
Submitted:
30 December 2024
Posted:
31 December 2024
You are already at the latest version
Abstract
Lower phylogenetic species are known to rebuild cut-off caudal parts with regeneration of the central nervous system (CNS). In contrast, CNS regeneration in higher vertebrates is ascribed allegedly to immaturity, which has failed to be shown. The emergence of stem cells and their effective medical applications has intensified regeneration research into the spinal cord. However, despite these advances, the impact of clinical trials involving spinal cord-injured (SCI) patients remains disappointingly low. Long-distance regeneration has yet to be proven. Our study involving dorsal myelotomy in fetal rats examined the development of pioneering afferent axons during early gestation. We identified a critical period in the development of the long primary afferent system. A single cut demonstrated the intrinsic ability of these axons to regenerate toward their original targets in the spinal medulla. Compared to intact parent axons, we observed hypoxia-induced phenotypic changes in the severed fibers, making them distinctly recognizable life-long. This provides a tool for intrauterine reprogramming of dorsal root ganglion (DRG) neurons, as illustrated by various stills throughout the developmental progression of central axons. These axons' inferred high growth speed indicates a plausible missing link in CNS regeneration research. This paradigm could revolutionize preclinical research on CNS regeneration for SCI patients.
Keywords:
CNS regeneration
; fetal reprogramming
; proteomic engineering
; conditioning hypoxia
; spinal cord
; fetal rat
; DRG neuron development
1. Introduction
An incidence increase of severe spinal cord injury among older people is a worldwide trend. Older people with SCI risk more complications. Data from more than a thousand clinical trials shows that recovery characteristics have remained unchanged over the last twenty years [1,2,3]. The pattern of neurological and functional recovery of older people might have counterbalanced positive effects from approved care in acute and rehabilitation practices. Given the wealth of knowledge of the central nervous system existing today, medical science seems hesitant to pay off its merits in SCI. Major domains relevant to CNS repair and regeneration, like Biochemistry and Neurobiology, have enriched scientists' armamentarium to tackle life's intricate mechanisms inherited from phylogenetically lower species capable of cell and tissue regeneration [4,5,6]. The experienced incapability of the mature CNS deviated science from the lesion site after "a century of sterile endeavor"[7]. However, cell-based transplantation experiments in higher vertebrates pulled back with promising results [8,9]. The first Phase I safety studies of human autologous Schwann cell transplantation in patients with SCI and human fetal neural stem cell transplants for chronic SCI were launched in 2012 and 2013 [8,10]. Since then, research papers on non-human or human-induced pluripotent stem cells have peaked. So far, various cell suspensions are delivered mostly by intrathecal injections and have reached Phase I/II clinical trials for SCI worldwide [11]. Small patient numbers and short follow-up periods hamper assessing the immediate effects of very early interventions, i.e., ≤ 2 weeks post-injury [1]. Preclinical studies demonstrate this incapacity of axon outgrowth that extends beyond the CNS lesion for a 10 mm length max and after days or weeks.
We might classify these features as sprouting like central axons, creating collaterals (colls) at their final stage of axon development [5,12]. The incapacity of CNS regeneration is ascribed to the mammalian dorsal root ganglia neuron’s lack of long-distance axon elongation across the white matter. Since the turn of the century, this notion has been ranked a law of nature in neuroscience [7,13]. The inhibitory environment of the lesioned adult spinal cord is thought to prevent the expression of the innate ability. The neuron with its pseudounipolar axon can regenerate its cut peripheral branch long distance. The acute primary and lasting secondary effects in experimental spinal cord transections ruin the tissue's cytoarchitecture, demonstrating central axon regeneration failure. For decades, research into extrinsic factors like myelin and proteoglycans challenged glial scar formation [14]. Meanwhile, the human-induced progenitor stem cell-based transplantation paradigm came into practice [15]. Before that, the absence of glial scarring in the injured immature spinal cord had been incidentally investigated [16,17]. Research into immature CNS tissue for conditions conducive to CNS regeneration rendered conflicting results and hindered an expected breakthrough. Our conference report indicated an intrinsic factor precluding fetal spinal cord regeneration. In a small S-series of E17/E18.p42 rats, the glucose metabolism at the gracile nuclei was comparable to control [18]. These experiments revealed that the fetal dorsal myelotomies failed for expected signs of regeneration and were devoid of scar tissue. This initially observed baffling perspective prompted the endeavor to acquire more upstream targets. Facing financial constraints at the time ultimately postponed this contribution to neuroscience.
Standing at a crossroads, do we consider finding the maze’s way out while keeping the same track? On the one hand, the possibly negative impact of older people in the clinical trials could counterbalance a noticeable effect on recovery. On the other hand, questioning whether applied translational science might still account for improvements in neurological and functional recovery from current clinical trials is valid. Although many preclinical studies have claimed regeneration, this issue moves in circles regarding sprouting. We suggest an addition to the affirmative criteria for CNS regeneration, which was stated twenty years ago [19] (Discussion). Our recent paper documented the long primary afferent system development, focusing on Clarke’s and gracile nuclei [12]. Here, we present intriguing features of long primary afferent axons that regenerate and elongate presumably quickly towards their medullary targets after a single cut during fetal development.
2. Material and Methods
2.1. A Summary
The data presented in this paper was part of an excerpt of experimental work predating the European legislation on animal welfare and institutional ethics board approval. The animal facility and husbandry reflected the highest ethical standards applicable at that time. High fetal survival rates and many long-surviving rats justify this statement (Table 1). The pregnant rats were housed solitary in cages at 12:12 light cycle, having unlimited access to food and water. We witnessed derangements in the daily routine when rats had moved the unweaned litter from one corner to another during construction work in the facility. Increased anxiety, especially among primiparous rats, prompted us to postpone scheduled experiments. We summarize a short technical description here. For more details, we may refer the reader to our recent papers. The microsurgical dorsal myelotomy at random cervical and thoracic levels was aimed at disrupting the fetal rat's primary afferent system development. The dam's conception day was scheduled fifteen to seventeen days before at E0, covering the long primary afferent system development in E15–E17 fetuses. The spontaneously breathing dam recovered within one or two minutes of quitting fluothane inhalation after the procedure, which took approximately half an hour. Applying the horse-radish peroxidase (HRP) tracer only to the left sciatic nerve's proximal stump was straightforward. The spinal cords had been sectioned sagittally for processing except for the horizontal sections of the medulla. Enzyme histochemistry involved tetramethylbenzidine (TMB), according to Mesulam [20]. Focused on the DC, we valued the tracing with HRP for its competent histology exhibiting the elongating axons in sagittal sections. This approach has enabled us to describe the assemblage of the intermediate and long subdivisions beyond the critical period (CP) in the previous paper [12]. Here, we present six experiments demonstrating the CP from a subset of cases that fulfilled all the sequential and hazardous processing steps. Given their places on the list ordered by estimating the M0s on the assembly line, chances were challenged with perseverance, underlining that data acquisition was full of flaws and mishaps (Table 1). Uncovering the unknown phenotypes described recently yields a conclusive interpretation of the results aggregated for this paper. First, the next chapter recapitulates the long primary afferent system’s blueprint for the reader’s convenience [12].
2.2. Preamble to the Long Primary Afferent System’s Development
We have outlined the development cascade of the long primary afferent axons governed by the DRG neurons in the lumbar spinal column [12]. Using HRP tracing of the sciatic nerve, we hypothesize transition hubs (THs) on the assembly line of temporospatial axon development. Three or four consecutive stations are identifiable (Figure 1A). All the pioneering axons elongate in a highly dynamic TH.0 stage and reach the medulla in high tide waves. Axon tips at the medulla, taking jointly a very short time, transition into the TH.1 stage during a standing tide. Thereby, all upstream axons passing through this narrow time window down their imaginable assembly lines demonstrate the hypothetical fast elongation stop (Figure 1B, f-ES). At the second transition, they form less dynamic TH.2 stage collaterals (colls) penetrating the gracile nucleus. This phenomenon, the slow elongation switch (Figure 1B, s-ES), coincides with an elongation that parallels or synchronizes with spinal cord growth. Two instructive graphics displaying the actual development state before and after the myelotomy are added to grasp the actual states quickly (Figure 1C,D). Such graphics pertain to cases 3 to 8. Characteristics of the CP are highlighted in Figures 2A and 2B.
2.3. The Impact of Hypoxia during the Critical Period
The microsurgical dorsal myelotomy (Tx) is performed under compression of the placenta’s vasculature. The ensuing fetal tissue hypoxia induces reprogramming of the DRG neurons if done upstream at the proper M0 (Glossary). This susceptibility is restricted temporally and upstream stage-dependent. The resulting perturbed phenotype mimics the imaginable upstream invisible TH.1 stage. In contrast to that naturally brief and undetectable axon feature, its mimicry remains visible under any circumstance and has a typical tracing feature. These neonatal axons exhibit the abrupt front stop (a-FS) when bundled. The single axons form the i-FSs. The bluntly tipped terminal club-like features always terminate in the white matter.
Our findings have revealed that a half-hour of oxygen shortage can reprogram DRG neurons. These alterations might link transcriptomic or translational perturbations documented in former research to HIF pathways, objectifying the pivotal impact of hypoxia [21,22,23,24]. The permanently visible i-FSs create stills of the naturally unstoppable primary afferent development cascade at various temporospatial spots on the assembly line. The stills have enabled us to distinguish between the high and low tide i-FSs and describe the dichotomous trajectory of the long primary afferent system. Those high and low tide axons build the long and intermediate subdivisions during and after the CP [12].
The CP encompasses the time involved in the long primary afferent axon elongation, in which a rostrocaudal gradient of axon development occurs. The smaller this window, the faster the growth, considering that halfway through the CP, 50% of the axons are still pioneers (Figure 2A). The smaller the time window, the more likely the Tx might render the exclusively monomorphic neonatal a-FS features. They are assigned to the pioneering axons' second half, originating in the L5 and, or L6 DRG neurons. In contrast, the Txs during the first half might render the multimorphic features with parent axons. Our data matches high-speed growth harmoniously with such considerations (Figure 2B).
During spring tide, the lumbar TH.0 axons pioneer toward the medulla in high tide waves [12]. Fortunately raised at an uncertain M0, by chance precisely within the appropriate CP’s narrow time window, six bell-ringer cases showcase configurations exhibiting pertinent dynamic HRP features (Table 1). The feature mix reflects an -estimated- spot on the speculative development cascade and determines the order of the assembly line (Figure 2B, red-blue diagonal). An inferred reduction in available energy might explain the imminent decrease in axon elongation assigned to thrust (Discussion).
2.4. A Watershed Delineates the Critical Period
The cutting of pioneering TH.0 stage axons renders the distinct phenotype of neurons extending the clear i-FSs. These reprogrammed TH.1 stage mimicries exhibit permanent, thickened fiber terminations substituting the hypothetical transient and ephemeral TH.1 stage axon feature. Assumingly, the max visible i-FSs might entail 50% at spring tide. The appropriate upstream Txs render this monomorphic feature only discernable in neonates. The development block is demonstrated in the a-FSs and i-FSs. The highly dynamic nature of spring tide manifests in the axons that regenerate across the lesion site up to the medulla. In contrast, the low tide axons stay far behind and fail to regenerate. However, they might recover the terminal clubs (tcs) that remain distanced caudally from the lesion site. The neonatal a-FS feature identifies this watershed with the spot on the assembly line delineating the CP.
The Txs on the upstream assembly line (Figure 2B, High tide) elicit distinguishable features reflecting temporal and spatial aspects of axon development. These findings increase our understanding of axon development and regeneration. On the one hand, the rapid decrease in the number of i-FSs to zero correlates with a temporal element. On the other hand, the axons extending beyond the lesion site shorten their lengths, exhibiting spatial differences. A common denominator that might determine both phenomena (Figure 2B) is assigned to thrust (Discussion). The convincing features of reprogramming are confined to the CP. Whether the difference between high- and low-tide i-FSs implicates different phenotypes is questioned (Discussion).
3. Results
3.1. Regeneration Comes to a Halt before Neap Tide
Regenerated axons rendered by Txs during the CP are classified by the rostral i-FSs (Figure 2B). This reprogrammed phenotype demonstrates a particular variability in axon length. At high tide, the axons regenerate across the lesion site as far as the level of the medulla. At low tide, the axons remain distant from the rostral lesion site. The phenotype displays a uniform axon feature that varies in length. The variability suggests a hidden factor that we assign speculatively to thrust exerting energy for elongation. When the overall amount of thrust peaks, axons can regenerate beyond their cutoff level. This effect is linked to Txs of the pioneering axons still on their way to the medulla but before they transition. Recovered from the impact of Tx, ample thrust propels these high tide axons again into the medulla. The “upstream” unharmed TH.0 stage axons accompany them alongside and transition into colls in the gracile nuclei, as shown in Figure 2B at (4)-(6). The downstream Tx renders more low tide axons. The ensuing i-FSs do not regenerate. We postulate that the fiber elongation process will stop when energy runs out. Those shorter lengths at neap tide may likely represent axons of the intermediate subdivision, of which the multi-level Clarke’s nucleus is their target [12]. The data shows that low-tide axons exhibit gradual length-shortening, whereas graduality is less noticeable in high-tide axons. Nevertheless, an occasional i-FS has been found in the rostral medulla.
3.2. Six Bell Ringer Cases Exhibiting All Dynamic Features
The paradigm induces a short perturbation of the intrinsic development plan. In response to half an hour of hypoxia, DRG neurons are reprogrammed. This susceptibility to hypoxia renders a distinctive feature of axons on the upstream cascade. In the next figures, two infographics (A and B) help us understand the development state in the blink of an eye, just like Figures 1C and D. The colored bars illustrate the imaginable development states of the long primary afferent system in the DC at M0, i.e., just before the Tx. The line graphic visualizes the artist's impression of the Tx's durable impact on the fiber system. The colors refer to the axon stages on the assembly line (Figure 1). The estimated number of parent axons and i-FSs at M0 determine the case order of Figure 3, Figure 4, Figure 5, Figure 6, Figure 7 and Figure 8 on the red-blue line (Figure 2B). Figure 3, Figure 4, Figure 5, Figure 6 and Figure 7 demonstrate multi-stage configurations, mostly in combination with upstream parent axons. They accomplish the physiological development down the cascade and penetrate the gracile nuclei. Figure 7 shows the last i-FS at a sub medullary level. Figure 8 shows an a-FS outlier exhibiting a single-stage monomorphic configuration at the level of the medulla (Discussion). Finally, Figure 5 exhibits low tide axons with decreased axon lengths, reflecting inferred minimal thrust.
Legend forFigure 3, Figure 4, Figure 5, Figure 6, Figure 7 and Figure 8
| */** | asterisk/s | a single asterisk indicates a TH.1-stage i-FS / a tandem asterisk indicates colls |
| g.nu | gracile nucleus | |
| 4th V | fourth ventricle | |
| L|Th|C | Lumbar|Thoracic|Cervical segment of the spinal cord | |
| c <== ==> r | caudal <== ==> rostral direction of the spinal cord | |
| d <== ==> v | dorsal <== ==> ventral in a sagittal section of the spinal cord | |
| L/R | left side/right side | of the spinal cord in a horizontal section |
| N | fix pinhole
|
an artifact from tissue processing; a number identifies the spinal cord's level derived from the gelatine block's count spinal level of Tx / depicted level in the Figure |
In the medulla of the T78.p40 male (Figure 3C), the high tide axons exhibited the multistage axon configuration. This finding suggests an upstream M0, likely occurring during the first half of the CP. The axons downstream of the severed ones, which had transitioned upstream, reflected full thrust and transitioned into the TH.2 colls, i.e., after the Tx. These predominantly labeled the gracile nucleus on the left side. The amount of labeling indicated a reduction in the number of axons in line with a downstream origin. On the right side, the fibers may partially counterbalance the loss observed on the left side. The i-FSs were discernably tipped with blunt tcs at both the right and left gracile nuclei, underlining a fetal Tx. Caudally from the medulla (Figure 3D), one i-FS was visible in each DC, possibly originating from a neuron in the most caudal DRG at L6.
In the medulla of the T42.p240 female (Figure 4C), various TH.2 staged colls were present in the left gracile nucleus. The axon reduction indicated that the M0 fell downstream compared to the former p40 male. Here, the less distinct hallmark a-FS was age-morphed and exhibited just a few TH.1 stage i-FSs abutting the caudal lesion site. A dorsal surface tag marked the lesion site (Figure 5D). That might be formed by external scar tissue. This stigma covered the lesion site's CG glia, different from the outmoded term glial scar [25][2301].
After almost two years, the left gracile nucleus of the V1.p600 male (Figure 5C) exhibited numerous regenerated i-FSs. A few colls might be present too. In contrast, the i-FSs of low tide fibers distanced from the lesion site indicated the inability to regenerate beyond the lesion site. However, these i-FSs contained labeling indicating that they had recovered. The shorter lengths were assigned to insufficient thrust at M0 beyond the closure of the CP in these low tide axons (Figure 2B). The axons were distributed throughout the caudal DC. The reduction in lengths was paramount and permanent. After almost two years, these i-FSs tipped with the typical blunt terminal clubs (tcs) were still distinguishable from the parent axons. Moreover, they were found on either side of the lesion site, i.e., at caudal and bilateral rostral levels.
The hallmark a-FS of the Tx’s impact in the neonatal W2.p9 male abutted the cervical lesion site at a dorsal hump (Figure 6D). The multimorphic lesion configuration also entailed the TH.0 parent axons. They gave rise to TH.2 colls, which had penetrated the left gracile nucleus. Moreover, various colls had grown into the CG at the lesion site. These features might be linked to the TH.1 axons at the medulla severed just before or while transitioning down the cascade.
The W20.p6 neonate was comparable to the former p9 with similar features (Figure 7). The submedullar DC entailed a single i-FS that had not reached its target at the level of gracile nucleus, devoid of labeling. Again, the three axon development stages were gathered at the lesion site, marked by an intraspinal cyst. A superfluous amount of TH.2 colls scattered throughout the neuropil. This feature of dystopic growth illustrated the paradigm’s impact by elucidating the contrast between this downstream axon sprouting and de facto upstream CNS axon regeneration features of the high tide rostral i-FSs.
The medulla of the W14.p14 female (Figure 8C) showed surfaced axons in the DC bypassing the gracile nucleus. Their continuity with the bundled i-FSs fanning out beyond the ventral gracile nucleus was taken for granted. The appearance resembled the hallmark a-FS while morphing by age. The i-FSs looked like they had grown far beyond their proper ventral targets. Notably, the colls were absent in the gracile nucleus. This peculiar single-stage, monomorphic configuration in the upper medulla raises questions about what mechanism might be accountable for the outlier feature (Discussion). The one-of-a-kind lesion site exhibited a multilevel diastematomyelia, masking the exact Tx level. The pathology might have been irrelevant for the i-FSs bypassing in the left DC. The most upstream cut TH.1 & TH.2 axons (Figure 8A) terminated caudally into the lesion site (not shown).
4. Discussion
Pioneering long primary afferent axons regenerate toward the gracile nucleus if cut during the CP. The pertinent features during this narrow time window have been identified in a previous study [12]. Half an hour of hypoxia induces reprogramming of the neuron’s phenotype. This permanent axon feature is distinguishable over time by its blunt fiber tip, just like the well-known terminal club. This feature of the afferent axon materializes the CNS regeneration enigma by definition. The i-FSs bear doubtless characteristics of the obligatory terminal clubs, the regrowth after their convincing severance, and the mapping of their natural targets. We want to add a pivotal one that has been overlooked, i.e., the high tempo of axon elongation.
Revealing the conditions of enigmatic regeneration uncovered during the CP of the intrinsic development plan raises questions. Due to susceptibility to less oxygen, the cut axons demonstrate the highest dynamic features. On the one hand, the neuron’s reprogrammed phenotype blocks development further down the cascade. On the other hand, the upstream severed i-FSs elongate across the lesion long-distance. In contrast, the downstream cut axons elongate at variable lengths and remain caudally distant from the lesion site. This variability indicates a development-linked relationship, which we assign to the decline in inferred energy [12].
This paper describes the recovery and long-distance re-elongation of cut high-tide axons extending as far rostrally as the medulla at an inferred high speed. A capability that is assigned to high thrust levels. This uptempo axon elongation might be due to the combination of conditioning by the Tx and hypoxia. Spinal cord transections and hypoxia are known conditions that can lead to elevated ATP levels [26,27]. These phenomena might even show synergy, called hypoxic conditioning. Regarding the paradigm’s physiological pathway, the Tx’s sequelae suggest that situational conditions possibly determine where or when the f-ES and s-ES ultimately occur. Our previous paper addressed the likelihood of a non-prevailing intrinsic development plan regarding the wandering i-FSs' whereabouts in the DC [12]. Nevertheless, the hypothetical s-ES phenomenon in high and low tide axons and the blueprint's TH.2 transition normally coincide in some consecutive manner [28]. Adhering to our blueprint’s concept, this option might also unveil a possible affinity between their neuron’s transcript- and translatomes governing the hypothetical TH.1 transit. So, might the transition be similar in high and low tide axons? Simplifying the pertinent proteomic signatures might ease future rejuvenating strategies backward on the upstream cascade.
A key question remains whether the mature state can rejuvenate and reinstate the conditions of the proper transitions. The data provides evidence that a lack of thrust can be accountable for the system’s failure to recapture. The history of negative results implies a catch-22. Low thrust might limit the impact of artificial tools such as cell cultures and organoids. Referring to our blueprint, we question the adequacy of equating axon sprouting or time-consuming long-distance axonal projection with long-distance axon elongation. Only the upstream i-FS with bluntly tipped tcs demonstrate regeneration beyond the lesion site.
Our data may comply with a simplified blueprint, accustoming the TH.1 hub. The lengths of the high tide i-FSs and a-FSs differ from those of low tide i-FSs; they all might demonstrate merely thrust-driven effects in contrast with primarily cell cycle dependency [29]. We postulated in our previous paper that the hypoxic conditions during spinal cord lesions might affect the inferred speed of axon growth, reflecting the variability of the low tide i-FS lengths, in particular [12]. Again, the growth speed relationship between axon length and inferred thrust has gained credibility. The speed slows in low-tide axons but might also gear up in high-tide axons at spring tide. An uptempo of speed might explain why the a-FS bypasses its medullary target (Figure 8C). Purinergic signaling compound levels can multiply manifold compared to basic conditions [22,30]. Increased energy supply might explain why the pioneering growth cones have bypassed their target at spring tide (Figure 8C, a-FS). This phenomenon indicates thrust is a manipulable commodity, underpinning its situational impact. It is worth noting that half an hour of hypoxia was an estimation of the procedure’s mean duration. Variations in the thirty-minute hypoxia might have a relevant yet undetermined impact on the i-FSs, explaining an increased elongation tempo and farther reach (Figure 8C). The susceptibility to hypoxia is confined to the CP. Beyond that short period, the development in the upstream unharmed axons along physiological pathways is normal. The transient involvement of oxygen-sensing mechanisms potentially points to HIF-alpha signaling pathways [21,22,23,31]. The mechanism permanently affected the cut fibers, some of which regenerated, too. It is questionable whether transcriptome profiling might discriminate upstream from downstream i-FSs [32]. Reference validation for pioneering axons versus coll formation requires reliable profiling tools with development stage specificity. Our data casts doubt on the assumed validity of proteomic profiles of cultured embryonic stem cells without being assessed, as they might have been reprogrammed and exhibit downstream profiles of differentiated TH.2 stage cells [33]. Underestimating the value of evaluated and validated long-distance regeneration profiles might have attributed to the translational complex being overlooked [34]. Qualifying parent axons and classifying colls as proof of CNS regeneration are comparable conundrums for misinterpretion of CNS regeneration [19]. This research may benefit from adding the tempo topic to those CNS regeneration criteria established twenty years ago [19].
The bluntly tipped i-FSs, with their regenerative capacity, illustrate the dynamic features of the developing primary afferent axons in the spinal cord. Profiling of all the omics may help identify the physiological pathways involved in CNS regeneration. The inferred high elongation speed of 1 mm/hour is also plausibly proven by negative demonstration. The lumbar pioneering afferents reach the gracile nuclei at a distance of about 10 mm in (less than) a day. In contrast, published cell profiles, which create colls crossing a few mms after days or weeks, point at the downstream stage in the cascade. The commonly held belief about axon growth speed in the CNS is based on biased experiments [35]. In vivo live-cell imaging of primary afferent axon outgrowth rates at 1 or 2 mm/day [36]. However, whether cultured neuronal progenitor cells whose axons grow slowly manifest the upstream phenotype is questionable. Nevertheless, the widely adhered-to notion of 1 mm/day is considered a rock-solid dogma of axon outgrowth [19]. A 40 µm/hour tempo was recently recorded in organoids, reflecting a similar phenotypical proteomic signature [37].
Growth cone assembly and propulsion are the forefront features of pioneering axons that determine the elongation speed, revealing a manipulable tempo [5,38]. Our data fuels the suggestion of excessive speed, demanding an extreme energy supply. If M0 falls on the right spot on the assembly line, severing axons and hypoxia might synergistically increase the pool of compounds for purinergic signaling [39]. Understanding ubiquitous purines and associated pathways related to energy supply may lead to pertinent gaps in knowledge, providing opportunities for future research [30]. We sincerely acknowledge the scientific contributions of Sir Geoffrey Burnstock (1929-2020), particularly his influential paper on purinergic nerves [40]. Purinergic signaling provides a potential mechanism for delivering significant amounts of adenosine compounds to the developing axon. It took twenty years to overcome skepticism about Burnstock's purinergic hypothesis [41]. Today, it may be easier to decipher and quantify the compounds of the purinergic signaling system and assess the oldest evolutionary preserved purine receptors required for CNS regeneration [42]. We need to determine whether the proper amounts of pertinent molecules might have an impact, supporting the view of the right molecule at the correct location at the right time [43]. Temporospatially pinpointed experimentation under distinct hypoxic conditions may reveal whether rejuvenation can alleviate preexisting development blocked after reprogramming. While knockout mutants have great scientific value, their single-cell sequencing might reveal randomness and nonphysiological phenotypes. The reprogrammed i-FS’s transcriptome may entail a physiological pathway for research into regeneration. The next step is to determine a possibility for manipulation recapturing an upstream transcriptomic signature with the ability to regrow long-distance axons quickly and form coils during maturation. Cracking these codes is crucial for engineering regenerative conditions in the adult spinal cord despite a repellent extracellular environment.
Our findings show the ability of long primary afferent axons to regenerate, manifesting the i-FS axon feature. The i-FS and the a-FS highlight the dependency on conceptual thrust and manifest the long primary afferent system's perturbed temporal and spatial development blockade. These features also delineate the susceptibility to reprogramming due to hypoxia in the upstream development. Half an hour of hypoxia can be adequate to reprogram this enduring new phenotype. The two significant characteristics may be key to understanding regeneration. Regeneration can occur in the pioneering axons upstream during the spring tide but not in low tide downstream axons, which target Clarke’s nucleus [12]. This discovery may be useful for identifying profile benchmarks for organoids and cell cultures applied in preclinical studies and therapeutic strategies for SCI patients. Profiles reprogrammed physiologically might help to decipher why assumed long-distance regeneration potential in translational research remains ineffective. The assumption is made that those indispensable compounds in purinergic signaling provide the necessary energy for long-distance regeneration, and their discovery revolutionizing preclinical research is expected shortly. Then, the therapies’ potential for clinical outcomes promises a better outlook for SCI patients.
Author contributions: Conceptualization, Frits de Beer; Investigation, Frits de Beer; Resources, Frits de Beer; Visualization, Frits de Beer; Writing-original draft, Frits de Beer; Supervision, Harry Steinbusch FB began this work during the last few months of his residency. He was a qualified neurosurgeon responsible for research, development, and data acquisition over ten years. After retiring, a dormant fascination ignited a second career as a neuroscientist. The internet and open-access literature provided the opportunity to explore an unknown world filled with incomprehensible random features related to basic biology and the conditions of enigmatic CNS regeneration. The fruitful collaboration with HS was tremendously helpful in making the results editable for public access.
Competing Interests
The authors declare no competing interests.
Ethical Approval
Ethical review and approval were waived for this study due to its retrospective nature. The experiments pre-dated European legislation on animal welfare and institutional ethics board approval.
Funding
none
Glossary
| a-FS | abrupt front stop | WM-facing medullary bundle of fetal cut high-tide primary afferent i-FSs blocked at their reprogrammed TH.1 stage. Frequently, the a-FS abuts the lesion site caudally [12]. |
| CP | critical period | Upstream time slot(s) delineating elongation in each (and all) TH.0 stage pioneering long primary afferent axon(s). |
| CG | central gray | neuropil |
| colls | TH.2-staged collaterals = collateral sprouting following T.H.2 transit and illustrating unrestrained development had been accomplished in gracile nuclei. | |
| DRG | dorsal root ganglion | involving the lumbar segments L4, L5, and L6 (HRP-tracing at the left side, only) |
| DC | dorsal column | |
| E16-8h | 15th day of gestation | M0 is scheduled 15 days + 16 h after mating, restricted to 1 h |
| E16 | day of conception without surveillance of mating time | |
| f-ES | fast Elongation Stop | Figuring a hypothetical configuration where the elongating TH.0-staged pioneering axons arriving at the medulla swiftly slow down. |
| fringe | the CG, adjacent to the DC white matter | |
| high tide | in the rostral DC, pioneering axons target the gracile nuclei in high-tide waves at spring tide | |
| i-FS | individual front stop | The TH.1 staged axon mimicry generates a blunt fiber termination, i.e., a regenerated axon substitute. At high tide, the axon re-elongates towards the medulla. At low tide, the fiber tip remains caudally distanced from the lesion site, forming the look-alike of the terminal club. |
| HRP | low tide | in the lower thoracic DC, pioneering axons target Clarke's nucleus in low-tide waves at neap tide #break#horse radish peroxidase |
| M0 | The moment of Tx is referenced to the hour (or day) of conception and serves the ID in combination with survival time (Table 1). M0 has a temporospatial link with a location on the assembly line determined by the axon features, which demonstrate variability. This underlines that the development between fetuses may differ. | |
| neap tide | see low tide | |
| s-ES | slow Elongation Switch | Figuring the transition of the hypothetical TH.1 staged axon before creating collateral sproutings, i.e., TH.2 staged colls. |
| spring tide | see high tide | |
| tc | terminal club, see i-FS | |
| THs | transition hubs | TH.0, TH.1, TH.2, and TH.3 are hypothetically situated on the developmental cascade, figuring unknown phenotypes that disclose a mimicry of TH.1, TH.2, and TH.3 stage axon features after Tx. |
| TH.0 | staged axon | pioneering primary afferent axon in a high tide wave |
| TH.1 | staged axons | Mimicked by a bundle of reprogrammed regenerated axons featuring the a-FS rostrally at spring tide or the multilevel i-FSs at a caudal Tx at low tide. |
| Tx | dorsal myelotomy | the microsurgical procedure |
References
- Bourguignon, L.; Tong, B. International surveillance study in acute spinal cord injury confirms viability of multinational clinical trials. BMC Medicine 2022, 20, 1–18. [Google Scholar] [CrossRef] [PubMed]
- Dietz, V.A.; Roberts, N. Fighting for recovery on multiple fronts: The past, present, and future of clinical trials for spinal cord injury. Front Cell Neurosci 2022, 16, 1–18. [Google Scholar] [CrossRef]
- Jagrit, V.; Koffler, J. Combinatorial strategies for cell transplantation in traumatic spinal cord injury. Front Neurosci 2024, 18, 1–11. [Google Scholar] [CrossRef] [PubMed]
- Ferretti, P.; Zhang, F. Changes in spinal cord regenerative ability through phylogenesis and development: lessons to be learned. Dev Dynamics 2003, 226, 245–256. [Google Scholar] [CrossRef] [PubMed]
- Rodemer, W.; Hu, J. Heterogeneity in the regenerative abilities of central nervous system axons within species: why do some neurons regenerate better than others? Neur Reg Res 2020, 15, 996–1005. [Google Scholar]
- Norris, V. Successive paradigm shifts in the bacterial cell cycle and related subjects. Life 2019, 9, 1–11. [Google Scholar] [CrossRef]
- Illis, LS. Central nervous system regeneration does not occur. Spinal Cord 2012, 50, 259–263. [Google Scholar] [CrossRef] [PubMed]
- Mothe, A.J.; Tator, C.H. Review of transplantation of neural stem/progenitor cells for spinal cord injury. Int J Devl Neurosci 2013, 31, 701–713. [Google Scholar] [CrossRef]
- Olivero, R.S.; Bello, S. Mesenchymal stem cells improve locomotor recovery in traumatic spinal cord injury: Systematic review with meta-analyses of rat models. Neurobiol Dis 2014, 62, 338–353. [Google Scholar] [CrossRef]
- Xu X-M. Breaking news in spinal cord injury research. Neur Reg Res 2012, 7, 1685–1687. [Google Scholar]
- Ahuja, C.S.; Mothe, A. The leading edge: emerging neuroprotective cell-based therapies for spinal cord injury. Stem Cells Transl Med 2020, 9, 1509–1530. [Google Scholar] [CrossRef] [PubMed]
- De Beer, F.C.; Steinbusch, H.W. On the blueprint of the long primary afferent axons and the dichotomous axon trajectory of Clarke's nucleus. A morphological tracing study on the effect of hypoxia during development. Anatomia 2023, 2, 414–49. [Google Scholar] [CrossRef]
- Schwab, M.E.; Bartholdi, D. Degeneration and regeneration of axons in the lesioned spinal cord. Physiol Rev 1996, 76, 319–370. [Google Scholar] [CrossRef]
- Quraishe, S.; Forbes, L.H. The extracellular environment of the CNS: Influence on plasticity, sprouting, and axonal regeneration after spinal cord injury. Neural Plast 2018, 1–18. [Google Scholar] [CrossRef] [PubMed]
- Yamanaka, S. Induced pluripotent stem cells: Past, Present, and Future. Cell Stem Cell 2012, 10, 678–684. [Google Scholar] [CrossRef] [PubMed]
- Gearhart, J.; Oster-Granite, M.L. Histological changes after transection of the spinal cord of fetal and neonatal mice. Exp Neurol 1979, 66, 1–15. [Google Scholar] [CrossRef] [PubMed]
- Buyan Dent, L.J.; McCasland, J.S. Attempts to facilitate dorsal column axonal regeneration in a neonatal spinal environment. J Comp Neurol 1996, 372, 435–456. [Google Scholar] [CrossRef]
- Wree, A.; Fiekas, D. Lokale zerebrale Glukose-Utilisation des Riickenmarkes und der Hinterstrangkerne der Ratte nach pränataler dorsaler Myelotomie in Höhe Thl2: Eine [14C]2-Desoxyglukose-Studie. Eur J Neurosci 1998, 10, 62. [Google Scholar]
- Steward, O.; Zheng, B. False resurrections: distinguishing regenerated from spared axons in the injured central nervous system. J Comp Neurol 2003, 459, 1–8. [Google Scholar] [CrossRef] [PubMed]
- Mesulam MM, Brushart TM. Transganglionic and anterograde transport of horseradish peroxidase across dorsal root ganglia: a tetramethylbenzidine method for tracing central sensory connections of muscles and peripheral nerves. Neuroscience. 1979; 4:1107-17.
- Cox-Limpens, K.; Strackx, E. Fetal Asphyctic Preconditioning Protects Against Perinatal Asphyxia-Induced Apoptosis and Astrogliosis in Neonatal Brain. CNS Neurol Disord Drug Targets 2015, 14, 33–40. [Google Scholar] [CrossRef] [PubMed]
- Rivkees, S.A.; Wendler, C.C. Long-term consequences of disrupting adenosine signaling during embryonic development. Mol Aspects Med 2017, 55, 110–117. [Google Scholar] [CrossRef] [PubMed]
- Bustelo, M.; Barkhuizen, M. Clinical Implications of Epigenetic Dysregulation in Perinatal Hypoxic-Ischemic Brain Damage. Front Neurol 2020, 11, 483. [Google Scholar] [CrossRef] [PubMed]
- De Beer, F.C. Dorsal myelotomy in E15-E16 fetal rat: A promising paradigm in regeneration research with serendipitous transcriptomic effects on development of the long primary afferent system. J Neurosci Methods 2022, 366, 1–6. [Google Scholar] [CrossRef] [PubMed]
- Sofroniew, MV. Dissecting spinal cord regeneration. Nature 2018, 557, 344. [Google Scholar] [CrossRef] [PubMed]
- Pires Monteiro, S.; Voogd, E. Neuroprotective effect of hypoxic preconditioning and neuronal activation in an in vitro human model of the ischemic penumbra. J Neural Eng 2021, 18, 1–13. [Google Scholar] [CrossRef] [PubMed]
- Stefanova, E.E.; Scott, A.L. Purinergic signaling systems across comparative models of spinal cord injury. Neural Regen Res 2022, 17, 2391–2398. [Google Scholar] [PubMed]
- Lanfranchi, M.; Yandiev, S. The AMPK-related kinase NUAK1 controls cortical axon branching by locally modulating mitochondrial metabolic functions. Nat Commun 2024, 15, 2487–2504. [Google Scholar] [CrossRef]
- Liu, K.; Tedeschi, A. Neuronal intrinsic mechanisms of axon regeneration. Ann Rev Neurosci 2011, 34, 131–152. [Google Scholar] [CrossRef]
- Jacobson, K.A.; Pradhan, B. New paradigms in purinergic receptor ligand discovery. Neuropharmacology 2023, 230, 109503. [Google Scholar] [CrossRef]
- Stepien, B.K.; Wielockx, B. From vessels to neurons – The role of hypoxia pathway proteins in embryonic neurogenesis. Cells 2024, 13, 621–651. [Google Scholar] [CrossRef]
- Vissers, C.; Sinha, A. The epitranscriptome in stem cell biology and neural development. Neurobiol Dis 2020, 146, 1–13. [Google Scholar] [CrossRef] [PubMed]
- Coquand, L.; Avalos, C.B. A cell fate decision map reveals abundant direct neurogenesis bypassing intermediate progenitors in the human developing neocortex. Nat Cell Biol 2024, 1–24. [Google Scholar] [CrossRef] [PubMed]
- Schaeffer, J.; Belin, S. Customization of the translational complex regulates mRNA-specific translation to control CNS regeneration. Neuron 2023, 111, 2881–2898. [Google Scholar] [CrossRef]
- He, Z.; Jin, Y. Intrinsic control of axon regeneration. Neuron 2016, 90, 437–451. [Google Scholar] [CrossRef]
- Tedeschi, A.; Dupraz, S. ADF/Cofilin-mediated actin turnover promotes axon regeneration in the adult CNS. Neuron 2019, 103, 1073–1085. [Google Scholar] [CrossRef] [PubMed]
- Martins-Costa, C.; Wiegers, A. ARID1B controls transcriptional programs of axon projection in an organoid model of the human corpus callosum. Cell Stem Cell 2024, 31, 1–20. [Google Scholar] [CrossRef] [PubMed]
- Leite, S.C.; Pinto-Costa, R. Actin dynamics in the growth cone: a key player in axon regeneration. Curr Opin Neurobiol 2021, 69, 11–18. [Google Scholar] [CrossRef]
- Marichal, N.; Fabbiani, G. Purinergic signaling in a latent stem cell niche of the rat spinal cord. Purinergic Signal 2016, 12, 331–341. [Google Scholar] [CrossRef]
- Burnstock, G. Purinergic nerves. Pharmacol Rev 1972, 24, 509–557. [Google Scholar] [PubMed]
- Burnstock, G. Physiology and pathophysiology of purinergic neurotransmission. Physiol Rev 2007, 87, 659–797. [Google Scholar] [CrossRef] [PubMed]
- Sanchez-Arias, J.C.; Van der Slagt, E. Purinergic signaling in nervous system health and disease: Focus on pannexin 1. Pharmacol Ther 2021, 225, 107840. [Google Scholar] [CrossRef] [PubMed]
- Fawcett, J.W. Why has it been so difficult to make CNS axons regenerate? Neurochem Res 2020, 45, 144–158. [Google Scholar] [CrossRef] [PubMed]
Figure 1.
The intrinsic development plan of a DRG neuron: the blueprint, the assembly line, and the dorsal column contents. Four graphics show that the development of the DRG neuron governs the central long primary afferent pioneering axon and maturation in a high-tide wave to the gracile nucleus. The transganglionic transport of HRP is displayed in Figures 3–6. (A) The consecutive stages of the assembly line are green, yellow, light brown, and dark brown. Embryonic days 15 to 18 might harbor these stages. The black and gray bars partition the assembly line and mask the complexity of unidentified networks of transcription factors, i.e., hypothetical transition hubs (THs). TH.1, in its quality as a mimicking substitute, is addressed in the Discussion. (B) The temporospatial elements of the assembly line involve complex interplay. Above the axis, the red block represents the upstream critical period that delineates the waves of TH.0-stage axons at spring tide targeting gracile nuclei. The curved line shows an inferred decrease in total thrust for axon-tip propulsion and the energy deployed for axon development down the assembly line. Displayed beneath the axis: The pioneering TH.0 staged axons are colored green; beyond the f-ES, the axon stage turns yellow; the s-ES again turns the stage light brown and leads to the formation of TH.2 staged colls; downstream, the axons become darker brown, figuring the maturation process. These successive stations on the assembly line form the developmental cascade of the long primary afferent system. (C) Vertically placed, two afferent system stills at two random M0s during the CP before the dorsal myelotomy. The colored bars depict the dorsal columns harboring the upstream dominant stage axons. The green line at the bottom delineates the critical period, i.e., the upstream time window at spring tide. (D) These graphics reflect how the former stages develop after the myelotomy. The lines serve as a pars pro toto for axons from the left DRG L4-L6 neurons. The high tide axons target gracile nuclei (g.nu), and the low tide axons target Clarke’s nucleus (C.nu). t = time.
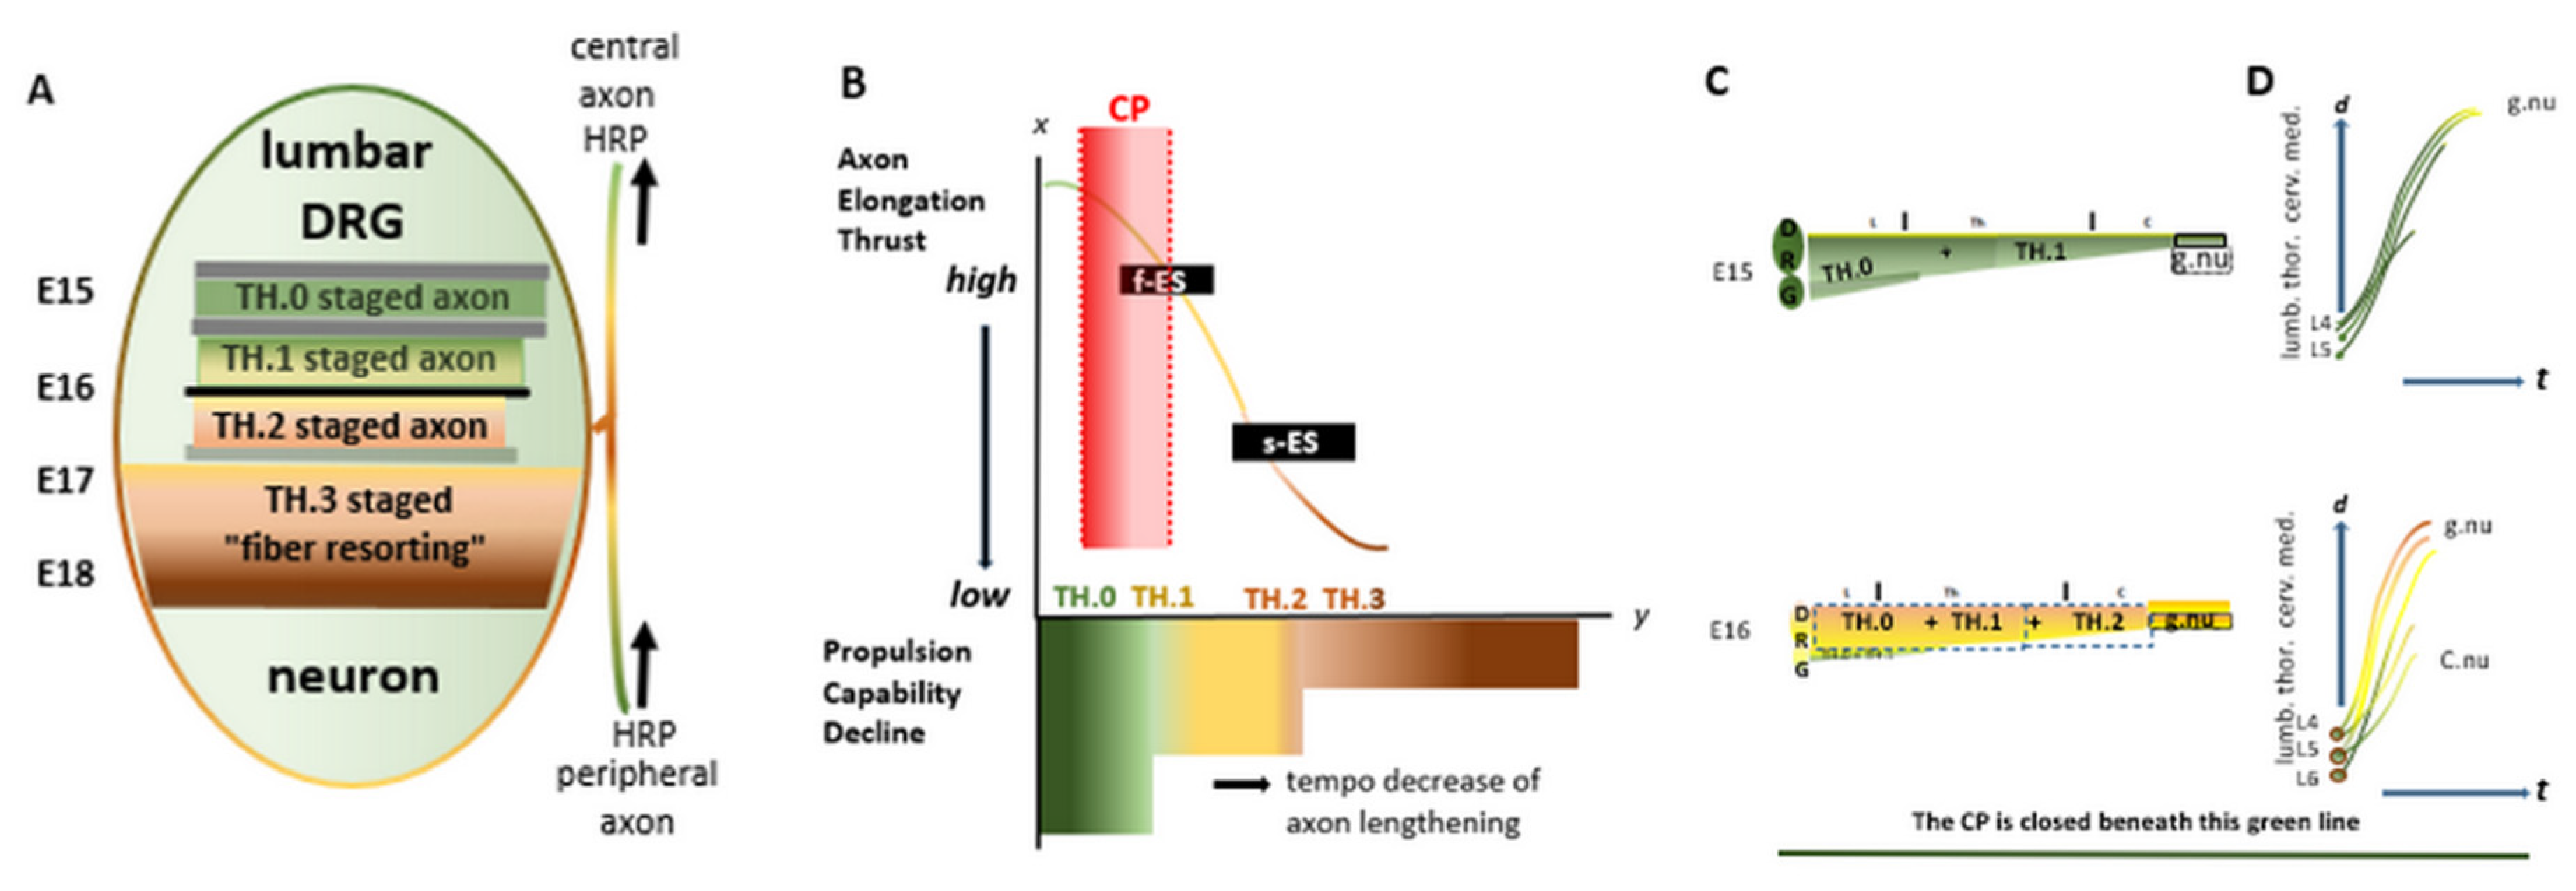
Figure 2.
(A) Halfway through the CP, a swift reduction of axon outgrowth into the medulla matches the CP’s short time window, reflecting a high axon elongation speed. The Tx renders the a-FSs, entailing 50% max of remaining pioneering axons. Their current i-FSs fail to reach the lesion site on the assembly line and beyond, marking a watershed. (B) On the red-blue diagonal line of temporospatial development, the Tx at M0 (3) renders kaleidoscopic features exemplifying a combination of TH.0 and TH.2 stage (parent) axons and i-FSs (TH.1 substitute), mounting the highest numbers with the most dynamic characteristics during development. After that, failing (re)growth beyond the lesion site quickly diminishes the number of labeled axons at the medulla. At M0, parent axons reaching the gracile nuclei unharmed might peek. Further down at M0 and (6), labeled axons decrease. The last visible axons depend on the final regenerated i-FSs. In particular, an invisible commodity of thrust can be inferred from these TH.1 stage axons. Between maximal and minimal thrust, noted as  and
and  respectively, the axon lengths might parallel the available energy for elongation. The reprogrammed i-FS’s phenotype is yellow-tinted. Within the upstream CP (red-shaded area/line), the i-FSs regenerate up to the medulla enabled by . The a-FS of joined i-FSs abuts the lesion site caudally. Beyond the a-FS (the red line changes color), severed axons gradually increase their distance to the rostral lesion site due to failing thrust. The numbers (3)-(8) denote the six cases with Txs at their estimated M0 spots on the assembly line.
and respectively, the axon lengths might parallel the available energy for elongation. The reprogrammed i-FS’s phenotype is yellow-tinted. Within the upstream CP (red-shaded area/line), the i-FSs regenerate up to the medulla enabled by . The a-FS of joined i-FSs abuts the lesion site caudally. Beyond the a-FS (the red line changes color), severed axons gradually increase their distance to the rostral lesion site due to failing thrust. The numbers (3)-(8) denote the six cases with Txs at their estimated M0 spots on the assembly line.
Figure 2.
(A) Halfway through the CP, a swift reduction of axon outgrowth into the medulla matches the CP’s short time window, reflecting a high axon elongation speed. The Tx renders the a-FSs, entailing 50% max of remaining pioneering axons. Their current i-FSs fail to reach the lesion site on the assembly line and beyond, marking a watershed. (B) On the red-blue diagonal line of temporospatial development, the Tx at M0 (3) renders kaleidoscopic features exemplifying a combination of TH.0 and TH.2 stage (parent) axons and i-FSs (TH.1 substitute), mounting the highest numbers with the most dynamic characteristics during development. After that, failing (re)growth beyond the lesion site quickly diminishes the number of labeled axons at the medulla. At M0, parent axons reaching the gracile nuclei unharmed might peek. Further down at M0 and (6), labeled axons decrease. The last visible axons depend on the final regenerated i-FSs. In particular, an invisible commodity of thrust can be inferred from these TH.1 stage axons. Between maximal and minimal thrust, noted as and respectively, the axon lengths might parallel the available energy for elongation. The reprogrammed i-FS’s phenotype is yellow-tinted. Within the upstream CP (red-shaded area/line), the i-FSs regenerate up to the medulla enabled by . The a-FS of joined i-FSs abuts the lesion site caudally. Beyond the a-FS (the red line changes color), severed axons gradually increase their distance to the rostral lesion site due to failing thrust. The numbers (3)-(8) denote the six cases with Txs at their estimated M0 spots on the assembly line.
and respectively, the axon lengths might parallel the available energy for elongation. The reprogrammed i-FS’s phenotype is yellow-tinted. Within the upstream CP (red-shaded area/line), the i-FSs regenerate up to the medulla enabled by . The a-FS of joined i-FSs abuts the lesion site caudally. Beyond the a-FS (the red line changes color), severed axons gradually increase their distance to the rostral lesion site due to failing thrust. The numbers (3)-(8) denote the six cases with Txs at their estimated M0 spots on the assembly line.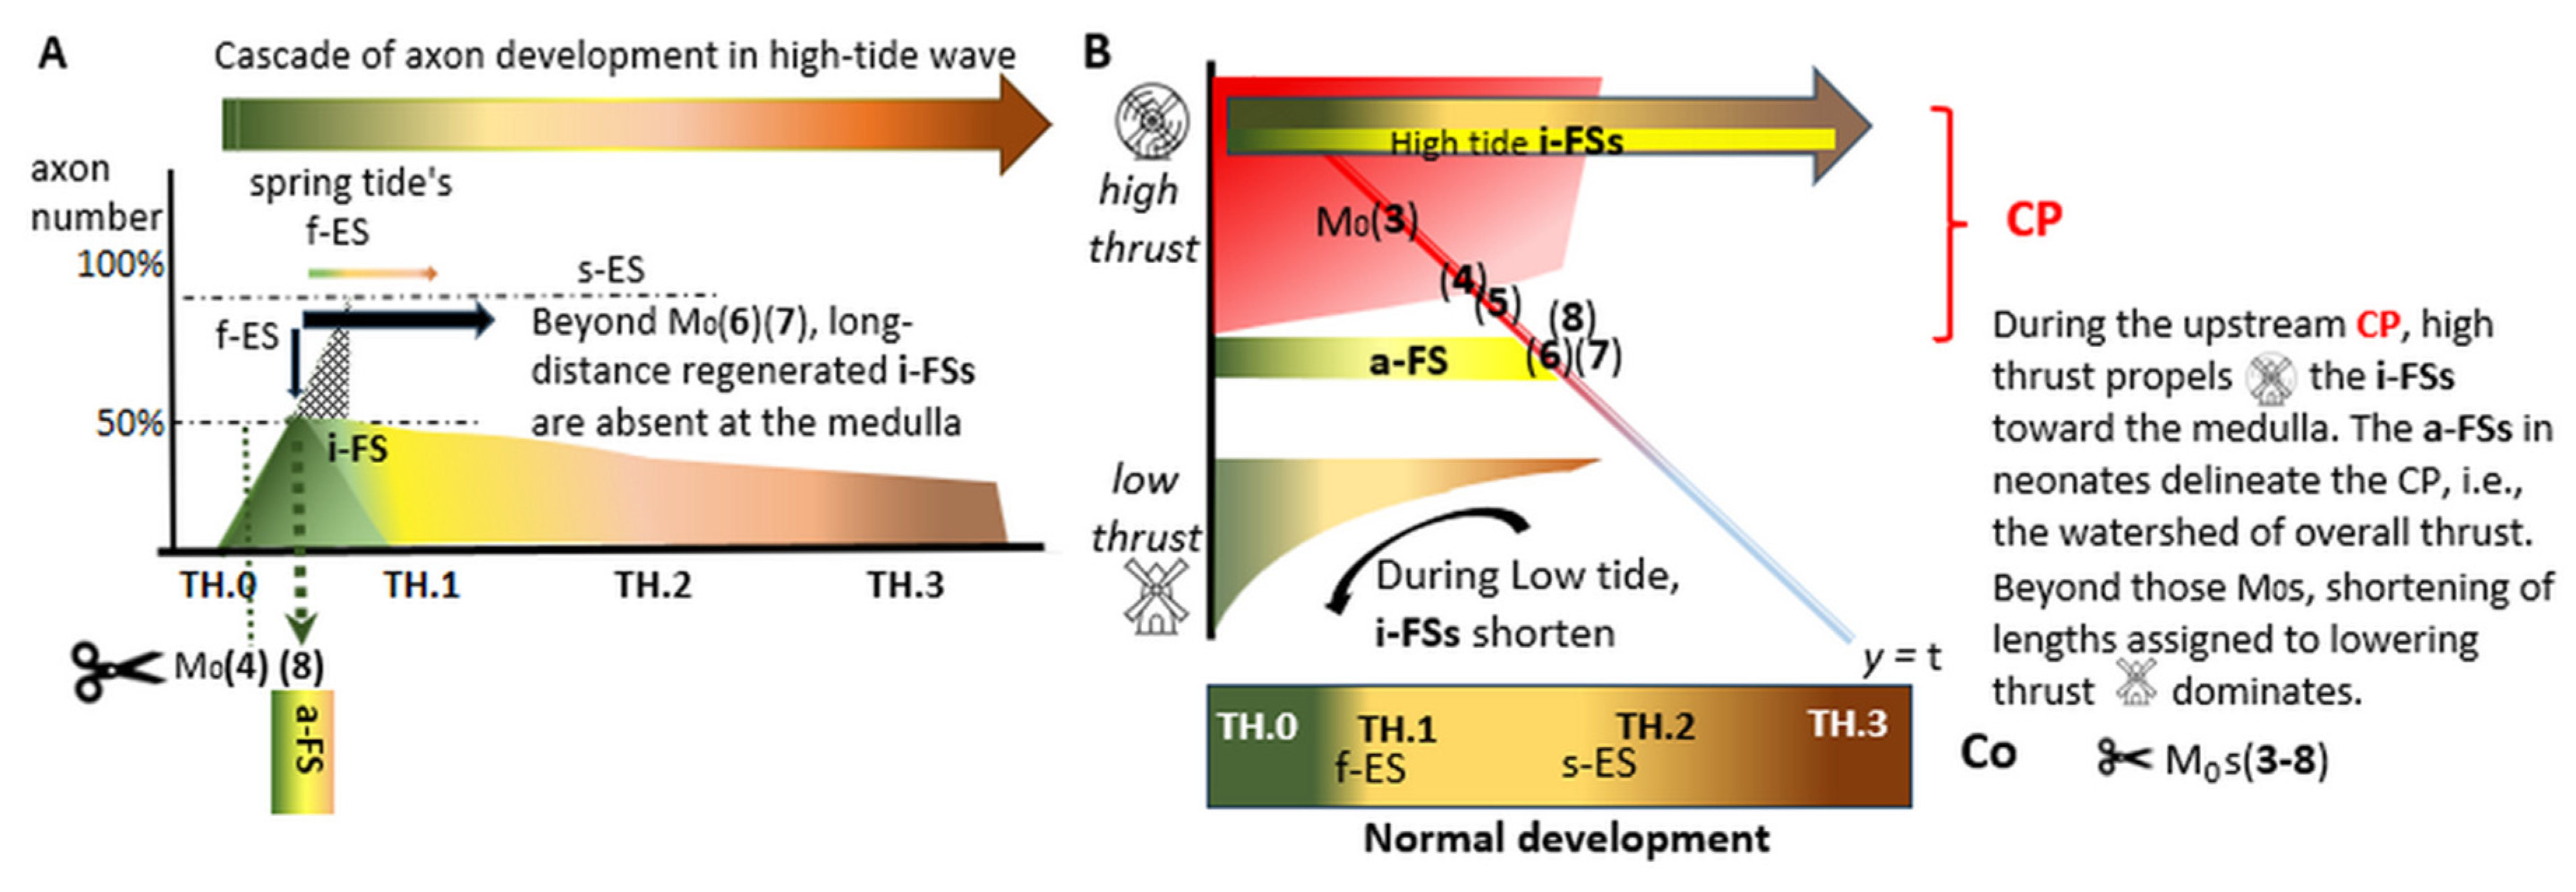
Figure 3.
The upstream state of high-tide pioneering axons. (A) This infographic illustrates the Tx level in the upper thoracic spinal cord (indicated by scissors), highlighting the most upstream pioneering long primary afferent axons, TH.0 (in green) and TH.1 (in yellow), during the first half of the CP.  : Denotes the spinal levels at C and D (horizontal sections). (B) The lines represent the TH.1 axons mimicry (in yellow), and TH.2 colls (in brown) originating from parent axons at the medulla (C). : The p40 male exhibited a medulla with multistage axons in both gracile nuclei. The dominance of TH.2 colls in the left gracile nucleus (noted with**) indicated accomplished development due to sustained high thrust levels. Phenotypically altered i-FSs outnumbered in the right DC. The increased labeling on the right side confirmed that many axons had regenerated across the damaged midline septum. (D) : Caudally from the medulla, occasional i-FSs (noted with *) were present in both DCs. t = time. N: iron fix pinhole. Bars: 100 µm.
: Denotes the spinal levels at C and D (horizontal sections). (B) The lines represent the TH.1 axons mimicry (in yellow), and TH.2 colls (in brown) originating from parent axons at the medulla (C). : The p40 male exhibited a medulla with multistage axons in both gracile nuclei. The dominance of TH.2 colls in the left gracile nucleus (noted with**) indicated accomplished development due to sustained high thrust levels. Phenotypically altered i-FSs outnumbered in the right DC. The increased labeling on the right side confirmed that many axons had regenerated across the damaged midline septum. (D) : Caudally from the medulla, occasional i-FSs (noted with *) were present in both DCs. t = time. N: iron fix pinhole. Bars: 100 µm.
Figure 3.
The upstream state of high-tide pioneering axons. (A) This infographic illustrates the Tx level in the upper thoracic spinal cord (indicated by scissors), highlighting the most upstream pioneering long primary afferent axons, TH.0 (in green) and TH.1 (in yellow), during the first half of the CP. : Denotes the spinal levels at C and D (horizontal sections). (B) The lines represent the TH.1 axons mimicry (in yellow), and TH.2 colls (in brown) originating from parent axons at the medulla (C). : The p40 male exhibited a medulla with multistage axons in both gracile nuclei. The dominance of TH.2 colls in the left gracile nucleus (noted with**) indicated accomplished development due to sustained high thrust levels. Phenotypically altered i-FSs outnumbered in the right DC. The increased labeling on the right side confirmed that many axons had regenerated across the damaged midline septum. (D) : Caudally from the medulla, occasional i-FSs (noted with *) were present in both DCs. t = time. N: iron fix pinhole. Bars: 100 µm.
: Denotes the spinal levels at C and D (horizontal sections). (B) The lines represent the TH.1 axons mimicry (in yellow), and TH.2 colls (in brown) originating from parent axons at the medulla (C). : The p40 male exhibited a medulla with multistage axons in both gracile nuclei. The dominance of TH.2 colls in the left gracile nucleus (noted with**) indicated accomplished development due to sustained high thrust levels. Phenotypically altered i-FSs outnumbered in the right DC. The increased labeling on the right side confirmed that many axons had regenerated across the damaged midline septum. (D) : Caudally from the medulla, occasional i-FSs (noted with *) were present in both DCs. t = time. N: iron fix pinhole. Bars: 100 µm.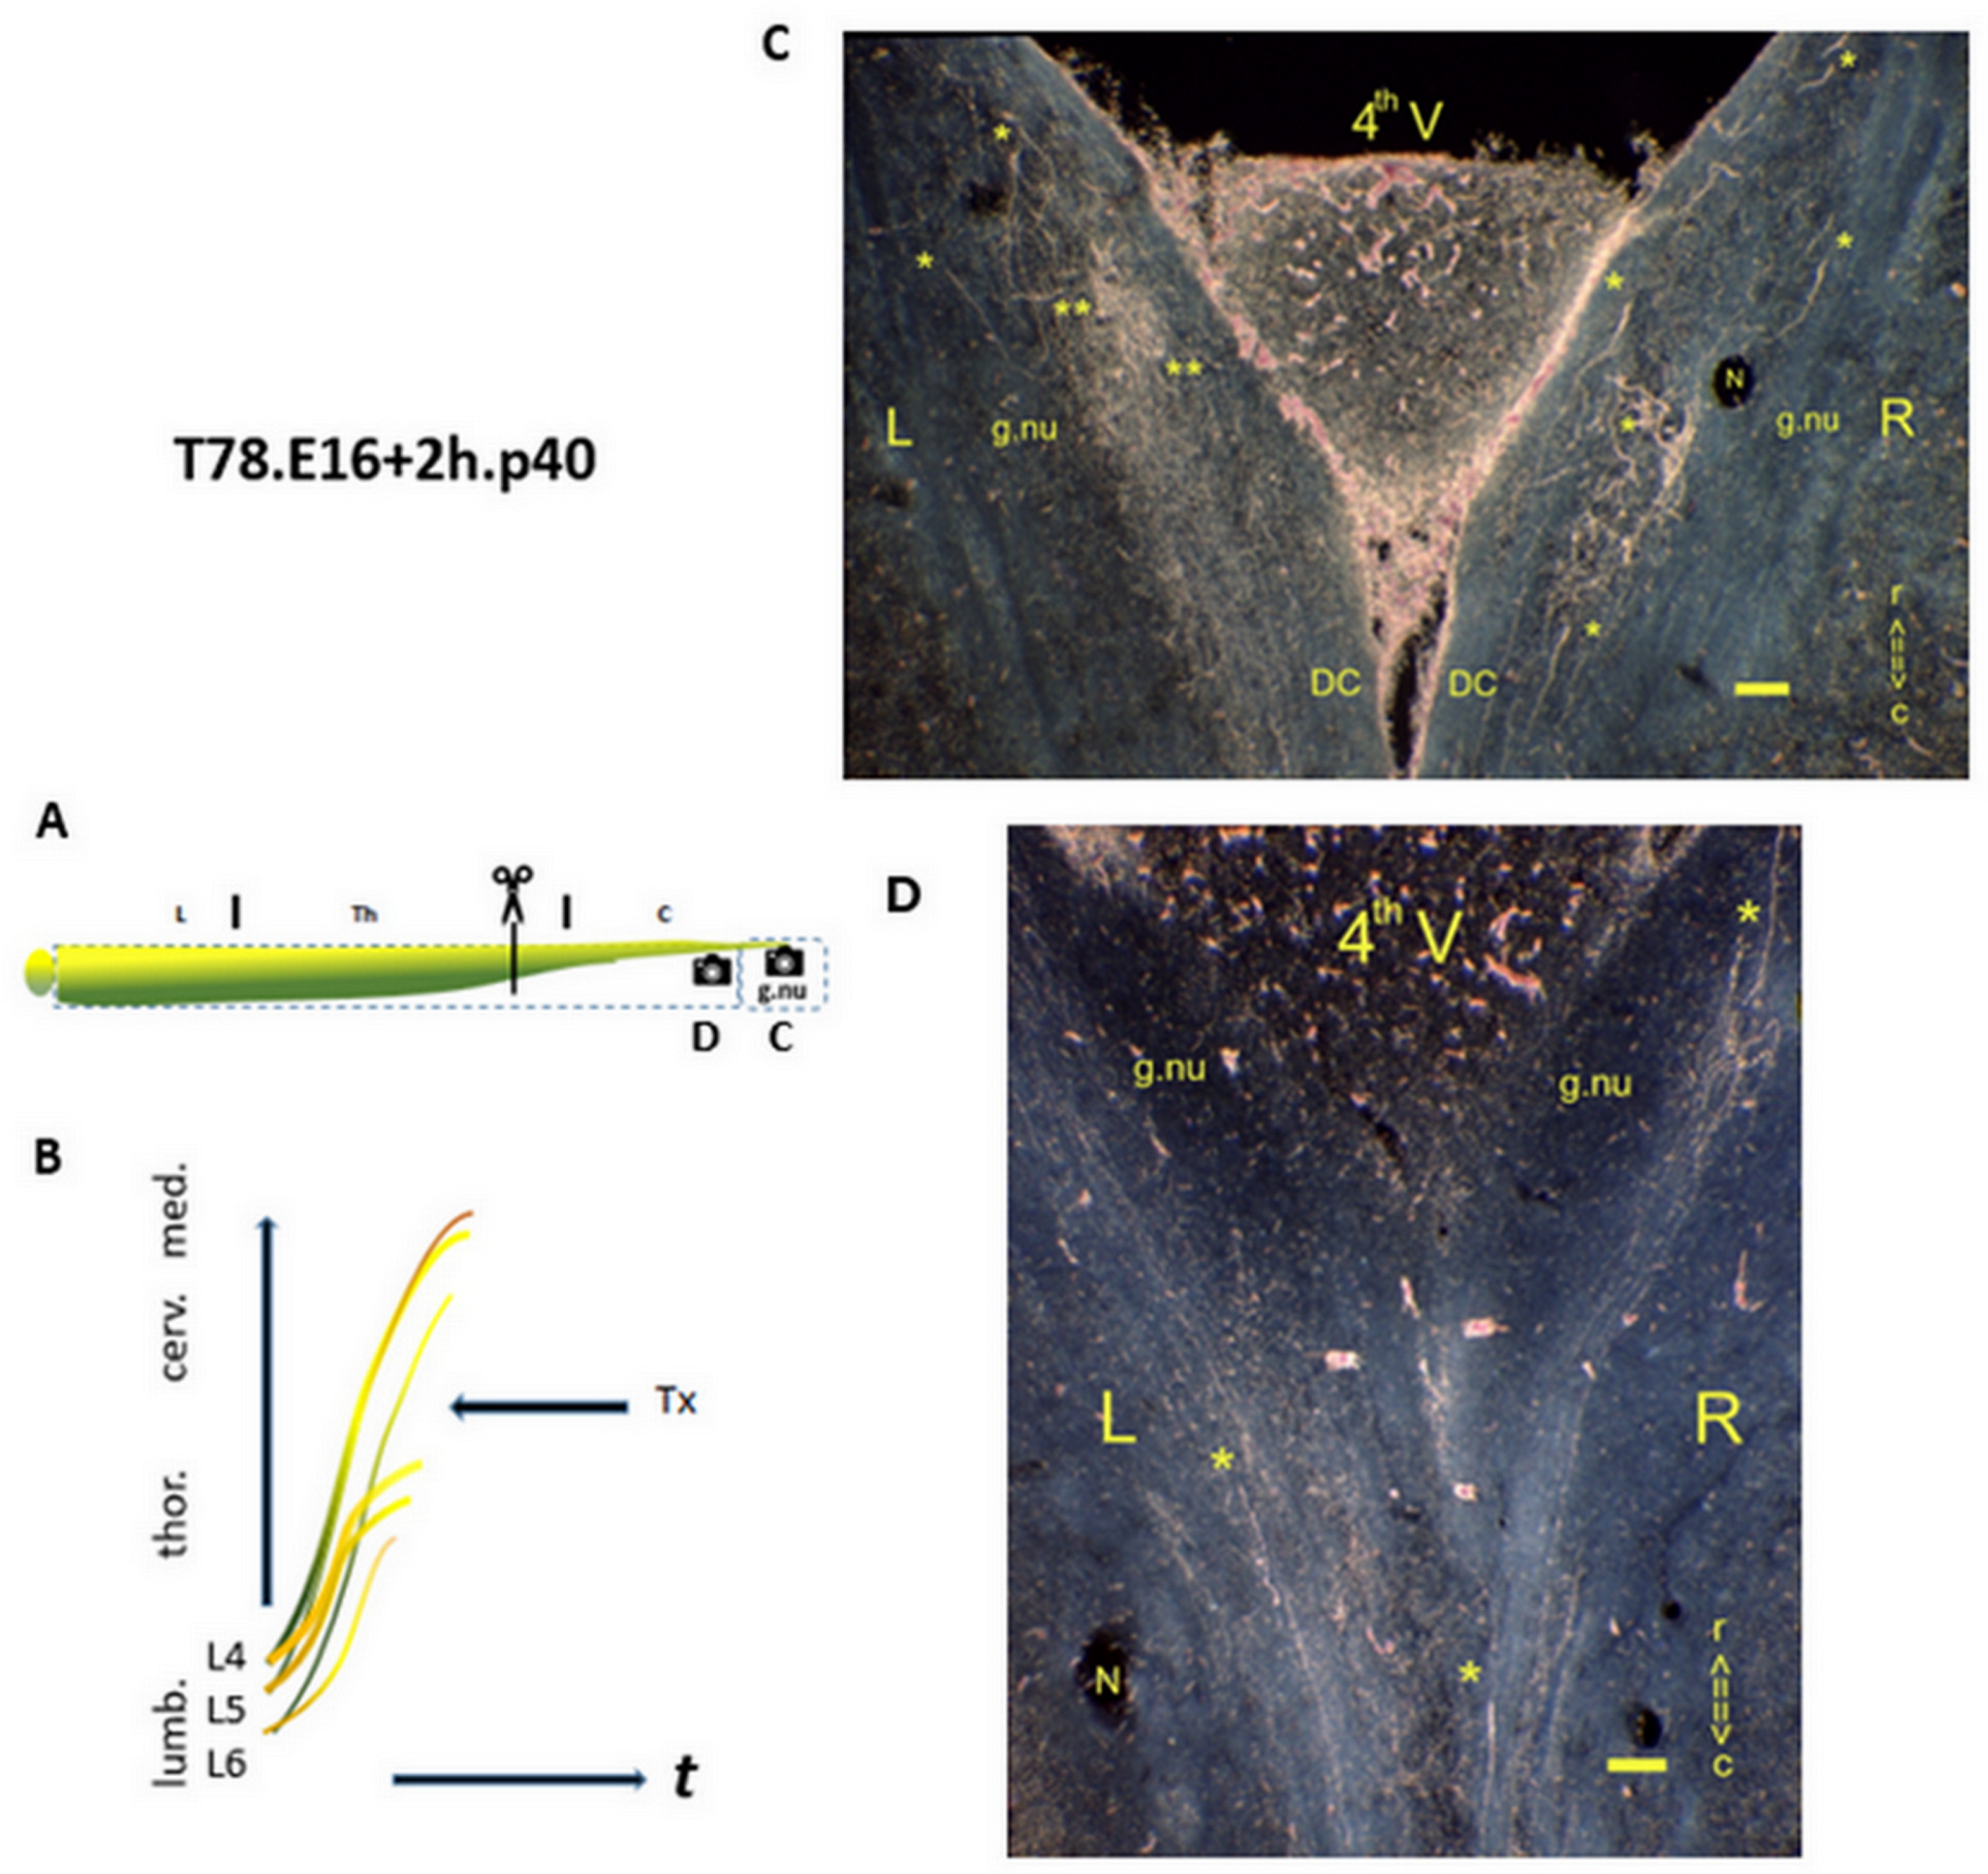
Figure 4.
Approaching the CP’s closure, the long primary afferent axon development progressed downstream compared with the former p40 male. (A) The Tx level is located in the lower thoracic spinal cord. : Denotes the spinal levels at C and D. (B) Various axons crossed the lesion site. (C) : Horizontal section of gracile nuclei. The p240 female exhibited the left gracile nucleus labeled with TH.2 staged colls (noted: **). The covering DC contained a few i-FSs (noted: *). (D) : Sagital section at the lesion site. A fibrous attachment marked the lesion site covering the CG. A few age-morphed i-FSs (*) abutted the lesion site caudally. These dispersed i-FSs reflected a neonatal a-FS, which converted into the adult state over time. These axons re-elongated close to the level of the Tx. Bypassing ventrally the lesion site, a few parent axons (TH.0 staged) were localized. t = time. N: iron fix pinhole. Bars: 100 µm.
: Denotes the spinal levels at C and D. (B) Various axons crossed the lesion site. (C) : Horizontal section of gracile nuclei. The p240 female exhibited the left gracile nucleus labeled with TH.2 staged colls (noted: **). The covering DC contained a few i-FSs (noted: *). (D) : Sagital section at the lesion site. A fibrous attachment marked the lesion site covering the CG. A few age-morphed i-FSs (*) abutted the lesion site caudally. These dispersed i-FSs reflected a neonatal a-FS, which converted into the adult state over time. These axons re-elongated close to the level of the Tx. Bypassing ventrally the lesion site, a few parent axons (TH.0 staged) were localized. t = time. N: iron fix pinhole. Bars: 100 µm.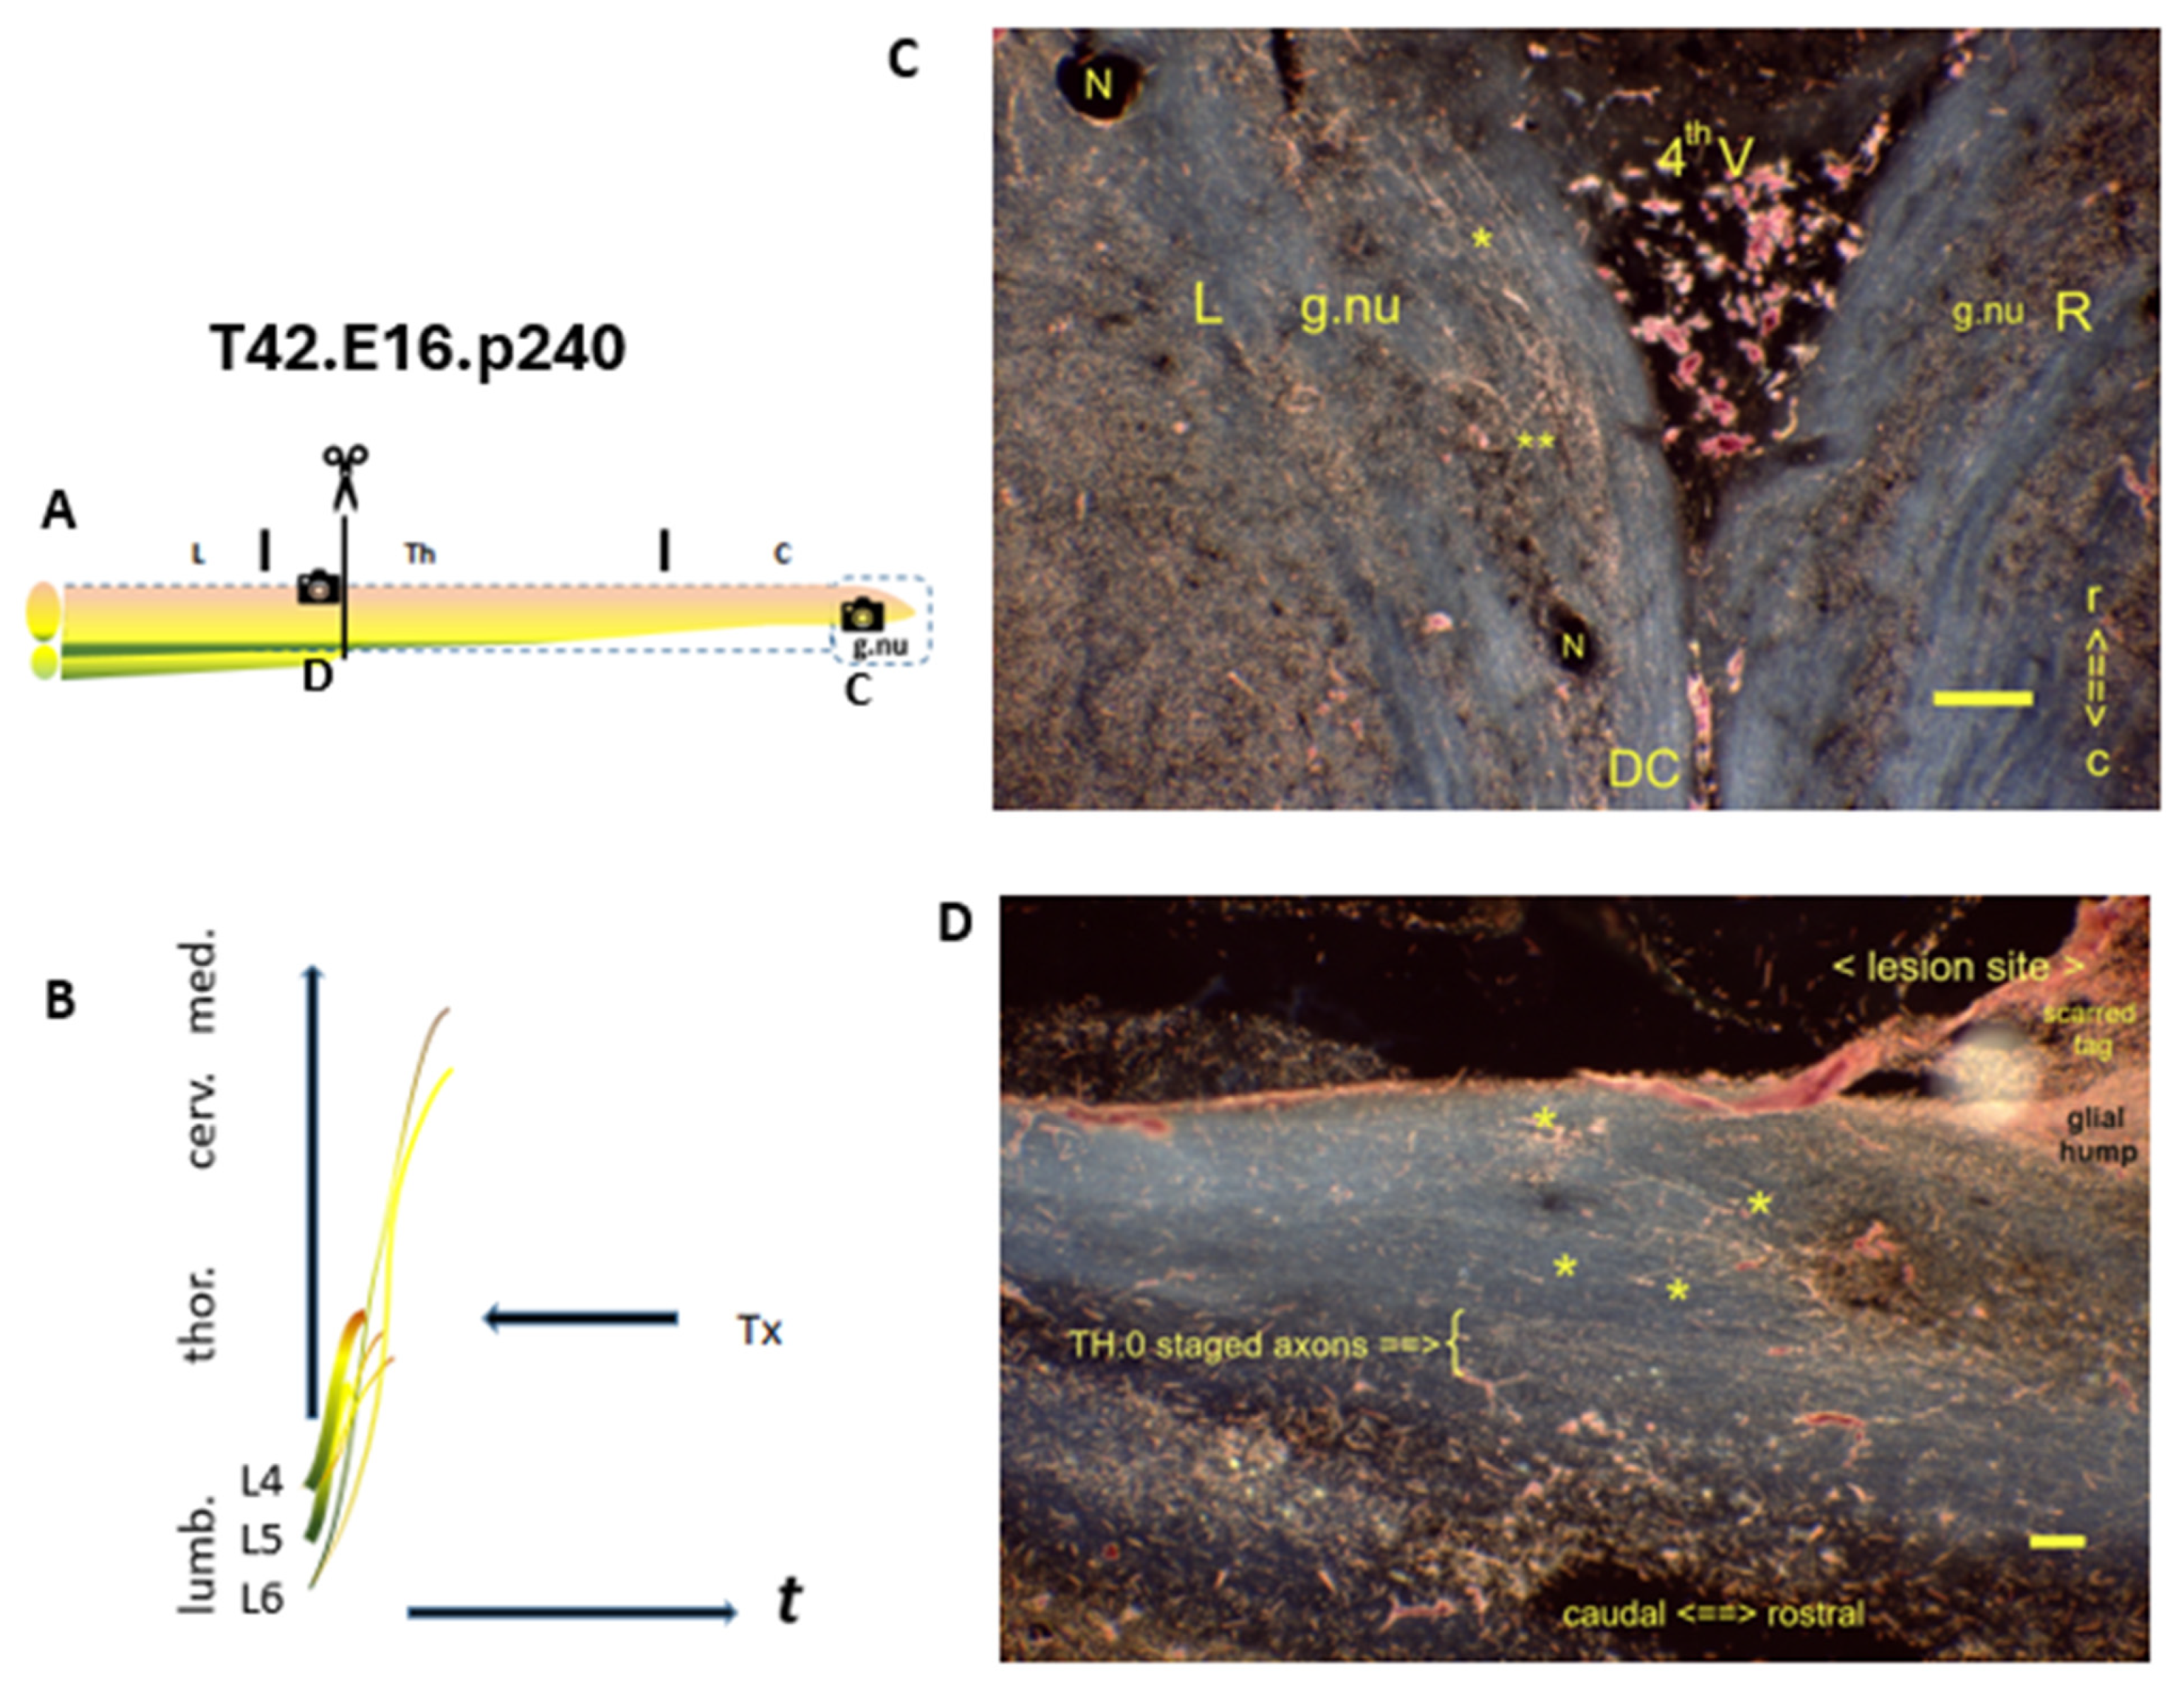
Figure 5.
The distinct features remained visible after almost two years. (A) The Tx level is located at the upper thoracic spinal cord. : Denotes the spinal levels at C and D. (B) The axons at the medulla demonstrate the CP had not been closed. (C) : Horizontal section of gracile nuclei. The p600 male showed various i-FSs in the left gracile nucleus and a few colls. (D): Sagittal section of the mid-thoracic spinal cord. The multilevel i-FSs elongated to caudal levels distant from the lesion site. Fading thrust was thought to determine the lengths of axons. t = time. N: iron fix pinhole. Bars: 100 µm.
: Denotes the spinal levels at C and D. (B) The axons at the medulla demonstrate the CP had not been closed. (C) : Horizontal section of gracile nuclei. The p600 male showed various i-FSs in the left gracile nucleus and a few colls. (D): Sagittal section of the mid-thoracic spinal cord. The multilevel i-FSs elongated to caudal levels distant from the lesion site. Fading thrust was thought to determine the lengths of axons. t = time. N: iron fix pinhole. Bars: 100 µm.
Figure 6.
W2.E16-7h.p9 A hallmark of fetal Txs: the neonatal a-FS. (A) The Tx level is located at a low cervical segment. : Denotes the spinal levels at C (transverse section) and D (sagital section). (B) A few TH.2 axons have reached the medulla. (C) The left gracile nucleus had been labeled. (D) The lesion site was marked with a dorsal hump. The hallmark a-FS abutted the caudal lesion site. Various i-FSs (noted: *) and colls (noted: **) were visible in the neuropil. The parent axons might be inferred from their presence in the medulla. t = time. Bars: 100 µm.
: Denotes the spinal levels at C (transverse section) and D (sagital section). (B) A few TH.2 axons have reached the medulla. (C) The left gracile nucleus had been labeled. (D) The lesion site was marked with a dorsal hump. The hallmark a-FS abutted the caudal lesion site. Various i-FSs (noted: *) and colls (noted: **) were visible in the neuropil. The parent axons might be inferred from their presence in the medulla. t = time. Bars: 100 µm.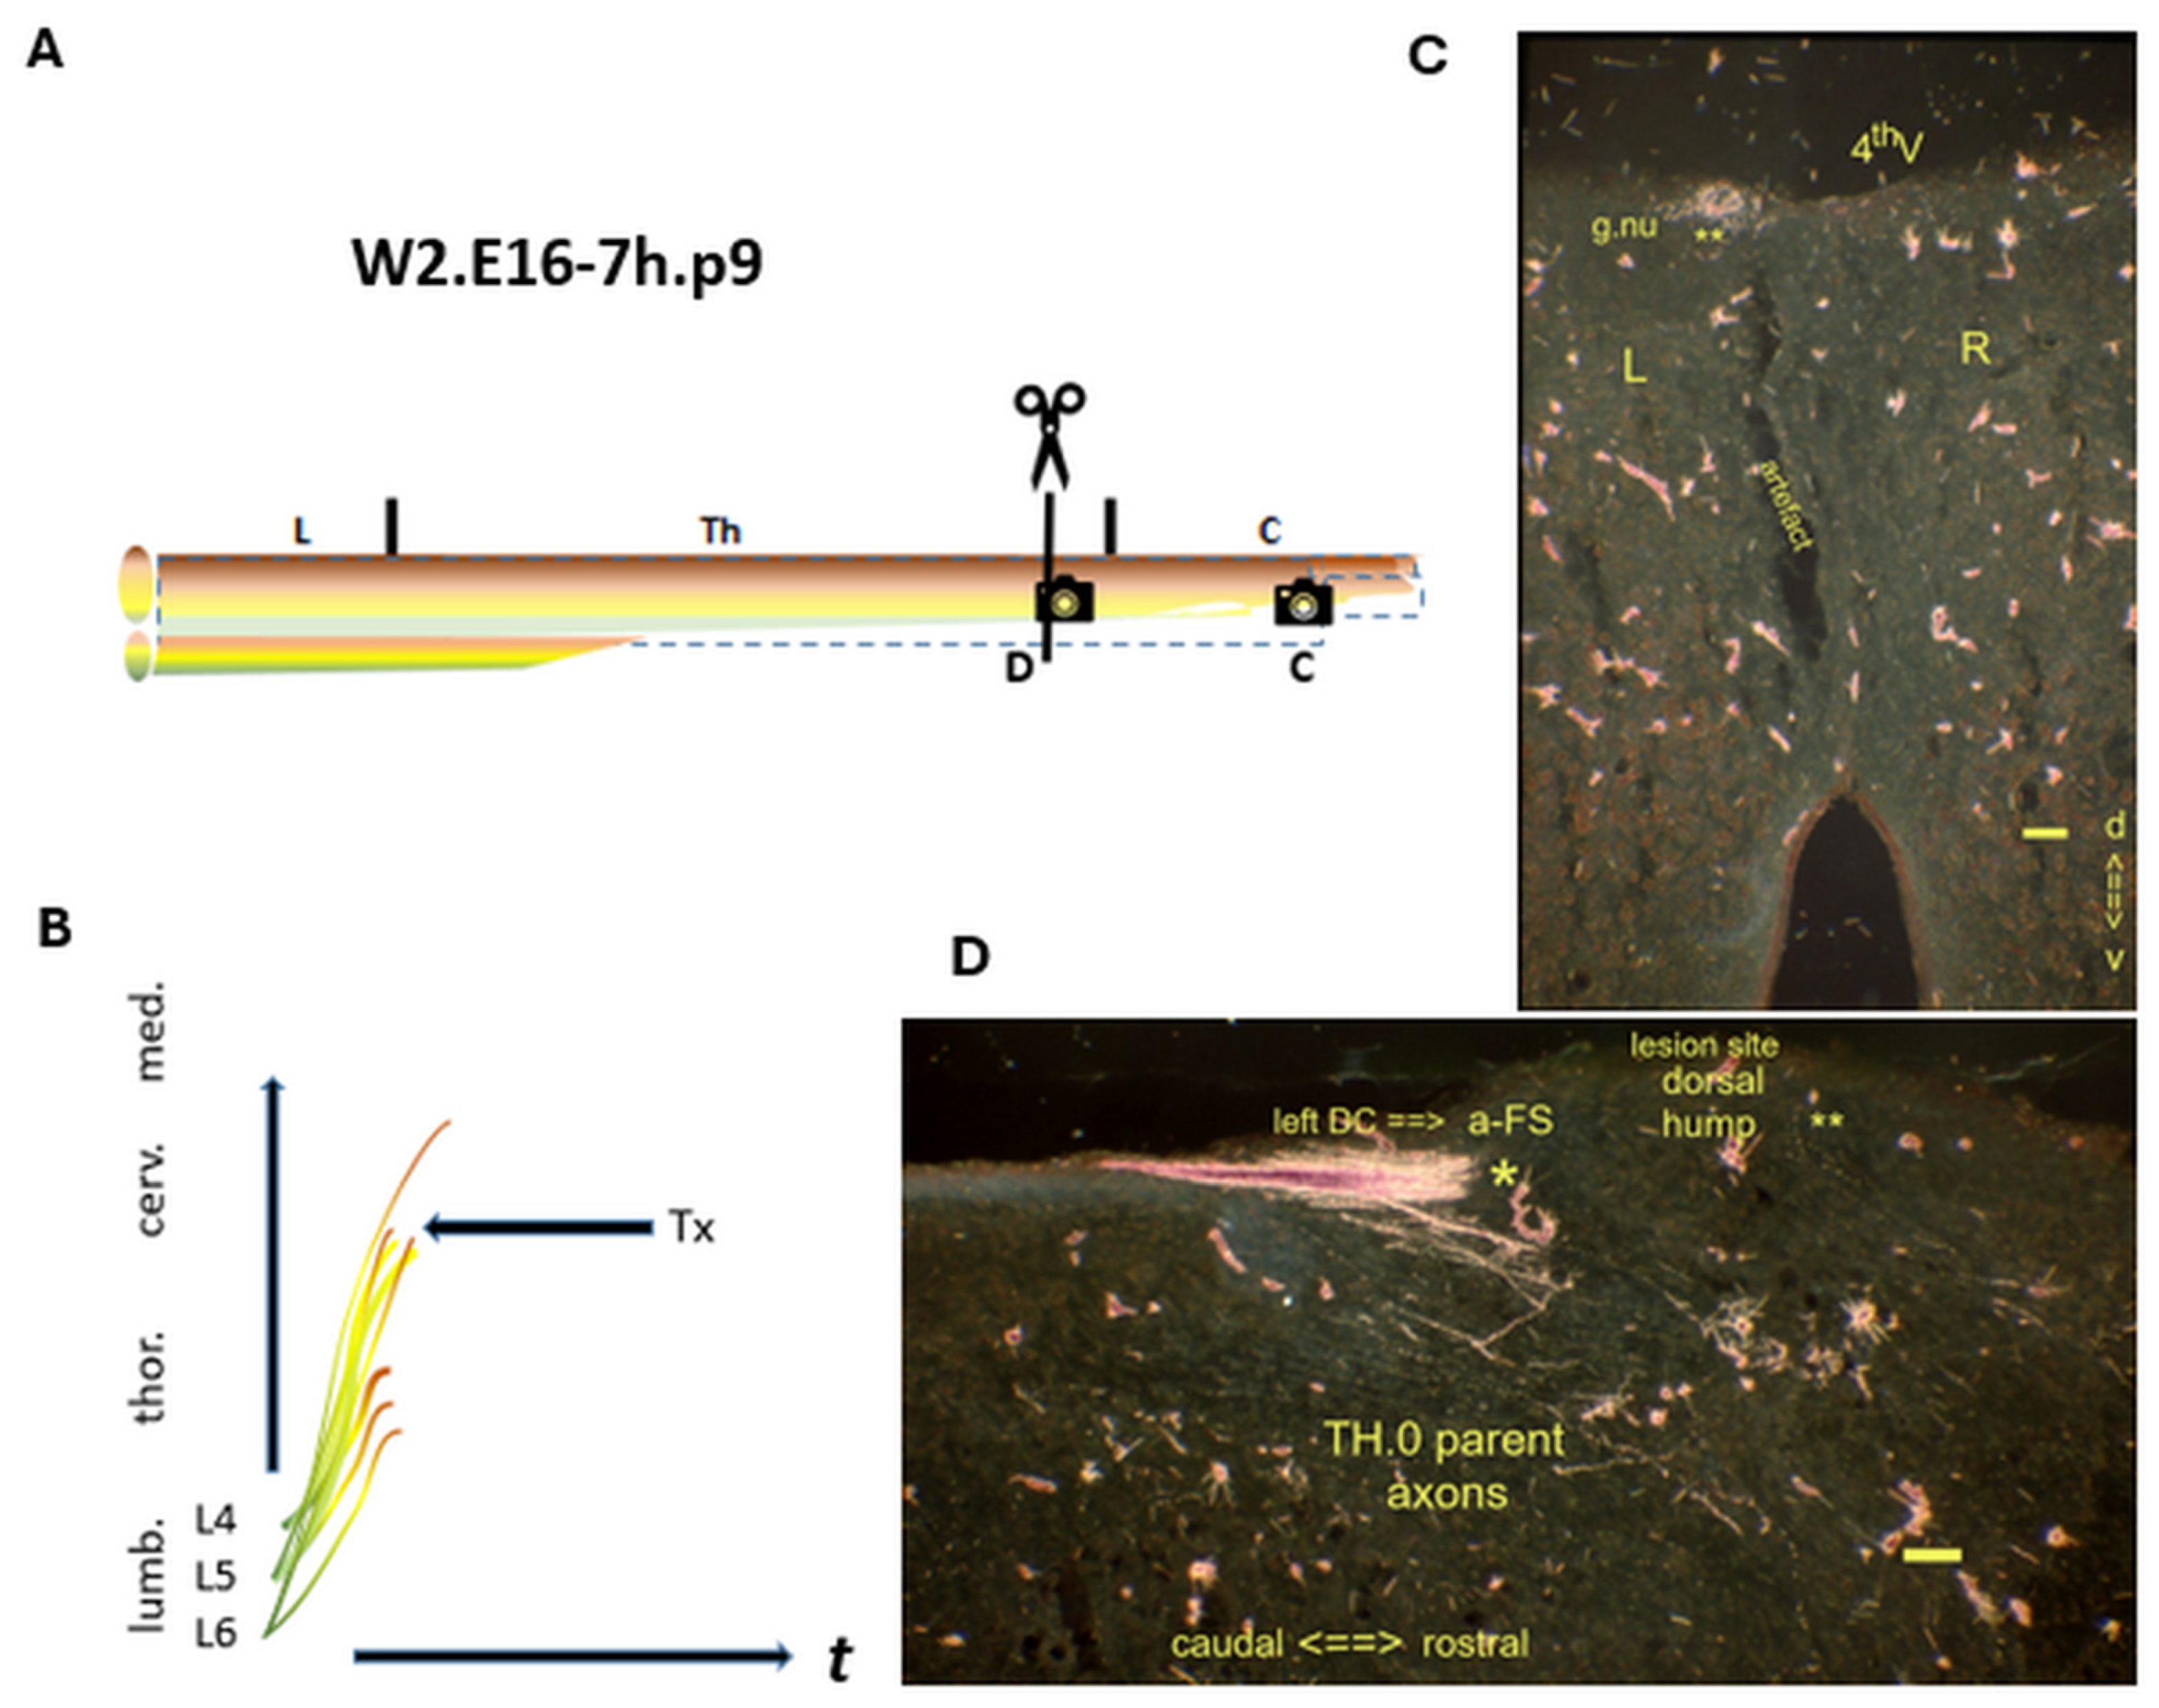
Figure 7.
A final i-FS in the rostral DC marks the closure of the CP. (A) The Tx level at the upper thoracic spinal cord. : The spinal levels at C and D (horizontal sections). (B) A final i-FS crossed the lesion site. (C): In the left rostral DC, the final i-FS has not yet reached the medulla. (D): The lesion site’s level is identified first and foremost by the midline cyste. The a-FS is the typical feature of bundled i-FSs in a neonate. The colls (noted: **) exhibited an unusual growth pattern into the CG far beyond the natural superficially located gracile nucleus. These dystopic TH.2 stage colls in the CG exemplified the features complying with the downstream phenotype. Colls have always been qualified mistakenly in the literature as CNS regeneration. t = time. Bars: 100 µm.
: The spinal levels at C and D (horizontal sections). (B) A final i-FS crossed the lesion site. (C): In the left rostral DC, the final i-FS has not yet reached the medulla. (D): The lesion site’s level is identified first and foremost by the midline cyste. The a-FS is the typical feature of bundled i-FSs in a neonate. The colls (noted: **) exhibited an unusual growth pattern into the CG far beyond the natural superficially located gracile nucleus. These dystopic TH.2 stage colls in the CG exemplified the features complying with the downstream phenotype. Colls have always been qualified mistakenly in the literature as CNS regeneration. t = time. Bars: 100 µm.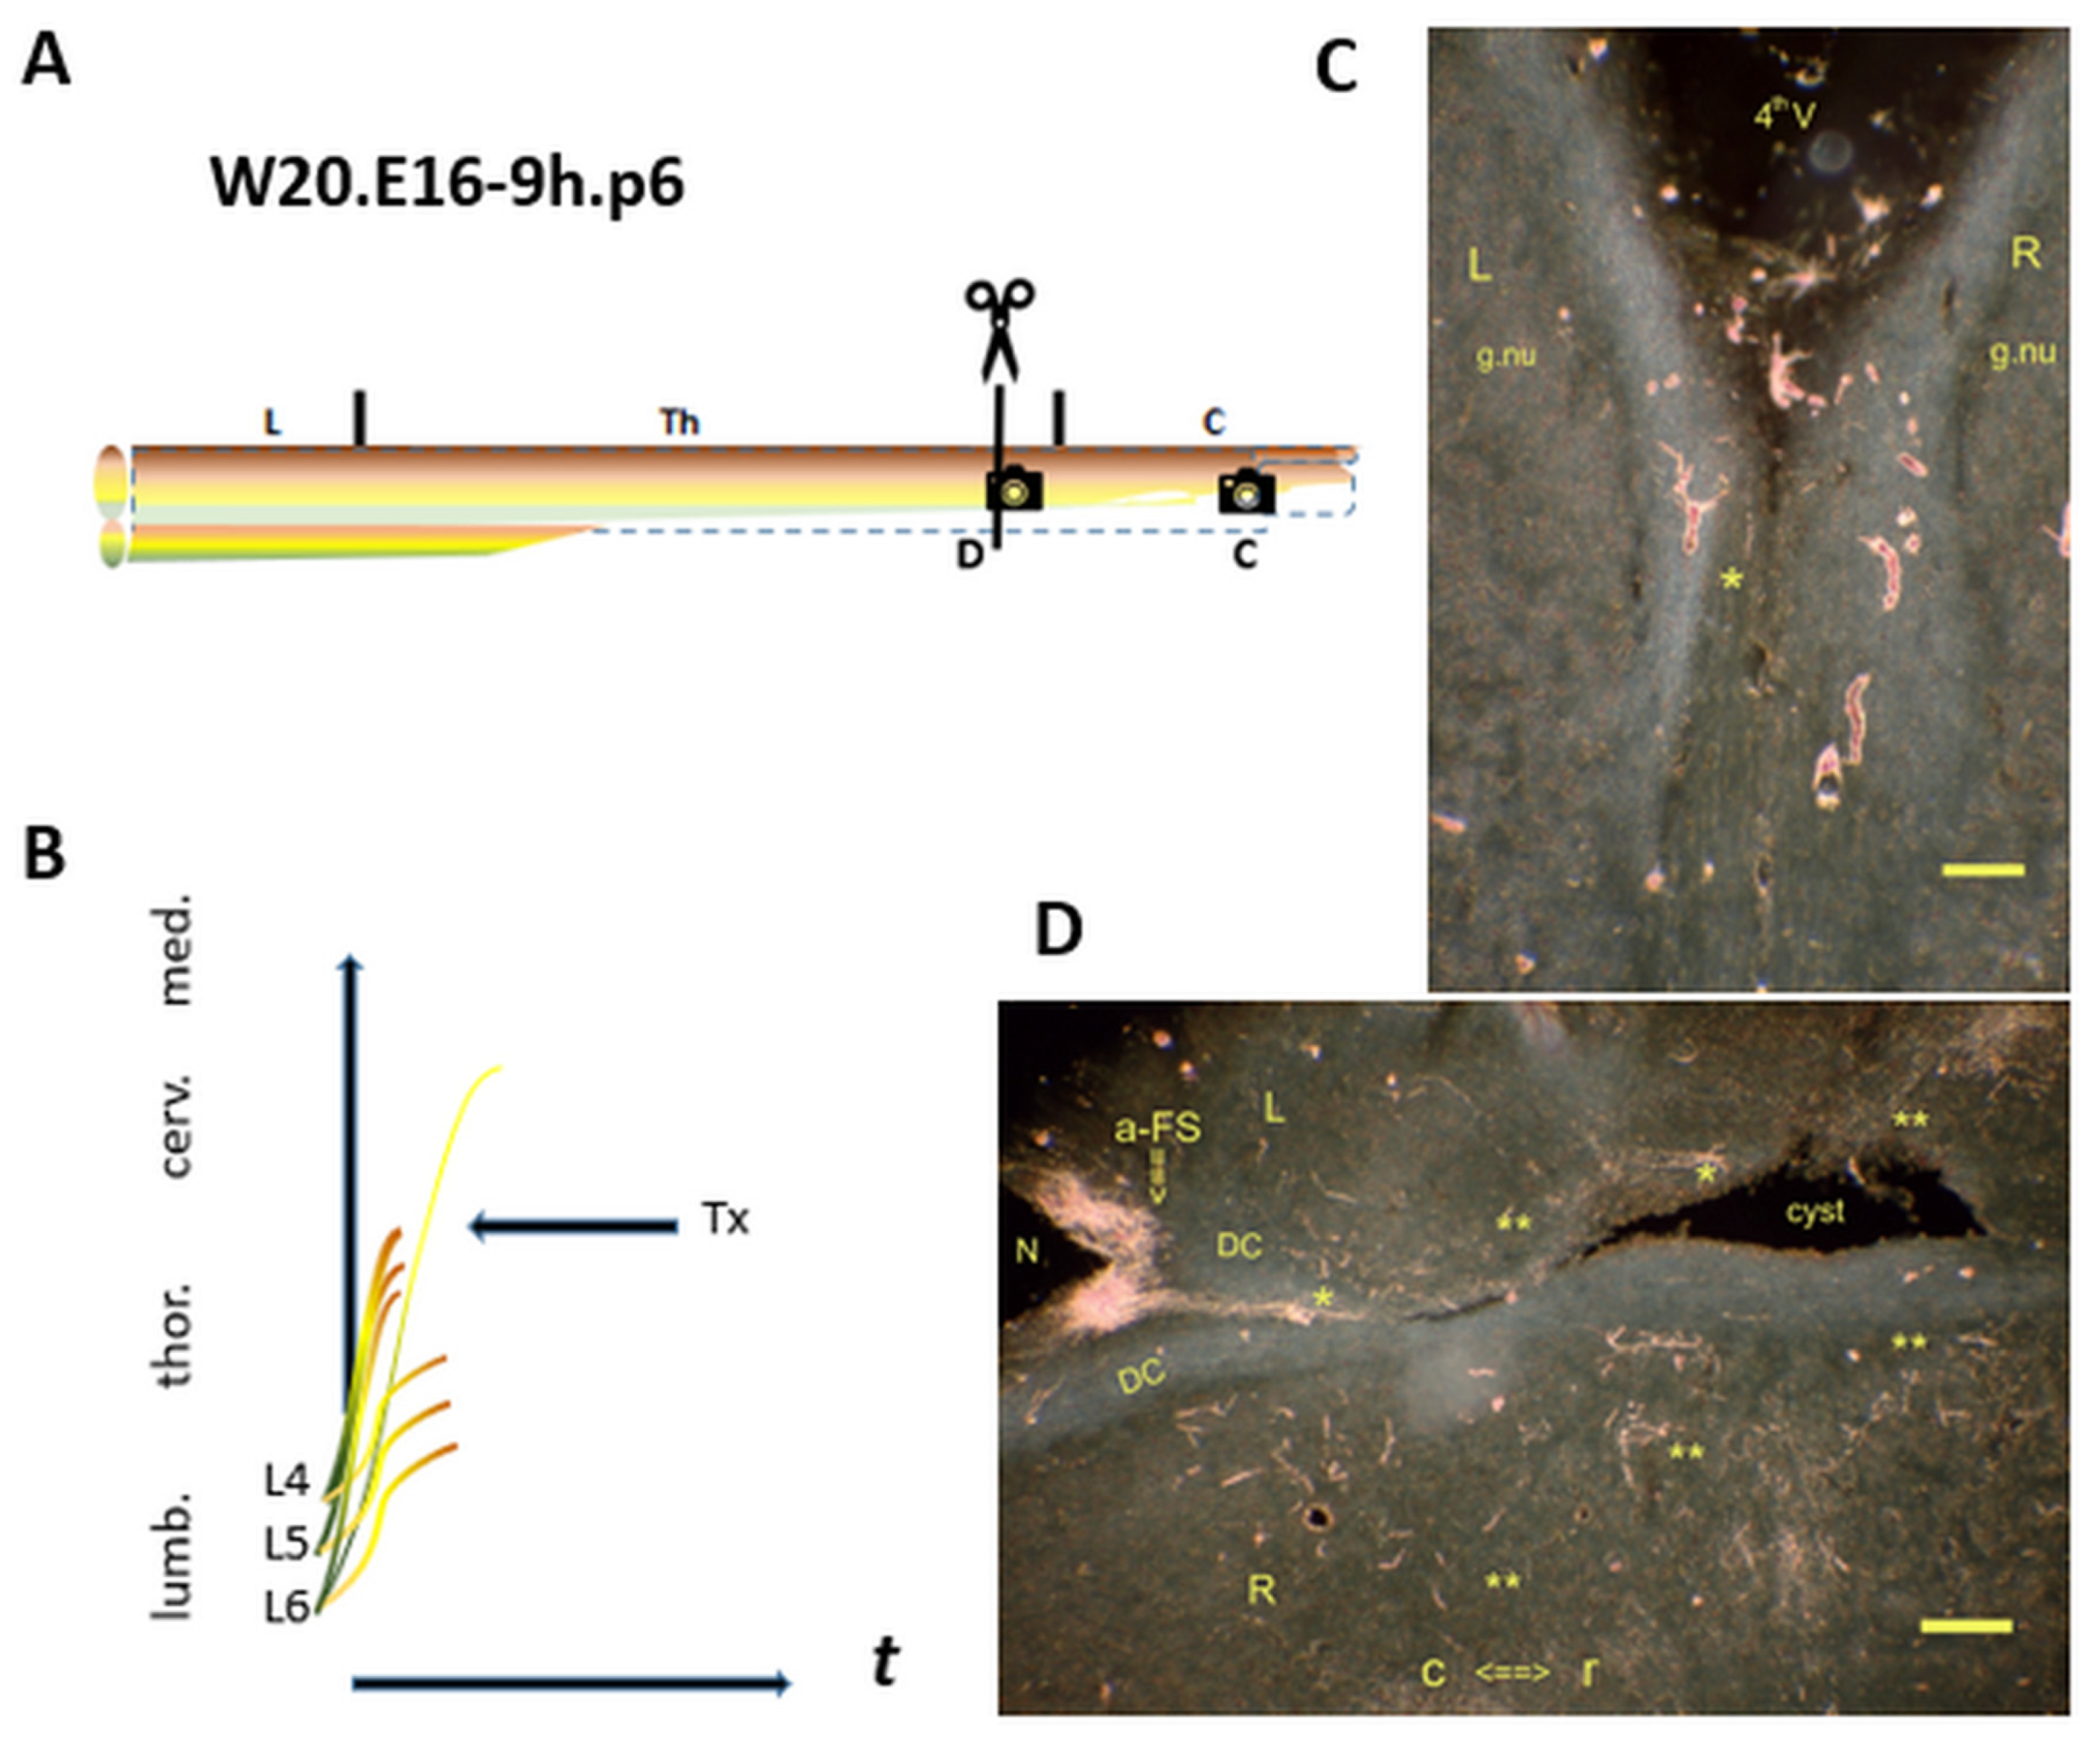
Figure 8.
A peculiar a-FS at the level of the medulla. (A) The Tx level at the upper thoracic spinal cord. The elongating TH.0 axons from L5 and/or L6 DRGs create the a-FS : The spinal levels at C and D. (B) The yellow i-FSs regenerate into the medulla. (C) : Horizontal slide at the medulla. In the p14 female, the left DC (open arrow) covering the gracile nucleus harbored i-FSs (noted: *). They joined the a-FS feature at a rather rostral medullary level. The axons might have bypassed the gracile nucleus. (D) The lesion site exhibited the traumatic origin of a diastematomyelia at the thoracic level. The left DC contained i-FSs (noted:*), which had been re-elongated into the medulla. t = time. Bar: 100 µm.
: The spinal levels at C and D. (B) The yellow i-FSs regenerate into the medulla. (C) : Horizontal slide at the medulla. In the p14 female, the left DC (open arrow) covering the gracile nucleus harbored i-FSs (noted: *). They joined the a-FS feature at a rather rostral medullary level. The axons might have bypassed the gracile nucleus. (D) The lesion site exhibited the traumatic origin of a diastematomyelia at the thoracic level. The left DC contained i-FSs (noted:*), which had been re-elongated into the medulla. t = time. Bar: 100 µm.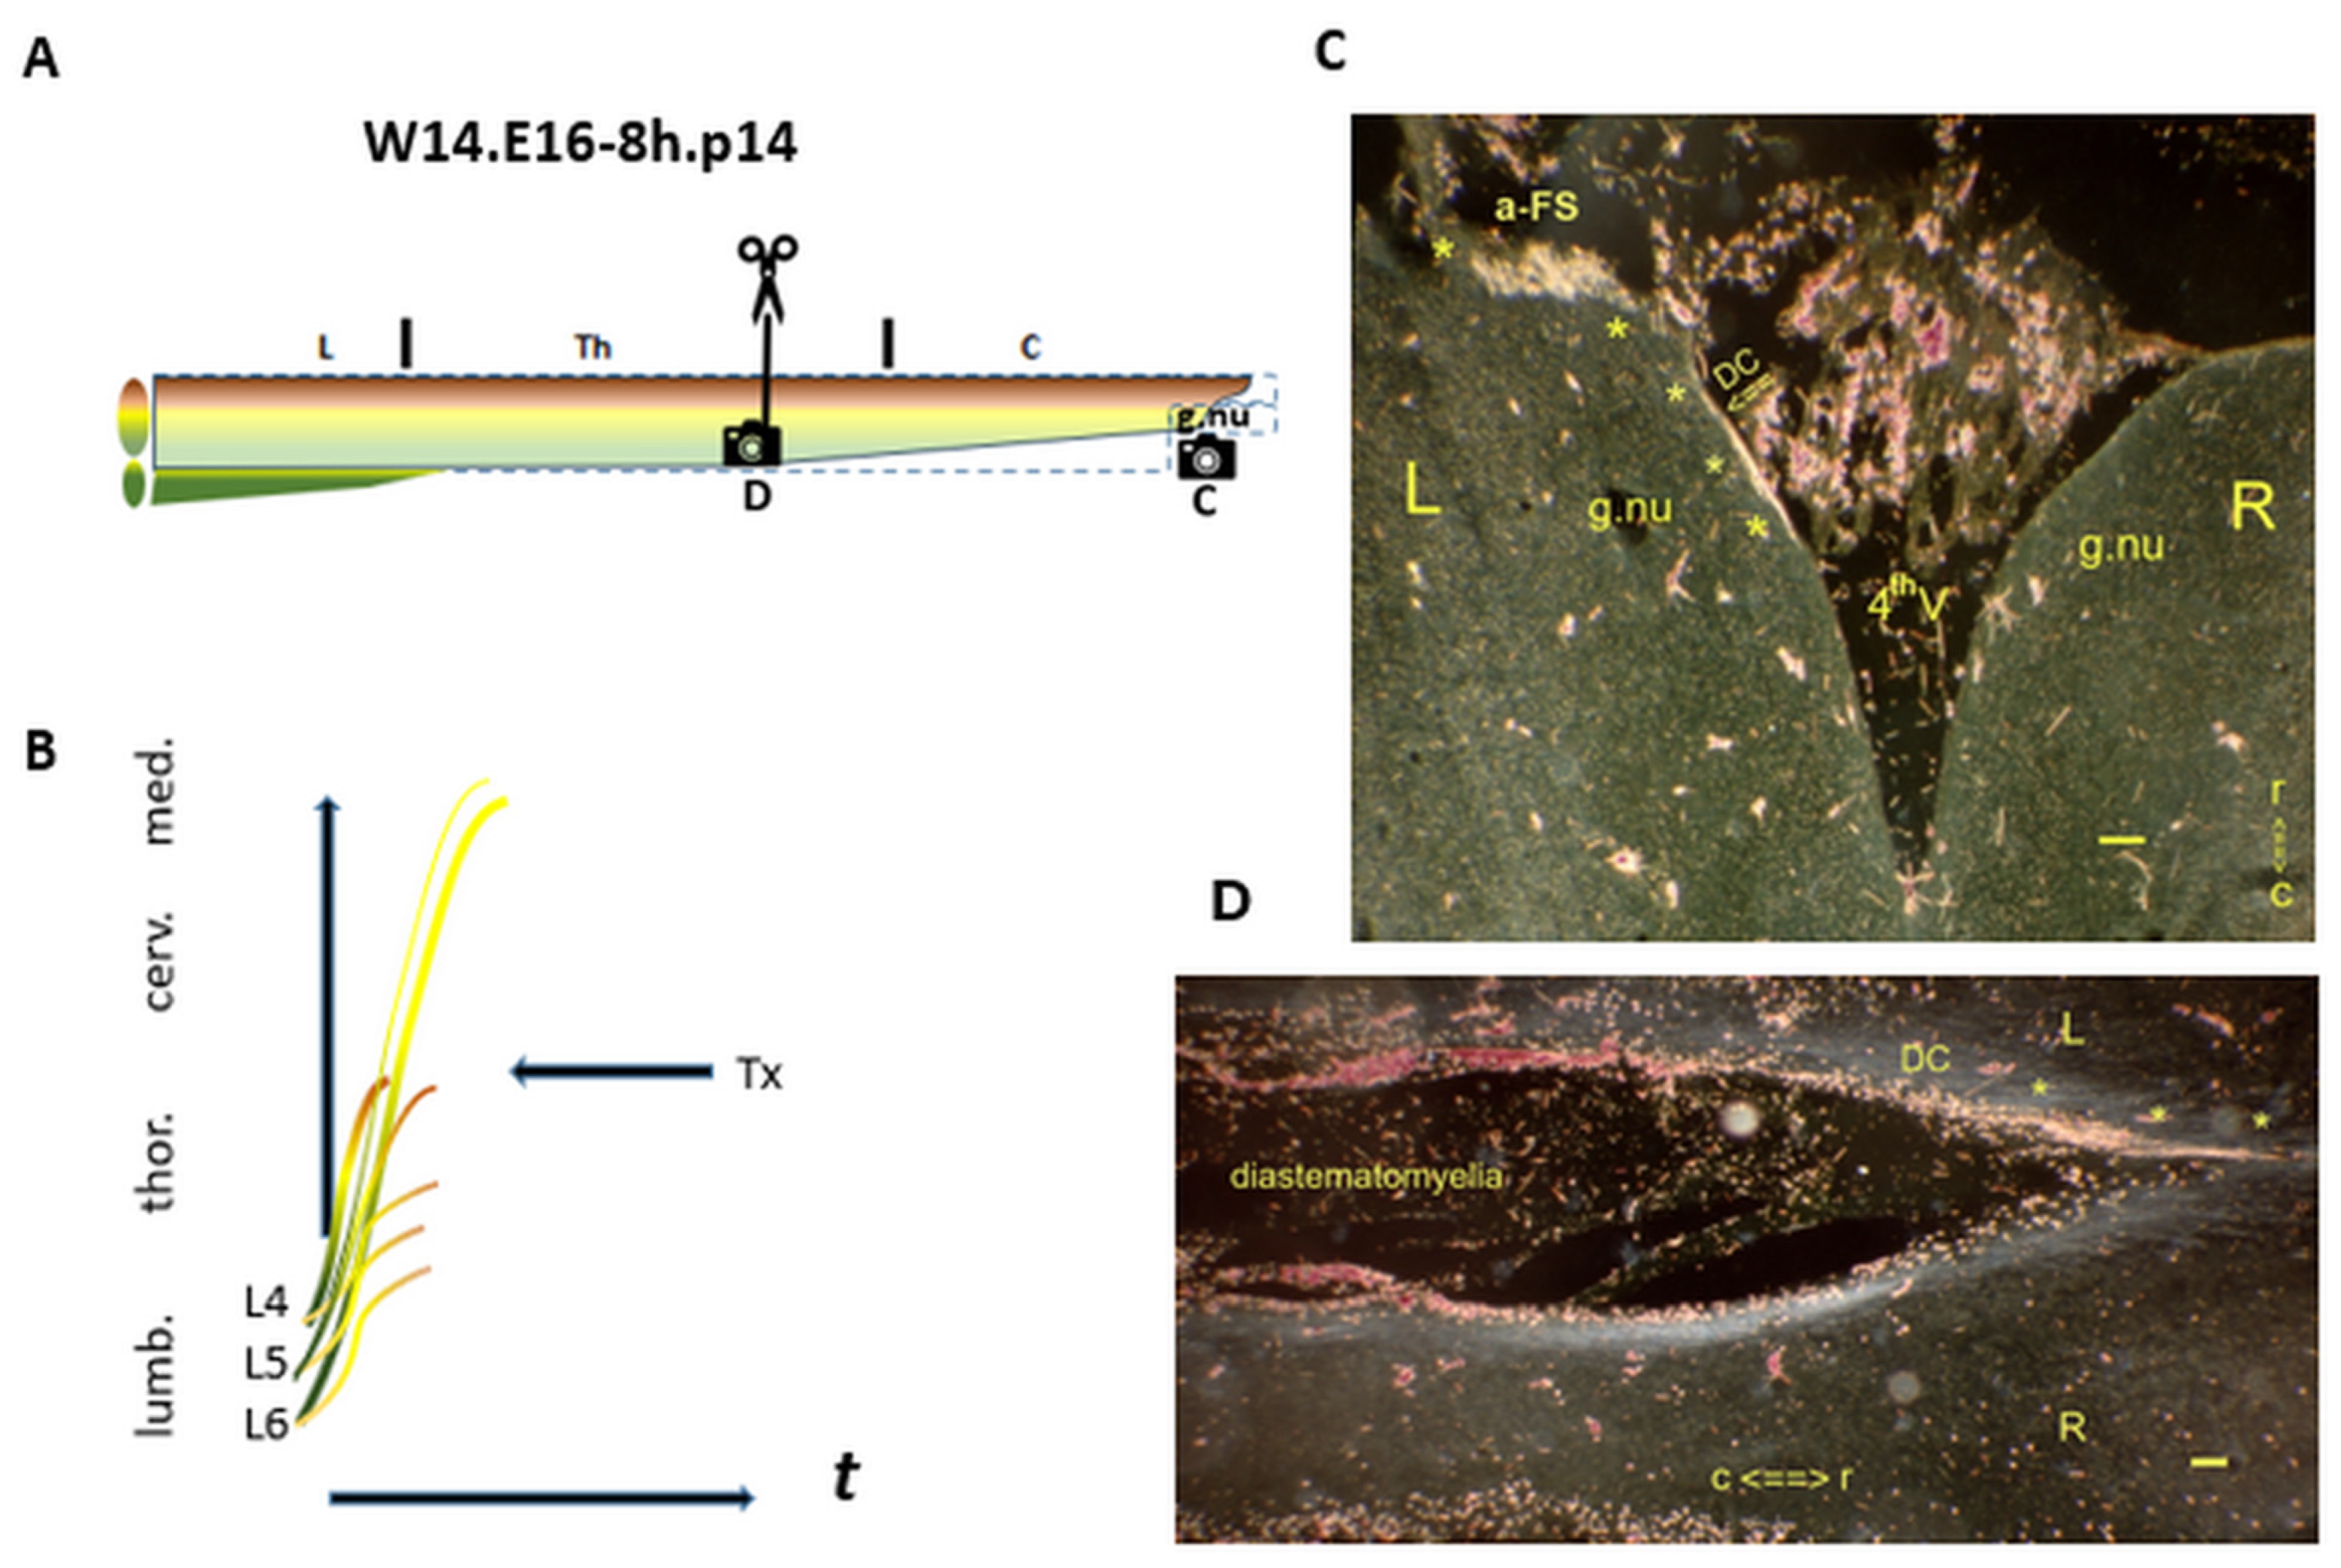

Table 1.
The recruitment of the 45 experiments during the experimentation period reflects the scarcity of cases with proper M0s, which are hard to pinpoint upfront. Six cases display HRP feature stills, ranking the M0 on the upstream development within the critical period. The majority fulfills the criteria of downstream development, which are beyond the scope of this paper.
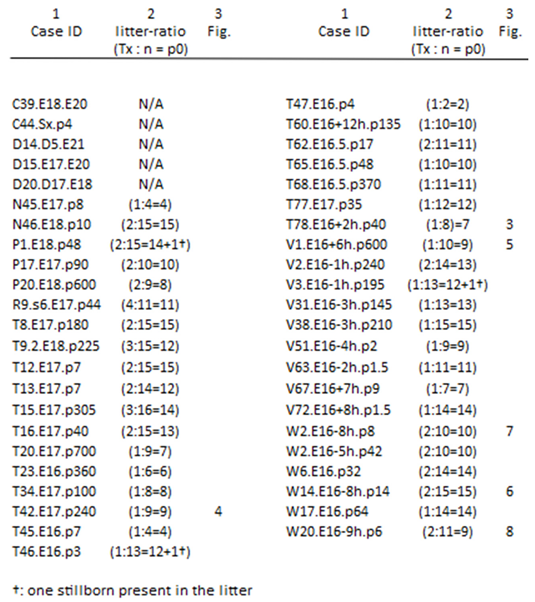
Column 1 includes the experiments performed during ten years of experimentation and is denoted by a threefold letter-and-number combination. The column shows the serial number first and the follow-up period third. The Tx day (M0) relates to the conception day noted in the middle, specified by the hour in a few. In column 2, the success ratios are shown (count of Txs: fetus count = litter size). Optimal ratios underline standardization as key for the paradigm’s applicability. Fewer-than-expected deaths resulted from three stillborn neonates, not yet cannibalized. The male/female ratio was 3/2 in 41 neonates and the six in column 3, listing the six bell-ringer cases displayed in Figures 3–8.
Disclaimer/Publisher’s Note: The statements, opinions and data contained in all publications are solely those of the individual author(s) and contributor(s) and not of MDPI and/or the editor(s). MDPI and/or the editor(s) disclaim responsibility for any injury to people or property resulting from any ideas, methods, instructions or products referred to in the content. |
© 2025 by the authors. Licensee MDPI, Basel, Switzerland. This article is an open access article distributed under the terms and conditions of the Creative Commons Attribution (CC BY) license (https://creativecommons.org/licenses/by/4.0/).
Copyright: This open access article is published under a Creative Commons CC BY 4.0 license, which permit the free download, distribution, and reuse, provided that the author and preprint are cited in any reuse.


