Submitted:
28 December 2024
Posted:
30 December 2024
You are already at the latest version
Abstract
Objectives
This study aimed to evaluate the outcomes of the Subcrestally Placed Implants (SPI) with Internal Platform Switching (IPS) design in single molar replacements utilizing the matching abutment technique. The investigation focused on achieving biological stability and esthetics while proposing a schematic model to seek the relationship between the biological stability of peri-implant soft tissue and crestal bone.
Materials and Methods
Twenty cases of SPI with IPS design were evaluated. Panoramic radiographs were employed to assess changes in crestal bone levels at the mesial and distal sides over an average follow-up period of 3.4 years, providing a practical method for routine monitoring. CBCT scans, acquired at least one year after surgery, were comprehensively analyzed to determine the dimensions of peri-implant soft tissue in a three-dimensional context. Parameters assessed included:
Placement depth (PD), both central (cPD) and peripheral (pPD).
Soft tissue thickness (STT), both central (cSTT) and peripheral (pSTT).
Transitional Zone (TZ) length at the mesial, distal, buccal, and lingual aspects.
To evaluate the health of peri-implant soft tissue, the following clinical assessments were performed:
IPPP (Implant Paper Point Probe)
Bleeding on Probing (BOP)
Visual Assessment for redness and swelling
Results
1. Panoramic Analysis
Panoramic radiographs revealed stable crestal bone levels with minimal changes, with mean pPD change observed to be less than 0.1 mm over an average follow-up period of 3.3 years.
2. CBCT Analysis
o The average central placement depth (cPD) was 1.4 mm, and the peripheral placement depth (pPD) was 2.7 mm.
o The average central soft tissue thickness (cSTT) was 0.3 mm, and the peripheral soft tissue thickness (pSTT) was 0.6 mm.
o The average Transitional Zone (TZ) length was 4.3 mm.
3. Clinical Observations
o Depth of Probing: Probing depths were consistently less than 1 mm in all cases, demonstrating minimal pocket formation and stable peri-implant conditions.
o Bleeding on Probing (BOP): No bleeding was observed in any case, suggesting an absence of inflammation around the implants.
o Visual Signs of Inflammation: No swelling, redness, or other visual indicators of inflammation were detected, reflecting healthy peri-implant soft tissue in all cases.
Conclusions
The findings of this study demonstrated that subcrestally placed implants (SPI) with an internal platform switching (IPS) design, utilizing the matching abutment technique, provide stable outcomes, particularly in terms of crestal bone levels and peri-implant soft tissue dimensions. This stability is likely attributed to the biological and structural integrity at the soft tissue-implant restoration interface (Transitional Zone). The study investigated the three-dimensional topography of peri-implant soft tissue, emphasizing its relationship with implant restoration, crestal bone changes, and clinical outcomes. Further histological research is necessary to validate the unique characteristics and mechanical properties of these zones, offering deeper insights into their contribution to long-term implant success and enhanced esthetics.
Keywords:
peri-implant soft tissue
; transitional zone
; subcrestally placed implants
; implant biologic width
Introduction
Subcrestally placing implants (SPI) has emerged as a versatile technique designed to address specific clinical scenarios. Although its adoption has grown significantly, key concerns persist, primarily due to the lack of a clear and consistent model explaining the biologic width around implants in a three-dimensional context. This is particularly evident in efforts to differentiate between pathological pockets, typically associated with periodontal disease, and the longer peri-implant soft tissue interface with the implant restoration. Despite these challenges, SPI continues to gain traction, reflecting clinicians’ commitment to achieving biologically stable and aesthetically favorable outcomes. (1,2,3,4)
Clinical Scenarios for SPI
The SPI technique is particularly advantageous in three primary scenarios:
- Esthetic Requirements in Molar Restorations
SPI is often employed to meet esthetic demands, particularly in molar restorations where establishing an appropriate emergence profile is essential. This technique enables seamless integration of prosthetic components with the surrounding soft tissue, enhancing both functionality and esthetics by ensuring an adequate vertical soft tissue height for the transit area (transitional zone).
- 2.
- Managing Narrow Alveolar Ridges
In cases of narrow ridges, SPI provides an effective solution for implant placement while promoting a favorable peri-implant phenotype. This ensures sufficient bone and soft tissue support, essential for long-term implant stability and health.
- 3.
- Implant Placement Adjacent to Natural Teeth
SPI is particularly useful in anterior or premolar regions adjacent to healthy natural teeth, especially in the upper arch. These regions often present challenges due to variations in edentulous ridge levels between buccolingual and mesiodistal interproximal spans. SPI accommodates these anatomic differences, preserving the functionality and appearance of neighboring teeth.
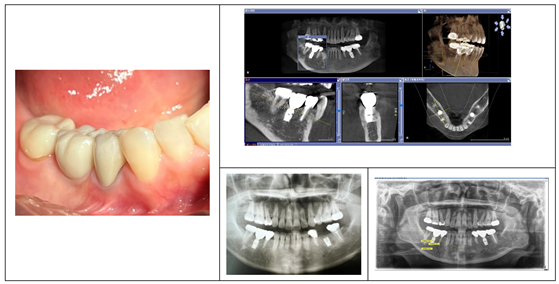
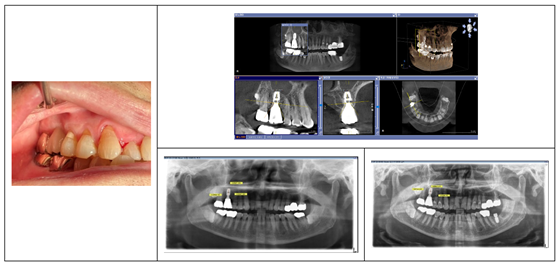
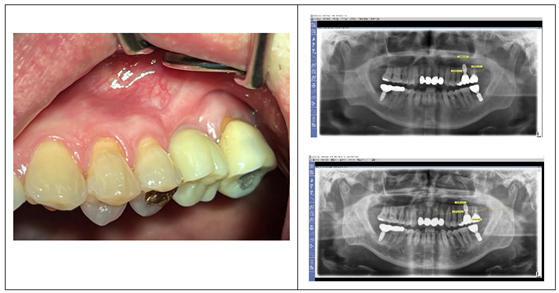
Figure 1 showcases a successful case of SPI, demonstrating stable and esthetic outcomes. The clinical photos highlight natural soft tissue integration, while the CBCT images provide peri-implant soft tissue analysis, including measurements of the length and thickness of the peri-implant soft tissue located between the implant restoration and the underlying crestal bone, to explore the relationship between the structural and biological stability achieved with SPI.
Concerns About Pocket Formation in SPIs
One prominent concern with SPI is the risk of pocket formation around deeply placed implants, potentially compromising peri-implant health (5,6,7). These concerns stem from the lack of a biologic width model specifically tailored to implants. Instead, the conventional biologic width concept, originally developed for natural teeth, has been broadly applied to implants without significant adaptations, leading to misunderstandings and misinterpretations.
Biologic Width in Natural Teeth
The biologic width, first described in 1961, (8) refers to the gingival soft tissue extending from the gingival sulcus to the alveolar crest, averaging approximately 2 mm in width. This structure comprises two components:
Junctional Epithelium (~0.97 mm wide): Provides a protective epithelial barrier.
Connective Tissue (~1.07 mm wide): Offers mechanical support and immunologic defense. (9)
Together, these structures protect the underlying tissues from external stimuli and play a critical role in maintaining periodontal health. (10)
Differences in Peri-Implant Biologic Width
While the biologic width concept has been adapted for implants, key structural differences between peri-implant tissues and natural teeth underscore the need for a dedicated model: (11)
- 1.
- Absence of Periodontal Ligament
Unlike natural teeth, which rely on a periodontal ligament for attachment and both biological and mechanical mediation, implants achieve stability through direct osseointegration. This lack of a ligament makes implants more vulnerable to mechanical and microbial challenges.
- 2.
- Lack of Dentogingival Fibers
Natural teeth benefit from dentogingival fibers that anchor the gingiva to the cementum, contributing to soft tissue stability and resistance to external forces. In contrast, implants lack this intrinsic attachment, relying entirely on their own structural and immunological integrity of peri-implant soft tissues for sealing and protection by themselves.
- 3.
- Distinct Crown-Root Morphology and Coronal Flaring
Natural teeth exhibit a gradual transition from the root to the crown, facilitating smooth adaptation of the soft tissue. Conversely, implant restorations display a distinct coronal flaring, where the crown abruptly widens, posing unique challenges for peri-implant tissue adaptation and stability.
The morphology of implant restorations is directly influenced by the peri-implant soft tissue due to their close interface. Unlike natural teeth, implant restorations must account for the unique emerging phenomenon. Consequently, numerous studies have explored methods to achieve a natural emergence profile for implant restorations, examining the relationship between the stability of the peri-implant soft tissue (commonly referred to as the biologic width), crestal bone health, implant positioning, and restoration morphology. (12,13,14,15)
Implications of Coronal Flaring
SPIs are almost exclusively performed using implants with an Internal Platform Switching (IPS) design, widely recognized for their numerous advantages in promoting biological stability. SPI with IPS is inherently associated with coronal flaring of implant restorations, a feature that facilitates both soft tissue adaptation and esthetic integration. (16,17,18)
The coronal flaring feature of implants introduces unique peri-implant soft tissue configurations, distinctly differing from the architecture observed around natural teeth. Unlike the continuous dentogingival interface of natural teeth, implants require the adaptation of peri-implant soft tissues to abrupt changes in diameter. This adaptation leads to the development of a specialized peri-implant soft tissue architecture at this transit area which is generally horizontal components.
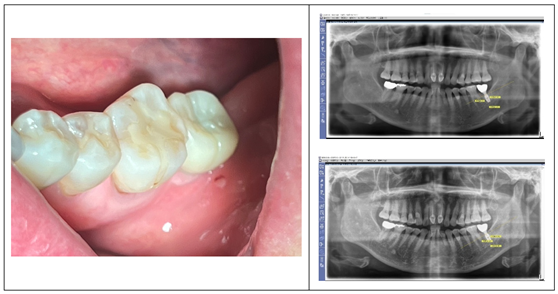
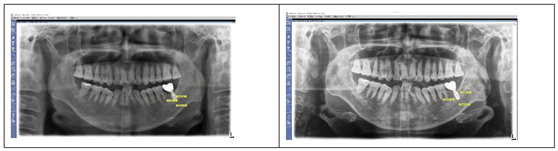
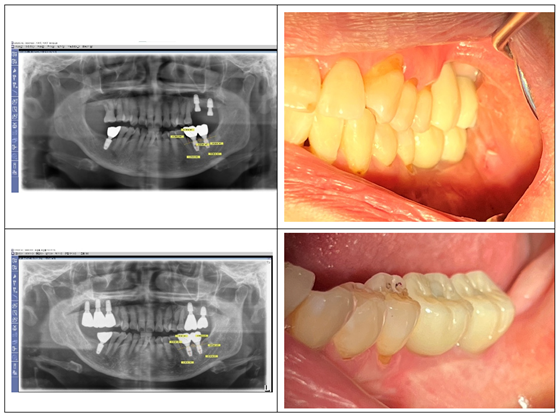
The images of Figure 2 on the left display cases with old external hex connection implants, where healing abutments are positioned without horizontal widening at the tissue-restoration interface. In these instances, the peri-implant soft tissue closely mimics the biologic width observed in natural teeth, with tissue thickness reflecting the adjacent surface mucosal tissue. Conversely, the images on the right illustrate SPI cases with internal connection implants featuring platform-switching designs. These cases highlight the impact of coronal flaring, where horizontal extension at the restoration interface modifies the peri-implant soft tissue structure, creating distinct horizontal and vertical components at the junction between the restoration and crestal bone. This dimensional adaptation is a defining characteristic of peri-implant tissues shaped by coronal flaring.
The Need for a Multidimensional Analysis Framework
Traditional two-dimensional analyses, which have long been the standard for studying peri-implant tissues, fail to account for the multidirectional complexity of soft tissue and bone around implants. For instance, the biologic width in natural teeth is typically represented as a single vertical dimension. However, due to the unique morphology of implants, including coronal flaring, a multidirectional framework is essential to accurately interpret peri-implant structures.
Although there is a report investigating the two-dimensional size of peri-implant soft tissue using CBCT, the study was limited to the anterior region, where esthetic concerns are typically prioritized. However, esthetic considerations should also extend to the posterior region. CBCT serves as a valuable tool for analyzing both peri-implant soft tissue and bone structures. Therefore, it is essential to establish clinically and theoretically meaningful parameters for measurement to enhance our understanding and improve outcomes in both regions.
Advancements in Implant Technology and Soft Tissue Analysis
Contemporary dentistry has embraced advanced technologies such as Computer-Aided Design (CAD), Computer-Aided Manufacturing (CAM), and digital scanning to achieve natural crown contours and esthetic outcomes. These tools enable precise planning and fabrication, ensuring that prostheses harmonize with the surrounding soft tissue and underlying bone. (19,20)
To complement these technological advancements, this study introduces a novel investigative framework: 3-Dimensional Soft Tissue Analysis (3DSTA). This approach provides a comprehensive understanding of peri-implant tissue dynamics, emphasizing the critical interplay between horizontal and vertical dimensions. By analyzing the peri-implant soft tissue in 3-dimensional way, 3DSTA offers valuable insights into the structural and biological requirements for achieving long-term stability and esthetic excellence in SPIs.
Materials and Methods
Study Design
This study evaluates the structural and biological characteristics of Subcrestally Placed Implants (SPIs) using a combination of radiographic and clinical assessments. The objective is to analyze the relationship between parameters derived from three-dimensional analyses via CBCT and their corresponding clinical outcomes.
Study Population
Twenty-four single molar implant cases using the SPI technique were selected randomly from a pool of 200 cases treated with the same approach. All cases had Cone Beam Computed Tomography (CBCT) X-ray records taken at least one year after the initial surgery. These procedures were performed at Dr. Won’s private dental clinic in Seoul, South Korea, between 2012 and 2022.
Inclusion Criteria
- Patients with a single missing posterior molar.
- Neighboring natural teeth presented with periodontal stability and no signs of inflammation.
- Implant fixtures were placed subcrestally, fully embedded buccolingually and mesiodistally.
-
Implant System:
- ○
- In 18 cases, 5 x 8 mm Well Lock implants (manufactured by Withwell Company, Seoul, South Korea) with Bicon-type modifications to allow screwing of healing abutments were used.
- ○
- n two cases, Bicon implants (Bicon LLC, Boston, MA, USA) were utilized.
- Healing abutments of the same diameter and profile as final ready-made abutments were connected to the fixture during the initial surgery to avoid bone reduction at the time of abutment connection. Flaps were closed primarily without wound dehiscence.
- Transmucosal connection procedures were performed three months post-surgery, during which longer healing abutments with the same profile as the final ready-made abutments were connected.
- Final prostheses were fabricated as single crowns designed to match the natural size of neighboring teeth and were cemented using the Extraoral Cementation (EOC) technique.
- Patients with contraindications to oral surgical procedures were excluded from the study.
Implant and Prosthesis Details
- Study Sample: 20 cases of single molar SPIs.
- Implant System: Implants with Internal Platform Switching (IPS) designs were selected to ensure biologically and aesthetically favorable outcomes.
- Crown Material: Predominantly zirconia crowns, with some cases involving Porcelain-Fused-to-Metal (PFM) restorations.
- Follow-up Period: Mean duration of 3.4 years.
Clinical Procedure
Initial Surgery
(Well Lock Implant Cases)
A periosteal flap was reflected, and drilling commenced with a 2.0 mm drill at 750 rpm under saline irrigation. Sequential drilling (2.5–5.0 mm) was then performed at 50 rpm without irrigation. After the final 5.0 mm drill, a 5 x 8 mm implant fixture was connected to a 5 mm diameter and 2.5 mm height healing abutment and passively placed subcrestally to protect the subcrestal bone. The periosteal flap was sutured with 4-0 Monocryl sutures (Ethicon) for primary closure, avoiding the need for further bone reduction during subsequent prosthetic procedures. (Figure 3)
(Bicon Implant Cases)
In two cases, a plastic plug provided by the manufacturer was used to seal the fixture connection hole during the initial surgery. During the second surgery, any excessive bone obstructing the full seating of the healing abutment was carefully removed. All other procedures followed the same protocol as the Well Lock implant cases.
Second Surgery and Prosthodontic Procedure:
Three months post-surgery, longer healing abutments identical in profile to the initially embedded ones were connected. Final crowns were fabricated using an impression coping technique and ready-made abutments (5 mm diameter, 2.5 mm gingival cuff) matching the healing abutments. Clinical crowns were shaped with a gradual emergence angle extending from the abutment margin to the level corresponding to the cervical area of neighboring natural teeth buccolingually and toward the apical part of the contact area of the neighboring teeth mesiodistally, ensuring a natural appearance.
Given an approximate mesiodistal length and buccolingual breadth of 11 mm for the molar crown, each horizontal extension from the periphery of the 5 mm abutment will measure around 3 mm buccally, lingually, mesially, and distally. With an average supracrestal soft tissue height of 3 mm, the horizontal extension components of the implant restoration will extend 3 mm both vertically and horizontally. In this extension area, the shape of the implant restoration follows the contour of the underlying crestal bone at an angle of 30 to 60 degrees, except in regions with steeper crestal bone. X-ray imaging was utilized to ensure proper alignment and avoid bony impingement. (21)
The Extraoral Cementation (EOC) technique was employed. Cement was applied and excess was removed extraorally. The crown-abutment complex (CAC) was thoroughly cleaned before seating into the fixture.
This approach minimized cement remnants, ensured proper prosthesis seating, and supported long-term biological stability.
Figure 4 serves as an illustrative example of the procedural sequence in SPI. It demonstrates the transition from initial healing abutments placed with primary flap closure to the connection of longer abutments during the second stage, ensuring continuity in submucosal profile and supporting soft tissue stabilization for the final restoration.
Imaging Techniques and Calibration
Radiographic assessments were conducted using the following:
- Panoramic X-rays: Utilized for evaluating long-term crestal bone stability and measuring peripheral placement depth (pPD).
- Cone Beam Computed Tomography (CBCT): Used for a detailed three-dimensional analysis of bone and soft tissue characteristics.
Calibration Protocol:
CBCT images were aligned along the long axis of the implant fixture. Measurements were calibrated by confirming the known dimensions of the fixture (length and diameter) against the radiographic images.
Radiographic Parameters and Measurements
- 1.
-
Crest to Restoration Gap (CRG):
- ○
- Definition: The vertical distance between the crestal bone and the crown-abutment complex.
- ○
-
Measurement Sites:
- ▪
- Central CRG (cCRG): Measured at the implant fixture’s outer diameter.
- ▪
- Peripheral CRG (pCRG): Measured at the most coronal aspect of the mesial, distal, buccal, and lingual crestal bone. (Figure 5)
- 2.
-
Soft Tissue Thickness (STT): (which is identical to CRG within critical range)
- ○
- Central STT (cSTT): Measured the same way as cCRG, using the outer diameter of the implant fixture as the reference point.
- ○
- Peripheral STT (pSTT): Measured the same was as pCRG, at the most coronal aspects of the crestal bone at mesial, distal, buccal, and lingual points. (Figure 5)
- 3.
-
Placement Depth (PD):
- ○
- Central Placement Depth (cPD): The perpendicular distance from the implant platform to the most coronal point of the crestal bone at the fixture’s diameter.
- ○
- Peripheral Placement Depth (pPD): The distance measured at the crown’s periphery along buccal, lingual, mesial, and distal directions. (Figure 6)
- 4.
-
Transitional Zone Length (TZL) (Radiographic TZL):
- ○
- Definition: The distance from the implant-abutment junction to the point where peri-implant soft tissue maintains a thickness ≥1.0 mm.
- ○
- Measurement Sites: Mesial, distal, buccal, and lingual.
- ○
-
Reference for TZL Measurements:
- ▪
- Mesiodistally: Measured at the most coronal point of the crestal bone shared between the implant and adjacent structures. If the crestal bone has a curvature with a zenith, the zenith was used; otherwise, the midpoint was chosen.
- ▪
- Buccolingually: Measured from the most coronal point of the crestal bone in continuous interface with the implant restoration. (Figure 7)
Note: TZL measurements are radiographic and represent inferred dimensions, as actual soft tissue extensions beyond the crestal bone’s most peripheral point are not visible, except for palatal soft tissue in select cases.
- 5.
-
Peripheral Placement Depth (pPD) from Panoramic X-ray:
- ○
- Definition: The perpendicular distance from the zenith of the crestal bone to the connection between the abutment and fixture as observed on a panoramic X-ray, using the vertical reference line of the implant fixture.
- ○
- Measurement Sites: Mesial and distal.
- ○
- Purpose: To evaluate changes in the crestal bone over the observation period. (Figure 8)
Clinical Assessments
The health of peri-implant soft tissue was evaluated using the following parameters:
Implant Paper Point Probing (IPPP):
A method to measure probing depths using IPPP, a tool developed by Suredent in South Korea. The IPPP has a yield strength of 0.25–0.35 N, ensuring consistent and gentle probing to avoid tissue damage.
Bleeding on Probing (BOP):
Used as an indicator of inflammation, assessing the presence of bleeding upon probing around the peri-implant tissue.
Visual Assessment:
Inspections for redness, swelling, or other visible signs of inflammation to evaluate the peri-implant tissue’s overall health.
Key Concepts: CRG, STT, and TZ
- 1.
-
Crest to Restoration Gap (CRG):
- ○
- CRG refers to the vertical distance from the crestal bone to the implant restoration. Initially, CRG encompasses both the peri-implant soft tissue (STT) and voids. However, when CRG is within a critical range (e.g., ≤1.0 mm), it likely represents STT exclusively, indicating clinical stability and the absence of voids or inflammation.
- 2.
-
Soft Tissue Thickness (STT):
- ○
- STT represents the vertical thickness of peri-implant soft tissue from the crest to the fixture-abutment connection. In stable cases, where CRG is within the critical range, STT is inferred to equal CRG. When CRG exceeds this range, the excess often signifies instability or voids.
- 3.
-
Transitional Zone (TZ):
- ○
-
The TZ refers to the three-dimensional peri-implant soft tissue between the restoration and the crestal bone, consisting of:
- ▪
- Vertical Component: STT.
- ▪
- Horizontal Component: Transitional Zone Length (TZL).
- ○
-
Subdivisions of TZ:
- ▪
- Transitional Zone Proper (TZ): The coronal portion, composed of elastic connective tissue.
- ▪
- Subcrestal Zone (SZ): The apical portion near the crestal bone, composed of inelastic, periosteum-like connective tissue.
Together, the TZ and SZ form the Self-Sustained Soft Tissue (SSST), which maintains structural integrity without epithelial coverage under stable conditions.
Imaging Procedures
Measurements were performed using Sirona Dental Systems:
- Devices: XIOX Plus ORTHOPHOS XG 3D.
- Software: SIDEXIS and GALILEOS Implant Viewer (v1.9.5605.25519 ID7).
Calibration: CBCT images were centered around the long axis of the implant fixture. Known fixture dimensions were used for calibration.
Results
Table 1 provides a summary of the implant cases, detailing the tooth location, implant brand, fixture size, and abutment size. It serves to categorize the key specifications of the implants used in this study, offering a comprehensive overview of the case distribution and implant characteristics.
Table 2 presents the measured values of Central Placement Depth (cPD) and Peripheral Placement Depth (pPD) across mesial, distal, buccal, and lingual aspects. The data highlights the differences in placement depths at the central and peripheral regions of the implants, providing insights into the vertical positioning of fixtures relative to the crestal bone and surrounding tissue architecture.
Table 3 presents the results of central Soft Tissue Thickness (cSTT) and peripheral Soft Tissue Thickness (pSTT) measured at mesial (M), distal (D), buccal (B), and lingual (L) sites for each case. These values reflect the thickness of peri-implant soft tissue at central and peripheral regions, providing insights into tissue adaptation and stability around the implants. The averages for cSTT and pSTT across all sites are also included to highlight general trends.
Table 4 presents the measurements of Transitional Zone Length (TZL) and reference TZL (rTZL) across mesial (M), distal (D), buccal (B), and lingual (L) sites for each case. TZL indicates the distance from the implant-abutment connection to the point where the peri-implant soft tissue maintains a critical thickness, providing a key parameter for understanding the dimensions of the peri-implant transitional zone. rTZL represents the width of the reference point from which the TZL is measured, offering a baseline for comparison. The averages of TZL and rTZL for all sites are included to illustrate overall patterns.
Table 5 and Figure 9 summarize the results of Placement Depth (PD), Soft Tissue Thickness (STT), and Transitional Zone Length (TZL). The average central PD (cPD) was 1.4 mm, and the peripheral PD (pPD) was 2.6 mm, reflecting the subcrestal placement of implants (SPI). The average central STT (cSTT) was 0.3 mm, and the peripheral STT (pSTT) was 0.6 mm, suggesting that the peri-implant soft tissue thickness (CRG) is thinner than conventional expectations. The average TZL was 3.4 mm, measured at a reference point where the average STT was 0.8 mm, indicating an extended transitional zone adapted to the SPI design.
The stability of the crestal bone level as measured by Peripheral Placement Depth (pPD) over an average follow-up period of 3.4 years is summarized at Table 6. Both mesial and distal sites showed minimal change (0.1 mm), indicating long-term stability of the crestal bone. These results reflect successful peri-implant health management and the effectiveness of the SPI technique in maintaining stable bone levels. (Table 6)
Results from clinical observations
Depth of Probing: Probing depths were consistently less than 1 mm in all cases, indicating minimal pocket formation and stable peri-implant conditions.
Bleeding on Probing (BOP): No bleeding was observed in any case, suggesting the absence of inflammation around the implants.
Visual Signs of Inflammation: No swelling, redness, or other visual indicators of inflammation were detected, reflecting healthy peri-implant soft tissue in all cases.
DISCUSSION
The Goals of Implantology: Stability and Aesthetics
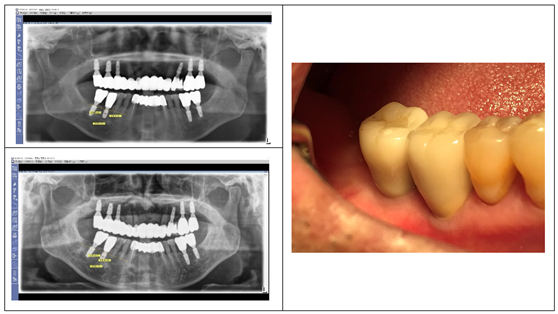
Dental implants aim to restore missing teeth with biological stability and natural esthetics. (22,23) These dual objectives are closely linked to the depth of implant placement, which significantly influences the configuration of the soft tissue, comprising connective tissue and junctional epithelium. Achieving long-term bone stability has driven the evolution of implant designs, particularly those addressing the biologic width. Innovations such as internal connection with platform switching (IPS) have improved soft tissue conditions by enhancing bacterial seals, reducing stress on the crestal bone, and encouraging biologically favorable outcomes. Studies by Linkevicius and Vervaeke have shown that subcrestal placement enhances soft tissue thickness and supports bone remodeling by re-establishing biologic width. From an esthetic perspective, subcrestal implant placement is essential for creating a gradual emergence profile, particularly for molar restorations. (25,26) A natural appearance requires a coronal flaring of the implant restoration that mimics the cervical contour of adjacent teeth. Natalia Palacios-Garzón reported that subcrestal placement can enhance peri-implant soft tissue stability without negatively impacting bone loss, particularly in cases with thin tissue. (27) Figure 10 illustrates the long-term stability of subcrestally placed implants with IPS design. (18,24) The panoramic X-ray, taken in 2023, demonstrates the preserved bone levels and healthy soft tissue conditions around the lower first molar implants placed in 2012, underscoring the effectiveness of subcrestal placement in achieving biologic stability over a decade.
The Role of Coronal Flaring and the Transitional Zone (TZ)
Although achieving natural aesthetics in molar implant restorations may not currently be a primary focus in dentistry, this study highlights its significance. Subcrestally Placed Implants (SPI) facilitate more natural-looking results through coronal flaring, enabled by deep placement. (Figure 11)
The conventional concept of biologic width, primarily based on natural teeth, does not fully account for the peri-implant soft tissue’s unique horizontal and vertical adaptations. While natural teeth and tissue-level implants primarily exhibit vertical biologic widths, implants with Internal Platform Switching (IPS) designs introduce a horizontal component due to coronal flaring (or emergence profile). This horizontal area, formed by coronal flaring, creates a distinct Transitional Zone (TZ) extending from the implant-abutment connection to the final crown’s cervical margin.
When the most prominent cervical area of the implant restoration aligns in size with the neighboring natural teeth, the restoration achieves a natural appearance. For the cervical area to flare seamlessly from the implant-abutment connection and emerge at the intended size above the peri-implant soft tissue, the depth of implant placement must be predetermined. (Table 7) The required vertical space depends on the intended emergence angle and the horizontal difference between the crown and connection diameters. Table 7 illustrates the calculated vertical distance from the implant-abutment connection to the most prominent cervical area of the implant crown. For instance, at a 30° angle with a 3.5 mm horizontal difference, a vertical distance of 6.1 mm is necessary.
In molar restorations, the depth of implant placement determines the emergence angle and horizontal dimensions. Large emergence angles (e.g., >30°) may compromise biologic stability by inducing soft tissue stress. However, SPI provides sufficient vertical space for gradual tissue adaptation. Subcrestal placement ensures this space, effectively balancing biological stability and esthetic outcomes.
The longer transit area can be categorized into two distinct zones: the Transitional Zone (TZ) and the Subcrestal Zone (SZ). These zones, named based on their anatomical location, describe the peri-implant soft tissue positioned between the implant restoration and the underlying crestal bone. The TZ represents the coronal portion of this soft tissue, adjacent to the implant-abutment interface, characterized by its elastic connective tissue properties. The SZ, located apically closer to the crestal bone, consists predominantly of inelastic connective tissue with periosteum-like characteristics. Both zones are critical for maintaining biological stability, ensuring an effective seal against microbial invasion, and minimizing the risk of pocket formation by their self-sustainable integrity without being covered by sulcular epithelium. By introducing the notions of TZ and SZ, this conceptual framework, based on radiographic observations but requiring validation through histological examination, offers a novel and multidimensional perspective on peri-implant soft tissue dynamics, enhancing the understanding of how implants interact with surrounding tissues to achieve functional and esthetic success.
Significance and Prevalence of Subcrestal Placement (SPI):
Subcrestal implant placement (SPI) is not merely an additional technique for achieving esthetic and biological benefits but is also a widely practiced approach in implantology. In many clinical situations, SPI becomes inevitable due to anatomical and structural constraints. Historically, SPIs have been performed, sometimes unknowingly, when adapting to the natural contours of the crestal bone or when addressing specific clinical challenges.
Clinical Scenarios Necessitating SPI:
- Esthetic Considerations:
To accommodate the emerging phenomenon of IPS (Internal Platform Switching) designs, ensuring a natural crown profile. To create a gradual transition zone beneath the restoration, particularly critical in molar regions.
- 2.
- Anatomical Limitations:
For narrow crestal ridges, SPI provides adequate bone thickness (≥2 mm) around the fixture, enhancing stability and soft tissue health. To strengthen soft tissue by increasing blood supply to peri-implant tissues.
- 3.
- Adjacent Natural Teeth:
When implants are placed near healthy natural teeth, especially in the upper premolar and anterior regions, subcrestal placement ensures harmonious integration with the neighboring structures.
Unique Characteristics of Subcrestal Placement (SPI)
Subcrestal implant placement (SPI) offers significant advantages for achieving both stability and esthetics by positioning fixtures deeper into the bone. (28,29,30,31,32,33,34) This technique creates a broader peri-implant contact area beneath the restoration, challenging the misconception that such zones resemble harmful periodontal pockets. Instead, this area represents a specialized tissue zone distinct from periodontal structures. This study introduces the concepts of the transitional zone (TZ) and subcrestal zone (SZ) as integral components of peri-implant soft tissue architecture, highlighting the need for a novel model beyond the conventional biologic width used for natural teeth.
Defining Peri-Implant Soft Tissue Zones
This study introduces a novel framework for categorizing peri-implant soft tissue zones to address the unique biological and structural demands of subcrestally placed implants (SPI). These zones, collectively referred to as the Crestal Restoration Soft Tissue (CRST), emphasize the need for a detailed understanding beyond the conventional biologic width model applied to natural teeth.
- A.
- Crestal Restoration Soft Tissue (CRST)
CRST represents the peri-implant soft tissue situated between the crestal bone and the implant restoration, encompassing both vertical and horizontal components critical for biological stability and esthetic outcomes. Two key parameters define CRST:
- 1.
-
Crest to Restoration Gap (CRG):
- ○
- Definition: The vertical distance from the crestal bone to the implant restoration.
- ○
- Components: Initially includes both voids and soft tissue. CRG transitions into the Soft Tissue Thickness (STT) when optimized within a critical range.
- ○
- Measurement: Directly visible on CBCT, CRG serves as a foundational metric for understanding peri-implant tissue stability.
- 2.
-
Crest Restoration Length (CRL):
- ○
- Definition: The horizontal dimension of the Crestal Restoration Soft Tissue (CRST), measured from the junction (or connection) between the abutment and fixture to the lateral edge of the implant restoration.
- ○
- Components: Complements CRG by accounting for the lateral extent of soft tissue.
- ○
- Measurement: CRL is measured or inferred using radiographic methods. It serves as a reference for evaluating horizontal adaptations of the peri-implant soft tissue, particularly for calculating the Transitional Zone Length (TZL). Since TZL is ideally measured histologically, CRL provides a radiographic approximation, facilitating practical assessment in clinical settings.
- B.
- Self-Sustained Soft Tissue (SSST)
Optimized CRST forms the Self-Sustained Soft Tissue (SSST), divided into two distinct functional zones:
- 1.
-
Transitional Zone (TZ):
- ○
- Location: Positioned coronally within the SSST.
- ○
- Structure: Composed of elastic connective tissue, the TZ accommodates mechanical forces and forms a biological seal.
- ○
-
Measurements:
- ▪
- Vertical: Represented by the STT.
- ▪
- Horizontal: Represented by the Transitional Zone Length (TZL)
- ▪

- 2.
-
Subcrestal Zone (SZ):
- ○
- Location: Positioned apically, adjacent to the subcrestal bone.
- ○
- Structure: Composed of inelastic connective tissue with periosteum-like characteristics, providing both mechanical resistance and immunological defense.
- ○
-
Unique Identity:
- Location-Dependent Formation: The SZ forms specifically next to the subcrestal bone, distinguishing it as a distinct component of SSST.
- Consistent Thickness: A hallmark of the SZ is its near-uniform thickness, which is influenced by the use of matching abutment techniques or when tissue-level implants are placed subcrestally.
- Conditional Formation: The SZ may not develop in certain SPI cases where the matching abutment technique is not utilized with IPS or where tissue-level implants are not placed subcrestally.
- ○
-
Measurements:
- ▪
- Vertical: Represented by the STT, indicating the connective tissue’s thickness adjacent to the bone.
- ▪
- Horizontal: Represented by the Subcrestal Zone Length (SZL), which is directly measurable via CBCT, providing insights into the horizontal extension of this zone.
Parameters and Measurements
The following parameters and their relationships underscore the structural and biological roles of peri-implant soft tissue zones:
- CRG (Crest to Restoration Gap): The initial vertical measurement of the gap between the crestal bone and the implant restoration. CRG consists of both void and soft tissue (STT) when the thickness exceeds the optimal range. As the soft tissue adapts and reaches an optimized state, CRG transitions into STT, ensuring long-term biological stability and functional integration.
- STT (Soft Tissue Thickness): Represents the optimized vertical thickness of the peri-implant soft tissue, forming the foundation of the Transitional Zone (TZ) and Subcrestal Zone (SZ).
- TZ (Transitional Zone): A histological concept inferred clinically based on probing depths not exceeding 1 mm, which represents the junctional epithelium’s starting point.
-
TZL (Transitional Zone Length): The horizontal extension of the TZ, a histological concept, is estimated radiographically through a combined approach:
- From CRL (Crestal Restoration Length): CRL defines the lateral dimension of the peri-implant soft tissue between the abutment-fixture junction and the implant restoration edge, providing a key reference for TZL.
- From Optimized STT Values: These are derived statistically, such as the 0.6 mm average calculated from this study’s 20 cases or an arbitrarily set critical value like 1.0 mm, representing the assumed optimized soft tissue thickness.
Since direct histological measurement of TZL is not feasible in clinical practice, it is inferred by combining these radiographic observations and statistical approximations. This clinically assumed approach provides a practical framework for evaluating the peri-implant soft tissue’s three-dimensional adaptations.
- CRL: Complements vertical measurements by defining the horizontal dimension of CRST. CRL serves as a key reference for estimating TZL radiographically, given that direct histological measurements of TZL are not feasible in clinical practice.
The schematic model illustrated in Figure 12 offers a conceptual framework for understanding the submucosal soft tissue zones in SPI. By categorizing the peri-implant soft tissue into three distinct zones—the sulcular area, transitional zone (TZ), and subcrestal zone (SZ)—this model underscores the structural and functional differentiation within the peri-implant soft tissue. The sulcular area, composed primarily of sulcular epithelium, transitions into the TZ, which integrates junctional epithelium and elastic connective tissue. This is followed by the SZ, predominantly composed of inelastic connective tissue resembling periosteum, directly in contact with the crestal bone.
This differentiation highlights the unique adaptations of the peri-implant soft tissue architecture in SPI, providing a biologically stable seal while accommodating the structural demands of subcrestally placed implants. By visually summarizing these key components, Figure 12 serves as a valuable tool for understanding the dynamic interplay between soft tissue zones and their implications for implant stability and esthetics.
Functional Implications
The proposed framework highlights the distinct three-dimensional architecture of CRST, diverging from the linear vertical structure of biologic width in natural teeth.
- Coronal Flaring and Esthetics: The horizontal (CRL) and vertical (CRG/STT) components of CRST accommodate the coronal flaring of implant restorations, creating a gradual and natural emergence profile.
- Biological Stability: TZ and SZ collectively form an active biological interface that resists inflammatory changes, ensuring both functional stability and esthetic harmony.
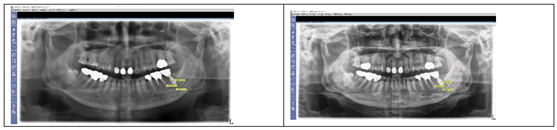
Figure 13 highlights a critical observation in peri-implant analysis: while the plain X-ray suggests a subcrestal placement of the implant, the CBCT image reveals an epi-crestal positioning in the buccolingual aspect. This discrepancy underscores the importance of three-dimensional imaging in accurately evaluating the spatial relationship between the implant fixture and surrounding anatomical structures, particularly in cases where conventional radiographic methods may lead to misinterpretations.
Need for 3-Dimensional Analysis for Peri-Implant Soft Tissue
- 1)
- Structural Complexity of Implants vs. Natural Teeth
While plain X-rays suffice for studying the structural health of natural teeth, implants require a more detailed, three-dimensional analysis. Standard panoramic or oral X-rays provide only mesiodistal information, which is insufficient for assessing the buccolingual aspects of implant placement. For example, an implant that appears subcrestally placed on a plain X-ray may actually be epi-crestally positioned when evaluated buccolingually using CBCT. This study leveraged CBCT imaging to analyze the mesiodistal, buccal, and lingual relationships between the implant complex (fixtures, abutments, crowns) and surrounding biological tissues, ensuring a comprehensive assessment.
- 2)
- Differences in Soft Tissue Architecture
The soft tissue architecture surrounding natural teeth and implants differs fundamentally. Traditional biologic width models, developed based on natural teeth, fail to capture the unique configurations of peri-implant tissues, particularly in subcrestal placements. A three-dimensional framework is essential to redefine and study these structural variations effectively.
- 3)
- Impact of Coronal Flaring
Implant restorations with coronal flaring create a different interface between the prosthesis and surrounding tissues compared to natural teeth. This structural divergence necessitates three-dimensional analysis, as it influences both the emergence profile and soft tissue adaptation. The need for such analysis is directly tied to the limitations of plain X-rays (Reason 1) and the inadequacies of traditional biologic width models (Reason 2).
Three-dimensional imaging and analysis are therefore crucial for understanding and optimizing the biological and structural dynamics of peri-implant soft tissue, particularly in cases involving subcrestal implant placement.
SPI: A Necessity for Biological and Esthetic Excellence Despite Concerns About Long Soft Tissue
SPIs (Subcrestally Placed Implants) with IPS (Internal connection with Platform Switching design) are widely recognized for enhancing bone stability by strengthening soft tissue. (28) Despite concerns about the extended peri-implant soft tissue beneath prostheses, often perceived as resembling pathological pockets, this study demonstrates that these zones, particularly the Transitional Zone (TZ), function as specialized and biologically stable structures.
Clinical evidence from this study demonstrated minimal to no bone changes over years of follow-up, underscoring the biological stability achievable with SPI. While early crestal bone loss is often attributed to biologic width accommodation, this study suggests that SPI creates a favorable environment that not only minimizes this accommodation but also resists microbial infection, thereby reducing the risk of peri-implant diseases such as mucositis and peri-implantitis.
Palacios et al. reported that both crestal and subcrestal implant placements achieved high survival rates and comparable bone loss. However, subcrestal placement was preferred due to its potential to reduce the likelihood of future implant exposure, thereby lowering the risk of peri-implant pathologies. (35,36)
Beyond biological benefits, SPI provides esthetic advantages by facilitating a natural emergence profile. These results reaffirm SPI’s dual role as a biologically and esthetically superior approach, addressing common concerns while delivering long-term success.
There are numerous reports demonstrating that an insufficient volume of peri-implant soft tissue—resulting from the relationship between the abutment and soft tissue or from shallow implant placement—is associated with crestal bone loss. This is attributed to its reduced ability to perform the protective role comparable to that of the biologic width. (14,25,26,34,37,38,39)
From this study, the average Transitional Zone Length (TZL) was 3.8 mm, with an average thickness of 0.6 mm, suggesting that the majority of the TZ consists predominantly of connective tissue. (Figure 14) As the TZ extends toward the peripheral area and its thickness increases beyond 1.0–1.5 mm, it may become covered by junctional epithelium. Consistent with findings by Ikiru Atsuta et al., the junctional epithelium typically covers only the entrance area of the submucosal zone, measuring approximately 0.5–1 mm. This highlights the dominant role of the connective tissue zone in TZ.
The enlarged TZ from the results of SPI provides a broader area for blood supply from the alveolar bone, promoting healthier peri-implant soft tissue. This increased vascularization may reduce inflammation and enhance resistance to bone loss. Given the inherent disadvantages of dental implants—lack of connective tissue attachment and reduced blood supply due to the absence of periodontal ligaments—the expanded TZ may compensate by strengthening the biological width and improving peri-implant tissue stability.
In short, SPI reliably achieves both esthetic and biological benefits. However, concerns remain regarding CRST (Crest to Restoration Soft Tissue), the long peri-implant tissue between the implant restoration and the underlying crestal bone, inherent to SPI. This tissue is primarily responsible for maintaining the biological seal. If CRST comprises junctional epithelium coronally and connective tissue apically (SSST, including TZ and SZ) without epithelial downgrowth forming a pocket, these structures must function similarly to the biologic width of natural teeth. Proving this mechanism requires two key investigations:
- 4.
- Dimensional stability of CRST to ensure its long-term integrity.
- 5.
- Sealing ability of the junctional epithelium to prevent microbial invasion.
The first task can be addressed by monitoring the dimensional stability of the CRST components, with a particular focus on CRG (STT) as a critical parameter. In this study, the average central soft tissue thickness (cSTT) was 0.3 mm, and the average peripheral soft tissue thickness (pSTT) was 0.6 mm, both of which remained consistent throughout the observation period, indicating stable peri-implant soft tissue dimensions.
The 2nd task can by carried out by probing.
Probing remains the most practical and reliable tool for evaluating the health of peri-implant and periodontal tissues as well as for demonstrating the sealing capability of the junctional epithelium. Accurate probing helps assess the structural and functional stability of CRST, reinforcing the value of SPI as a comprehensive implant solution.
Probing the Peri-Implant Sulcus
Accurate probing is essential for evaluating the structural and functional stability of peri-implant soft tissues, especially the sealing capacity of the junctional epithelium. Unlike natural teeth, peri-implant sulcus anatomy is curved, and probing is complicated by the lack of standardized normal depths for subcrestally placed implants.
Conventional metal probes often over-penetrate or cause tissue damage, especially in curved sulcus areas. Probing force must be limited; studies recommend a force of ~0.25 N, which allows consistent measurement without compromising tissue integrity.
In this study, probing with Implant Paper Point Probes (IPPP) was used to evaluate the sealing capacity of peri-implant soft tissue:
The IPPP, with a yield strength of 0.25–0.35 N, bent under excessive force, avoiding tissue damage and ensuring accurate penetration. (Figure 15)
The method revealed positive results for SPI cases, demonstrating intact sealing ability and reinforcing the role of resilient connective tissue in peri-implant health.
Practical and Reliable IPPP Utility
The IPPP offers several advantages:
- Controlled Force: Minimizes risk of over-penetration or tissue damage.
- Dual Functionality: Detects sulcus fluid and bleeding on probing (BOP), providing additional diagnostic insights.
- Enhanced Adaptability: Unlike metal probes, it accommodates the curved anatomy of peri-implant sulcus, ensuring reliable measurements.
This approach validated the resilience and stability of peri-implant soft tissue in SPI cases, contributing to their long-term success and minimal bone changes.
Histologic Insights into Peri-Implant Soft Tissue
Connective Tissue and Its Role in Peri-Implant Health
The connective tissue within the peri-implant soft tissue plays a critical role in maintaining biological stability. Its thickness and proximity to the underlying crestal bone, as measured through CRG (which transitions into STT when optimized), are key to its structural and functional integrity. This study demonstrates that maintaining stable CRG/STT dimensions ensures long-term peri-implant health by preventing bone loss and supporting soft tissue adaptation.
Key functional roles of peri-implant connective tissue include:
- -
- Supporting the Junctional Epithelium: Providing a stable foundation and vascular supply for its biological seal.
- -
- Immune Functionality: Facilitating immune responses and acting as a conduit for immune cells and signaling molecules.
- -
- Mechanical Sealing: Resisting external forces through resilience and biochemical properties, including protein-carbohydrate macromolecules.
- -
- Tissue Repair: Serving as a reservoir of stem cells and fibroblasts to promote healing.
- -
- Bone Protection: Acting like periosteum to safeguard the underlying bone and promote homeostasis.
Junctional Epithelium and Its Role in Peri-Implant Soft Tissue Stability
The junctional epithelium plays a pivotal role as the first line of defense against microbial colonization around implants. Although its sealing capability is reported to be less robust than that observed in natural teeth, the presence and function of hemidesmosomal attachments have been well-documented. These attachments form a functional barrier, providing critical adhesion to both the implant surface and the underlying connective tissue. (41,44,45,46,47,48)
Key features of the junctional epithelium include:
- -
- Thickness: It is limited to the coronal portion of the peri-implant soft tissue, typically measuring between 0.5–1 mm. In most peri-implant soft tissues, this layer constitutes only a superficial portion, with connective tissue comprising the majority of the peri-implant soft tissue.
- -
- Cell Turnover Rate: The junctional epithelium exhibits a high turnover rate, facilitating rapid renewal and maintenance of its protective barrier.
- -
- Structural Characteristics: It is composed of 15–30 cell layers with intercellular spaces larger than those found in oral epithelium. These larger spaces, combined with fewer desmosomes, allow greater mobility of immune cells, enhancing its immunological role.
- -
- Hemidesmosomal Attachments: These structures provide adhesion to both the implant surface and the connective tissue, forming the biologic seal. While weaker than the attachment around natural teeth, they are essential in maintaining the integrity of the peri-implant soft tissue. By promoting adhesion and sealing the interface, the junctional epithelium minimizes microbial penetration and inflammation.
- -
- Immunologic function: It involves the endocytosis and decomposition of exogenous factors.
In contrast to natural teeth, implants are classified as “percutaneous devices,” where the soft tissue interface is not as integrated. Unlike natural teeth, where the periodontal ligament and hemidesmosomal attachments provide continuity with the oral mucosa, the peri-implant junctional epithelium functions within a less mechanically integrated environment. This distinction highlights the reliance on connective tissue for additional support.
Optimal CRG/STT Dimensions
The average CRG/STT in this study was measured at 0.6 mm, highlighting its dimensional stability over time. This consistent thickness indicates a healthy and adaptive peri-implant tissue architecture. An excessive gap (>2 mm) between the subcrestal bone and the prosthetic component risks creating a pocket-like environment, whereas maintaining an optimal CRG/STT prevents food infiltration and ensures proper vascular support.
Implications of Implant Surface and Placement
Rough implant surfaces enhance initial bone-to-implant contact but may increase susceptibility to bacterial adhesion. Deep placement in SPI cases mitigates this risk, with the strengthened soft tissue barrier protecting against oral biofilm exposure. Maintaining an optimal CRG/STT further reinforces the protective functions of peri-implant soft tissue.
Evaluating Implant Results with X-Rays
Plain X-rays, particularly panoramic views, are sufficient for routine follow-ups to monitor postoperative bone changes by comparing reference points. CBCT imaging, while increasingly used, is typically reserved for essential procedures like preoperative planning or when significant clinical signs suggest inflammation or notable bone changes. This approach minimizes unnecessary radiation exposure.
Although serial CBCTs cannot be routinely used for longitudinal assessments due to radiation concerns, a single postoperative CBCT—recommended within 6 months to 1 year after the procedure—can provide detailed three-dimensional data on bone and soft tissue stability. Combined with serial plain X-rays taken annually or biannually, this strategy effectively evaluates implant outcomes while minimizing radiation exposure.
In this study, CBCTs were taken 1–10 years post-procedure to analyze 3-dimensional submucosal soft tissue structures. Despite the retrospective nature of the study and the absence of consecutive CBCTs, the stable results observed reinforce the reliability of SPI outcomes.
The Peri-Implant Phenotype and the Role of SPI
In contemporary implantology, the peri-implant phenotype is recognized as a critical factor for achieving long-term stability. Traditionally, three key components are emphasized: (49)
- Alveolar Bone Thickness: A minimum of 2 mm thickness around implants (buccal, lingual, and interproximal) is necessary to prevent bone loss and provide mechanical support, particularly for forces concentrated near the crestal area.
- Width of Attached Gingiva: A thick gingival phenotype improves resistance to inflammation and mechanical stress.
- Biologic Width: This provides a protective barrier through soft and hard tissues, ensuring long-term health.
SPI (Subcrestally Placed Implants) supports and enhances these components:
- Alveolar Bone Thickness: By placing implants subcrestally, the fixtures are surrounded by thicker crestal bone, improving structural support and bone stability.
- Soft Tissue Reinforcement: Subcrestal placement enlarges the connective tissue area, which protects the underlying bone and creates a stable biologic barrier.
- Functional Biologic Width: SPI leverages the horizontal dimension of platform-switching designs, stabilizing soft tissue and minimizing crestal bone remodeling.
Additionally, SPI offers esthetic benefits by creating a more natural emergence profile. The enlarged circular area of soft tissue, visible occlusally after healing cap removal, strengthens both the biological and visual outcomes. (37)
Traditionally, clinicians have relied on bone grafting or connective tissue grafting to improve these phenotype components in cases of epicrestal placement. SPI provides an effective alternative by ensuring implants are surrounded by sufficient bone and soft tissue, enhancing structural integrity and biologic function without the need for additional invasive procedures. This positions SPI as an important technique for achieving stable and esthetic implant outcomes while addressing the essential elements of the peri-implant phenotype.
Surgical Technique: Matching Ready-Made Abutments with Subcrestally Placed Healing Abutments
This study underscores the efficacy of using healing abutments that match the final ready-made abutments. This technique not only simplifies surgical procedures by eliminating the need for additional bone reduction but also significantly contributes to maintaining a stable mucosal barrier and ensuring long-term bone integrity. These findings align with the recommendations of Alejandro et al., who emphasized that selecting appropriately sized abutments based on the distance between the implant platform and the alveolar bone crest plays a critical role in enhancing mucosal and bone stability. (50)
Furthermore, this technique facilitates the generation of the Subcrestal Zone (SZ), a critical component of the peri-implant soft tissue architecture in SPI. (Figure 16) By allowing for deep subcrestal placement of the fixture, combined with the use of healing abutments and primary closure, this approach enhances the ease and predictability of SPI procedures. While not an integral or essential component of SPI, it is a highly beneficial method that offers practical advantages to clinicians. As the author and advocate of this technique, I strongly recommend its adoption to optimize the outcomes of SPI procedures.
Figure 17 illustrates the natural results achievable with SPI, demonstrating a seamless transition of peri-implant soft tissue that closely mimics natural teeth. The distinction between the oral epithelium and the underlying connective tissue (likely the TZ) is evident, while the junctional epithelium, situated between these layers, remains subtle and indistinct without histological magnification
Food Impaction and the Role of SPI
Food impaction between implant-supported prostheses and adjacent teeth often increases when the embrasure space is excessive. (51) However, SPI techniques minimize this issue by maintaining close contact between prostheses and underlying soft tissue through an optimized emergence profile. This study supports the notion that maintaining sufficient bone and soft tissue volume, particularly with SCIs, contributes to reduced food impaction as reported by patients.
Paradigm Shifts in Implant Dentistry
The focus in implant therapy has shifted from prioritizing bone quantity alone to emphasizing soft tissue stability, as both are interdependent. Optimal implant positioning not only influences prosthetic design but also creates adequate space for soft tissue integration, enhancing overall outcomes. (52)
A notable observation of the temporary swelling of peri-implant soft tissue during prosthetic adjustments demonstrates the hydraulic positive pressure and resilience of the TZ. This response illustrates its role in maintaining the sealing function of the biologic width, contributing to the stability of peri-implant tissues (Figure 18).
Significance of Soft Tissue and Prosthesis Design
Soft tissue impressions, captured either traditionally or via oral scanning, provide essential data for prosthesis fabrication. However, the temporary swelling of peri-implant soft tissue caused by hydraulic pressure during impression-taking highlights the resilience and positive pressure of the Transitional Zone (TZ). This study’s findings suggest that the subcrestal connective tissue dimension remains relatively constant, emphasizing its critical role in prosthesis design. Yet, both digital impressions obtained through oral scanning and traditional impressions using impression materials face limitations, particularly due to the absence of established standards for peri-implant soft tissue dimensions.
This study underscores the necessity of aligning surgical planning with the biologic environment, including subcrestal bone, connective tissue, and junctional epithelium. (50) The SPI technique, combined with extraoral cementation, enables precise determination of the prosthetic shape at the submucosal level, guided by statistically derived optimal values under controlled conditions. As demonstrated in this report, the consistent thickness of peri-implant soft tissue at the TZ offers valuable insights into prosthetic design at the submucosal area and abutment size selection using matching abutment techniques. A similar approach has been reported by other authors, who proposed abutment height selection based on statistical results, albeit focusing solely on vertical soft tissue height. This represents significant advancement, paving the way for improved stability, esthetics, and a more convenient workflow in implant dentistry.
Conclusively, TZ is supported by crestal bone thicker than 2 mm, providing stability and integration for soft tissue (as seen in Figure 19). When the crestal bone is thinner, it fails to support a TZ, leaving only a conventional biologic width with solely vertical components. This study highlights the TZ as a critical concept in understanding the functional and biological phenomena surrounding SPIs, emphasizing its essential role in stabilizing soft tissue and ensuring long-term implant success.
CONCLUSIONS
This study investigated the structural integrity and stability of peri-implant soft tissue and crestal bone around SPIs (Subcrestally Placed Implants) using CBCT measurements and panoramic X-rays. The findings underscore the critical role of soft tissue dimensions and their impact on the biological and esthetic outcomes of SPI.
Key Findings:
- Crestal Bone Stability: Panoramic analysis revealed that crestal bone remained stable, with minimal changes in pPD (peripheral placement depth) over an average follow-up period of 3.3 years, showing a mean change of less than 0.1 mm.
-
Soft and Hard Tissue Dimensions:
- ○
- Average cPD (central placement depth): 1.7 mm
- ○
- Average pPD (peripheral placement depth): 2.7 mm
- ○
- Average cSTT (central soft tissue thickness): 0.2 mm
- ○
- Average pSTT (peripheral soft tissue thickness): 0.6 mm
- Diagnostic Tools: Panoramic X-rays were sufficient for routine monitoring of SPI stability. CBCT, while essential for preoperative planning and three-dimensional analysis, can be reserved for cases requiring detailed investigation of bone or soft tissue structures.
Implications:
- Natural-Looking Implant Results: Subcrestal placement allows for adequate vertical space to create a gradual and natural emergence profile, particularly critical in posterior regions where esthetic considerations are often overlooked. This approach contributes to both improved appearance and biological stability.
- Biologic Seal Around Implants: The study highlights the importance of the peri-implant soft tissue, specifically CRG (Crest to Restoration Gap), in forming a biologic seal akin to the biologic width of natural teeth. The dimensions and structural integrity of this soft tissue are essential for maintaining implant health and preventing complications.
- Future Directions: The findings emphasize the need for further research to define the optimal pSTT and explore the functional roles of the peri-implant soft tissue, including its contributions to immune defense, sealing capacity, and structural resilience.
Conclusion:
SPI offers both biological and esthetic advantages, establishing it as a reliable and effective technique for implant placement. By enhancing the structural stability of peri-implant soft tissue and maintaining crestal bone integrity, SPI addresses critical challenges in implant dentistry. This study provides foundational data and insights, paving the way for more comprehensive investigations into the role of soft tissue in achieving long-term success with SPIs.
Funding
This research has neither fund nor sponsor.
Ethical Approval and Consent to participate
Not applicable
Consent for publication
Not applicable
Availability of supporting data
Please refer to appendix
Competing interests/Authors’ contributions
The author declares to have no competing interests
Abbreviations
| Abbreviation | Definition |
| 3 DSTA | 3-Dimensional Soft Tissue Analysis |
| SPI | Subcrestally Placed Implant |
| IPS | Internal connection with Platform Switching |
| IAP | Implant Abutment Prosthesis |
| CBCT | Cone Beam Computed Tomography |
| PD | Placement Depth |
| cPD | Central Placement Depth |
| pPD | Peripheral Placement Depth |
| STT | Soft Tissue Thickness |
| cSTT | Central Soft Tissue Thickness |
| pSTT | Peripheral Soft Tissue Thickness |
| CRG | Crest to Restoration Gap |
| CRL | Crest to Restoration Length |
| TZ | Transitional Zone |
| TZL | Transitional Zone Length |
| SZ | Subcrestal Zone |
| SZL | Subcrestal Zone Length |
| CRST | Crestal Restoration Soft Tissue |
| SSST | Self-Sustained Soft Tissue |
| CBT | Crestal Bone Thickness |
| CAC | Complex of Abutment and Crown |
| EOC | Extraoral Cementation |
| IPPP | Implant Paper Point Probing |
| BOP | Bleeding on Probing |
Appendix
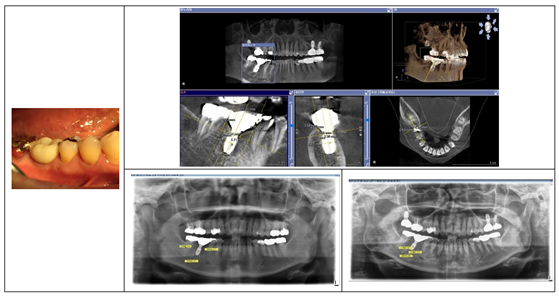
Case 1 (#46) from the same pt of J OO
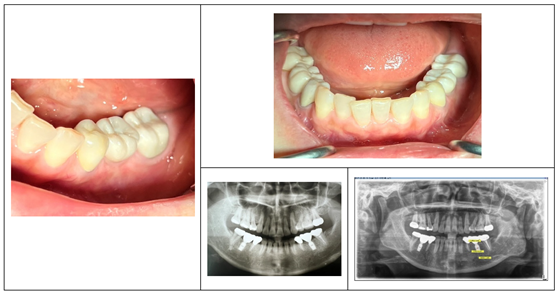
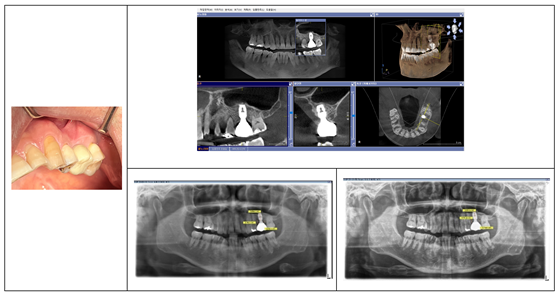
Case 2(#36) from the same pt of Joo
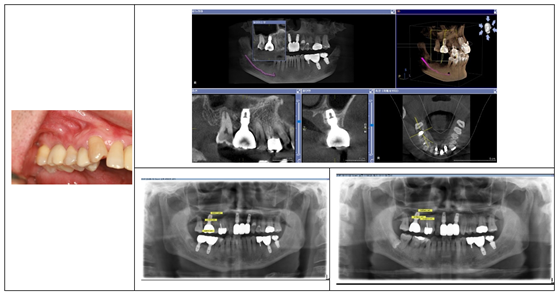
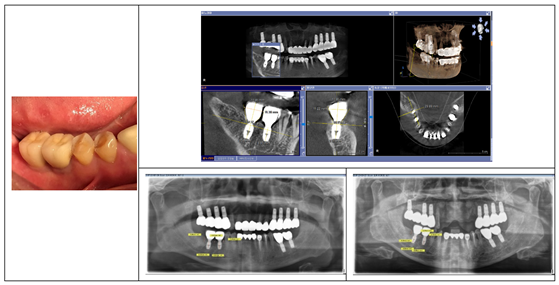
Case 3 (#16) from pt of Jung
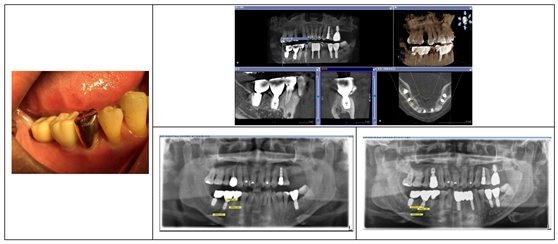
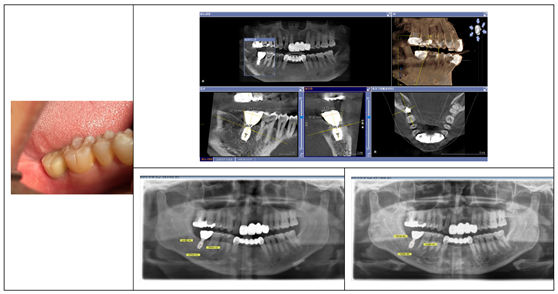
Case 4 (# ) from pt of Huh
Case 5 (# ) from pt of LeeSA
Case 6 (# ) from pt of Ch
Case 7 (# 46 ) from pt of Song

Case 8 (# 47 ) from pt of Song
Case 9 (# 47 ) from pt of Choi
Case 10 (# 16 ) from pt of Kim
Case 11
Case 12
Case 13
Case 14
Case 15, 16
Case 17
Case 18
Case 19
References
- Cruz, R. S., et al. (2022). Clinical comparison between crestal and subcrestal dental implants: A systematic review and meta-analysis. Journal of Prosthetic Dentistry. PMID: 33358610. [CrossRef]
- Valles, C., et al. (2018). Influence of subcrestal implant placement compared with equicrestal position on the peri-implant hard and soft tissues around platform-switched implants: A systematic review and meta-analysis. Clinical Oral Investigations. PMID: 29313133. [CrossRef]
- Sun, Y., et al. (2023). Clinical and radiographic results of crestal vs. subcrestal placement of implants in posterior areas: A split-mouth randomized controlled clinical trial. Clinical Implant Dentistry and Related Research. PMID: 37259774. [CrossRef]
- Chatterjee, P., et al. (2022). Comparative study of the crestal vs subcrestal placement of dental implants via radiographic and clinical evaluation. Journal of Contemporary Dental Practice, 23, 623–627. PMID: 36259302. [CrossRef]
- Donos, N. (2018). The periodontal pocket. Periodontology 2000, 76(1), 7–15. [CrossRef]
- Bosshardt, D. D. (2018). The periodontal pocket: Pathogenesis, histopathology, and consequences. Periodontology 2000, 76(1), 43–50. [CrossRef]
- Esquivel, J., Meda, R. G., & Blatz, M. B. (2021). The impact of 3D implant position on emergence profile design. International Journal of Periodontics & Restorative Dentistry, 41(1). [CrossRef]
- Gargiulo, A. U., Wentz, F., & Orban, B. (1961). Dimension and relations of the dentogingival junction in humans. Journal of Periodontology, 32, 261–267. [CrossRef]
- Vacek, J. S., Gher, M. E., Assad, D. A., Richardson, A. C., & Giambarresi, L. I. (1994). The dimensions of the human dentogingival junctions. International Journal of Periodontics and Restorative Dentistry, 14(2), 154–165. [CrossRef]
- Zheng, Z., et al. (2021). The biological width around implants. Journal of Prosthodontic Research, 65(1), 11–18. [CrossRef]
- Ivanovski, S., et al. (2018). Comparison of peri-implant and periodontal marginal soft tissues in health and disease. Periodontology 2000, 76, 116–130. PMID: 29193334. [CrossRef]
- González-Martín, O., et al. (2020). Contour management of implant restorations for optimal emergence profiles: Guidelines for immediate and delayed provisional restorations. International Journal of Periodontics & Restorative Dentistry, 40(1), 61–70. [CrossRef]
- Lin, G. H., & Madi, I. M. (2019). Soft-tissue conditions around dental implants: A literature review. Implant Dentistry, 28(2), 138–143. [CrossRef]
- Soulami, S. A., et al. (2022). Implant-abutment angle and profile in relation to peri-implantitis: A systematic review. Clinical and Experimental Dental Research, 8, 759–806. [CrossRef]
- Chu, S. J., et al. (2020). Restorative emergence profile for single-tooth implants in healthy periodontal patients: Clinical guidelines and decision-making strategies. International Journal of Periodontics & Restorative Dentistry, 40(1), 18–29. [CrossRef]
- Gutmacher, Z., Levi, G., Blumenfeld, I., & Machtei, E. E. (2015). Soft and hard tissue changes around tissue-oriented tulip-design implant abutments: A 1-year randomized prospective clinical trial. Clinical Implant Dentistry and Related Research, 17(5), 891–897. PMID: 26434929. [CrossRef]
- Lago, L., et al. (2017). Bone and soft tissue response in bone-level implants restored with platform switching: A 5-year clinical prospective study. International Journal of Oral and Maxillofacial Implants. PMID: 28708924. [CrossRef]
- Sahabi, M., et al. (2013). Biomechanical effects of platform switching in two different implant systems: A three-dimensional finite element analysis. Journal of Dentistry (Tehran). 24396353. Free PMC article.
- Watanabe, H., et al. (2022). Digital technologies for restorative dentistry. Dental Clinics of North America. PMID: 36216447. [CrossRef]
- Flügge, T., Kramer, J., Nelson, K., Nahles, S., & Kernen, F. (2022). Digital implantology—a review of virtual planning software for guided implant surgery. Part II: Prosthetic set-up and virtual implant planning. BMC Oral Health, 22(1), 23. [CrossRef]
- Monje, A., et al. (2023). Impact of peri-implant soft tissue characteristics on health and esthetics. Journal of Esthetic and Restorative Dentistry, 35(1), 183–196. PMID: 36650691. [CrossRef]
- Gomez-Meda, R., Esquivel, J., & Blatz, M. B. (2021). The esthetic biological contour concept for implant restoration emergence profile design. Journal of Esthetic and Restorative Dentistry, 33(1), 173–184. [CrossRef]
- Beretta, M., et al. (2019). Peri-implant soft tissue conditioning by means of customized healing abutments: A randomized controlled clinical trial. Materials, 12, 3041. [CrossRef]
- Hsu, Y. T., et al. (2017). Effects of platform-switching on peri-implant soft and hard tissue outcomes: A systematic review and meta-analysis. International Journal of Oral and Maxillofacial Implants. PMID: 28095526. [CrossRef]
- Linkevicius, T., et al. (2020). The influence of submerged healing abutments or subcrestal implant placement on soft tissue thickness and crestal bone stability: A 2-year randomized clinical trial. Clinical Implant Dentistry and Related Research, 22, 497–506. [CrossRef]
- Vervaeke, S., et al. (2014). The influence of initial soft tissue thickness on peri-implant bone remodeling. Clinical Implant Dentistry and Related Research, 16(2), 238–247. [CrossRef]
- Palacios-Garzón, N., Velasco-Ortega, E., & López-López, J. (2019). Bone loss in implants placed at subcrestal and crestal level: A systematic review and meta-analysis. Materials, 12(1), 154. [CrossRef]
- Chatterjee, P., Shashikala, R., & Navneetham, A. (2022). Comparative study of the crestal vs subcrestal placement of dental implants via radiographic and clinical evaluation. Journal of Contemporary Dental Practice, 23, 623–627. [CrossRef]
- Cruz, R. S., et al. (2022). Clinical comparison between crestal and subcrestal dental implants: A systematic review and meta-analysis. Journal of Prosthetic Dentistry, 127(3), 408–417. [CrossRef]
- Stacchi, C., et al. (2023). Marginal bone changes around platform-switched conical connection implants placed 1 or 2 mm subcrestally: A multicenter crossover randomized controlled trial. Clinical Implant Dentistry and Related Research, 25(2), 398–408. [CrossRef]
- Valles, C., et al. (2018). Influence of subcrestal implant placement compared with equicrestal position on the peri-implant hard and soft tissues around platform-switched implants: A systematic review and meta-analysis. Clinical Oral Investigations, 22, 555–570. [CrossRef]
- Zukauskas, S., et al. (2021). Influence of implant placement depth and soft tissue thickness on crestal bone stability around implants with and without platform switching: A comparative clinical trial. International Journal of Periodontics & Restorative Dentistry, 41(3). [CrossRef]
- Madani, E., et al. (2018). Impact of different placement depths on the crestal bone level of immediate versus delayed placed platform-switched implants. Journal of Cranio-Maxillofacial Surgery, 46(7), 1139–1146. [CrossRef]
- Saleh, M. H. A., et al. (2018). The effect of implant-abutment junction position on crestal bone loss: A systematic review and meta-analysis. Clinical Implant Dentistry and Related Research, 20(4), 617–633. [CrossRef]
- Palacios-Garzón, N., Velasco-Ortega, E., & López-López, J. (2019). Bone loss in implants placed at subcrestal and crestal level: A systematic review and meta-analysis. Materials, 12(1), 154. [CrossRef]
- Anton, et al. (2019). Effect of dental implant surface roughness in patients with a history of periodontal disease: A systematic review and meta-analysis. International Journal of Implant Dentistry, 5, 1–11. [CrossRef]
- Muñoz, M., et al. (2021). Bone-level changes around implants with 1-or 3-mm-high abutments and their relation to crestal mucosal thickness: A 1-year randomized clinical trial. Journal of Clinical Periodontology, 48(10), 1302–1311. [CrossRef]
- Michitsuna, et al. (2018). Restoration contour is a risk indicator for peri-implantitis: A cross-sectional radiographic analysis. Journal of Clinical Periodontology, 45, 225–232. [CrossRef]
- Pérez-Sayans, M., et al. (2022). Impact of abutment geometry on early implant marginal bone loss: A double-blind, randomized, 6-month clinical trial. Clinical Oral Implants Research, 33(10), 1038–1048. [CrossRef]
- Ivanovski, S., & Lee, R. (2018). Comparison of peri-implant and periodontal marginal soft tissues in health and disease. Periodontology 2000, 76(1), 116–130. [CrossRef]
- Renvert, S., et al. (2018). Peri-implant health, peri-implant mucositis, and peri-implantitis: Case definitions and diagnostic considerations. Journal of Clinical Periodontology, 45(S278), S278–S285. [CrossRef]
- Barendregt, D. S., et al. (2006). Comparison of two automated periodontal probes and two probes with a conventional readout in periodontal maintenance patients. Journal of Clinical Periodontology, 33(4), 276–282. [CrossRef]
- Laugisch, O., et al. (2021). Clinical evaluation of a new electronic periodontal probe: A randomized controlled clinical trial. Diagnostics, 12(1), 42. [CrossRef]
- Atsuta, I., et al. (2016). Soft tissue sealing around dental implants based on histological interpretation. Journal of Prosthodontic Research, 60(1), 3–11. [CrossRef]
- Eggert, F., et al. (2018). Biology of teeth and implants: The external environment, biology of structures, and clinical aspects. Quintessence International, 49(4). [CrossRef]
- Fischer, N. G., & Aparicio, C. (2022). Junctional epithelium and hemidesmosomes: Tape and rivets for solving the “percutaneous device dilemma” in dental and other permanent implants. Bioactive Materials, 18, 178–198. [CrossRef]
- Schroeder, H. E., & Listgarten, M. A. (1997). The gingival tissues: The architecture of periodontal protection. Periodontology 2000, 13(1), 91–120. [CrossRef]
- Gibbs, S., et al. (2019). Biology of soft tissue repair: Gingival epithelium in wound healing and attachment to the tooth and abutment surface. European Cells and Materials, 38, 63–78. [CrossRef]
- Avila-Ortiz, G., et al. (2020). The peri-implant phenotype. International Journal of Periodontics & Restorative Dentistry, 40.
- Elizalde Hernandez, A., et al. (2022). Assessment of surgical and radiographic parameters for abutment height selection: A prospective study with 1-year follow-up. International Journal of Oral & Maxillofacial Implants, 37(5). [CrossRef]
- Jeong, J. S., & Chang, M. (2015). Food impaction and periodontal/peri-implant tissue conditions in relation to the embrasure dimensions between implant-supported fixed dental prostheses and adjacent teeth: A cross-sectional study. Journal of Periodontology, 86(12), 1314–1320. [CrossRef]
- Di Gianfilippo, R., et al. (2022). Paradigm shifts in the evolution of implant therapy. International Journal of Periodontics & Restorative Dentistry, 42(5). [CrossRef]
- Clinical Periodontology and Implant Dentistry. (6th ed.). Wiley Blackwell.
Figure 1.
Clinical and Radiographic Outcomes of an SPI Restored Upper Left First Molar. Upper Two Images (Clinical Photos): Show the natural, healthy appearance of the restored upper left first molar, highlighting well-integrated soft tissue and a harmonious emergence profile (coronal flaring of the implant restoration), demonstrating both stability and esthetic success. Lower Left Image (CBCT Cross-Section): Buccolingual view showing precise implant placement, contributing to the establishment of a favorable peri-implant phenotype. Lower Right Image (CBCT with Measurements): Displays Transitional Zone Length (TZL) and Soft Tissue Thickness (STT), highlighting the peri-implant soft tissue’s horizontal and vertical dimensions, which are essential for achieving biological stability.
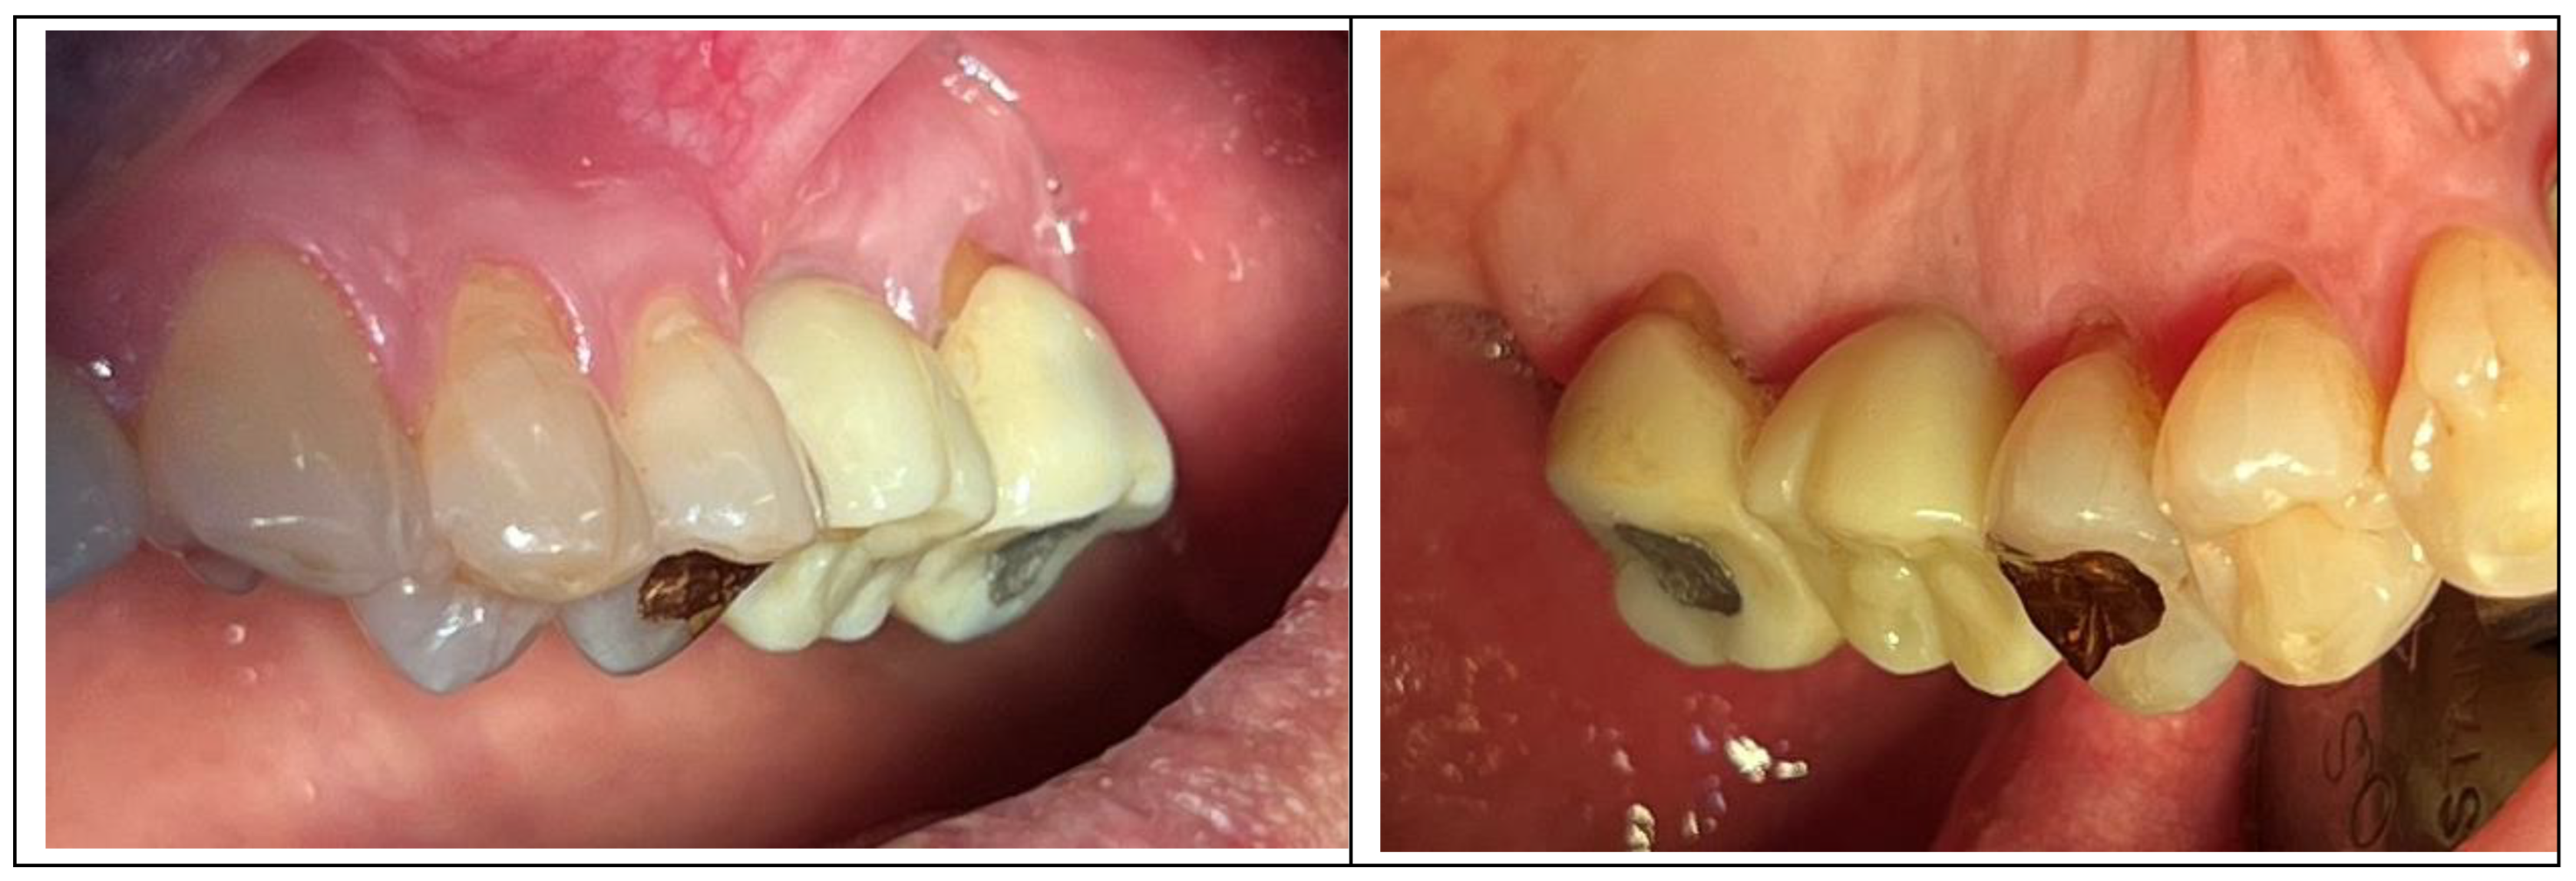
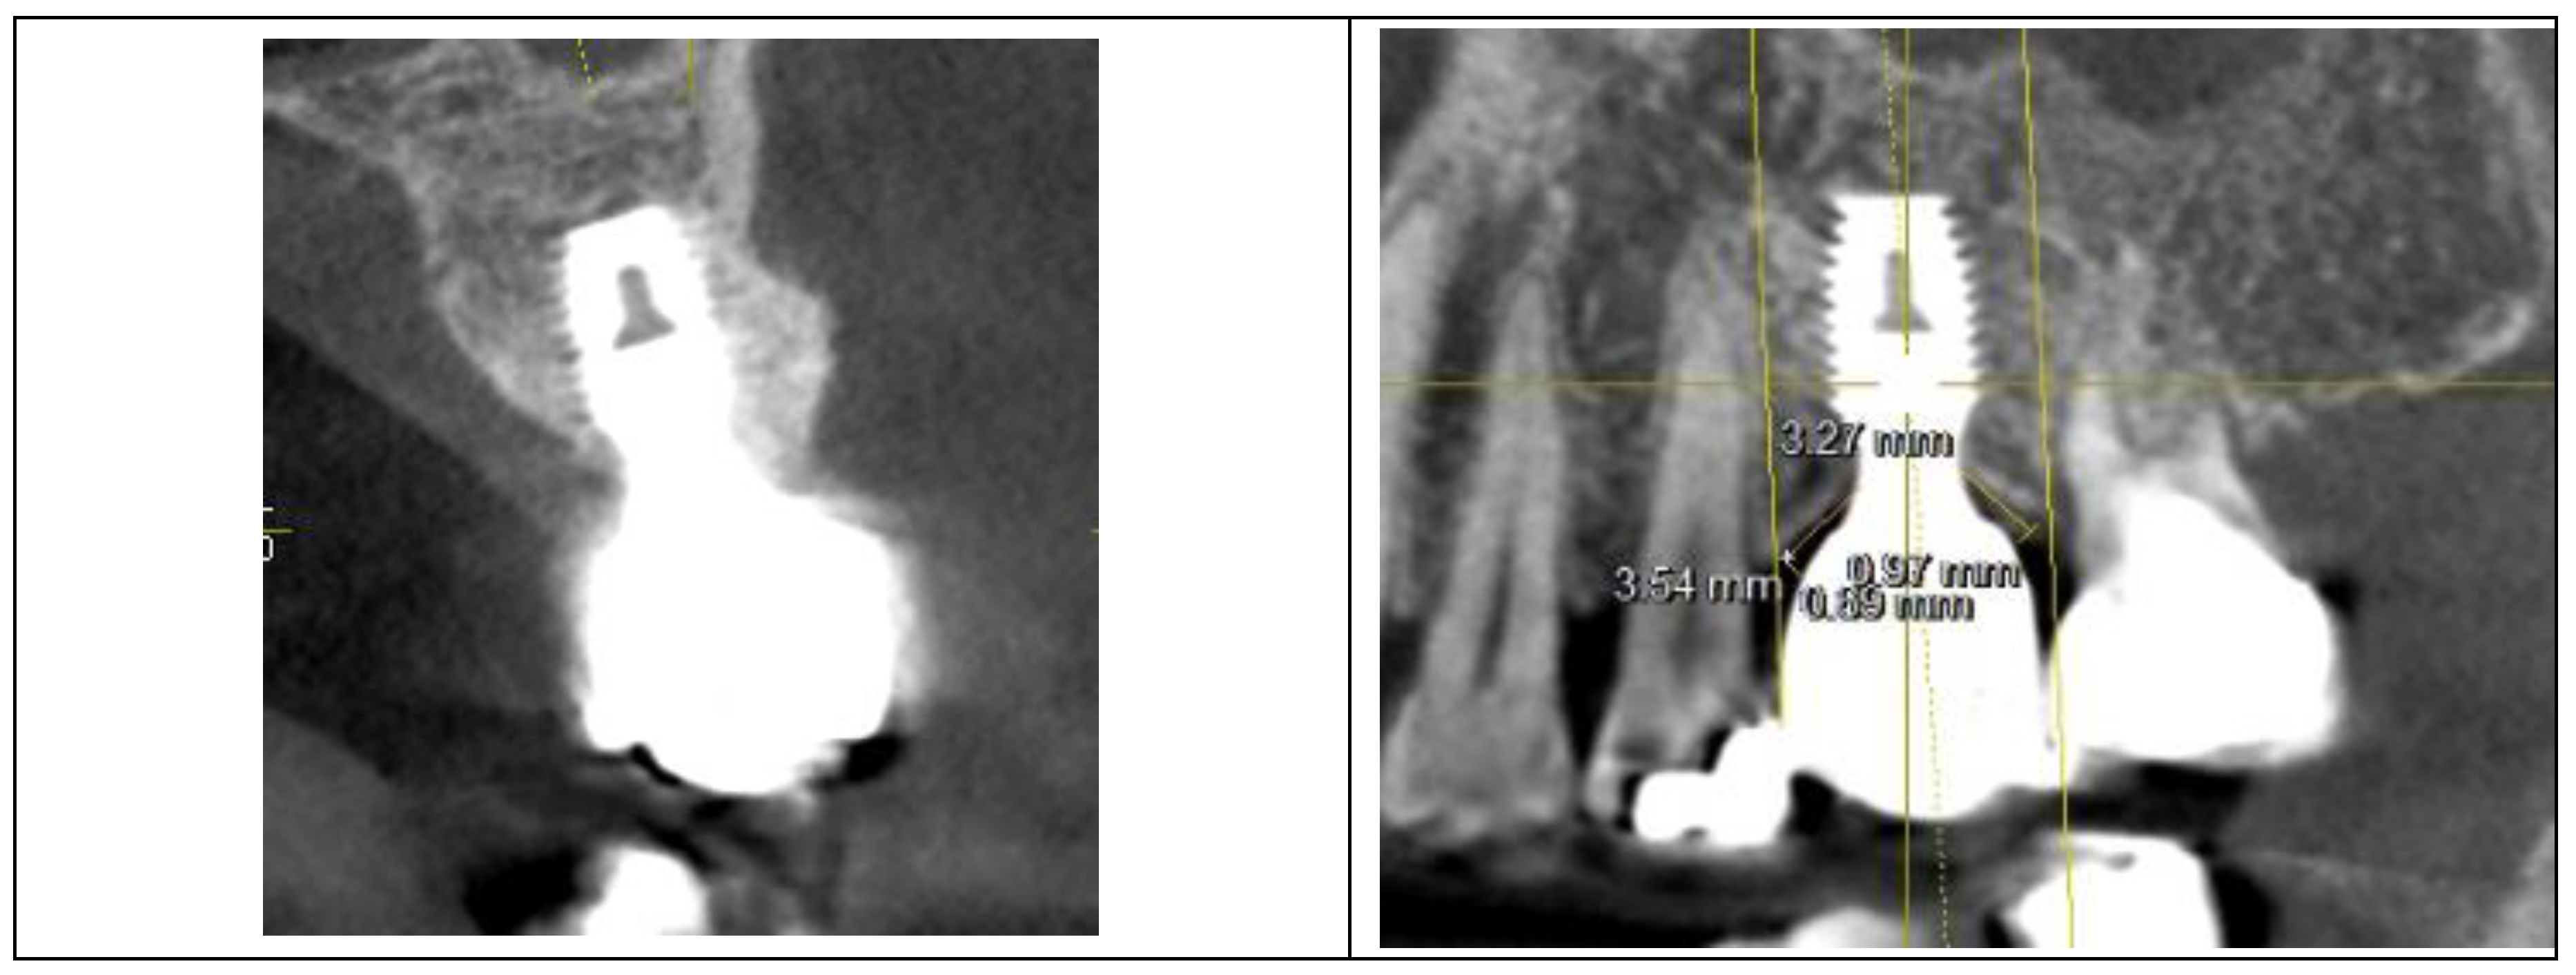
Figure 2.
Comparison of peri-implant soft tissue architecture with and without horizontal widening, using examples of external hex connection implants without horizontal extension at the mucosal level and SPI with internal connection and platform design incorporating horizontal extension for coronal flaring.
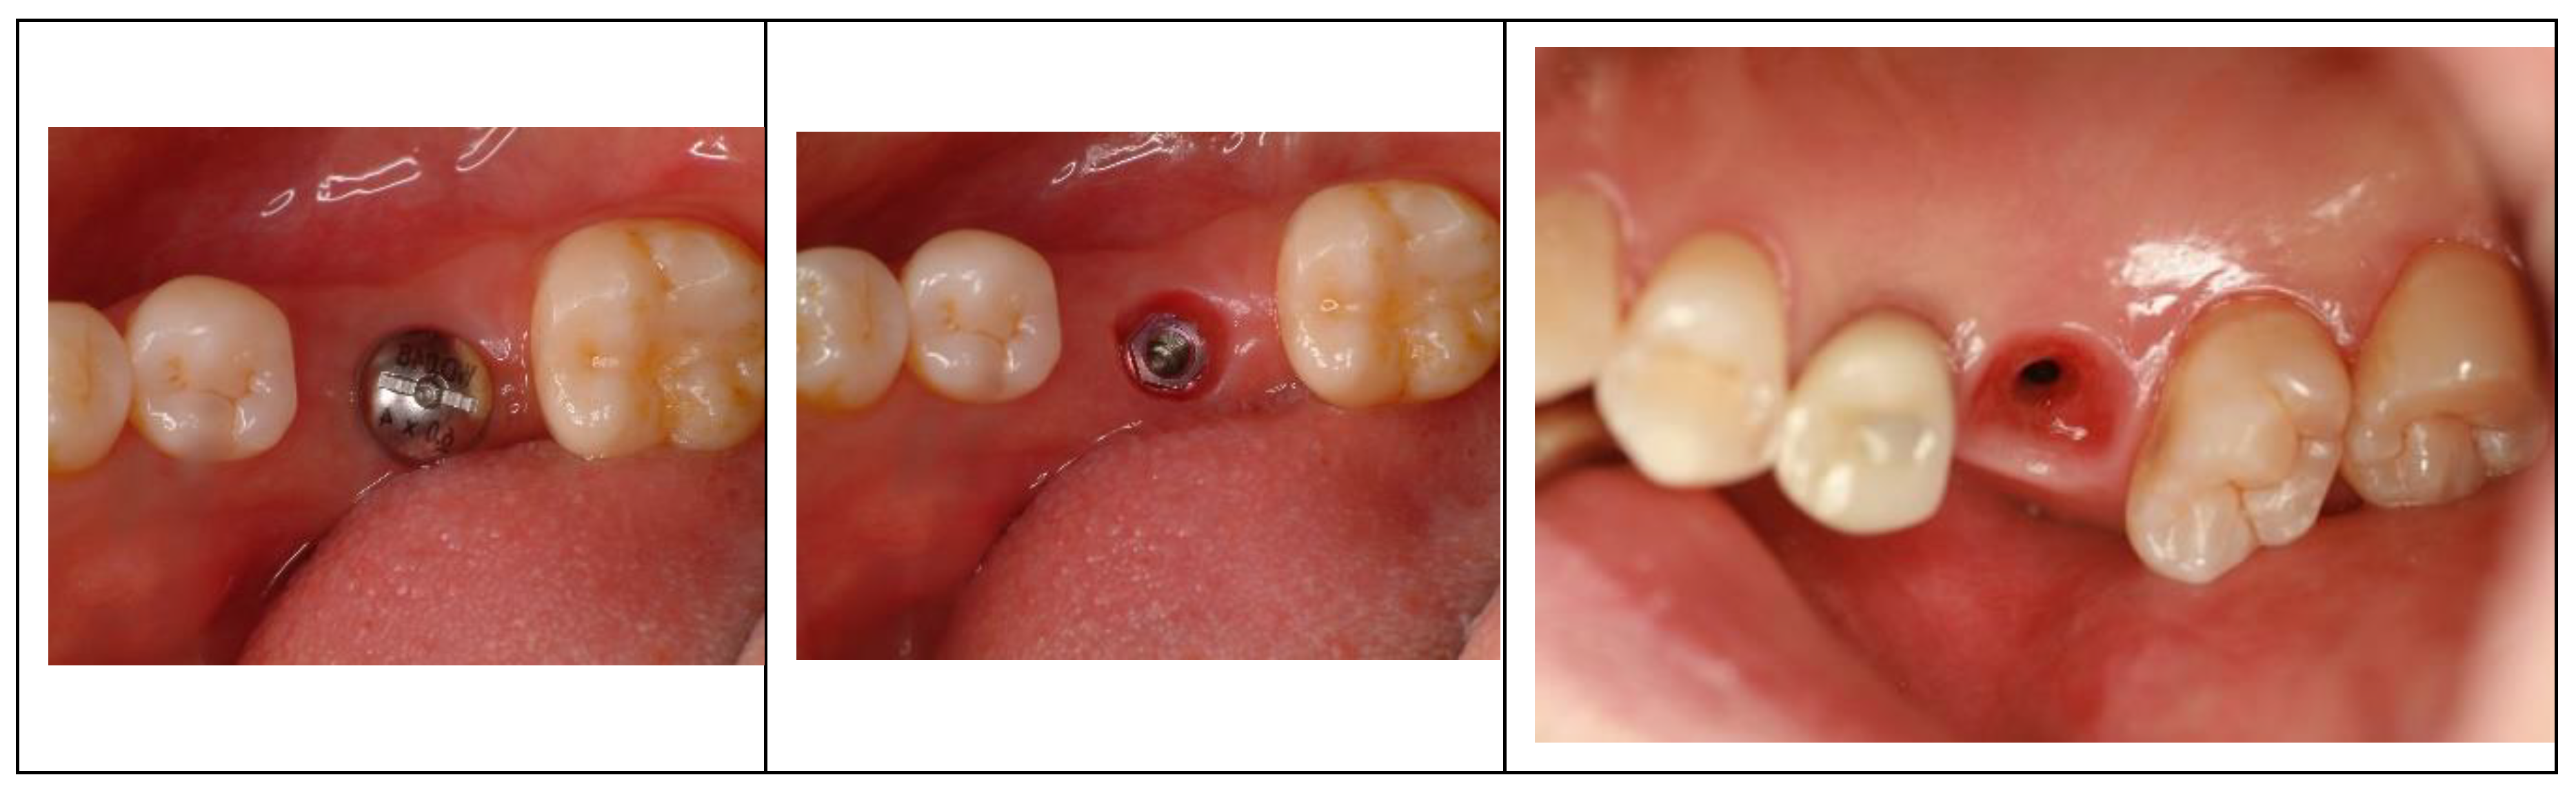
Figure 3.
Fixtures placed subcrestally with healing abutments (5 mm diameter x 2.5 mm height) connected, and the flap sutured for primary closure over the healing abutments.
Figure 3.
Fixtures placed subcrestally with healing abutments (5 mm diameter x 2.5 mm height) connected, and the flap sutured for primary closure over the healing abutments.
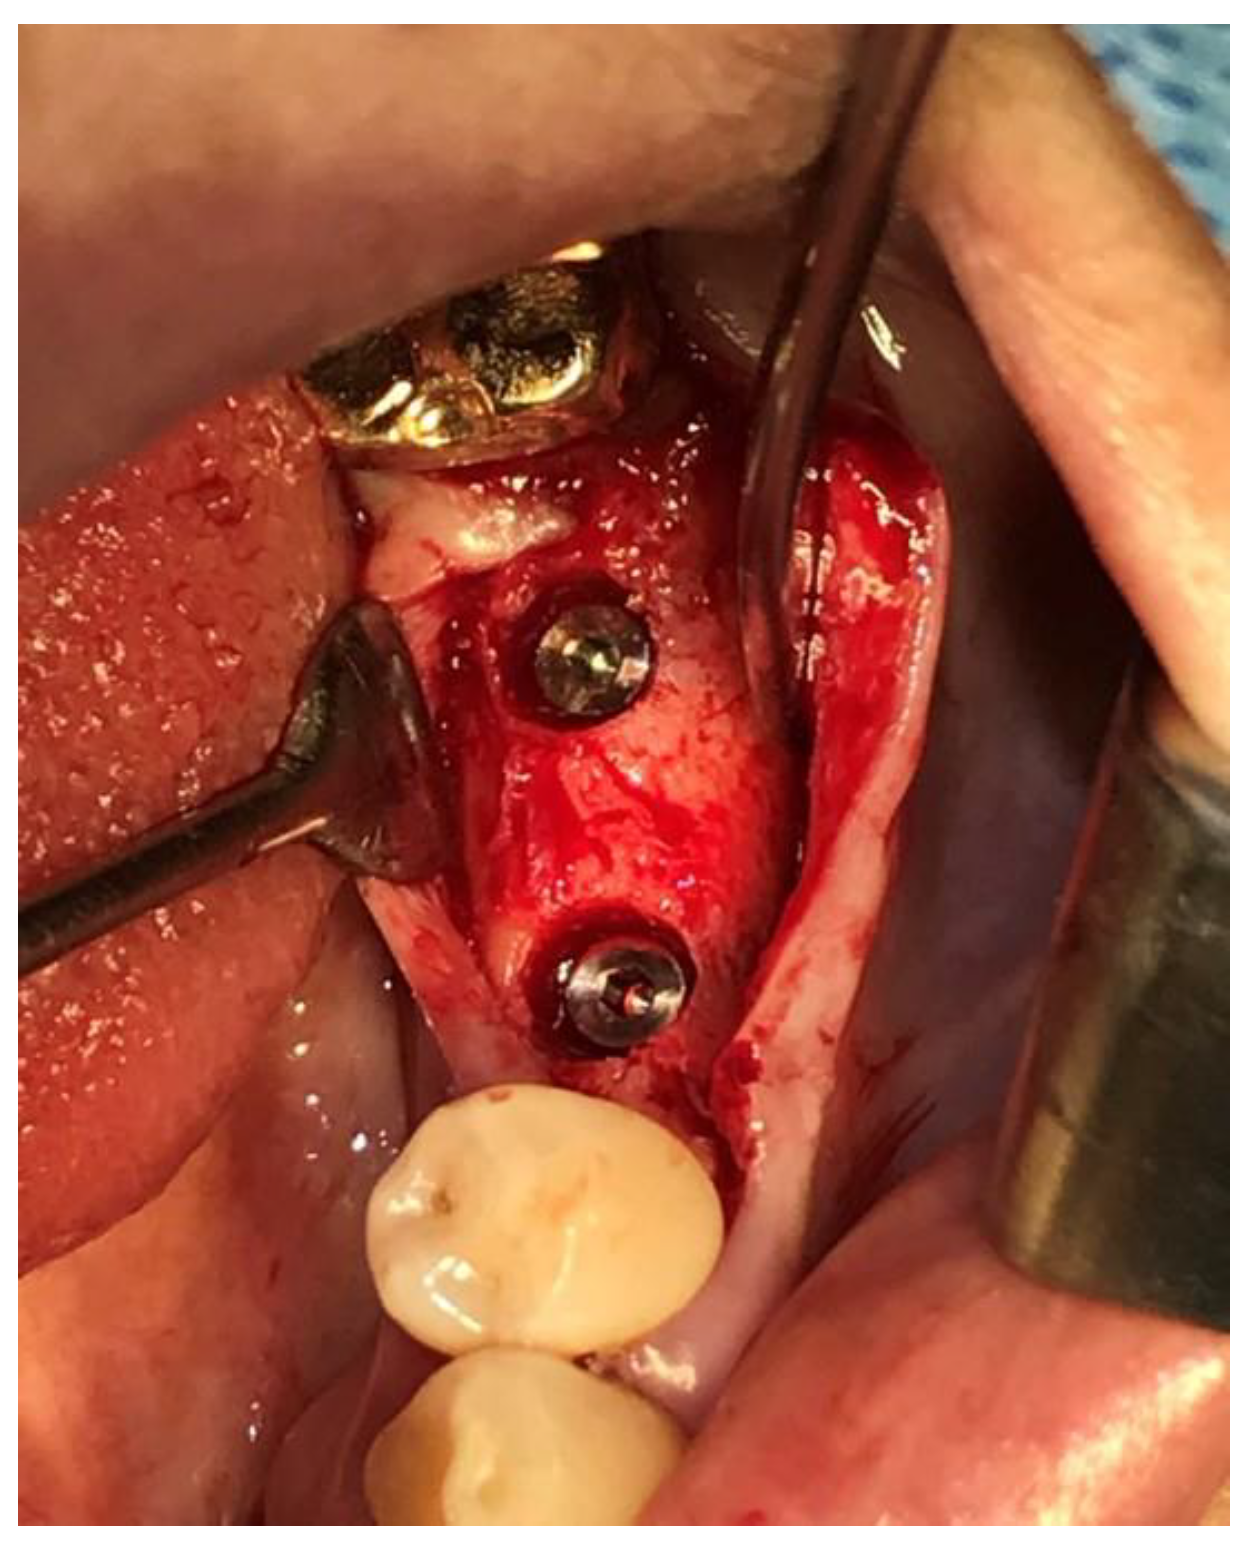
Figure 4.
X-rays showing the procedural sequence. The initial healing abutments (5 mm x 2.5 mm) were embedded with primary flap closure. After 3 months, during the second operation for prosthetic procedures, longer healing abutments with the same profile as the initial ones were connected.
Figure 4.
X-rays showing the procedural sequence. The initial healing abutments (5 mm x 2.5 mm) were embedded with primary flap closure. After 3 months, during the second operation for prosthetic procedures, longer healing abutments with the same profile as the initial ones were connected.
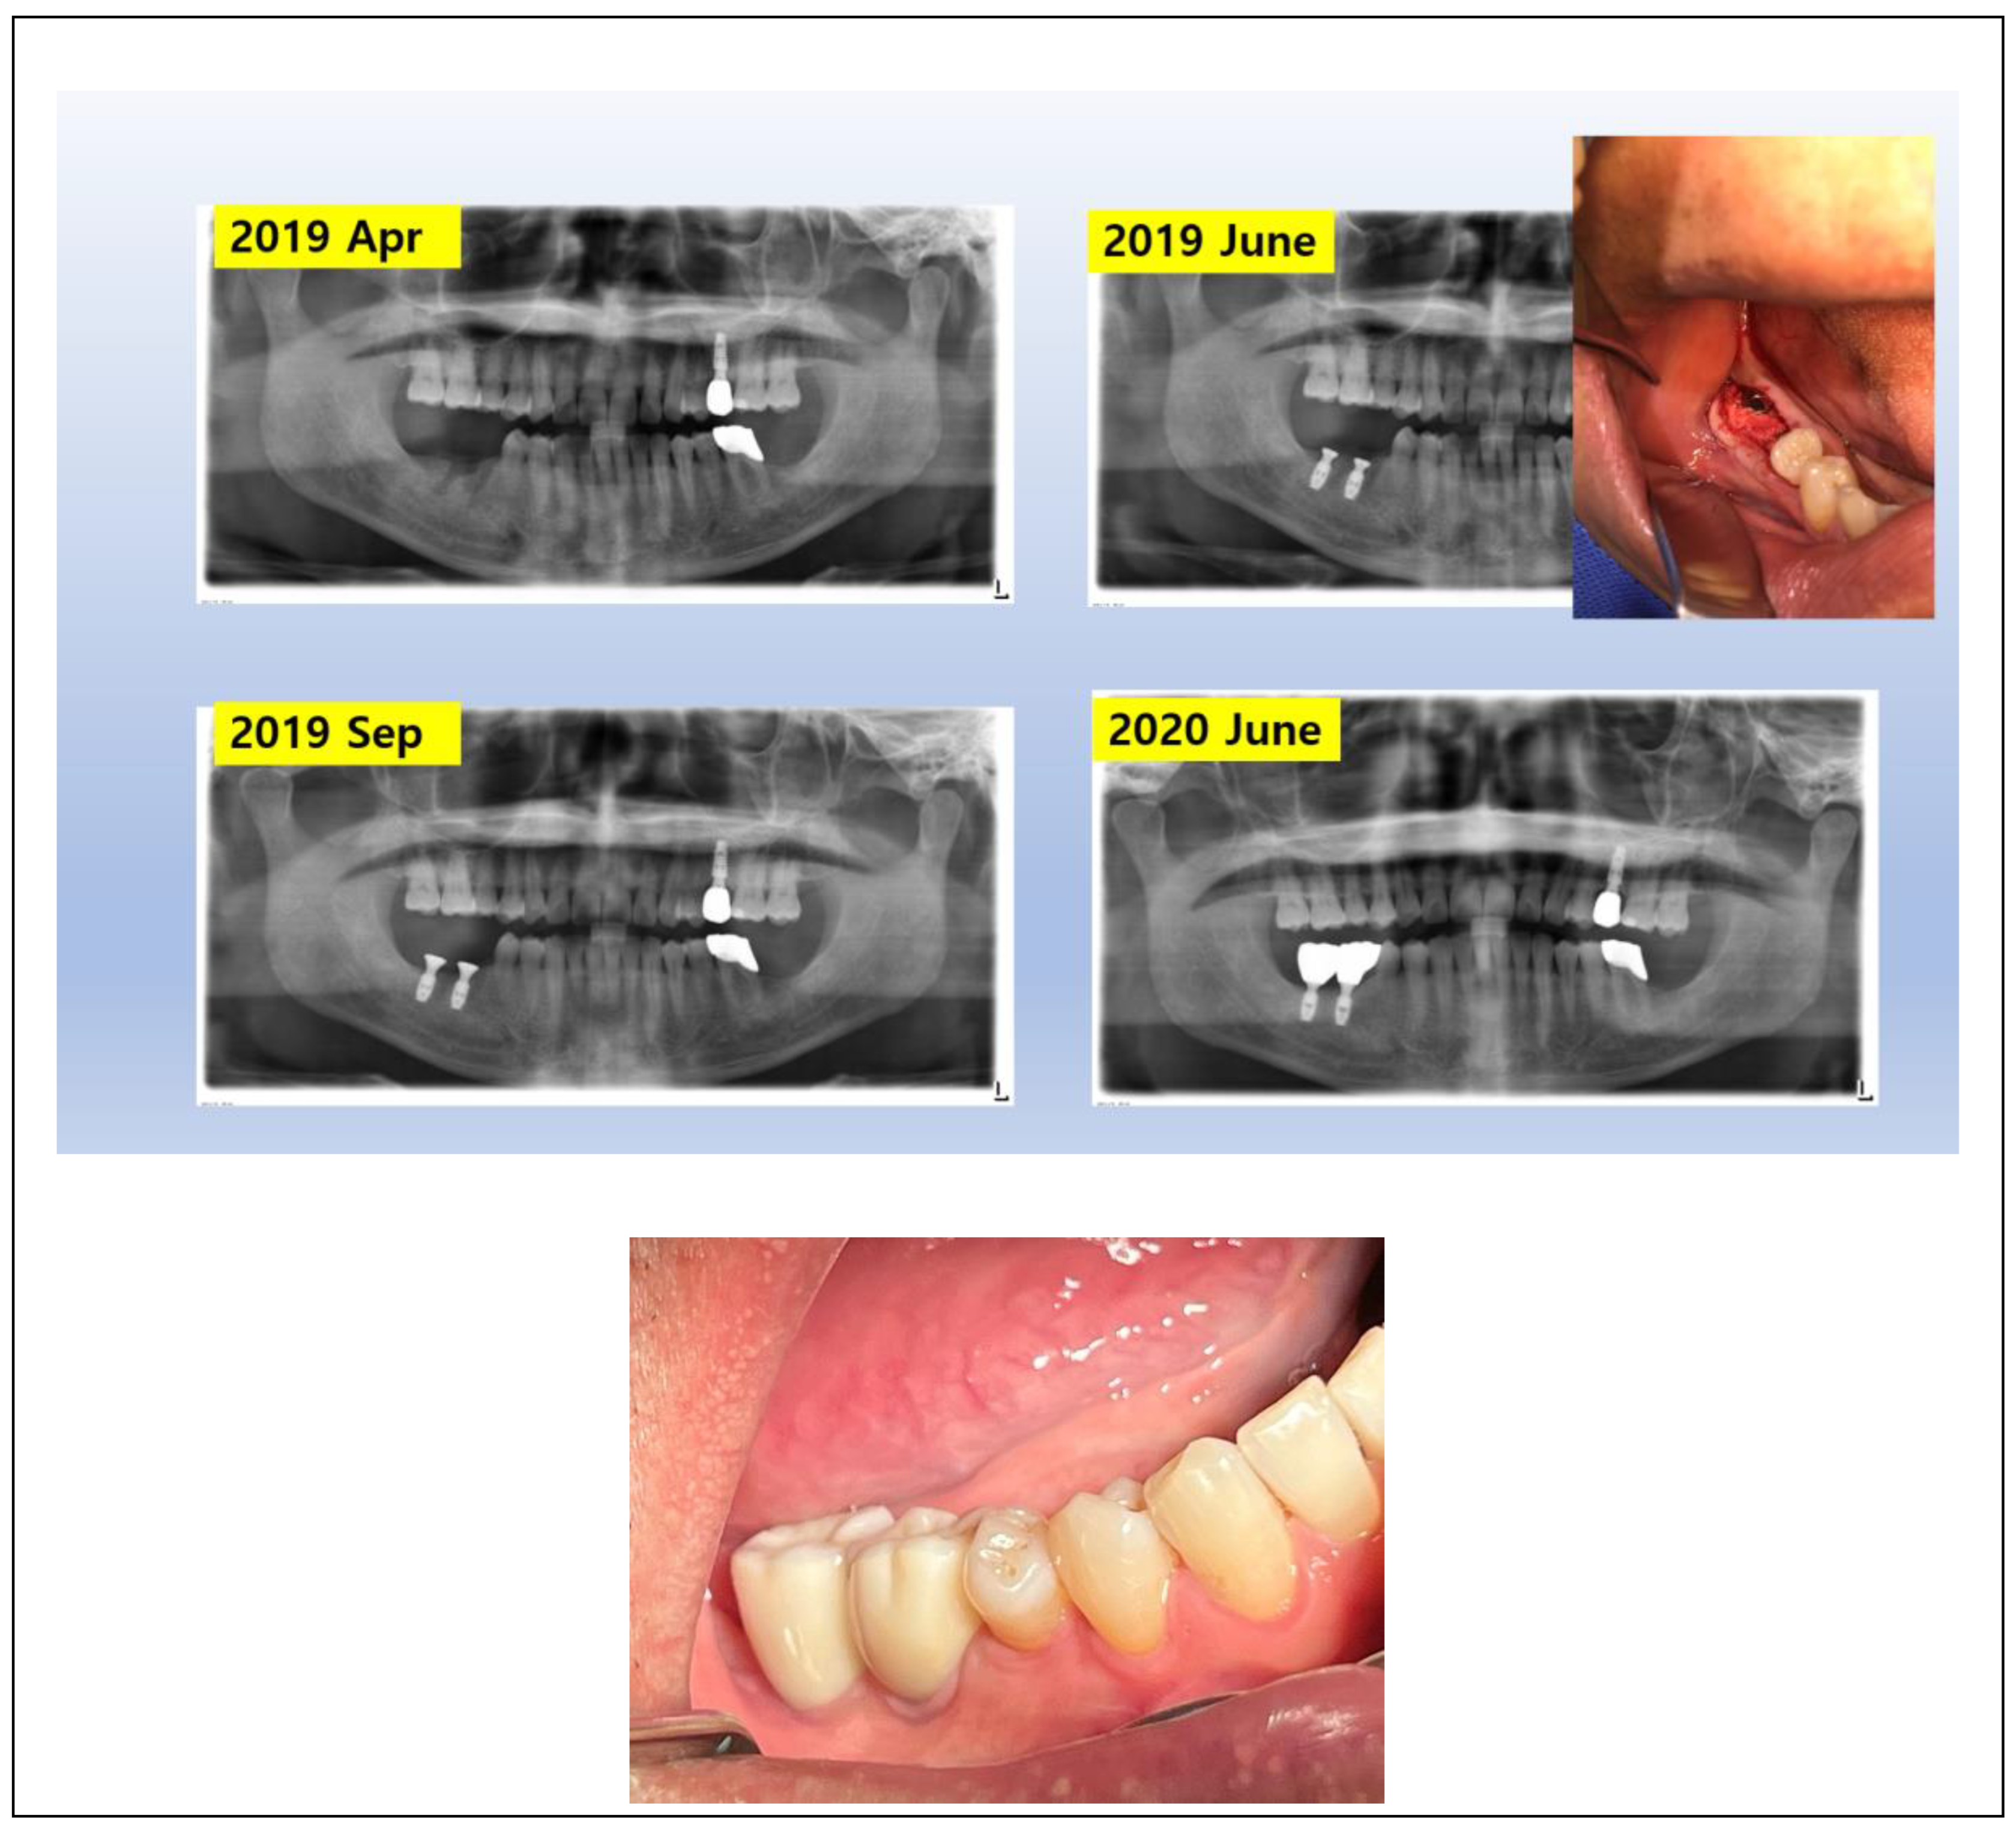
Figure 5.
Measurements of the Crest to Restoration Gap (CRG) or Soft Tissue Thickness (STT) using Cone Beam Computed Tomography (CBCT). CRG represents the vertical distance from the crestal bone to the crown-abutment complex, which may be equivalent to STT when within the critical range (<1.0 mm). Measurements are taken at both central (cCRG/cSTT) and peripheral (pCRG/pSTT) sites, including the mesial, distal, buccal, and lingual aspects.
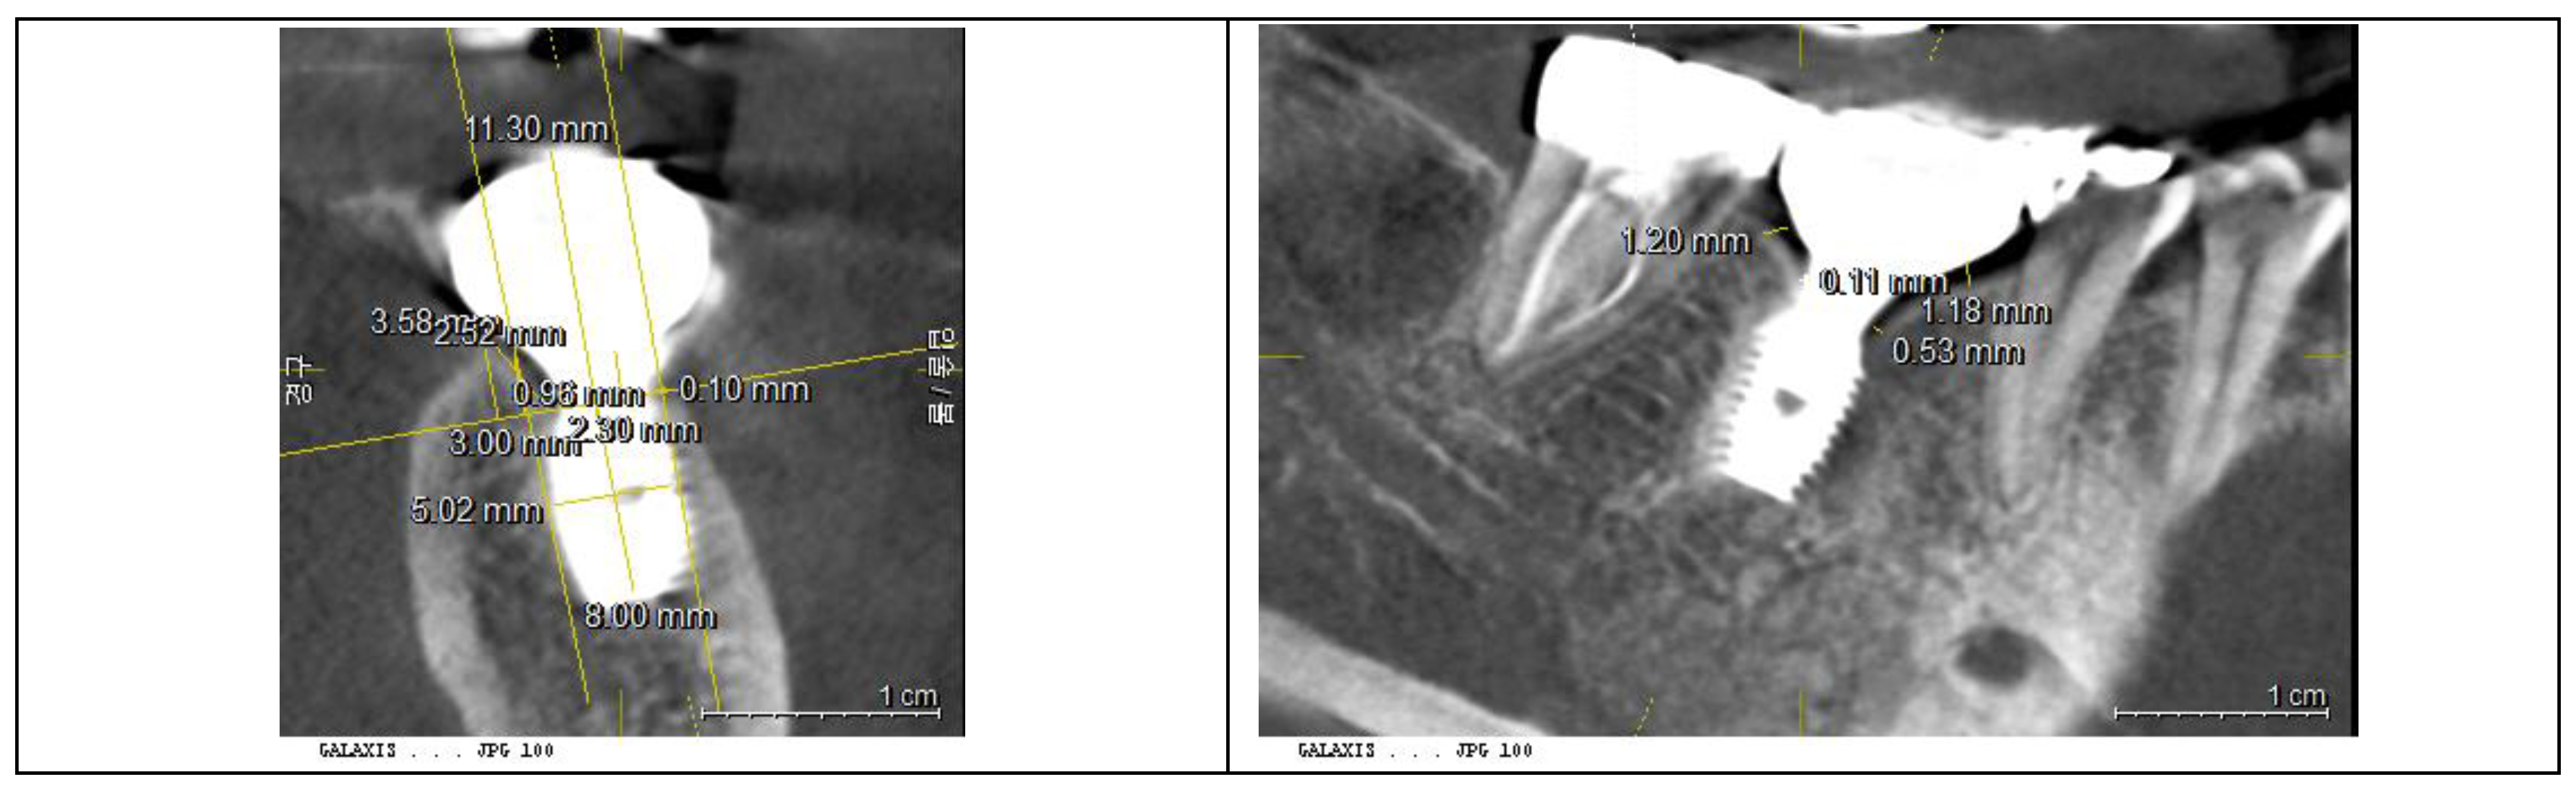
Figure 6.
Measurement of Placement Depth (PD) using CBCT. PD is determined as the perpendicular distance from the implant platform to the most coronal point of the crestal bone. Central Placement Depth (cPD) is measured at the implant fixture’s diameter, while Peripheral Placement Depth (pPD) is measured at the crown’s periphery (buccal, lingual, mesial, and distal aspects).
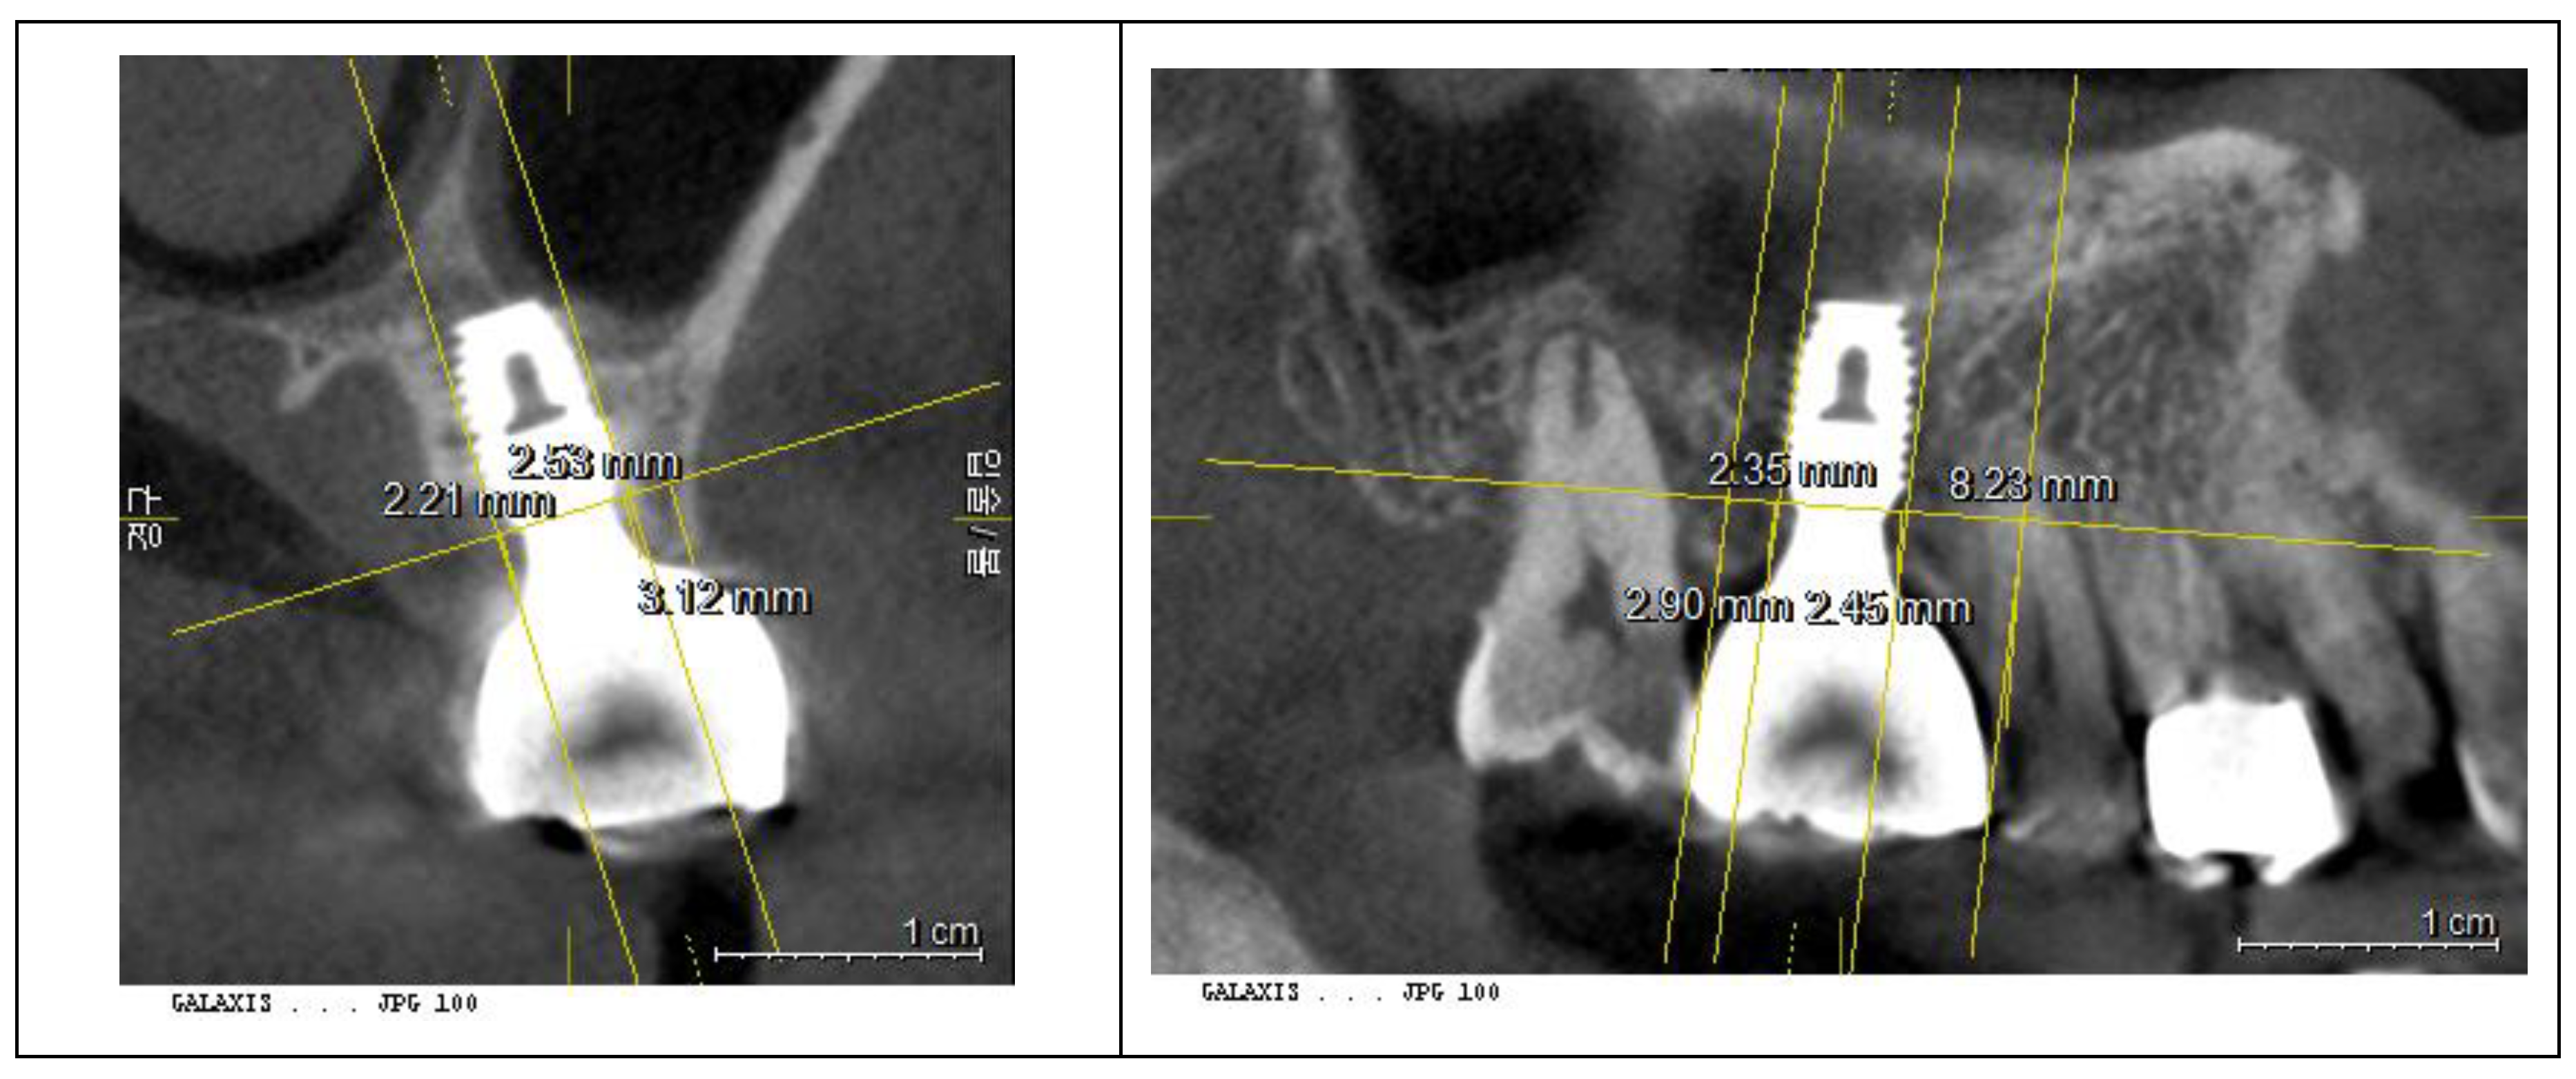
Figure 7.
Measurement of Transitional Zone Length (TZL) using CBCT. TZL is defined as the distance from the implant-abutment junction to the point where the peri-implant soft tissue maintains a thickness of ≥1.0 mm. Measurements are taken at mesial, distal, buccal, and lingual aspects. This radiographic evaluation helps assess the extent of the soft tissue’s transitional zone in three dimensions.
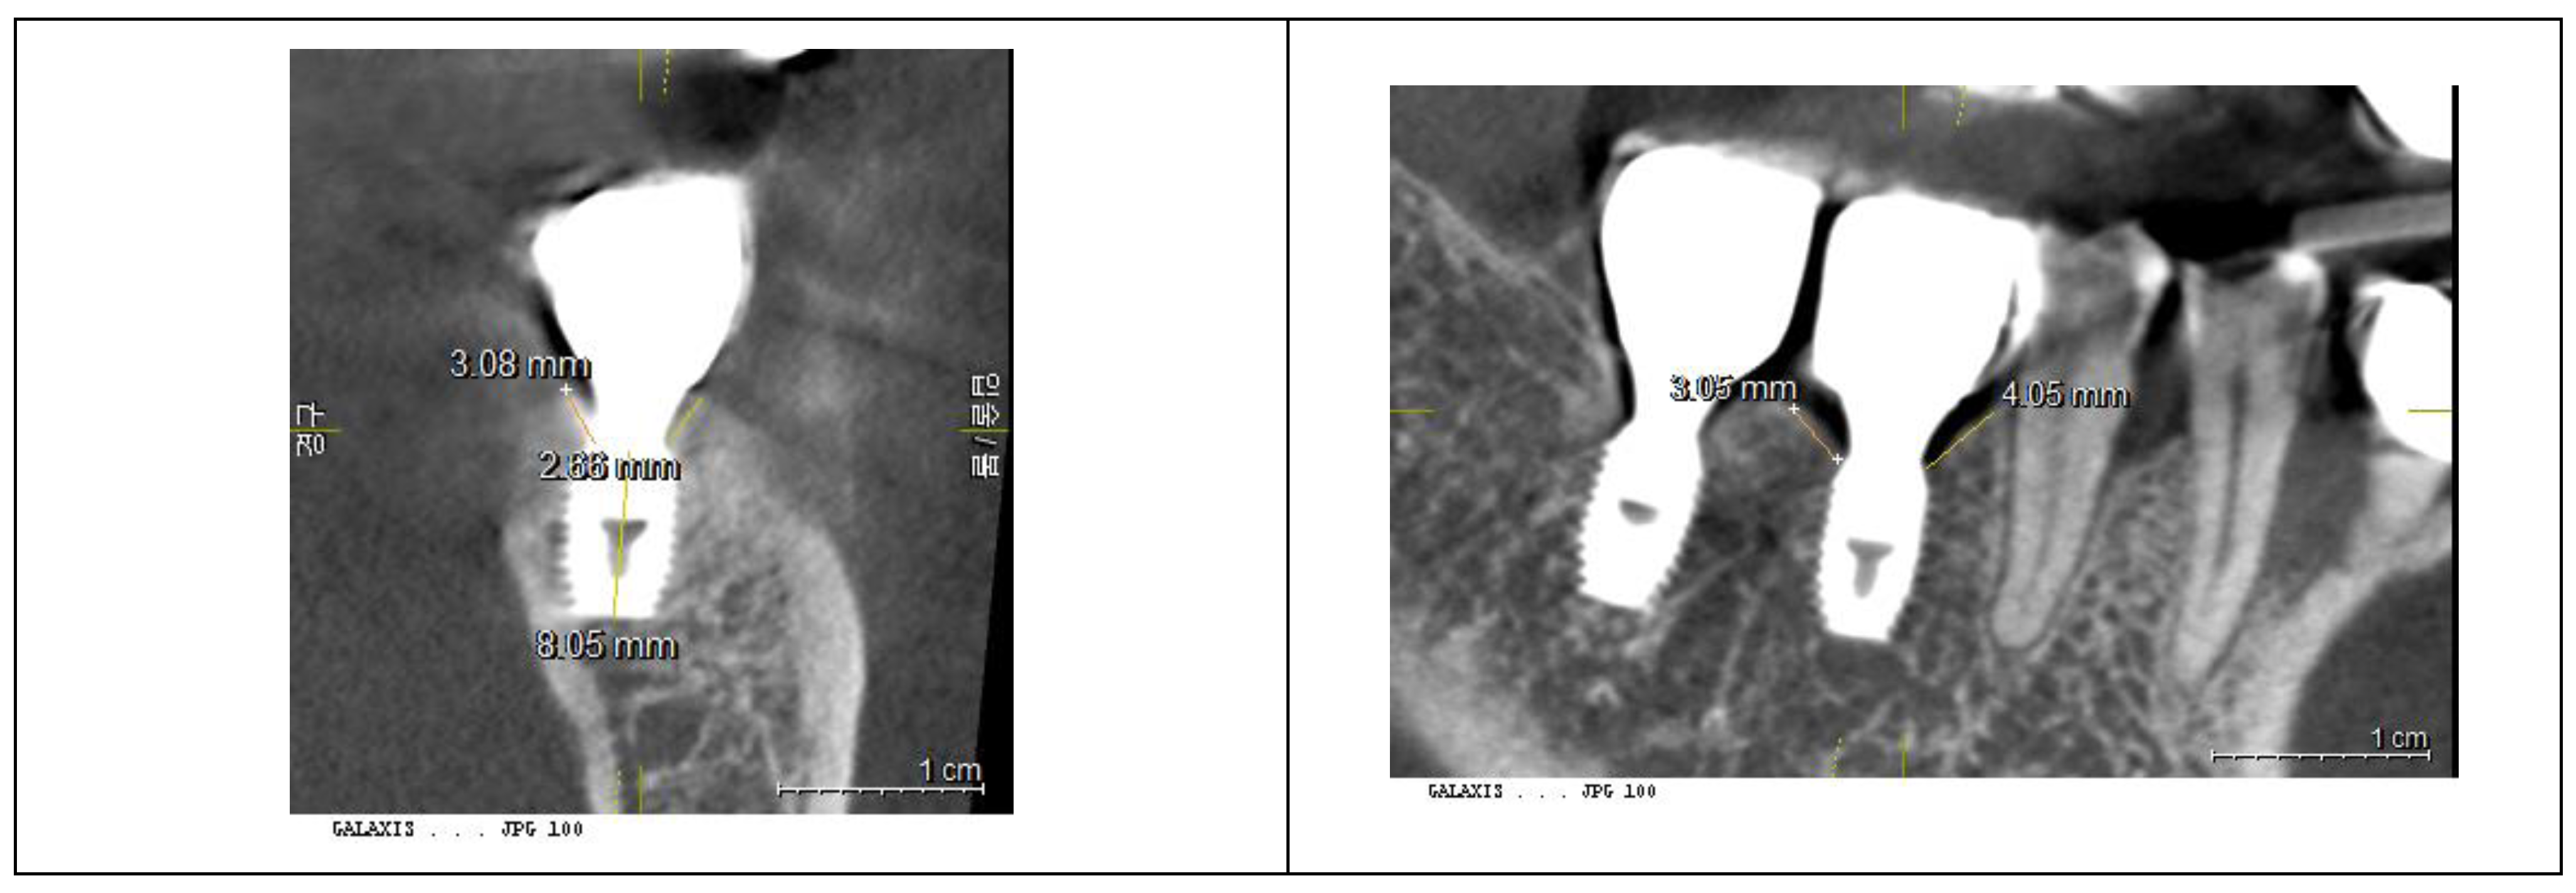
Figure 8.
Measurement of Peripheral Placement Depth (pPD) from Panoramic X-ray. The pPD is defined as the perpendicular distance from the zenith of the crestal bone to the connection point between the abutment and fixture. This measurement is taken using the vertical reference line of the implant fixture at the mesial and distal sites. The purpose of this assessment is to evaluate crestal bone changes over the observation period, providing insights into bone stability around the implant.
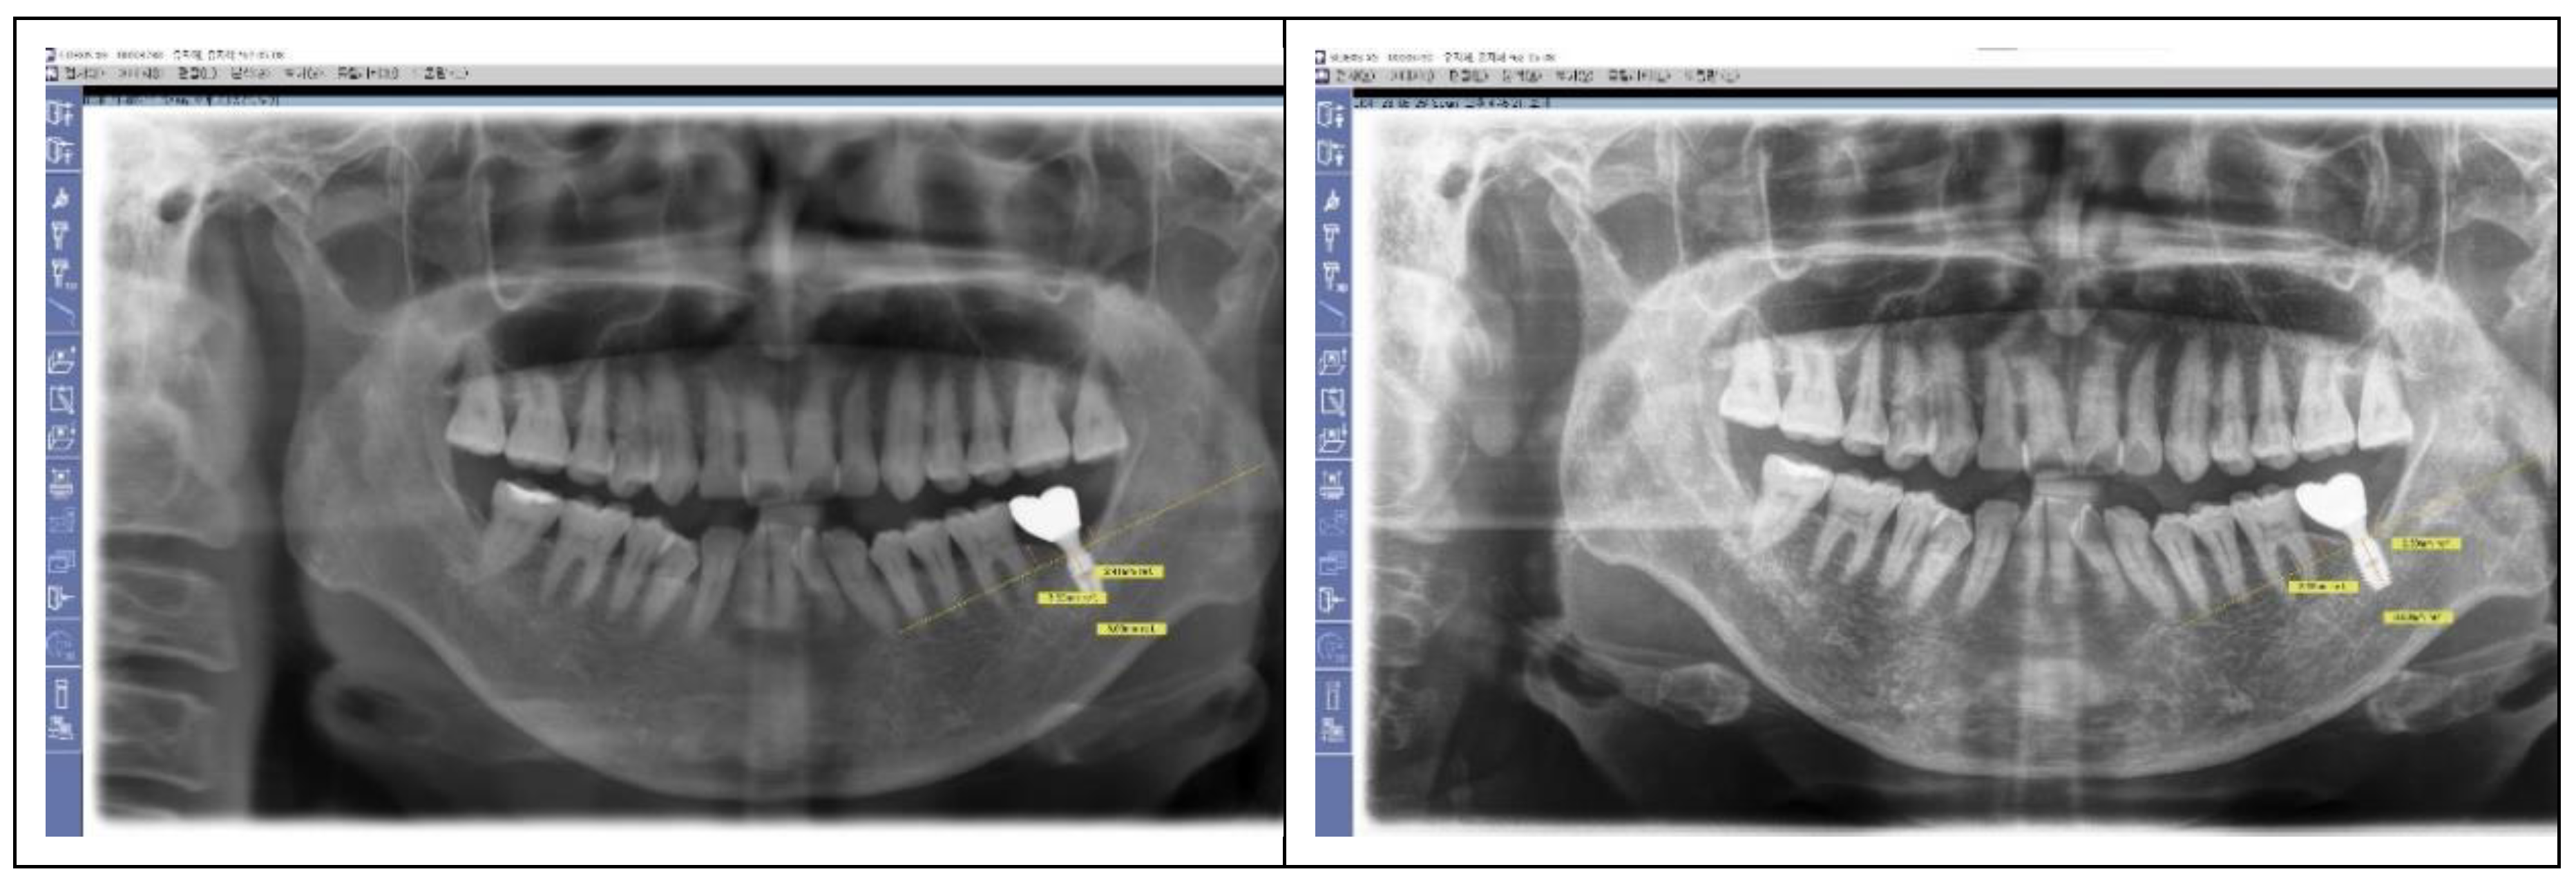
Figure 9.
This diagram illustrates the average results of key parameters across mesial, distal, buccal, and lingual sites, specifically: cPD (Central Placement Depth); pPD (Peripheral Placement Depth); cSTT (Central Soft Tissue Thickness); pSTT (Peripheral Soft Tissue Thickness); TZL (Transitional Zone Length); rSTT (Reference Soft Tissue Thickness).
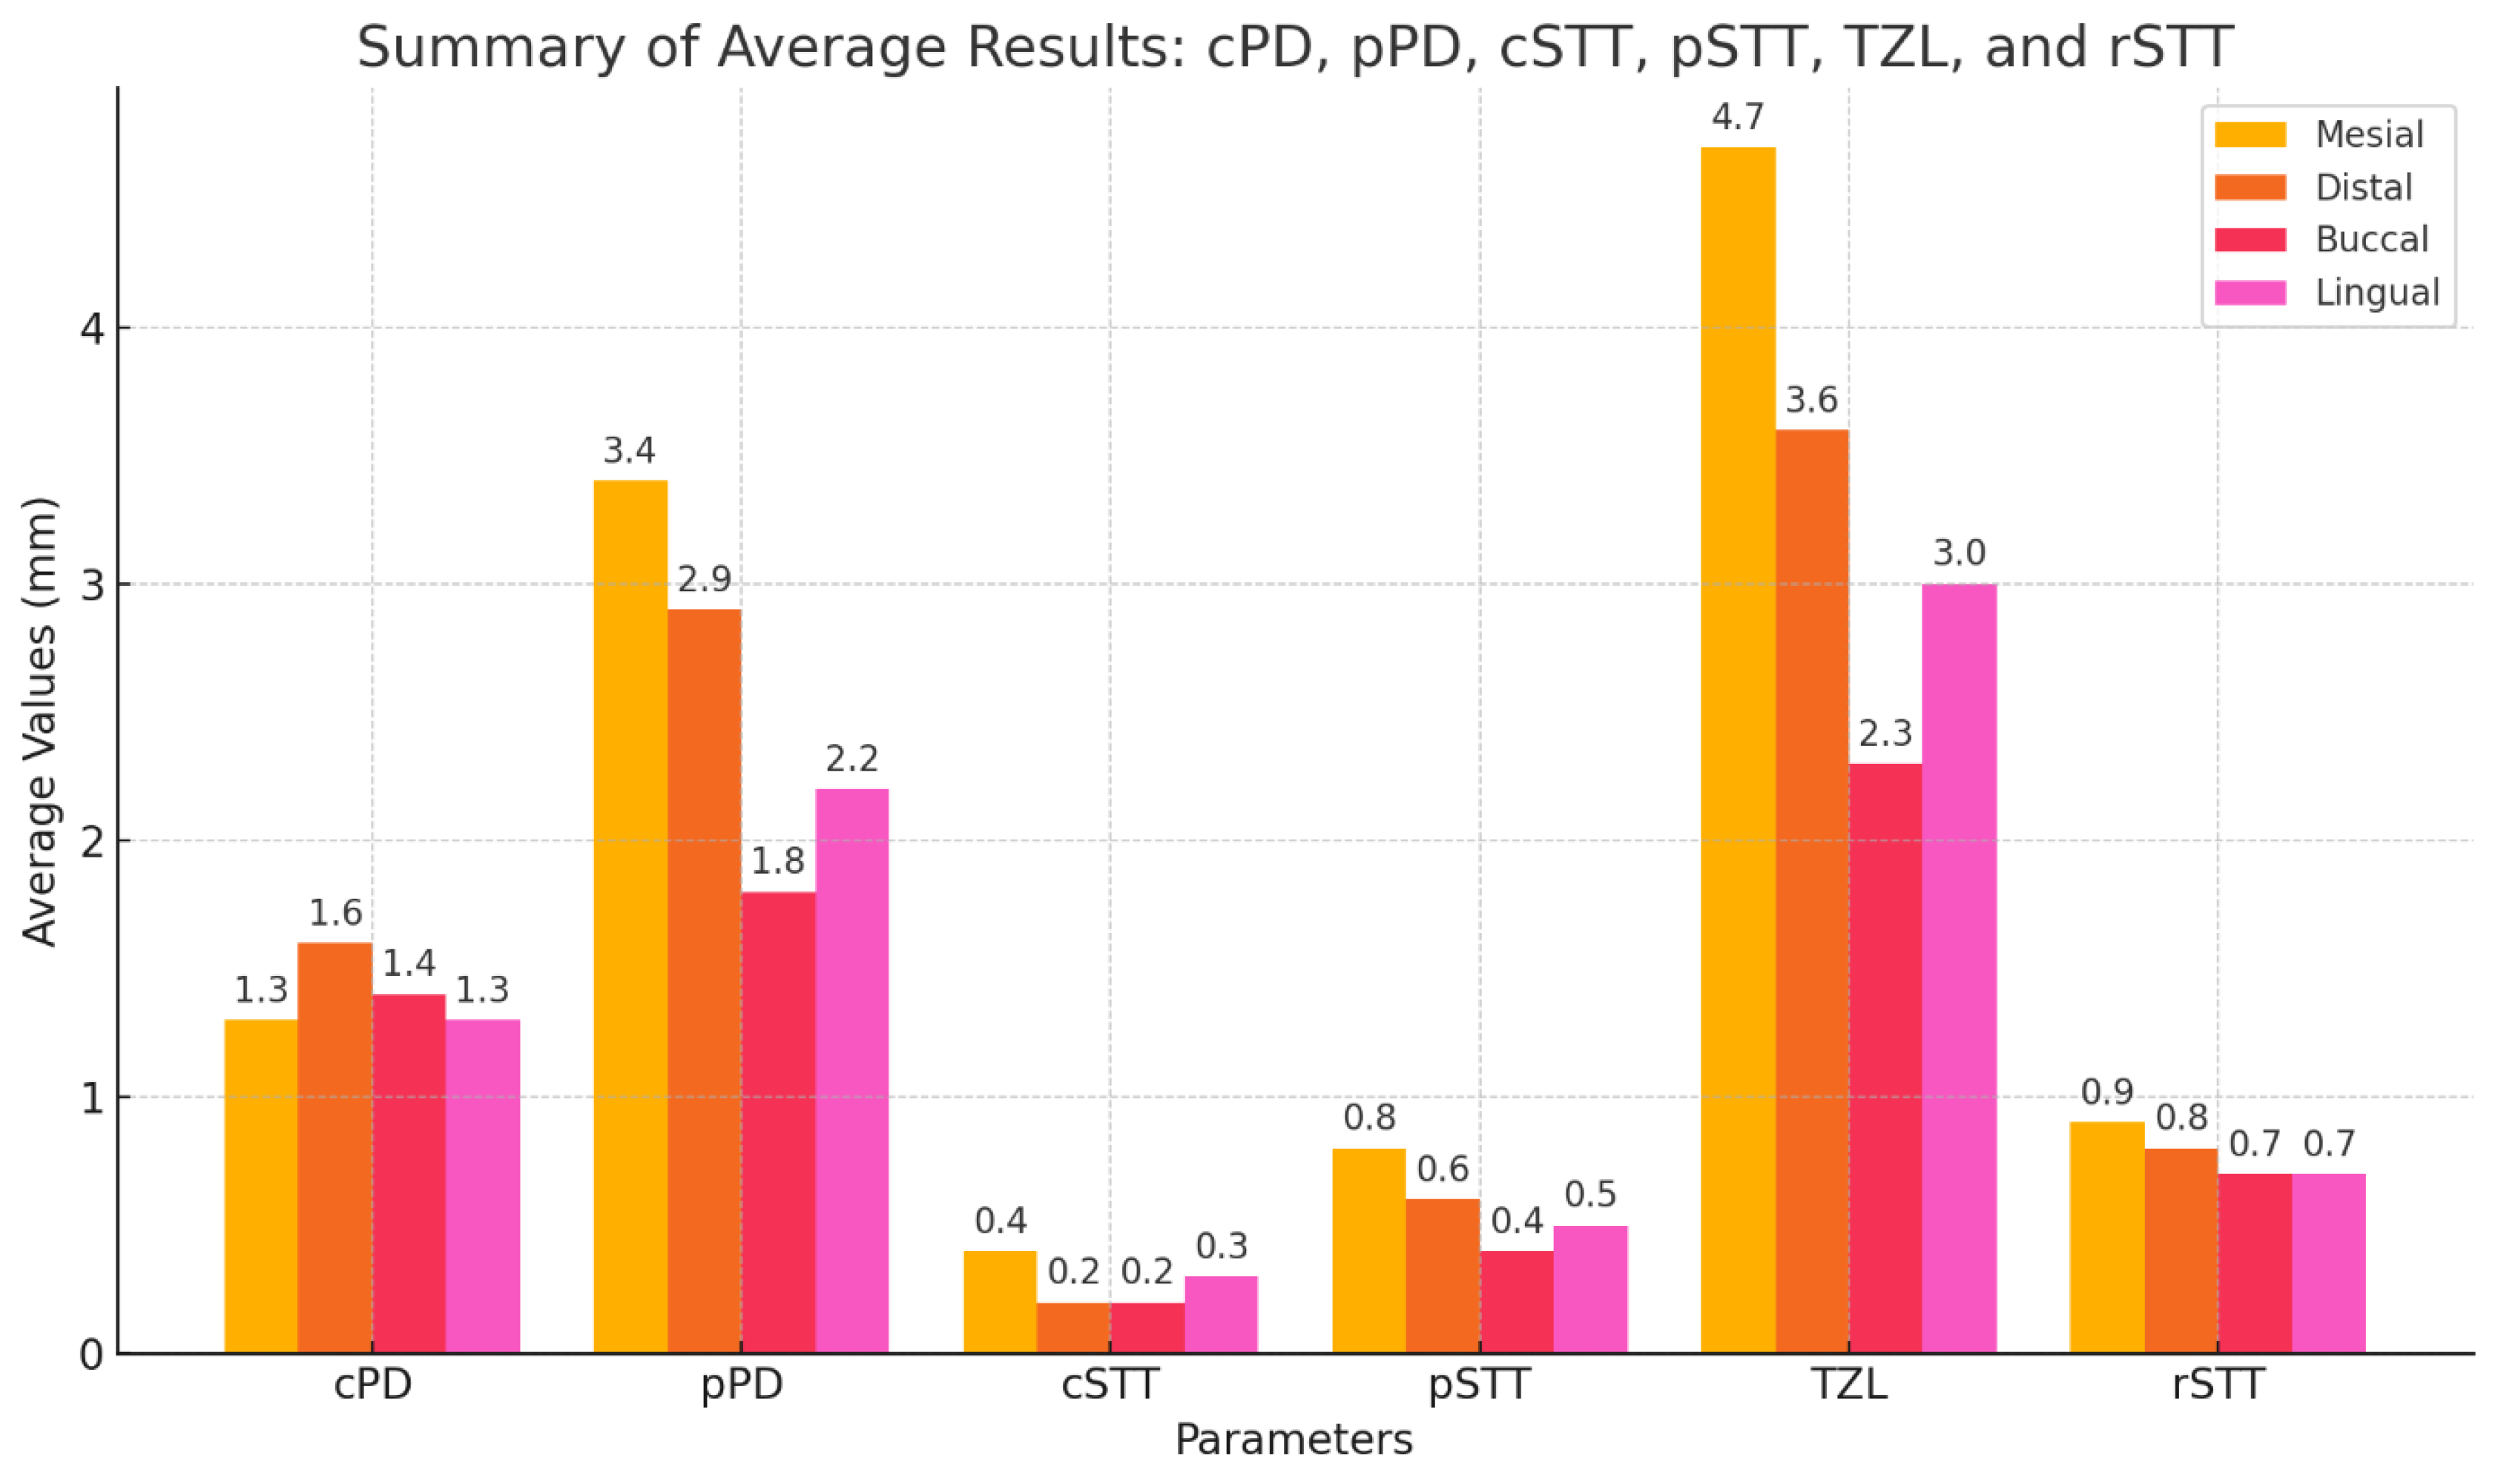
Figure 10.
The panoramic view X ray taken at 2023 shows the stable results of the both lower 1st implants which were placed at 2012. (SPI with IPS design implants - Bicon).
Figure 10.
The panoramic view X ray taken at 2023 shows the stable results of the both lower 1st implants which were placed at 2012. (SPI with IPS design implants - Bicon).
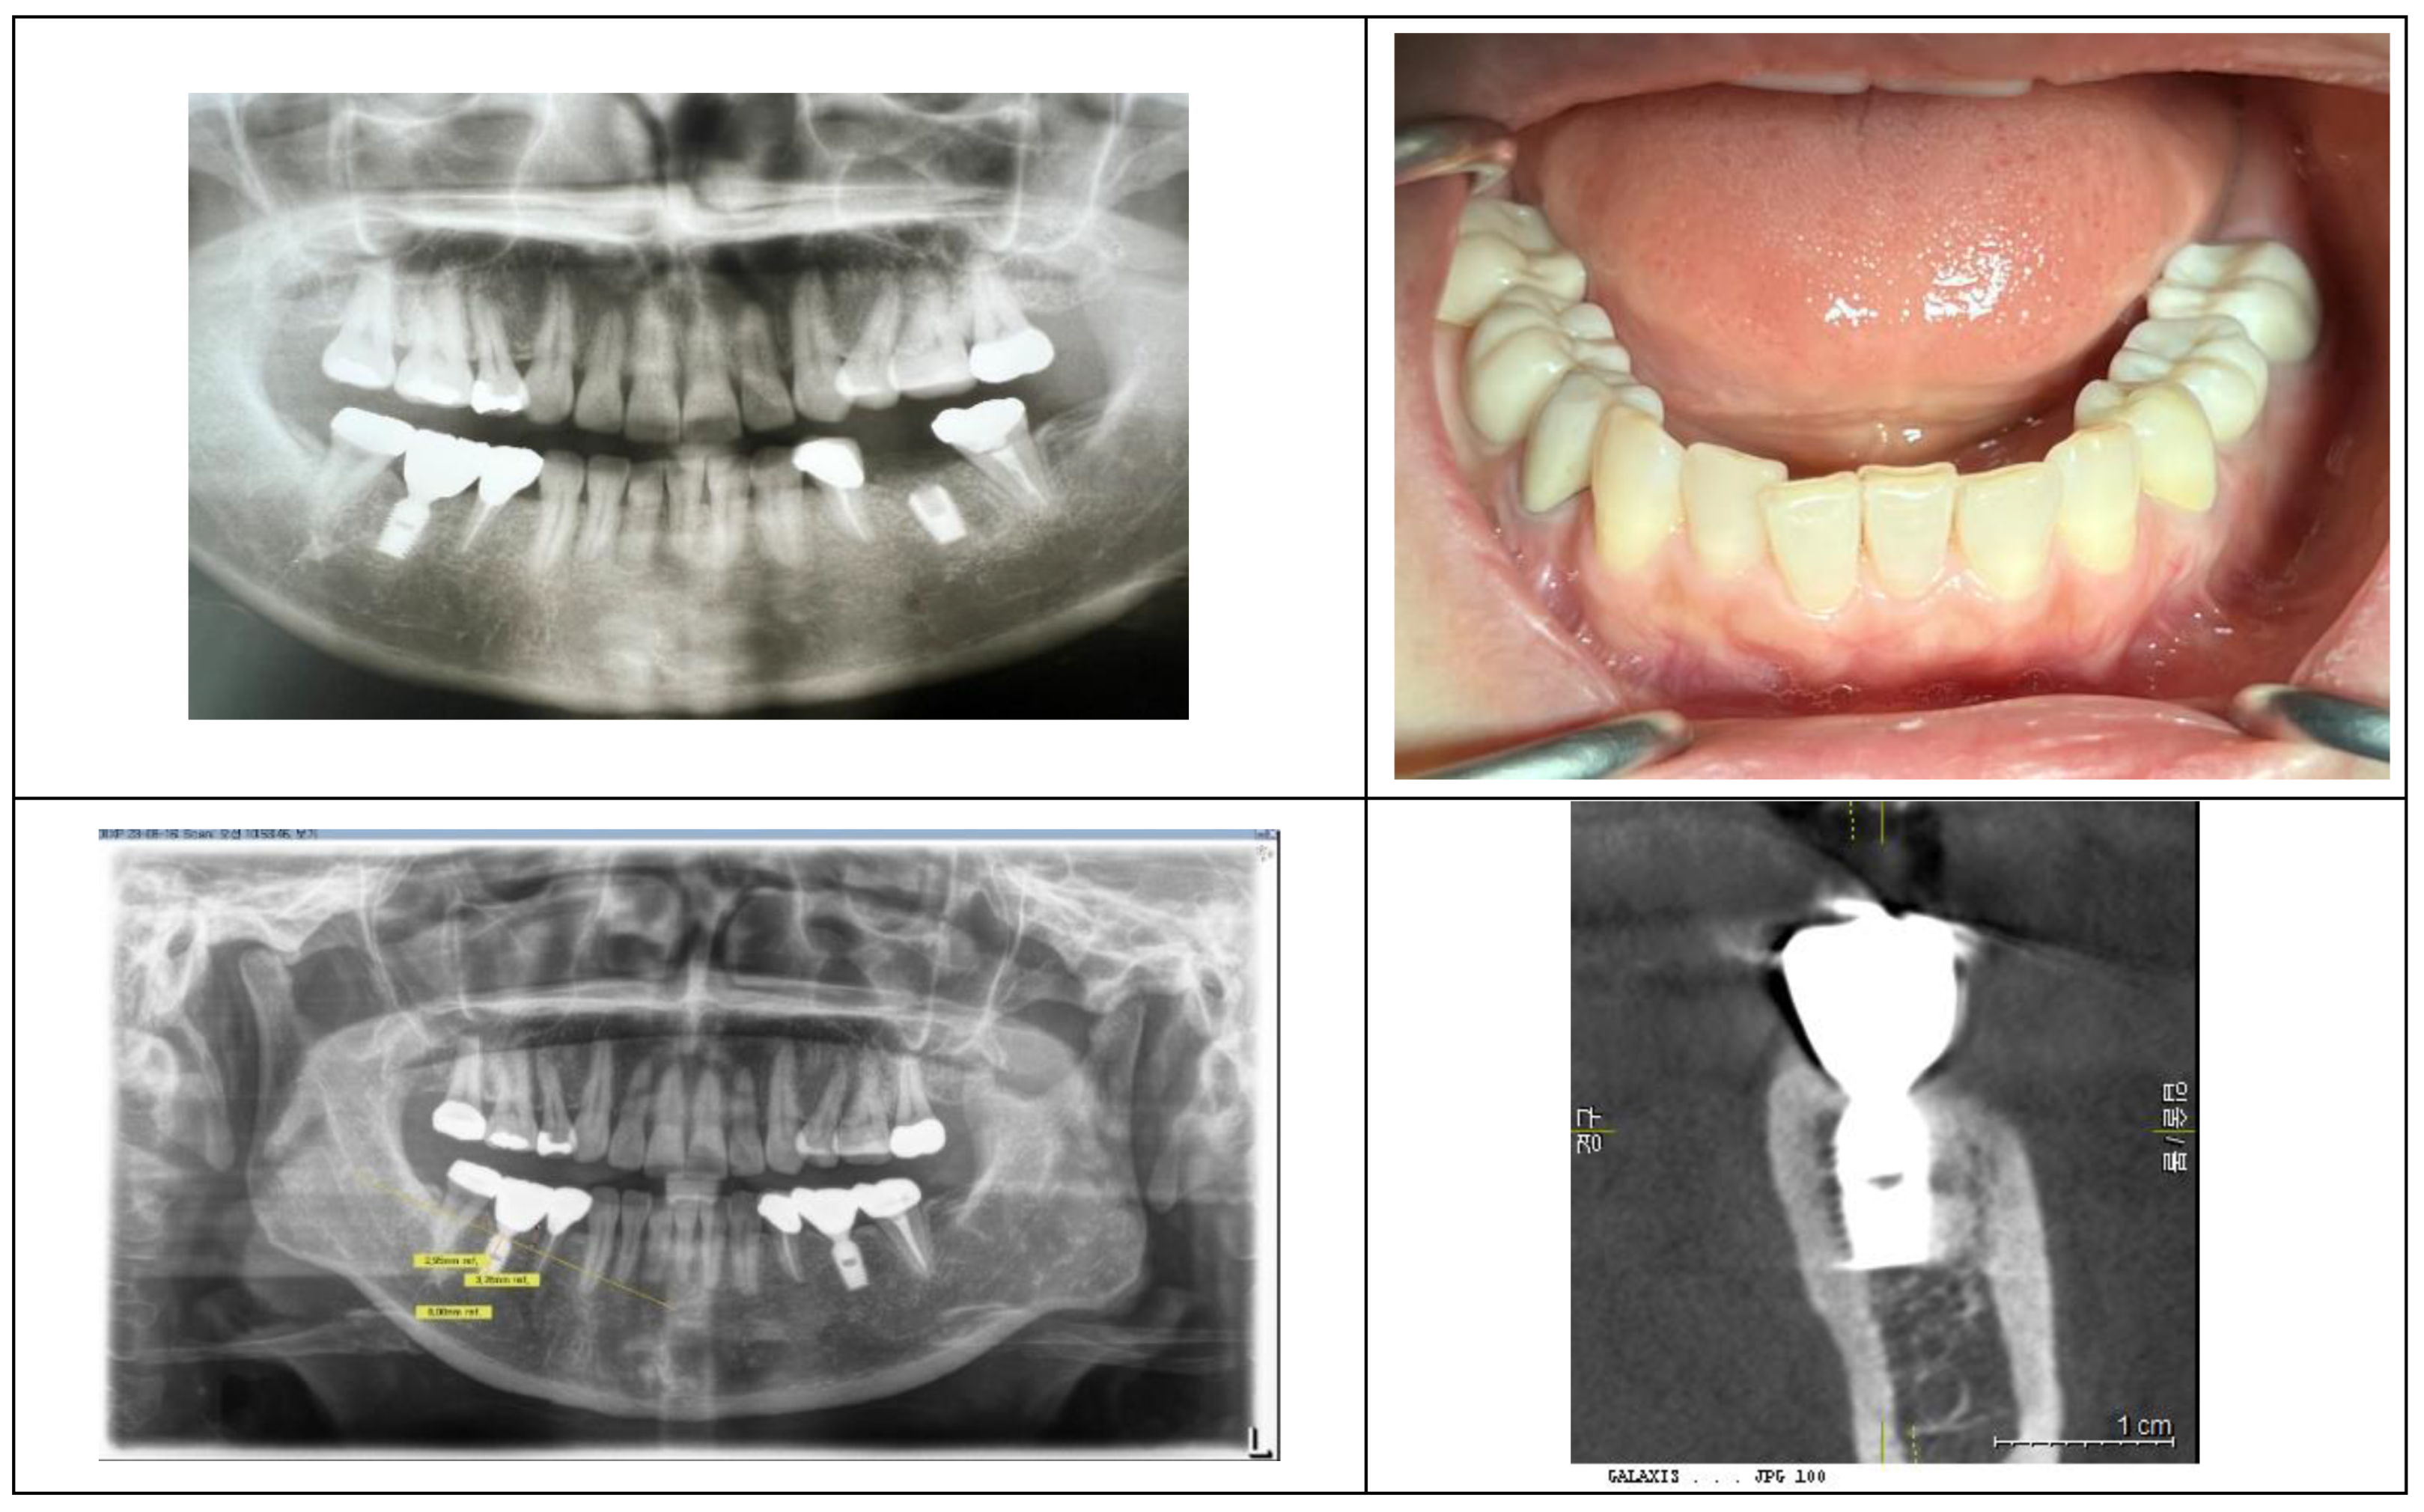
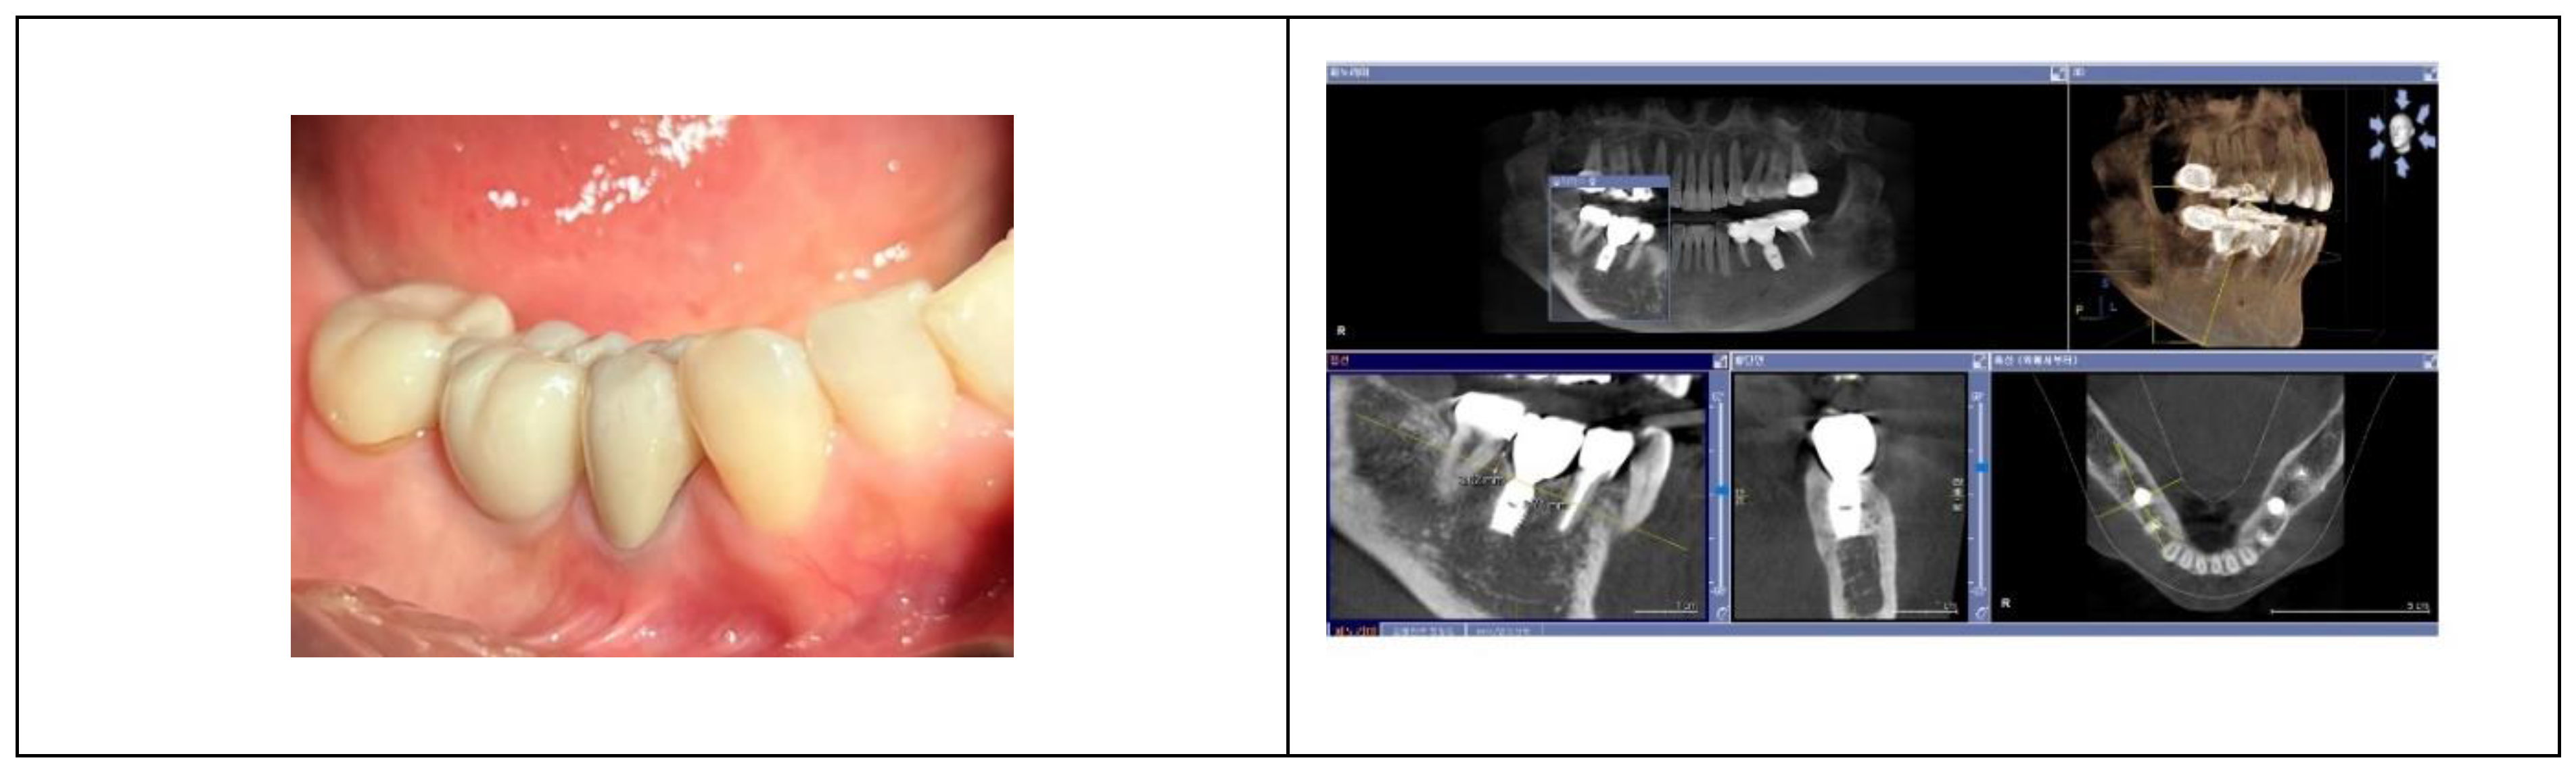
Figure 11.
To achieve a natural-looking appearance, the emerging phenomenon (coronal flaring) must be carefully considered.
Figure 11.
To achieve a natural-looking appearance, the emerging phenomenon (coronal flaring) must be carefully considered.
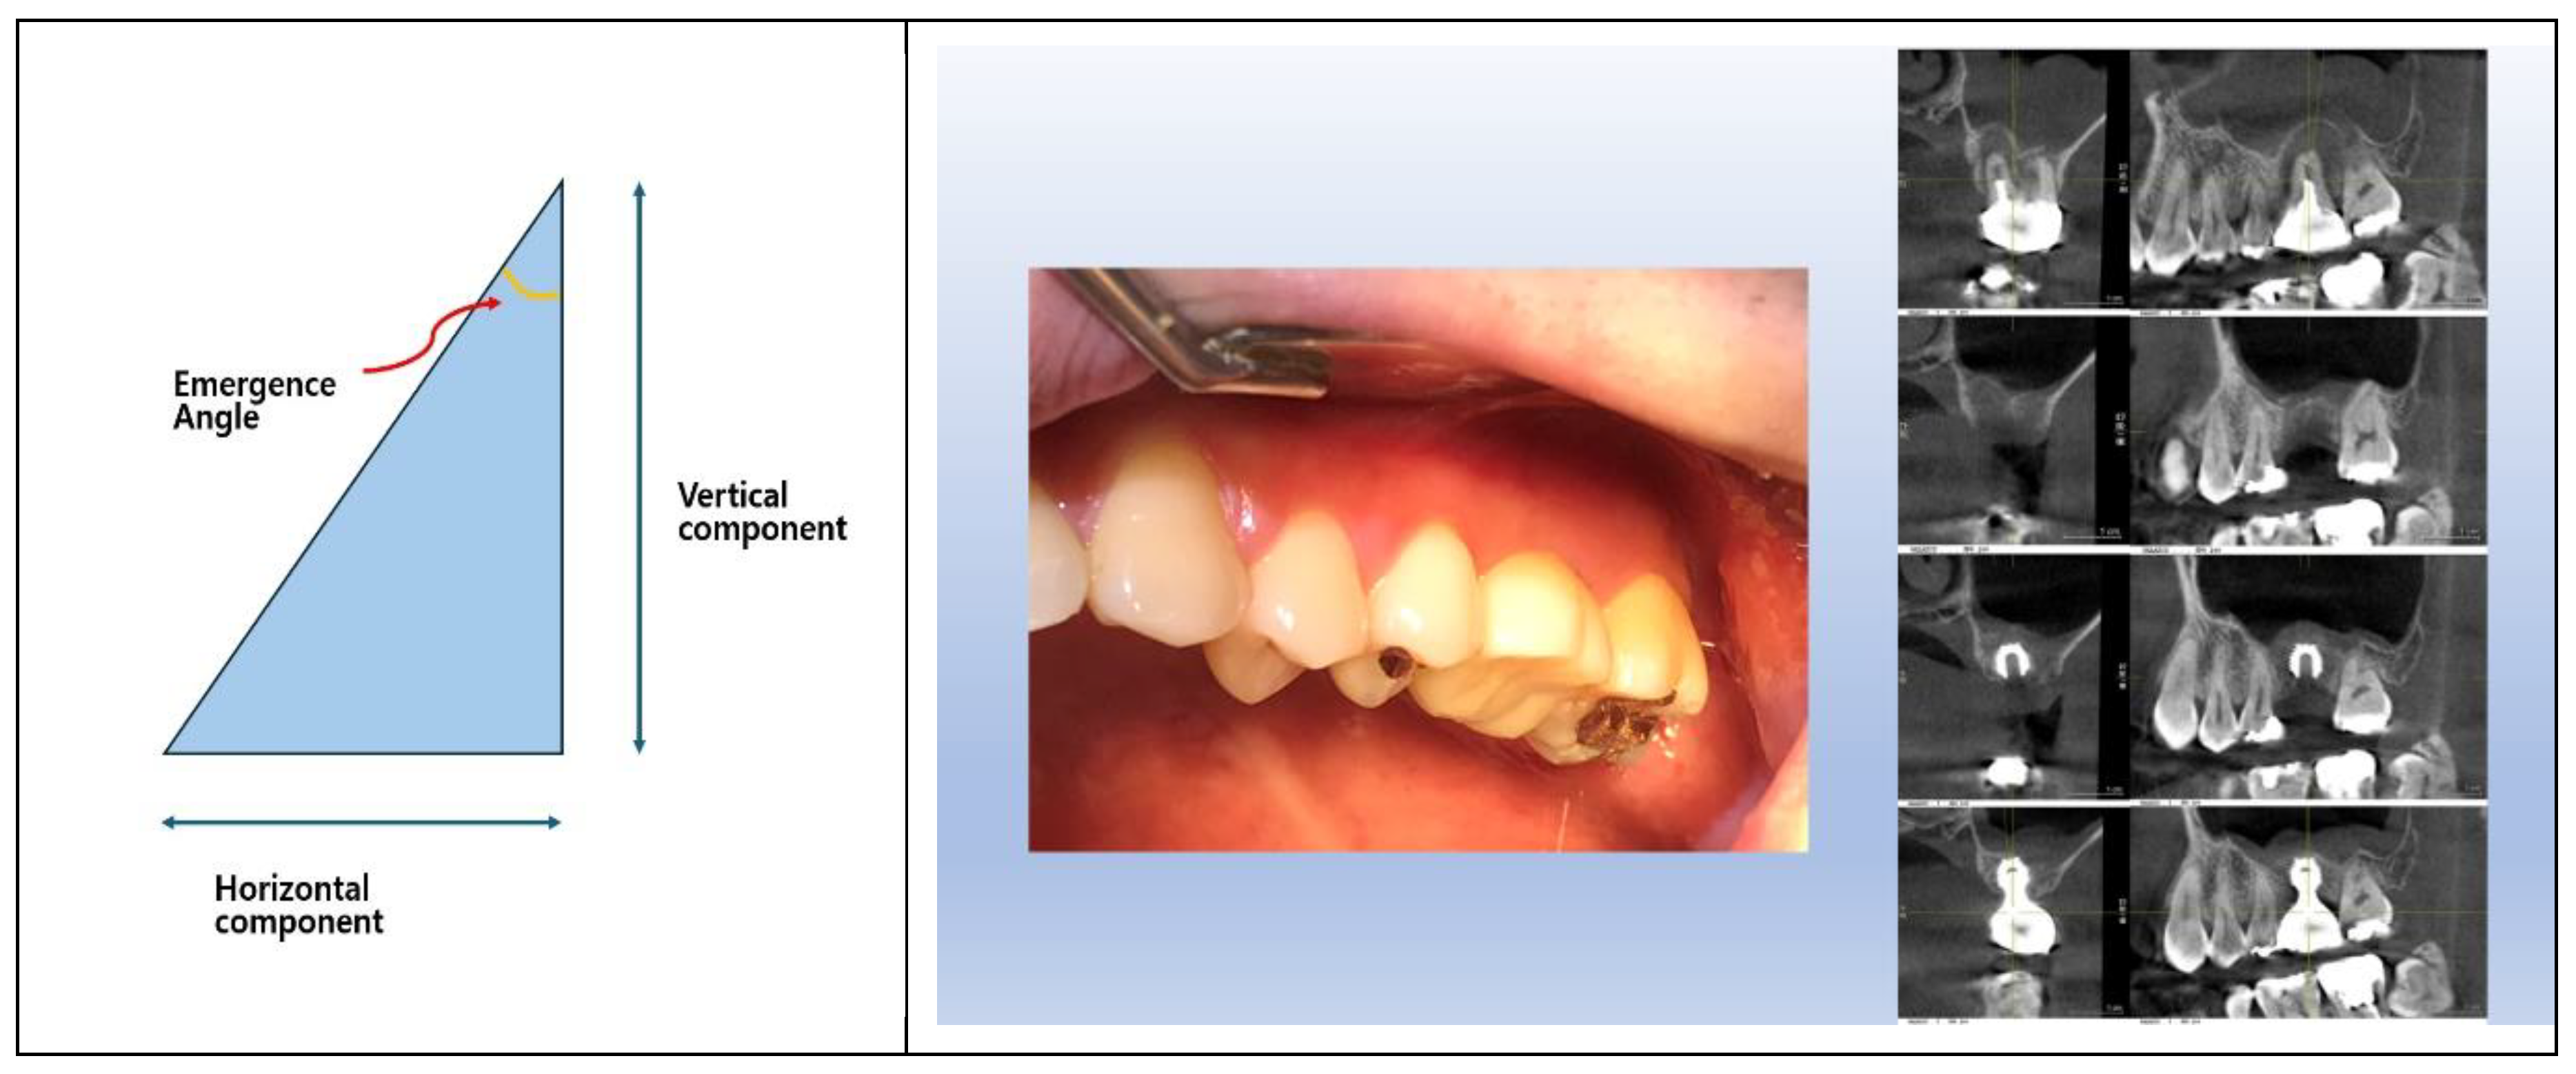
Figure 12.
Schematic drawing to differentiate the submucosal soft tissue into 3 zones 1) sulcular area 2) transitional zone 3) subcrestal zone.
Figure 12.
Schematic drawing to differentiate the submucosal soft tissue into 3 zones 1) sulcular area 2) transitional zone 3) subcrestal zone.
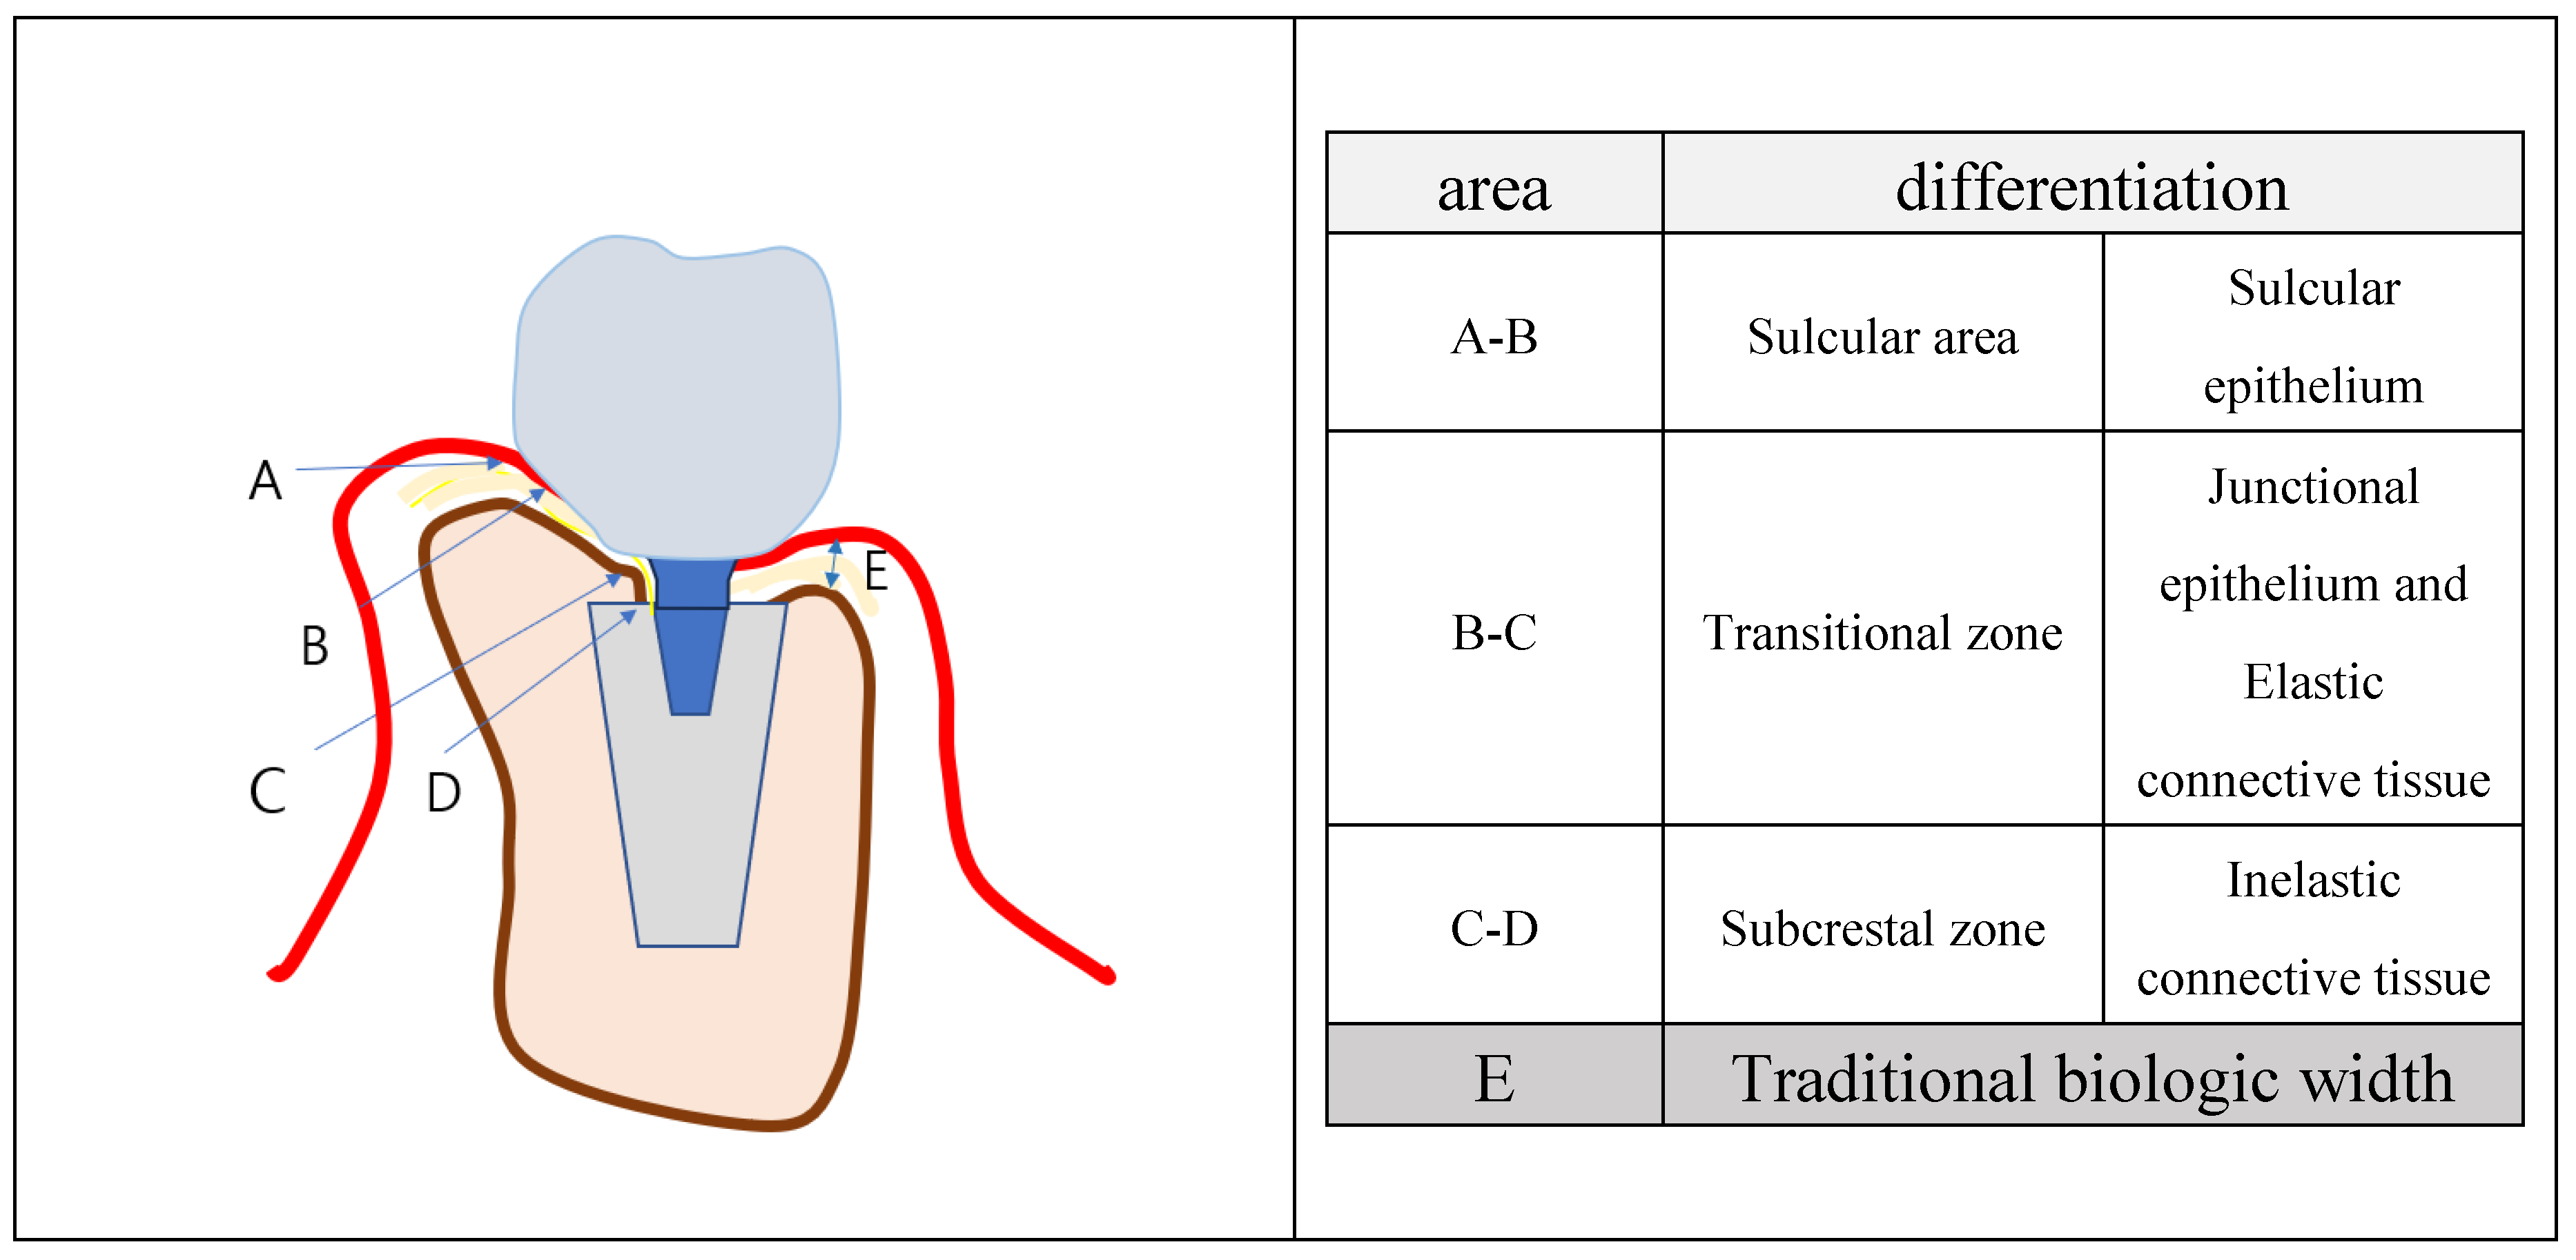
Figure 13.
Although the plain X-ray image shows that the implant was placed subcrestally, the CBCT image reveals that the fixture was placed epi-crestally in the buccolingual aspect.
Figure 13.
Although the plain X-ray image shows that the implant was placed subcrestally, the CBCT image reveals that the fixture was placed epi-crestally in the buccolingual aspect.
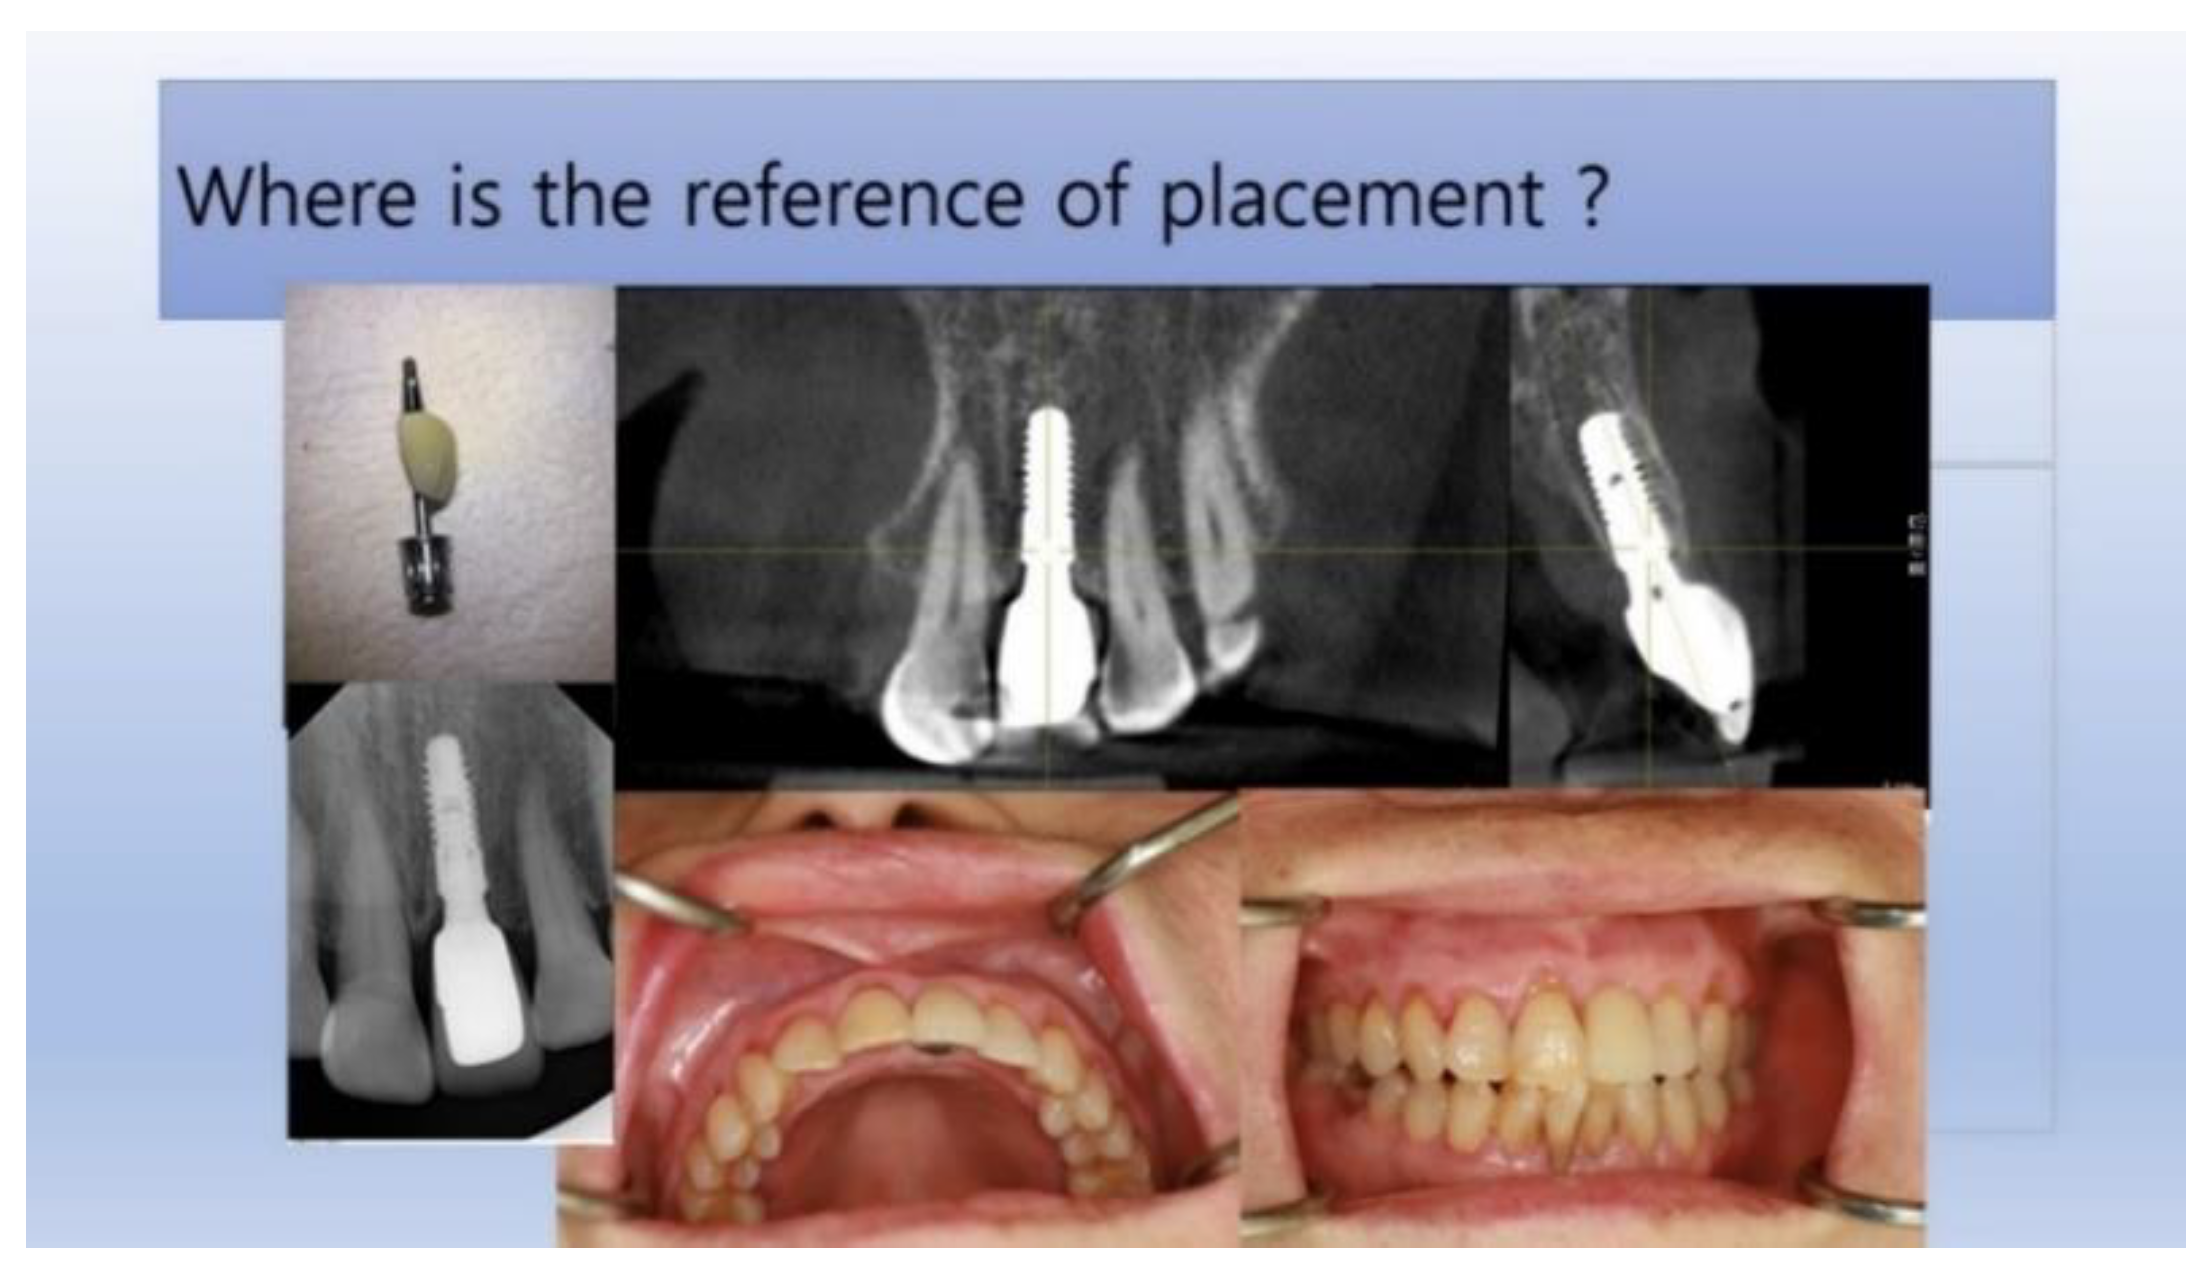
Figure 14.
Clinical pictures of the peri-implant soft tissue showing the junctional epithelium and connective tissue (the biologic width) after removing or before setting the prosthetic part of implants. The SPIs have a larger area of transmucosal soft tissue than in cases of epi- or equi-crestal placements. In the right picture, three distinct layers can be distinguished – the subcrestal zone, the TZ, and the sulcular area, where the pale pink color is similar to the adjacent oral epithelium.
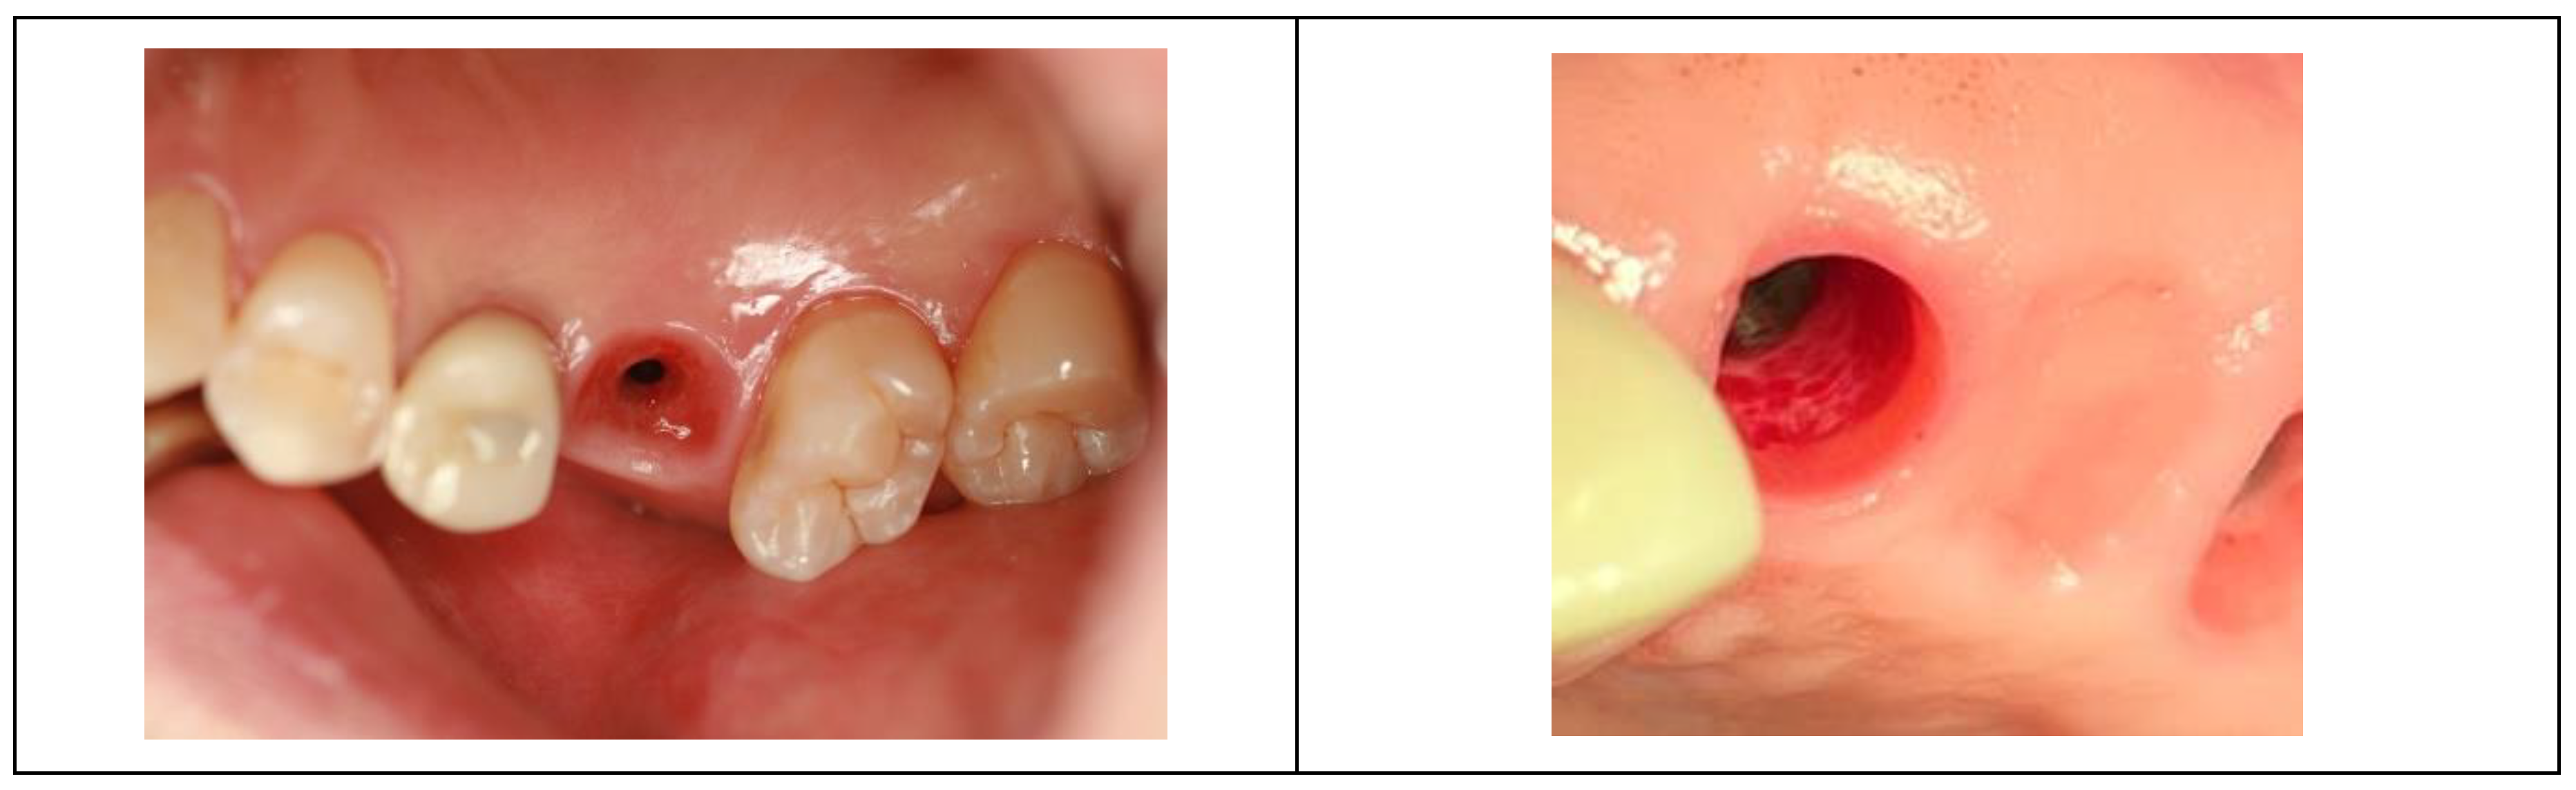
Figure 15.
IPPP, tested to have a yield strength within 0.25 to 0.35 N, is used to probe the sulcus depth around implants. The paper points penetrate into the sulcus of implants with peri-implantitis without resistance, showing blood wetting when withdrawn. On the other hand, the paper points cannot penetrate the healthy sulcus despite the long soft tissue area.
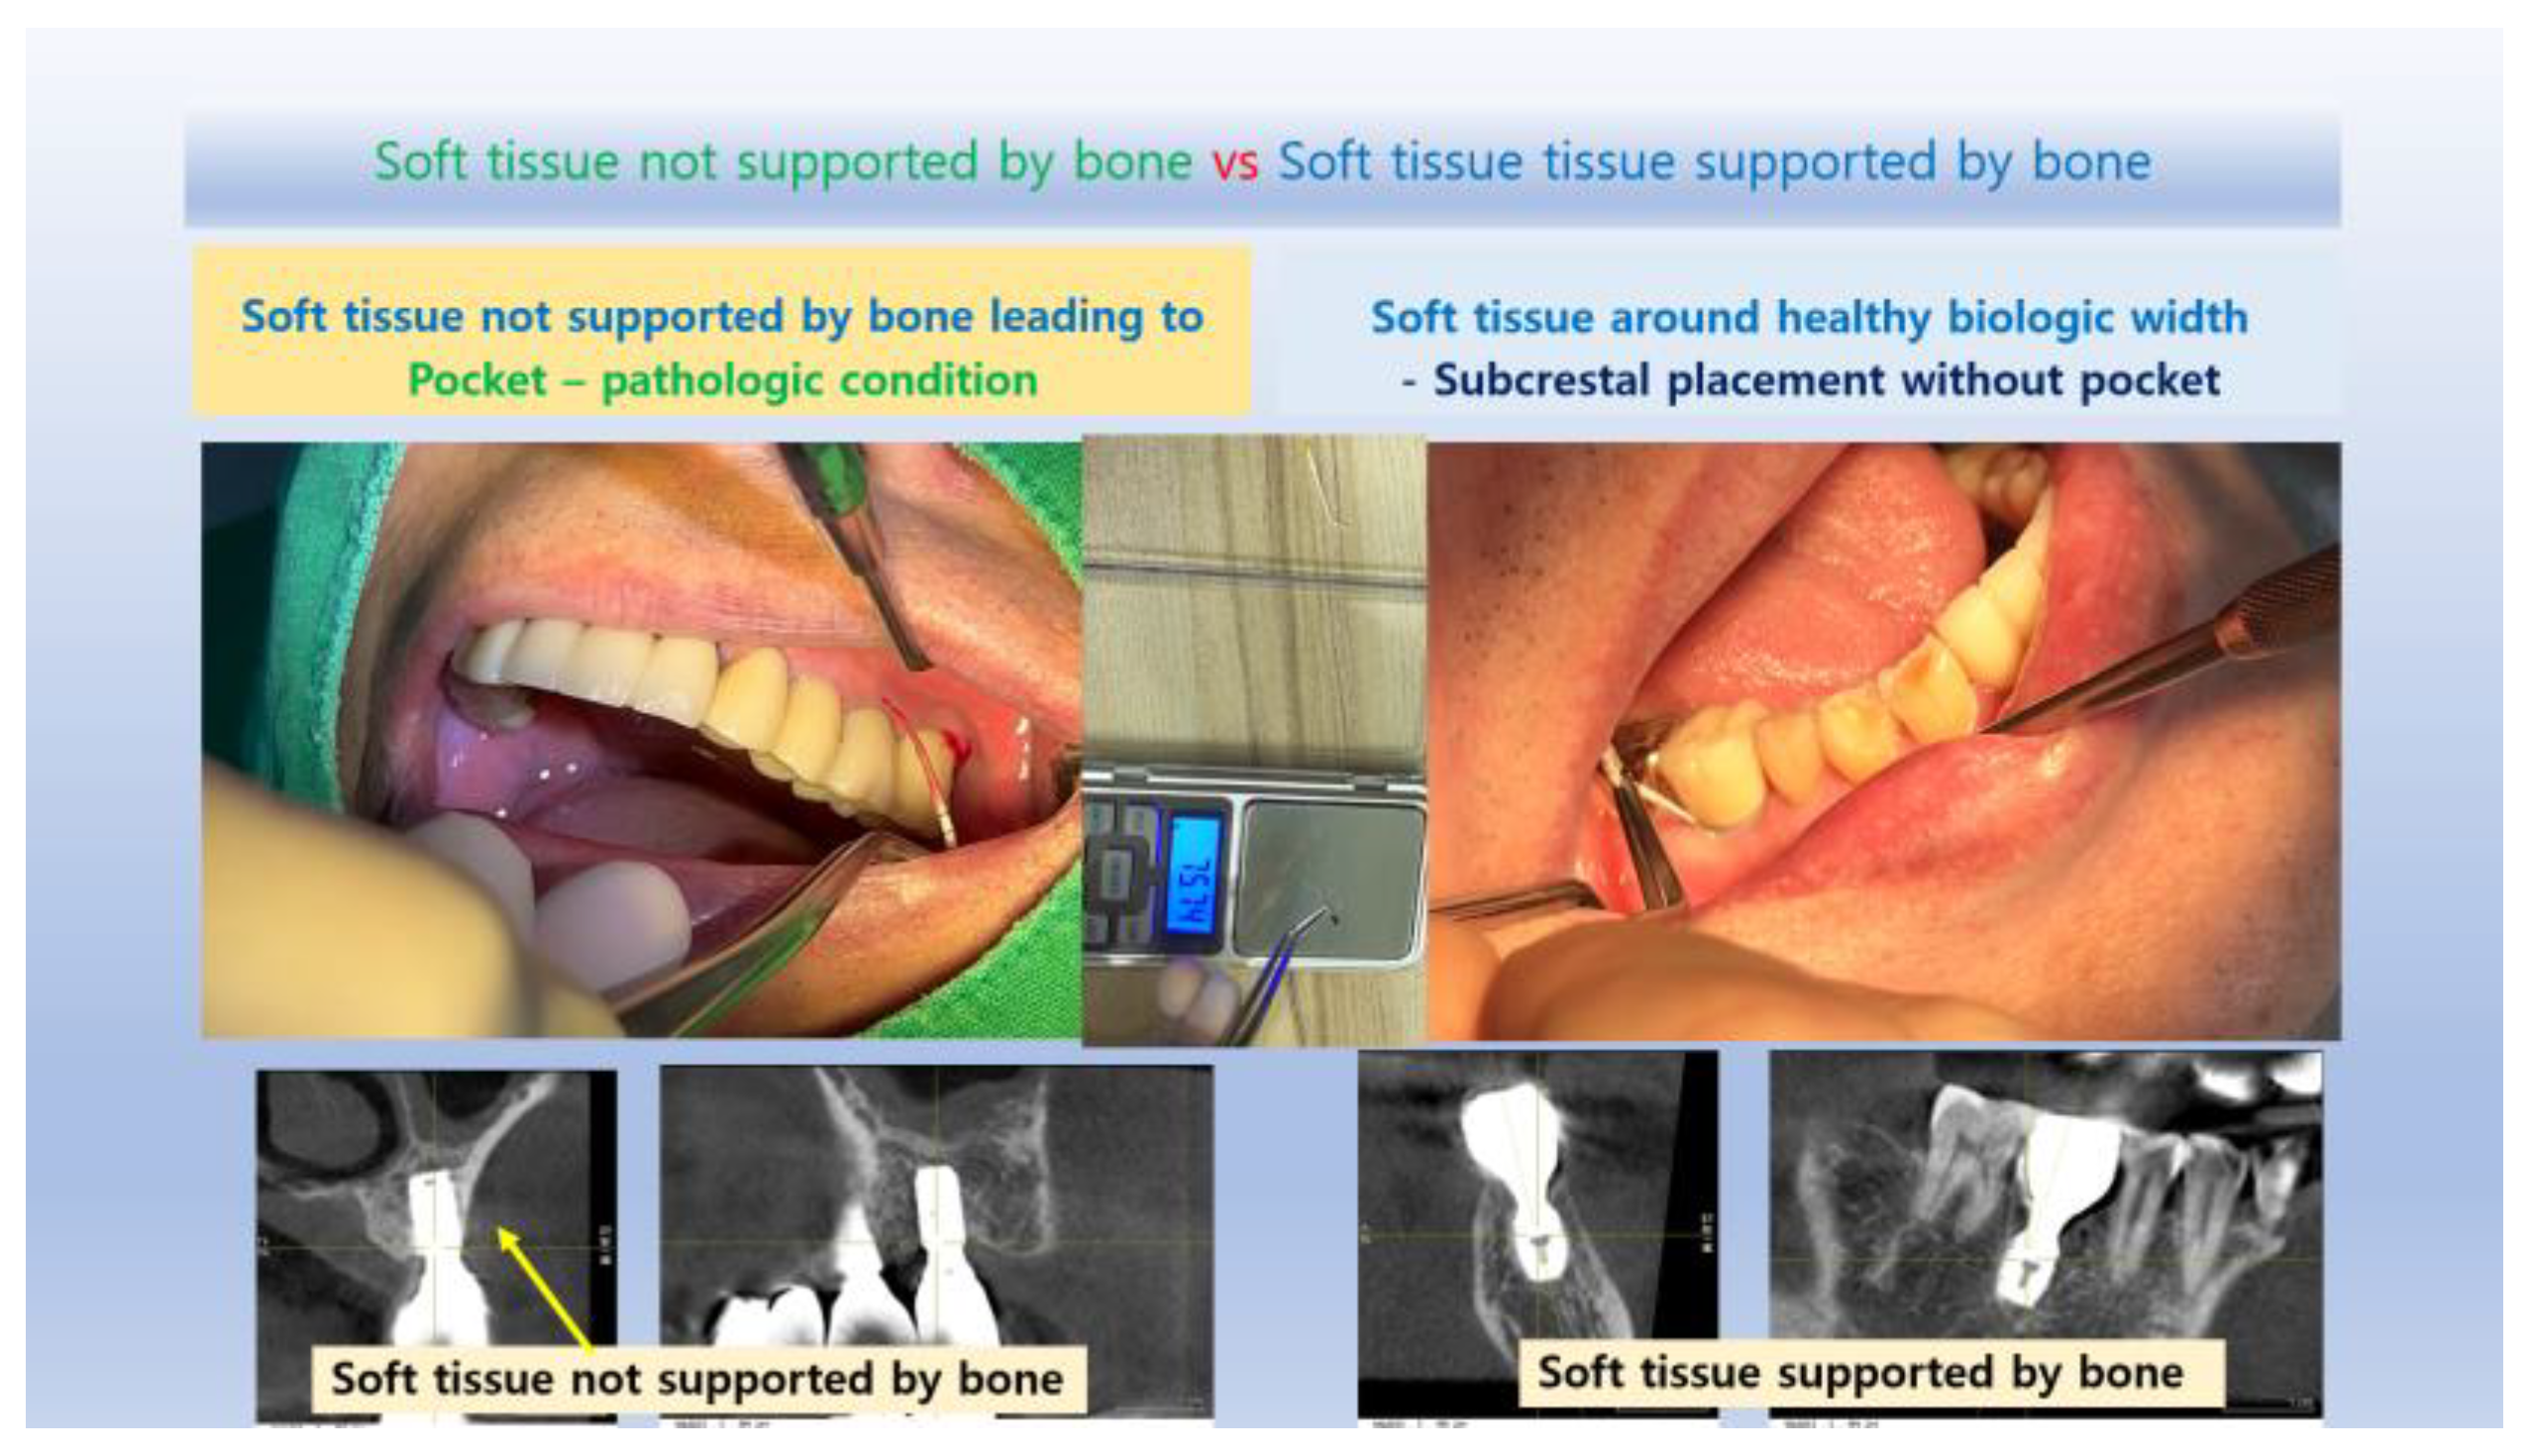
Figure 16.
The upper X-ray images and clinical photographs illustrate the procedural steps of matching ready-made abutments with subcrestally placed healing abutments. The lower images distinctly showcase the Transitional Zone (TZ) and Subcrestal Zone (SZ). The TZ appears pink and elastic, while the SZ is paler and less elastic, highlighting their distinct structural and functional characteristics.
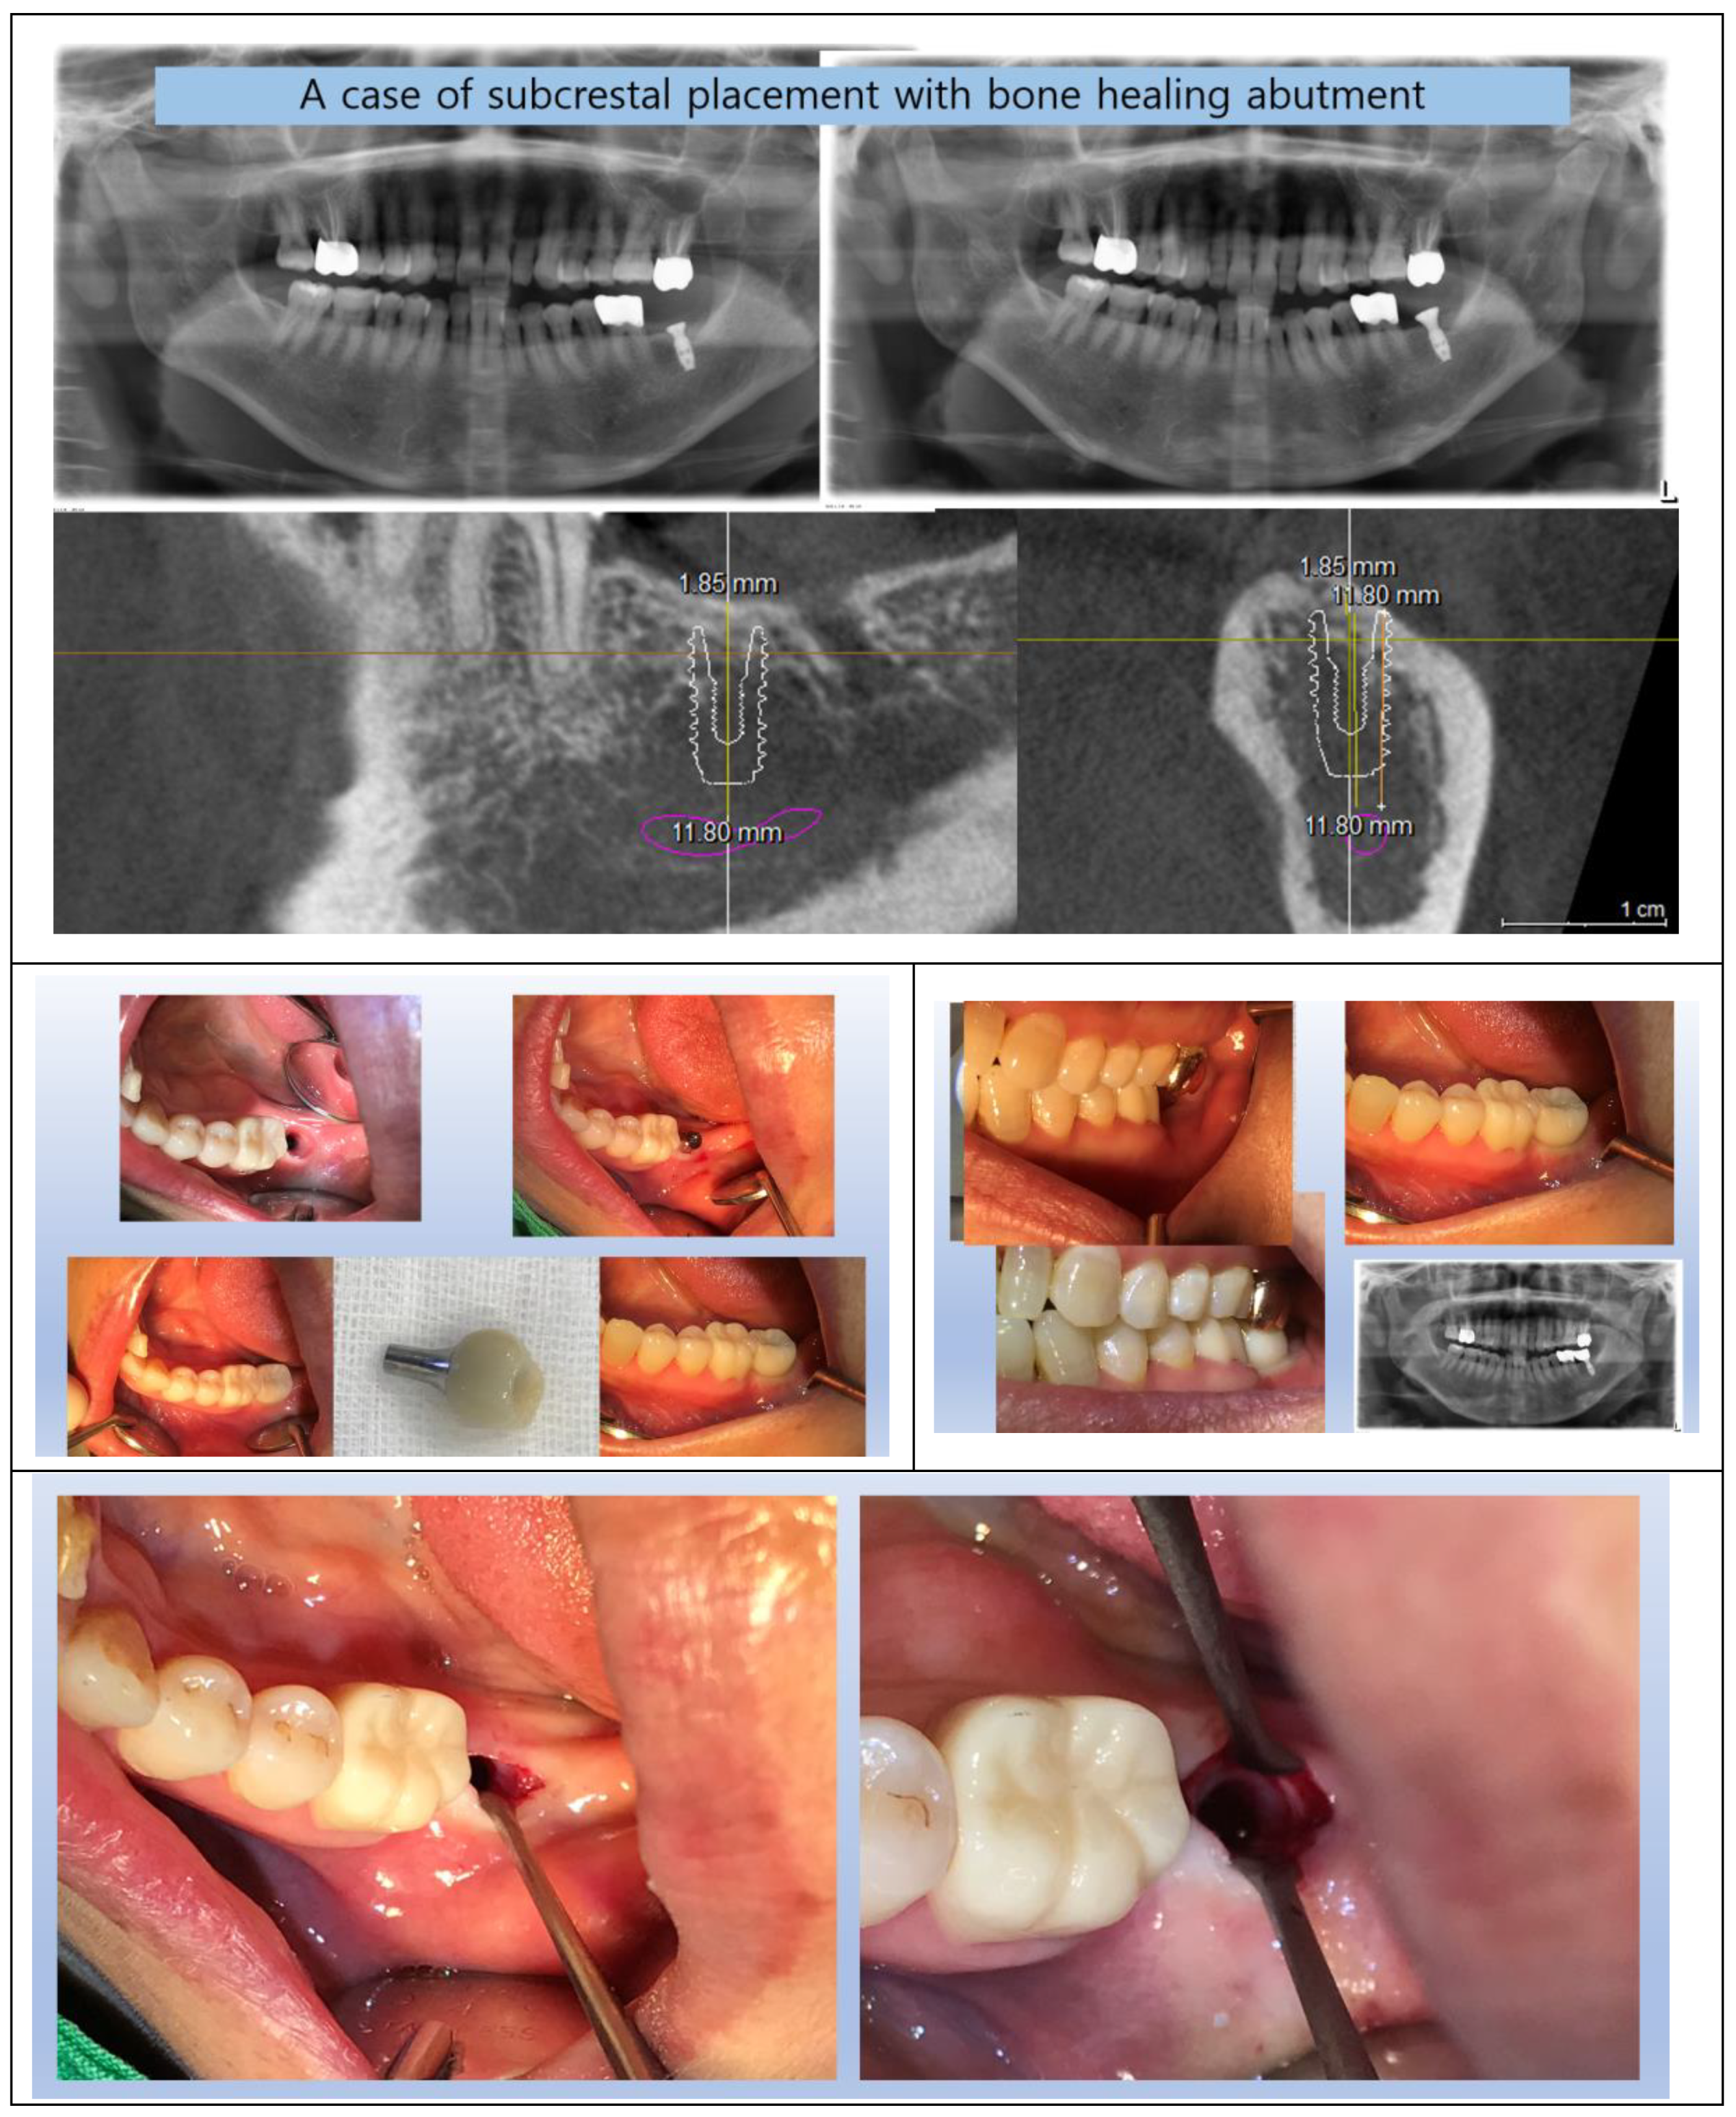
Figure 17.
Using the SPI technique, the results closely mimic the appearance of natural teeth. These clinical pictures clearly show the demarcation between the oral epithelium and the underlying connective tissue (likely representing the TZ). The junctional epithelium lies between these two layers but is difficult to distinguish without histological magnification.
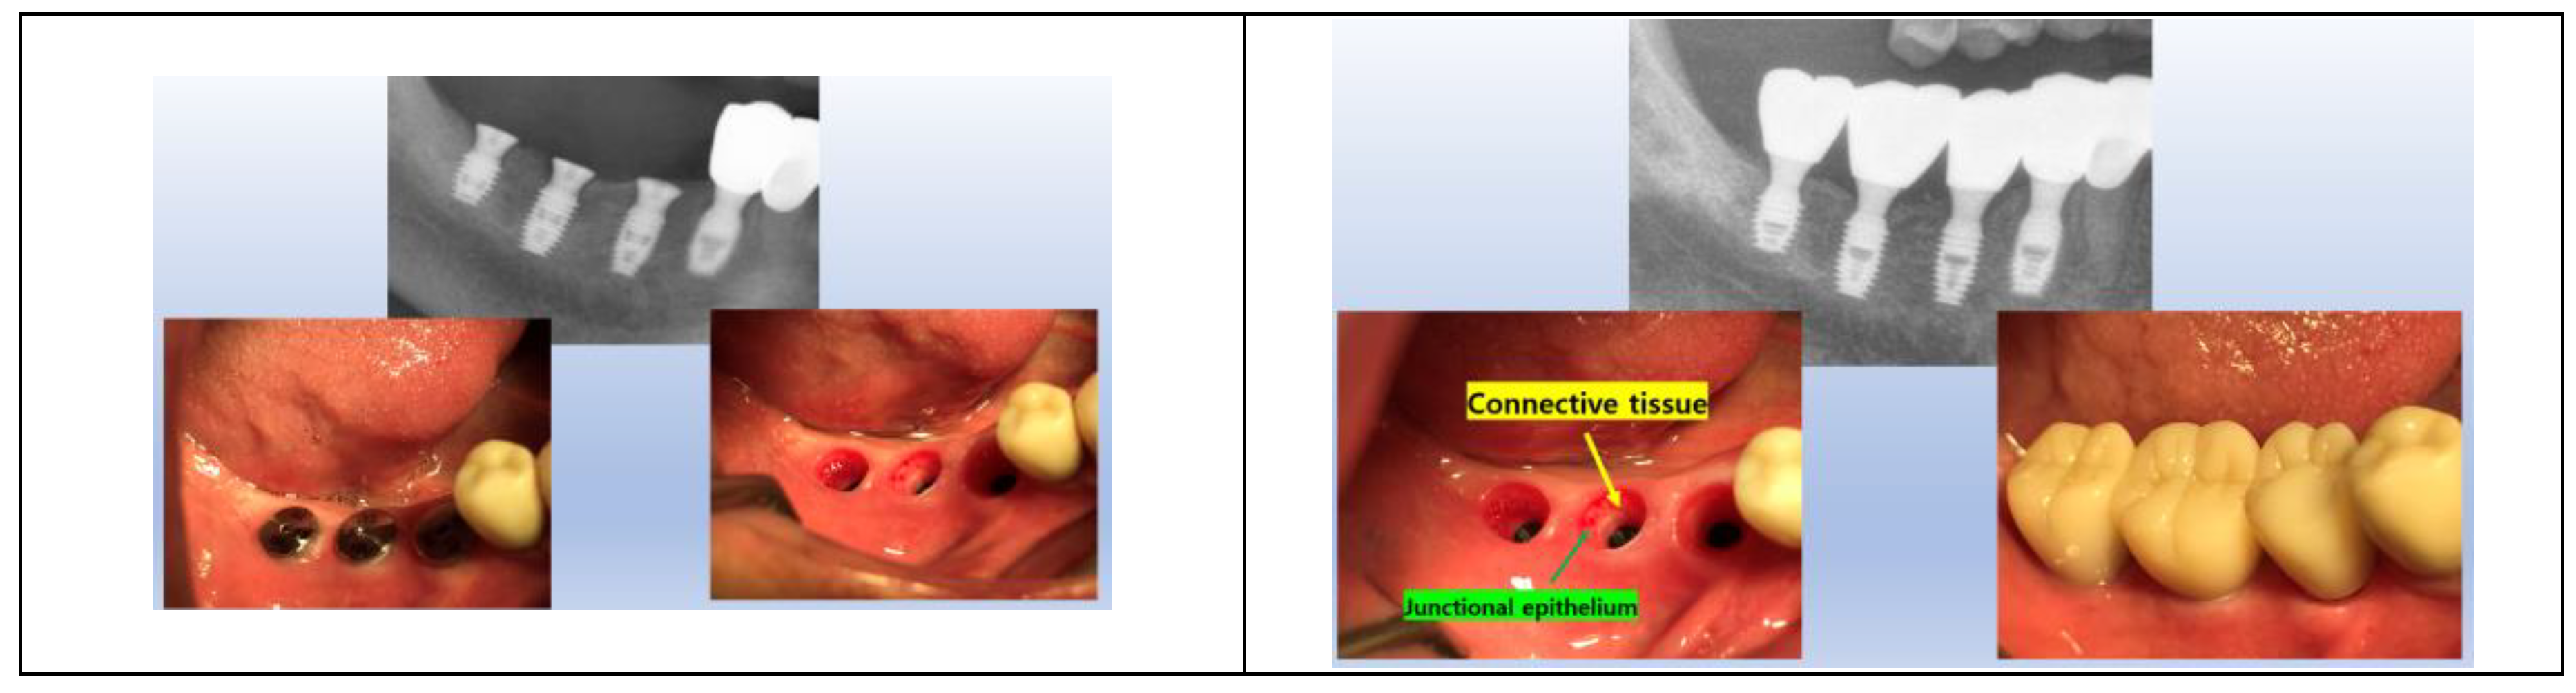
Figure 18.
The temporary swelling of peri-implant soft tissue during repair demonstrates the resilience and hydraulic positive pressure from the connective tissue, likely originating from the TZ. This phenomenon highlights one of the protective mechanisms of the TZ, contributing to the sealing capability of the biologic width in peri-implant soft tissue.
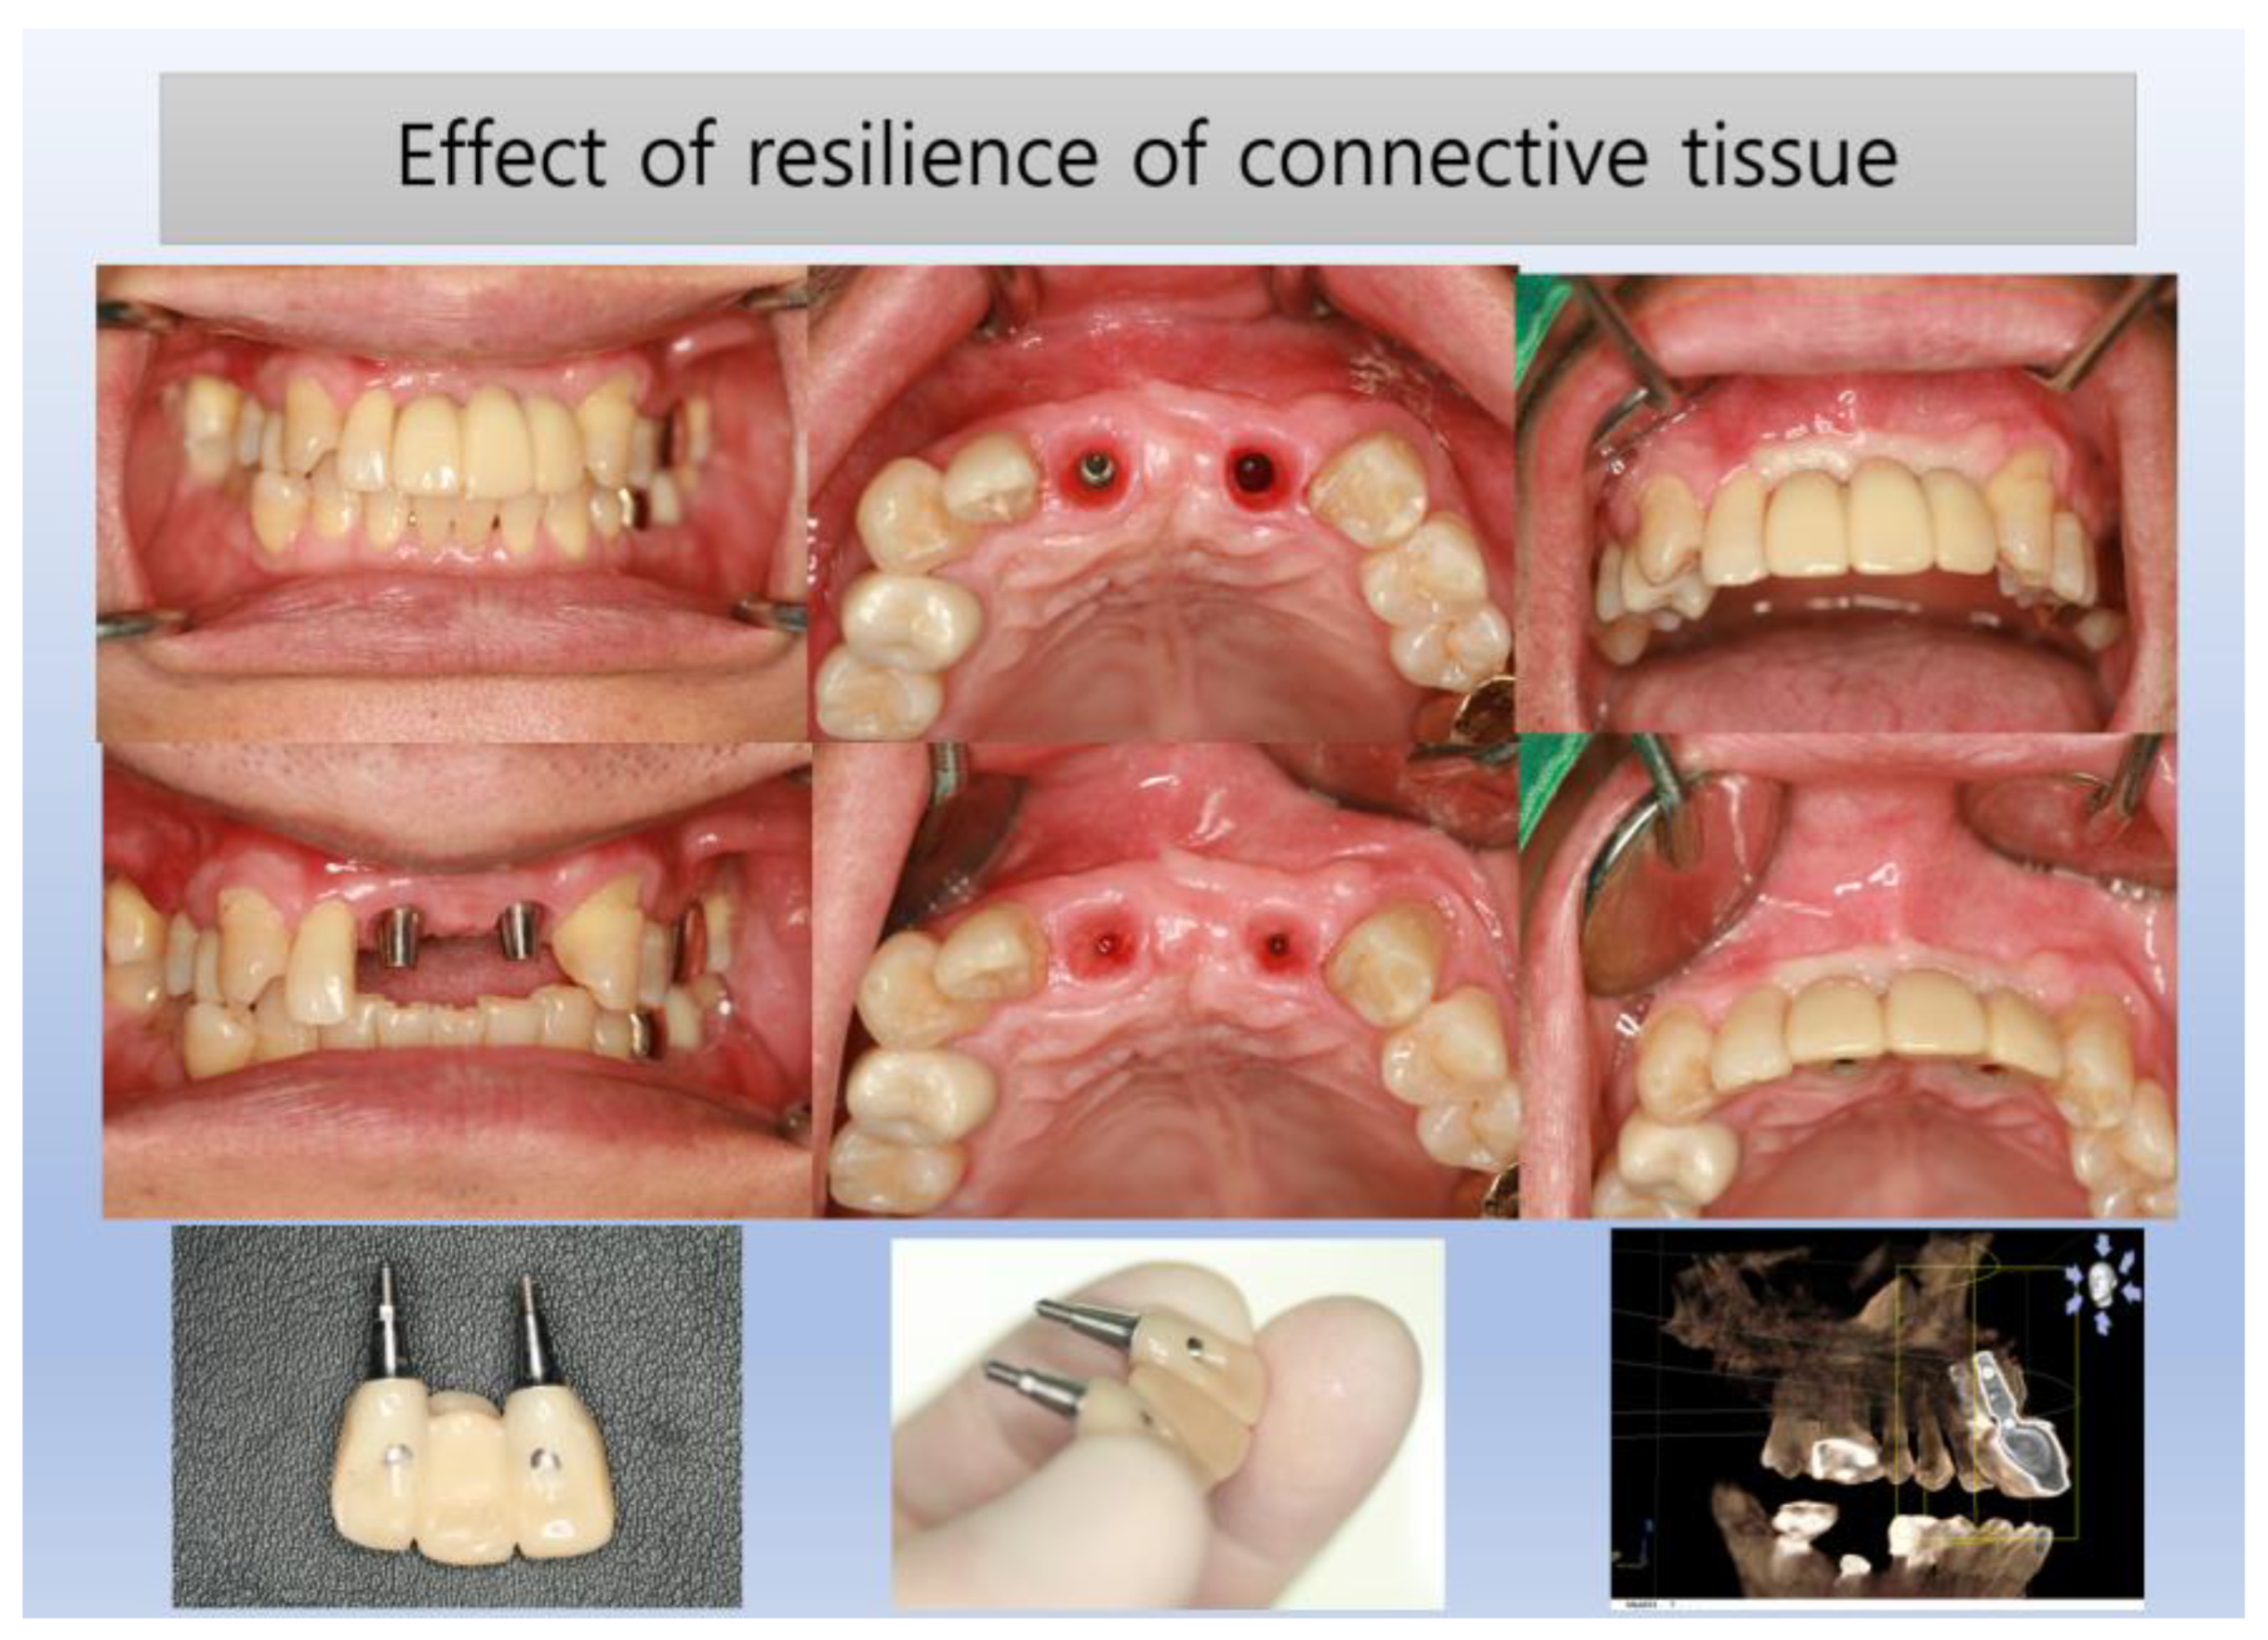
Figure 19.
The upper and lower cases contrast the outcomes of epi-crestal and subcrestal implant placements. The subcrestal placement in the lower case demonstrates more natural, stable, and healthy results compared to the epi-crestal placement in the upper case. Additionally, the lower case highlights the scalloping effect; the reference point must be at the midfacial point rather than the interproximal point. Consequently, the total vertical length for creating a prosthesis with a natural emergence profile must account for this scalloping effect distance (approximately 2 mm), in addition to the distance from the fixture-abutment joint to the crestal bone level in a plain X-ray.
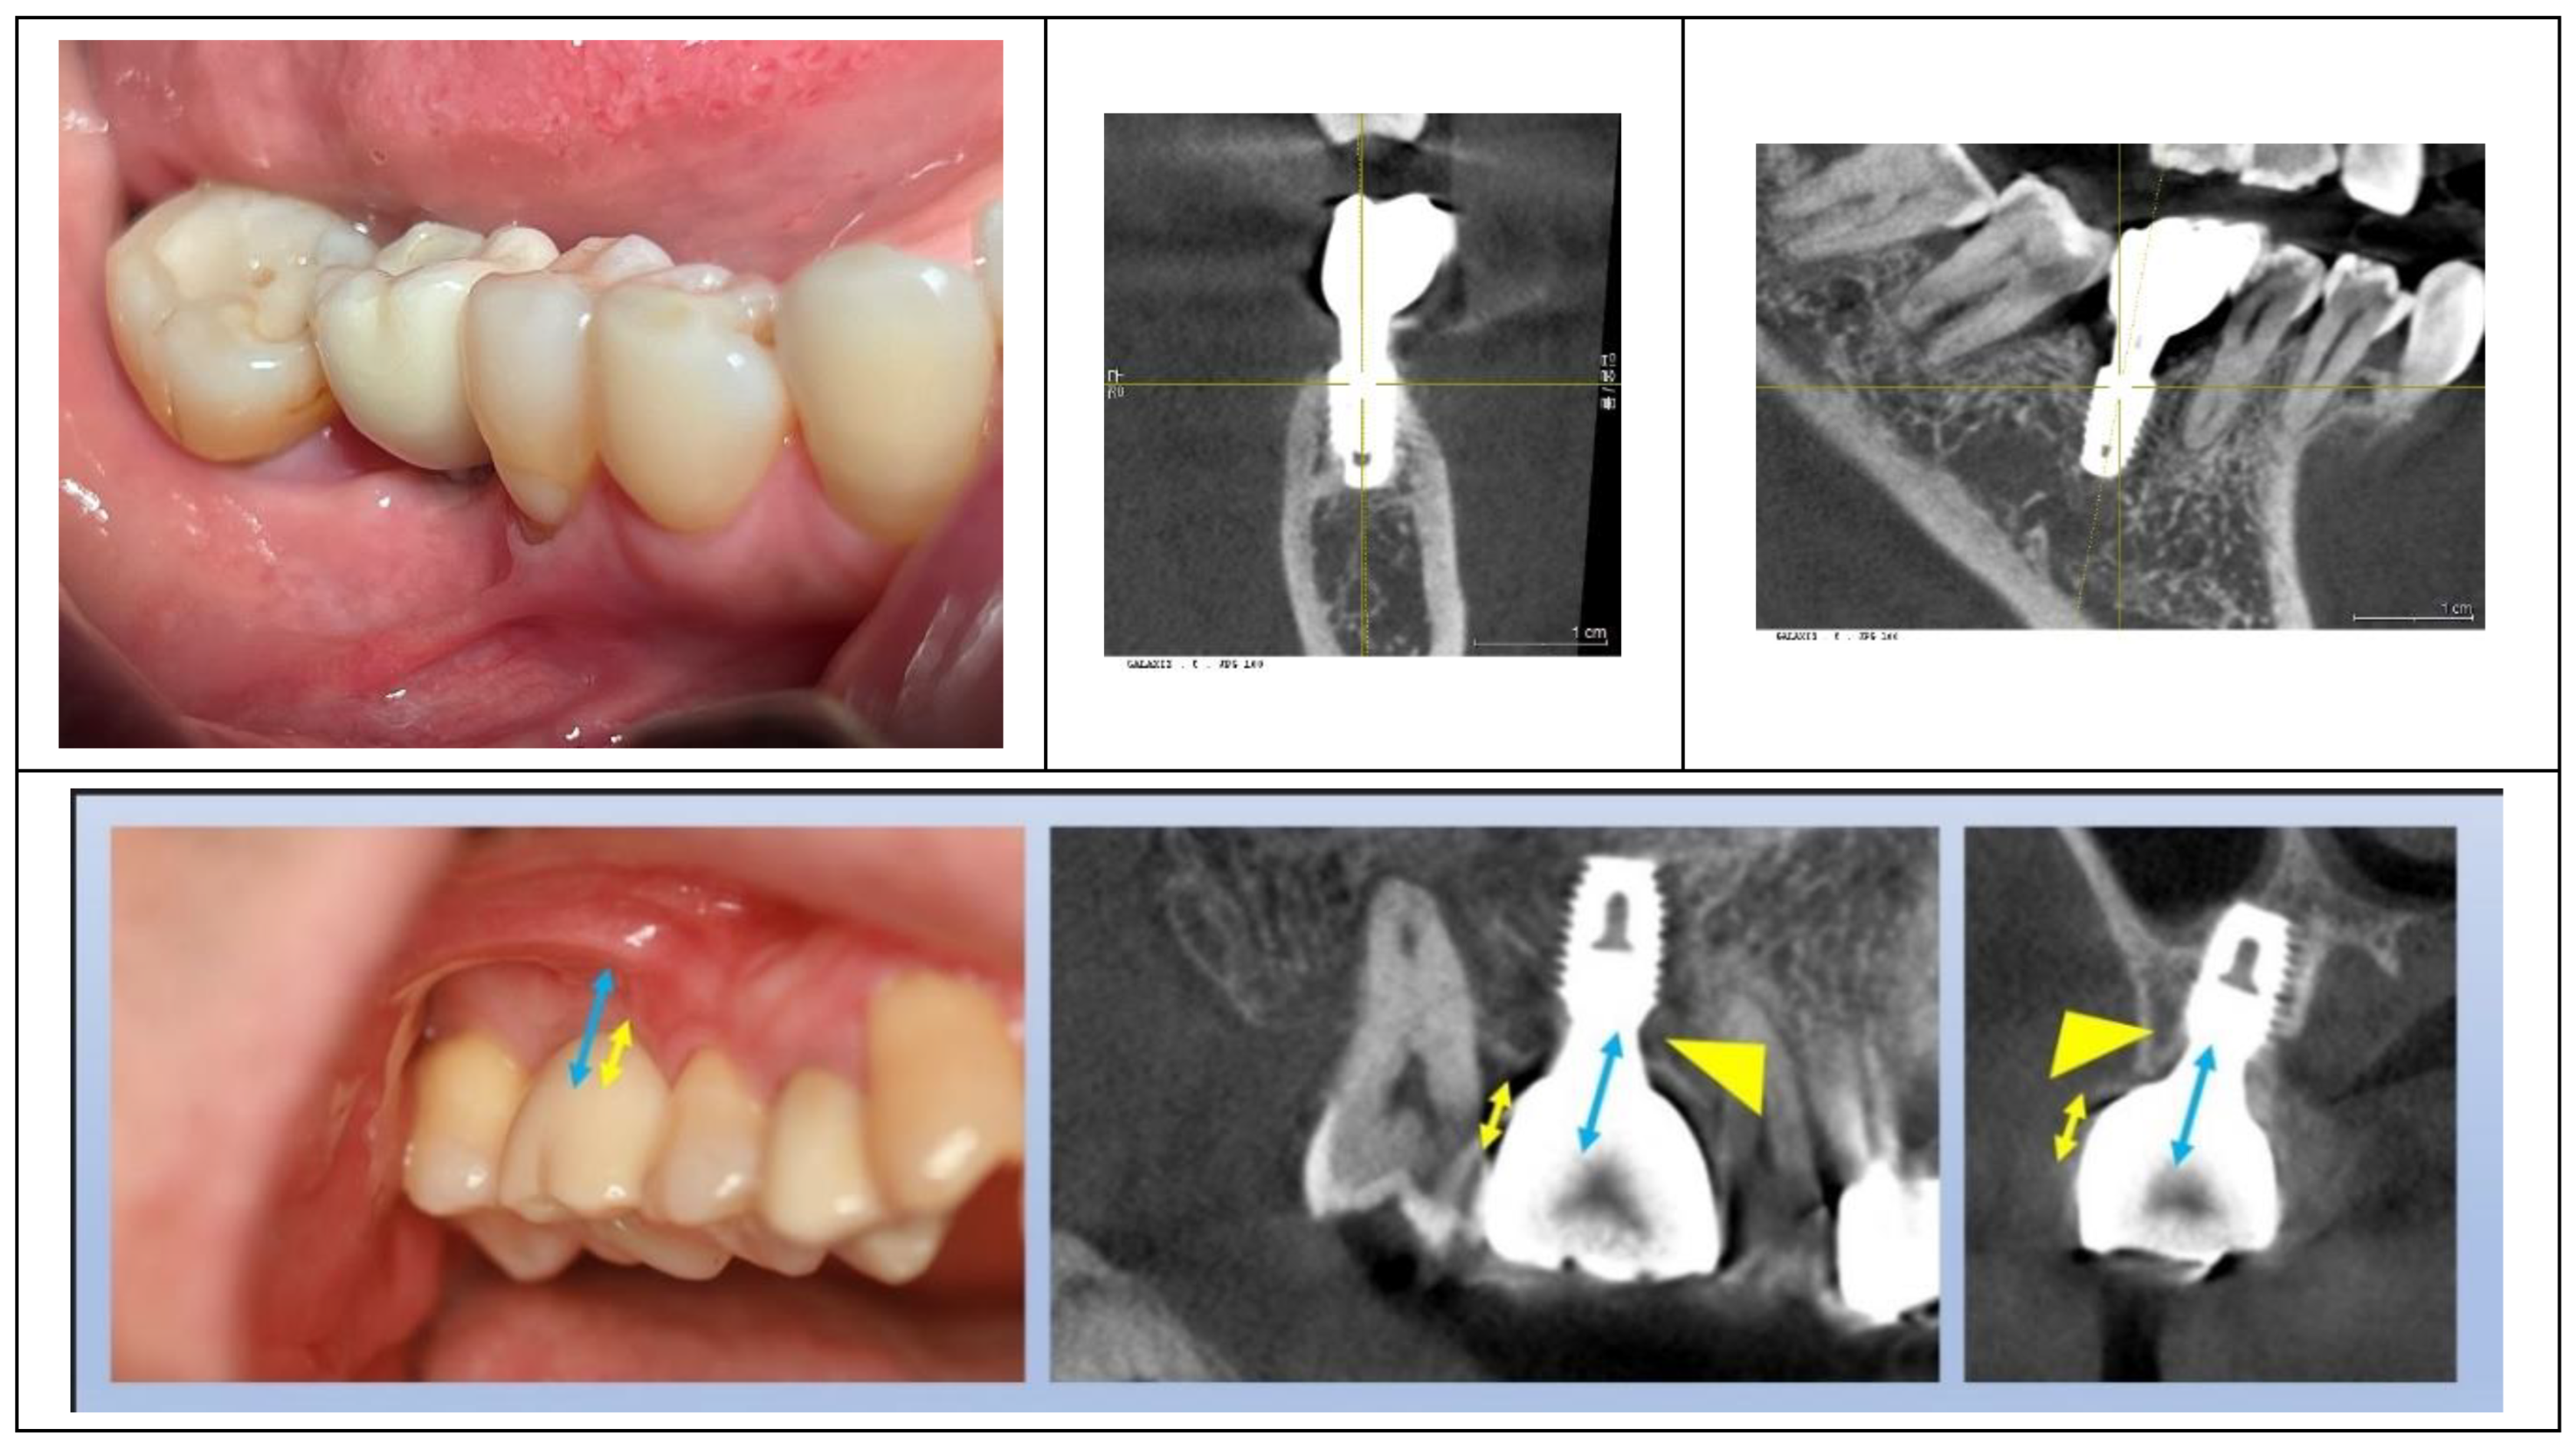

Table 1.
Summary of implant cases, detailing tooth location, implant brand, fixture size, and abutment size.
Table 1.
Summary of implant cases, detailing tooth location, implant brand, fixture size, and abutment size.
| position | brand | size | con dia | abut dia | cr mat | AGH | |
| case1 | #46 | Bicon | 5.0 x 8.0 | 3.0mm | 5.0mm | zirconia | 2 |
| case2 | #36 | Bicon | 5.0 x 8.0 | 3.0mm | 5.0mm | zirconia | 1 |
| case3 | #16 | Well Lock | 5.0 x 8.0 | 3.0mm | 5.0mm | zirconia | 2.5 |
| case4 | #46 | Well Lock | 5.0 x 8.0 | 3.0mm | 5.0mm | zirconia | 2.5 |
| case5 | #46 | Well Lock | 5.0 x 8.0 | 3.0mm | 5.0mm | zirconia | 2.5 |
| case6 | #26 | Well Lock | 5.0 x 8.0 | 3.0mm | 5.0mm | zirconia | 2.5 |
| case7 | #46 | Well Lock | 5.0 x 8.0 | 3.0mm | 5.0mm | zirconia | 2.5 |
| case8 | #47 | Well Lock | 5.0 x 8.0 | 3.0mm | 5.0mm | zirconia | 2.5 |
| case9 | #47 | Well Lock | 5.0 x 8.0 | 3.0mm | 5.0mm | zirconia | 2.5 |
| case10 | #16 | Well Lock | 5.0 x 8.0 | 3.0mm | 5.0mm | PFM | 2.5 |
| case11 | #37 | Well Lock | 5.0 x 8.0 | 3.0mm | 5.0mm | zirconia | 2.5 |
| case12 | #46 | Well Lock | 5.0 x 8.0 | 3.0mm | 5.0mm | zirconia | 2.5 |
| case13 | #37 | Well Lock | 5.0 x 8.0 | 3.0mm | 5.0mm | zirconia | 2.5 |
| case14 | #37 | Well Lock | 5.0 x 8.0 | 3.0mm | 5.0mm | zirconia | 2.5 |
| case15 | #36 | Well Lock | 4.5 x 8.0 | 3.0mm | 5.0mm | zirconia | 2.5 |
| case16 | #37 | Well Lock | 4.5 x 7.0 | 3.0mm | 5.0mm | zirconia | 2.5 |
| case17 | #37 | Well Lock | 5.0 x 8.0 | 3.0mm | 5.0mm | zirconia | 2.5 |
| case18 | #46 | Well Lock | 5.0 x 8.0 | 3.0mm | 5.0mm | zirconia | 2.5 |
| case19 | #26 | Well Lock | 5.0 x 8.0 | 3.0mm | 5.0mm | zirconia | 2.5 |
| case20 | #46 | Well Lock | 5.0 x 8.0 | 3.0mm | 5.0mm | zirconia | 2.5 |
Table 2.
Measured Central (cPD) and Peripheral (pPD) Placement Depths across mesial, distal, buccal, and lingual aspects.
Table 2.
Measured Central (cPD) and Peripheral (pPD) Placement Depths across mesial, distal, buccal, and lingual aspects.
| cPD (central Placing Depth) | pPD (peripheral Placing Depth) | |||||||
| cPD/M | cPD/D | cPD/B | cPD/L | pPD/M | pPD/D | pPD/B | pPD/L | |
| case1 | 1.4 | 1.8 | 0.8 | 1.8 | 3.7 | 3 | 1.1 | 4.1 |
| case2 | 1 | 1.1 | 1.3 | 1.1 | 3.5 | 1.5 | 2.1 | 2.1 |
| case3 | 2.5 | 2.4 | 2.5 | 2.2 | 4 | 3.2 | 3 | 2.2 |
| case4 | 1.8 | 0.9 | 1.1 | 1 | 4.9 | 1.7 | 1.1 | 2.4 |
| case5 | 1.7 | 2.3 | 0.1 | 2.5 | 5.1 | 3.8 | 0.1 | 3 |
| case6 | 1.5 | 1.3 | 2 | 0 | 3.7 | 3 | 3.5 | 0 |
| case7 | 1 | 0.3 | 2.2 | 1.5 | 2.4 | 2 | 2.2 | 1.5 |
| case8 | 1.7 | 1.8 | 2 | 1.7 | 2.4 | 5.4 | 2.2 | 2 |
| case9 | 1.5 | 1.5 | 2.4 | 2.1 | 3.1 | 3.1 | 2.4 | 2.1 |
| case10 | 2.5 | 2.5 | 2.9 | 2.6 | 4.8 | 3.9 | 4.2 | 4.1 |
| case11 | 1.99 | 2.52 | 1.93 | 1.02 | 3.83 | 3.45 | 2.03 | 2.23 |
| case12 | 0.86 | 0.71 | 0.44 | 0.88 | 4.1 | 1.97 | 0.44 | 3.09 |
| case13 | 1.08 | 2.02 | 0.66 | 0.63 | 3.76 | 3.38 | 0.66 | 3.23 |
| case14 | 0.09 | 2.41 | 0.57 | 0.54 | 2.37 | 3.1 | 1.05 | 0.99 |
| case15 | 0.19 | 1.06 | 1.21 | 1.03 | 2.46 | 2.62 | 1.21 | 2.57 |
| case16 | 0.19 | 1.24 | 1.21 | 1.21 | 2.13 | 3.11 | 2.67 | 1.21 |
| case17 | 1.36 | 2.36 | 1.81 | 1.48 | 3.91 | 3.68 | 2.67 | 3.28 |
| case18 | 1.41 | 0.85 | 0.86 | 1.23 | 1.92 | 3.29 | 0.86 | 1.23 |
| case19 | 1.95 | 1.46 | 1.5 | 1.18 | 3.49 | 2.35 | 1.75 | 1.18 |
| case20 | 0 | 0.52 | 0.72 | 0.54 | 2.3 | 1.09 | 0.72 | 0.99 |
| average | 1.3 | 1.6 | 1.4 | 1.3 | 3.4 | 2.9 | 1.8 | 2.2 |
| 1.4 | 2.6 | |||||||
Table 3.
Results of central (cSTT) and peripheral (pSTT) soft tissue thickness measured at mesial (M), distal (D), buccal (B), and lingual (L) sites, including overall averages.
Table 3.
Results of central (cSTT) and peripheral (pSTT) soft tissue thickness measured at mesial (M), distal (D), buccal (B), and lingual (L) sites, including overall averages.
| cSTT(central Soft Tissue Thickness) | pSTT(peripheral Soft Tissue Thickness) | |||||||
| cSTT/M | cSTT/D | cSTT/B | cSTT/L | pSTT/M | pSTT/D | pSTT/B | pSTT/L | |
| case1 | 0.2 | 0.2 | 0.3 | 0.5 | 0.6 | 0.6 | 0.6 | 0.9 |
| case2 | 0.3 | 0.3 | 0.1 | 0.1 | 0.4 | 0.8 | 0.6 | 0.8 |
| case3 | 0.1 | 0.3 | 0.3 | 0.1 | 0.8 | 0.6 | 0.5 | 0.1 |
| case4 | 0.3 | 0.4 | 0.2 | 0.3 | 0.5 | 0.5 | 0.4 | 0.7 |
| case5 | 0.5 | 0.1 | 0 | 0.2 | 1.2 | 1.2 | 1 | 1.2 |
| case6 | 0 | 0.6 | 0.5 | 0 | 0 | 1 | 1.3 | 0.5 |
| case7 | 0.5 | 0.5 | 0 | 0 | 0.7 | 0.9 | 0 | 0 |
| case8 | 0.2 | 0.3 | 0.1 | 0.2 | 0.2 | 0.3 | 0.2 | 0.5 |
| case9 | 0.6 | 0.5 | 0.3 | 0.3 | 0.6 | 0.5 | 0.3 | 0.3 |
| case10 | 0.4 | 0.3 | 0.3 | 0.3 | 0.6 | 0.4 | 0.3 | 0.3 |
| case11 | 0.22 | 0 | 0 | 0.25 | 0.91 | 0.1 | 0.15 | 0.88 |
| case12 | 0.4 | 0.44 | 0.16 | 0.11 | 0.78 | 0.56 | 0.8 | 0.99 |
| case13 | 0.52 | 0.33 | 0 | 0.1 | 0.76 | 0.85 | 0 | 0.33 |
| case14 | 0.64 | 0 | 0.54 | 0.7 | 1.2 | 0 | 0.96 | 0.96 |
| case15 | 0.69 | 0.09 | 0 | 0 | 0.97 | 0.09 | 0.17 | 0.27 |
| case16 | 0.81 | 0 | 0.17 | 0.09 | 1.45 | 0.43 | 0.34 | 0.19 |
| case17 | 0.1 | 0.1 | 0.76 | 0.9 | 0.99 | 0.33 | 0 | 0 |
| case18 | 0.47 | 0.3 | 0.19 | 0.48 | 0.57 | 0.87 | 0.19 | 0.74 |
| case19 | 0.08 | 0 | 0 | 0 | 0.98 | 0.98 | 0 | 0 |
| case20 | 0.7 | 0 | 0 | 0.18 | 1 | 0 | 0.58 | 0.64 |
| average | 0.4 | 0.2 | 0.2 | 0.2 | 0.8 | 0.6 | 0.4 | 0.5 |
| 0.3 | 0.6 | |||||||
Table 4.
This table summarizes the measurements of Transitional Zone Length (TZL) and reference TZL (rTZL) at mesial (M), distal (D), buccal (B), and lingual (L) sites. TZL reflects the distance from the implant-abutment connection to the point of critical tissue thickness, while rTZL provides the baseline reference width. Averages across all sites are included to show overall trends.
| TZL (Transitional Zone Length) | rSTT (reference Soft Tissue Thickness) | |||||||
| M | D | B | L | M | D | B | L | |
| case1 | 4.62 | 2.57 | 1.03 | 3.18 | 1.03 | 1 | 1.03 | 0.99 |
| case2 | 5.01 | 5.59 | 2.15 | 0.98 | 1 | 0.8 | 0.94 | 0.98 |
| case3 | 7.41 | 4.6 | 4.47 | 3.9 | 0.8 | 0.97 | 0.84 | 1 |
| case4 | 5.98 | 4.62 | 2.72 | 4.53 | 1.05 | 1.05 | 0.9 | 0.99 |
| case5 | 6.86 | 3.51 | 1.5 | 3.56 | 0.99 | 0.99 | 0.97 | 0.66 |
| case6 | 6.49 | 3.71 | 5.05 | 4.75 | 0.95 | 0.97 | 0.96 | 1 |
| case7 | 4.3 | 3.89 | 2.33 | 1.13 | 0.97 | 0.99 | 0 | 0 |
| case8 | 2.6 | 6 | 2.3 | 2.62 | 0.99 | 0.99 | 0.99 | 0.99 |
| case9 | 4.03 | 3.12 | 3.38 | 2.04 | 0.86 | 0.94 | 0.47 | 0.33 |
| case10 | 6.19 | 4.14 | 3.9 | 7 | 0.99 | 0.99 | 0.69 | 0.95 |
| case11 | 4.52 | 3.05 | 1.26 | 2.38 | 0.99 | 0 | 0.64 | 0.44 |
| case12 | 5.19 | 3.28 | 2.6 | 4.3 | 0.79 | 0.56 | 0.8 | 0.99 |
| case13 | 5..87 | 3.14 | 0.52 | 4.95 | 0.99 | 0.7 | 0 | 0.70 |
| case14 | 2.14 | 3.38 | 2.79 | 2.25 | 1 | 0.99 | 0.96 | 0.96 |
| case15 | 4.19 | 3.03 | 0.46 | 2.79 | 1 | 0.09 | 0.46 | 0 |
| case16 | 2.14 | 1.29 | 1.69 | 0.28 | 0.93 | 0.9 | 0.99 | 0.28 |
| case17 | 5.52 | 3.17 | 2.92 | 2.6 | 0.99 | 0.33 | 0.76 | 0.9 |
| case18 | 2.55 | 3.75 | 0.74 | 1.02 | 0.57 | 1.01 | 0.74 | 0.55 |
| case19 | 5.49 | 4.39 | 2.89 | 4.09 | 1 | 0.97 | 0 | 1 |
| case20 | 3.33 | 1.33 | 1.6 | 1.85 | 1 | 0.97 | 0.58 | 0.64 |
| average | 4.7 | 3.6 | 2.3 | 3.0 | 0.9 | 0.8 | 0.7 | 0.7 |
Table 5.
This table presents the average measurements for Placement Depth (PD), Soft Tissue Thickness (STT), and Transitional Zone Length (TZL) across mesial (M), distal (D), buccal (B), and lingual (L) sites.
Table 5.
This table presents the average measurements for Placement Depth (PD), Soft Tissue Thickness (STT), and Transitional Zone Length (TZL) across mesial (M), distal (D), buccal (B), and lingual (L) sites.
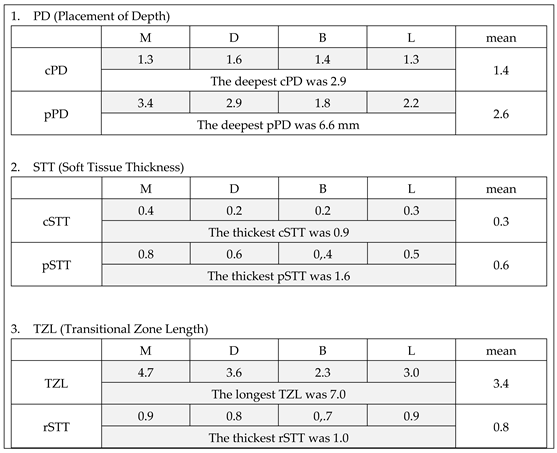
Table 6.
Summary of Crestal Bone Stability Based on pPD Changes from Panoramic X-Ray Over 3.4 Years.
Table 6.
Summary of Crestal Bone Stability Based on pPD Changes from Panoramic X-Ray Over 3.4 Years.
| Initial X ray | F/U X ray | change | F/U duration | |
| Mesial pPD | 3.8 | 3.9 | 0.1 | 3.4 years |
| Distal pPD | 2.7 | 2.9 | 0.1 |
Table 7.
A table for calculating the vertical distance required given each emergence angle and horizontal distance difference, applicable to bone level implant designs with IPS, would be beneficial for understanding and implementing these measurements.
Table 7.
A table for calculating the vertical distance required given each emergence angle and horizontal distance difference, applicable to bone level implant designs with IPS, would be beneficial for understanding and implementing these measurements.
| Diameter of crown | Diameter of connection | Horizontal distance difference of each side |
Emergence Angle | Vertical distance |
| 10 | 3 | (10-3)/2=3.5 | 30 o | 6.1 |
| 45 o | 3.5 | |||
| 60 o | 2.0 | |||
| 8 | 3 | (8-3)/2=2.5 | 30 o | 4.3 |
| 45 o | 2.5 | |||
| 60 o | 1.4 |
Disclaimer/Publisher’s Note: The statements, opinions and data contained in all publications are solely those of the individual author(s) and contributor(s) and not of MDPI and/or the editor(s). MDPI and/or the editor(s) disclaim responsibility for any injury to people or property resulting from any ideas, methods, instructions or products referred to in the content. |
© 2024 by the authors. Licensee MDPI, Basel, Switzerland. This article is an open access article distributed under the terms and conditions of the Creative Commons Attribution (CC BY) license (http://creativecommons.org/licenses/by/4.0/).
Copyright: This open access article is published under a Creative Commons CC BY 4.0 license, which permit the free download, distribution, and reuse, provided that the author and preprint are cited in any reuse.


