Submitted:
28 December 2024
Posted:
30 December 2024
You are already at the latest version
Abstract
We designed and evaluated performance of a high resolution large-area detector for positron emission tomography (PET) based on a crystal assembly readout using wavelength-shifting (WLS) fibers, offering a cost-effective alternative to the direct readout of monolithic crystals with photodetectors. The considered detector geometries are made up of 4×4 assembly of LuY2SiO5:Ce (LYSO) crystal scintillators, each with surface area of 50×50 mm2 and thickness 7 or 15 mm optically coupled together using optical adhesive. The crystal assembly is coupled with orthogonal wavelength-shifting (WLS) fibers of square cross-section placed on the top and bottom of the assembly. To evaluate the characteristics of the novel detector we used the GEANT4 to perform optical photon transport in the crystal assembly and WLS fibers. The simulation results show that best position resolution achieved is around 1.6 mm FWHM and 3.8 mm FWTM for crystal thickness 7 mm and 1.5 mm FWHM and 4.8 mm FWTM for crystal thickness 15 mm. Compared to direct photosensor readout, WLS fibers can drastically reduce the number of photosensors required while covering a larger sensitive detection area. In proposed detector design 2N photodetectors are used to cover the same image area instead of N2 with direct readout. This design allows for the development of a compact detector with an expanded effective field of view and reduced cost.
Keywords:
Monte Carlo simulations
; GEANT4
; positron emission tomography
; scintillation photons
; Geant4 simulations
; silicon photomultiplier
; scintillators
; LYSO(Ce)
1. Introduction
Positron Emission Tomography (PET) is a powerful and versatile imaging technique that plays a crucial role in the diagnosis and management of a variety of medical conditions, including tumors (cancer), cardiovascular diseases, and neurological disorders. By providing detailed images of metabolic activity and physiological processes at the cellular level, PET offers insights that other imaging modalities, like CT or MRI, may not provide.
Because conventional whole-body PET scanners are not optimized for imaging small structures there is a growing research focus on developing organ-specific PET scanners. These specialized scanners offer improved performance in terms of enhanced spatial resolution and higher sensitivity. They are particularly beneficial for detailed imaging in neurological diseases (e.g., Alzheimer’s, Parkinson’s), where detecting small brain structures is critical. Additionally, they improve the detection of small-sized breast cancers that might not be visible in whole-body scans and enhance the study of cardiovascular disease and heart metabolism with greater accuracy. By targeting specific organs, these scanners provide a valuable tool for early diagnosis, monitoring disease progression, and evaluating treatment response, offering higher diagnostic accuracy for specialized clinical applications.
PET imaging uses a positron-emitting radioactive tracer, such as 18F, which is injected into the patient’s body. Commercial PET scanners typically employ scintillation crystal arrays arranged in a ring around the human body. These arrays detect the two 511 keV photons emitted in opposite directions as a result of positron annihilation. This configuration allows for the localization of both annihilation photon interactions, creating a line of response (LOR) that is used for image reconstruction in PET [1].
For PET scanners parallax errors become a significant issue when -rays hit the detector at an angle, leading to inaccuracies in determining the line of response (LOR). This angular deviation causes errors in reconstructing the interaction position, which negatively impacts image quality. Therefore, accurate determination of the depth of interaction (DOI) or, more precisely, the 3D reconstruction of the first interaction position, is a primary focus of research in PET technology. For pixelated PET detectors, one of the common methods for acquiring the DOI is the dual-ended readout technique. This method uses photodetectors on both ends of the scintillation crystal to measure the light output, allowing the system to estimate the position of the -photon interaction along the depth of the crystal [2,3]. But, dual-sided readout of scintillators requires a larger number of photosensors, which increases detector costs. In monolithic crystal based PET detectors [4,5,6,7,8,9] the DOI can be inferred based on the pattern of scintillation light detected by the photosensors coupled to the crystal [10,11]. In recent years, there has been growing interest in using PET detectors based on monolithic crystals as an alternative to the conventional pixelated scintillation crystal arrays. Monolithic crystals offer several advantages in terms of performance and flexibility, particularly in improving spatial resolution, sensitivity, and timing precision, making them a promising choice for next-generation PET systems
In this paper, we are exploring new detection technology based on the use of wavelength shifters (WLS) for reading out scintillation light instead of direct photosensor readout (the detector scheme is shown in Figure 1). The detector design features WLS fibers placed along both long sides of a planar crystal scintillator in orthogonal directions, enabling the reconstruction of x, y, and z coordinates of the interaction point. Since the size of monolithic scintillators is limited by production technology, multiple crystals are combined into a matrix assembly using optical adhesive coupling, enabling larger detection surfaces without compromising performance. The performance of the optically coupled crystal assembly was studied in [12,13,14], and the results suggest a reduction in edge effects and improved the uniformity of light pattern in the whole sensitive area. The method for extracting DOI information in PET detectors using wavelength-shifting (WLS) material was originally proposed in [15,16] were the WLS fibers were arranged orthogonally on the top and bottom of the scintillator array for signal readout. This approach has also beed explored in [12,13,14,17,18].
2. The WLS-PET Detector Configuration
The PET detector, using WLS-fiber readout (WLS-PET) is made up of the N ×N assembly of monolithic LYSO crystal scintillators, with planar geometry and a base size of 50 × 50 × 15 mm3, optically coupled together using an optical adhesive (MeltmountTM 1.704 with refractive index n = 1.704 [19]) to create the detector with large sensitive area. The 3×3 mm2 WLS squared fibers are placed in orthogonal directions (X and Y) on each side of the crystal assembly. This arrangement allows for the reconstruction of hit position information. To improve light collection efficiency, the WLS fibers are optically coupled to the crystals using optical grease. The outer detector layer, covering the WLS fibers on both the top and bottom, is made of an ESR mirror to reflect photons back into the fibers. WLS fibers are readout at both ends using SiPMs. To prevent reflections from the lateral faces of the crystals, they are painted black. Schematic of detector is shown in Figure 1. The number of WLS fibers on each side of 2×2 crystal array is 33 and 66 for 4×4 assembly. The WLS-fiber pitch is 3.03 mm.
3. Monte Carlo Modeling of the WLS-PET Detector
In the GEANT4 simulation for this study, all relevant physical processes have been included to ensure accurate modeling of photon interactions within the PET detector. The following electromagnetic processes, such as ionization, bremsstrahlung, multiple scattering, pair production, Compton scattering, and the photoelectric effect, are considered. Optical processes include scintillation, Cherenkov radiation, volume absorption, Rayleigh scattering, and boundary processes like reflection, refraction, and absorption. The Birk’s effect, which adjusts the scintillation light yield to account for variations in the energy deposition density by ionizing particles, is accounted for. For optical photon transport, the GLISUR model [20,21] in the GEANT4 package was employed. This model simulates the interactions of optical photons at the interfaces between different materials by applying the concept of optical surfaces to describe light reflection and transmission at the boundaries between media, accounting for scattering, absorption, and reflection. In the detector GEANT4 model, we define the surface roughness for all interfaces. When the polish parameter is set to zero, it represents maximum roughness, where photons are reflected according to a Lambertian distribution. Conversely, a polish value of one applies Snell’s Law. For each surface, the appropriate optical boundary processes and reflectivity were specified.
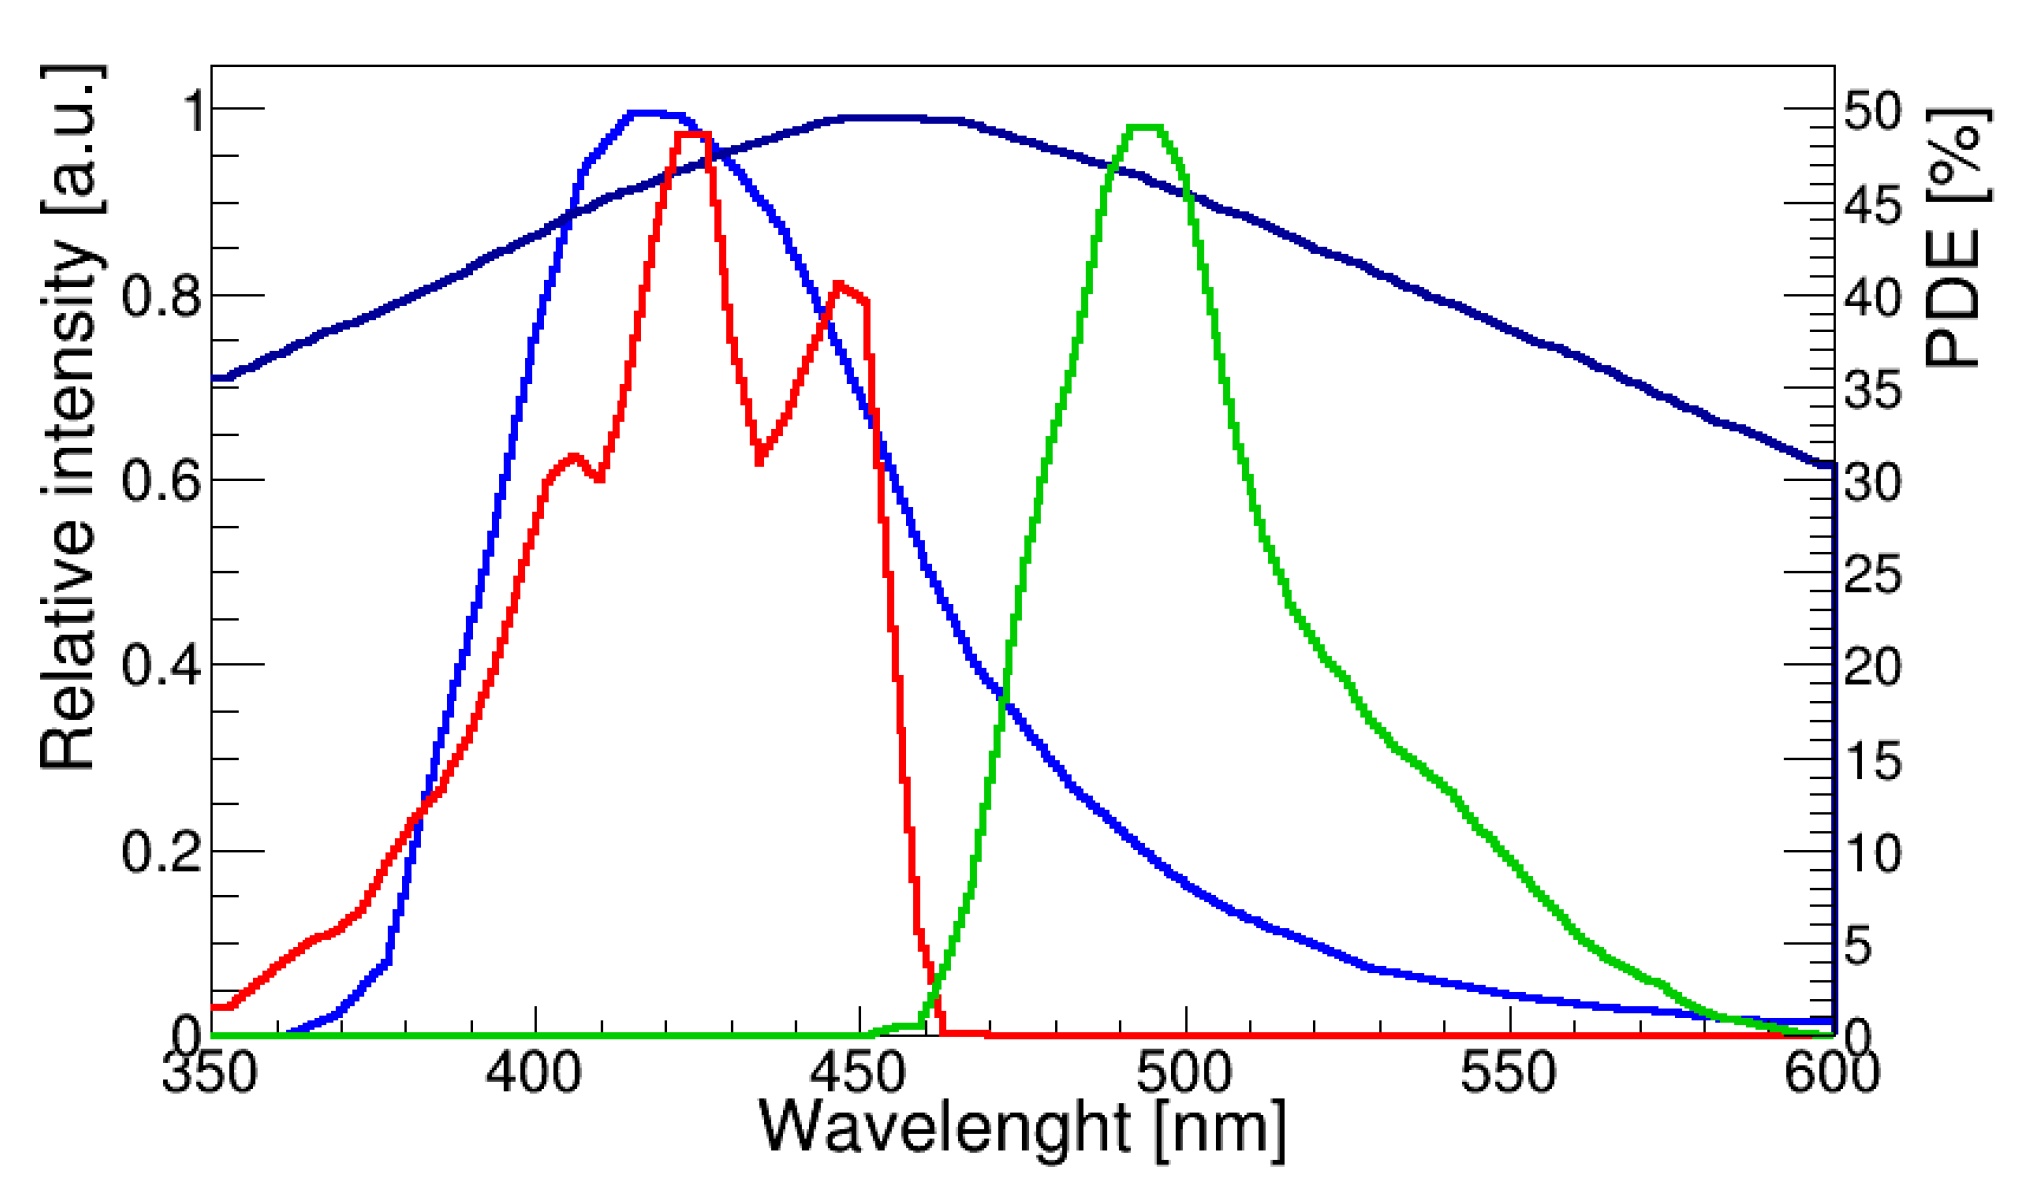
LYSO has a high effective atomic number of 66 and a density of 7.4 g/cm3, which provides a short attenuation length of 11.5 mm for 511 keV rays and corresponds to an interaction probability of approximately 73 % within a 15-mm thick crystal. The LYSO scintillator light yield ranges from 26000/MeV to 39900/MeV [22,23,24,25,26,27,28]. In the simulation refractive index of the LYSO set at 1.82, and the light yield at 27,000 photons / MeV, the light attenuation length set to 40 cm [27]. The WLS fiber used in the simulations was the square shape double clad BCF-91A [29] which has an absorption peak at 420 nm and an emission peak at 494 nm. The LYSO scintillation light emission peak is at 420 nm and is a good match to the BCF-91A maximum absorption wavelength range (410-460 nm). The absorption spectrum of the fiber matches the emission spectrum of the LYSO scintillator providing maximal light conversion for transmission to WLS fibers. WLS fibers are coupled to the SiPM using silicon optical grease to increase the efficiency of light transmission to the SiPM, the entrance window of which is made of epoxy with an index of refraction of 1.5. The polystyrene core refractive index of BCF-91A WLS fiber’s is 1.6, while that of the first cladding layer (acrylic) has a refractive index of 1.49 and the second cladding layer (fluor-acrylic) has an index of refraction of 1.42. WLS fibers are coupled to LYSO assembly using optical grease (refractive index = 1.46). The application of optical grease significantly enhances the number of optical photons transmitted from the crystal to fibers. This improvement occurs because the critical angle at the LYSO - optical grease interface is greater than at the LYSO - air interface, allowing more photons to overcome total internal reflection and pass through the interface. The SiPM modeled as material Si and SiPM window size was 3×3 mm2. The Hamamatsu S13360 type SiPM was used as a reference unit. The light detection efficiency was determined by weighting the SiPM PDE with the BCF-91A WLS fiber emission spectra, which gives a value of ≈40%.
The developed simulation model and optical properties of materials were validated against experimental data on the light response of the LYSO scintillator. A GEANT4 model, as described in [28], was created, and parameters were adjusted until agreement was achieved with the energy resolution data presented in the publication. The simulation parameters for WLS fibers were adjusted in [30].
4. Results
The GEANT4 application is run to generate data samples that record the number of optical photons detected by each SiPM. The simulated data are recorded event-by-event in CERN ROOT [31] TTree format and then analyzed using a C++ code. In the simulation run, the pencil beam of 511 keV photons was incident perpendicularly to the LYSO scintillator block at different positions. 20000 events were simulated at each beam position. Figure 3 shows an example of the tracking of optical photons inside the WLS-PET detector. Generated optical photons travel directly through the optically coupled LYSO scintillators to the black painted lateral surfaces of the crystal assembly and are absorbed in it. Some others are tracked to the WLS fibers where they are absorbed and re-emitted with longer wavelength’s, which allow tracking towards SiPMs.
There are several event positioning algorithms in PET detectors, such as a weighted energy centroid positioning (Anger logic) [32], machine learning-based positioning algorithm [33,34], or statistical methods, least squares, nearest neighbors and maximum likelihood [35]. In this work ()-positions are reconstructed using the in-house developed algorithm, which analyzes the light distribution patterns within the detector using ROOT peak search function.
The simulated data represent the distribution of the number of photons detected by the SiPMs connected to both the upper (-axis) and lower (y-axis) WLS fibers. The examples of such distributions are shown in Figure 4 and Figure 5.
The -ray hit position is calculated for the and -axes. For each simulated event, the distributions of detected photons were analyzed using a functions of CERN ROOT package. The found peaks in the distribution are used to identify photoelectric absorption and Compton scattering events. If two or more peaks are detected in the light distribution, the event is excluded from further analysis as it likely results from Compton scattering or other complex interactions that distort the reconstruction. An example of such an event with two peaks detected in the light distribution is illustrated in Figure 5. In photoelectric absorption events, a single isotropic source of scintillation light is generated at the exact location where the 511 keV photon was absorbed. The emitted light from this event spreads isotropically, making it straightforward to determine the interaction position based on the light distribution pattern. During Compton scattering events, the -photon does not get fully absorbed in the scintillator but transfers a portion of its energy to an electron. This interaction leads to the generation of multiple scintillation points within the crystal. These additional points complicate the light distribution, making it challenging to accurately determine the primary interaction position, which is critical for precise image reconstruction. The presence of multiple light sources complicates the overall light distribution, as each source corresponds to a distinct interaction point (e.g., Compton scattering points and the final absorption point). This complexity makes it challenging to accurately determine the first interaction position, as the light distribution deviates from a simple, predictable shape. In this work, as a feasibility study, we restricted our approach to classifying events and rejecting those identified as Compton scattering events. In future work, we plan to incorporate Compton kinematic reconstruction to include Compton scattering events in the analysis.
Figure 5.
Number of photons detected by SiPMs at both ends of WLS fibers in (a) and (b) directions in typical event displaying the photoelectron absorption like event. The simulated data are fitted by the mixture of two Gaussian’s, which indicating Compton scattering event. Description of figures (c) and (d) as in Figure 4.
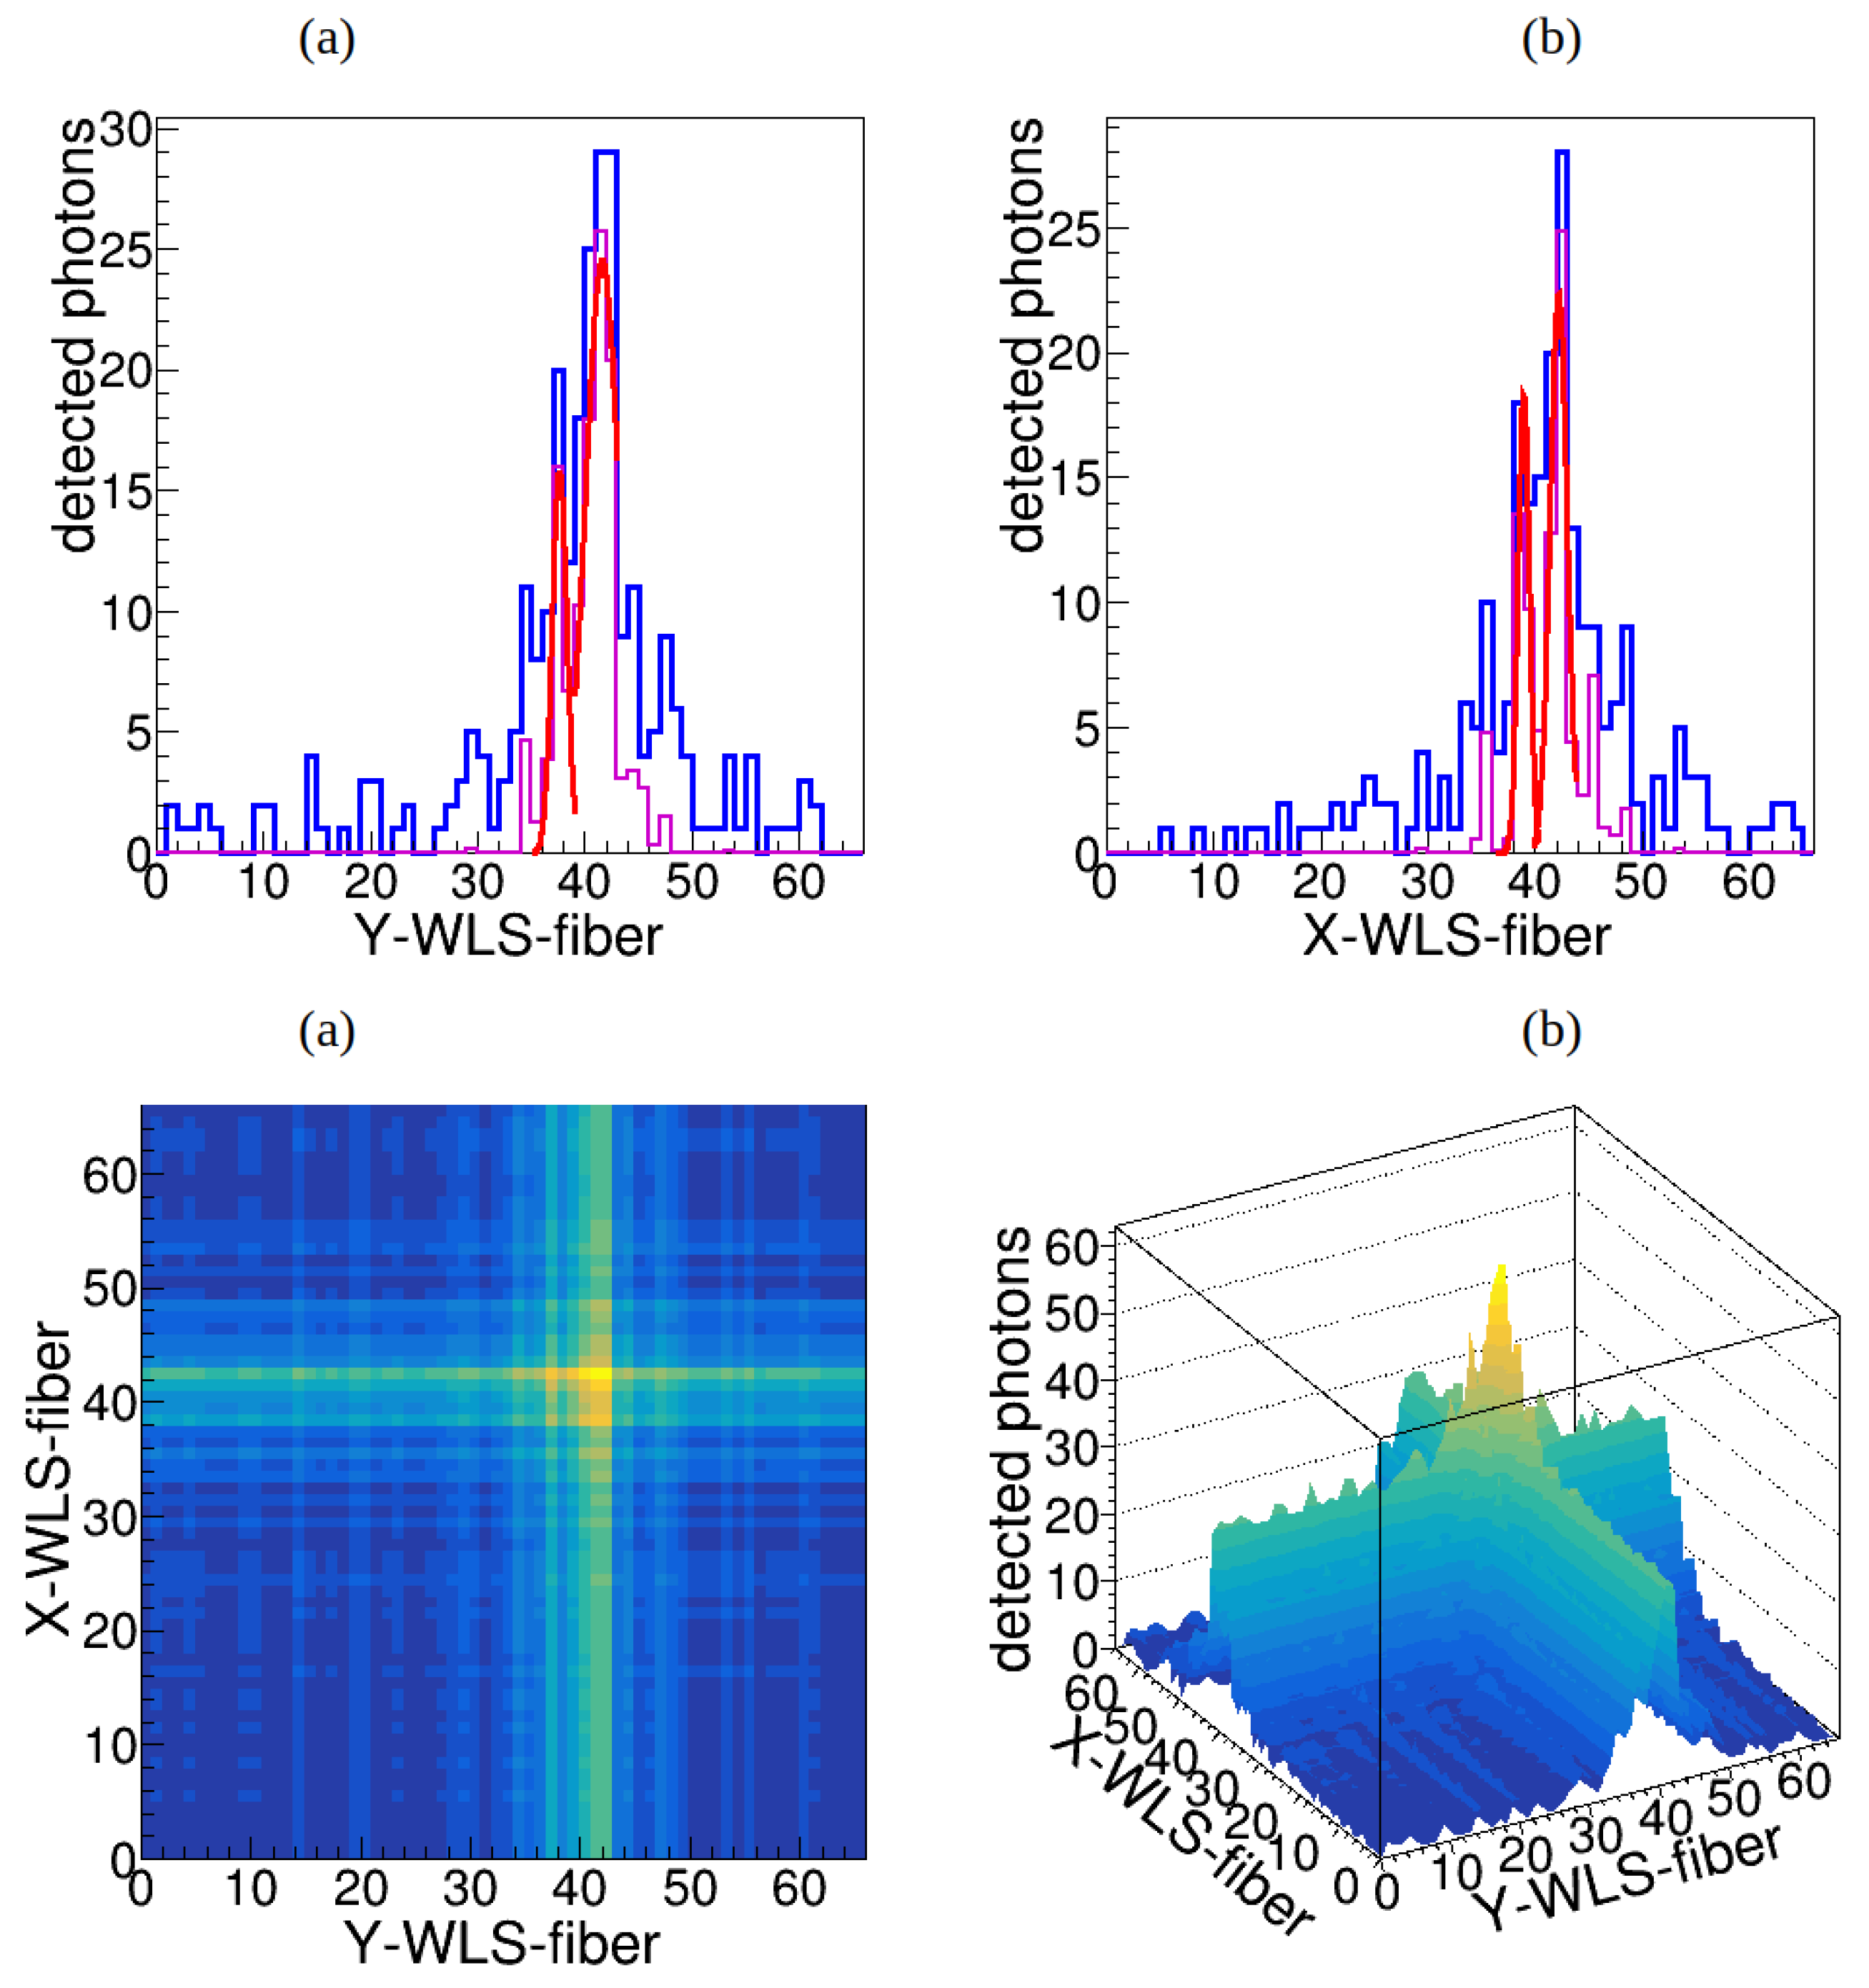
Figure 6 shows the reconstructed interaction position of a 511 keV -ray beam modeled at position (, ) = (15 mm, 15 mm) for crystal thicknesses 7 mm (a) and 15 mm (b). The spatial resolution was calculated for each point source position as full width at half maximum (FWHM) and full width at tenth maximum (FWTM) of the LSF determined in two dimensions. We consider it would be possible to use the full width tenth maximum (FWTM) as a characterization of system resolution. It can be seen that FWTM is larger increased with increase of crystal thickness then FWHM. To localize the interaction position, the distributions of detected photons in and WLS fibers are fitted with a Lorentzian functions. The mean value of the Lorentzian functions corresponds to the - and -coordinates of the 511 keV -ray interaction position. The resulting distribution shows that Compton scatterings do not have a strong effect on the width of the peak but create a noise-like plateau.
Example of an arbitrary event simulated with the 10 mm thick crystal and fitted to the Lorentzian-model is shown in Figure 8. The reconstruction of two hit positions in XY plane is shown in Figure 9 for crystal thicknesses 7 mm (a) and 15 mm (b) for two beam positions at (, ) = (15 mm, 15 mm) and (, ) = (20 mm, 15 mm). It can be seen that hit position discrimination is much better for crystal thickness 7 mm. This is because in large thickness crystal the after Compton scattering -quantum can penetrate large distance far from first interaction position, thus creating wider LSF.
The (x,y,z) coordinates are reconstructed in 3 dimensions: 2 planar coordinates (x,y) in combination with the coordinate (z) within the crystal. The light asymmetry is used for the determination of the axial coordinate z:
where and being the number of optical photons detected by SiPMs in the upper and lower WLS fibers, respectively, in a crystal assembly with thickness c. The reconstructed coordinate of interaction position is shown in Figure 11a. The obtained resolution in z direction is around of 3-4 mm FWHM. The distribution of 3D-coordinates is shown in Figure 12a without rejection of Compton events and with such a rejection (b).
The number of photons detected within the energy window of 450 keV to 600 keV is used to determine the energy resolution of the detector. With the simulation we obtained an energy resolution of ≈12% (FWHM) (Figure 12b).
In monolithic crystal-based detector designs, a key challenge is the truncation of scintillation light at the edges, which negatively impacts spatial, timing, and energy resolutions in these regions. Various methods have been tested to mitigate this effect, including crystal surface treatments, such as covering the edges with an optical absorber, and innovative photodetector arrangements. To study the impact of position reconstruction at the crystal edges, we simulated 511 keV -rays impinging on the detector surface with the grid of 10 mm. As can be seen in Figure 11b the detector response is uniform around all surface accept 5 mm from edge of crystal assembly.
5. Discussion
In commercial PET systems, the detector typically uses a crystal array that forms a matrix of pixel elements with pixel size 4×4 mm2. The scintillation light produced in each pixel element is used to identify the interaction location based on the pixel’s position, meaning that the reconstructed interaction positions are limited to discrete values corresponding to the pixel layout. In contrast, monolithic scintillator detectors capture a continuous light distribution across their surface, which is detected by SiPM pixels, which size determine the detection grid. Each pixel covers a specific region of the scintillation crystal, converting the scintillation light into electrical signals. The signal level is proportional to the amount of light hitting the surface of the photodetector pixel, resulting in the continuous light distribution being digitized and organized into bins. Each bin represents a defined region of the scintillation crystal. A smaller bin size allows for more accurate digitization of the light distribution, capturing finer details of the scintillation light pattern. For commercial applications of monolithic-based PET detectors, the size of the SiPMs and the number of detection channels must be optimized to achieve a cost-effective solution while maintaining high performance. The 6×6 mm2 SiPMs arrays are used to cover large detection areas [36].
For the proposed WLS-PET detector design, the WLS-fiber size of 3×3 mm2 creates a detection grid with 66 fibers on each side of the crystal assembly, totaling 132 fibers. This configuration results in a "pixel" size of ≈ 3×3 mm2. The light is detected by 264 SiPMs, each with an active area of 3×3 mm2, and the total detector surface area is 2,376 mm2. For comparison, for the same 4×4 crystal assembly of LYSO with dimensions of 200 mm × 200 mm, the number of 6×6 mm2 SiPMs would be 1,089, with a total area of 39,204 mm2. The
This results in the total SiPM area for the WLS-PET design being just 6% of that required for a traditional SiPM-based design. In spite of smaller photosensor area, much finer detection grid can be created with the WLS-PET detector design, offering better reconstruction of the details of gamma ray interactions with the crystal. The details of gamma ray interactions with the crystal can be used for Compton kinematic reconstruction, which results in improved detection sensitivity. By accurately tracking the interactions, including Compton scattering events, the system can better localize the initial photon interaction point and refine the reconstruction of the line of response (LOR). This enhanced sensitivity helps in improving the overall image quality, particularly in detecting small structures and providing more accurate spatial resolution in PET imaging.
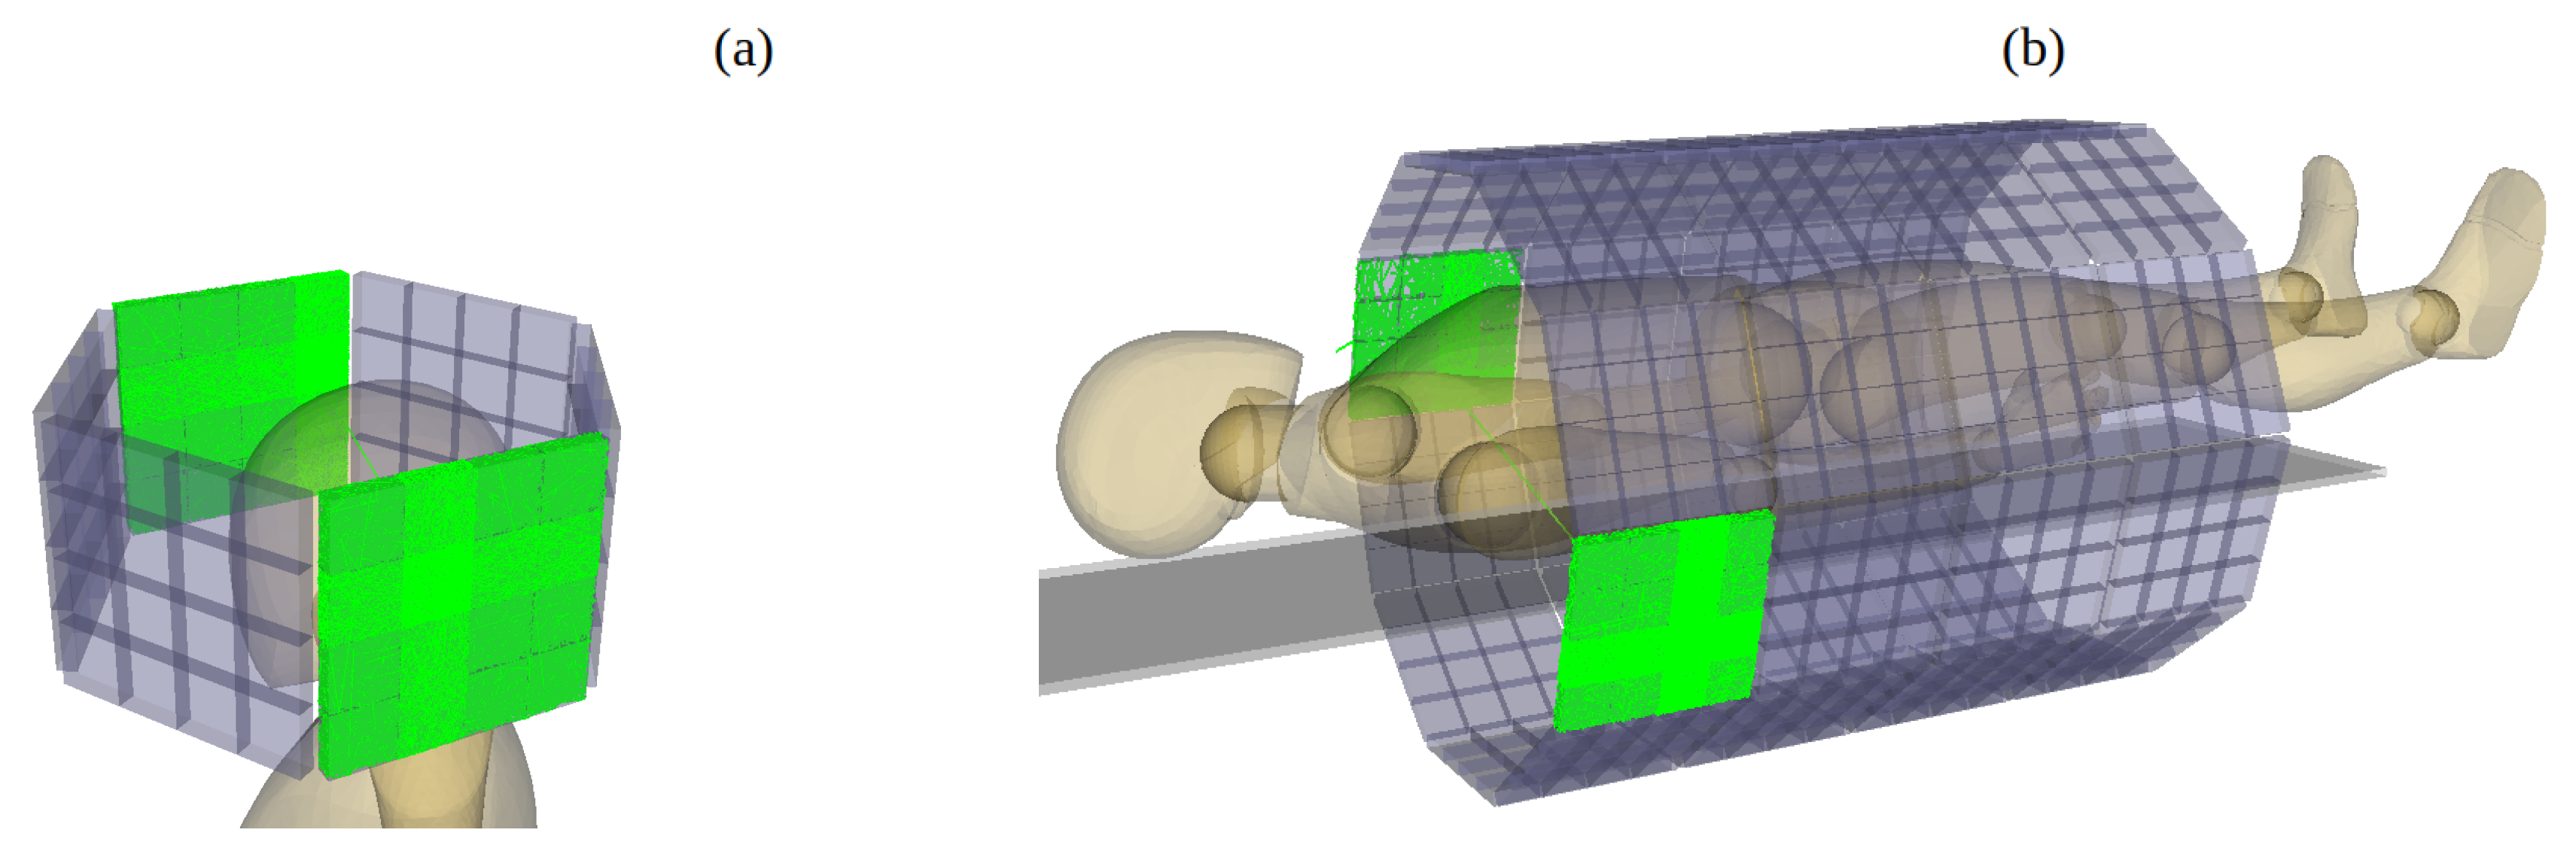
The proposed novel WLS-PET detector design can be used in the construction of organ-specific or whole-body PET scanners, as the drastic reduction in the number of SiPMs and readout channels makes the design cost-effective, while maintaining very high spatial resolution. The schematic design of the potential organ-specific or whole-body PET scanners is shown in Figure 13.
6. Conclusion
We designed and evaluated the performance of a WLS-PET detector featuring an assembly of optically coupled monolithic crystals with large surface areas of 200×200 mm2 and LYSO crystal thickness 7 mm and 15 mm. The detector utilizes 3 mm WLS fibers with square cross-sections for light readout, providing a fine detection grid while maintaining a simplified and cost-effective design. This configuration enables high spatial resolution and efficient gamma-ray interaction localization, demonstrating its potential for advanced PET imaging applications. In the proposed WLS-PET detector, the interaction position of annihilation -rays within the scintillation crystal assembly is determined by measuring the light profiles trapped in wavelength-shifting (WLS) fibers coupled to the crystal assembly. The detector achieves a position resolution of approximately 1.2 mm FWHM and 4.3 mm FWTM for 7 mm LYSO crystal thickness and 1.7 mm FWHM and 4.8 mm FWTM for 15 mm LYSO crystal thickness. The spatial resolution compatible with commercial detectors is achieved while significantly reducing the number of SiPMs and readout channels required, making the WLS-PET design both cost-effective and simpler compared to traditional systems.
Funding
This research has received no external funding.
References
- Larobina, M.; Brunetti, A.; Salvatore, M. Small animal PET: a review of commercially available imaging systems. Current Medical Imaging 2006, 2, 187–192. [Google Scholar] [CrossRef]
- Stickel, J.R.; Cherry, S.R. High-resolution PET detector design: modelling components of intrinsic spatial resolution. Physics in Medicine & Biology 2004, 50, 179. [Google Scholar]
- Yang, Y.; Wu, Y.; Qi, J.; James, S.S.; Du, H.; Dokhale, P.A.; Shah, K.S.; Farrell, R.; Cherry, S.R. A prototype PET scanner with DOI-encoding detectors. Journal of Nuclear Medicine 2008, 49, 1132–1140. [Google Scholar] [CrossRef] [PubMed]
- Schaart, D.R.; van Dam, H.T.; Seifert, S.; Vinke, R.; Dendooven, P.; Löhner, H.; Beekman, F.J. A novel, SiPM-array-based, monolithic scintillator detector for PET. Physics in Medicine & Biology 2009, 54, 3501. [Google Scholar]
- Yoshida, E.; Inadama, N.; Osada, H.; Kawai, H.; Nishikido, F.; Murayama, H.; Tsuda, T.; Yamaya, T. Basic performance of a large area PET detector with a monolithic scintillator. Radiological physics and technology 2011, 4, 134–139. [Google Scholar] [CrossRef]
- González, A.J.; Aguilar, A.; Conde, P.; Hernández, L.; Moliner, L.; Vidal, L.F.; Sánchez, F.; Sánchez, S.; Correcher, C.; Molinos, C.; et al. A PET design based on SiPM and monolithic LYSO crystals: performance evaluation. IEEE Transactions on Nuclear Science 2016, 63, 2471–2477. [Google Scholar] [CrossRef]
- Sánchez, F.; Orero, A.; Soriano, A.; Correcher, C.; Conde, P.; González, A.; Hernández, L.; Moliner, L.; Rodríguez-Alvarez, M.J.; Vidal, L.; et al. ALBIRA: a small animal PET/SPECT/CT imaging system. Medical physics 2013, 40, 051906. [Google Scholar] [CrossRef] [PubMed]
- Moliner, L.; Gonzalez, A.; Soriano, A.; Sanchez, F.; Correcher, C.; Orero, A.; Carles, M.; Vidal, L.; Barbera, J.; Caballero, L.; et al. Design and evaluation of the MAMMI dedicated breast PET. Medical physics 2012, 39, 5393–5404. [Google Scholar] [CrossRef]
- Mollet, P.; Deprez, K.; Vandeghinste, B.; Neyt, S.; Marcinkowski, R.; Vandenberghe, S.; Van Holen, R. The β-CUBE, a high-end compact preclinical benchtop PET for total body imaging, 2017.
- Morrocchi, M.; Ambrosi, G.; Bisogni, M.G.; Bosi, F.; Boretto, M.; Cerello, P.; Ionica, M.; Liu, B.; Pennazio, F.; Piliero, M.A.; et al. Depth of interaction determination in monolithic scintillator with double side SiPM readout. EJNMMI physics 2017, 4, 1–25. [Google Scholar] [CrossRef] [PubMed]
- Díaz-Martínez, V.D.; Ambrosio-Macías, N.I.; Murrieta-Rodríguez, T.; Martínez-Dávalos, A.; Rodríguez-Villafuerte, M.; Alva-Sánchez, H. Depth of interaction in monolithic scintillators for positron emission tomography. In Proceedings of the AIP Conference Proceedings. AIP Publishing. 2021; 2348, 050004. [Google Scholar]
- Freire, M.; Echegoyen, S.; Gonzalez-Montoro, A.; Sanchez, F.; Gonzalez, A.J. Performance evaluation of side-by-side optically coupled monolithic LYSO crystals. Medical Physics 2022, 49, 5616–5626. [Google Scholar] [CrossRef]
- Vinke, R.; Levin, C.S. A method to achieve spatial linearity and uniform resolution at the edges of monolithic scintillation crystal detectors. Physics in Medicine & Biology 2014, 59, 2975. [Google Scholar]
- Morrocchi, M.; Hunter, W.; Del Guerra, A.; Lewellen, T.; Kinahan, P.; MacDonald, L.; Bisogni, M.G.; Miyaoka, R. Evaluation of event position reconstruction in monolithic crystals that are optically coupled. Physics in Medicine Biology.
- Worstell, W.; Doulas, S.; Johnson, O.; Lin, C.J. Scintillator crystal readout with wavelength-shifting optical fibers. In Proceedings of the Proceedings of 1994 IEEE Nuclear Science Symposium-NSS’94. IEEE. 1994; 4, 1869–1873. [Google Scholar]
- Worstell, W.; Johnson, O.; Zawarzin, V. Development of a high-resolution PET detector using LSO and wavelength-shifting fibers. In Proceedings of the 1995 IEEE Nuclear Science Symposium and Medical Imaging Conference Record. IEEE, 1995; 3, 1756–1760. [Google Scholar]
- Du, H.; Yang, Y.; Cherry, S.R. Comparison of four depth-encoding PET detector modules with wavelength shifting (WLS) and optical fiber read-out. Physics in Medicine & Biology 2008, 53, 1829. [Google Scholar]
- An, S.J.; Kim, H.i.; Lee, C.Y.; Song, H.K.; Park, C.W.; Chung, Y.H. Design and simulation of depth-encoding PET detector using wavelength-shifting (WLS) fiber readout. IEIE Transactions on Smart Processing and Computing 2015, 4, 305–310. [Google Scholar] [CrossRef]
- Cargille. Optical Mounting Media – Meltmount, DATASHEET from. https://www.cargille.com/mounting-media/.
- Collaboration, G.; et al. Geant4 Book for Application Developers, Release 10.5. CERN, Geneva, Switzerland, 2019. [Google Scholar]
- Gumplinger, P. Optical photon processes in Geant4. In Proceedings of the Users’ Workshop at CERN. 2002. [Google Scholar]
- Wanarak, C.; Chewpraditkul, W.; Phunpueok, A.; Kaewkhao, J. Luminescence and scintillation properties of Ce-doped LYSO and YSO crystals. Advanced Materials Research 2011, 199, 1796–1803. [Google Scholar] [CrossRef]
- Wanarak, C.; Chewpraditkul, W.; Phunpueok, A. Light yield non-proportionality and energy resolution of Lu1. 8Y0. 2SiO5: Ce and LaCl3: Ce scintillation crystals. Advanced Materials Research 2011, 284, 2002–2007. [Google Scholar] [CrossRef]
- Pidol, L.; Kahn-Harari, A.; Viana, B.; Virey, E.; Ferrand, B.; Dorenbos, P.; de Haas, J.T.; van Eijk, C.W. High efficiency of lutetium silicate scintillators, Ce-doped LPS, and LYSO crystals. IEEE Transactions on Nuclear Science 2004, 51, 1084–1087. [Google Scholar] [CrossRef]
- Blahuta, S.; Ouspenski, V.; Menge, P.; Yang, K. Next Generation LYSO: Ce, Ca Single Crystals. Context 2018, 27, 53. [Google Scholar]
- Mao, R.; Wu, C.; Lu, S.; et al. Crystal growth and scintillation properties of LSO and LYSO crystals. Journal of crystal growth 2013, 368, 97–100. [Google Scholar] [CrossRef]
- Vilardi, I.; Braem, A.; Chesi, E.; Ciocia, F.; Colonna, N.; Corsi, F.; Cusanno, F.; De Leo, R.; Dragone, A.; Garibaldi, F.; et al. Optimization of the effective light attenuation length of YAP: Ce and LYSO: Ce crystals for a novel geometrical PET concept. Nuclear Instruments and Methods in Physics Research Section A: Accelerators, Spectrometers, Detectors and Associated Equipment. 2006; 564, 506–514. [Google Scholar]
- van der Laan, D.J.; Schaart, D.R.; Maas, M.C.; Beekman, F.J.; Bruyndonckx, P.; van Eijk, C.W. Optical simulation of monolithic scintillator detectors using GATE/GEANT4. Physics in Medicine & Biology 2010, 55, 1659–1675. [Google Scholar]
- Solutions, L. Luxium Solutions. https://luxiumsolutions.com/radiation-detection-cintillators/fibers, 2024.
- Georgadze, A. ; Shivani.; Tayefi, K.A.; Moskal, P. Optimization of the WLS design for positron emission mammography and Total-Body J-PET systems.
- Brun, R.; Rademakers, F. ROOT — An object oriented data analysis framework. Nuclear Instruments and Methods in Physics Research Section A: Accelerators, Spectrometers, Detectors and Associated Equipment 1997, 389, 81–86. New Computing Techniques in Physics Research V. [CrossRef]
- Anger, H.O. Scintillation camera. Review of scientific instruments 1958, 29, 27–33. [Google Scholar] [CrossRef]
- Zatcepin, A.; Pizzichemi, M.; Polesel, A.; Paganoni, M.; Auffray, E.; Ziegler, S.I.; Omidvari, N. Improving depth-of-interaction resolution in pixellated PET detectors using neural networks. Physics in Medicine & Biology 2020, 65, 175017. [Google Scholar]
- Gong, K.; Berg, E.; Cherry, S.R.; Qi, J. Machine Learning in PET: From Photon Detection to Quantitative Image Reconstruction. Proceedings of the IEEE 2020, 108, 51–68. [Google Scholar] [CrossRef]
- Gonzalez-Montoro, A.; Gonzalez, A.J.; Pourashraf, S.; Miyaoka, R.S.; Bruyndonckx, P.; Chinn, G.; Pierce, L.A.; Levin, C.S. Evolution of PET Detectors and Event Positioning Algorithms Using Monolithic Scintillation Crystals. IEEE Transactions on Radiation and Plasma Medical Sciences 2021, 5, 282–305. [Google Scholar] [CrossRef]
- Carra, P.; Bisogni, M.G.; Ciarrocchi, E.; Morrocchi, M.; Sportelli, G.; Rosso, V.; Belcari, N. A neural network-based algorithm for simultaneous event positioning and timestamping in monolithic scintillators. Physics in Medicine & Biology 2022, 67, 135001. [Google Scholar]
Figure 1.
Schematic of detector module composed of a 4 × 4 assembly of LYSO crystals.
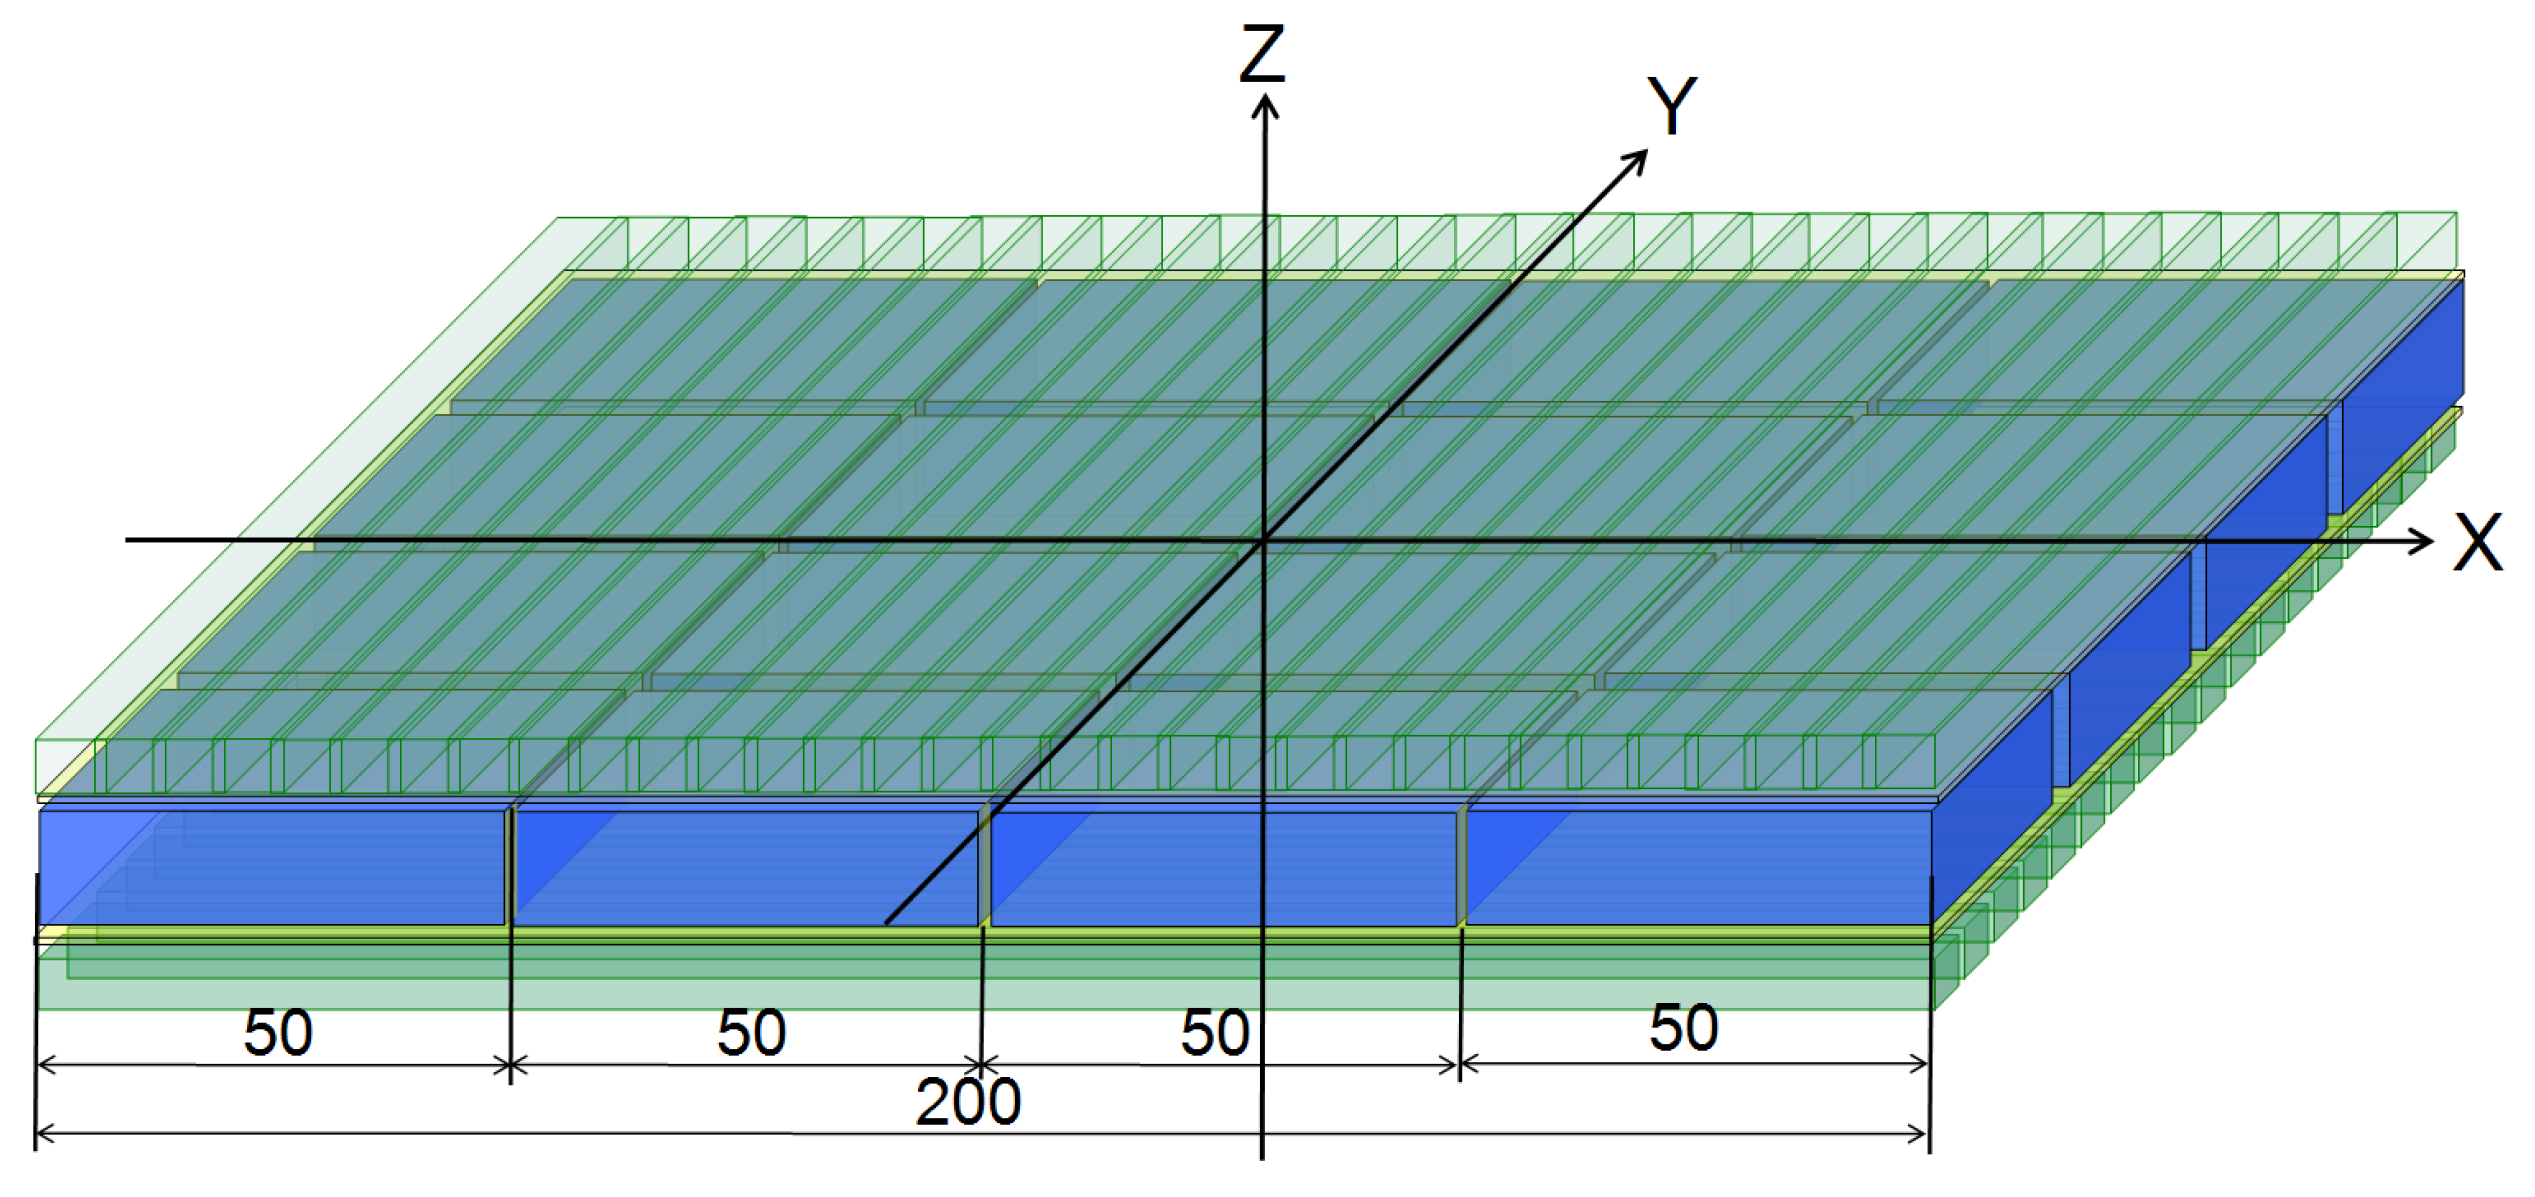
Figure 3.
Example of one event with the secondary scintillation photons simulated in GEANT4 for LYSO assembly. The light green lines are the tracks of optical photons, the red boxes are SiPMs.
Figure 3.
Example of one event with the secondary scintillation photons simulated in GEANT4 for LYSO assembly. The light green lines are the tracks of optical photons, the red boxes are SiPMs.
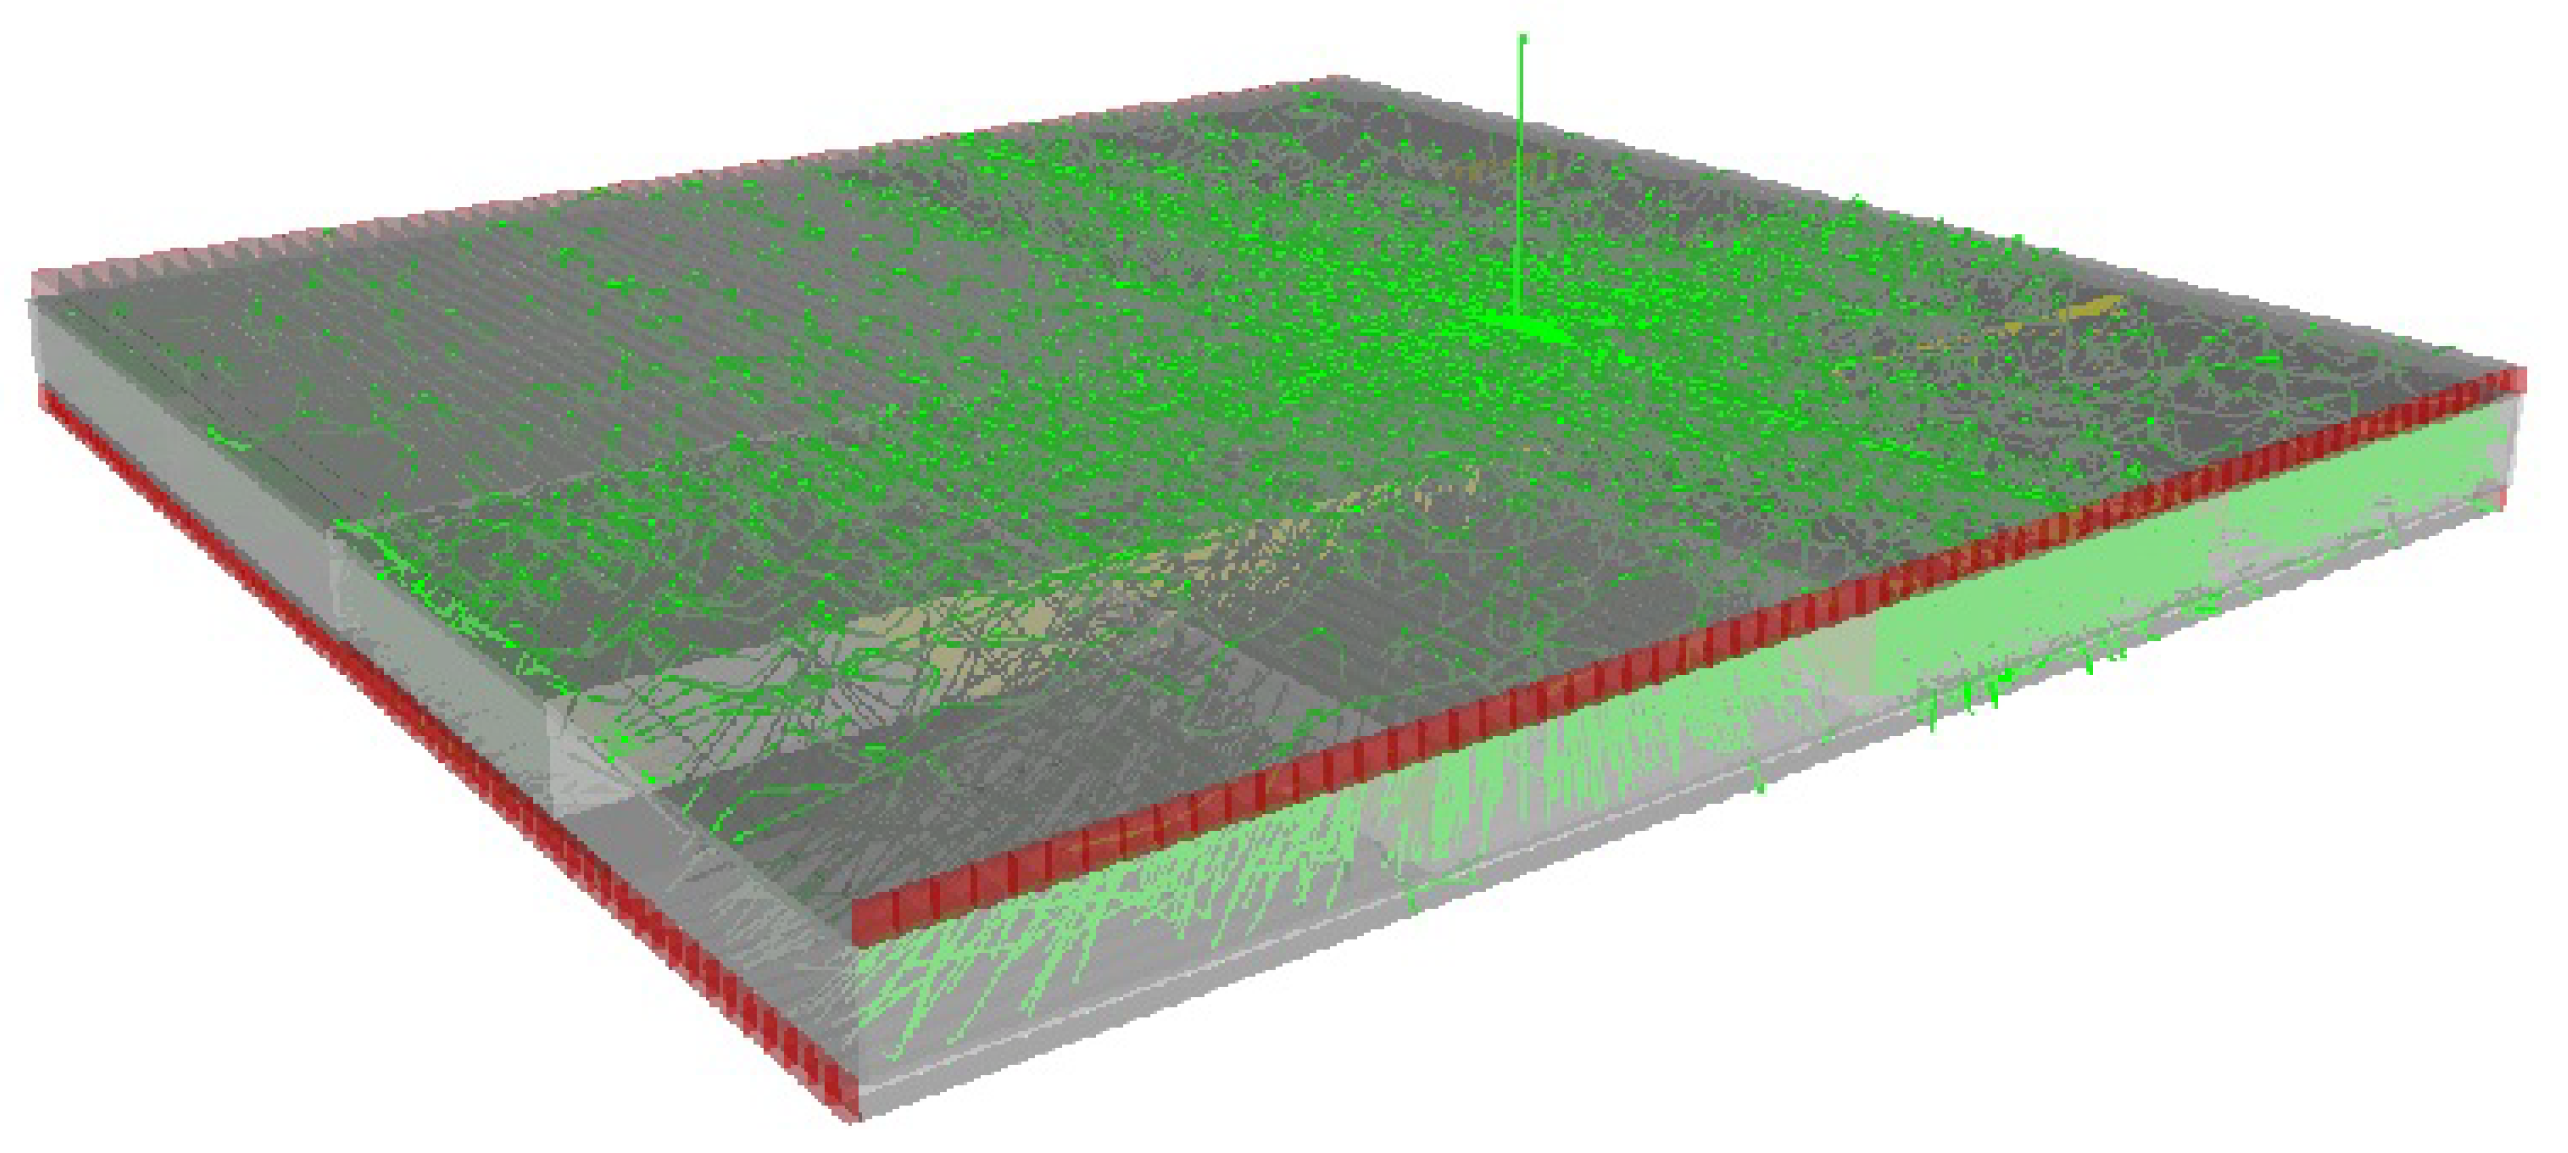
Figure 4.
(a) and (b) plots show the and light distribution profiles in (a) and (b) directions in typical event displaying the photoelectron absorption like event. The simulated data are fitted by Gaussian function. The blue curve is simulated results and the red curve is Gaussian fitting, magenta curve is a high resolution peak search function. (c) – distribution image got from combining signals from and WLS fibers; (d) – distribution image shown in 3-d.
Figure 6.
Reconstructed interaction position of a 511 keV -ray beam modeled at ( , ) =(20 mm, 15 mm) for crystal thickness 7 mm (a) before and (b) after cut on Compton peaks. A Lorentzian fit to the distribution is also shown (red curve).
Figure 6.
Reconstructed interaction position of a 511 keV -ray beam modeled at ( , ) =(20 mm, 15 mm) for crystal thickness 7 mm (a) before and (b) after cut on Compton peaks. A Lorentzian fit to the distribution is also shown (red curve).
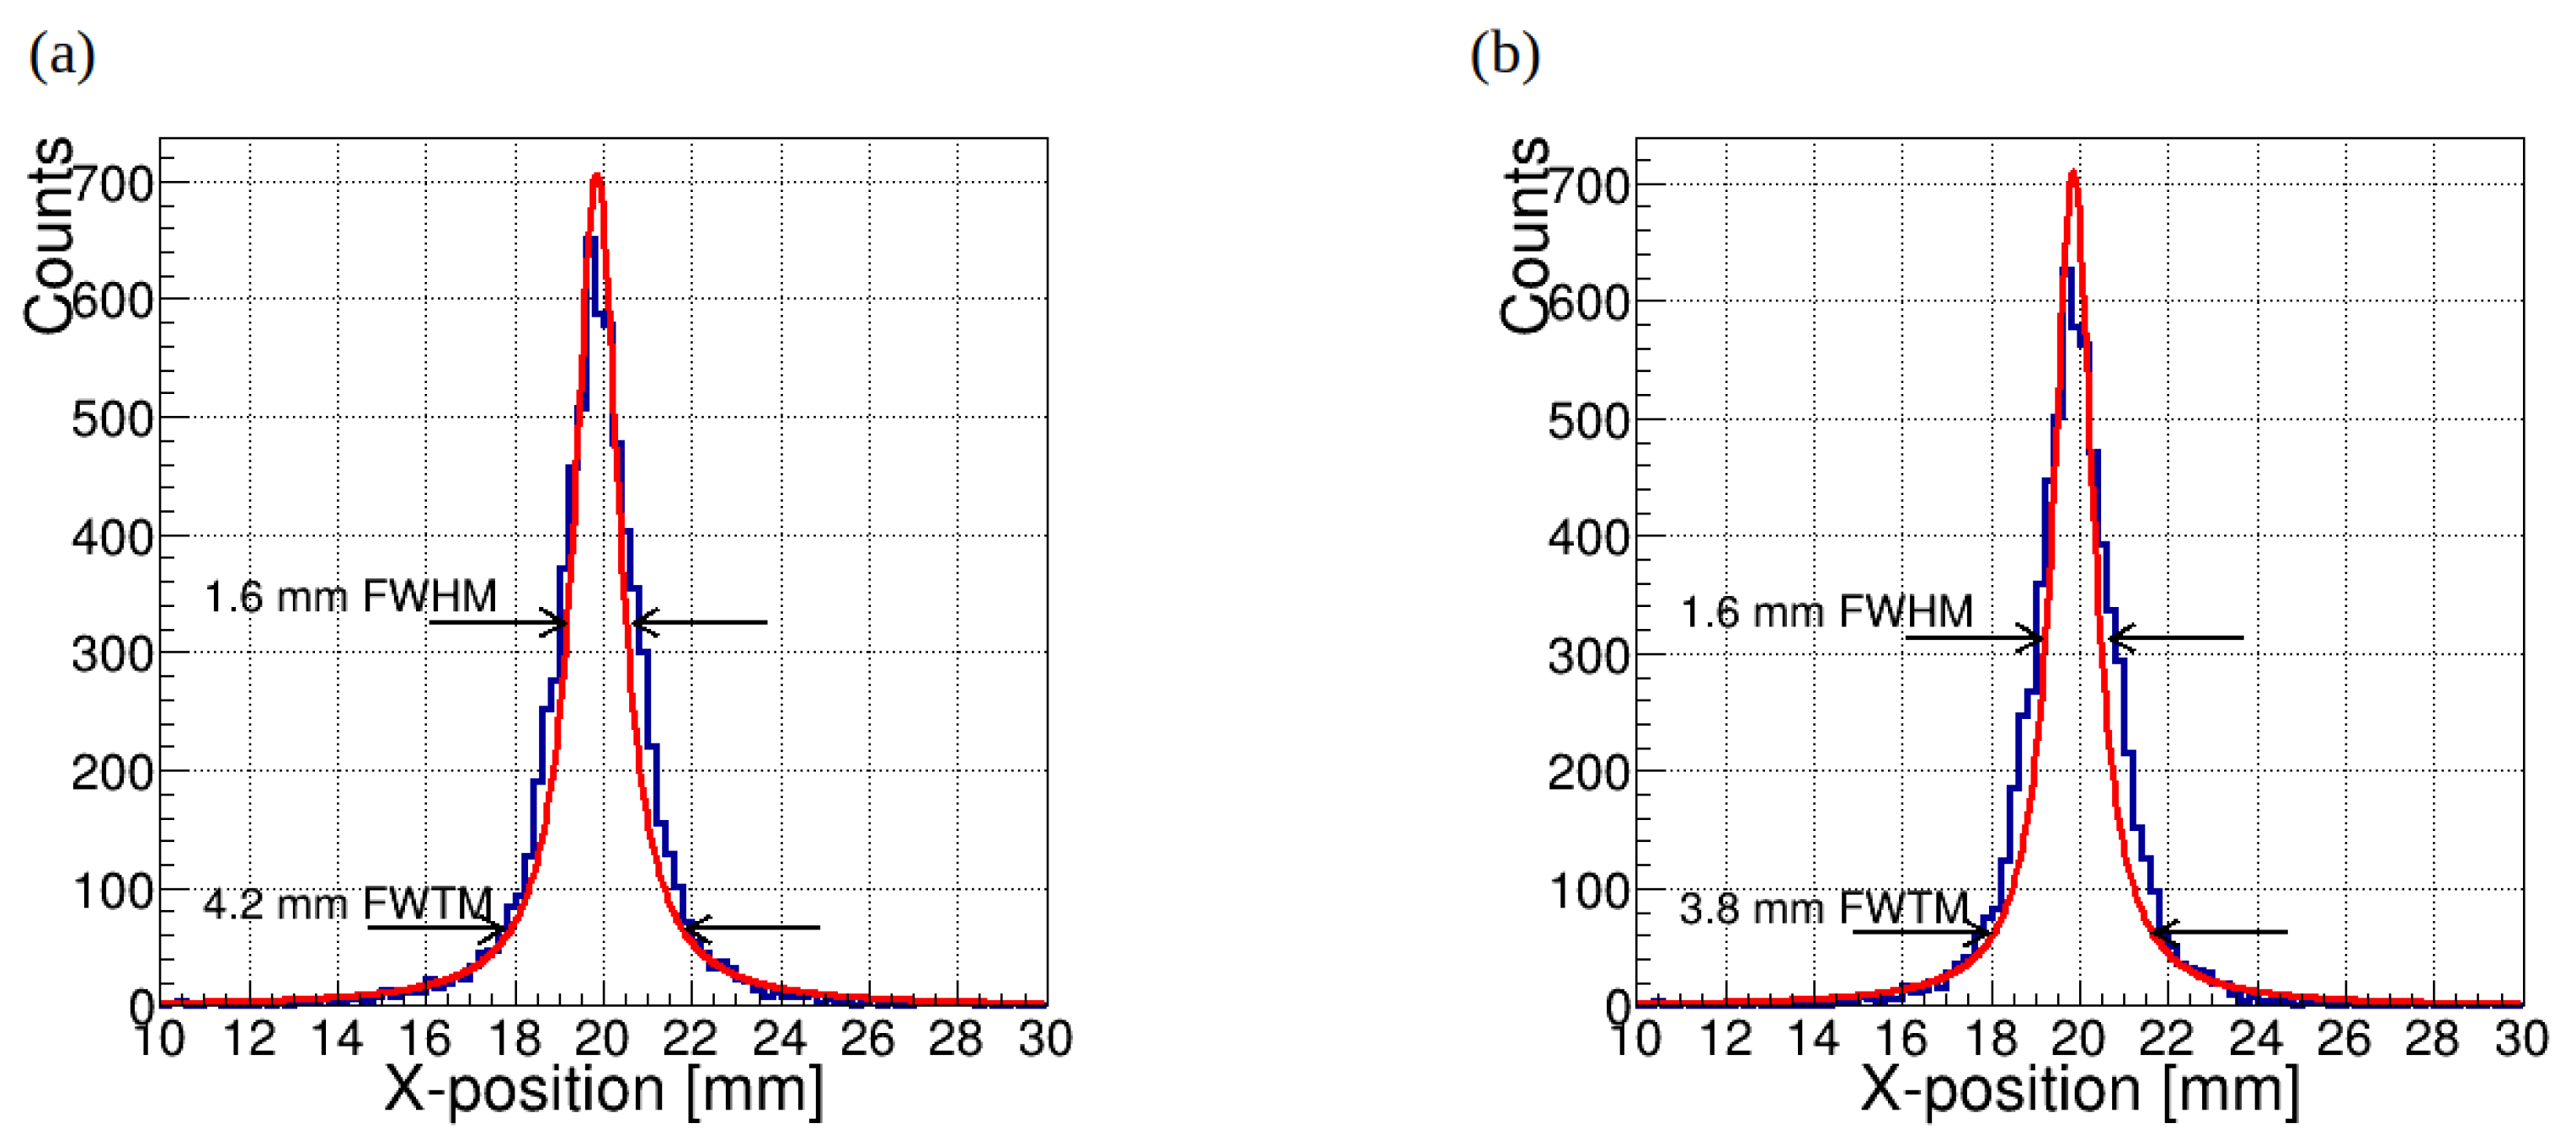
Figure 7.
Reconstructed interaction position of a 511 keV -ray beam modeled at ( , ) =(15 mm, 15 mm) for crystal thickness 15 mm (a) before and (b) after cut on Compton peaks. A Lorentzian fit to the distribution is also shown (red curve).
Figure 7.
Reconstructed interaction position of a 511 keV -ray beam modeled at ( , ) =(15 mm, 15 mm) for crystal thickness 15 mm (a) before and (b) after cut on Compton peaks. A Lorentzian fit to the distribution is also shown (red curve).
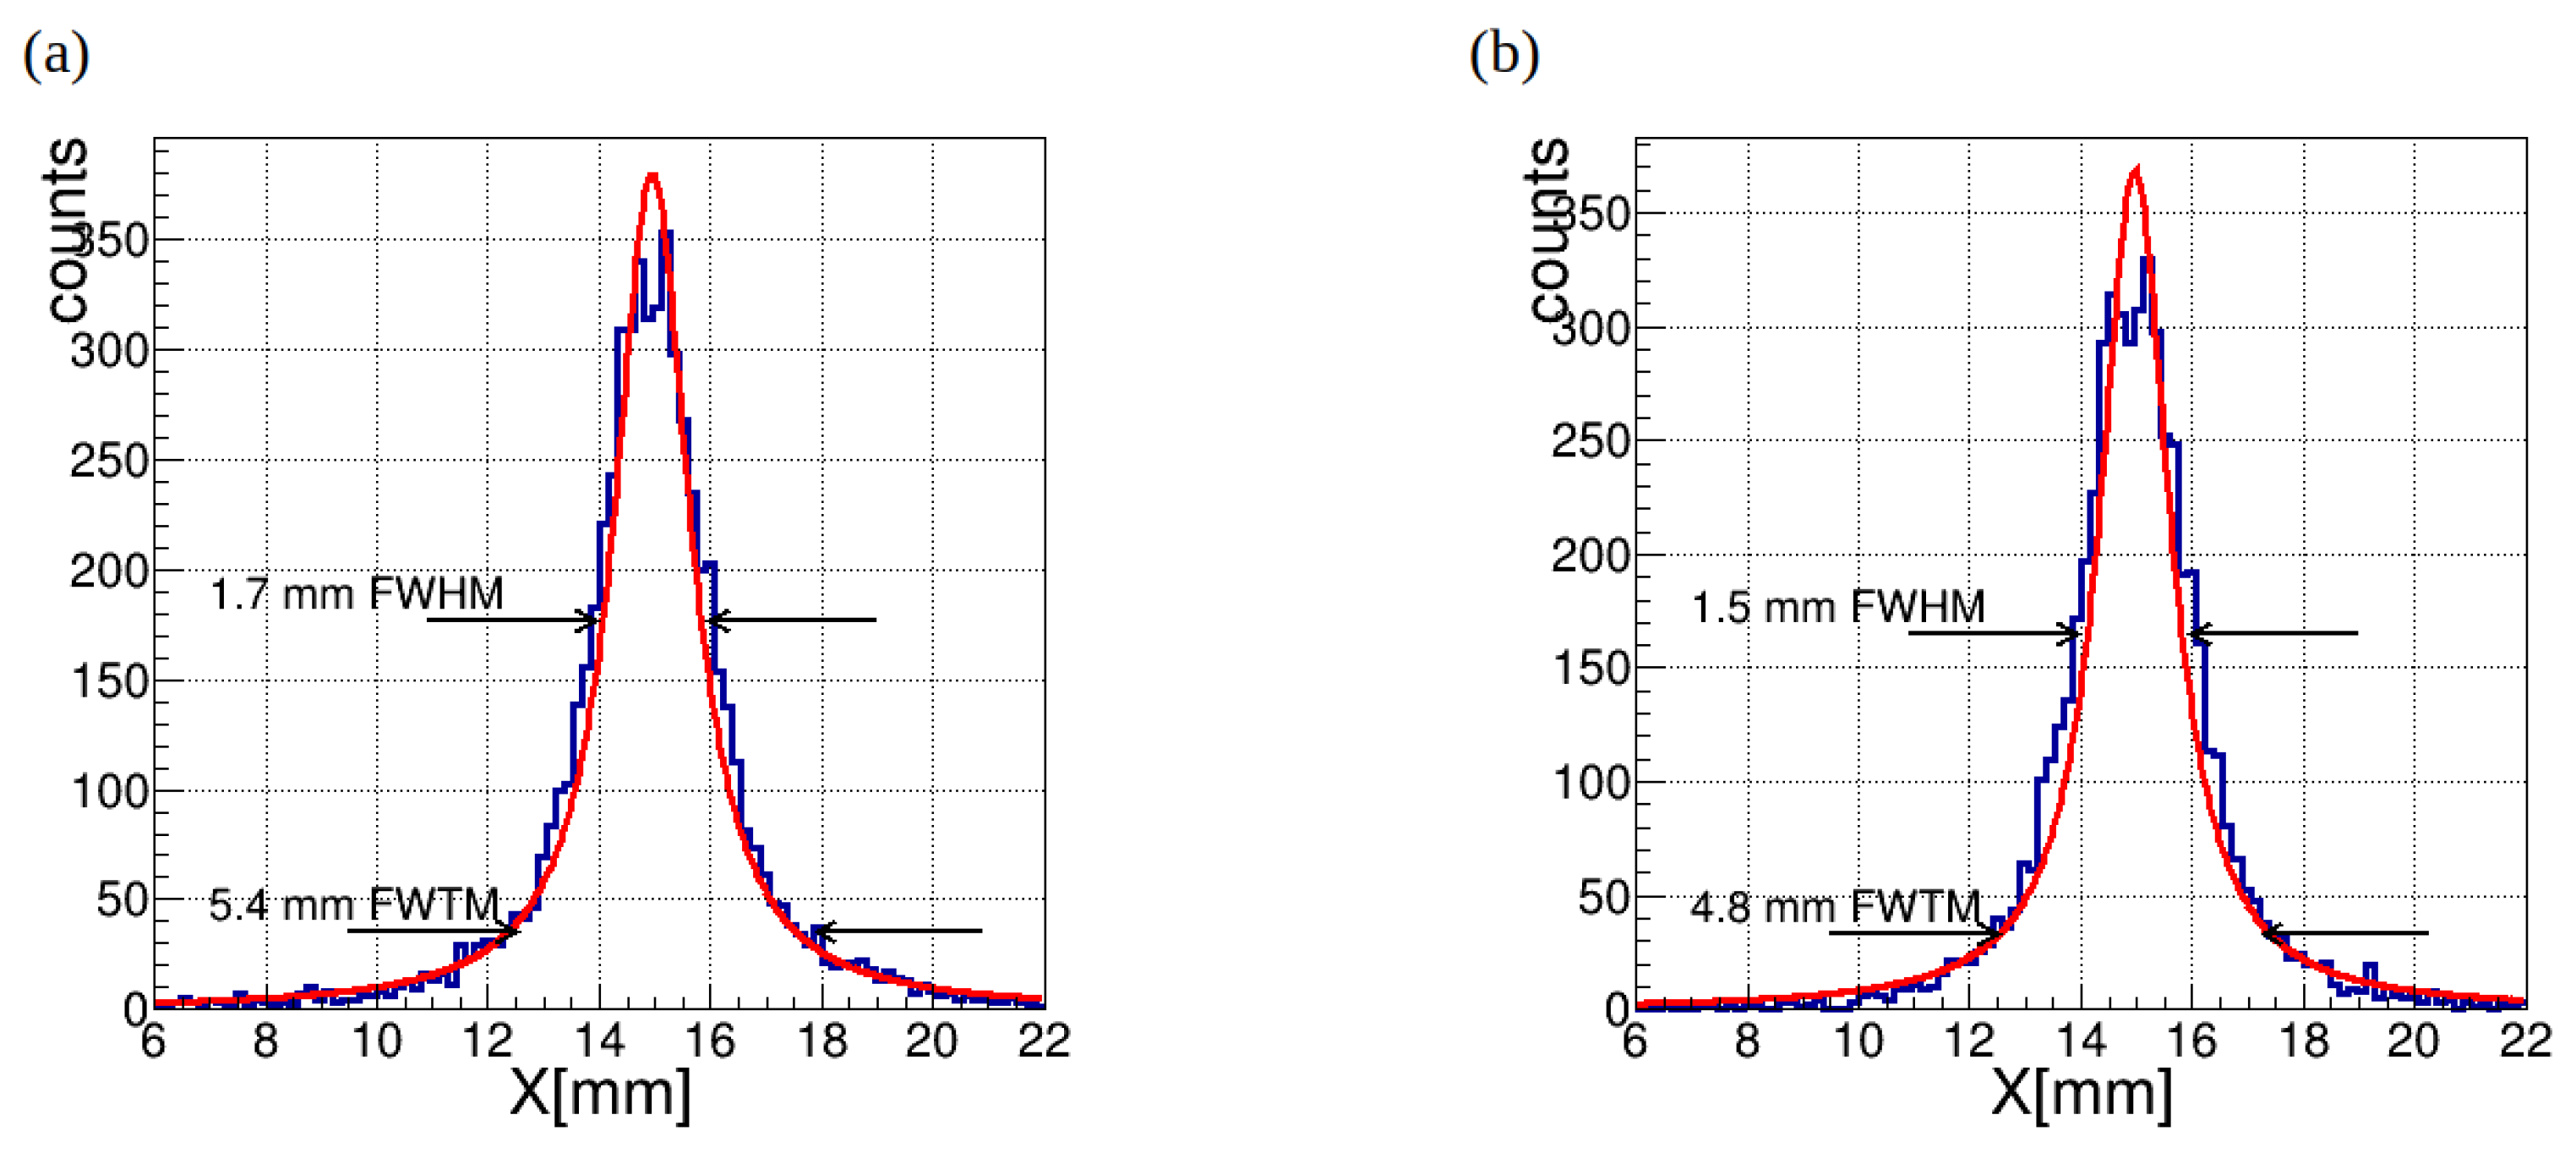
Figure 8.
Example of an arbitrary event simulated with the 15 mm thick crystal and fitted to the Lorentzian-model; (a) no Compton events rejection; (b) Compton events rejection applied
Figure 8.
Example of an arbitrary event simulated with the 15 mm thick crystal and fitted to the Lorentzian-model; (a) no Compton events rejection; (b) Compton events rejection applied
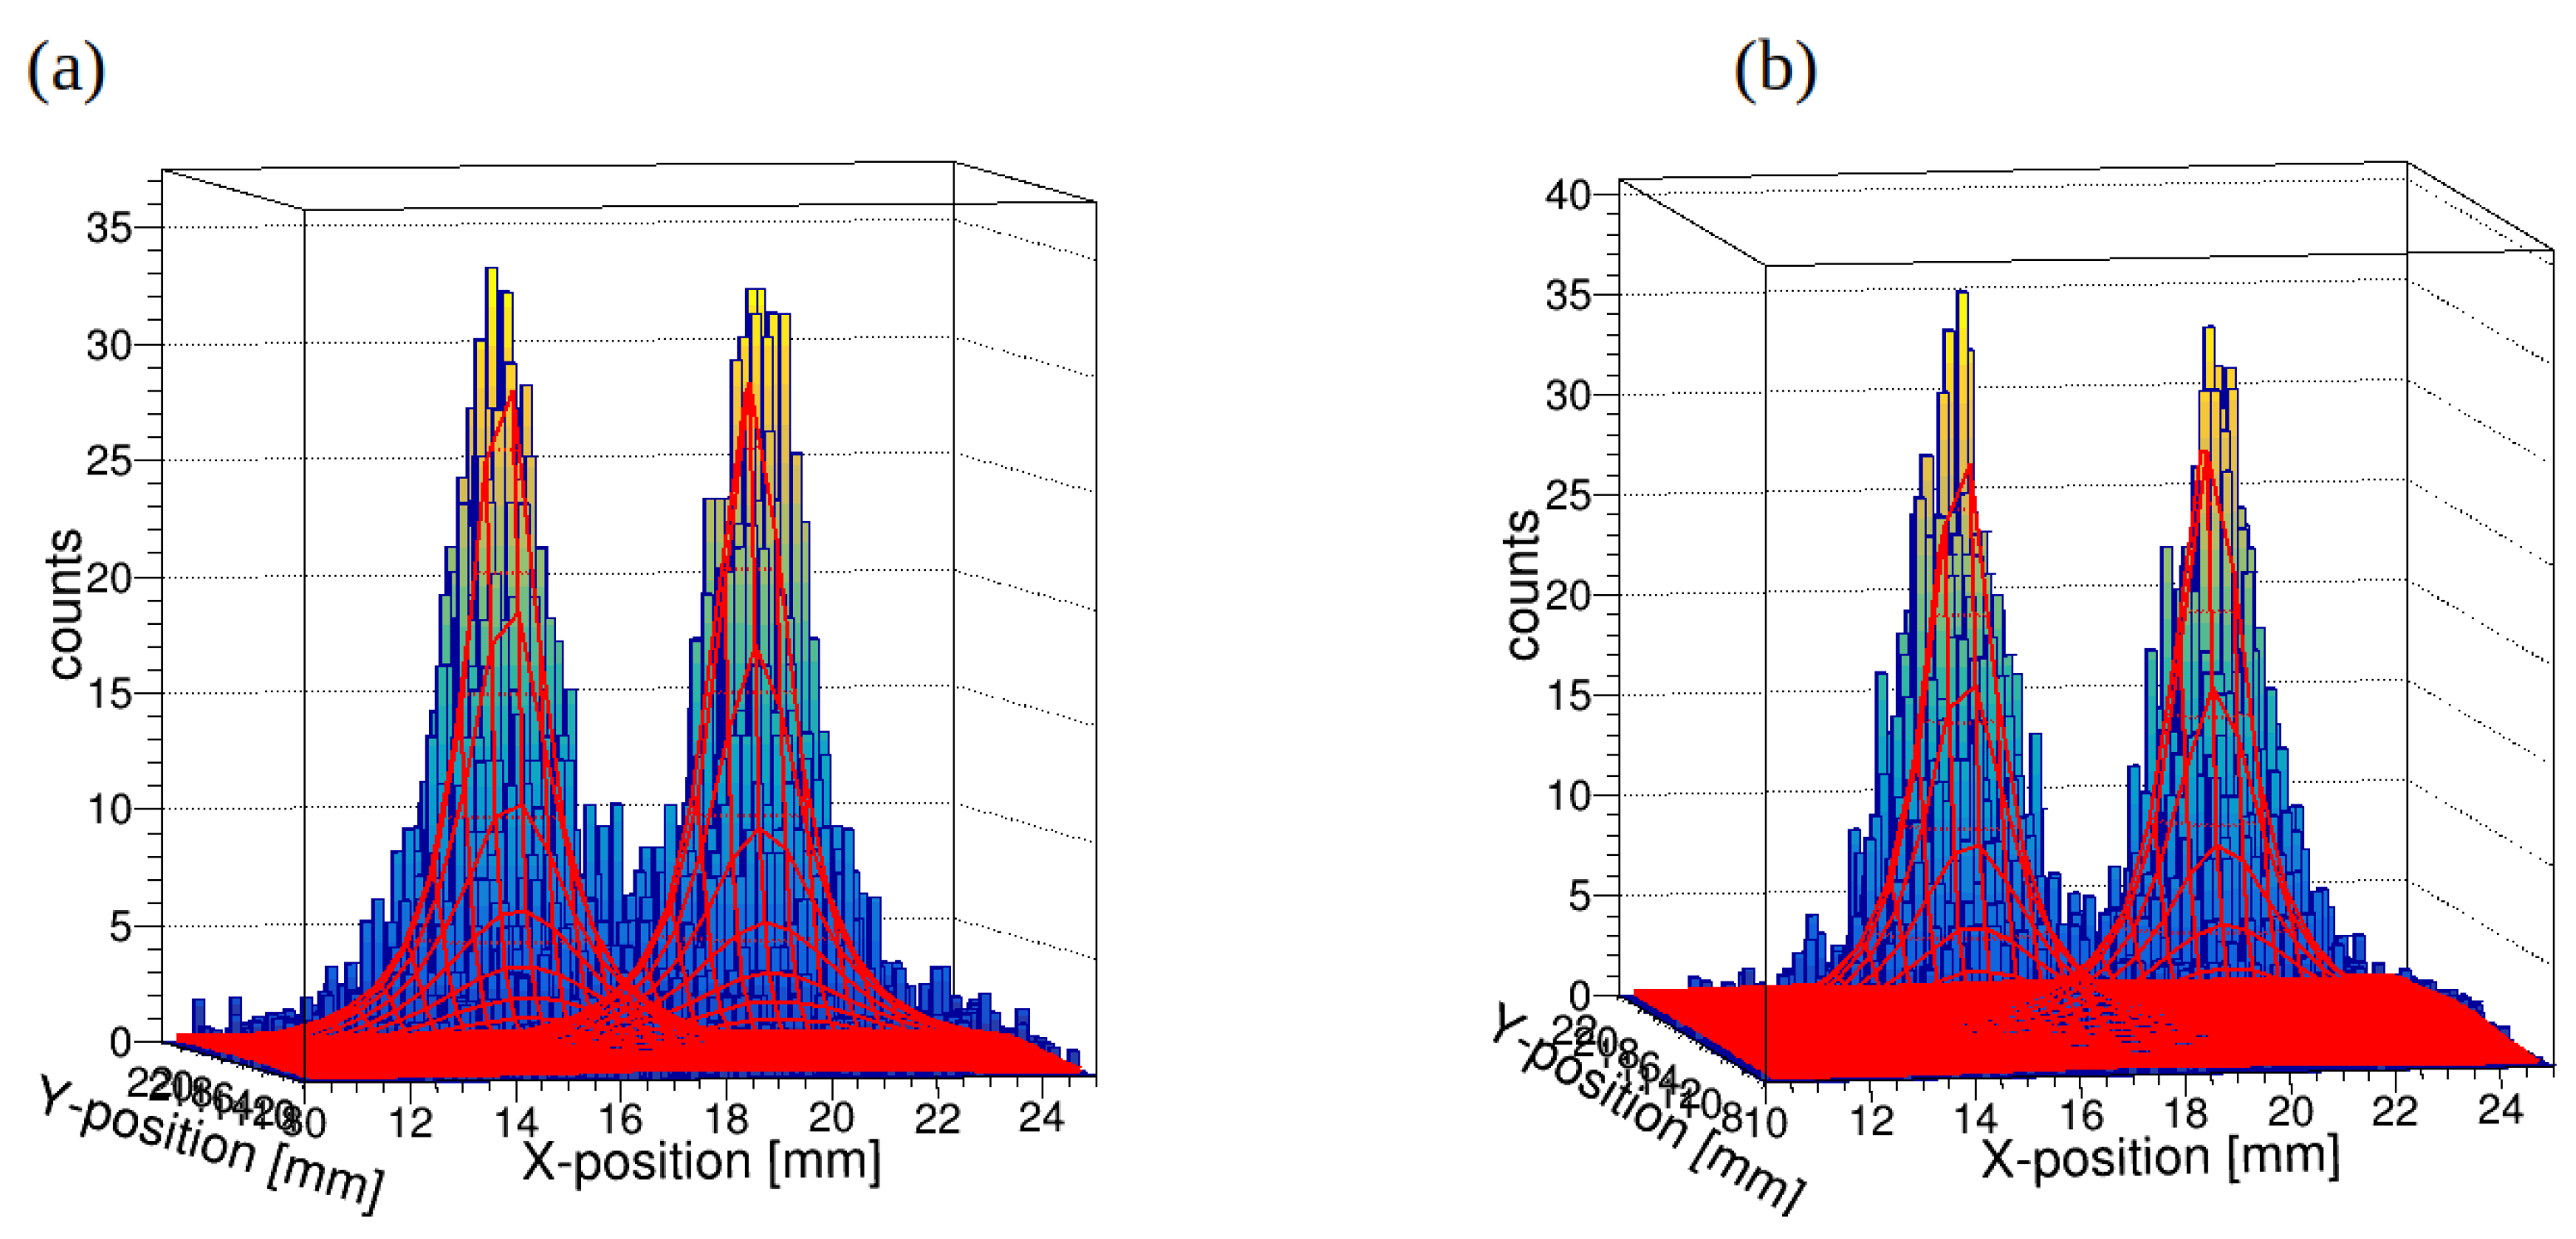
Figure 9.
(a) XY-histograms of interaction position reconstruction of the 511 keV -rays for crystal thickness 7 mm; (b) the same figure but after cut on multiple peaks detected.
Figure 9.
(a) XY-histograms of interaction position reconstruction of the 511 keV -rays for crystal thickness 7 mm; (b) the same figure but after cut on multiple peaks detected.
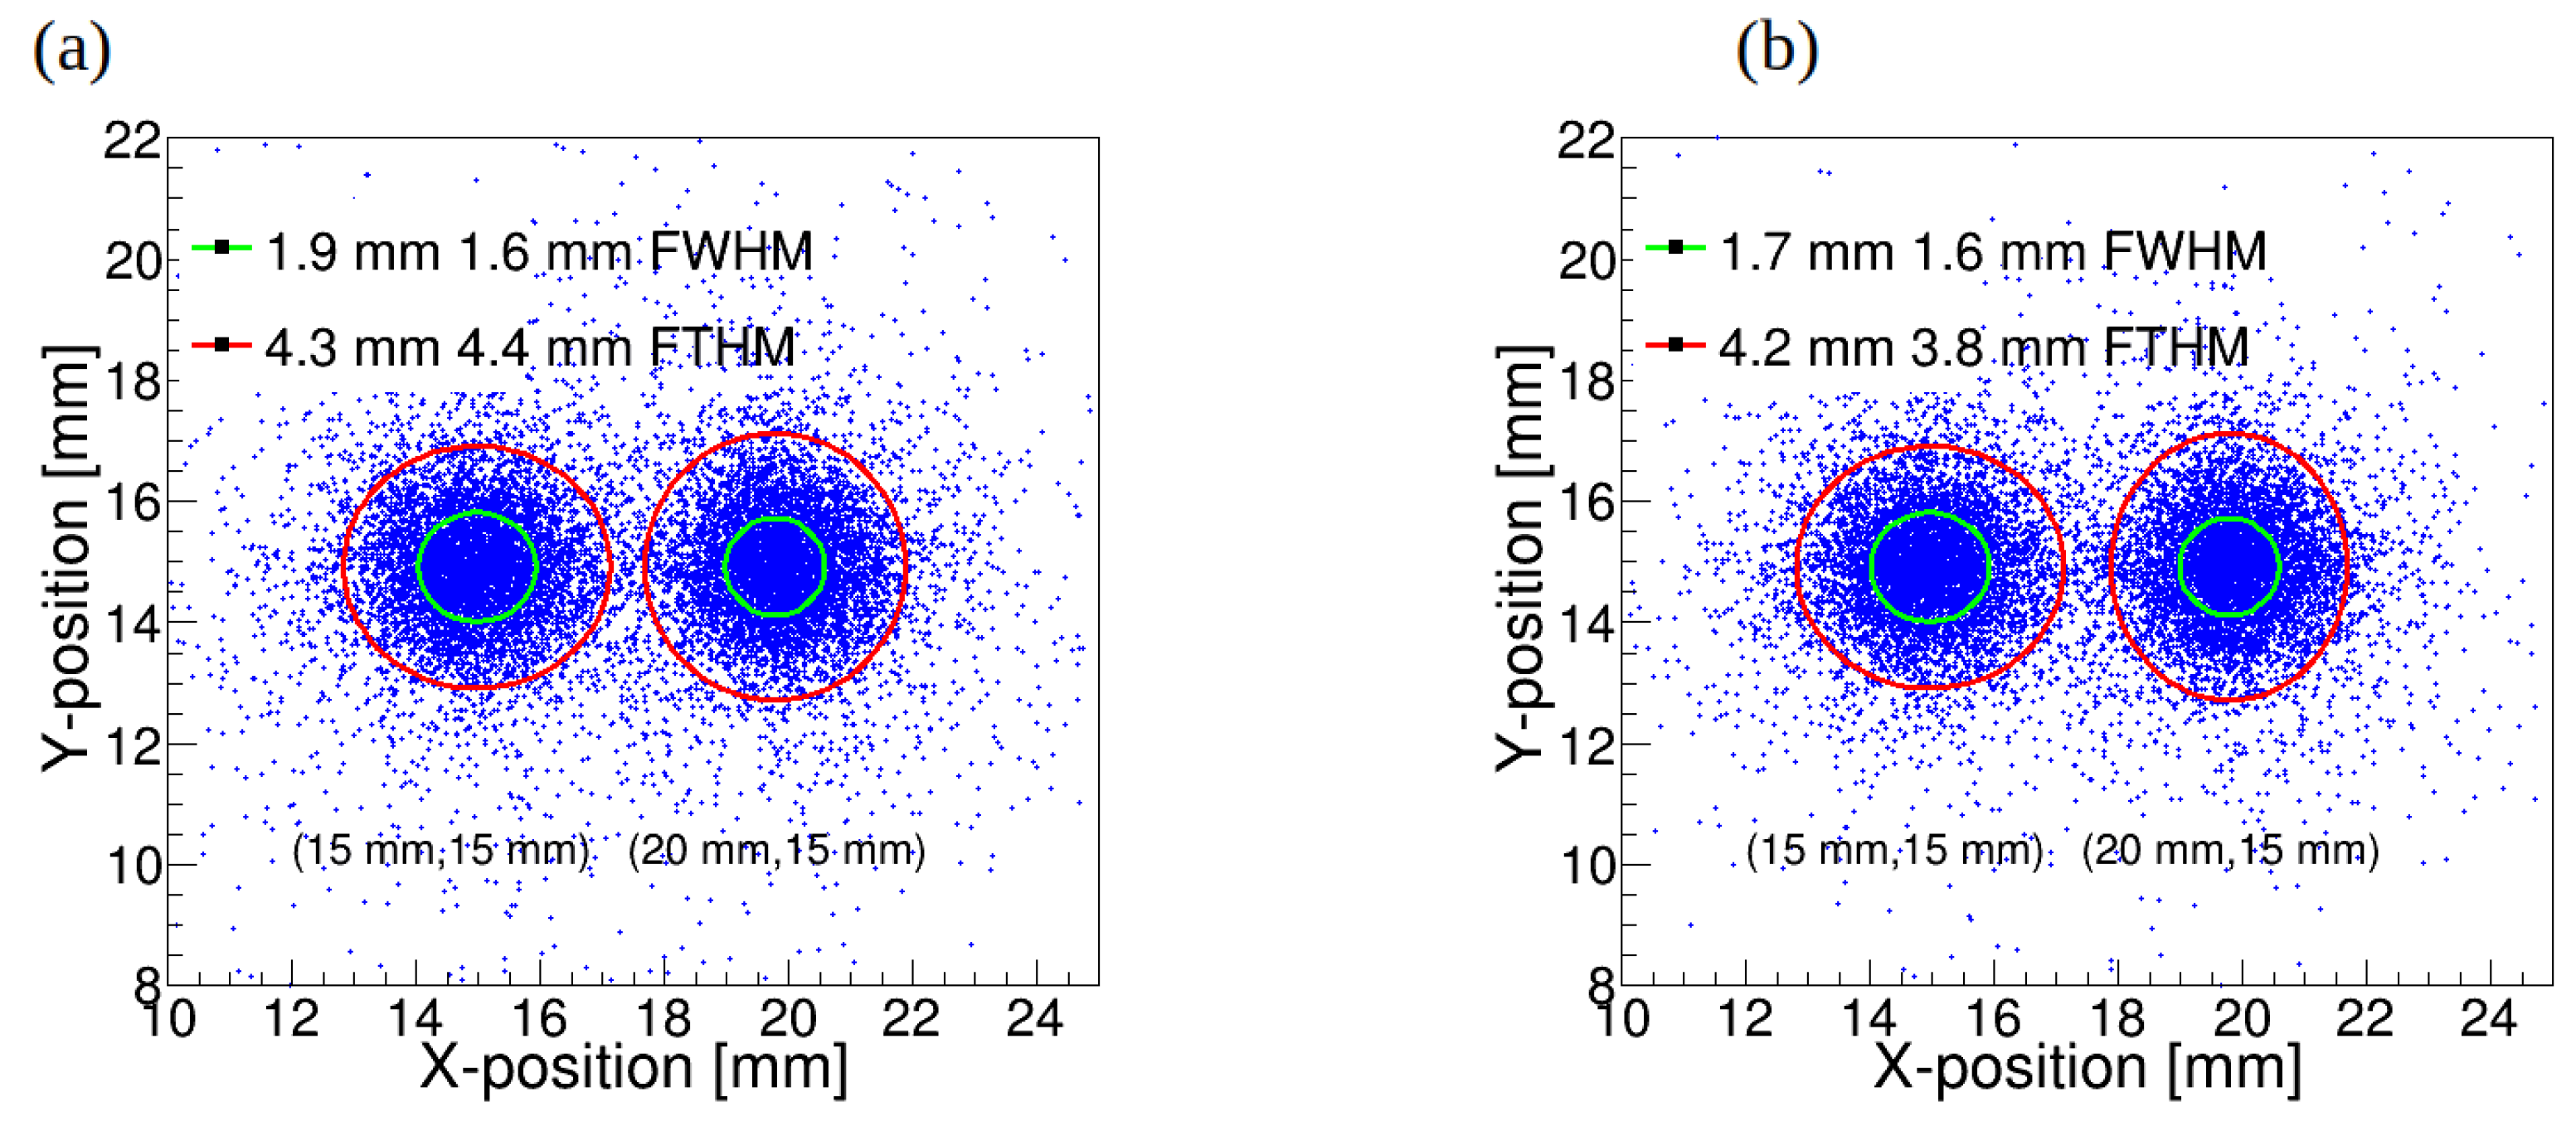
Figure 10.
(a) XY-histograms of interaction position reconstruction of the 511 keV -rays for crystal thickness 15 mm; (b) the same figure but after cut on multiple peaks detected.
Figure 10.
(a) XY-histograms of interaction position reconstruction of the 511 keV -rays for crystal thickness 15 mm; (b) the same figure but after cut on multiple peaks detected.
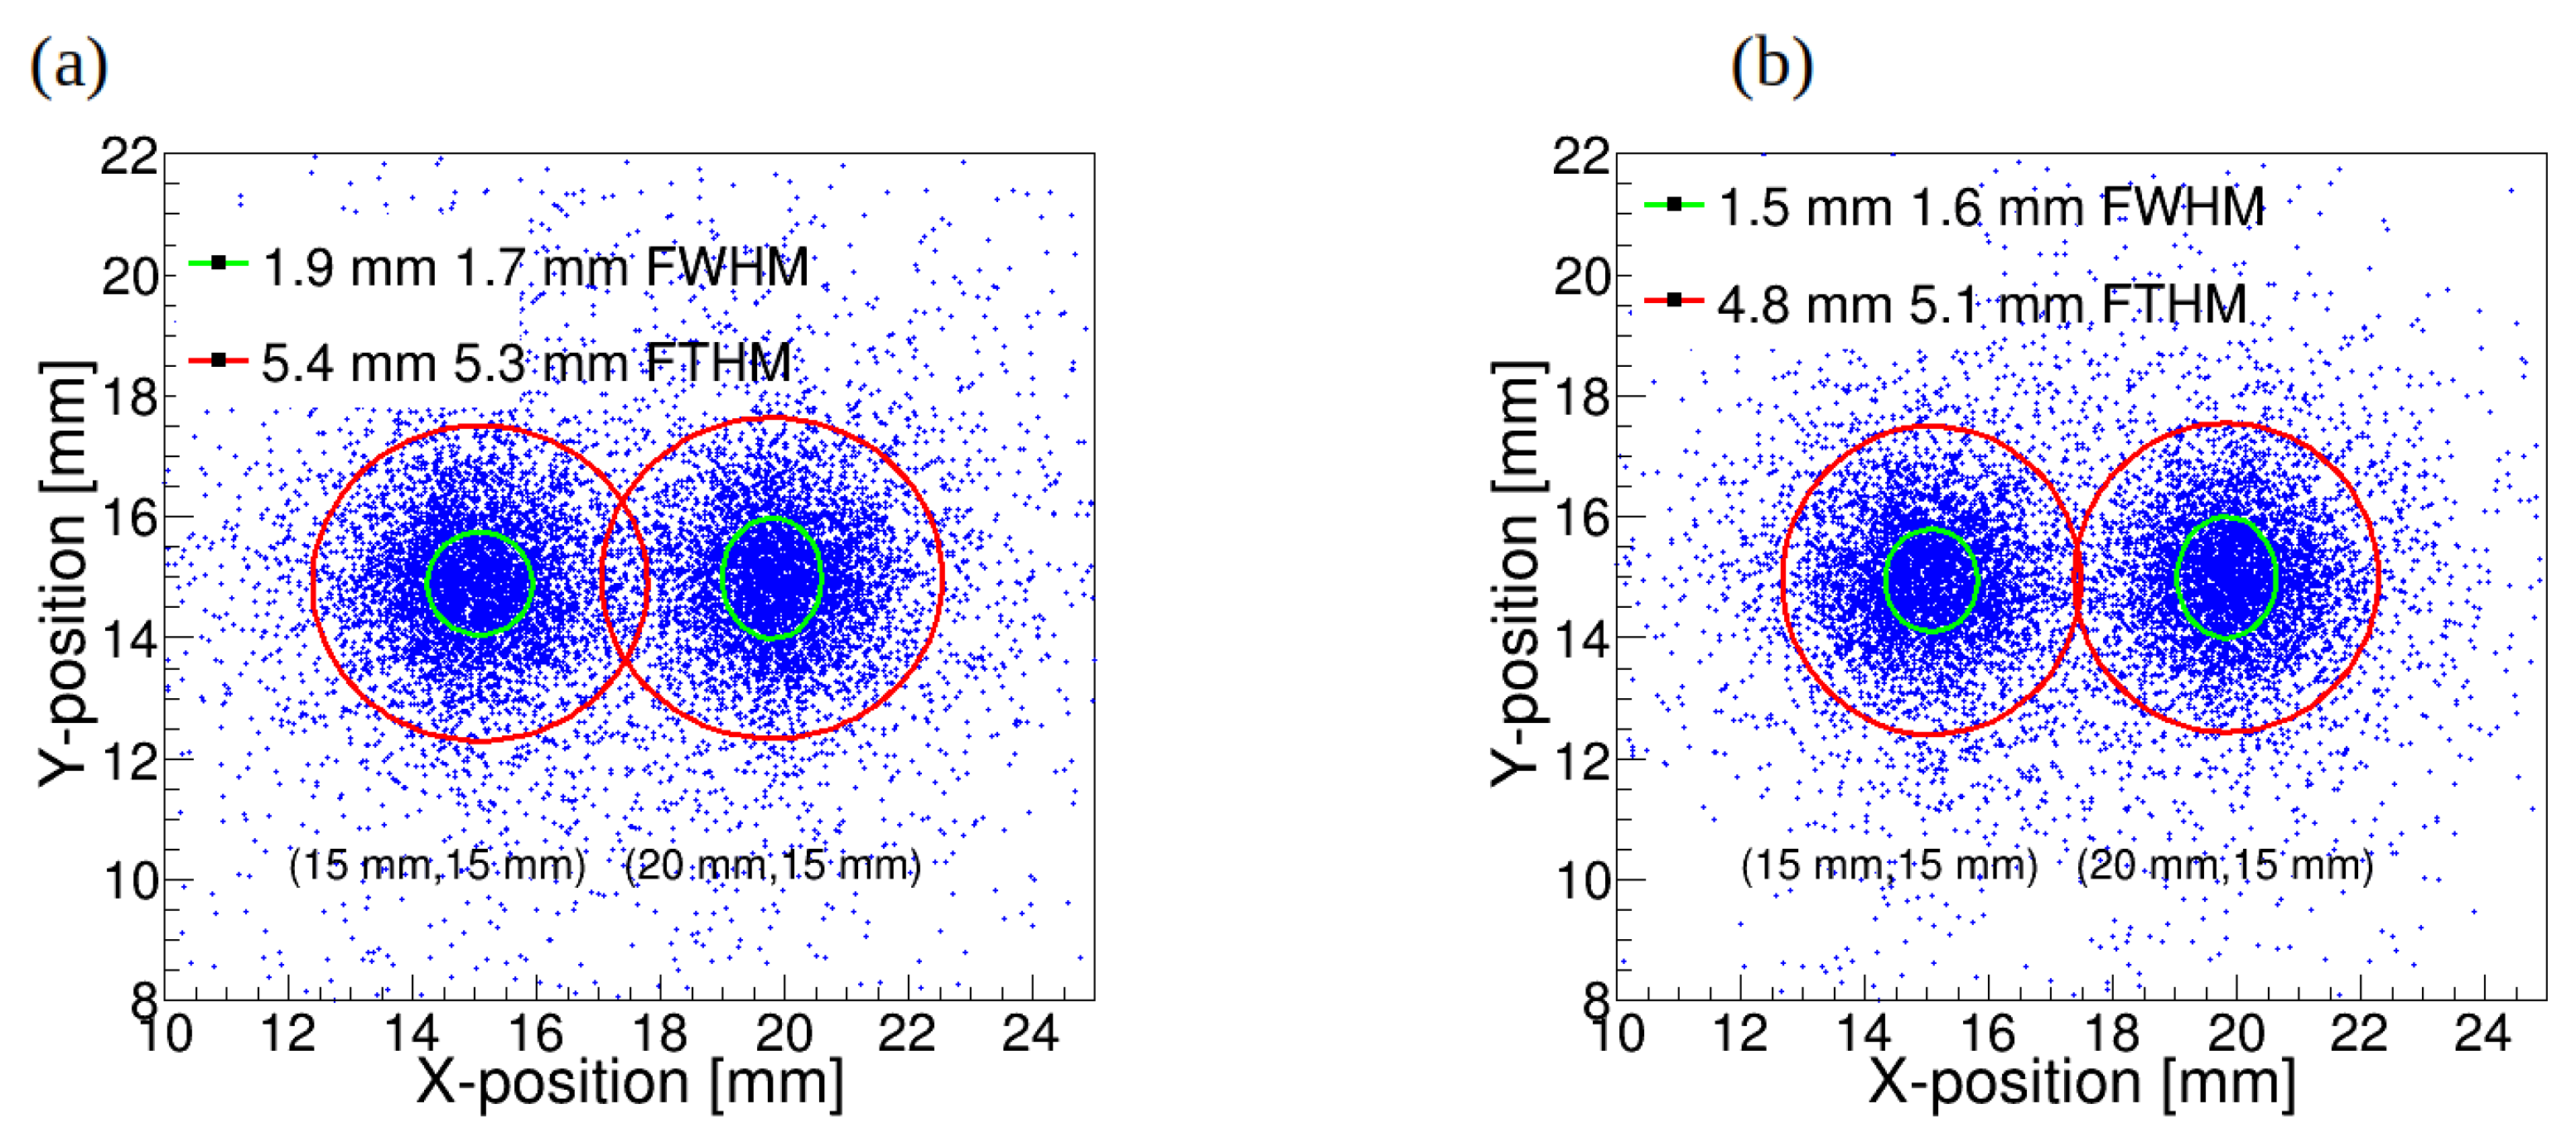
Figure 11.
(a) Reconstructed coordinate of interaction position regarded as DOI; (b) Illustration of XY-plane positioning estimation.
Figure 11.
(a) Reconstructed coordinate of interaction position regarded as DOI; (b) Illustration of XY-plane positioning estimation.
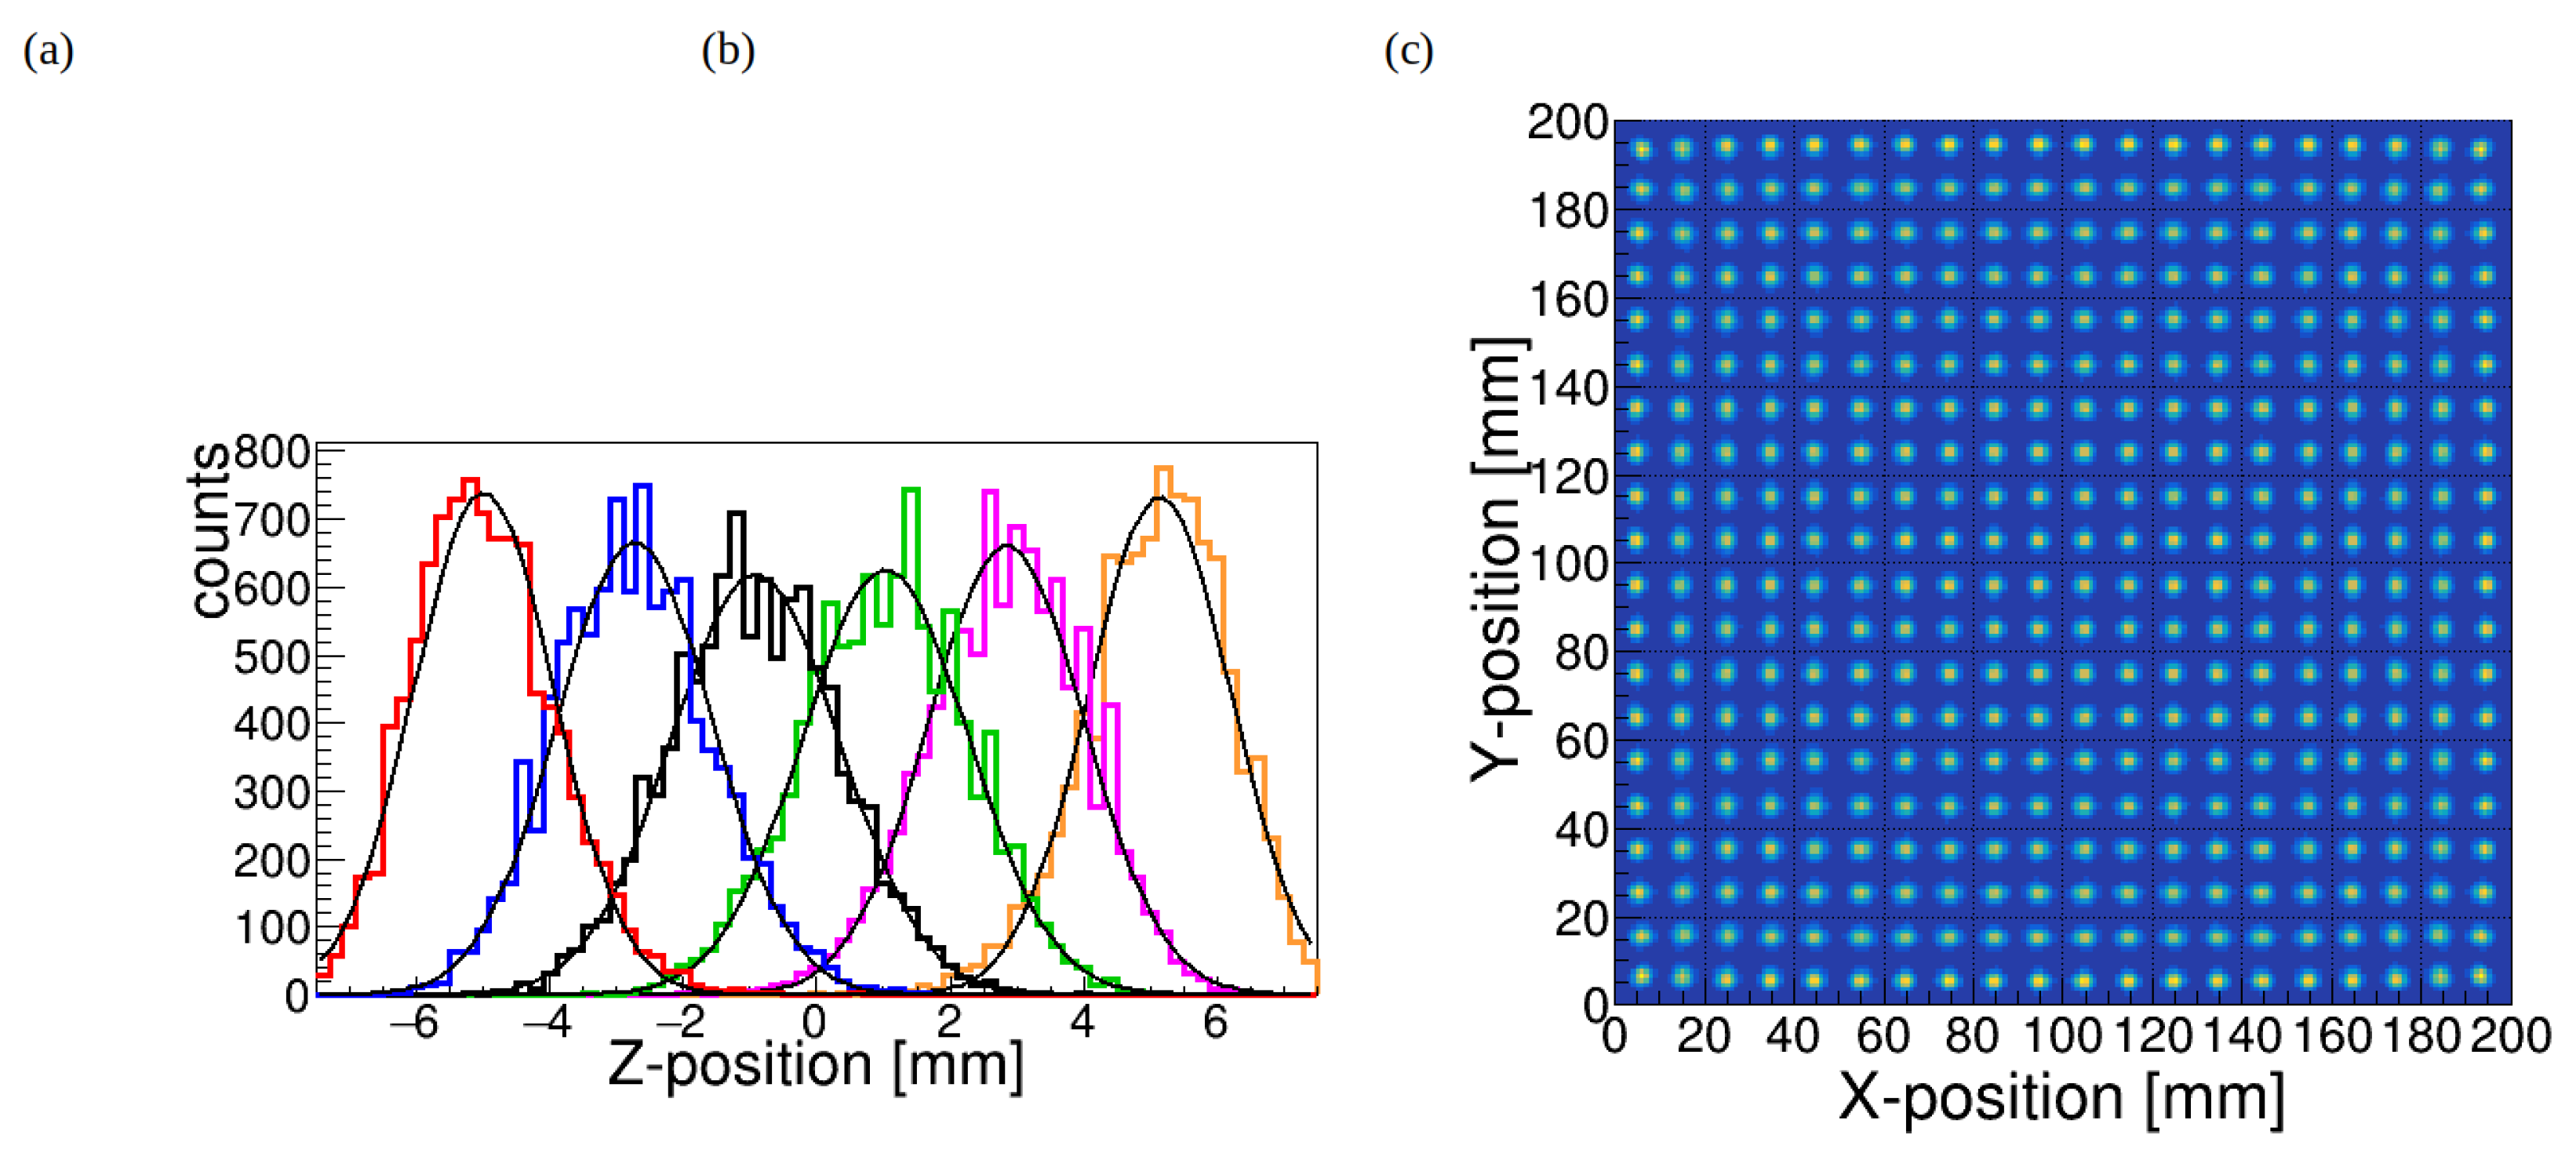
Figure 12.
The distribution of 3D-coordinates is shown in panel (a) with no cuts and (b) after multiple peak cut. Full-energy peak is shown in panel (c). The sigma value of the fitting Gaussian waveform can be regarded as the energy resolution.
Figure 12.
The distribution of 3D-coordinates is shown in panel (a) with no cuts and (b) after multiple peak cut. Full-energy peak is shown in panel (c). The sigma value of the fitting Gaussian waveform can be regarded as the energy resolution.
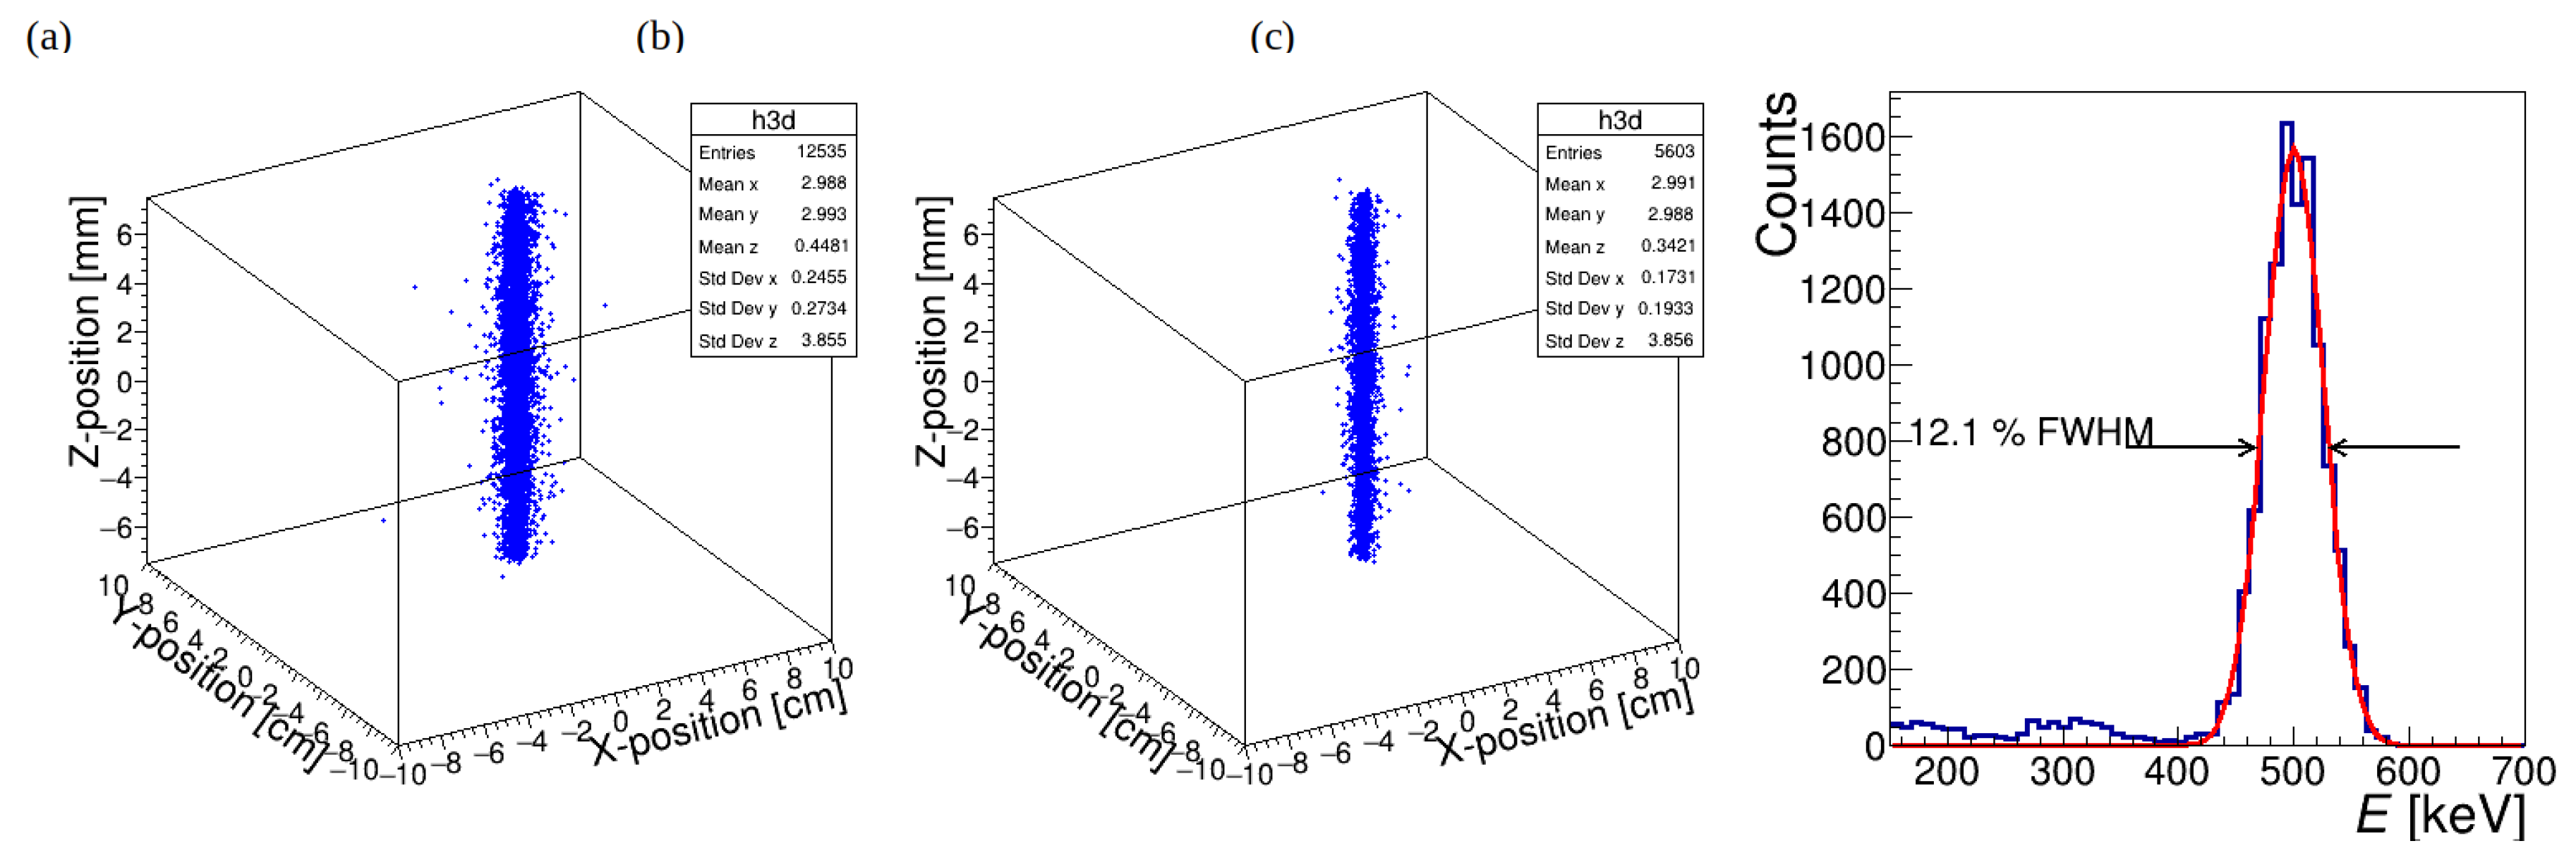
Figure 13.
Schematic of brain PET scanner (a) or the Whole Body PET scanner (b) composed of modules from a 4 × 4 assembly of LYSO crystals.
Figure 13.
Schematic of brain PET scanner (a) or the Whole Body PET scanner (b) composed of modules from a 4 × 4 assembly of LYSO crystals.
Disclaimer/Publisher’s Note: The statements, opinions and data contained in all publications are solely those of the individual author(s) and contributor(s) and not of MDPI and/or the editor(s). MDPI and/or the editor(s) disclaim responsibility for any injury to people or property resulting from any ideas, methods, instructions or products referred to in the content. |
© 2024 by the authors. Licensee MDPI, Basel, Switzerland. This article is an open access article distributed under the terms and conditions of the Creative Commons Attribution (CC BY) license (http://creativecommons.org/licenses/by/4.0/).
Copyright: This open access article is published under a Creative Commons CC BY 4.0 license, which permit the free download, distribution, and reuse, provided that the author and preprint are cited in any reuse.


