
Submitted:
30 December 2024
Posted:
30 December 2024
You are already at the latest version
Abstract
Background/Objectives:
Laryngeal squamous cell carcinoma (LSCC) is a common malignancy with unsatisfactory survival rates, highlighting the need for reliable biomarkers to improve diagnosis and prognosis. Growth differentiation factor 15 (GDF15), a protein implicated in various cancers, has not been thoroughly investigated in LSCC. This study aimed to evaluate the significance of GDF15 expression in LSCC and its potential clinical implications.
Methods:
We analyzed archival tissue samples from 65 LSCC patients using immunohistochemistry and evaluated GDF15 expression profiles from the Cancer Genome Atlas (TCGA) and Gene Expression Omnibus (GEO) datasets. Statistical analyses included Kaplan-Meier survival analysis and Cox proportional hazards regression to assess the correlation between GDF15 expression, clinicopathological variables, and survival outcomes.
Results:
GDF15 expression showed no significant difference between tumor and adjacent normal tissues. However, in the tissue macroarray (TMA) cohort, high GDF15 expression was significantly associated with lower TNM stage and less advanced pT status. Kaplan-Meier analysis revealed that high GDF15 expression correlated with poorer overall survival in the TMA cohort but not in the TCGA or GEO datasets. Multivariable analysis identified GDF15 as an independent prognostic factor for disease-free survival in LSCC.
Conclusions:
Our findings suggest that GDF15 may serve as a prognostic biomarker in LSCC, particularly in early-stage disease. Further research is warranted to validate these results and explore GDF15's potential as a therapeutic target, contributing to improved patient management.
Keywords:
laryngeal squamous cell carcinoma
; GDF15
; Tissue macroarrays
; immunohistochemistry
1. Introduction
Laryngeal carcinoma remains the second most common malignancy of aerodigestive tract and makes up approximately 20% of head and neck cancers. It occurs almost five times more often in men than women. The vast majority of cases is squamous cell carcinoma, whose most significant risk factors are tobacco and alcohol consumption [1,2,3]. Patients with laryngeal squamous cell carcinoma (LSCC) are often diagnosed in the advanced stage of the disease and the 5-year survival rate oscillates around 65%. Although radiation and systemic therapy appeared as new treatment options, surgery still remains equal or necessary depending on stage and expansion of the disease [3]. Since survival remains unsatisfying, it remains urgent to identify specific biomarkers of the disease.
GDF15 (Growth Differentiation Factor 15) also known as MIC-1 (Macrophage Inhibitory Cytokine-1), PLAB (Placental Bone Morphogenetic Protein), P-TGFβ (Placental Transforming Growth Factor Beta), PDF (Prostate-Derived Factor), HP00269 is a member of the TGF-β superfamily. The GDF15 gene is located on chromosome 19p12–13 and encodes a nuclear protein of 25 kDa. GDF15 is a stress responsive cytokine best known from its anorectic action [4,5]. However, this protein has vast biological activity, including roles in inflammation, cardiovascular diseases, and carcinogenesis. The role of GDF15 in carcinogenesis can be protumorigenic or antitumorigenic depending on the microenvironment, type and stage of cancer [6,7]. As a protumorigenic action we can count contribution to proliferation and survival of cancer cells, angiogenesis, metastasis and bone lysis. GDF15 presents protumorigenic action by affecting many signal pathways, for instance: ERK (extracellular signal-regulated kinases) pathway, ErbB2 (receptor tyrosine-protein kinase erbB-2), uPA (urokinase-type plasminogen activator), RhoE (Rho-related GTP-binding protein), catenin-δ1 (ang. catenin-cadherin associated protein, δ1), PI3K/AKT, MAPK. Additionally, GDF15 is a target gene for tumor suppressor protein p53 [6]. GDF15 is present in different tissues including kidneys, liver, muscles, fat tissue and macrophages and its expression increases in pregnancy, inflammation, cancers, heart and kidneys failure correlating with poor prognosis and weight loss [8,9]. Overexpression of GDF15 has also been observed in many cancers including breast, cervical, prostate, colorectal and oral squamous cell carcinoma [10,11,12,13]. Confirmed by many studies GDF15 is classified as a new potential cancer biomarker. However, the correlation between GDF15 and laryngeal squamous cell carcinoma remains unclear.
This study was conducted to investigate this correlation in order to improve diagnosis, prognosis and molecular target therapy.
2. Materials and Methods
Patients and Tissue Material
The study was conducted on archival formalin-fixed, paraffin-embedded (FFPE) tissue samples derived between 2016 to 2020 from 65 patients hospitalized and diagnosed with laryngeal squamous cell carcinoma at the Department of Otolaryngology, Oncological Laryngology and Maxillofacial Surgery, University Hospital No. 2, Bydgoszcz, Poland and the Department of Clinical Pathomorphology, Collegium Medicum in Bydgoszcz, Nicolaus Copernicus University in Toruń, Poland. The institutional tissue macroarray cohort was thereafter referred to as ‘TMA cohort’. All tumors were reclassified in accordance with the standardized TNM 8th edition classification of the American Joint Committee on Cancer (AJCC) criteria. The study group involved 65 laryngeal squamous cell carcinoma samples, while the control group included 21 samples of normal tissue adjacent to the tumor (NAT). Patients were excluded when they had a second primary carcinoma or tumor in situ (Tis), as well as when no cancer cells were detected by immunohistochemical staining, or if patients received prior treatment. Clinicopathological data of 65 patients with laryngeal squamous cell carcinoma is presented in Table 1. The study protocol was approved by the Bioethics Committee at Collegium Medicum in Bydgoszcz of Nicolaus Copernicus University in Toruń KB 58/2022 and performed according to the guidelines of the Declaration of Helsinki.
Tissue Macroarrays
Tissue macroarrays (TMA) were constructed as previously described [14]. In brief, representative areas within the tissue samples, containing at least 80% of tumor cells, were identified under the microscope using archival tissue sections stained with hematoxylin and eosin (H&E). Then, fragments of FFPE tissue specimens were removed from every donor block and inserted into recipient blocks. The prepared macroarrays blocks were routinely sectioned at 3 µm thickness using a rotary microtome (Accu-Cut® SRMTM200, Sakura Finetek, Torrance, CA, USA) and placed on high-adhesive glass slides (Superfrost Plus; MenzelGlasser, Germany) afterward.
Immunohistochemistry
The sections (3 μm thick) were subjected to IHC staining according to the previously described protocol [15]. Immunohistochemistry was carried out by BenchMark® Ultra automatic staining machine (Roche Diagnostics/Ventana Medical Systems, Tucson, AZ, USA) with Ventana UltraView DAB Detection Kit (Ventana Medical Systems, Tucson, AZ, USA). GDF15 was detected by using anti-GDF15 rabbit polyclonal antibody (cat. no: HPA011191, Sigma-Aldrich, St. Louis, MO, USA) in a 1:150 dilution for 32 min. Positive and negative controls were set for each test.
Evaluation of Immunohistochemical Reactions
The immunohistochemical expression of GDF15 protein was evaluated by two independent pathologists using a modified immunoreactive score of Remmele and Stegner (IRS) [16]. The staining score (0-12) was determined by multiplying the percentage of positively stained cells/tissue area (0: 0%; 1: 1-5%; 2: 6-25%; 3: 26-75%; 4: 76-100%) and the expression intensity (0: negative, 1: weak, 2: moderate, 3: strong). The analysis was conducted at 20× original objective magnification in three randomly selected fields of view, and the final staining score was presented as a mean of three results. To determine “high” or “low” expression levels of GDF15 protein, the final IRS scores (0-12) were dichotomized based on the cut-off point (IRS < 4, low expression; IRS ≥ 4, high expression) established with the Evaluate Cutpoints software [17]. Of note, the median expression level of GDF15 protein in tumor tissue was 4 (IRQ, 3-5.835).
Overall survival (OS) was defined as the time from date of curative surgery to the time of death from any cause. Disease free survival was defined as the time from date of curative surgery to the time of relapse or death. Overall survival (OS) and disease-free survival (DFS) data were censored if patients were alive at the last follow-up date (11 January 2023). The median follow-up time (calculated by the reverse Kaplan-Meier method) for OS and DFS was 49 and 46 months, respectively.
Extraction of RNA-Sequencing TCGA Data and Clinical Information
RNA-sequencing data (DESeq2 normalized counts) for GDF15 expression in 116 LSCC tissues and 12 adjacent tissues were downloaded from The Cancer Genome Atlas (TCGA) using the University of California Santa Cruz (UCSC) Xena Browser (https://xenabrowser.net/, accessed on 10 February 2023), whereas corresponding clinical information was retrieved from cBioPortal (https://www.cbioportal.org, accessed on 10 February 2023). The clinical endpoints were OS and DFS. The former was defined as the time from date of curative surgery to the time of death from any cause, while the latter as the time from date of curative surgery to the time of recurrence or progression. Overall survival and DFS data were available for 116 (100%) and 87 (75%) patients, respectively. GDF15 expression levels were categorized into low-level and high-level groups based on the optimal cut-off values determined with the Evaluate Cutpoints software [18]. The cut-point values for OS and DFS were 9.731 (< 9.731, low expression; ≥ 9.731, high expression) and 7.217 (< 7.217, low expression; ≥ 7.217, high expression), respectively. The median OS and DFS times for the TCGA cohort were 65 and 76 months, respectively.
GEO Data Collection
The expression levels of GDF15 were extracted from the Gene Expression Omnibus (GEO) database through the ShinyGEO web-based application (http://gdancik.github.io/shinyGEO/, accessed on 13 March 2023) [18]. Five GEO datasets for LSCC: GSE25727 [19], GSE27020 [20], GSE59102 [21], GSE117973 [22,23], and GSE51985 [24] were included. If several probes were mapped to the GDF15, the mean value was utilized as the final expression of this gene.
Statistical Analysis
All statistical analyses were performed using the GraphPad Prism (version 8.0, GraphPad Software, San Diego, CA, USA), SPSS (version 28.0, IBM Corporation, Armonk, NY, USA) or Rstudio (version 1.3.1093) software packages. Data distribution was determined with the Shapiro-Wilk test and the appropriate parametric or nonparametric statistical tests were then applied. The Kaplan-Meier method and log-rank test was used to depict and compare unadjusted survival curves for OS and DFS. Univariable and multivariable Cox proportional hazards regression analyses were conducted to explore the predictors of survival by estimating the hazard ratio (HR) and 95% confidence interval (CI). A backward elimination procedure built all multivariable models, with a significance level of p < 0.2 to enter the model and p ≤ 0.05 to stay. Proportional hazard assumption was verified by testing for significant interactions when each variable was entered as a time-based covariate. In the TCGA cohort, multiple imputation of missing variables for the Cox proportional hazards models was used to adjust for the bias of missing data, but the variables with amounts of missing data over 20% were not considered for the model. It was assumed that the missing data of predictor variables occurred at random. Combined estimates were obtained from 10 imputed datasets. Associations were considered statistically significant if the two-sided p-value was < 0.05.
3. Results
Comparison of GDF15 Expression Between Tumor Tissue and Non-Tumor Tissue in TMA and Publicly Available Cohorts
There was no statistically significant difference in GDF15 expression between tumor tissue and non-tumor tissue at both protein and mRNA expression levels (Figure 1). Boxplot graphs in Figure 1 illustrate GDF15 expression levels in tumor tissue versus histologically normal tissue across various cohorts, including the institutional TMA, TCGA, and gene expression data from the GEO.
At the protein level, GDF15 expression, assessed by immunohistochemistry (IHC), revealed primarily cytoplasmic staining at any level of expression intensity in tumor tissues and non-tumor tissues adjacent to the tumor. Representative IHC images demonstrate the variation in GDF15 staining intensity between tumor tissues (Figure 2). However, tumor tissues showed a more heterogeneous and often stronger staining pattern compared to the adjacent normal tissues. Additionally, the staining pattern observed in the tumor tissues exhibited significant heterogeneity, with variations in intensity across different regions of the same sample.
Association Between GDF15 Expression and Clinicopathological Variables in TMA and TCGA Cohorts
After data dichotomization according to the established cut-off values, the TMA cohort included 28 (43.08%) samples with low and 37 (56.92%) samples with high GDF15 expression and the TCGA cohort included 89 (76.72%) samples with low and 27 (23.28%) samples with high gene expression.
In the TMA LSCC cohort (Table 1), high GDF15 expression was significantly associated to less advanced pT stages (p=0.02). Moreover, high GDF15 expression was significantly associated with lower TNM stage (p=0.019). A statistically significant relationship was also demonstrated between GDF15 expression and the location of the primary tumor (p=0.001), with higher expression being associated with the location of glottis. No other associations existed between GDF15 expression and investigated clinicopathological parameters.
Relationships to Survival
In Kaplan-Meier survival analysis of the TMA cohort, high GDF15 expression was significantly associated with a median overall survival (OS) time compared with low GDF15 (not reached vs. not reached; log-rank p=0.004; Figure 3A), but disease-free survival (DFS) time in this group was not significantly (not reached vs. not reached; log-rank p=0.188; Figure 3B). High GDF15 expression was not significantly associated with worse OS and DFS in the TCGA Xena and GEO cohorts (Figure 3C-F).
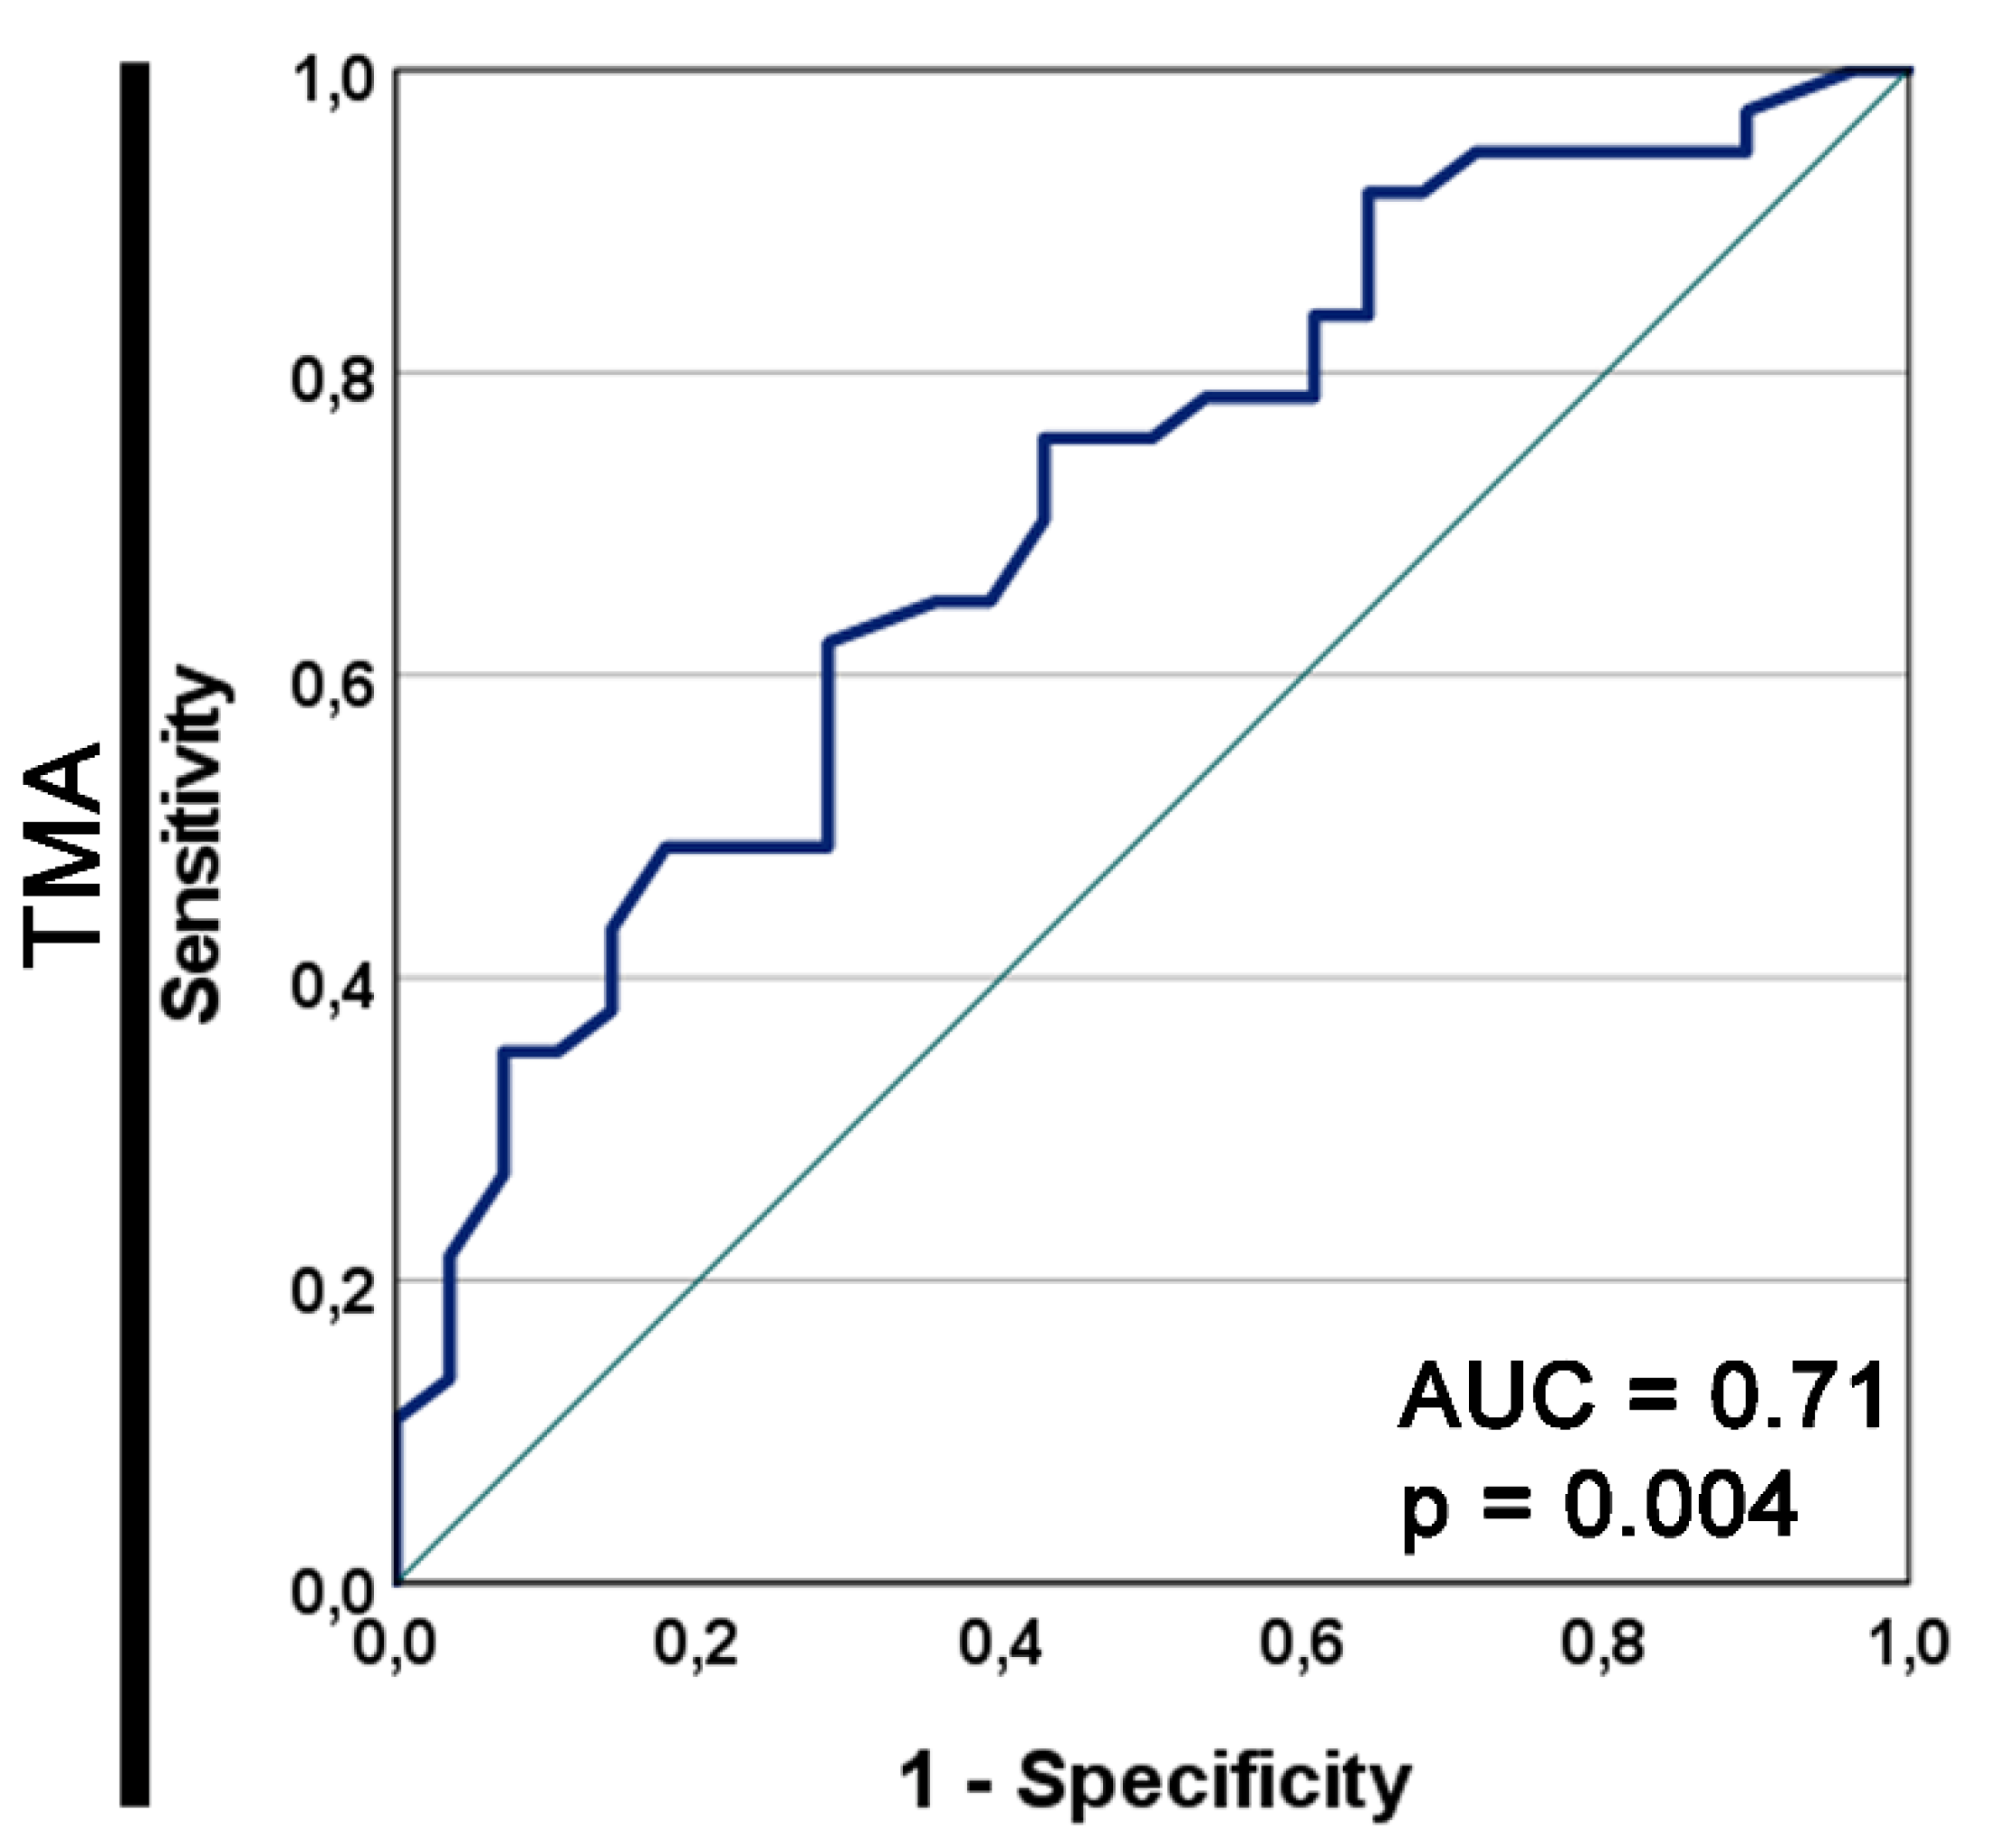
The area under the prognostic ROC curve for GDF15 as a prognostic marker for the OS in the TMA cohort was 0.71 and the asymptotic p=0.004 (Figure S2).
Figure 3.
Kaplan–Meier curves for the overall survival (A, C) and disease free survival (B, D-F) of laryngeal squamous cell carcinoma patients stratified by GDF15 expression. The survival curves were plotted based on the (A, B) immunohistochemistry data for the tissue microarray (TMA) cohort; gene expression levels for (C, D) The Cancer Genome Atlas (TCGA) dataset downloaded from the UCSC Xena Browser; (E, F) the Gene Expression Omnibus (GEO) datasets downloaded from the ShinyGEO web-based tool (the GSE number and probe information are shown). Cases were divided into two expression groups (low and high) according to (A-D) the optimal cutoff point determined by the Evaluate Cutpoints software; (E, F) the median expression. The results are shown with median OS or DFS (in months; abbr. mths) for high and low expression groups, as well as with p-value from the log-rank test. The number of cases (n) and events (EPV) in low and high expression groups is displayed.
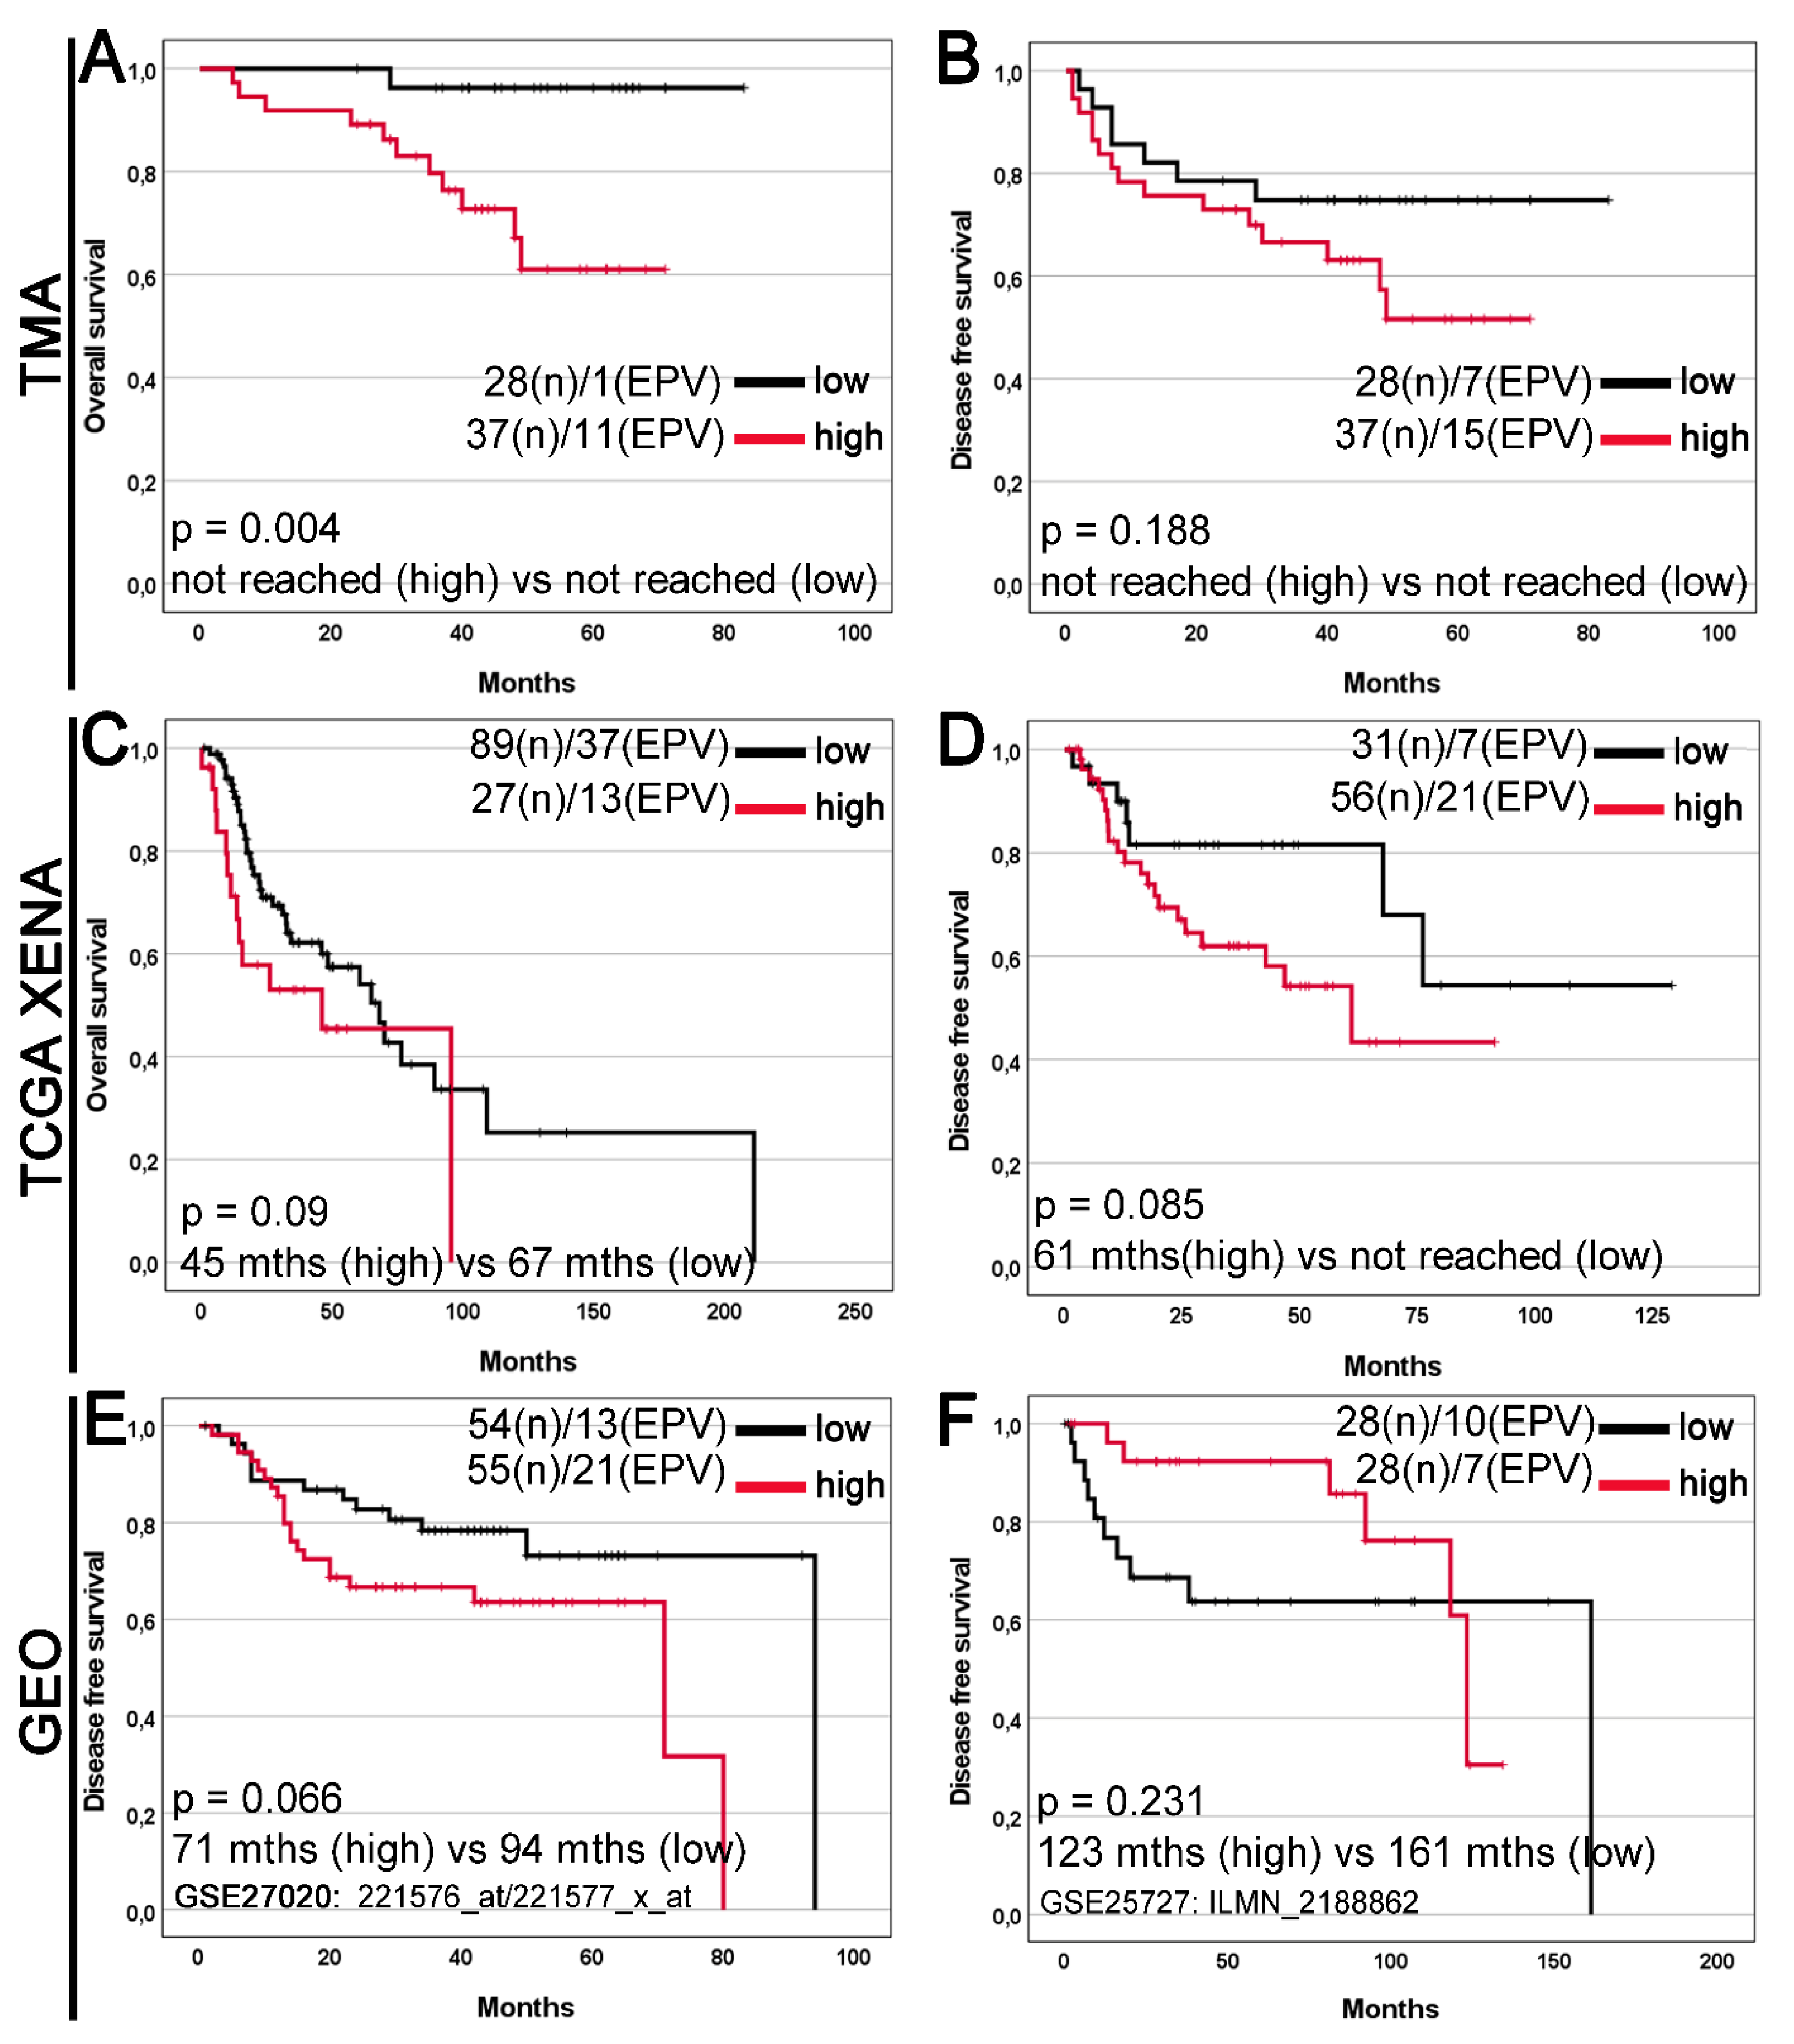
Figure S2.
The receiver operating characteristic (ROC) curve for GDF15 as a prognostic marker for the overall survival in the tissue macroarray (TMA) cohort. The asymptotic p value of the ROC curve is shown. AUC, area under the ROC curve.
Figure S2.
The receiver operating characteristic (ROC) curve for GDF15 as a prognostic marker for the overall survival in the tissue macroarray (TMA) cohort. The asymptotic p value of the ROC curve is shown. AUC, area under the ROC curve.
As presented in Table 3, a univariate analysis of DFS in the TMA cohort indicated statistically significant univariable hazard ratios (HRs) were found for resection margins positive (HR 2.52, 95% CI 1.05–6.04, p=0.038) and pT2 stage (HR 2.65, 95% CI 1.03-6.86, p=0.044). Next, in the multivariate analysis confirmed high GDF15 expression, stage II, stage III as an independent predictor DFS LSCC patients (GDF15 HR 2.98, 95% CI 1.16-7.65, p=0.023; TNM stage (p=0.022) included: TNM stage II HR 4.64, 95% CI 1.53-14.13, p=0.007; TNM stage III-IV HR 3.13, 95% CI 1.06-9.27, p=0.04).
In unadjusted Cox proportional hazards regression in the TCGA cohort, age at diagnosis (HR 2.04, 95% CI 1.10-3.81, p=0.025), sex (HR 0.28 95% CI 0.14-0.54, p=0.0002), tumor grade (p=0.012) was significantly associated with OS (Table 4). Multivariable regression analysis confirmed sex and tumor grade as an independent predictor of OS LSCC patients (sex HR 0.30 95% CI 0.15-0.59, p=0.0006; tumor grade p=0.017). Next univariable and multivariable Cox analysis of DFS in the TCGA cohort, N stage was significantly associated with DFS (OS and DFS HR 2.69, 95% CI 1.14-6.35, p=0.024).
4. Discussion
Growth differentiation factor 15 (GDF15) is a peptide hormone belonging to the transforming growth factor beta (TGFβ) superfamily. Under physiological conditions, it is present in various human tissues, including the placenta, liver, prostate, bladder, kidneys, colon, and endometrium, although in small quantities. This protein has pleiotropic effects, which has led to research aimed at demonstrating its role in the formation and development of malignant tumors as well as its role in the occurrence of cancer metastasis. Previous studies on GDF15 as a marker for malignant tumors and metastasis diagnosis prompted us to investigate its expression in patients with laryngeal squamous cell carcinoma. To our knowledge, our study is the first to evaluate GDF15 expression in patients with laryngeal cancer.
In our studies, we have demonstrated that the lack of statistically significant difference in GDF15 expression between tumor tissue and normal tissue adjacent to the tumor may suggest similar levels of activity of this protein in both types of tissue. However, it is important to consider the potential differences in cellular composition and microenvironment present in these two types of tissues, which could influence the interpretation of these results. The associations between GDF15 expression and clinical variables, such as T feature and TNM stage, exhibited variations between the tissue macroarray (TMA) and The Cancer Genome Atlas (TCGA) cohorts, as indicated by the data dichotomization and analysis presented earlier. The TMA cohort assesses protein expression levels, whereas the TCGA or GEO cohorts measure the molecular level, that is, gene/mRNA expression levels. In the TMA cohort, consisting of 28 samples with low gene expression and 37 samples with high gene expression, the frequency of high and low GDF15 protein expression significantly differed in relation to the T feature according to pT status and TNM stage. Notably, patients in stage I demonstrated a higher prevalence of high GDF15 protein expression compared to low expression levels. Conversely, no statistically significant differences in clinicopathological variables were observed in the TCGA cohort. Significant association between high GDF15 expression and poorer overall survival in laryngeal squamous cell carcinoma patients, predominantly observed in the tissue macroarray (TMA) dataset, may suggest the potential prognostic value of this protein. However, the lack of significant differences in disease-free survival across all datasets necessitates further analysis considering additional prognostic factors. Highlighting trends approaching statistical significance in DFS overall survival observed in TCGA and GEO datasets suggests the potential broader significance of GDF15 expression in cancer prognosis. Analyzing these trends indicates that higher levels of GDF15 may be associated with worse survival outcomes, which could have significant clinical implications.
These findings underscore the complex interplay of GDF15 and highlight the importance of comprehensive investigations to elucidate its role as a prognostic marker in various cancer types. However, further investigation and confirmation of these results are necessary to precisely delineate the role of GDF15 as a prognostic biomarker and its potential application in clinical practice
Growth differentiation factor 15 (GDF15) exhibits a diverse array of physiological and pathological effects across multiple contexts. Elevated serum concentrations of GDF15 have been associated with various malignancies, indicating its potential utility as a diagnostic biomarker for neoplastic diseases [7,25]. Clinical studies have indicated its involvement in promoting metastasis [4,25]. Moreover, GDF15 expression has been correlated with decreased survival in cancer patients, particularly evident in laryngeal squamous cell carcinoma, highlighting its potential prognostic value [4], Additionally, the concentration of this marker has been shown to be significant in colorectal [26,27], gastric [28,29], pancreatic [30,31], breast [32,33], and prostate cancers [34,35]. However, to better understand the role of GDF15 as a prognostic biomarker, further research is needed, considering methodological limitations and other prognostic factors. Despite these limitations, these results suggest that GDF15 could be an important prognostic factor in various types of cancer, with significant clinical implications for cancer treatment and patient care.
Our study's discussion extends to the broader implications of GDF15 in cancer-related symptoms, particularly anorexia and cachexia. GDF15 has been implicated in tumor-induced anorexia and cachexia, as evidenced by its association with weight loss and its ability to induce loss of fat and lean tissue mass [36]. Transgenic mice overexpressing human GDF15 exhibited reduced body weight, suggesting its role in metabolic dysregulation [37]. Further studies demonstrated that tumor-derived GDF15 contributes to weight loss and cachexia in mice, with treatment using GDF15 antibodies reversing these effects [38]. Additionally, serum analysis indicated a correlation between GDF15 and weight loss in various cancers. Recent findings highlight the circadian rhythm-dependent secretion of GDF15 by muscles, suggesting its pathological role in systemic energy metabolism regulation [39]. Potential therapeutic utilization of GDF15 neutralization using monoclonal antibodies to alleviate cancer-associated anorexia and metabolic dysfunctions is also under investigation [40]. Further research is necessary to elucidate the precise mechanisms underlying GDF15-induced metabolic dysregulation and its therapeutic implications in cancer treatment.
This study has several limitations that must be acknowledged. Firstly, the cohort size was very small, which reduces the statistical power of our findings. Secondly, the low number of events per variable precluded us from performing Cox proportional hazards analysis in relation to overall survival time. These limitations may affect the interpretation of the results and underscore the need for caution in drawing definitive conclusions. Future studies with larger cohorts and more robust event data are necessary to validate our findings and to provide more comprehensive insights into the role of GDF15 as a prognostic biomarker in laryngeal squamous cell carcinoma.
5. Conclusions
The study results showed no significant difference in GDF15 expression between tumor and adjacent normal tissue. However, variability in GDF15 expression was observed concerning clinical variables, exclusively in the TMA cohort. Elevated GDF15 levels were significantly associated with poorer overall survival in laryngeal squamous cell carcinoma patients, suggesting its potential prognostic value. Trends approaching statistical significance in overall survival across various datasets highlight its significance as a prognostic marker. Further research is warranted to better understand GDF15's role as a potential diagnostic biomarker and its clinical implications in different cancer types.
Author Contributions
Conceptualization, Aleksandra Romanowicz and Oskar Komisarek; methodology, Aleksandra Romanowicz and Anna Klimaszewska-Wiśniewska; software, Anna Klimaszewska-Wiśniewska, Paulina Antosik, and Kacper Naglik; validation, Anna Klimaszewska-Wiśniewska, Paulina Antosik, and Kacper Naglik; formal analysis, Anna Klimaszewska-Wiśniewska, Paulina Antosik, and Kacper Naglik; investigation, Joanna Czech, Marta Kodzik, and Witold Wrzesiński; resources, Aleksandra Romanowicz, Joanna Czech, Marta Kodzik, Paweł Burduk, and Witold Wrzesiński; data curation, Kacper Naglik; writing—original draft preparation, Oskar Komisarek and Aleksandra Romanowicz; writing—review and editing, Oskar Komisarek and Aleksandra Romanowicz; visualization, Paulina Antosik and Joanna Czech; supervision, Paweł Burduk; project administration, Aleksandra Romanowicz; funding acquisition, Dariusz Grzanka. All authors have read and agreed to the published version of the manuscript.
Funding
This research received no external funding.
Institutional Review Board Statement
The study was conducted in accordance with the Declaration of Helsinki and approved by the Institutional Review Board of the Nicolaus Copernicus University in Toruń, Collegium Medicum in Bydgoszcz (protocol code KB 58/2022, approved on 18 January 2022, valid until the end of 2025).
Informed Consent Statement
Not applicable. The study did not involve identifiable human participants requiring written informed consent for publication.
Data Availability Statement
Data supporting reported results are available from the corresponding author upon reasonable request.
Acknowledgments
Special thanks to the Department of Pathomorphology for providing materials and laboratory assistance.
Conflicts of Interest
The authors declare no conflicts of interest.
Abbreviations
The following abbreviations are used in this manuscript:
AJCC – American Joint Committee on Cancer
DFS – Disease-Free Survival
FFPE – Formalin-Fixed, Paraffin-Embedded
GDF15 – Growth Differentiation Factor 15
GEO – Gene Expression Omnibus
GTEx – Genotype-Tissue Expression
HR – Hazard Ratio
IHC – Immunohistochemistry
IRS – Immunoreactive Score
LSCC – Laryngeal Squamous Cell Carcinoma
N/A – Not Available
OS – Overall Survival
ROC – Receiver Operating Characteristic
TCGA – The Cancer Genome Atlas
TGF-β – Transforming Growth Factor Beta
TMA – Tissue Macroarray
References
- Hoffman, H. T.; Karnell, L. H.; Funk, G. F.; Robinson, R. A.; Menck, H. R. The National Cancer Data Base Report on Cancer of the Head and Neck. Arch. Otolaryngol. Neck Surg. 1998, 124, 951. [Google Scholar] [CrossRef] [PubMed]
- Chu, E. A.; Kim, Y. J. Laryngeal Cancer: Diagnosis and Preoperative Work-Up. Otolaryngol. Clin. North Am. 2008, 41, 673–695. [Google Scholar] [CrossRef]
- Steuer, C. E.; El-Deiry, M.; Parks, J. R.; Higgins, K. A.; Saba, N. F. An Update on Larynx Cancer. CA. Cancer J. Clin. 2017, 67, 31–50. [Google Scholar] [CrossRef]
- Li, Y.-L.; Chang, J. T.; Lee, L.-Y.; Fan, K.-H.; Lu, Y.-C.; Li, Y.-C.; Chiang, C.-H.; You, G.-R.; Chen, H.-Y.; Cheng, A.-J. GDF15 Contributes to Radioresistance and Cancer Stemness of Head and Neck Cancer by Regulating Cellular Reactive Oxygen Species via a SMAD-Associated Signaling Pathway. Oncotarget 2017, 8, 1508–1528. [Google Scholar] [CrossRef]
- Ahmed, D. S.; Isnard, S.; Lin, J.; Routy, B.; Routy, J.-P. GDF15/GFRAL Pathway as a Metabolic Signature for Cachexia in Patients with Cancer. J. Cancer 2021, 12, 1125–1132. [Google Scholar] [CrossRef]
- Corre, J.; Hébraud, B.; Bourin, P. Concise Review: Growth Differentiation Factor 15 in Pathology: A Clinical Role? Stem Cells Transl. Med. 2013, 2, 946–952. [Google Scholar] [CrossRef]
- Adela, R.; Banerjee, S. K. GDF-15 as a Target and Biomarker for Diabetes and Cardiovascular Diseases: A Translational Prospective. J. Diabetes Res. 2015, 2015, 1–14. [Google Scholar] [CrossRef]
- Mullican, S. E.; Lin-Schmidt, X.; Chin, C.-N.; Chavez, J. A.; Furman, J. L.; Armstrong, A. A.; Beck, S. C.; South, V. J.; Dinh, T. Q.; Cash-Mason, T. D.; Cavanaugh, C. R.; Nelson, S.; Huang, C.; Hunter, M. J.; Rangwala, S. M. GFRAL Is the Receptor for GDF15 and the Ligand Promotes Weight Loss in Mice and Nonhuman Primates. Nat. Med. 2017, 23, 1150–1157. [Google Scholar] [CrossRef]
- Wischhusen, J.; Melero, I.; Fridman, W. H. Growth/Differentiation Factor-15 (GDF-15): From Biomarker to Novel Targetable Immune Checkpoint. Front. Immunol. 2020, 11, 951. [Google Scholar] [CrossRef]
- Ma, J.; Tang, X.; Sun, W.; Liu, Y.; Tan, Y.; Ma, H.; Zhu, D.; Wang, M.; Wang, L.; Li, J.; Tu, Y.; Zhang, C.; Zhang, Z.; Zhong, L. Mutant GDF15 Presents a Poor Prognostic Outcome for Patients with Oral Squamous Cell Carcinoma. Oncotarget 2016, 7, 2113–2122. [Google Scholar] [CrossRef]
- Au Yeung, S. L.; Luo, S.; Schooling, C. M. The Impact of GDF-15, a Biomarker for Metformin, on the Risk of Coronary Artery Disease, Breast and Colorectal Cancer, and Type 2 Diabetes and Metabolic Traits: A Mendelian Randomisation Study. Diabetologia 2019, 62, 1638–1646. [Google Scholar] [CrossRef]
- Li, L.; Zhang, R.; Yang, H.; Zhang, D.; Liu, J.; Li, J.; Guo, B. GDF15 Knockdown Suppresses Cervical Cancer Cell Migration in Vitro through the TGF-β/Smad2/3/Snail1 Pathway. FEBS Open Bio 2020, 10, 2750–2760. [Google Scholar] [CrossRef]
- Sadasivan, S. M.; Chen, Y.; Gupta, N. S.; Han, X.; Bobbitt, K. R.; Chitale, D. A.; Williamson, S. R.; Rundle, A. G.; Tang, D.; Rybicki, B. A. The Interplay of Growth Differentiation Factor 15 (GDF15) Expression and M2 Macrophages during Prostate Carcinogenesis. Carcinogenesis 2020, 41, 1074–1082. [Google Scholar] [CrossRef] [PubMed]
- Klimaszewska-Wiśniewska, A.; Neska-Długosz, I.; Buchholz, K.; Durślewicz, J.; Grzanka, D.; Kasperska, A.; Antosik, P.; Zabrzyński, J.; Grzanka, A.; Gagat, M. Prognostic Significance of KIF11 and KIF14 Expression in Pancreatic Adenocarcinoma. Cancers 2021, 13, 3017. [Google Scholar] [CrossRef]
- Buchholz, K.; Antosik, P.; Grzanka, D.; Gagat, M.; Smolińska, M.; Grzanka, A.; Gzil, A.; Kasperska, A.; Klimaszewska-Wiśniewska, A. Expression of the Body-Weight Signaling Players: GDF15, GFRAL and RET and Their Clinical Relevance in Gastric Cancer. J. Cancer 2021, 12, 4698–4709. [Google Scholar] [CrossRef]
- Remmele, W.; Stegner, H. E. [Recommendation for uniform definition of an immunoreactive score (IRS) for immunohistochemical estrogen receptor detection (ER-ICA) in breast cancer tissue]. Pathol. 1987, 8, 138–140. [Google Scholar]
- Ogłuszka, M.; Orzechowska, M.; Jędroszka, D.; Witas, P.; Bednarek, A. K. Evaluate Cutpoints: Adaptable Continuous Data Distribution System for Determining Survival in Kaplan-Meier Estimator. Comput. Methods Programs Biomed. 2019, 177, 133–139. [Google Scholar] [CrossRef]
- Dumas, J.; Gargano, M. A.; Dancik, G. M. shinyGEO : A Web-Based Application for Analyzing Gene Expression Omnibus Datasets. Bioinformatics 2016, 32, 3679–3681. [Google Scholar] [CrossRef]
- Fountzilas, E.; Markou, K.; Vlachtsis, K.; Nikolaou, A.; Arapantoni-Dadioti, P.; Ntoula, E.; Tassopoulos, G.; Bobos, M.; Konstantinopoulos, P.; Fountzilas, G.; Spentzos, D. Identification and Validation of Gene Expression Models That Predict Clinical Outcome in Patients with Early-Stage Laryngeal Cancer. Ann. Oncol. 2012, 23, 2146–2153. [Google Scholar] [CrossRef]
- Fountzilas, E.; Kotoula, V.; Angouridakis, N.; Karasmanis, I.; Wirtz, R. M.; Eleftheraki, A. G.; Veltrup, E.; Markou, K.; Nikolaou, A.; Pectasides, D.; Fountzilas, G. Identification and Validation of a Multigene Predictor of Recurrence in Primary Laryngeal Cancer. PLoS ONE 2013, 8, e70429. [Google Scholar] [CrossRef]
- Plaça, J. R.; Bueno, R. D. B. E. L.; Pinheiro, D. G.; Panepucci, R. A.; De Araújo, L. F.; Mamede, R. C. M.; Figueiredo, D. L. A.; Silva, W. A. Gene Expression Analysis of Laryngeal Squamous Cell Carcinoma. Genomics Data 2015, 5, 9–12. [Google Scholar] [CrossRef]
- Metzger, K.; Moratin, J.; Freier, K.; Hoffmann, J.; Zaoui, K.; Plath, M.; Stögbauer, F.; Freudlsperger, C.; Hess, J.; Horn, D. A Six-Gene Expression Signature Related to Angiolymphatic Invasion Is Associated with Poor Survival in Laryngeal Squamous Cell Carcinoma. Eur. Arch. Otorhinolaryngol. 2021, 278, 1199–1207. [Google Scholar] [CrossRef]
- Mock, A.; Plath, M.; Moratin, J.; Tapken, M. J.; Jäger, D.; Krauss, J.; Fröhling, S.; Hess, J.; Zaoui, K. EGFR and PI3K Pathway Activities Might Guide Drug Repurposing in HPV-Negative Head and Neck Cancers. Front. Oncol. 2021, 11, 678966. [Google Scholar] [CrossRef]
- Lian, M.; Fang, J.; Han, D.; Ma, H.; Feng, L.; Wang, R.; Yang, F. Microarray Gene Expression Analysis of Tumorigenesis and Regional Lymph Node Metastasis in Laryngeal Squamous Cell Carcinoma. PLoS ONE 2013, 8, e84854. [Google Scholar] [CrossRef]
- Siddiqui, J. A.; Pothuraju, R.; Khan, P.; Sharma, G.; Muniyan, S.; Seshacharyulu, P.; Jain, M.; Nasser, M. W.; Batra, S. K. Pathophysiological Role of Growth Differentiation Factor 15 (GDF15) in Obesity, Cancer, and Cachexia. Cytokine Growth Factor Rev. 2022, 64, 71–83. [Google Scholar] [CrossRef]
- Mehta, R. S.; Chong, D. Q.; Song, M.; Meyerhardt, J. A.; Ng, K.; Nishihara, R.; Qian, Z.; Morikawa, T.; Wu, K.; Giovannucci, E. L.; Fuchs, C. S.; Ogino, S.; Chan, A. T. Association Between Plasma Levels of Macrophage Inhibitory Cytokine-1 Before Diagnosis of Colorectal Cancer and Mortality. Gastroenterology 2015, 149, 614–622. [Google Scholar] [CrossRef]
- Zhang, Y.; Wang, X.; Zhang, M.; Zhang, Z.; Jiang, L.; Li, L. GDF15 Promotes Epithelial-to-Mesenchymal Transition in Colorectal [Corrected]. Artif. Cells Nanomedicine Biotechnol. 2018, 46, 652–658. [Google Scholar] [CrossRef]
- Guo, J.; Bian, Y.; Wang, Y.; Chen, L.; Yu, A.; Sun, X. S100A4 Influences Cancer Stem Cell-like Properties of MGC803 Gastric Cancer Cells by Regulating GDF15 Expression. Int. J. Oncol. 2016, 49, 559–568. [Google Scholar] [CrossRef]
- Han, M.; Dai, D.; Yousafzai, N. A.; Wang, F.; Wang, H.; Zhou, Q.; Lu, H.; Xu, W.; Feng, L.; Jin, H.; Wang, X. CXXC4 Activates Apoptosis through Up-Regulating GDF15 in Gastric Cancer. Oncotarget 2017, 8, 103557–103567. [Google Scholar] [CrossRef]
- Kaur, S.; Chakraborty, S.; Baine, M. J.; Mallya, K.; Smith, L. M.; Sasson, A.; Brand, R.; Guha, S.; Jain, M.; Wittel, U.; Singh, S. K.; Batra, S. K. Potentials of Plasma NGAL and MIC-1 as Biomarker(s) in the Diagnosis of Lethal Pancreatic Cancer. PloS One 2013, 8, e55171. [Google Scholar] [CrossRef]
- Yang, Y.; Yan, S.; Tian, H.; Bao, Y. Macrophage Inhibitory Cytokine-1 versus Carbohydrate Antigen 19-9 as a Biomarker for Diagnosis of Pancreatic Cancer: A PRISMA-Compliant Meta-Analysis of Diagnostic Accuracy Studies. Medicine (Baltimore) 2018, 97, e9994. [Google Scholar] [CrossRef]
- Peake, B. F.; Eze, S. M.; Yang, L.; Castellino, R. C.; Nahta, R. Growth Differentiation Factor 15 Mediates Epithelial Mesenchymal Transition and Invasion of Breast Cancers through IGF-1R-FoxM1 Signaling. Oncotarget 2017, 8, 94393–94406. [Google Scholar] [CrossRef] [PubMed]
- Gkretsi, V.; Stylianou, A.; Kalli, M.; Louca, M.; Voutouri, C.; Zaravinos, A.; Stylianopoulos, T. Silencing of Growth Differentiation Factor-15 Promotes Breast Cancer Cell Invasion by Down-Regulating Focal Adhesion Genes. Anticancer Res. 2020, 40, 1375–1385. [Google Scholar] [CrossRef]
- Zhao, L.; Lee, B. Y.; Brown, D. A.; Molloy, M. P.; Marx, G. M.; Pavlakis, N.; Boyer, M. J.; Stockler, M. R.; Kaplan, W.; Breit, S. N.; Sutherland, R. L.; Henshall, S. M.; Horvath, L. G. Identification of Candidate Biomarkers of Therapeutic Response to Docetaxel by Proteomic Profiling. Cancer Res. 2009, 69, 7696–7703. [Google Scholar] [CrossRef]
- Li, J.; Veltri, R. W.; Yuan, Z.; Christudass, C. S.; Mandecki, W. Macrophage Inhibitory Cytokine 1 Biomarker Serum Immunoassay in Combination with PSA Is a More Specific Diagnostic Tool for Detection of Prostate Cancer. PloS One 2015, 10, e0122249. [Google Scholar] [CrossRef]
- Lerner, L.; Hayes, T. G.; Tao, N.; Krieger, B.; Feng, B.; Wu, Z.; Nicoletti, R.; Chiu, M. I.; Gyuris, J.; Garcia, J. M. Plasma Growth Differentiation Factor 15 Is Associated with Weight Loss and Mortality in Cancer Patients. J. Cachexia Sarcopenia Muscle 2015, 6, 317–324. [Google Scholar] [CrossRef]
- Baek, S. J.; Okazaki, R.; Lee, S.-H.; Martinez, J.; Kim, J.-S.; Yamaguchi, K.; Mishina, Y.; Martin, D. W.; Shoieb, A.; McEntee, M. F.; Eling, T. E. Nonsteroidal Anti-Inflammatory Drug-Activated Gene-1 over Expression in Transgenic Mice Suppresses Intestinal Neoplasia. Gastroenterology 2006, 131, 1553–1560. [Google Scholar] [CrossRef]
- Johnen, H.; Lin, S.; Kuffner, T.; Brown, D. A.; Tsai, V. W.-W.; Bauskin, A. R.; Wu, L.; Pankhurst, G.; Jiang, L.; Junankar, S.; Hunter, M.; Fairlie, W. D.; Lee, N. J.; Enriquez, R. F.; Baldock, P. A.; Corey, E.; Apple, F. S.; Murakami, M. M.; Lin, E.-J.; Wang, C.; During, M. J.; Sainsbury, A.; Herzog, H.; Breit, S. N. Tumor-Induced Anorexia and Weight Loss Are Mediated by the TGF-Beta Superfamily Cytokine MIC-1. Nat. Med. 2007, 13, 1333–1340. [Google Scholar] [CrossRef] [PubMed]
- Ost, M.; Igual Gil, C.; Coleman, V.; Keipert, S.; Efstathiou, S.; Vidic, V.; Weyers, M.; Klaus, S. Muscle-Derived GDF15 Drives Diurnal Anorexia and Systemic Metabolic Remodeling during Mitochondrial Stress. EMBO Rep. 2020, 21, e48804. [Google Scholar] [CrossRef]
- Breen, D. M.; Jagarlapudi, S.; Patel, A.; Zou, C.; Joaquim, S.; Li, X.; Kang, L.; Pang, J.; Hales, K.; Ziso-Qejvanaj, E.; Vera, N. B.; Bennett, D.; He, T.; Lambert, M.; Kelleher, K.; Wu, Z.; Zhang, B. B.; Lin, L.; Seeley, R. J.; Bezy, O. Growth Differentiation Factor 15 Neutralization Does Not Impact Anorexia or Survival in Lipopolysaccharide-Induced Inflammation. iScience 2021, 24, 102554. [Google Scholar] [CrossRef]
Figure 1.
Expression of GDF15 in laryngeal squamous cell carcinoma compared to non-cancerous control tissue. Boxplot graphs of (A) GDF15 expression in tumor tissue (n = 65) and histologically normal tissue adjacent to the tumor (n = 21) of the institutional tissue macroarray (TMA) cohort based on immunohistochemistry (IHC); (B) GDF15 expression levels in tumor tissue (n = 116) and normal solid tissue (n = 11) based on RNA-Seq data from The Cancer Genome Atlas (TCGA) and Genotype-Tissue Expression (GTEx) databases, respectively, downloaded from the UCSC Xena Browser. (C) GDF15 expression in tumor tissue (n = 29) and histologically normal tissue adjacent to the tumor (n = 13) based on the gene chip data derived from the Gene Expression Omnibus (GEO) database through the ShinyGEO web-based tool. The GSE number and probe information are shown. (D) GDF15 expression in tumor tissue (n = 10) and corresponding adjacent non-neoplastic tissue (n = 10) based on the gene chip data derived from the Gene Expression Omnibus (GEO) database through the ShinyGEO web-based tool. The GSE number and probe information are shown. (E) GDF15 expression in tumor tissue (n = 9) and corresponding adjacent non-neoplastic tissue (n = 9) based on the gene chip data derived from the Gene Expression Omnibus (GEO) database through the ShinyGEO web-based tool. The GSE number and probe information are shown.
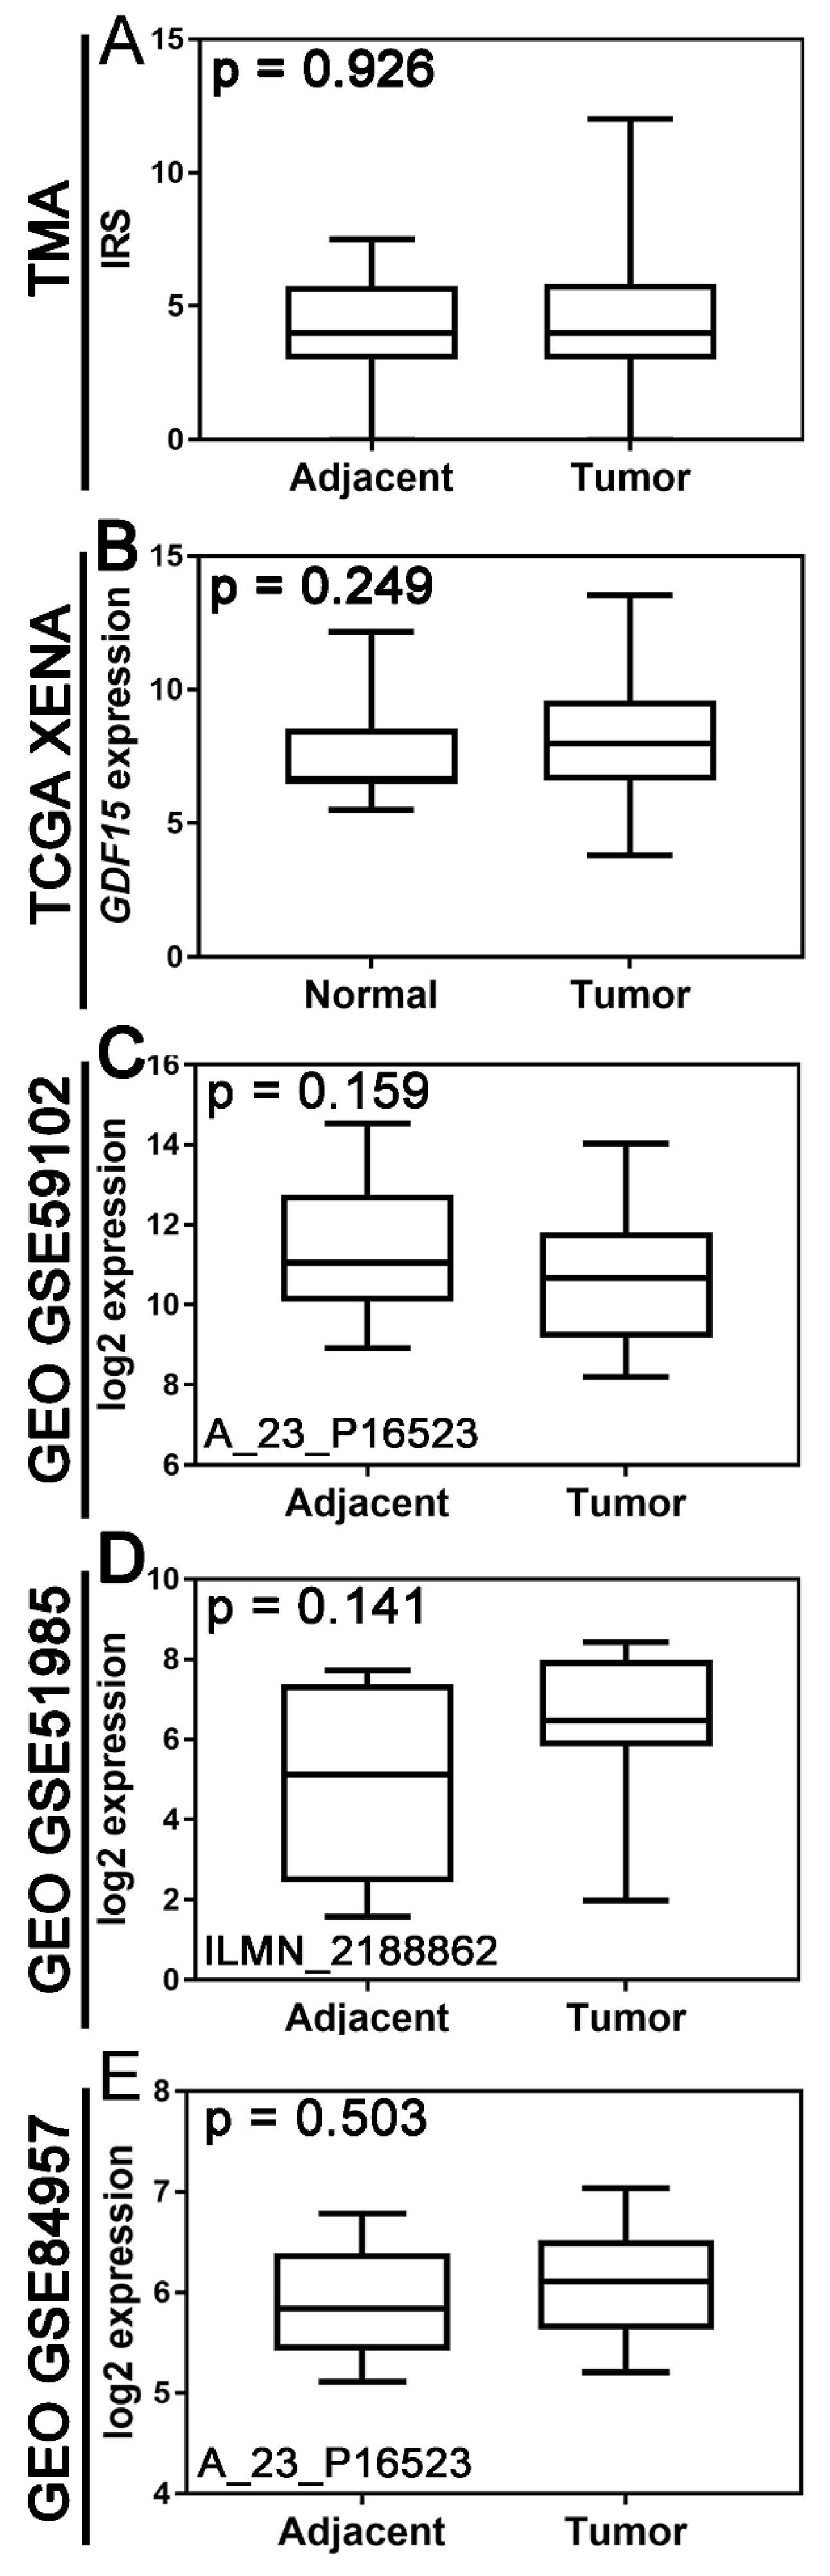
Figure 2.
Representative images of immunohistochemical expression of GDF15 in laryngeal squamous cell carcinoma (LSCC) (B-C) and histologically normal tissue adjacent to the tumor (control tissue) (A). Original magnification 10x.
Figure 2.
Representative images of immunohistochemical expression of GDF15 in laryngeal squamous cell carcinoma (LSCC) (B-C) and histologically normal tissue adjacent to the tumor (control tissue) (A). Original magnification 10x.
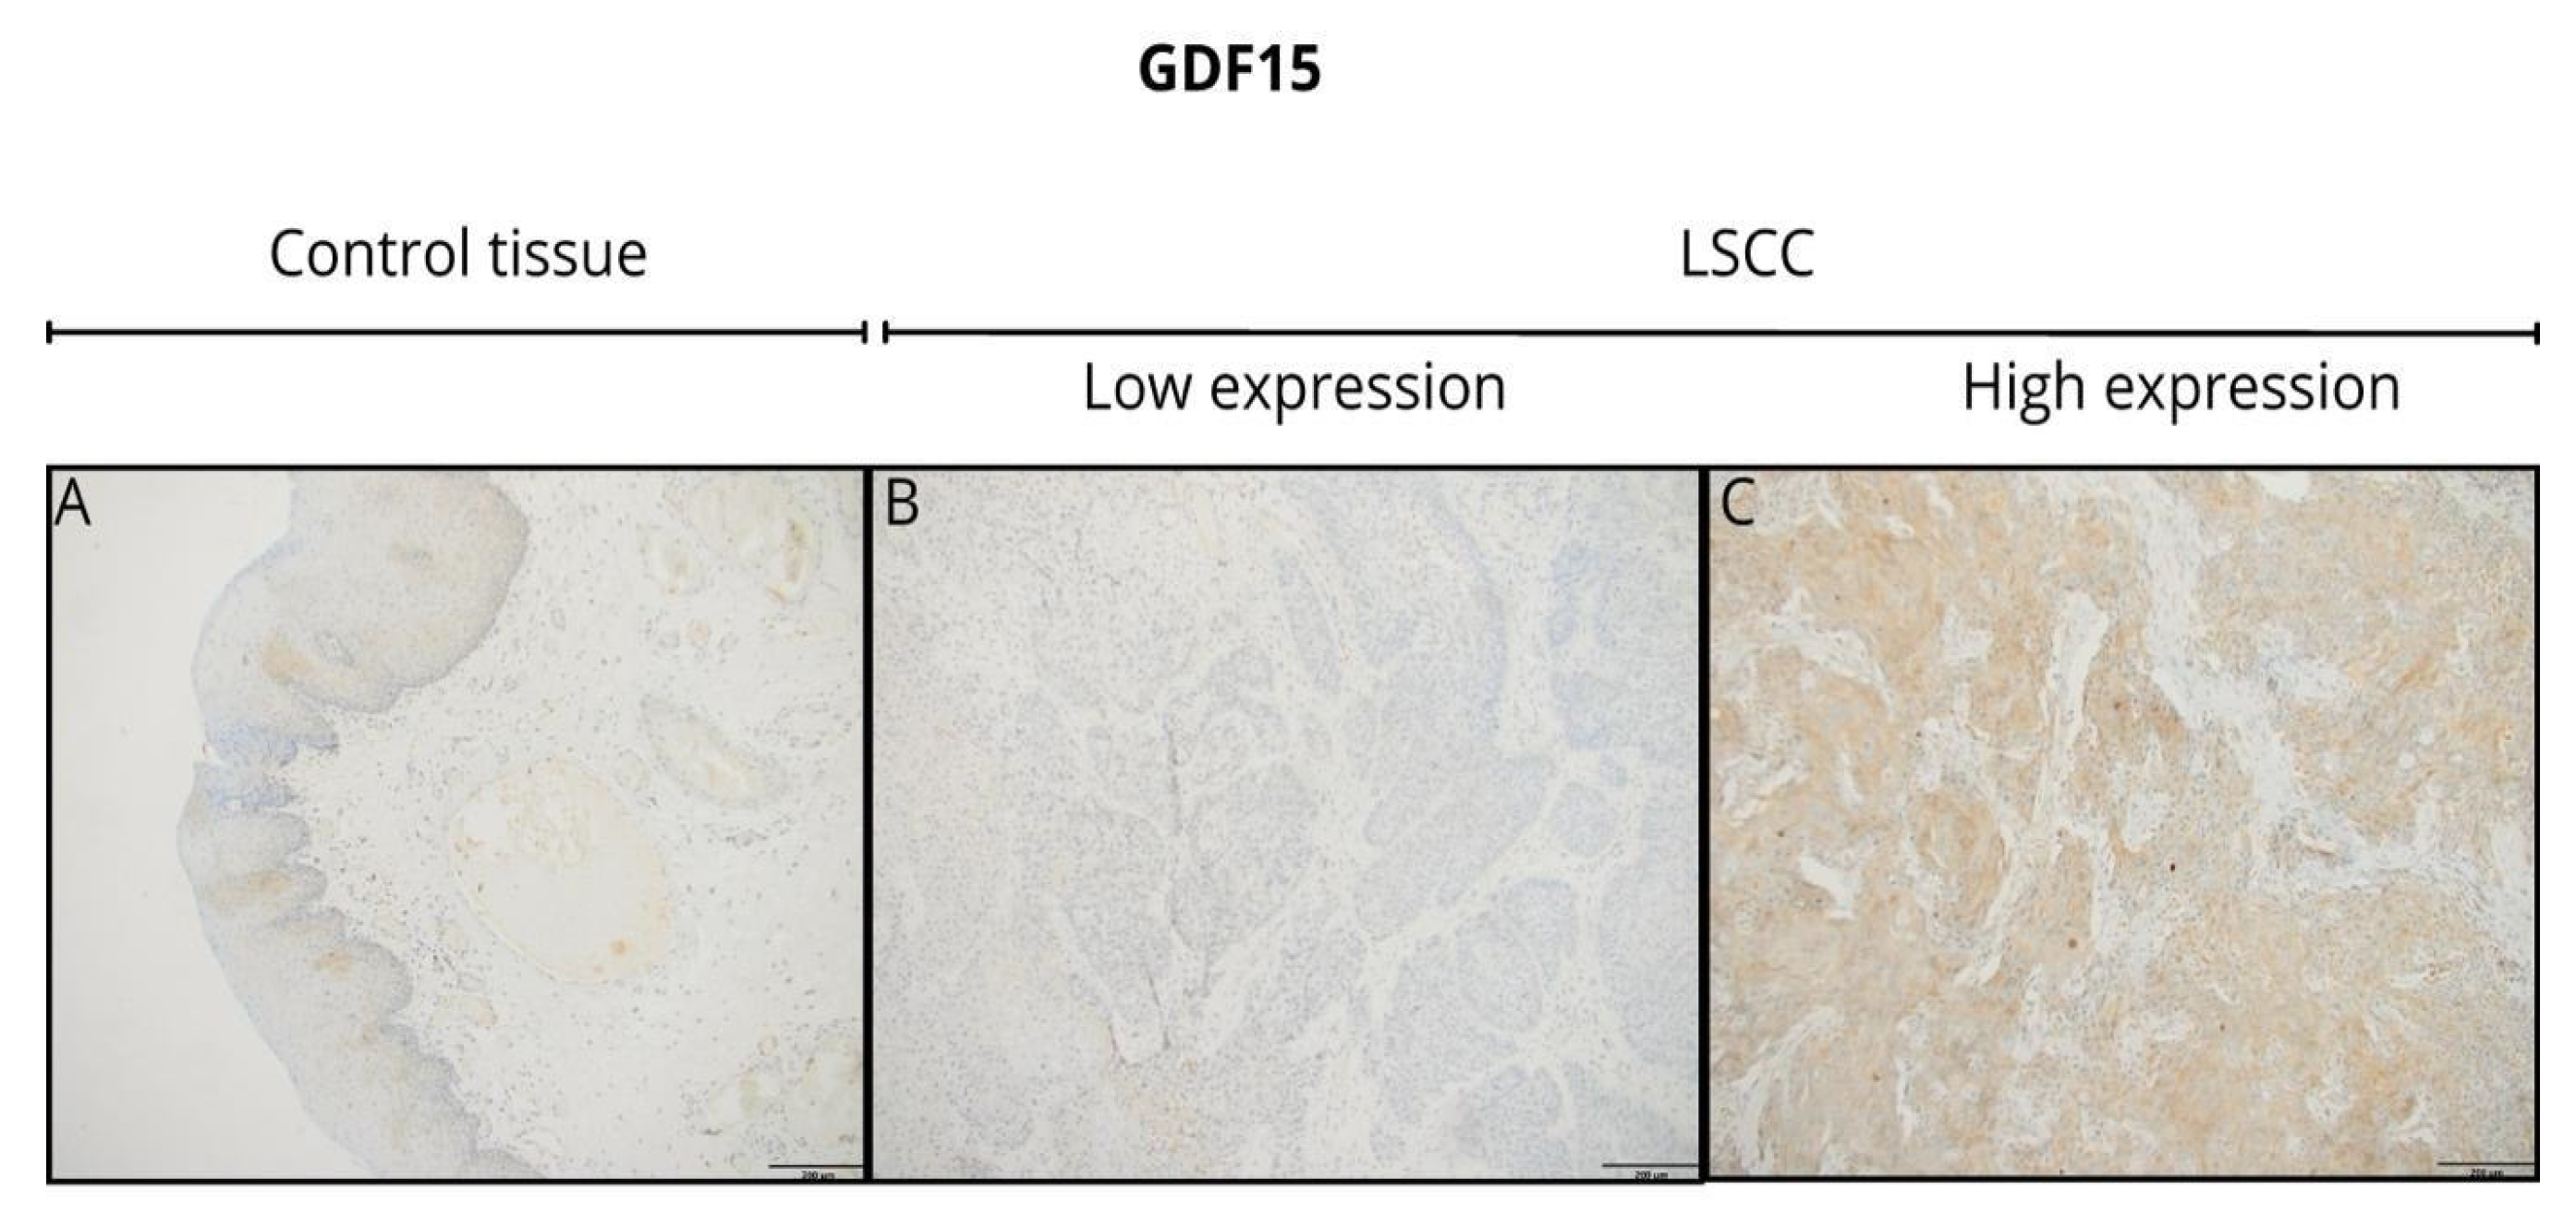

Table 1.
Association of GDF15 with clinicopathological variables in the TMA cohort.
| Variable | n (%) | GFD15 expression | p value | |
| low | high | |||
| Age (years) | ||||
| ≤ 60 | 17 (26.15) | 7 (41.18) | 10 (58.82) | >0.999 |
| > 60 | 48 (73.85) | 21 (43.75) | 27 (56.25) | |
| Gender | ||||
| Male | 55 (84.62) | 22 (40.00) | 33 (60.00) | 0.306 |
| Female | 10 (15.38) | 6 (60.00) | 4 (40.00) | |
| Tumor grade | ||||
| G1 | 16 (24.62) | 6 (37.50) | 10 (62.50) | 0.854 |
| G2 | 45 (69.23) | 20 (44.44) | 25 (55.56) | |
| G3 | 4 (6.15) | 2 (50.00) | 2 (50.00) | |
| pT status | ||||
| T1 | 32 (49.23) | 8 (25.00) | 24 (75.00) | 0.02 |
| T2 | 23 (35.39) | 14 (60.87) | 9 (39.13) | |
| T3-T4 | 10 (15.38) | 6 (60.00) | 4 (40.00) | |
| pN status | ||||
| N0 | 52 (80.00) | 20 (38.46) | 32 (61.54) | 0.210 |
| N1-N2 | 13 (20.00) | 8 (61.54) | 5 (38.46) | |
| Resection margin | ||||
| negative | 50 (76.92) | 23 (46.00) | 27 (54.00) | 0.554 |
| positive | 15 (23.08) | 5 (33.33) | 10 (66.67) | |
| TNM stage | ||||
| I | 30 (46.15) | 7 (23.33) | 23 (76.67) | 0.019 |
| II | 17 (26.15) | 11 (64.71) | 6 (35.29) | |
| III | 7 (10.77) | 3 (42.86) | 4 (57.14) | |
| IV | 11 (16.92) | 7 (63.64) | 4 (36.36) | |
| Tumor location | ||||
| Glottis | 34 (52.31) | 9 (26.47) | 25 (73.53) | 0.001 |
| Supraglottis | 10 (15.39) | 3 (30.00) | 8 (70.00) | |
| Subglottis+others | 21 (32.31) | 16 (76.19) | 5 (23.81) | |
| Smoking status | ||||
| Non-smoker | 22 (33.85) | 8 (36.36) | 14 (63.64) | 0.335 |
| Current smoker | 36 (55.38) | 19 (52.78) | 17 (47.22) | |
| Ex-smoker | 4 (6.15) | 1 (25.00) | 3 (75.00) | |
| N/A | 3 (4.62) | - | - | |
‘others’ includes overlapping lesion of larynx; N/A not available.
Table 2.
Association of GDF15 with clinicopathological variables in the TCGA cohort.
| Variable | n (%) | GDF15 expression | p value | |
| Low | High | |||
| Age (years) | ||||
| < 60 | 40 (34.48) | 33 (82.50) | 7 (17.50) | 0.358 |
| ≥ 60 | 76 (65.52) | 56 (73.68) | 20 (26.32) | |
| Gender | ||||
| Male | 96 (82.76) | 74 (77.08) | 22 (22.92) | 0.780 |
| Female | 20 (17.24) | 15 (75.00) | 5 (25.00) | |
| Tumor grade | ||||
| G1 | 8 (6.90) | 7 (87.50) | 1 (12.50) | 0.111 |
| G2 | 71 (61.21) | 50 (70.42) | 21 (29.58) | |
| G3-G4 | 33 (28.45) | 29 (87.88) | 4 (12.12) | |
| N/A | 4 (3.45) | - | - | |
| T status | ||||
| T1 | 7 (6.03) | 5 (71.43) | 2 (28.57) | 0.966 |
| T2 | 20 (17.24) | 15 (75.00) | 5 (25.00) | |
| T3 | 33 (28.45) | 25 (75.76) | 8 (24.24) | |
| T4 | 56 (48.28) | 44 (78.57) | 12 (21.43) | |
| N status | ||||
| N0 | 52 (44.83) | 35 (67.31) | 17 (32.69) | 0.047 |
| N1-N2 | 63 (54.31) | 53 (84.13) | 10 (15.87) | |
| N/A | 1 (0.86) | - | - | |
| TNM stage | ||||
| I-II | 15 (12.93) | 10 (66.67) | 5 (33.33) | 0.327 |
| III | 19 (16.38) | 13 (68.42) | 6 (31.58) | |
| IV | 82 (70.69) | 66 (80.49) | 16 (19.51) | |
| LVI | ||||
| No | 42 (36.21) | 33 (78.57) | 9 (21.43) | >0.999 |
| Yes | 36 (31.03) | 28 (77.78) | 8 (22.22) | |
| N/A | 38 (32.76) | - | - | |
| Alcohol co. | ||||
| No | 39 (33.62) | 33 (84.62) | 6 (15.38) | 0.240 |
| Yes | 75 (64.66) | 55 (73.33) | 20 (26.67) | |
| N/A | 2 (1.72) | - | - | |
N/A – not available; LVI – lymphovascular invasion.
Table 3.
Univariable and multivariable Cox analysis of disease-free survival in the TMA cohort (n = 65).
Table 3.
Univariable and multivariable Cox analysis of disease-free survival in the TMA cohort (n = 65).
| Variable | n/EPV | Univariable analysis | Multivariable model* | |||||||
| HR | 95% CI | p | HR | 95% CI | p | |||||
| L | U | L | U | |||||||
| Disease free survival | ||||||||||
| GDF15 (high vs low) | 37/15_28/7 | 1.81 | 0.74 | 4.43 | 0.197 | 2.98 | 1.16 | 7.65 | 0.023 | |
| Age (≥ 59 vs < 59) | 48/18_17/4 | 2.53 | 0.75 | 8.54 | 0.136 | - | - | - | - | |
| Sex (male vs female) | 55/20_10/2 | 2.07 | 0.48 | 8.85 | 0.329 | - | - | - | - | |
| Tumor grade (G2-G3 vs G1) | 49/21_16/1 | - | - | - | - | - | - | - | - | |
| T stage | 0.131 | |||||||||
| T1 | 32/7 | REF. - - - |
- - - - |
|||||||
| T2 stage vs REF. | 23/11 | 2.65 | 1.03 | 6.86 | 0.044 | - | - | - | - | |
| T3-T4 stage vs REF. | 10/4 | 1.75 | 0.51 | 5.98 | 0.376 | - | - | - | - | |
| pN (N1-N2 vs N0) | 13/6_52/16 | 1.36 | 0.53 | 3.49 | 0.518 | - | - | - | - | |
| TNM stage | 0.128 | 0.022 | ||||||||
| I | 30/6 | REF. - - - |
REF. - - - |
|||||||
| II vs REF. | 17/8 | 2.92 | 1.01 | 8.43 | 0.048 | 4.64 | 1.53 | 14.13 | 0.007 | |
| III-IV vs REF. | 18/8 | 2.23 | 0.77 | 6.44 | 0.138 | 3.13 | 1.06 | 9.27 | 0.04 | |
| Margins (positive vs negative) | 15/8_50/14 | 2.52 | 1.05 | 6.04 | 0.038 | - | - | - | - | |
| Tumor location (glottis vs others) | 34/8_31/14 | 1.98 | 0.83 | 4.71 | 0.125 | - | - | - | - | |
Abbreviations: TMA – tissue macroarray; HR – hazard ratio, REF. – reference; n – case number; EPV, events per variable, L – lower limit of the 95% confidence interval (CI), U – upper limit of the 95% confidence interval (CI). The group called ‘others’ includes supraglottic cancer, subglottic cancer, as well as overlapping lesion of larynx. HR is shown for the subgroup marked in bold. *Final result of a multivariable Cox analysis with backward elimination of the nonsignificant variables (with removal criterion of p > 0.05). The initial model included all univariate predictors (p < 0.2): GDF15, age, resection margin, tumor location, and tumor stage. ‘Grade’ was not introduced into the models due to insufficient events per G1 subgroup. T stage has not entered the multivariable model due to its collinearity with the tumor stage.
Table 4.
Univariable and multivariable Cox analysis of overall survival (n = 116) and disease-free survival (n =87) in the TCGA cohort.
Table 4.
Univariable and multivariable Cox analysis of overall survival (n = 116) and disease-free survival (n =87) in the TCGA cohort.
| Variable | n/EPV | Univariable analysis | Multivariable model 1* | ||||||||
|---|---|---|---|---|---|---|---|---|---|---|---|
| HR | 95% CI | p | HR | 95% CI | p | ||||||
| L | U | L | U | ||||||||
| Overall survival | |||||||||||
| GDF15(high vs low) | 27/13_89/37 | 1.73 | 0.91 | 3.28 | 0.095 | - | - | - | - | ||
| Age (≥ 69 vs < 69) | 24/15_92/35 | 2.04 | 1.10 | 3.81 | 0.025 | - | - | - | - | ||
| Sex (male vs female) | 96/38_20/12 | 0.28 | 0.14 | 0.54 | 0.0002 | 0.30 | 0.15 | 0.59 | 0.0006 | ||
| Tumor grade | 0.012 | 0.017 | |||||||||
| G1 | 11/4 | REF. | REF. - - |
||||||||
| G2 vs REF. | 72/35 | 3.25 | 0.98 | 10.8 | 0.054 | 4.83 | 1.14 | 20.43 | 0.032 | ||
| G3-G4 vs REF. | 33/11 | 1.29 | 0.36 | 4.63 | 0.699 | 2.13 | 0.47 | 9.70 | 0.326 | ||
| T stage | 0.651 | ||||||||||
| T1-T2 | 27/12 | REF. - - - |
- - - |
||||||||
| T3 vs REF. | 33/15 | 1.15 | 0.53 | 2.50 | 0.731 | - | - | - | - | ||
| T4 vs REF. | 56/23 | 0.84 | 0.41 | 1.75 | 0.646 | - | - | - | - | ||
| N stage (N1-N3 vs N0) | 63/32_53/18 | 1.54 | 0.85 | 2.80 | 0.152 | - | - | - | - | ||
| TNM stage (III-IV vs I-II) | 101/44_15/6 | 0.79 | 0.33 | 1.88 | 0.595 | - | - | - | - | ||
| Disease free survival | Multivariable model 2** | ||||||||||
| GDF15(high vs low) | 56/21_31/7 | 2.14 | 0.88 | 5.20 | 0.092 | - | - | - | - | ||
| Age (> 60 vs ≤ 60) | 48/13_39/15 | 0.53 | 0.25 | 1.12 | 0.095 | - | - | - | - | ||
| Sex (male vs female) | 76/25_11/3 | 0.78 | 0.23 | 2.60 | 0.680 | - | - | - | - | ||
| Tumor grade (G3-G4 vs G1-G2) | 30/10_57/18 | 0.84 | 0.37 | 1.90 | 0.677 | - | - | - | - | ||
| T stage (T3-T4 vs T1-T2) | 68/24_19/4 | 1.41 | 0.48 | 4.10 | 0.533 | - | - | - | - | ||
| N stage (N1-N3 vs N0) | 48/21_39/7 | 2.69 | 1.14 | 6.35 | 0.024 | 2.69 | 1.14 | 6.35 | 0.024 | ||
| TNM stage (III-IV vs I-II)1 | 78/28_9/0 | - | - | - | - | - | - | - | - | ||
Abbreviations: TCGA – The Cancer Genome Atlas; HR – hazard ratio; REF. – reference; n – case number; EPV, events per variable, L – lower limit of the 95% confidence interval (CI), U – upper limit of the 95% confidence interval (CI). HR is shown for the subgroup marked in bold. *Final result of a multivariable Cox model 1 with backward elimination of the nonsignificant variables (with removal criterion of p > 0.05). The initial model included all univariate predictors (p < 0.2): GDF15, age, sex, tumor grade, and N stage. ** Final result of a multivariable Cox model 2 with backward elimination of the nonsignificant variables (with removal criterion of p > 0.05). The initial model included all univariate predictors (p < 0.2): GDF15, age, and N stage. 1TNM stage was not introduced into the models due to insufficient events per stage I-II subgroup.
Disclaimer/Publisher’s Note: The statements, opinions and data contained in all publications are solely those of the individual author(s) and contributor(s) and not of MDPI and/or the editor(s). MDPI and/or the editor(s) disclaim responsibility for any injury to people or property resulting from any ideas, methods, instructions or products referred to in the content. |
© 2024 by the authors. Licensee MDPI, Basel, Switzerland. This article is an open access article distributed under the terms and conditions of the Creative Commons Attribution (CC BY) license (http://creativecommons.org/licenses/by/4.0/).
Copyright: This open access article is published under a Creative Commons CC BY 4.0 license, which permit the free download, distribution, and reuse, provided that the author and preprint are cited in any reuse.


