1. Introduction
Global greenhouse gas (GHG) emissions and carbon dioxide (CO
2) concentrations in the atmosphere continue to increase [
1], which has destabilized the climate [
2,
3]. This has resulted in potentially irreversible negative repercussions for both the natural environment as well as the social and economic welfare of humanity [
4,
5]. Most importantly to humanity, climate change is already responsible for numerous deaths and the potential billion future premature deaths spread over a period of very roughly one century [
6,
7]. To prevent these severe consequences it is imperative to reduce carbon emissions [
1,
3] by a large collection of methods [
8,
9,
10,
11,
12].
Although carbon emissions from energy use receive most of the attention, concrete manufacturing is the most detrimental material for the environment [
13]. The Portland cement that makes up 10-15% of concrete is responsible for 8% of global carbon emissions [
14,
15]. This is due to emissions from fossil fuel combustion to operate rotary kilns and the high temperatures required for the calcination of limestone, which results in 1.25 tons of CO
2 for every 1 ton of cement [
13]. Traditional concrete is the most used material globally (30 billion metric tons/year) [
16]. For perspective, if concrete were a country it would be behind only the U.S. and China in carbon emissions [
15,
17,
18]. Globally, the emissions from cement production continue to grow annually reaching a new peak of 1.7 billion metric tons of CO
2 in 2021 [
19]. Beyond CO
2 emissions, concrete uses 18% of global industrial water consumption and 9% of industrial water withdrawal each year [
20].
A much more visual source of environmental degradation is plastic waste as only 9% is recycled [
21] and thus long-lived plastic has widespread negative environmental effects [
22]. Although concrete’s environmental impact is largely unseen compared to ubiquitous plastic pollution [
23], the problem of concrete is much more severe than plastic [
18]. The vast amount of unrecycled plastic, however, presents an opportunity to use of polymers as a replacement aggregate or fiber reinforcement in concrete [
24]. To go a step further, one such approach has the potential to solve these two environmental problems simultaneously: find a way to recycle long-lived waste plastics that pollute the environment and replace cement manufacturing. This has been proposed as material substitutes in the experimental testing of plastic sand bricks [
25]. Several methods have been explored to manufacture plastic sand brick composites and test them for compressive strength, tensile strength, efflorescence, thermal resistance, and water absorption [
26,
27]. This includes testing thermoplastics such as both low density polyethylene (LDPE) and high density polyethylene (HDPE), as well as polypropylene (PP), and polystyrene (PS) and polyvinylchloride (PVC) [
28]. Plastic sand composites can achieve a compressive strength equivalent to the average for commercial concrete (from 23.3 to 30.2 MPa [
29]) with the highest strength from common thermoplastics being 32.7 MPa for a 3:1 LDPE-sand material composite [
30]. Most recently, a study with 50% polycarbonate (PC) and 50% sand composition yielded an average compressive strength of 71 MPa and a simultaneous increase in compressive stiffness more comparable to concrete[
31].
Thus, this study produced samples according to ASTM D695 and standard brick size to determine energy consumption. In this research, 50:50 sand-to-plastic composite charges were first prepared using an open-source recyclebot single-screw extruder [
32,
33]. The samples were formed using an open-source hot press inside custom molds [
34]. This study includes a cradle-to-gate environmental impact of sand-plastic brick and compares the result with the environmental impact of concrete. Two impact categories such as cumulative energy demand and IPCC global warming potential 100a were evaluated to quantify the energy consumption and greenhouse gas emission associated with sand-plastic brick and two types of concrete, spanning the lifecycle from raw materials extraction to use phase.
2. Materials and Methods
2.1. Materials
The materials and sources used in this study are listed in
Table 1.
The sand-plastic samples were fabricated using a combination of extrusion and compression molding techniques [
31]. The current setup allows for the small sample size batch to make 12 samples suited for ASTM D695 and one standard size brick of sand-plastic composites. To ensure each sample maintained a homogenous composition, the granulated rPC and silica sand were added to a single-screw extruder to produce uniform “pebbles” that were more compatible with the custom mold and compression molding process. Once these pebbles were extruded and cooled, they were prepared for integration with the hot press and compression molding.
Each of the pockets of the ASTM D695 custom mold were partially loaded with the prepared charges of homogenous silica sand and rPC. The mold was placed into the hot press and preheated to soften the loaded pebbles. Once soft, the mold was removed, and the plunger-style inserts added to each pocket before returning the assembly to the open source scientific hot press [
34] to compress the layer of softened material. This effectually ensured homogenization between pebbles, reduced any potential porosity in the final product, and ensured the charge conformed to the entire volume of the mold. This process was then repeated with additional layers of sand-plastic pebbles, softening, and pressing operations until the mold was fully loaded, and the material was densely compacted. Once complete, the mold was then allowed to cool within the hot press after which the formed bricks were carefully removed.
This method, which combines extrusion and hot pressing, was created to improve material bonding and provide a more repeatable manufacturing process for developing sand-plastic samples.
2.2. Life Cycle Assessment
Life cycle assessment (LCA) is a widely recognized methodology for analyzing environmental impacts across a product’s entire life cycle [
35,
36,
37,
38,
39]. According to ISO standards 14040 and 14044, an LCA consists of four key stages: goal and scope definition, life cycle inventory (LCI), life cycle impact assessment (LCIA), and interpretation [
40,
41,
42,
43]. An open-source software, openLCA, was used for the LCA study [
44].
2.2.1. Goal and Scope
In the goal and scope phase, the study objectives are defined, along with the selection of system boundaries and the functional unit. The system boundary outlines which processes are included in the analysis. This study carried out a cradle-to-gate assessment for both concrete and sand-plastic bricks, focusing on the life cycle stages before the use phase. Data inputs and outputs are normalized based on the functional unit (FU), set as one cm³, to facilitate comparison between different material systems [
45].
2.2.2. Life Cycle Inventory (LCI)
The LCI phase involves compiling data on inputs and outputs from unit processes. LCI data for concrete were sourced from the USLCI database and relevant literature [
46,
47,
48,
49,
50,
51,
52]. Two types of concrete were considered: (i) standard concrete used in residential construction and (ii) frost-resistant concrete for bridge construction. Additionally, a detailed LCI for silica sand production, a key component of sand-plastic bricks, was included. An open-loop recycling process was applied to the recycled polycarbonate used in manufacturing sand-plastic bricks. ISO standards 14040 and 14044 specify two methods for recycling in LCA: a closed-loop system is used when recycled material maintains its original properties and is reused in similar applications [
42].
In contrast, an open-loop system is applied when the material’s properties change or are used in different applications [
40,
41]. Therefore, the environmental impacts of virgin polycarbonate (vPC) production were excluded for this study. The energy demand and emissions generated during the polycarbonate recycling process were considered, with data from existing literature [
42,
53,
54,
55,
56,
57,
58,
59]. North America was defined as the geographic region for all life cycle stages.
2.2.3. Life Cycle Impact Assessment (LCIA)
The impact assessment phase focused on climate change and primary energy demand during raw material production. Primary energy demand, also called cumulative energy demand (CED), includes energy derived from fossil and non-fossil sources [
35,
60,
61,
62,
63,
64]. Primary energy represents the energy embedded in natural resources like coal, natural gas, biomass, and uranium, which must be converted into usable energy.
Climate change impacts were assessed by evaluating greenhouse gas (GHG) emissions contributing to global warming. The global warming potential (GWP) was used to compare the time-integrated radiative forcing of GHGs against that of carbon dioxide (CO₂) [
65]. Commonly reported GHGs include CO₂, methane, ozone, and nitrous oxide. GWP results are expressed as CO₂-equivalents (CO₂, eq) over different periods, with the most common being a 100-year horizon, referred to as GWP 100 [
8,
38,
66,
67,
68,
69,
70,
71,
72,
73,
74]. The interpretation of the results is discussed in the subsequent sections.
3. Results
3.1. Ordinary and Frost-Resistant Concrete
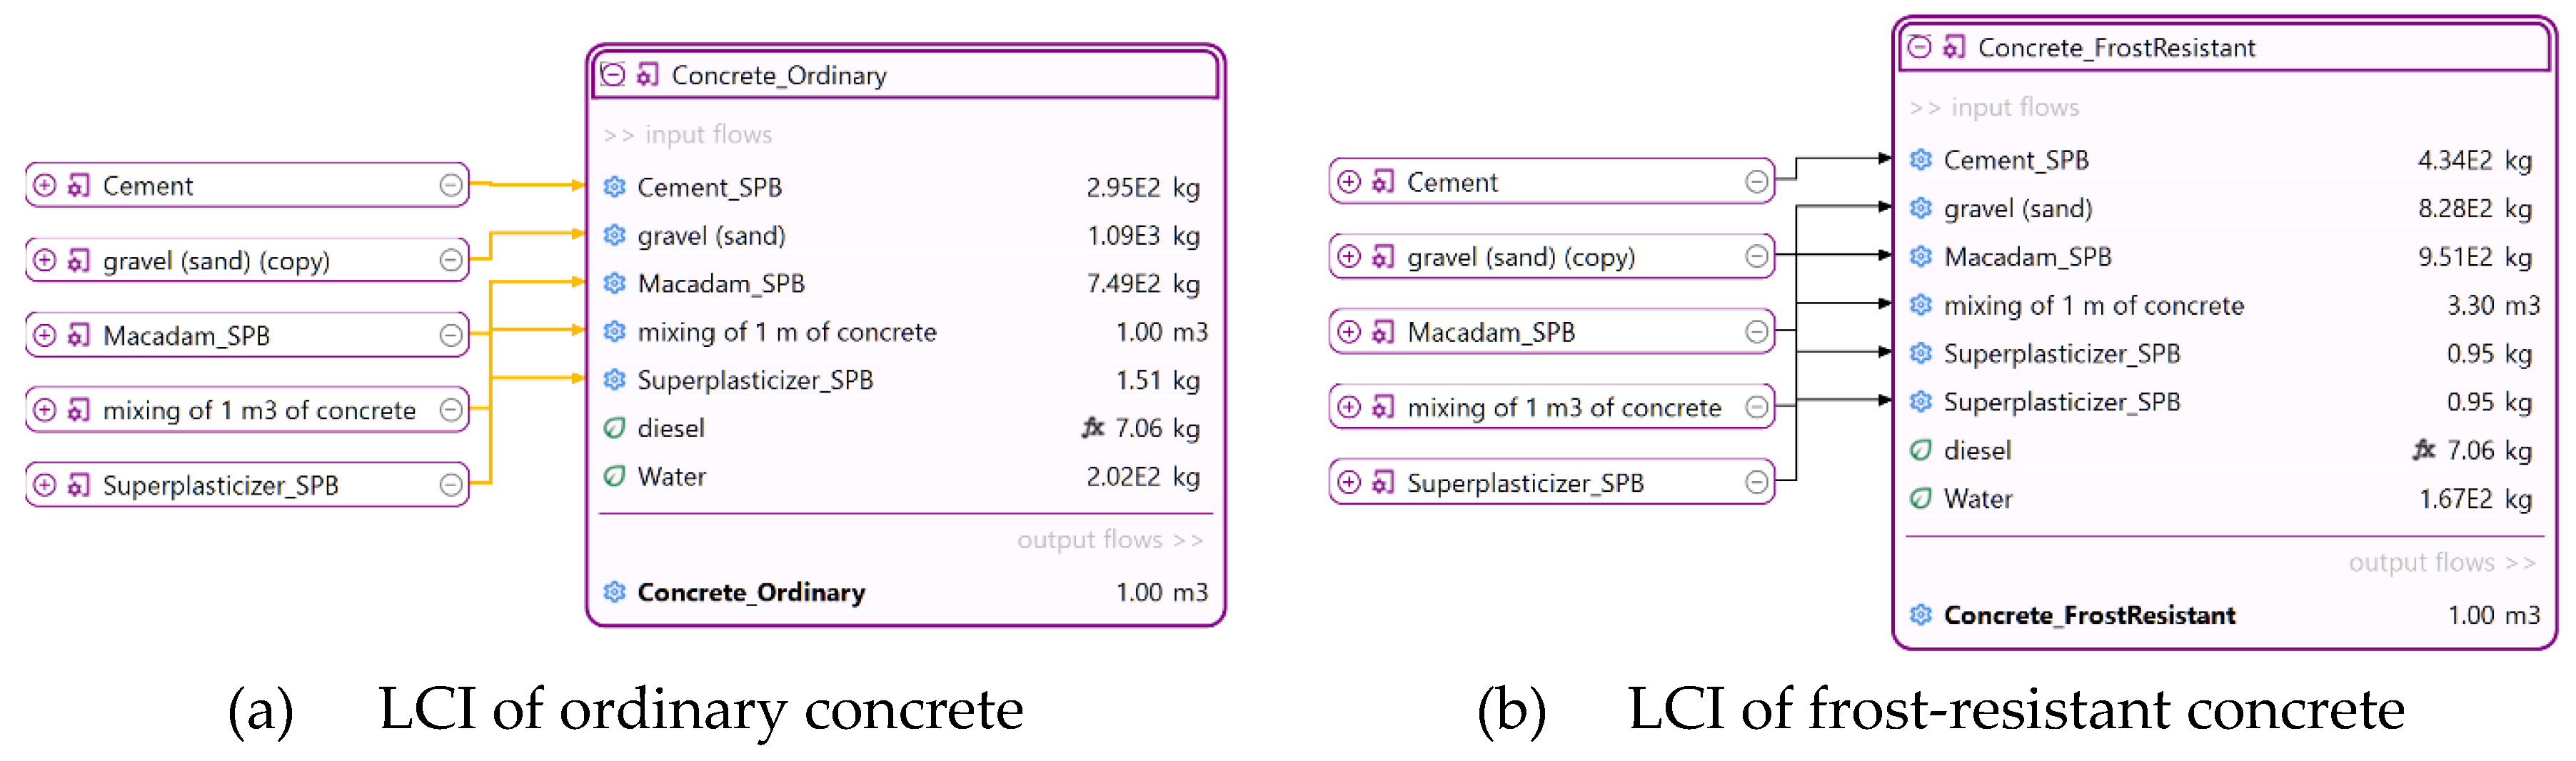
Figure 1 presents the LCI of ordinary and frost-resistant concrete. The CED for ordinary concrete is calculated as 1.89E-03 MJ/cm³, equivalent to 5.25E-04 kWh/cm³. The majority of the energy demand, approximately 72.92%, is attributed to cement production, reflecting the energy-intensive nature of cement manufacturing. Concrete mixing accounts for 6.19% of the total CED, while the production of macadam, superplasticizer, and gravel each contributes less than 5% to the total energy demand.
In contrast, the CED for frost-resistant concrete is higher, at 0.00283 MJ/cm³, corresponding to 7.86E-4 kWh/cm³. Like ordinary concrete, cement production is the dominant energy consumer, responsible for 71.67% of the total energy demand. The energy contribution from concrete mixing, however, is significantly higher for frost-resistant concrete, accounting for 13.64% of the total CED. The production of macadam (2.64%), superplasticizer (1.10%), and gravel (0.17%) remain minor contributors, each accounting for less than 5% of the total energy demand.
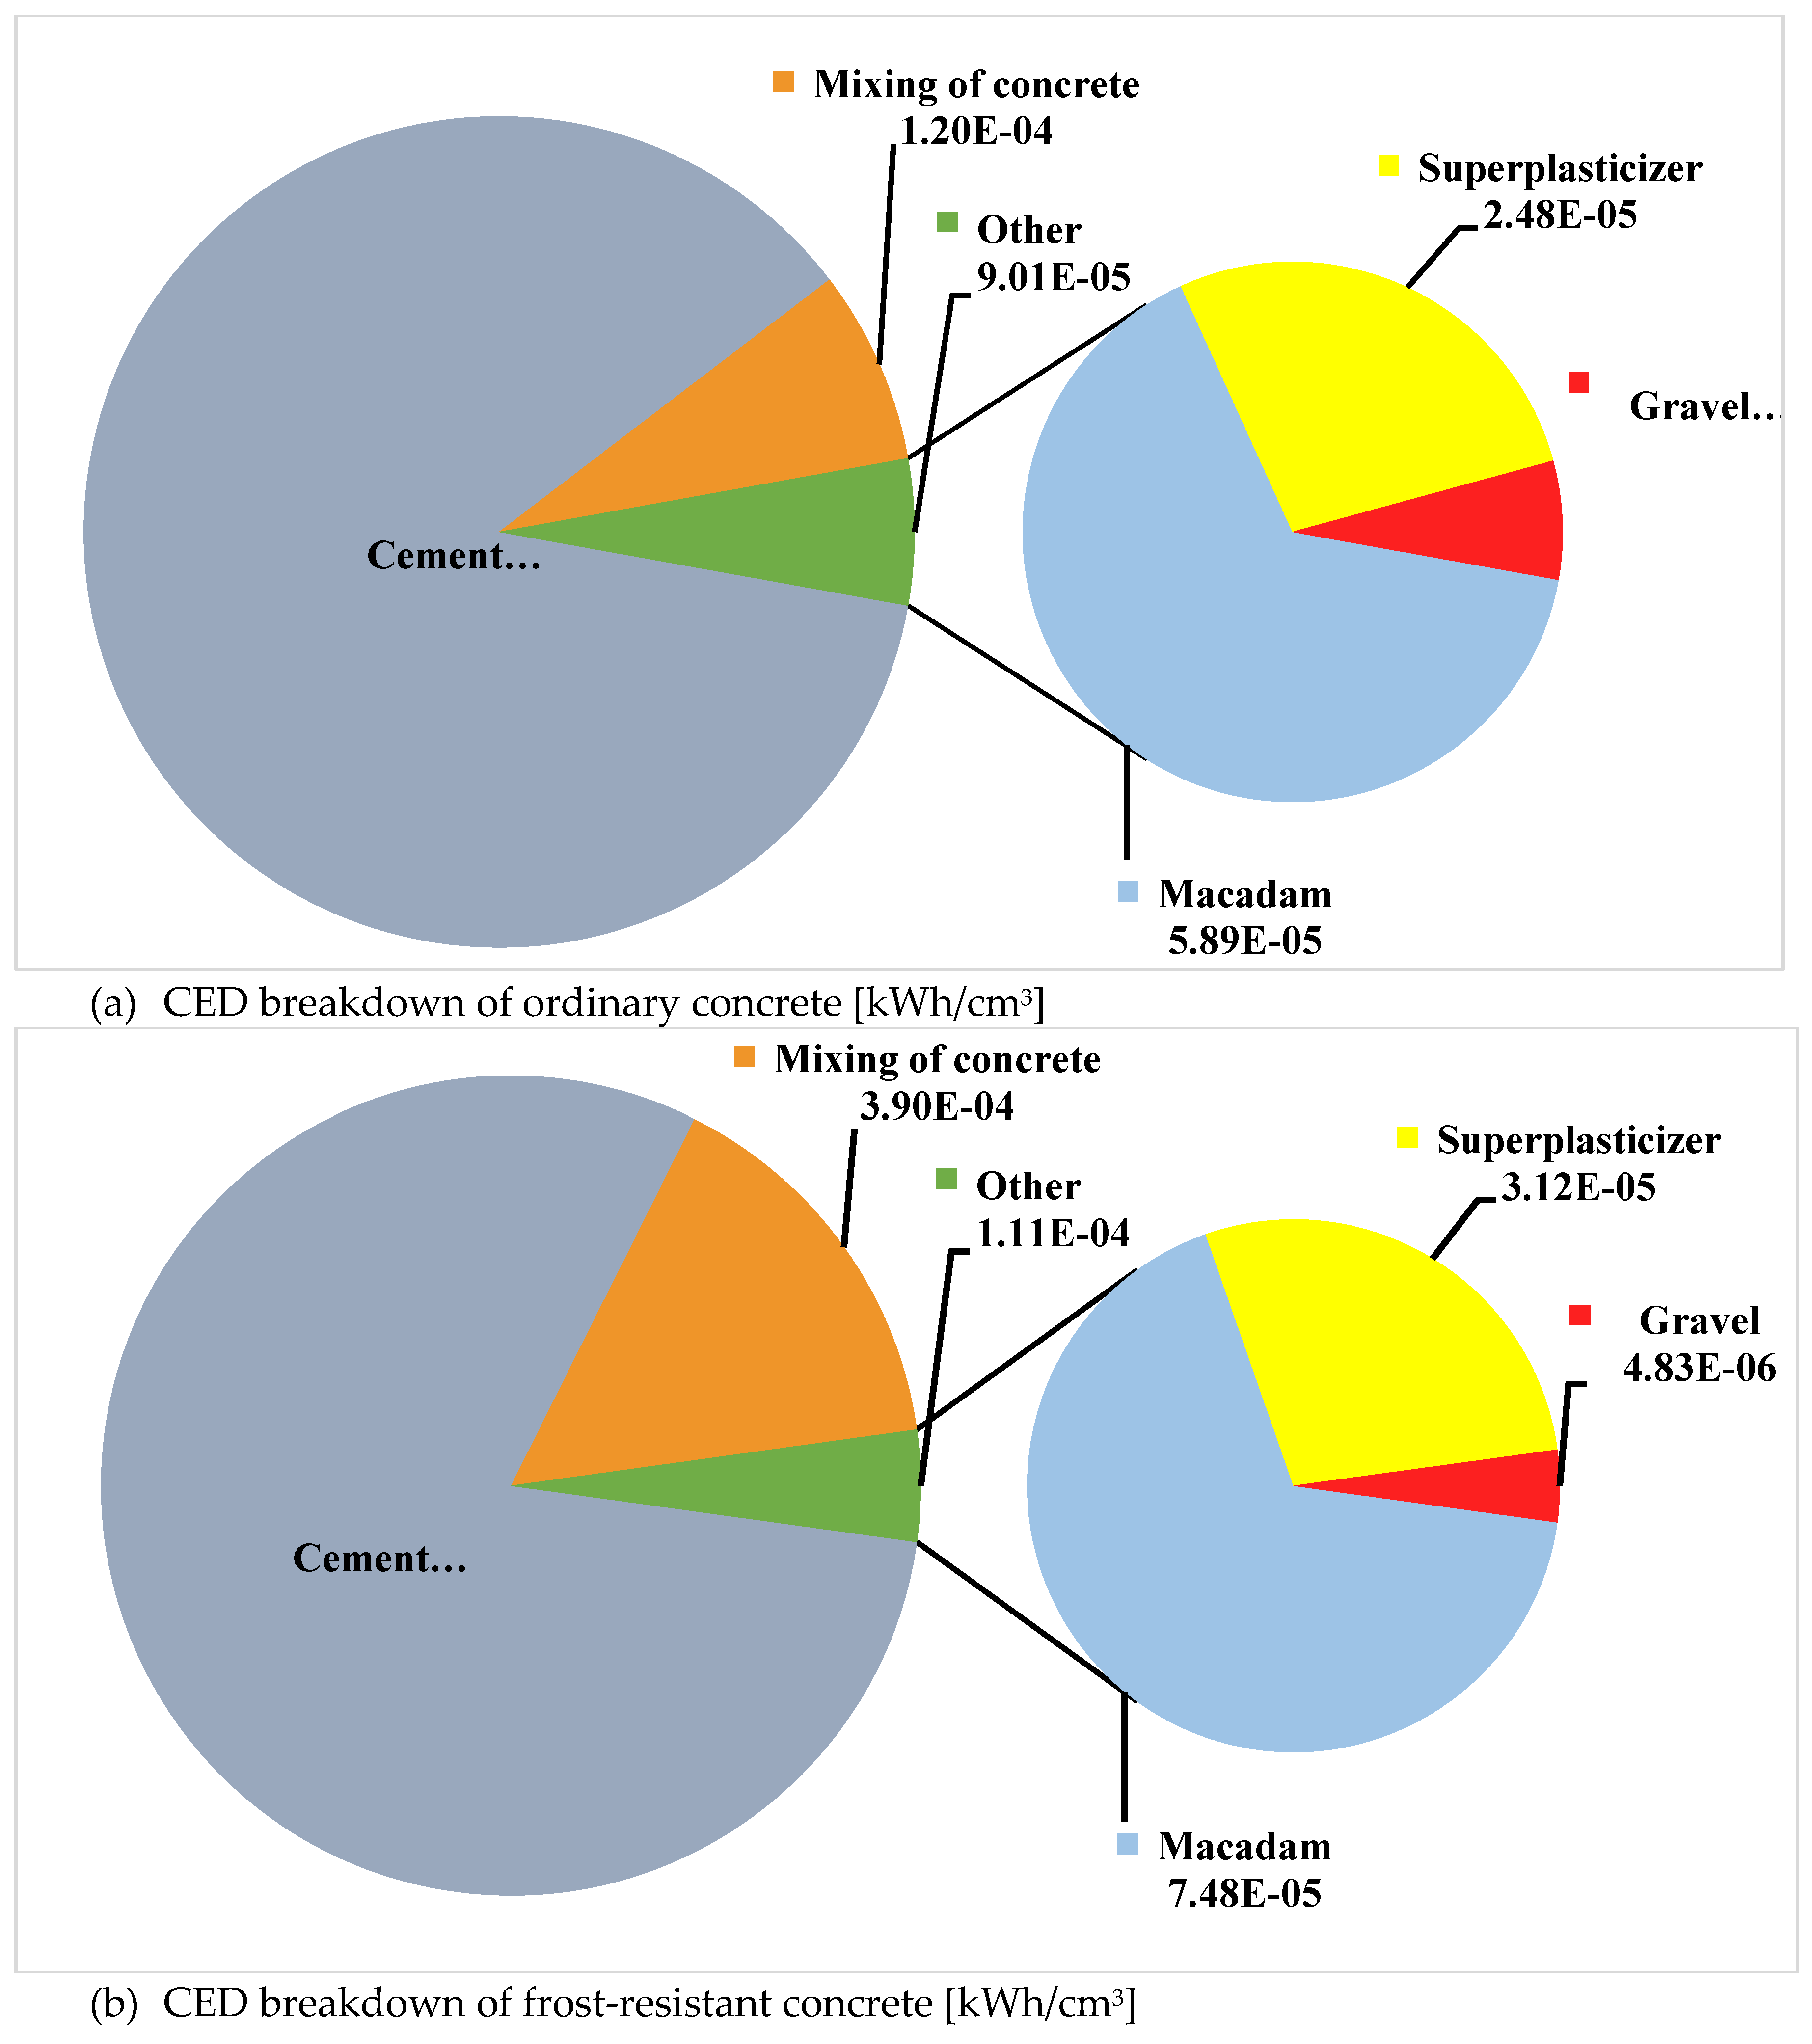
Figure 2 shows the breakdown of two different kinds of concrete.
Regarding GHG emissions, ordinary concrete emits 4.2E-4 kg CO₂ eq/cm³, with 99.99% of these emissions arising from cement production. Similarly, frost-resistant concrete has higher emissions, producing 5E-1 kg CO₂ eq/cm³, with cement production again responsible for around 74% of the total CO₂ emissions. The high proportion of emissions from cement production in both types of concrete underscores its significant environmental impact on the overall life cycle of these materials.
3.2. Sand-Plastic Brick
The CED of sand-plastic composite is 8.60E-02 MJ/cm³, equivalent to 2.49E-02 kWh/cm³. Most of this energy consumption, 93.78%, is attributed to the electricity required for brick production. PC recycling accounts for 4.73% of the total energy demand, while silica sand production contributes 1.49%.
The process of manufacturing these ASTM D695 composites consumed 3.63 kWh of electricity.
Table 2 provides a breakdown of electricity consumption at various stages of the brick-making process.
The sand-plastic composite has a carbon footprint (CF) of 1.87E-03 kg CO₂ eq./cm³. Of this, 98.1% of emissions are associated with electricity use during brick production. Additionally, less than 1% of the total CF results from the PC recycling process, while silica sand production contributes around 1.5% of total emissions.
3.2.1. Case 1: Sensitivity Analysis of CED and CF per cm3 on Scalability for ASTM D695 Composites and Standard Brick Size sand-rPC Composite Compared to the CED and CF of Ordinary and Frost-Resistant Concrete. Electricity Mix: Ontario Grid-Mix
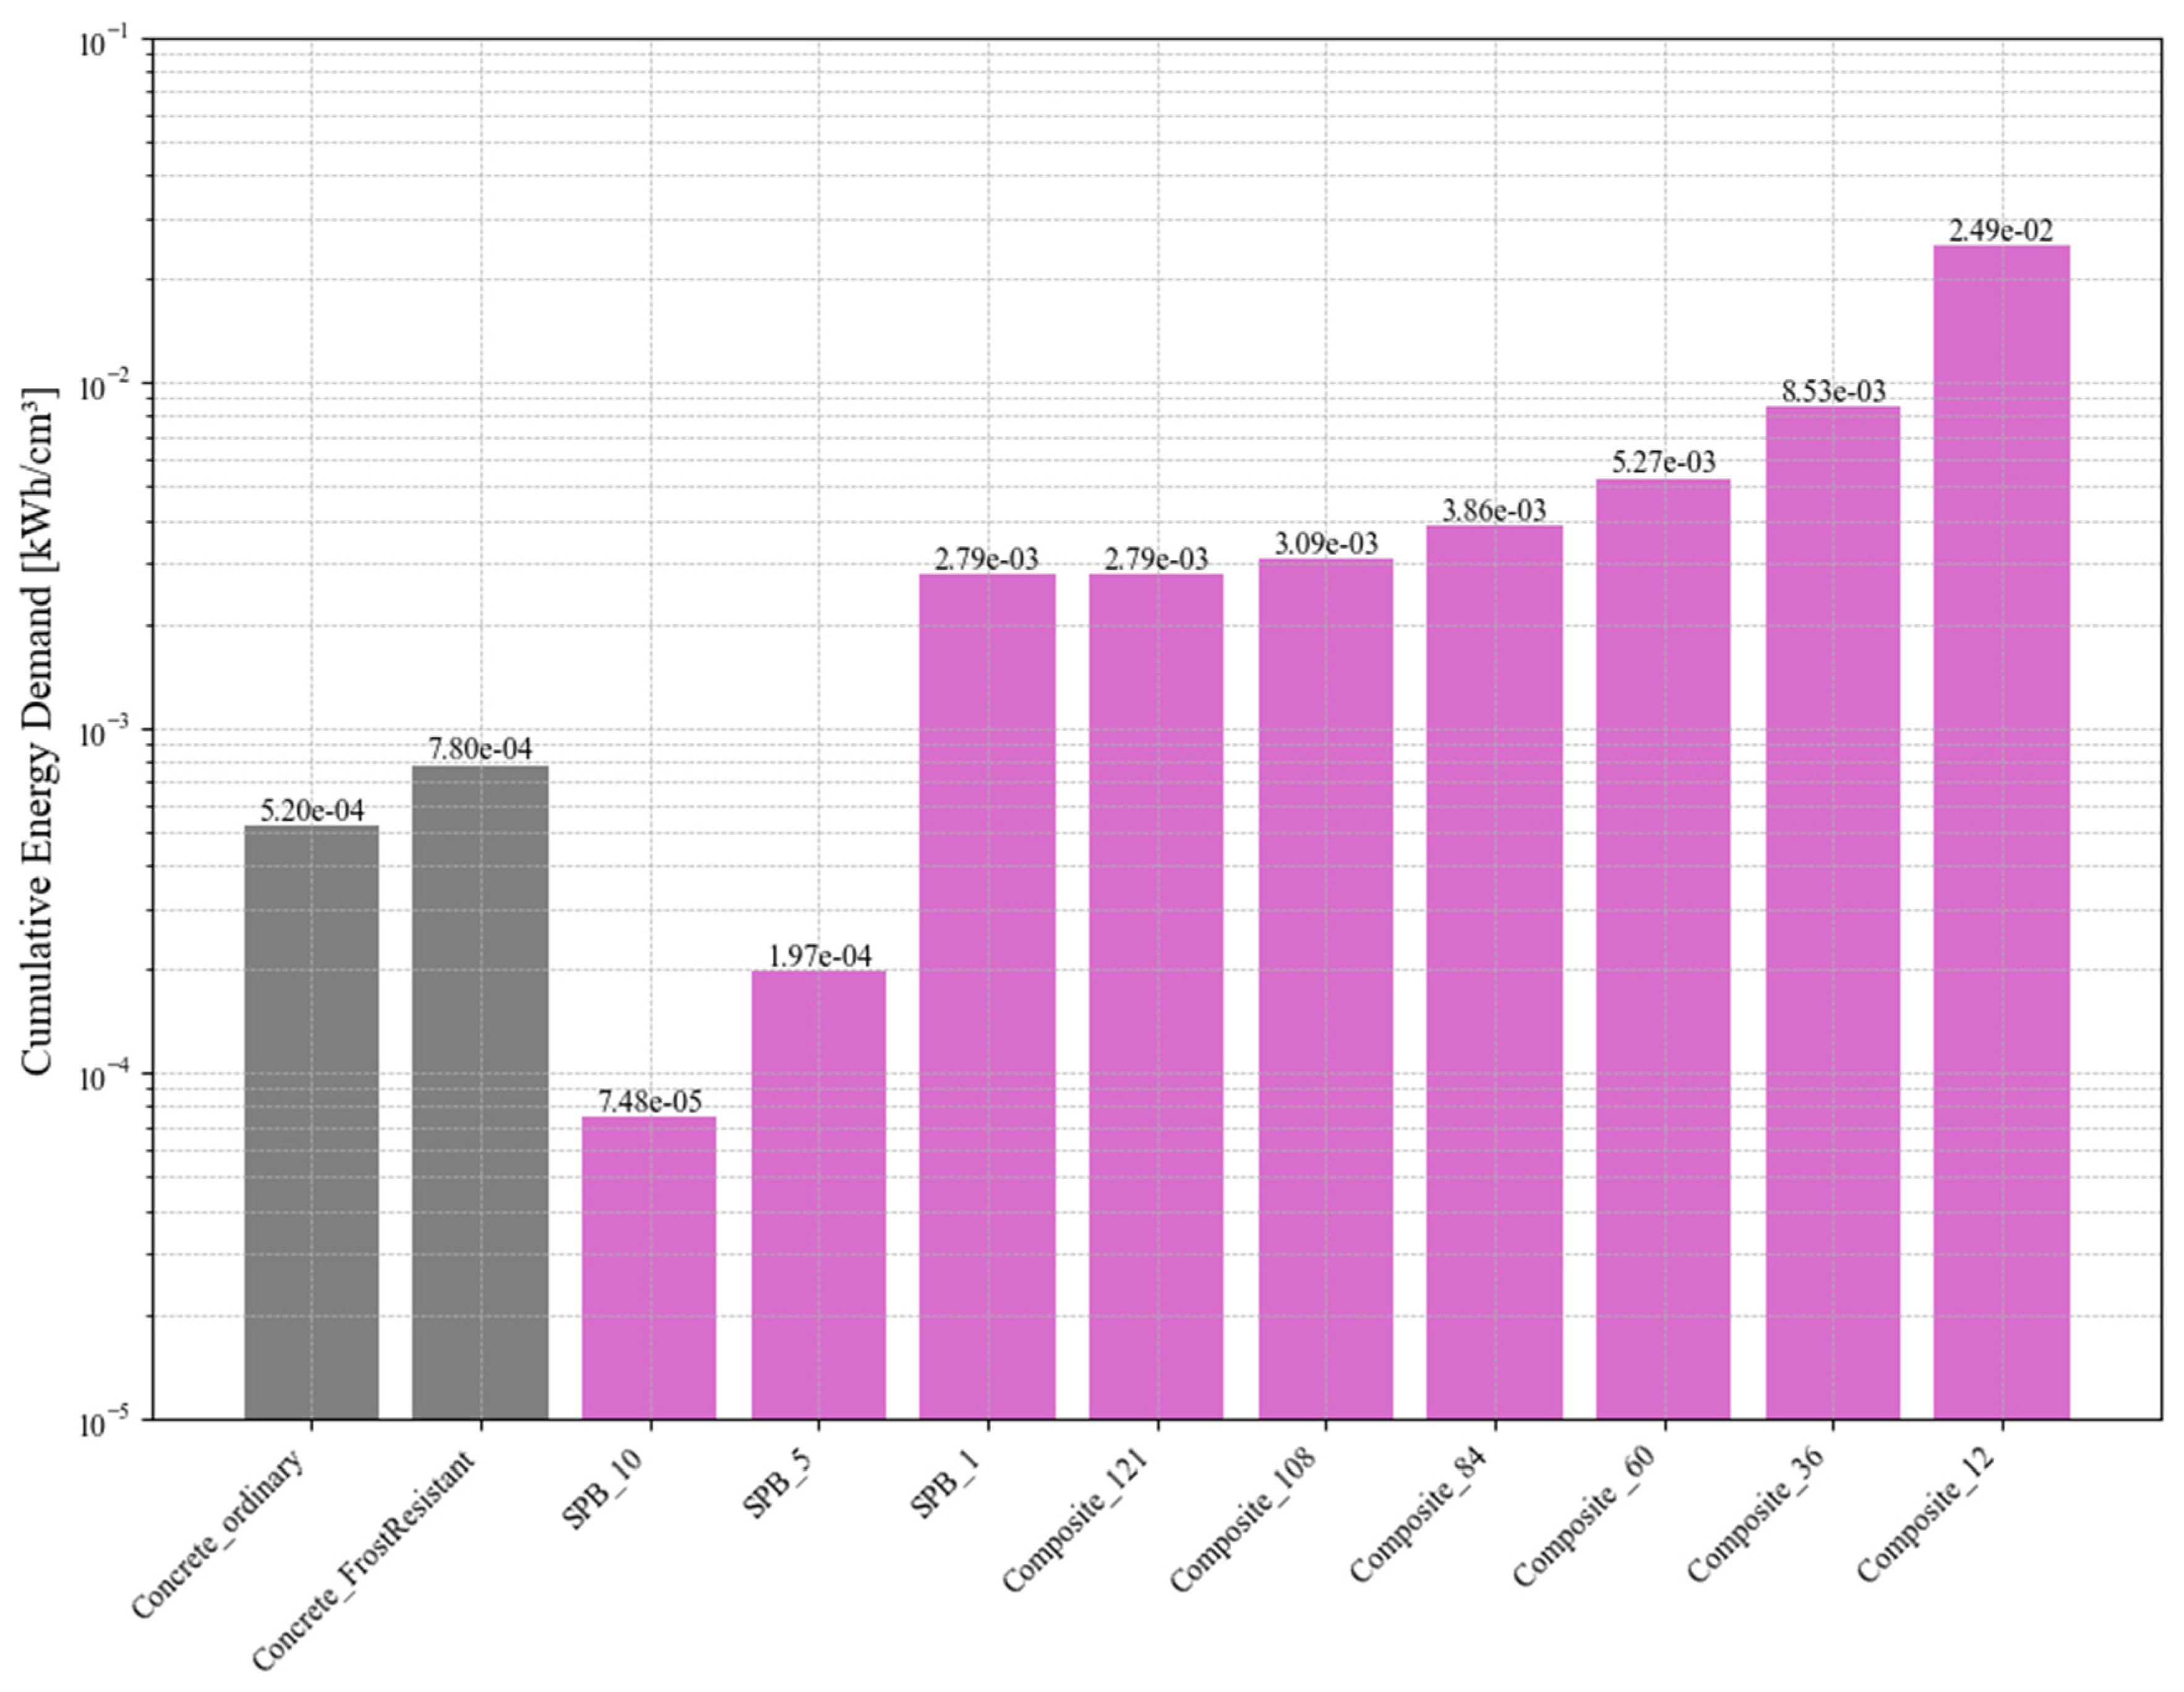
The scalability of sand-plastic composite production was evaluated in terms of environmental impact, focusing on differences between small-batch (ASTM D695 standard sample size) and large-batch (standard brick size) production. In
Figure 3 and
Figure 4, ASTM D695 samples are denotes as “Composite” and standard brick size samples denotes as “SPB”. The sand-plastic composite, adhering to ASTM D695 standards, is produced in batches capable of yielding 12 individual samples, though the production facility has a greater capacity. Additionally, a standard brick-sized sand-plastic composite (SPB) was manufactured, approximately equivalent to producing 135 ASTM D695 composite samples.
When analyzing the CED of sand-plastic composites at various production scales, significant differences emerge when compared to ordinary concrete. The smallest batch, consisting of 12 ASTM D695 composite samples (Composite_12), exhibits a CED of 2.49E-02 kWh/cm³, which is approximately 48 times higher than the CED of ordinary concrete at 5.20E-04 kWh/cm³. By increasing the production scale to 108 samples (Composite_108), the CED per sample decreases dramatically by around 87.6%, dropping to 3.09E-03 kWh/cm³. The standard brick-sized composite, however, remains about 5.36 times higher in CED than ordinary concrete. Notably, by producing 10 standard brick-sized composites (SPB_10), the CED per cubic centimeter can be reduced to 7.48E-05 kWh/cm³, making it approximately 6.95 times lower than that of ordinary concrete.
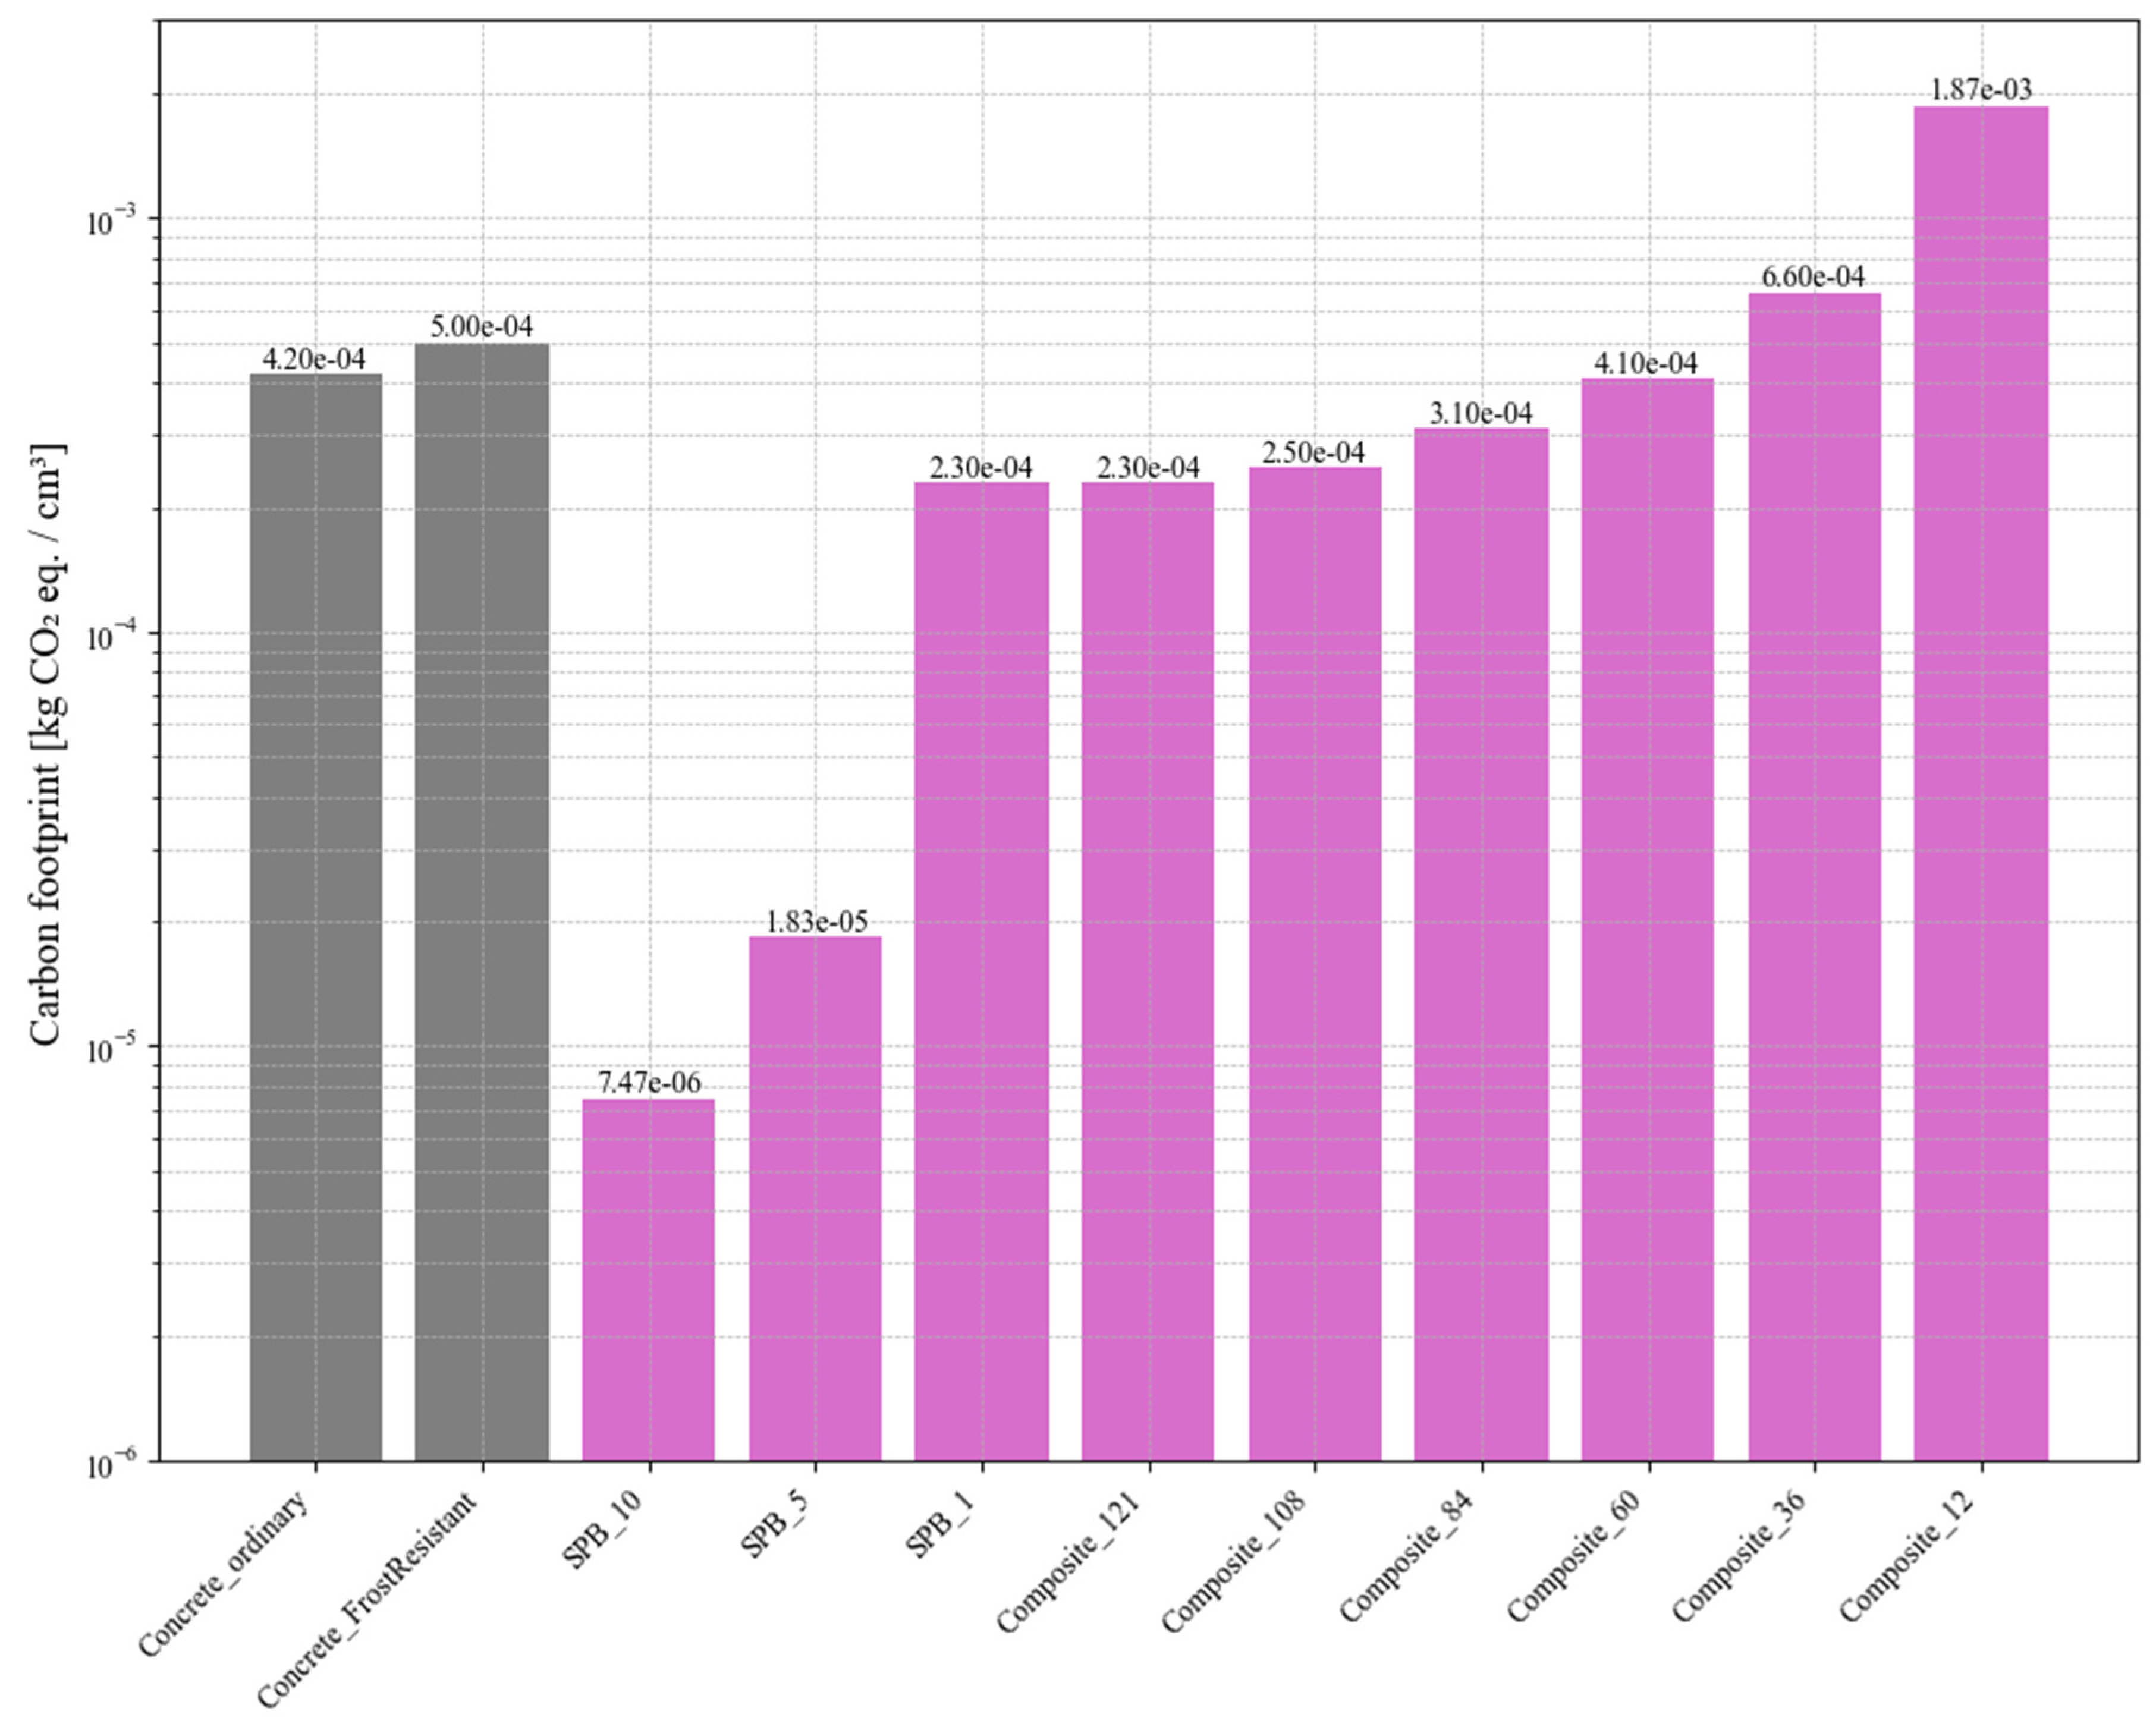
The CF of small-batch composite samples, produced in sets of 12, is significantly higher compared to larger batches due to the frequent heating and processing cycles required in small-scale production. When compared to traditional materials, the CF of 12 composite samples is 92% higher than ordinary concrete and 90% higher than frost-resistant concrete, making the small-batch production less environmentally favorable.
By scaling up production to a standard brick size, which is equivalent to producing 135 samples, however, shows a substantial improvement in CF. The CF of SPB is approximately 64% lower than that of 12 composite samples, demonstrating the environmental advantage of larger batch production. This reduction is achieved due to the reduced need for repetitive heating and mixing cycles, which improves the energy efficiency of the process and lowers CF. In fact, SPB emits 31% less CO₂ per cm³ than ordinary concrete and 56% less than frost-resistant concrete, making it a more sustainable alternative to both concrete types at this scale.
For sand-plastic composite to achieve a lower CF than traditional concrete, at least 84 samples need to be produced in a single batch, beyond which the CF begins to dip below that of ordinary concrete. This threshold highlights the critical role of production scale in making sand-plastic composite a viable, lower-impact alternative to conventional construction materials.
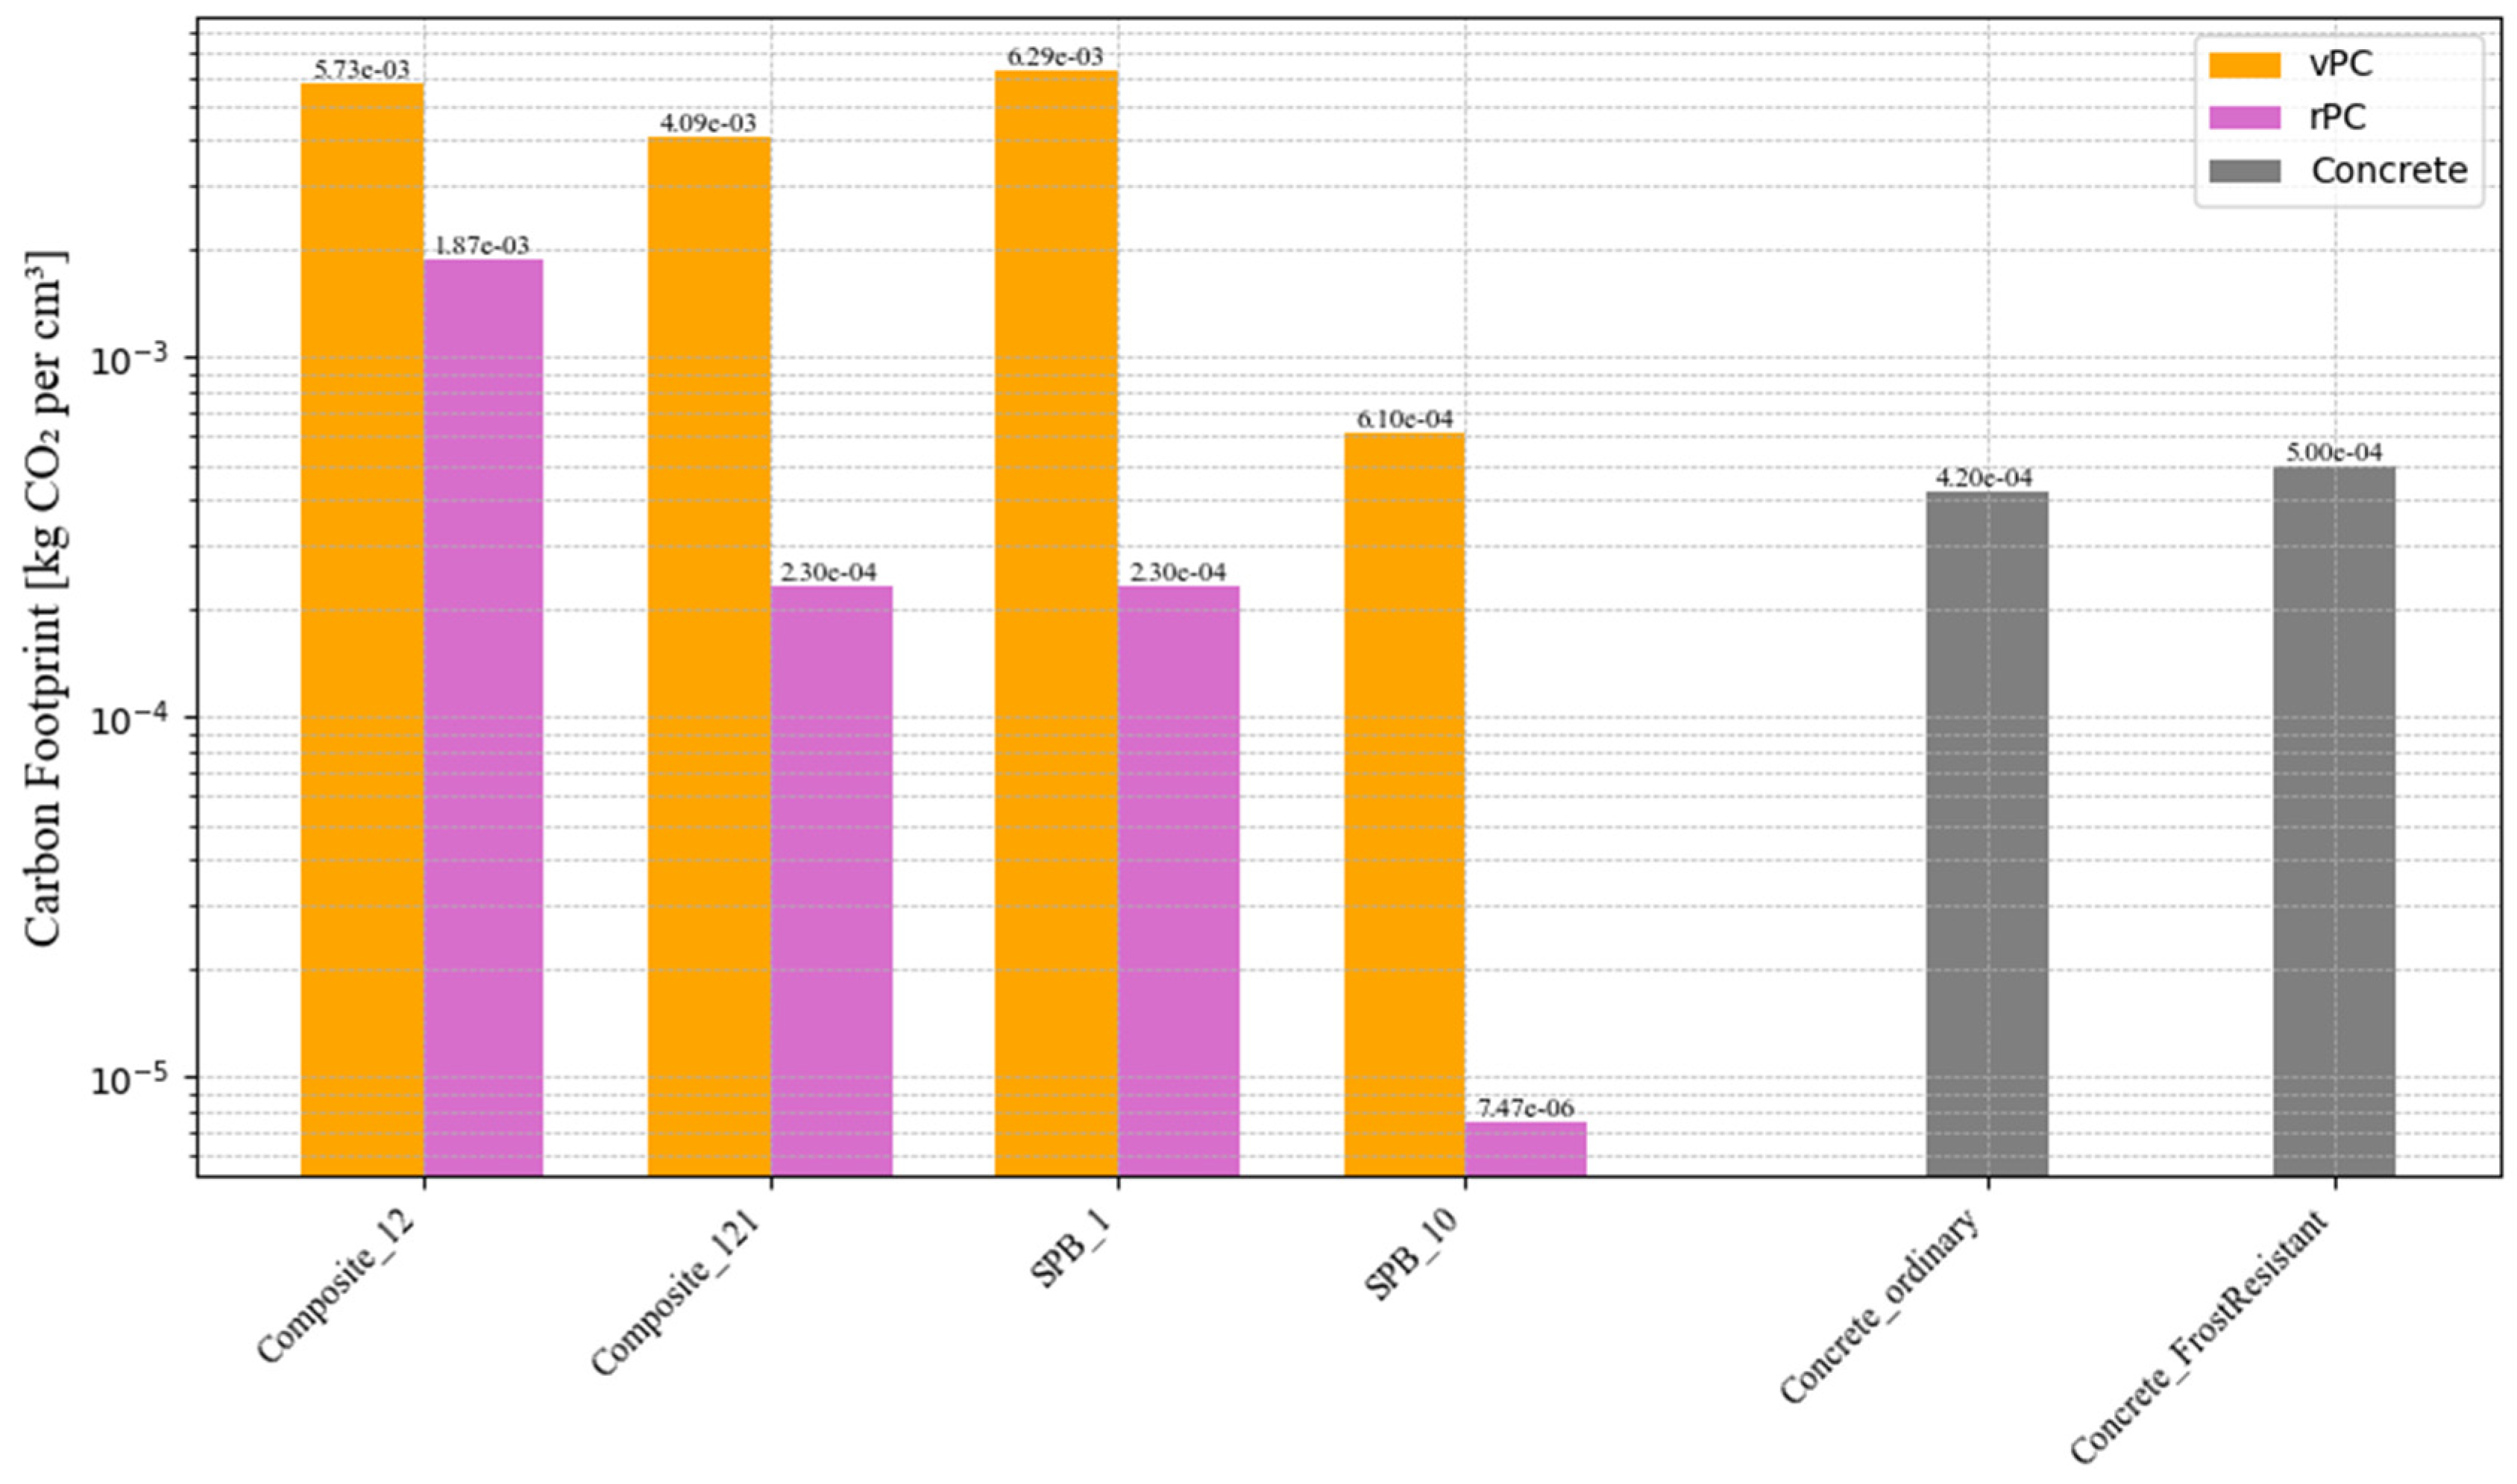
3.2.2. Case 2: Comparative Environmental Analysis Between Sand-rPC Composite (Made from Recycled and Virgin PC) and Concrete
This section evaluates the CF of sand-plastic composites made with vPC and rPC, focusing on the impact of scalability. The analysis considers the manufacturing processes within the Ontario electricity grid mix, which predominantly relies on low-carbon sources like hydroelectricity and other renewable energy technologies.
The CF of vPC-based sand-plastic composites is significantly higher than the rPC based composites. In the smallest batch (Composite_12), the CF of vPC composites is nearly three times that of rPC, highlighting the substantial environmental cost of using virgin polycarbonate over recycled polycarbonate in the same application. As production scales up 12 samples to 121 samples per batch, this difference remains pronounced; in Composite_121, the CF of vPC composites is around 18 times higher than that of rPC. 90% drop in CF can be observed with the increase of production rate of vPC composite from Composite_12 to SPB_10. When compared to traditional concrete, both Composite_121 (vPC) and SPB_10 (vPC) exhibit higher CF values, although scaled production helps narrow this gap. For Composite_121 (vPC), the CF is approximately 7.9 times that of ordinary concrete and about 5.2 times that of frost-resistant concrete, indicating that while CF reduction occurs with larger batch production, this composite still has a significantly higher CF than concrete. These results are summarized in
Figure 5.
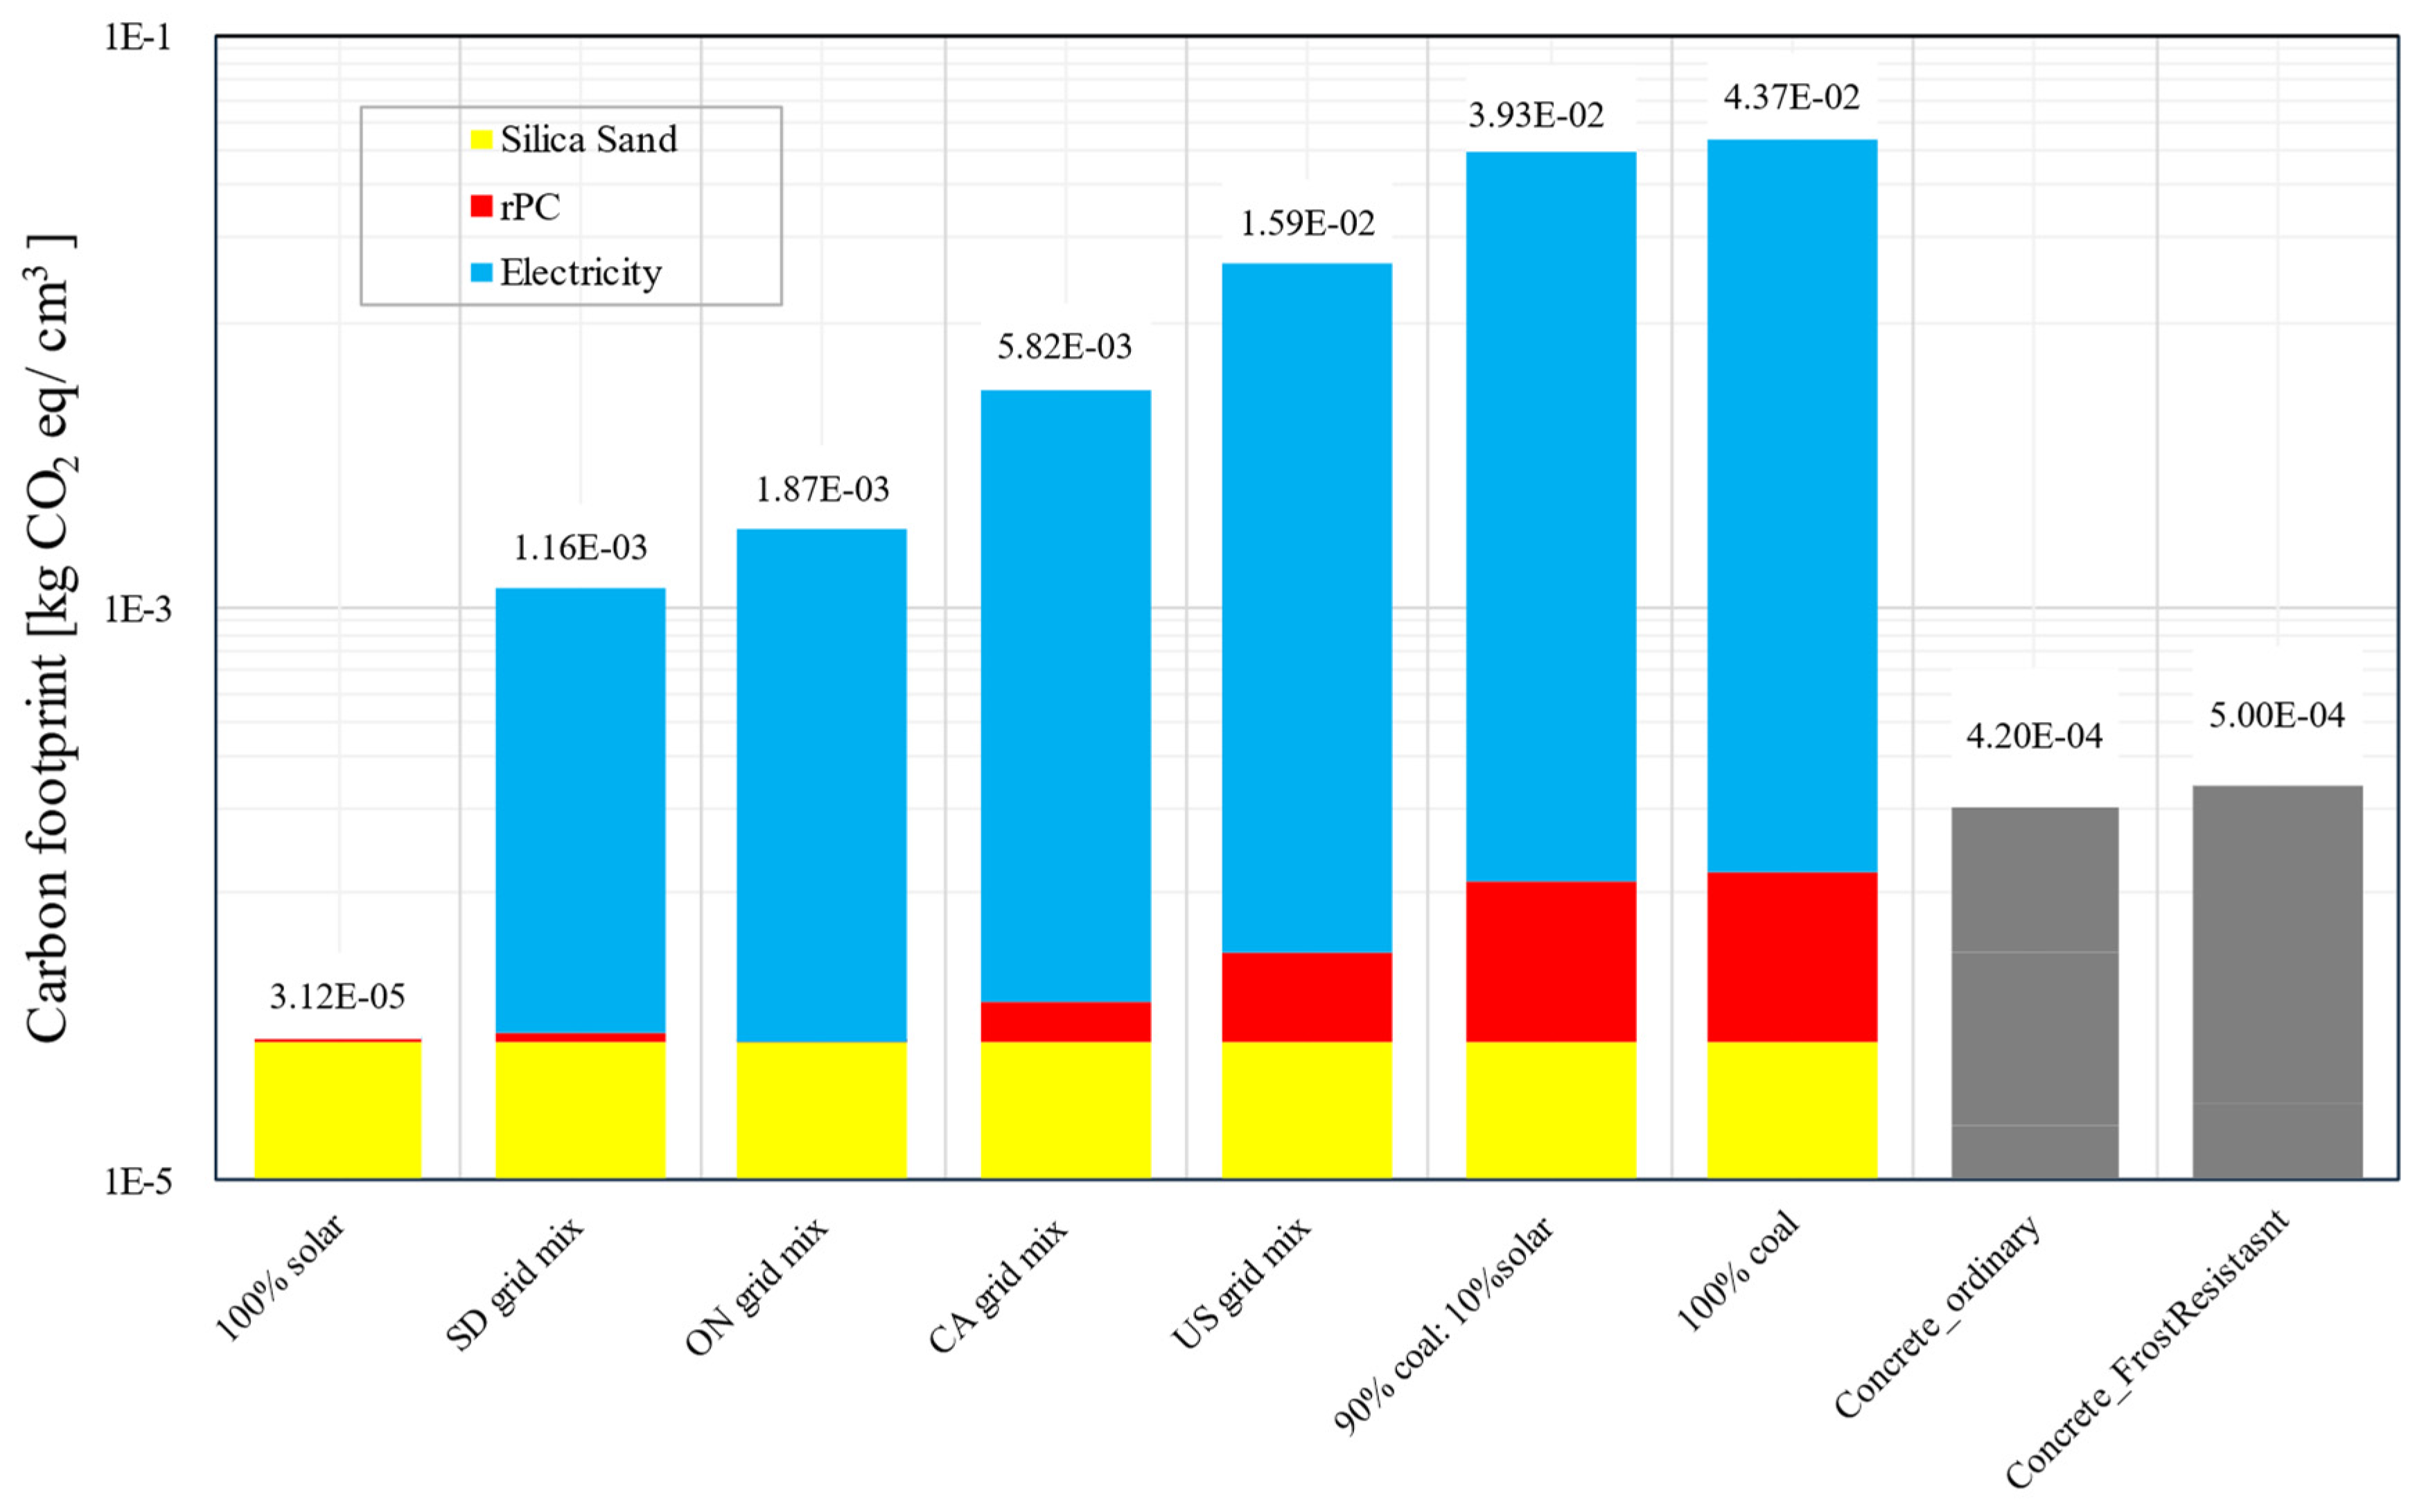
3.2.3. Case 3: Sensitivity Analysis of Sand-rPC Composite Carbon Footprint Based on Electricity Source- 100% Coal to 100% Solar Energy
These results, however, depend on energy mix as the production of rPC and production of sand-plastic composite (Composite_12) are highly energy intensive, with total electricity consumption accounting for over 95% of the cumulative carbon footprint. To observe the impact of the electricity mix.
Figure 6 shows a sensitivity of the extremes going from 100% sustainable solar photovoltaic based energy production to 100% coal-fired electricity. The transition from a coal-based energy source to solar energy results in an approximate 99.9% reduction in carbon emissions, emphasizing the substantial environmental benefits of renewable energy. When analyzing a mixed scenario of 90% coal and 10% solar, the carbon footprint exhibits a modest improvement, reflecting a 10% reduction compared to the 100% coal scenario. Expanding the analysis to regional electricity mixes, the United States [
75] exhibits a reduction of approximately 63% in carbon emissions compared to the 100% coal scenario. In Canada [
76], and particularly in Ontario, the carbon footprint decreases even further, with an impressive reduction of about 95.4% compared to coal.
Furthermore, transitioning from the U.S. energy mix to that of Canada results in a percentage decrease of approximately 64% in carbon emissions. The shift from the broader Canadian energy mix to Ontario’s specific energy profile leads to a decrease of around 67% in carbon emissions. This emphasizes the effectiveness of local energy strategies in Ontario, showcasing how provincial initiatives can further enhance sustainability outcomes. Transitioning from the Ontario energy mix to a scenario utilizing 100% solar electricity, however, results in an impressive reduction in carbon emissions, estimated at approximately 98%.
As can be seen in
Figure 6, it is clear that manufacturing sand-rPC composite in the United States does not provide large carbon footprint advantages because of the relatively high carbon-intensity of the grid. For manufacturing in the U.S. using 100% solar energy is preferred, which can be done because the costs of PV-generated electricity are now so much lower than grid electricity in some areas in the U.S. even grid defection is economically viable [
77].
Figure 6, however, also demonstrates that even without self-generation in specific states such as South Dakota (SD), where the share of renewable energy in electricity production is significantly higher, the carbon footprint of sand-plastic composite manufacturing can be notably reduced. In these states, the carbon footprint of sand-plastic composite production in SD is lowered by 92% compared to U.S. grid mix. This highlights the critical role that the regional electricity mix plays in determining the environmental viability of sand-plastic composite manufacturing.
The CF of vPC made sand-plastic composite is not significantly influenced by the electricity mix. The overall LCI for vPC production is based on data from the U.S. Life Cycle Inventory (USLCI) [
78] and is not large enough to overcome the influence of PC production. The analysis showed that rPC made composite emits approximately 91% to 100% less GHG compared to vPC made composite, depending on the energy source.
Furthermore, when compared to ordinary concrete and frost-resistant concrete, sand-plastic composite exhibits a 93% reduction in carbon footprint when 100% solar energy is used. For other cases CF of sand-plastic composite is 2 to 104 times higher than traditional concrete. In previous section, it has been discussed that production scalability can decrease the CF significantly. Another strategy to reduce CF in the future could be replacing silica sand with beach sand or even waste stamp sand [
79]. In that case, the emission will be only related to the transportation of beach sand or stamp sand.
Figure 6 shows that production of silica sand is responsible for 0% to 96% of total CF. For instance, the CF of sand-plastic composite (100%solar) is reduced to 1.57E-06 kg CO
2 eq. which is around 99.7% less than the CF of ordinary and frost-resistant concrete.
4. Discussion
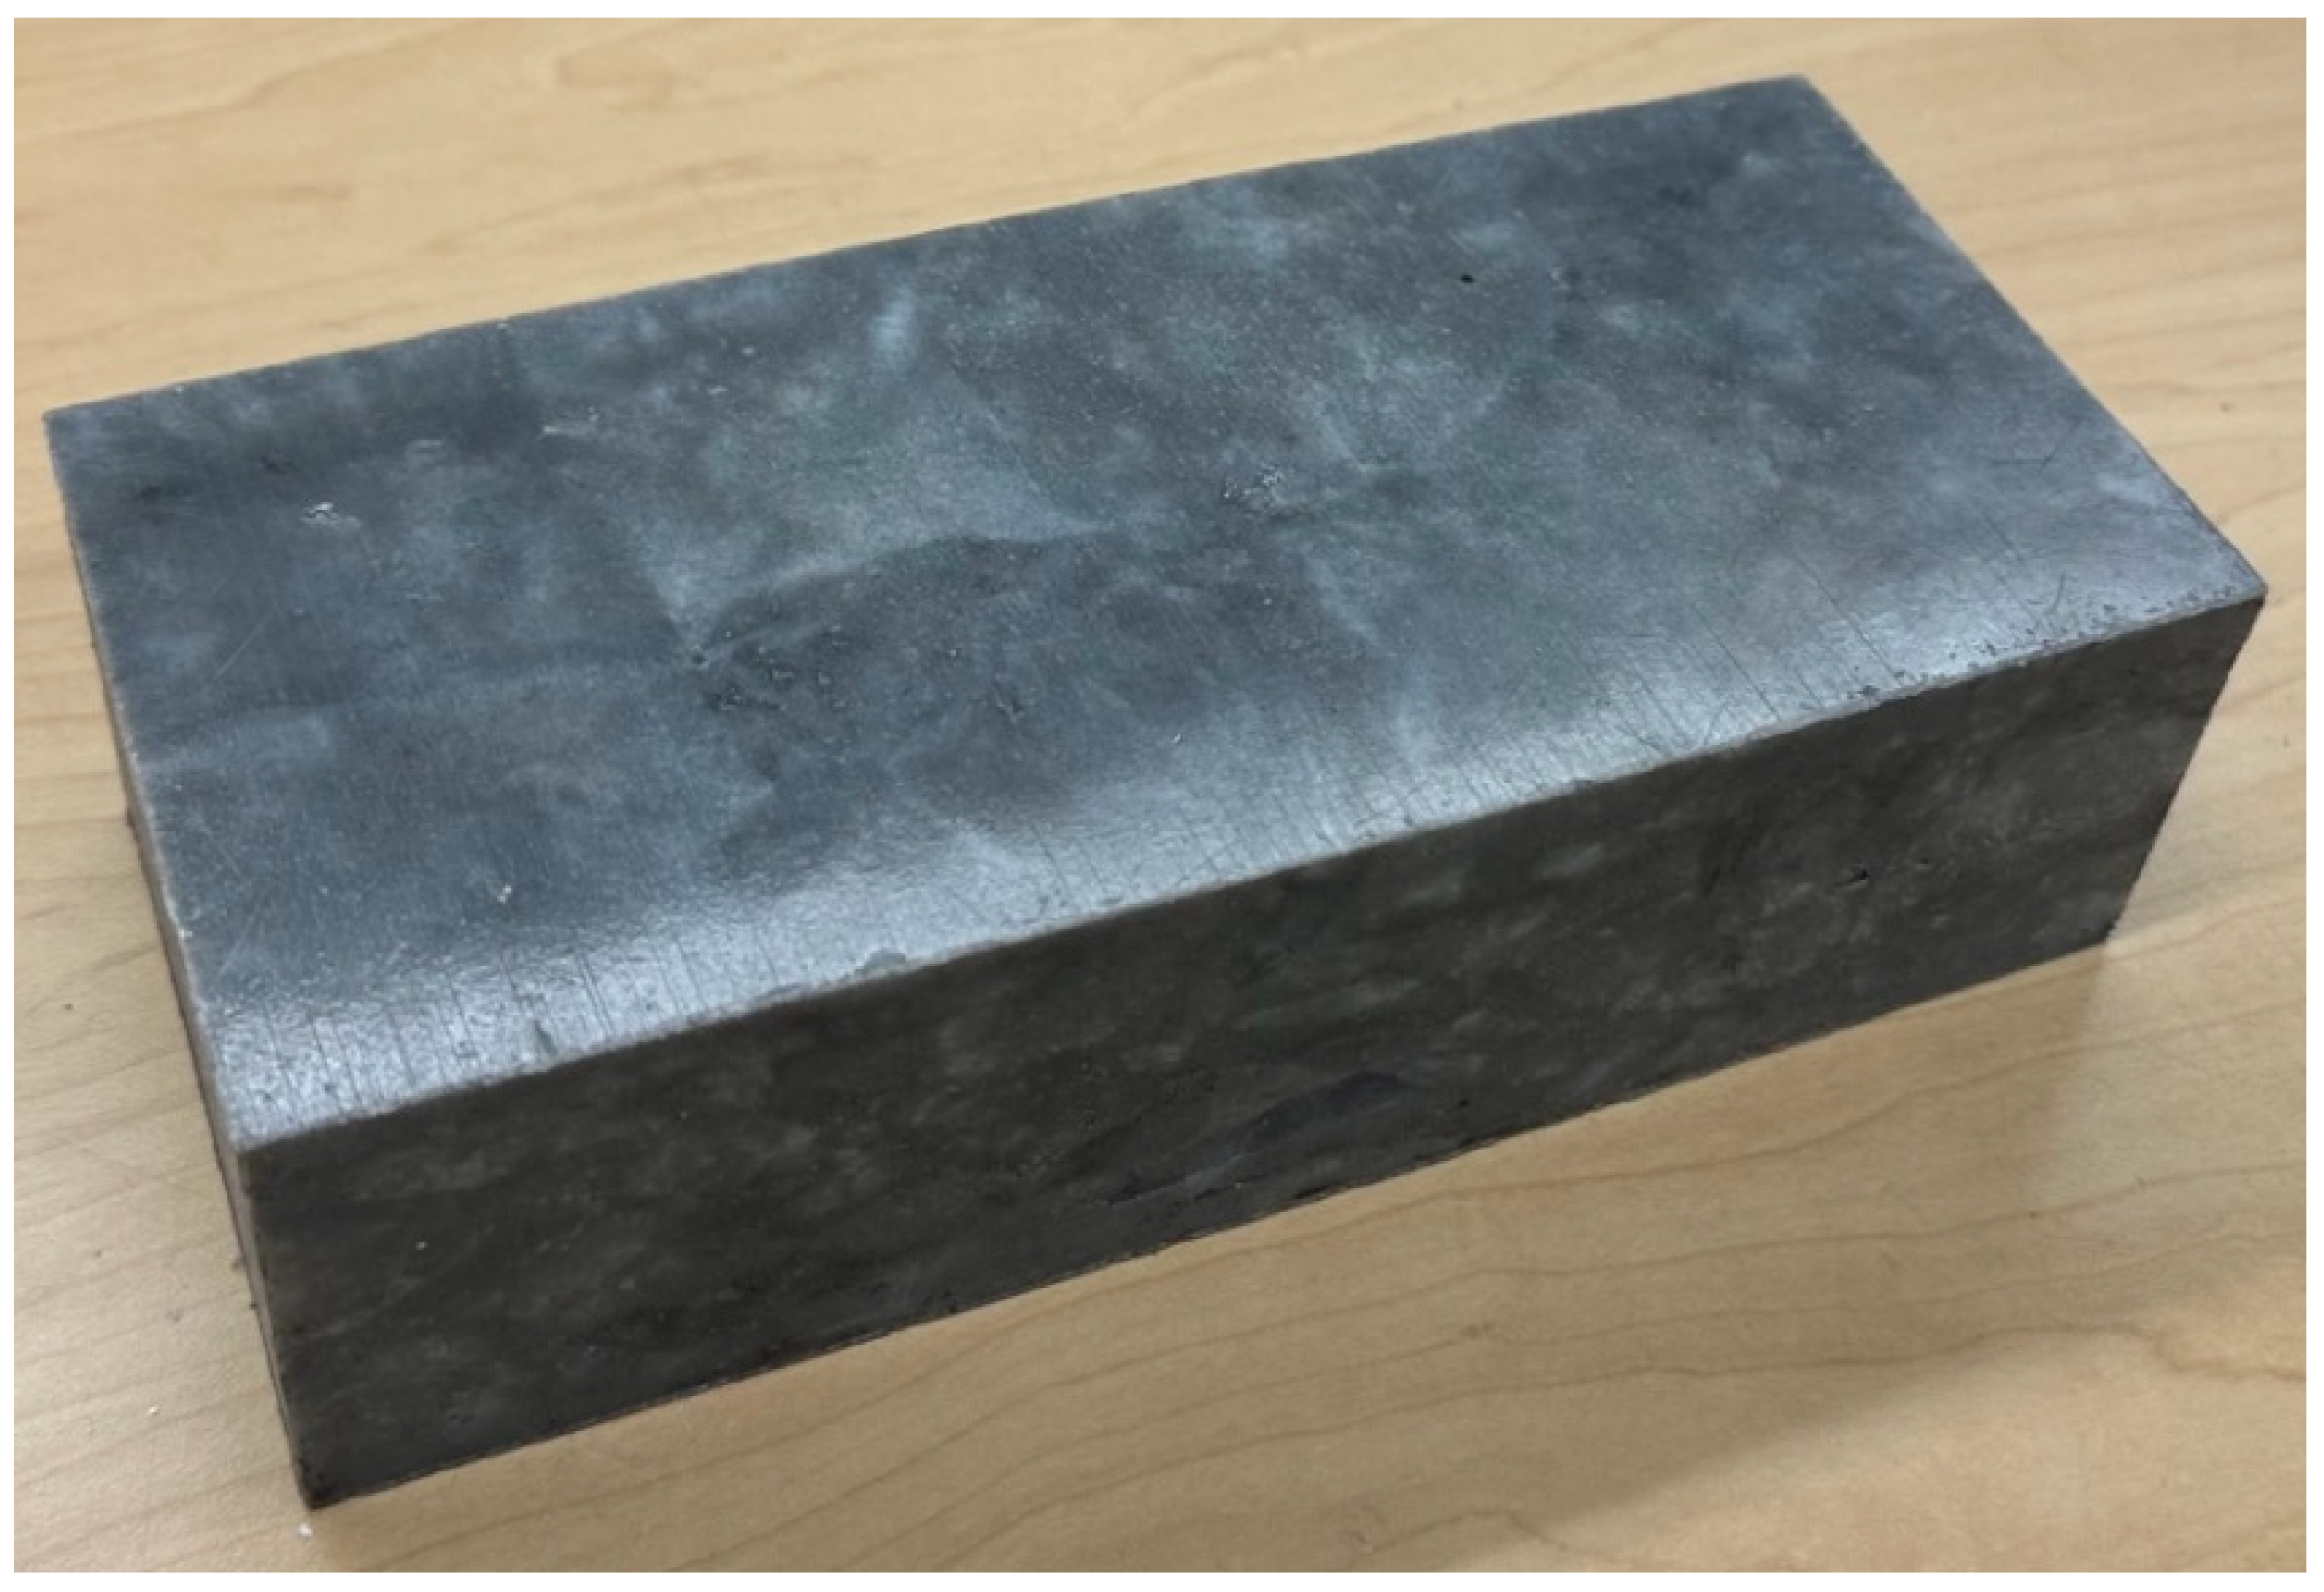
This study successfully demonstrated that the environmental properties of sand-rPC composites are more than adequate to replace concrete even with smaller production rates. To further emphasize this realistic potential, a standard dimensioned brick was produced using an alternative custom mold and the same routine as the ASTM D695 samples as shown for the top surface (
Figure 7). This larger product emphasizes the compatibility of this material with existing precast applications and encourages the substitution of sand-rPC composites in place of existing precast concrete products. As seen in
Figure 7, although aesthetically pleasing and similar in appearance to marble it is clear that the manufacturing process used does not currently completely uniform dispersal of sand within the waste plastic composite and thus is unlikely to have the optimal mechanical properties for the material. This inhomogeneity may still be tolerable, however as the compressive strength already tested on smaller samples far exceeds those of the concrete used in standard commercial structures. In future work, the mechanical properties of larger samples must be retested to ensure the compressive strength captured by the small samples and manufacturing method is scalable. As a result, using a test such as ASTM C109 to validate a scaled sample with visible inhomogeneity against a more applicable standard tailored for cement shall be conducted next.
In previous section, it has been observed that the CF of ASTM D695 sample is 8 times higher than the CF of standard size sand-rPC composite. Considering this, the LCIA exhibits that the CF per cubic centimetre of standard size sand-rPC composite is 47% to 94% less than ordinary and frost-resistant concrete. The CF of the composite is however around 10 times higher when the electricity consumption is coal or fossil-fuel based.
Each year, Canada produces over 3 million tonnes of plastic waste, with a mere 9% of this material being recycled. The majority ends up in landfills, waste-to-energy facilities, or is released into the environment [
80]. A similar situation exists in the United States, where recycling rates are equally low [
81]. The U.S. Department of Energy’s National Renewable Energy Laboratory revealed that the energy content of plastic waste sent to landfills could potentially meet 5% of the energy demands of the U.S. transportation sector, or 5.5% of those for the industrial sector [
82]. As of 2022, global production capacity for polycarbonate exceeded 7.1 million tonnes (Mt), with actual production reaching over 5 Mt; notably, North America represented 14% of this global demand [
83,
84].
If the total annual production of PC were recycled and mixed with sand to replace conventional concrete, it could yield approximately 1.1E13 cm³ of sand-rPC composite each year. In 2022 [
85], global concrete consumption approached 30 Gt per year [
86,
87,
88,
89,
90]. Given that the density of ordinary concrete is roughly 2.4 g/cm³, the volume of sand-plastic composite produced from recycled polycarbonate would displace approximately 26 Mt of concrete, which represents only about 0.1% of total concrete production.
Although, this is only a small fraction of the total concrete this replacement has significant implications for GHG emissions. By substituting ordinary concrete with sand-rPC composite, it is estimated that 4.5 Mt of CO₂
eq. could be saved. In comparison, if frost-resistant concrete were replaced, this figure could increase to approximately 5.4 Mt. To contextualize these savings, replacing 0.1% of global concrete production with sand-rPC composite could have environmental benefits equivalent to the carbon sequestration potential of approximately 204 to 245 million mature trees (or approximately 1 million to 2.5 million acres as a forest typically has 100 to 200 tress per acre [
91,
92,
93]. Mature trees absorb an average of 22 kilograms of CO
2 annually, making reforestation a common metric for comparing CO2 reduction [
94,
95,
96]. Additionally, These savings are also analogous to offsetting 4.5% to 5.4% of the global data center CO
2 emissions, which are known to be considerable in an increasingly digitalized world [
97]. According to the U.S. Energy Information Administration, the national annual average CO₂ output rate for electricity generation in the United States is around 0.417 kg CO₂
eq. per kWh [
98].
This study has several limitations that should be acknowledged. Future work must aim to refine the extrusion and compression molding process to guarantee the compositions are uniform, or uniform within an acceptable and repeatable compressive strength. These efforts would focus on obtaining a sand-rPC composite that could attempt to be a replacement for high strength concrete, which has a compressive strength ratings exceeding 70 – 80 MPa [
99].
One significant limitation is the lack of comprehensive data on PC recycling, which restricted the ability to conduct a thorough water footprint analysis. Additionally, the experimental data for sand-rPC composite production were compared against commercial-scale data for concrete production. While this comparison provides valuable insights, it does not fully capture the complexities associated with scalability, which have only been briefly addressed in this study. It should, however, be pointed out that this study represents conservative overestimates on the environmental impacts of 50:50 PC-sand composites and that industrial scale manufacturing would result in further energy and emissions savings.
It should also be pointed out that as manufacturers strive to achieve net-zero emissions, many are exploring using eco-friendly materials to replace traditional aggregates and cement in concrete production[
47,
51,
100,
101,
102,
103,
104,
105,
106,
107]. However, this study did not include a comparison between sand-rPC composite and these alternative concrete types. Future work could thus focus on conducting a comparative analysis between various types of eco-friendly concrete and sand-rPC composite to understand their environmental impacts better. Additionally, expanding the dataset on PC recycling would allow for more comprehensive assessments, including water footprint evaluations. Exploring these avenues could significantly contribute to understanding sustainable construction materials and their role in reducing overall environmental impact. Further, in the long term, sand-rPC composite can contribute to carbon sequestration compared to traditional concrete. While concrete emits significant CO
2 during production, only reabsorbing a small fraction through carbonation over time, sand-rPC composite embeds carbon-rich rPC directly into the material. rPC used in sand-rPC composite contain carbon that would otherwise be released into the atmosphere if incinerated or left to decompose in landfills. By incorporating these materials into sand-rPC composite, the carbon remains trapped within the brick for decades, effectively locking it away from the atmosphere.
5. Conclusions
Concrete production is responsible for a substantial portion of global CO2 eq. emissions and very little plastic is recycled. This study showed these twin problems could be solved by forming PC and sand into a building material composite to replace concrete.
The LCA results indicate that at small sample scales sand-rPC composite is 5 to 48 times more energy-intensive than ordinary and frost-resistant concrete, primarily due to its higher CED. The sensitivity analysis, however, reveals a substantial reduction in the CF of sand-rPC composite, with a 62% to 90% decrease as batch sizes increase. These sample sizes are small and do not represent construction sizes. Sand-rPC composite at construction brick scale, however, demonstrates significantly lower environmental impact, emitting 96% less CO₂ per cm³ than sand-vPC composite , 45% less than ordinary concrete, and 54% less than frost-resistant concrete. In contrast, sand-vPC composite emits 14 times more CO₂ than ordinary concrete and 1.5 time more than frost-resistant concrete, providing no environmental benefit over traditional materials.
Energy sourcing also has a significant influence on emissions. A transition from coal-based energy to solar energy reduces carbon emissions by 99.9%, while a mixed scenario of 90% coal and 10% solar results in a modest 10% reduction. The U.S. electricity mix decreases emissions by about 63%, with Canada’s mix achieving an 86.6% reduction. Further reductions are observed when transitioning from Canada’s energy mix to Ontario’s grid, with a 68% decrease in emissions. Utilizing 100% solar energy in Ontario reduces emissions by 98%.
Overall, sand-rPC composite achieves a 67%-98% lower carbon footprint compared to sand-vPC composite and a 3%-98% reduction compared to both types of concrete in different production rate. Recycling global polycarbonate production for use in sand-rPC composite could displace approximately 26 Mt of concrete annually, accounting for 0.1% of global concrete production. This substitution could result in CO₂ savings of 4.5 Mt to 5.4 Mt, equivalent to the carbon sequestration potential of 204 to 245 million trees, highlighting the potential environmental benefits of integrating recycled polycarbonate into construction materials.
Acknowledgments
This research was supported by the Thompson Endowment and Natural Sciences and Engineering Research Council of Canada.
References
- Hansen, J.; Kharecha, P.; Sato, M.; Masson-Delmotte, V.; Ackerman, F.; Beerling, D.J.; Hearty, P.J.; Hoegh-Guldberg, O.; Hsu, S.-L.; Parmesan, C. Assessing “Dangerous Climate Change”: Required Reduction of Carbon Emissions to Protect Young People, Future Generations and Nature. PLOS ONE 2013, 8, 81648. [Google Scholar] [CrossRef] [PubMed]
- Pachauri, R.K.; Allen, M.R.; Barros, V.R.; Broome, J.; Cramer, W.; Christ, R.; Church, J.A.; Clarke, L.; Dahe, Q.; Dasgupta, P.; et al. Synthesis Report. Contrib. Work. Groups II III Fifth Assess. Rep. Intergov. Panel Clim. Change 2014, 151. [Google Scholar]
- Tangney, P. Understanding Climate Change as Risk: A Review of IPCC Guidance for Decision-Making. J. Risk Res. 2020, 23, 1424–1439. [Google Scholar] [CrossRef]
- Stern, N. The Economics of Climate Change: The Stern Review; Cambridge University Press, 2007; ISBN 978-0-521-70080-1.
- The next Generation of Scenarios for Climate Change Research and Assessment. Nature 2010, 463, 747–756. [CrossRef] [PubMed]
- Parncutt, R. The Human Cost of Anthropogenic Global Warming: Semi-Quantitative Prediction and the 1,000-Tonne Rule. Front. Psychol. 2019, 10. [Google Scholar] [CrossRef] [PubMed]
- Pearce, J.M.; Parncutt, R. Quantifying Global Greenhouse Gas Emissions in Human Deaths to Guide Energy Policy. Energies 2023, 16, 6074. [Google Scholar] [CrossRef]
- Allan, R.P.; Arias, P.A.; Berger, S.; Canadell, J.G.; Cassou, C.; Chen, D.; Cherchi, A.; Connors, S.L.; Coppola, E.; Cruz, F.A. Intergovernmental Panel on Climate Change (IPCC). Summary for Policymakers. In Climate change 2021: The physical science basis. Contribution of working group I to the sixth assessment report of the intergovernmental panel on climate change; Cambridge University Press, 2023; pp. 3–32.
- IPCC Global Warming of 1.5°C: IPCC Special Report on Impacts of Global Warming of 1.5°C above Pre-Industrial Levels in Context of Strengthening Response to Climate Change, Sustainable Development, and Efforts to Eradicate Poverty; 1st ed.; Cambridge University Press, 2022; ISBN 978-1-00-915794-0.
- IPCC The Evidence Is Clear: The Time for Action Is Now. We Can Halve Emissions by 2030. — IPCC 2022.
- IPCC AR6 Synthesis Report: Climate Change 2023 — IPCC; 2023.
- IPCC Urgent Climate Action Can Secure a Liveable Future for All — IPCC. Available online: https://www.ipcc.ch/2023/03/20/press-release-ar6-synthesis-report/ (accessed on 21 October 2024).
- Babor, D.; Plian, D.; Judele, L. Environmental Impact of Concrete. Bul. Institutului Politeh. Din Lasi Sect. Constr. Arhit. 2009, 55, 27. [Google Scholar]
- Ellis, L.D.; Badel, A.F.; Chiang, M.L.; Park, R.J.-Y.; Chiang, Y.-M. Toward Electrochemical Synthesis of Cement—An Electrolyzer-Based Process for Decarbonating CaCO3 While Producing Useful Gas Streams. Proc. Natl. Acad. Sci. 2020, 117, 12584–12591. [Google Scholar] [CrossRef] [PubMed]
- Cement Industry Accounts for about 8% of CO2 Emissions. One Startup Seeks to Change That. Available online: https://www.cbsnews.com/news/cement-industry-co2-emissions-climate-change-brimstone/ (accessed on 11 May 2023).
- Monteiro, P.J.M.; Miller, S.A.; Horvath, A. Towards Sustainable Concrete. Nat. Mater. 2017, 16, 698–699. [Google Scholar] [CrossRef] [PubMed]
- Tiseo, I. Global Carbon Dioxide Emissions from Cement Manufacturing 1990-2021, by Country. Available online: https://www.statista.com/statistics/1091672/carbon-dioxide-emissions-global-cement-manufacturing/ (accessed on 10 May 2023).
- Watts, J. Concrete: The Most Destructive Material on Earth. The Guardian 2019.
- Tiseo, I. Global CO₂ Emissions from Cement Manufacturing 1960-2021. Available online: https://www.statista.com/statistics/1299532/carbon-dioxide-emissions-worldwide-cement-manufacturing/ (accessed on 8 May 2023).
- Miller, S.A.; Horvath, A.; Monteiro, P.J.M. Impacts of Booming Concrete Production on Water Resources Worldwide. Nat. Sustain. 2018, 1, 69–76. [Google Scholar] [CrossRef]
- OECD Global Plastics Outlook Database Plastic Pollution Is Growing Relentlessly as Waste Management and Recycling Fall Short, Says OECD. Available online: https://www.oecd.org/environment/plastic-pollution-is-growing-relentlessly-as-waste-management-and-recycling-fall-short.htm (accessed on 8 May 2023).
-
Plastics and the Environment; Andrady, A.L., Ed.; 1st ed.; Wiley, 2003; ISBN 978-0-471-09520-0.
- Lim, X. Microplastics Are Everywhere — but Are They Harmful? Nature 2021, 593, 22–25. [Google Scholar] [CrossRef]
- Gu, L.; Ozbakkaloglu, T. Use of Recycled Plastics in Concrete: A Critical Review. Waste Manag. 2016, 51, 19–42. [Google Scholar] [CrossRef] [PubMed]
- Al-Sinan, M.A.; Bubshait, A.A. Using Plastic Sand as a Construction Material toward a Circular Economy: A Review. Sustainability 2022, 14, 6446. [Google Scholar] [CrossRef]
- Suriyaa, M.; Hareharan, P.; Nageshwaran, J.; Nandhini, S.; Sathyamoorthy, R. Experimental Study on Strength Behaviour of Plastic Sand Bricks. 2020, 9.
- Sahani, K.; Joshi, B.; Khatri, K.; Thapa Magar, A.; Chapagain, S.; Karmacharya, N. Mechanical Properties of Plastic Sand Brick Containing Plastic Waste. Adv. Civ. Eng. 2022, 2022, 1–10. [Google Scholar] [CrossRef]
- Bamigboye, G.; Ngene, B.; Ademola, D.; Jolayemi, K. Experimental Study on the Use of Waste Polyethylene Terephthalate (PET) and River Sand in Roof Tile Production. J. Phys. Conf. Ser. 2019, 1378, 042105. [Google Scholar] [CrossRef]
- Yu, Q.L.; Spiesz, P.; Brouwers, H.J.H. Development of Cement-Based Lightweight Composites–Part 1: Mix Design Methodology and Hardened Properties. Cem. Concr. Compos. 2013, 44, 17–29. [Google Scholar] [CrossRef]
- Susila, I.M.; Suardana, N.P.G.; Kencanawati, C.I.P.K.; Thanaya, I.N.A.; Adnyana, I.W.B. THE EFFECT OF COMPOSITION OF PLASTIC WASTE LOW DENSITY POLYETHYLENE (LDPE) WITH SAND TO PRESSURE STRENGTH AND DENSITY OF SAND/LDPE COMPOSITES. IOP Conf. Ser. Mater. Sci. Eng. 2019, 539, 012043. [Google Scholar] [CrossRef]
- Woods, M.C.; Kulkarni, A.; Pearce, J.M. The Potential of Replacing Concrete with Sand and Recycled Polycarbonate Composites: Compressive Strength Testing. J. Compos. Sci. 2023, 7, 249. [Google Scholar] [CrossRef]
- Baechler, C.; DeVuono, M.; Pearce, J.M. Distributed Recycling of Waste Polymer into RepRap Feedstock. Rapid Prototyp. J. 2013, 19, 118–125. [Google Scholar] [CrossRef]
- Woern, A.L.; McCaslin, J.R.; Pringle, A.M.; Pearce, J.M. RepRapable Recyclebot: Open Source 3-D Printable Extruder for Converting Plastic to 3-D Printing Filament. HardwareX 2018, 4, e00026. [Google Scholar] [CrossRef]
- Woods, M.C.; Brooks, C.K.; Pearce, J.M. Open-Source Cold and Hot Scientific Sheet Press for Investigating Polymer-Based Material Properties. HardwareX 2024, 19, e00566. [Google Scholar] [CrossRef]
- Roy, R.; Pearce, J.M. Is Small or Big Solar Better for the Environment? Comparative Life Cycle Assessment of Solar Photovoltaic Rooftop vs. Ground-Mounted Systems. Int. J. Life Cycle Assess. 2024, 29, 516–536. [Google Scholar] [CrossRef]
- Hayibo, K.S.; Mayville, P.; Pearce, J.M. The Greenest Solar Power? Life Cycle Assessment of Foam-Based Flexible Floatovoltaics. Sustain. Energy Fuels 2022, 6, 1398–1413. [Google Scholar] [CrossRef]
- Frankl, P.; Masini, A.; Gamberale, M.; Toccaceli, D. Simplified Life-cycle Analysis of PV Systems in Buildings: Present Situation and Future Trends. Prog. Photovolt. Res. Appl. 1998, 6, 137–146. [Google Scholar] [CrossRef]
- Simonen, K. Life Cycle Assessment; Routledge, 2014.
- Curran, M.A. Life Cycle Assessment. Kirk-Othmer Encycl. Chem. Technol. 2000, 1–28.
- ISO ISO 14044: 2006. Environmental Management—Life Cycle Assessment—Requirements and Guidelines. International Organization for Standardization. 2006.
- Finkbeiner, M.; Inaba, A.; Tan, R.; Christiansen, K.; Klüppel, H.-J. The New International Standards for Life Cycle Assessment: ISO 14040 and ISO 14044. Int. J. Life Cycle Assess. 2006, 11, 80–85. [Google Scholar] [CrossRef]
- Karvinen, H. Life Cycle Assessment and Technical Performance of Recycled and Bio-Based Plastics. 2015.
- Kim, S.Y.; Kang, D.H.; Charoensri, K.; Ryu, J.R.; Shin, Y.J.; Park, H.J. Comparative Life Cycle Assessment of Reusable and Disposable Distribution Packaging for Fresh Food. Sustainability 2023, 15, 16448. [Google Scholar] [CrossRef]
- openLCA Download | openLCA.Org 2022.
- Arzoumanidis, I.; D’Eusanio, M.; Raggi, A.; Petti, L. Functional Unit Definition Criteria in Life Cycle Assessment and Social Life Cycle Assessment: A Discussion. In Perspectives on Social LCA; Traverso, M., Petti, L., Zamagni, A., Eds.; SpringerBriefs in Environmental Science; Springer International Publishing: Cham, 2020; pp. 1–10. ISBN 978-3-030-06564-5. [Google Scholar]
- Sjunnesson, J. Life Cycle Assessment of Concrete. 2005.
- De Schepper, M.; Van den Heede, P.; Van Driessche, I.; De Belie, N. Life Cycle Assessment of Completely Recyclable Concrete. Materials 2014, 7, 6010–6027. [Google Scholar] [CrossRef] [PubMed]
- Hottle, T.; Hawkins, T.R.; Chiquelin, C.; Lange, B.; Young, B.; Sun, P.; Elgowainy, A.; Wang, M. Environmental Life-Cycle Assessment of Concrete Produced in the United States. J. Clean. Prod. 2022, 363, 131834. [Google Scholar] [CrossRef]
- Maia de Souza, D.; Lafontaine, M.; Charron-Doucet, F.; Chappert, B.; Kicak, K.; Duarte, F.; Lima, L. Comparative Life Cycle Assessment of Ceramic Brick, Concrete Brick and Cast-in-Place Reinforced Concrete Exterior Walls. J. Clean. Prod. 2016, 137, 70–82. [Google Scholar] [CrossRef]
- Sjunnesson, J. Life Cycle Assessment of Concrete. 2005.
- Anh, L.H.; Mihai, F.-C.; Belousova, A.; Kucera, R.; Oswald, K.-D.; Riedel, W.; Sekar, N.A.; Schneider, P. Life Cycle Assessment of River Sand and Aggregates Alternatives in Concrete. Materials 2023, 16, 2064. [Google Scholar] [CrossRef]
- Zhou, X.; Zhai, Y.; Ren, K.; Cheng, Z.; Shen, X.; Zhang, T.; Bai, Y.; Jia, Y.; Hong, J. Life Cycle Assessment of Polycarbonate Production: Proposed Optimization toward Sustainability. Resour. Conserv. Recycl. 2023, 189, 106765. [Google Scholar] [CrossRef]
- Preparation of Environmental Friendly Plastic Brick from High-Density Polyethylene Waste. Case Stud. Chem. Environ. Eng. 2023, 7, 100291. [CrossRef]
- Tinz, J.; de Ancos, T.; Rohn, H. Carbon Footprint of Mechanical Recycling of Post-Industrial Plastic Waste: Study of ABS, PA66GF30, PC and POM Regrinds. Waste 2023, 1, 127–139. [Google Scholar] [CrossRef]
- Santos, J.; Pizzol, M.; Azarijafari, H. 14 - Life Cycle Assessment (LCA) of Using Recycled Plastic Waste in Road Pavements: Theoretical Modeling. In Plastic Waste for Sustainable Asphalt Roads; Giustozzi, F., Nizamuddin, S., Eds.; Woodhead Publishing Series in Civil and Structural Engineering; Woodhead Publishing, 2022; pp. 273–302 ISBN 978-0-323-85789-5.
- Earn Tan, A.H.; Ze Chew, A.W.; Wing-Keung Law, A. Deployment of Recyclable Polycarbonate as Alternative Coarse Media in Dual-Media Rapid Filters. Energy Procedia 2017, 143, 475–480. [Google Scholar] [CrossRef]
- US EPA Environmental Factoids | WasteWise | US EPA. Available online: https://archive.epa.gov/epawaste/conserve/smm/wastewise/web/html/factoid.html (accessed on 2 November 2024).
- Kousemaker, T.M.; Jonker, G.H.; Vakis, A.I. LCA Practices of Plastics and Their Recycling: A Critical Review. Appl. Sci. 2021, 11, 3305. [Google Scholar] [CrossRef]
- Heo, Y.; Bae, D.; Oh, C.; Suh, Y.; Lee, K. Life Cycle Assessment of Mobile Phone Charger Containing Recycled Plastics. J. Korean Soc. Environ. Eng. 2017, 39, 698–705. [Google Scholar] [CrossRef]
- Puig, R.; Fullana-i-Palmer, P.; Baquero, G.; Riba, J.-R.; Bala, A. A Cumulative Energy Demand Indicator (CED), Life Cycle Based, for Industrial Waste Management Decision Making. Waste Manag. 2013, 33, 2789–2797. [Google Scholar] [CrossRef]
- Röhrlich, M.; Mistry, M.; Martens, P.N.; Buntenbach, S.; Ruhrberg, M.; Dienhart, M.; Briem, S.; Quinkertz, R.; Alkan, Z.; Kugeler, K. A Method to Calculate the Cumulative Energy Demand (CED) of Lignite Extraction. Int. J. Life Cycle Assess. 2000, 5, 369–373. [Google Scholar] [CrossRef]
- Patel, M. Cumulative Energy Demand (CED) and Cumulative CO2 Emissions for Products of the Organic Chemical Industry. Energy 2003, 28, 721–740. [Google Scholar] [CrossRef]
- Huijbregts, M.A.J.; Hellweg, S.; Frischknecht, R.; Hendriks, H.W.M.; Hungerbühler, K.; Hendriks, A.J. Cumulative Energy Demand As Predictor for the Environmental Burden of Commodity Production. Environ. Sci. Technol. 2010, 44, 2189–2196. [Google Scholar] [CrossRef] [PubMed]
- Frischknecht, R.; Wyss, F.; Büsser Knöpfel, S.; Lützkendorf, T.; Balouktsi, M. Cumulative Energy Demand in LCA: The Energy Harvested Approach. Int. J. Life Cycle Assess. 2015, 20, 957–969. [Google Scholar] [CrossRef]
- Gołasa, P.; Wysokiński, M.; Bieńkowska-Gołasa, W.; Gradziuk, P.; Golonko, M.; Gradziuk, B.; Siedlecka, A.; Gromada, A. Sources of Greenhouse Gas Emissions in Agriculture, with Particular Emphasis on Emissions from Energy Used. Energies 2021, 14, 3784. [Google Scholar] [CrossRef]
- Nuss, P. Life Cycle Assessment Handbook: A Guide for Environmentally Sustainable Products, Edited by MaryAnn Curran. Hoboken, NJ, USA: John Wiley & Sons, Inc., and Salem, MA, USA: Scrivener Publishing LLC, 2012, 611 Pp., ISBN 9781118099728, $199.00 (Paper), $159.99 (E-book). J. Ind. Ecol. 2015, 19, 167–168. [Google Scholar] [CrossRef]
- Verones, F.; Hellweg, S.; Antón, A.; Azevedo, L.B.; Chaudhary, A.; Cosme, N.; Cucurachi, S.; De Baan, L.; Dong, Y.; Fantke, P.; et al. LC-IMPACT: A Regionalized Life Cycle Damage Assessment Method. J. Ind. Ecol. 2020, 24, 1201–1219. [Google Scholar] [CrossRef]
- Füssel, H.-M. An Updated Assessment of the Risks from Climate Change Based on Research Published since the IPCC Fourth Assessment Report. Clim. Change 2009, 97, 469–482. [Google Scholar] [CrossRef]
- Hulme, M.; Mahony, M. Climate Change: What Do We Know about the IPCC? Prog. Phys. Geogr. Earth Environ. 2010, 34, 705–718. [Google Scholar] [CrossRef]
- Mohd Nordin, A.H.; Sulaiman, S.I.; Shaari, S.; Mustapa, R.F. Effect of Photovoltaic (PV) Module Degradation Rate on the Greenhouse Gas Emissions: A Life-Cycle Assessment / Atiqah Hamizah Mohd Nordin …[et Al.]. J. Electr. Electron. Syst. Res. JEESR 2021, 18, 58–62. [Google Scholar] [CrossRef]
- Change, C. Intergovernmental Panel on Climate Change (IPCC). CC BY 1995, 4. [Google Scholar]
- Solomon, S.; Qin, D.; Manning, M.; Chen, Z.; Marquis, M.; Averyt, K.; Tignor, M.; Miller, H. IPCC Fourth Assessment Report (AR4). Clim. Change 2007, 374. [Google Scholar]
- O’neill, B.C.; Oppenheimer, M.; Warren, R.; Hallegatte, S.; Kopp, R.E.; Pörtner, H.O.; Scholes, R.; Birkmann, J.; Foden, W.; Licker, R. IPCC Reasons for Concern Regarding Climate Change Risks. Nat. Clim. Change 2017, 7, 28–37. [Google Scholar] [CrossRef]
- Change, C. The IPCC Scientific Assessment. Contrib. Work. Group First Assess. Rep. Intergov. Panel Clim. Change 1990, 365. [Google Scholar]
- EIA Electric Power Annual -, U.S. Energy Information Administration (EIA). Available online: https://www.eia.gov/electricity/annual/index.php (accessed on 19 October 2024).
- Government of Canada, C.E.R. CER – Provincial and Territorial Energy Profiles – Canada. Available online: https://www.cer-rec.gc.ca/en/data-analysis/energy-markets/provincial-territorial-energy-profiles/provincial-territorial-energy-profiles-canada.html (accessed on 19 October 2024).
- Ali Sadat, S.; Pearce, J.M. The Threat of Economic Grid Defection in the U.S. with Solar Photovoltaic, Battery and Generator Hybrid Systems. Sol. Energy 2024, 282, 112910. [Google Scholar] [CrossRef]
- NREL, U.S. Life Cycle Inventory Database. Available online: https://www.nrel.gov/analysis/lci.html (accessed on 29 April 2024).
- Meyer, T.K.; Tanikella, N.G.; Reich, M.J.; Pearce, J.M. Potential of Distributed Recycling from Hybrid Manufacturing of 3-D Printing and Injection Molding of Stamp Sand and Acrylonitrile Styrene Acrylate Waste Composite. Sustain. Mater. Technol. 2020, 25, e00169. [Google Scholar] [CrossRef]
- Canada, E. and C.C. Plastic Waste and Pollution Reduction. Available online: https://www.canada.ca/en/environment-climate-change/services/managing-reducing-waste/reduce-plastic-waste.html (accessed on 19 October 2024).
- US EPA, O. Plastics: Material-Specific Data. Available online: https://www.epa.gov/facts-and-figures-about-materials-waste-and-recycling/plastics-material-specific-data (accessed on 19 October 2024).
- NREL News Release: NREL Calculates Lost Value of Landfilled Plastic in U.S. Available online: https://www.nrel.gov/news/press/2022/nrel-calculates-lost-value-of-landfilled-plastic-in-us.html (accessed on 19 October 2024).
- Prismane Consulting Polycarbonate Market Analysis by Production, Capacity, Demand & Forecast Report Until 2036; 2022.
- Statista Polycarbonates Global Demand 2022. Available online: https://www.statista.com/statistics/750965/polycarbonates-demand-worldwide/ (accessed on 19 October 2024).
- Flower, D.J.; Sanjayan, J.G. Green House Gas Emissions Due to Concrete Manufacture. Int. J. Life Cycle Assess. 2007, 12, 282–288. [Google Scholar] [CrossRef]
- IEA Technology Roadmap - Low-Carbon Transition in the Cement Industry – Analysis; 2018.
- Global Cement and Concrete Association GCCA Concrete Future – Roadmap to Net Zero 2021.
- Petek Gursel, A.; Masanet, E.; Horvath, A.; Stadel, A. Life-Cycle Inventory Analysis of Concrete Production: A Critical Review. Cem. Concr. Compos. 2014, 51, 38–48. [Google Scholar] [CrossRef]
- IEA. Global Cement Production, 2010-2019 – Charts – Data & Statistics; IEA: Paris, 2020. [Google Scholar]
- Hottle, T.; Hawkins, T.R.; Chiquelin, C.; Lange, B.; Young, B.; Sun, P.; Elgowainy, A.; Wang, M. Environmental Life-Cycle Assessment of Concrete Produced in the United States. J. Clean. Prod. 2022, 363, 131834. [Google Scholar] [CrossRef]
- Ritchie, H.; Roser, M. Forest Area. Our World Data 2024. [Google Scholar]
- Soll, J. Can Planting a Trillion Trees Save Our Planet? Available online: https://www.oregonmetro.gov/news/power-trees (accessed on 24 October 2024).
- Crowther, T.W.; Glick, H.B.; Covey, K.R.; Bettigole, C.; Maynard, D.S.; Thomas, S.M.; Smith, J.R.; Hintler, G.; Duguid, M.C.; Amatulli, G.; et al. Mapping Tree Density at a Global Scale. Nature 2015, 525, 201–205. [Google Scholar] [CrossRef]
- Sedjo, R.A.; Solomon, A.M. Climate and Forests. In Greenhouse Warming; Routledge, 2016; pp. 105–118.
- Akbari, H. Shade Trees Reduce Building Energy Use and CO2 Emissions from Power Plants. Environ. Pollut. 2002, 116, S119–S126. [Google Scholar] [CrossRef] [PubMed]
- Kaul, M.; Mohren, G.M.J.; Dadhwal, V.K. Carbon Storage and Sequestration Potential of Selected Tree Species in India. Mitig. Adapt. Strateg. Glob. Change 2010, 15, 489–510. [Google Scholar] [CrossRef]
- IEA Data Centres & Networks. Available online: https://www.iea.org/energy-system/buildings/data-centres-and-data-transmission-networks (accessed on 23 October 2024).
- EIA Annual Energy Outlook 2023 - U.S. Energy Information Administration (EIA); U.S., 2023.
- Leung, C.K.Y. Concrete as a Building Material. In Encyclopedia of Materials: Science and Technology; Buschow, K.H.J., Cahn, R.W., Flemings, M.C., Ilschner, B., Kramer, E.J., Mahajan, S., Veyssière, P., Eds.; Elsevier: Oxford, 2001; pp. 1471–1479. ISBN 978-0-08-043152-9. [Google Scholar]
- Zabalza Bribián, I.; Valero Capilla, A.; Aranda Usón, A. Life Cycle Assessment of Building Materials: Comparative Analysis of Energy and Environmental Impacts and Evaluation of the Eco-Efficiency Improvement Potential. Build. Environ. 2011, 46, 1133–1140. [Google Scholar] [CrossRef]
- Martínez-Rocamora, A.; Solís-Guzmán, J.; Marrero, M. LCA Databases Focused on Construction Materials: A Review. Renew. Sustain. Energy Rev. 2016, 58, 565–573. [Google Scholar] [CrossRef]
- Stelzer, L.; Hoberg, F.; Bach, V.; Schmidt, B.; Pfeiffer, S.; Meyer, V.; Finkbeiner, M. Life Cycle Assessment of Fungal-Based Composite Bricks. Sustainability 2021, 13, 11573. [Google Scholar] [CrossRef]
- Asman, N.S.A.; Bolong, N.; Mirasa, A.K.; Asrah, H. Life Cycle Assessment of Interlocking Compressed Earth Brick and Conventional Fired Clay Brick for Residential House. J. Phys. Conf. Ser. 2020, 1529, 042012. [Google Scholar] [CrossRef]
- Zhang, C.; Hu, M.; van der Meide, M.; Di Maio, F.; Yang, X.; Gao, X.; Li, K.; Zhao, H.; Li, C. Life Cycle Assessment of Material Footprint in Recycling: A Case of Concrete Recycling. Waste Manag. 2023, 155, 311–319. [Google Scholar] [CrossRef] [PubMed]
- Vieira, D.R.; Calmon, J.L.; Coelho, F.Z. Life Cycle Assessment (LCA) Applied to the Manufacturing of Common and Ecological Concrete: A Review. Constr. Build. Mater. 2016, 124, 656–666. [Google Scholar] [CrossRef]
- Saberian, M.; Zhang, J.; Gajanayake, A.; Li, J.; Zhang, G.; Boroujeni, M. Life Cycle Assessment (LCA) of Concrete Containing Waste Materials. In Handbook of Sustainable Concrete and Industrial Waste Management; Elsevier, 2022; pp. 637–659 ISBN 978-0-12-821730-6.
- Xing, W.; Tam, V.W.; Le, K.N.; Hao, J.L.; Wang, J. Life Cycle Assessment of Recycled Aggregate Concrete on Its Environmental Impacts: A Critical Review. Constr. Build. Mater. 2022, 317, 125950. [Google Scholar] [CrossRef]
|
Disclaimer/Publisher’s Note: The statements, opinions and data contained in all publications are solely those of the individual author(s) and contributor(s) and not of MDPI and/or the editor(s). MDPI and/or the editor(s) disclaim responsibility for any injury to people or property resulting from any ideas, methods, instructions or products referred to in the content. |
© 2024 by the authors. Licensee MDPI, Basel, Switzerland. This article is an open access article distributed under the terms and conditions of the Creative Commons Attribution (CC BY) license (http://creativecommons.org/licenses/by/4.0/).