Submitted:
27 December 2024
Posted:
30 December 2024
You are already at the latest version
Abstract
Cosmic ray muon tomography is a promising method for the non-invasive inspection of shipping containers and trucks. It leverages the highly penetrating cosmic muons and their interactions with various materials to generate three-dimensional images of large and dense objects, such as inter-modal shipping containers, which are typically opaque to conventional X-ray radiography techniques. One of the key tasks of customs and border security is verifying shipping container declarations to prevent illegal trafficking, and muon tomography offers a viable solution for this purpose. Common imaging methods using muons rely on data analysis of either muon scattering or absorption-transmission. We have designed a compact muon tomography system with dimensions of 3 × 3 × 3 m3, consisting of 2-D position-sensitive detectors. These detectors include plastic scintillators, wavelength-shifting (WLS) fibers, and SiPMs. Through light transport modeling with GEANT4, we demonstrated that the proposed detector design—featuring 1 m × 1 m scintillator plates with 2 mm2 square-shaped WLS fibers—can achieve a spatial resolution of approximately 0.7-1.0 mm. Through Monte Carlo simulations, we show that a combined analysis of muon scattering and absorption data enables prompt identification of cargo materials. In a smuggling scenario where tobacco is declared as paper towel rolls, the combined analysis accurately distinguishes between tobacco and paper towel rolls with 3 σ confidence at 1 mm spatial resolution, within a short scanning time of 40 seconds for the entire 20-foot shipping container.
Keywords:
Geant4 simulation
; Muon tomography system
; Customs and Border Protection
; Plastic scintillator
; Wavelength-shifting fiber
1. Introduction
Muon tomography is an innovative and versatile imaging technique with the potential to revolutionize fields ranging from security to scientific research [1,2,3,4,5,6]. Its unique properties, such as non-invasiveness, deep penetration, and material sensitivity—make it a valuable asset for solving complex challenges in border security. Muon tomography utilizes naturally occurring cosmic-ray muons to non-invasively probe the internal structures of large objects, like shipping containers or trucks. Its unique capabilities, such as high penetration power and sensitivity to material density and composition, make it a promising tool in border security applications.
High-energy muons are constantly generated in the Earth’s atmosphere from cosmic rays. These particles have significant penetration capabilities, allowing them to pass through dense materials that conventional imaging techniques cannot. As muons pass through matter, they interact with atoms through processes such as bremsstrahlung, pair production, photo-nuclear interactions, and multiple Coulomb scattering. Muon tomography uses a scattering angle that is proportional to the atomic number (Z) of the material. By placing detectors around a target object, the trajectories of muons entering and exiting the object are tracked. The scattering and absorption patterns of the muons are analyzed to reconstruct a 3D density map of the object’s interior, identifying different materials or hidden inside cargo illegal objects.
Due to its penetrating properties, muon tomography has been proposed as a tool for border security applications to scan cargo containers and vehicles for hidden contraband or illicit materials [7,8,9,10,11,12,13,14,15,16,17]. The European project, "Cosmic beam Tomograph for Identification of Hazardous and Illegal Goods Hidden in Trucks and Sea Containers" (SilentBorder) [18], focuses on the development and in situ testing of a high-tech scanner designed for border guards, customs, and law enforcement authorities to inspect shipping containers at border control points. To improve the accuracy of inspection of the contents of shipping containers and trucks, an approach has been developed combining muon scattering and absorption [19]. Using a tobacco smuggling example in which cigarettes are disguised as rolled paper towels, it was demonstrated that a muon tomography system (MTS) that completely covers a 20-foot shipping container (8 m × 4 m × 3 m in size) can distinguish cigarettes from rolled paper towels in about 10 seconds.
The purpose of this study is to develop a muon tracking detector with high detection efficiency and high positional resolution for border security applications. We proposed a position-sensitive detector comprising a large-area plastic scintillator read out using wavelength-shifting (WLS) fibers. The detector’s positional resolution was evaluated through simulations of light transport using the GEANT4 toolkit. Furthermore, we assessed the material discrimination capability of a small-scale MTS (3 × 3 × 3 m3) incorporating novel scintillator-WLS fiber-based muon detectors. The compact MTS developed is considered a cost-effective solution for a cargo scanning portal. This system enables shipping containers to move continuously through the MTS while maintaining high throughput in container verification.
2. The Simulation of Muon Detector
The muon detector is composed of a plastic scintillator slab of size 100 × 100 × 1 cm4. Two arrays of 485 squire-shaped WLS fibers (2 × 2 × 1000 mm3 ) attached to either side of the plastic scintillator slab. WLS fiber arrays are orthogonal to each other and represent the light distribution in the and directions. The light photons produced by muon particles inside the plastic scintillator are absorbed by the WLS fibers, and the re-emitted green light are guided by total internal reflection to the two silicon photomultipliers (SiPMs) that are connected to both ends of each WLS fiber as shown in Figure 1(b). The WLSF are optically coupled to scintillator using an optical adhesive. The fibers are approximately 0.062 mm apart from each other. The outer detector layer, which covers the WLS fibers on the top and bottom, is made of an Enhanced Specular Reflector (ESR) film to reflect photons back into the fibers. WLS fibers are readout at both ends using SiPMs. To prevent reflections from the lateral faces of the crystals, they are painted black.
The simulation of optical photons is based on the Monte Carlo code GEANT4. This is a toolkit developed by CERN for simulation of particle transfer. In the GEANT4 simulation of the plastic scintillator-WLS detector, all relevant physical processes have been included to ensure accurate modeling of photon interactions within the detector. The following electromagnetic processes, such as ionization, bremsstrahlung, multiple Compton scattering, pair production, Compton scattering, and the photoelectric effect, are considered. Optical processes include scintillation, Cherenkov radiation, volume absorption, Rayleigh scattering, and boundary processes like reflection, refraction, and absorption. The Birk’s effect, which adjusts the scintillation light yield to account for variations in the energy deposition density by ionizing particles, is accounted for. For optical photon transport, the GLISUR model [20,21] in the GEANT4 package was used. This model simulates the interactions of optical photons at the interfaces between different materials by applying the concept of optical surfaces to describe light reflection and transmission at the boundaries between media, accounting for scattering, absorption, and reflection. In the detector GEANT4 model, we define the surface roughness for all interfaces. When the polish parameter is set to zero, it represents maximum roughness, where photons are reflected according to a Lambertian distribution. Conversely, a polish value of one applies Snell’s Law. For each surface, the appropriate optical boundary processes and reflectivity were specified. In the simulation refractive index of the plastic scintillator set to 1.58, and the light yield to 10,000 photons/MeV, the light attenuation length set to 240 cm [22]. The WLS fiber used in simulations was the square shape double clad BCF-91A [23] which has an absorption peak at 420 nm and an emission peak at 494 nm. The plastic scintillator light emission peak is at 420-430 nm and is a good match to the BCF-91A maximum absorption wavelength range (410-460 nm). The absorption spectrum of the fiber matches the emission spectrum of the BC-408 scintillator providing maximal light conversion for transmission to WLS fibers. The WLS fibers are bonded to the SiPM using silicone optical grease to enhance the light transmission efficiency of the SiPM, whose entrance window is made of epoxy resin with a refractive index of 1.5. The polystyrene core refractive index of BCF-91A WLS fibers is 1.6, while that of the first cladding layer (acrylic) has a refractive index of 1.49 and the second cladding layer (fluor-acrylic) has an index of refraction of 1.42. To attach the fibers to the scintillator plate, an optical adhesive with a refractive index of n = 1.32 is used. SiPM was modeled as a Si material and the SiPM window size was 2×2 mm2 and was made of epoxy resin with a refractive index of n = 1.52. To improve light detection SiPM’s coupled to WLSF with optical coupling material with a refractive index of 1.465. The light detection efficiency was determined by weighting the SiPM PDE with the BCF-91A WLS fiber emission spectra, which gives a value of ≈40%. The developed simulation model and optical properties of the materials were verified based on experimental data on the light response of a plastic scintillator and WLS fibers, as described in [24].
3. Simulation Results
We simulate a muon of 3 GeV energy passing through the plastic scintillator detector. The energy deposited in scintillator is converted into fluorescence and finally to light photons. The generated optical photons pass directly through the plastic scintillator plate to the black-painted side surfaces of the detector and are absorbed there. Some others are tracked to the WLS fibers, where they are absorbed and re-emitted at longer wavelengths, allowing them to be tracked toward the SiPM. The transport of light photons simulated using GEANT4 is shown in Figure 1(b). The number of optical photons detected by each SiPM is recorded event-by-event in ROOT TTree format and analyzed using a C++ code. The simulated data represent the distribution of the number of photons detected by the SiPMs connected to both the upper (-axis) and lower (y-axis) WLS fibers. In this work () the interaction positions of muons are reconstructed using an algorithm developed in-house. The distribution of detected photons is analyzed using the peak search function of the CERN ROOT [26] package.
For each simulated event, the distributions of detected photons in the and WLS fibers were analyzed using a peak search function from the ROOT package. The resulting distribution is approximated by a Gaussian function, which is considered as the point of muon impact on the scintillator. The positions of and are determined by analyzing the distribution of light photons between the WLS fibers and using ROOT tools approximated by a Gaussian function.
The mean value of the Gaussian function corresponds to the - and -coordinates of the 3 GeV muon beam interaction position. The spatial resolution, defined as the full width at half maximum (FWHM) of the linear profile, reaches approximately 0.7-0.8 mm (FWHM) at the detector center (Figure 3) and closer to detector edge position resolution is 0.6-0.7 mm (FWHM) (Figure 4). The uniformity of the 1 × 1 m2 plastic scintillator plate response to a cosmic ray muons was studied modeling 3 GeV muon beam hitting detector surface in different locations with 5 cm grid.
As shown in Figure 5 of reconstructed XY–coordinates for muon hits are uniformly distributed along detector surface and reconstructed hit positions correspond to actual positions of muon beam. As shown in Figure 6 (a) and (b) position resolution is slightly better closer to the edge of scintillator plate.
4. Cargo Discrimination Capability Study
One of the key tasks of customs and border security is to verify shipping container declarations to prevent illegal trafficking. This can be achieved by comparing the measured data to a customs database or simulated data for scenarios corresponding to the declared contents.
We designed the MTS (see Figure 7) consisting of a matrix of horizontal position-sensitive detectors 1 m × 1 m consisting plastic scintillator with WLSF readout.
The interior dimensions of shipping container are 5.898 m long × 2.35 2 m wide × 2.393 m high, usable capacity is 32.6 m3 and maximum load is 25 tons. A 20-foot container’s unloaded weight is 2,300 kg. In simulations we consider container is fully loaded with cargo which size is 590 cm × 220 cm × 220 cm.
4.1. Muon Scattering Tomography
The scattering muon tomography technique calculates the deflection of muons from their straight trajectory due to multiple coulomb interactions, which in turn depend on cargo density and chemical composition. The absorption muon tomography technique calculates the fraction of muons that were stopped in cargo. The absorption depends on cargo density and chemical composition. Due to the different sizes and loading configurations of the cargo, object detection techniques can be applied to localize and identify the dimensions of the cargo in the reconstructed image of the container.
Cosmic ray muon undergoes multiple coulomb scattering while passing through material. The angular distribution of scattered muon of momentum p is approximately Gaussian, with zero mean and standard deviation given by:
where is the ratio between velocity of muon V to velocity of light c, X0 is the radiation length of the material, L is the length of the material traversed. X0 is a material property and depends on the density of the material , the atomic mass A and the atomic number Z and can be expressed as[27]:
For material discrimination purposes in muon tomography we define the scattering density (), derived from Rossi formula [28]:
where is a nominal muon momentum and is with units in milliradians2/cm. The approximation c ≅ 1 for muons is used in this equation. The scattering density of a material represents the mean square scattering angle of muons passing through a unit depth of that material. For generating tomographic image scattering angles are accumulated at different locations generating a 3D map of scattering densities.
4.2. Muon Absorption Method
While passing through cargo, muons lose energy and have a probability of stopping and decaying. The attenuation length depends on the density of the material traversed. In the absorption tomography approach, the tracks of muons stopped in the cargo can be reconstructed using the algorithm described in publication [19]. This algorithm focuses on muons that are detected by the upper detectors but not by the lower detectors, due to absorption within the imaging volume. According to the detector geometry, four detectors are used: two upper muon tracking detectors and two lower muon tracking detectors. Scattered muons are identified using hits in both the upper and lower muon tracking detectors. Some muons do not produce hits on the lower detectors because they are either absorbed within the imaging volume or scattered out of the imaging volume. This involves determining which voxels the muon ray intersects. The algorithm counts the number of times each voxel is traversed by these muon rays. The reconstructed muon tracks allow for the calculation of the path length of each muon through each voxel j within the container. The stopping power of each voxel represents the energy loss of muons per unit distance as they travel through that voxel. The total absorption along each muon track is the sum of the stopping powers of all the voxels the muon traverses. The number of stopped muons is calculated based on the path lengths and the stopping powers of the intersected voxels: .
The distribution of absorbed muon rays across the voxels enables the reconstruction of a 3D map of the material’s density and composition within the container. Voxels with higher absorption rates correspond to areas with denser materials. Higher-density materials stop more muons, leading to a higher count of absorbed muon rays in those voxels.
4.3. Simulation in a Real Scenario
Contraband materials can be hidden among the legal materials or smuggled material can be declared as legal goods. Such a smuggling scenario is often realized in case of contraband of cigarettes. We simulated this scenario by placing boxes with rolled towel paper or cigarettes on the floor of shipping container thus filling almost all it’s free volume. We simulated datasets for container fully loaded with 5 million cigarettes and container fully loaded with paper towel rolls.
The Cosmic-Ray Shower Library (CRY) [29] interfaced with GEANT4 was used to generate 200000 muons for the latitude 50∘ at sea-level, producing one dataset, which correspond 20 seconds scanning time. The origin points of generated muons were sampled from a horizontal plane surface of 10 m × 10 m. GEANT4 simulates the interaction of muons with the detector, a 20-foot shipping container, and the payload. Simulated data samples were generated by producing 5,000 datasets for both paper towel rolls and cigarettes.
The simulated data on hit positions in each detector layer are used to generate two tracks. Cosmic ray muon scattering tomography is achieved by tracking the trajectories of both incoming and outgoing muons using a set of position-sensitive detectors. We calculate scattering angle between the trajectories of incoming () and outgoing () muons using formula [30]:
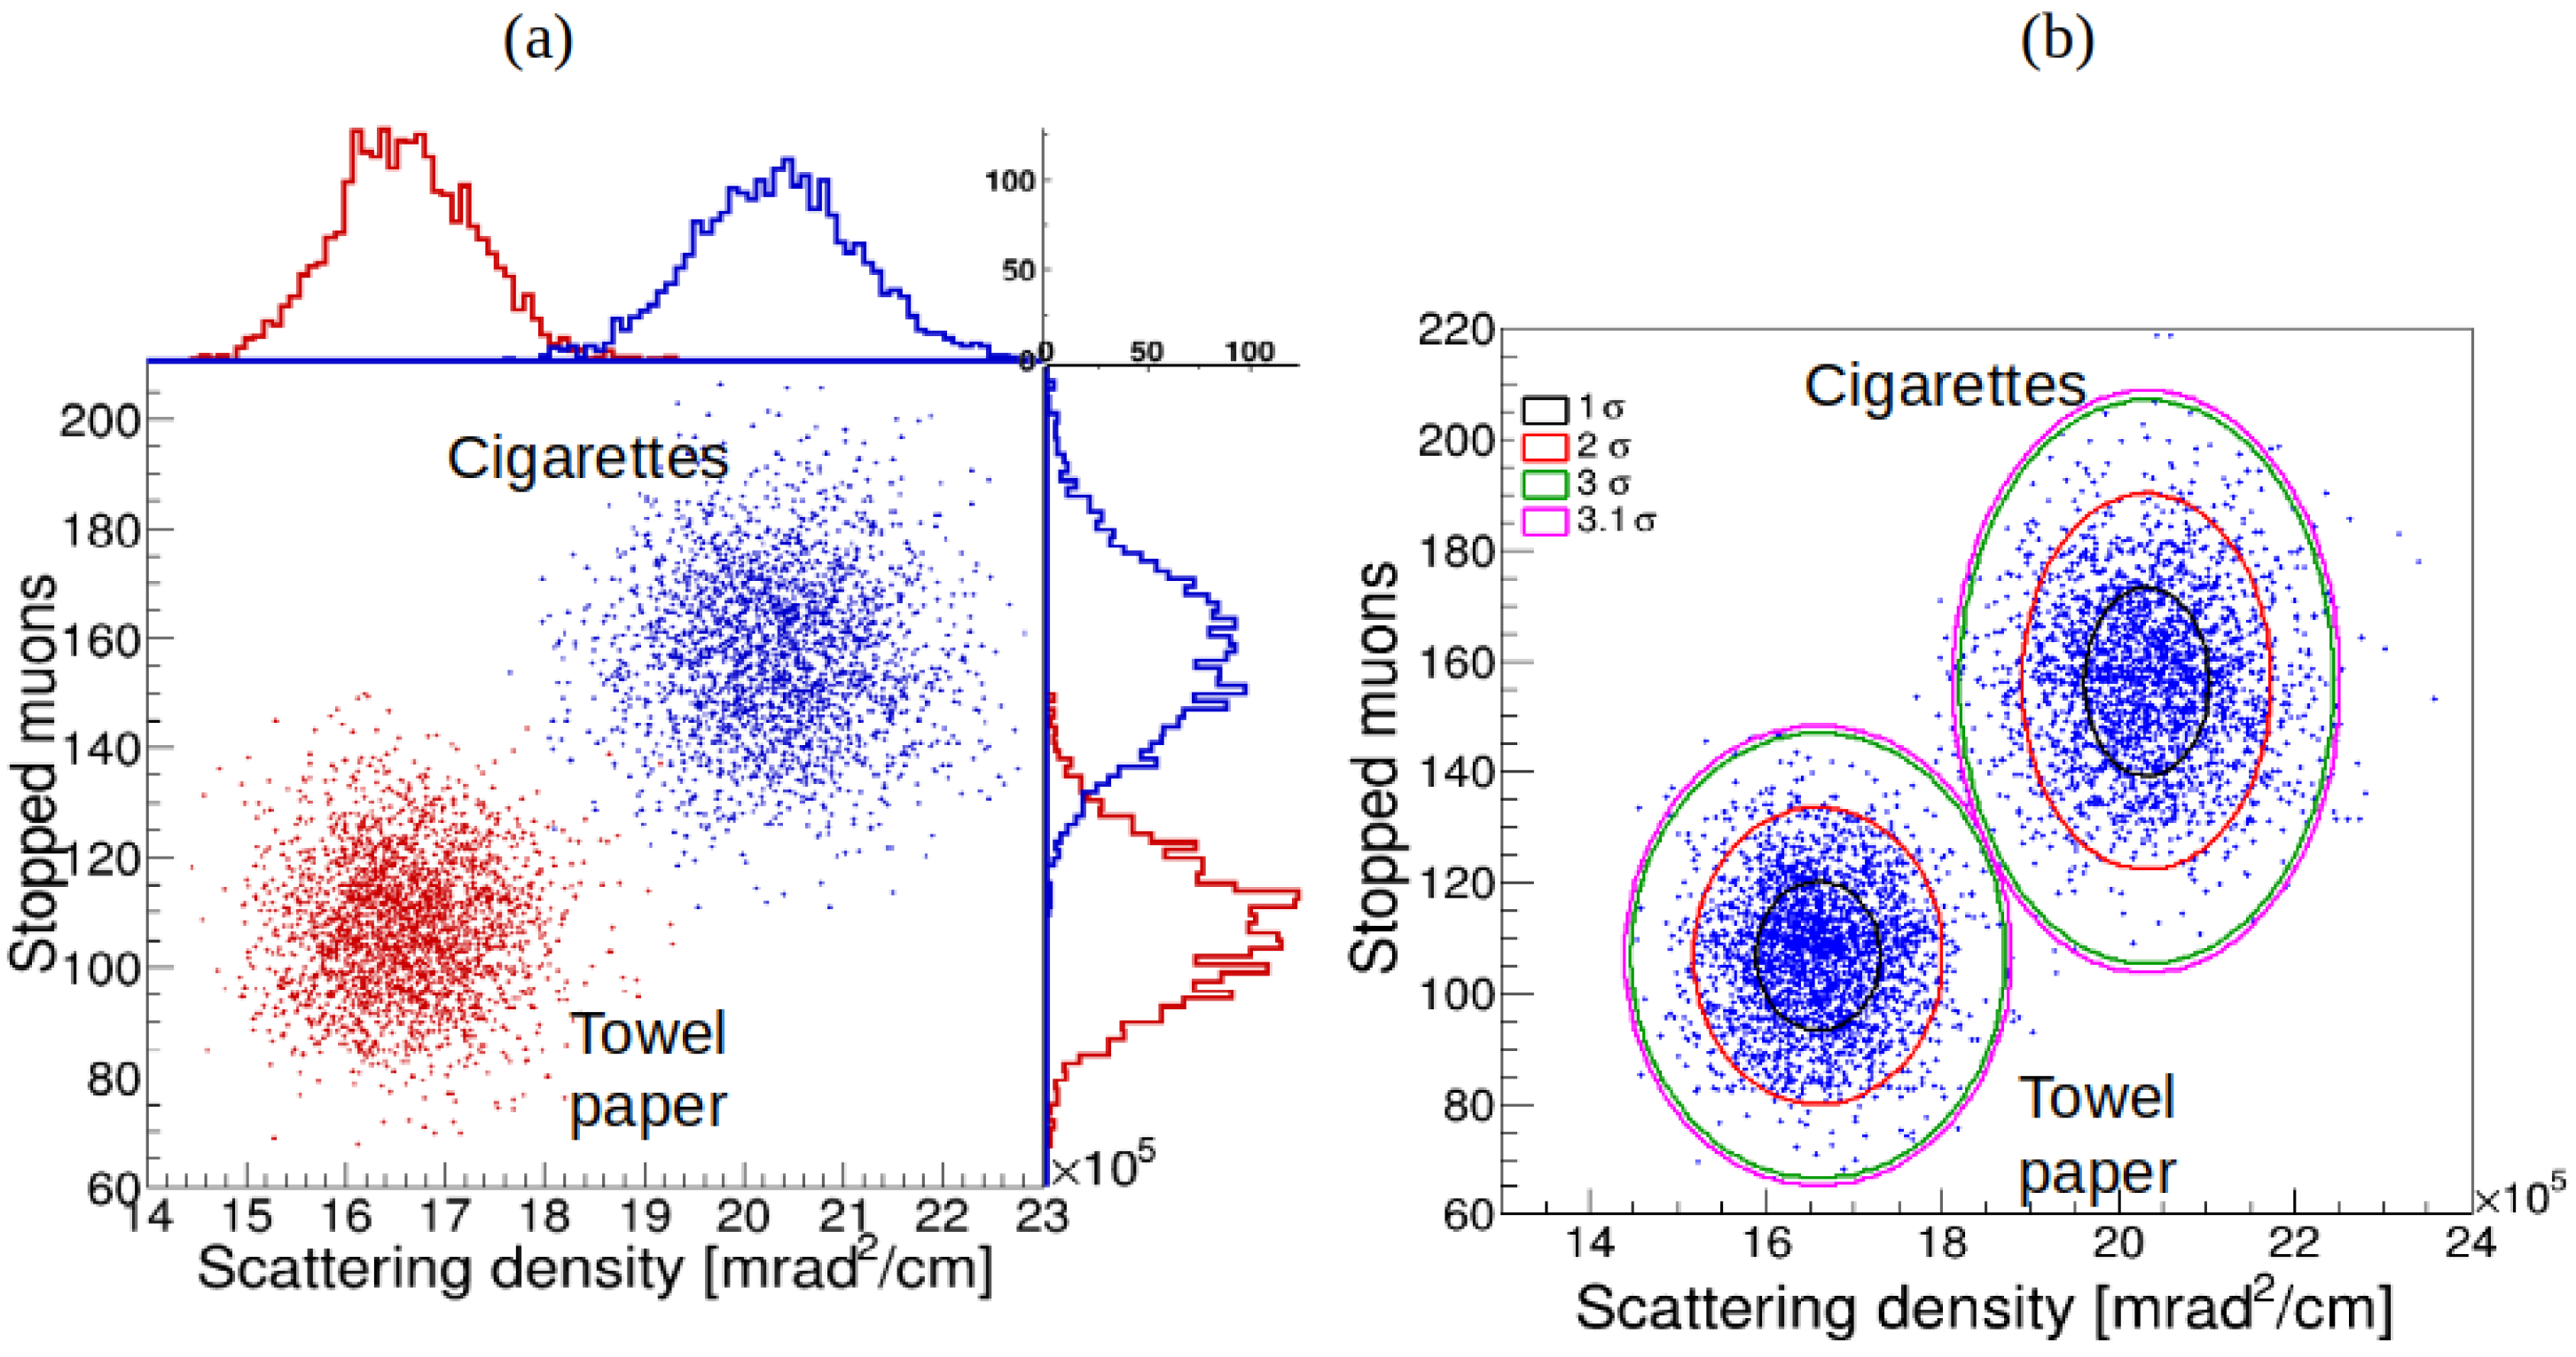
The Point-of-Closest-Approach (PoCA) algorithm [31] is used to reconstruct position of muon interaction with cargo and container. The PoCA algorithm calculates the closest point between the incoming and outgoing muon tracks, which is considered the muon interaction position. The angle between these tracks is regarded as the scattering angle. Figure 8(a), (b), and (c) illustrate the reconstructed 3D tomographic image of the cargo (a), created using PoCA points, along with the 2D and 1D profiles (b) and (c) used to calculate the cargo dimensions. In Figure 9(a) the scatter plots of scattering density versus stopped muons distribution are shown for paper towel rolls and tobacco for detector position resolution of 1 mm. On top of each 2D histogram in Figure 9(a), we also display the 1D histograms of scattering data, with the histogram of stopped muons distribution shown on the right side. The 1D analysis is limited due to partial overlap between the distributions for paper towel rolls and tobacco, whereas the 2D analysis offers more distinct material discrimination.
For the quantitative analysis of discrimination accuracy, we applied the two components 2D Gaussian Mixture Model (GMM) algorithm, which categorizes data into groups based on their probability distributions (see Figure 9(b)). The confidence ellipses for each distribution are set to show 1, 2, and 3 confidence levels (CL). The scattering density distribution versus stopped muons distribution for rolled paper towels and tobacco are accurately distinguished with a 3 CL at a position resolution of 1 mm (FWHM).
5. Conclusion
The detailed geometry of the muon detector, including the layout of the plastic scintillator plates, wavelength-shifting fibers, and SiPMs, is modeled using the GEANT4 toolkit. Simulation results indicate that the proposed detector design, featuring 1 m × 1 m scintillator plate readout with 2 mm2 square-shaped WLS fibers, can achieve a spatial resolution of approximately 0.7-1.0 mm. Taking into account the obtained spatial resolution, the geometric parameters of the muon tomography system were proposed and modeled to optimize performance and accuracy. The CRY package in combination with GEANT4 is used to generate cosmic muons and model their transportation and interaction with the transport container and cargo. The combined analysis of muon absorption and scattering data significantly enhances material discrimination compared to using scattering data alone, thereby reducing measurement time. This improvement is crucial for maintaining high throughput in container inspections. In a smuggling scenario where tobacco is declared as paper towel rolls, it is shown that combined muon scattering and absorption analysis can accurately differentiate between tobacco and paper towel rolls with 3 sigma discrimination for a 1 mm spatial resolution (FWHM) in a short scan time of 20 seconds using a small-sized (3 m × 3 m × 3 m) MTS that covers half of the container. The entire 6 m long shipping container can then be scanned in 40 seconds.
Funding
This work was supported by the EU Horizon 2020 Research and Innovation Programme under grant agreement no. 101021812 ("SilentBorder"
References
- Bonechi, L.; D’Alessandro, R.; Giammanco, A. Atmospheric muons as an imaging tool. Reviews in Physics 2020, 5, 100038. [Google Scholar] [CrossRef]
- Barnes, S.; et al. Cosmic-Ray Tomography for Border Security. Instruments 2023, 7, 13. [Google Scholar] [CrossRef]
- Borozdin, K.N.; et al. Radiographic imaging with cosmic-ray muons. Nature 2003, 422, 277–277. [Google Scholar] [CrossRef] [PubMed]
- Cuéllar, L.; et al. Soft cosmic ray tomography for detection of explosives. In Proceedings of the 2009 IEEE Nuclear Science Symposium Conference Record (NSS/MIC); 2009; pp. 968–970. [Google Scholar] [CrossRef]
- Yifan, Z.; Zhi, Z.; Ming, Z.; Xuewu, W.; Ziran, Z. Discrimination of drugs and explosives in cargo inspections by applying machine learning in muon tomography. High Power Laser and Particle Beams 2018, 30, 086002–1. [Google Scholar] [CrossRef]
- Chen, J.; et al. Towards a muon scattering tomography system for both low-Z and high-Z materials. Journal of Instrumentation 2023, 18, P08008. [Google Scholar] [CrossRef]
- Schultz, L.J. Cosmic ray muon radiography; Portland State University, 2003.
- Åström, E.; Bonomi, G.; Calliari, I.; Calvini, P.; Checchia, P.; Donzella, A.; Faraci, E.; Forsberg, F.; Gonella, F.; Hu, X.; et al. Precision measurements of linear scattering density using muon tomography. Journal of Instrumentation 2016, 11, P07010. [Google Scholar] [CrossRef]
- Checchia, P. Review of possible applications of cosmic muon tomography. Journal of Instrumentation 2016, 11, C12072. [Google Scholar] [CrossRef]
- Antonuccio, V.; Bandieramonte, M.; Becciani, U.; Bonanno, D.; Bonanno, G.; Bongiovanni, D.; Fallica, P.; Garozzo, S.; Grillo, A.; La Rocca, P.; et al. The Muon Portal Project: Design and construction of a scanning portal based on muon tomography. Nuclear Instruments and Methods in Physics Research Section A: Accelerators, Spectrometers, Detectors and Associated Equipment 2017, 845, 322–325. [Google Scholar] [CrossRef]
- Pugliatti, C.; Antonuccio, V.; Bandieramonte, M.; Becciani, U.; Belluomo, F.; Belluso, M.; Billotta, S.; Blancato, A.A.; Bonanno, D.L.; Bonanno, G.; et al. Design of a muonic tomographic detector to scan travelling containers. Journal of Instrumentation 2014, 9, C05029. [Google Scholar] [CrossRef]
- Morris, C.; Bacon, J.; Borozdin, K.; Miyadera, H.; Perry, J.; Rose, E.; Watson, S.; White, T.; Aberle, D.; Green, J.A.; et al. A new method for imaging nuclear threats using cosmic ray muons. AIP Advances 2013, 3. [Google Scholar] [CrossRef]
- Preziosi, E.; Arcieri, F.; Caltabiano, A.; Camarri, P.; Casagrande, S.; Cavicchioni, D.; Danza, F.A.; Fabrizi, E.; Fabrizi, M.; Festa, G.; et al. TECNOMUSE: a novel, RPC-based, muon tomography scanner for the control of container terminals. Journal of Physics: Conference Series 2020, 1548, 012021. [Google Scholar] [CrossRef]
- Georgadze, A.S.; Kudryavtsev, V.A. Geant4 simulation study of low-Z material detection using muon tomography. Journal of Instrumentation 2023, 18, C12014. [Google Scholar] [CrossRef]
- Georgadze, A.; Giammanco, A.; Kudryavtsev, V.; Lagrange, M.; Turkoglu, C. A Simulation of a Cosmic Ray Tomography Scanner for Trucks and Shipping Containers. Journal of Advanced Instrumentation in Science 2024, 2024. [Google Scholar] [CrossRef]
- Georgadze, A.S. Simulation study into the detection of low- and high-Z materials in cargo containers using cosmic ray muons. Acta Physica Polonica B Proceedings Supplement 2024, 17, 1–A2.1. [Google Scholar] [CrossRef]
- Georgadze, A.S. Automated object detection for muon tomography data analysis. Journal of Instrumentation 2024, 19, C07004. [Google Scholar] [CrossRef]
- Europian Commission. Cosmic Ray Tomograph for Identification of Hazardous and Illegal Goods hidden in Trucks and Sea Containers. [CrossRef]
- Georgadze, A.S. Rapid cargo verification with cosmic ray muon scattering and absorption tomography. Journal of Instrumentation 2024, 19, P10033. [Google Scholar] [CrossRef]
- Collaboration, G.; et al. Geant4 Book for Application Developers, Release 10.5. CERN, Geneva, Switzerland, 2019. [Google Scholar]
- Gumplinger, P. Optical photon processes in Geant4. In Proceedings of the Users’ Workshop at CERN; 2002. [Google Scholar]
- Vilardi, I.; Braem, A.; Chesi, E.; Ciocia, F.; Colonna, N.; Corsi, F.; Cusanno, F.; De Leo, R.; Dragone, A.; Garibaldi, F.; et al. Optimization of the effective light attenuation length of YAP: Ce and LYSO: Ce crystals for a novel geometrical PET concept. Nuclear Instruments and Methods in Physics Research Section A: Accelerators, Spectrometers, Detectors and Associated Equipment 2006, 564, 506–514. [Google Scholar] [CrossRef]
- Solutions, L. Luxium Solutions. https://luxiumsolutions.com/radiation-detection-cintillators/fibers, 2024.
- Georgadze, A. ; Shivani.; Tayefi, K.A.; Moskal, P. Optimization of the WLS design for positron emission mammography and Total-Body J-PET systems.
- Solutions, L. Premium Plastic Scintillators, BC-408 datasheet. http://www.crystals.saint-gobain.com, 2014.
- Brun, R.; Rademakers, F. ROOT — An object oriented data analysis framework. Nuclear Instruments and Methods in Physics Research Section A: Accelerators, Spectrometers, Detectors and Associated Equipment 1997, 389, 81–86. [Google Scholar] [CrossRef]
- Lynch, G.R.; Dahl, O.I. Approximations to multiple Coulomb scattering. Nuclear Instruments and Methods in Physics Research Section B: Beam Interactions with Materials and Atoms 1991, 58, 6–10. [Google Scholar] [CrossRef]
- Highland, V.L. Some practical remarks on multiple scattering. Nuclear Instruments and Methods 1975, 129, 497–499. [Google Scholar] [CrossRef]
- Hagmann, C.; Lange, D.; Wright, D. Cosmic-ray shower generator (CRY) for Monte Carlo transport codes. In Proceedings of the 2007 IEEE Nuclear Science Symposium Conference Record, Vol. 2; 2007; pp. 1143–1146. [Google Scholar] [CrossRef]
- Carlisle, T.; et al. Multiple scattering measurements in the MICE experiment. In Proceedings of the Conf. Proc. C, Vol. 1205201; 2012; pp. 1419–1421. [Google Scholar]
- Riggi, S.; et al. Muon tomography imaging algorithms for nuclear threat detection inside large volume containers with the Muon Portal detector. Nuclear Instruments and Methods in Physics Research Section A: Accelerators, Spectrometers, Detectors and Associated Equipment 2013, 728, 59–68. [Google Scholar] [CrossRef]
Figure 1.
(a) GEANT4 visualization of detector composed of plastic scintillator readout by 2 × 2 mm2 WLS fibers. (b) Simulated light photons transmitted in plastic scintillator slab and WLS fibres with GEANT4. Generated scintillation photons, shown as light green lines. The SiPMs are depicted in red.
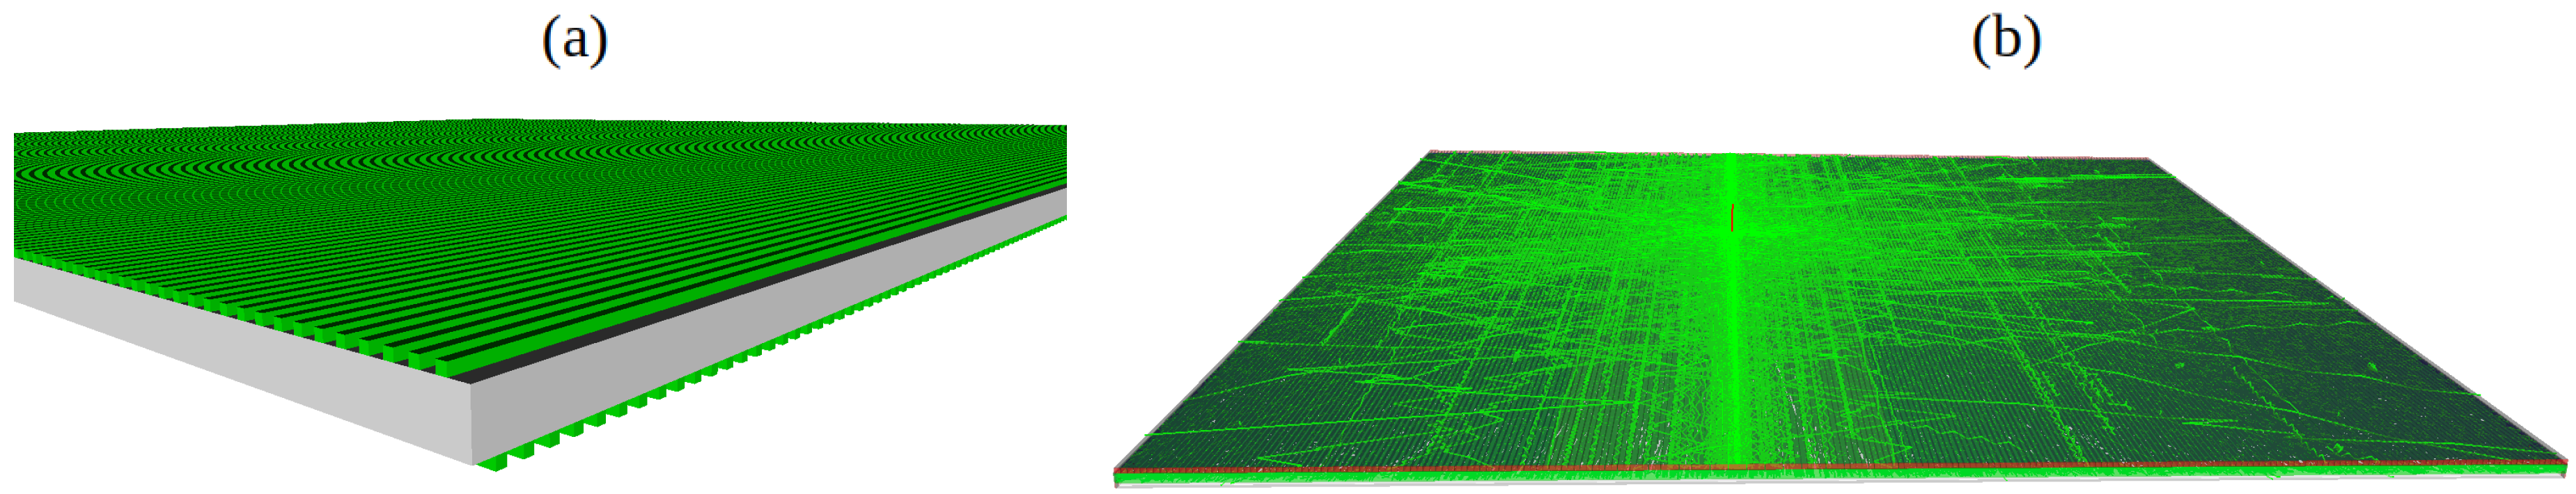
Figure 2.
Photon emission spectrum of BC-404 scintillator [25] (blue colour); absorption (red colour) and emission (green colour) spectra of BCF-91A [23], SiPM PDE (dark blue colour).
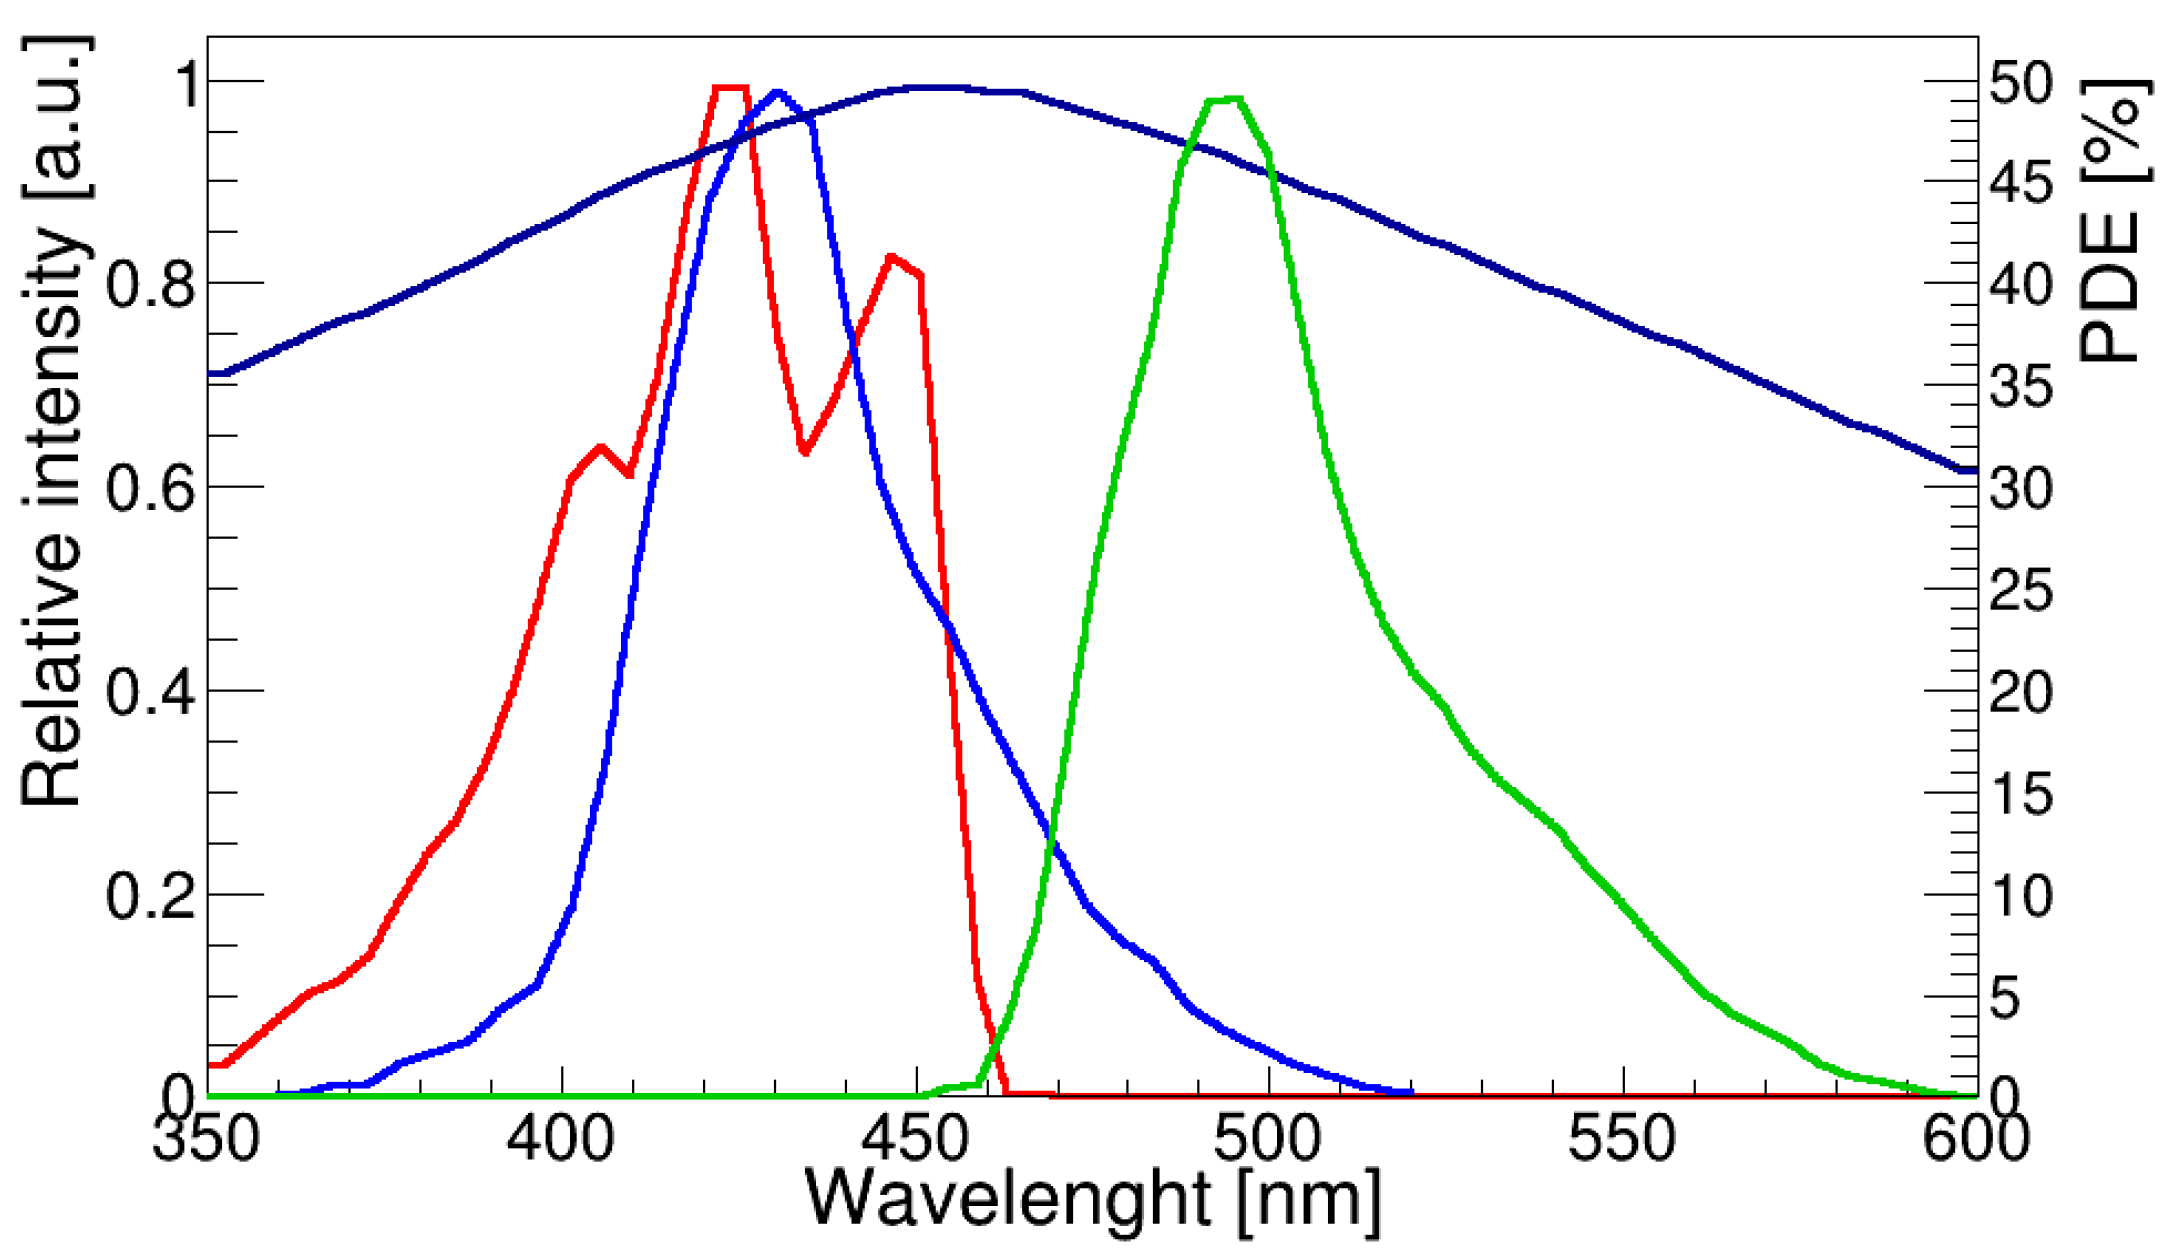
Figure 3.
Reconstructed in 2D muon interaction position for the central detector area and profiles along the x-axis (a) and y-axis (b) showing position resolutions are around 0.7 mm (FWHM). The sigma value of the fitting Gaussian waveform can be regarded as the position resolution. Two muon beam coordinates are x1 = 4 mm, y1 = 4 mm and x2 = 5, y2 = 5 mm.
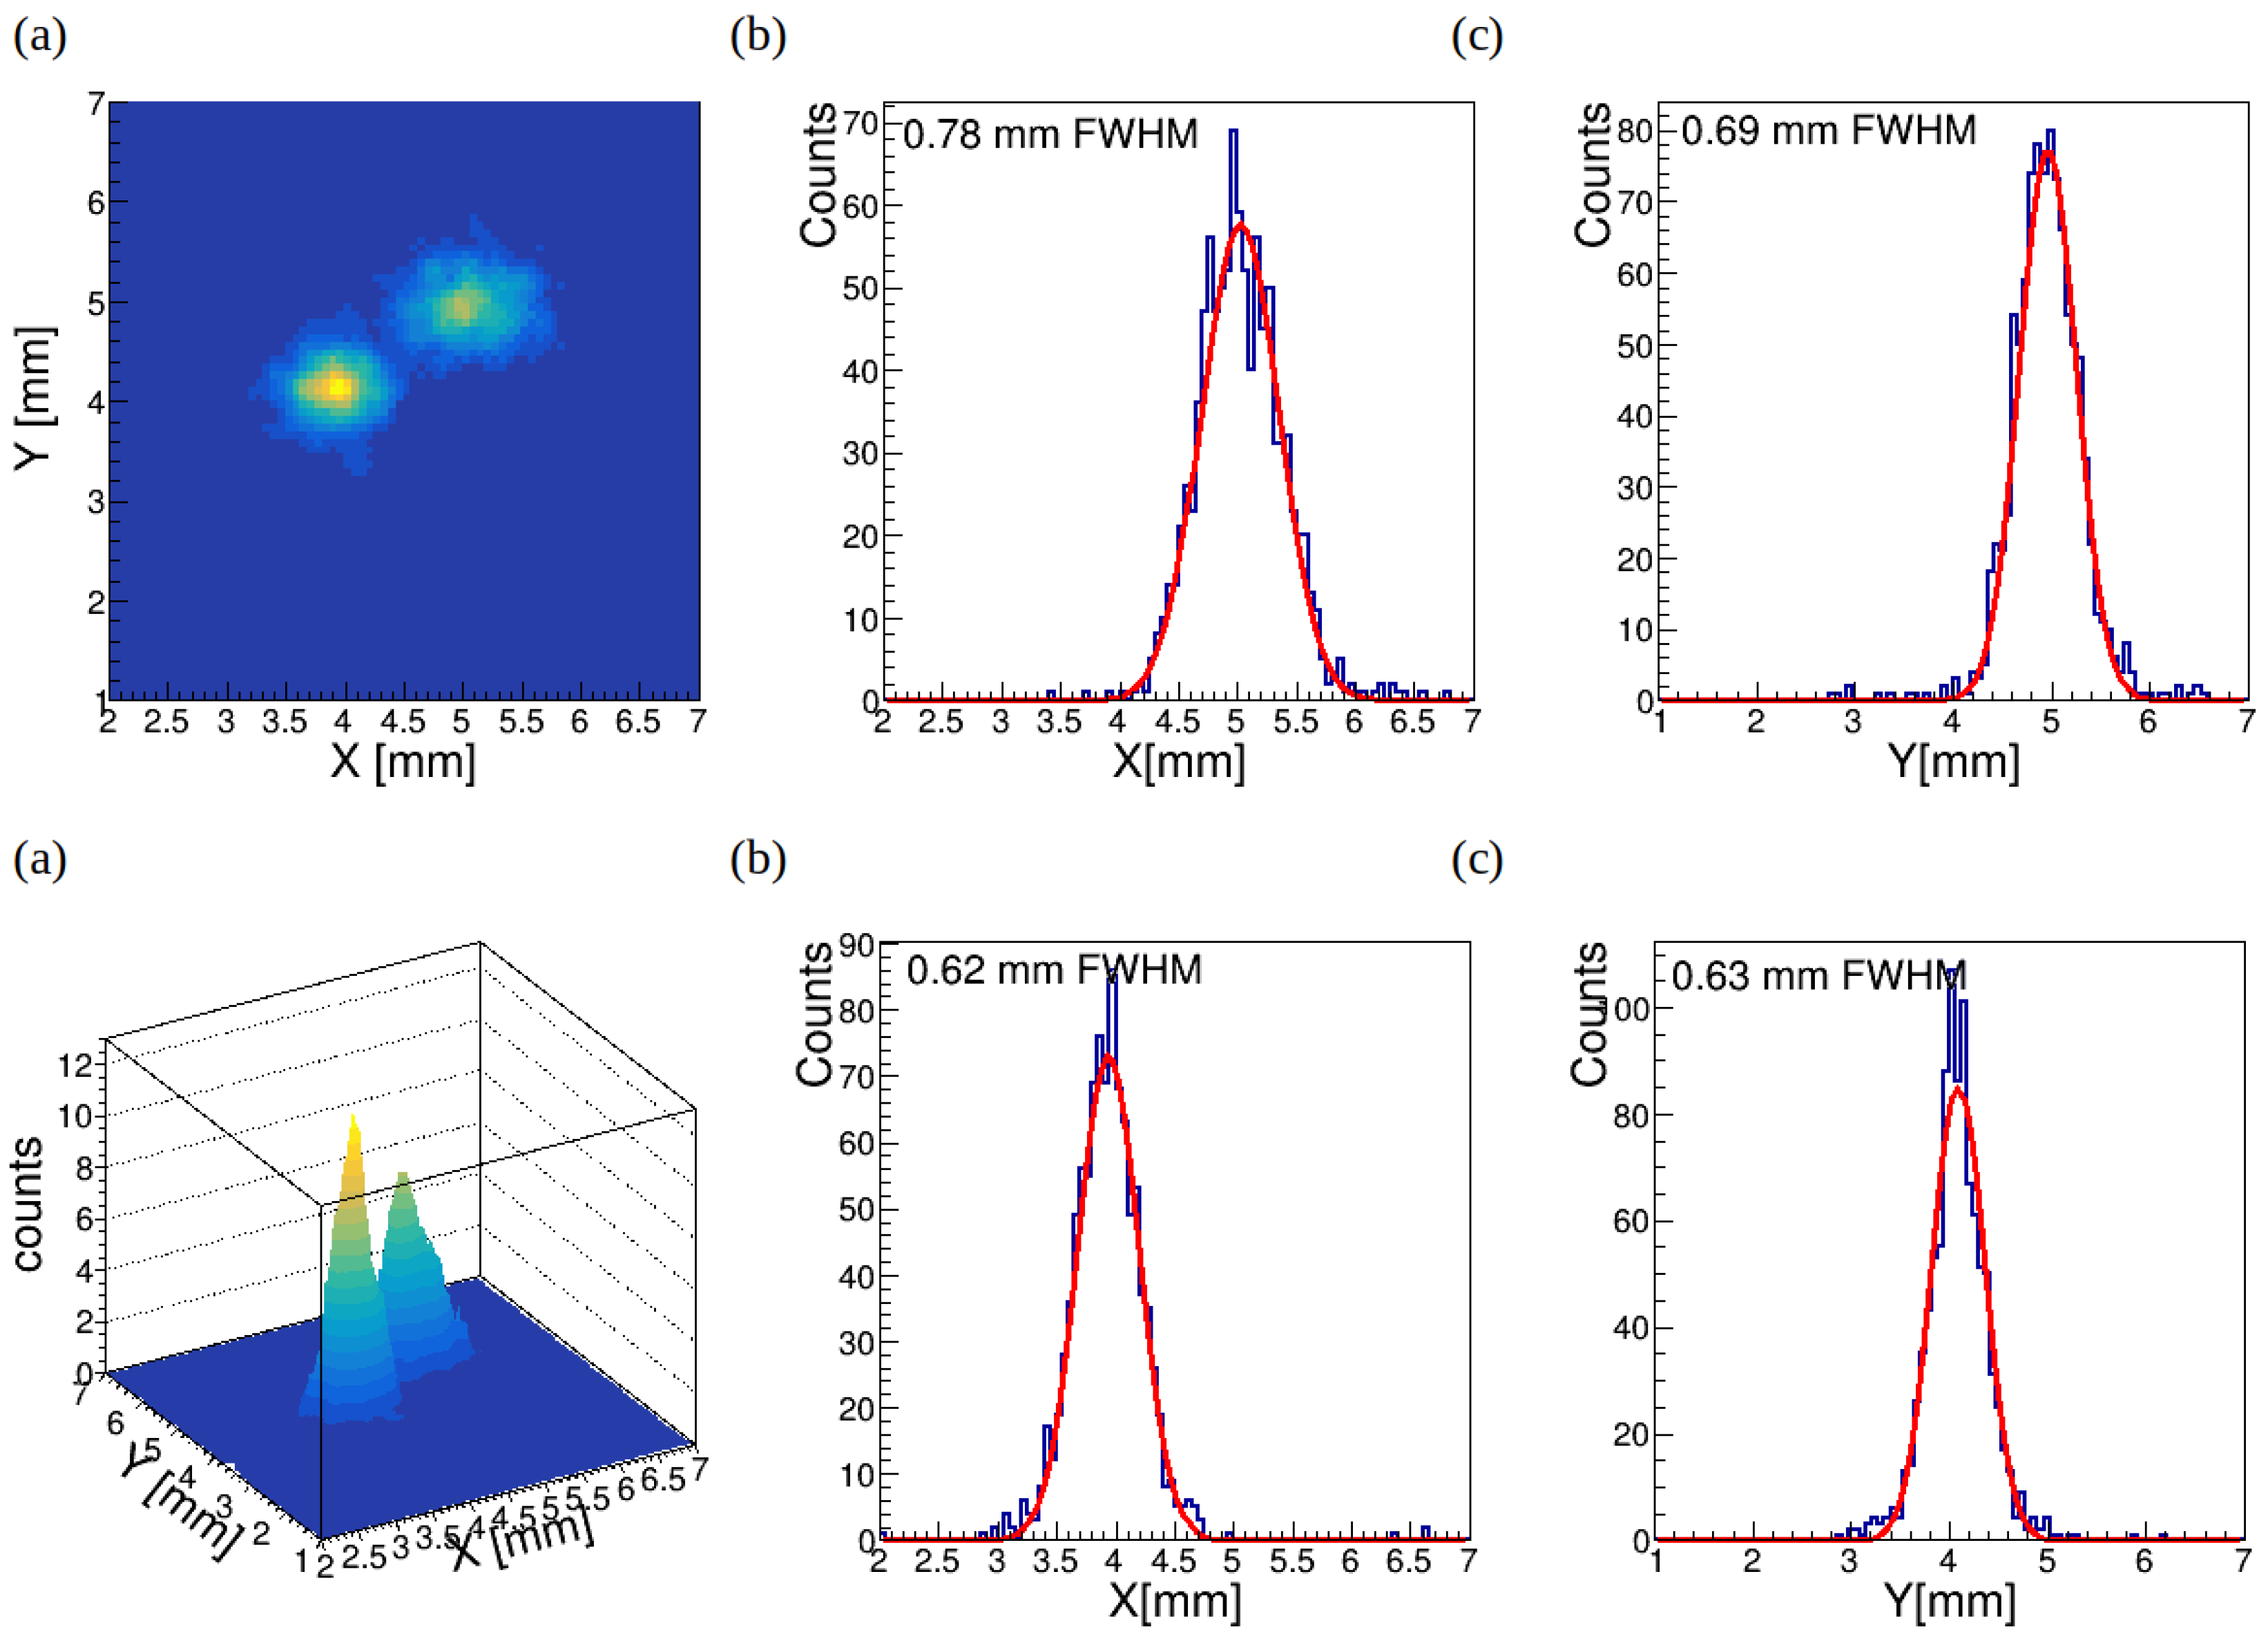
Figure 4.
(a) Reconstructed in 2D muon interaction position on the periphery of detector surface and profiles along the x-axis (b) and y-axis (c). The obtained position resolutions are around 0.7 mm (FWHM). The sigma value of the fitting Gaussian waveform can be regarded as the position resolution. Two muon beam coordinates are x1 = 493 mm, y1 = 3 mm and x2 = 494, y2 = 4 mm.
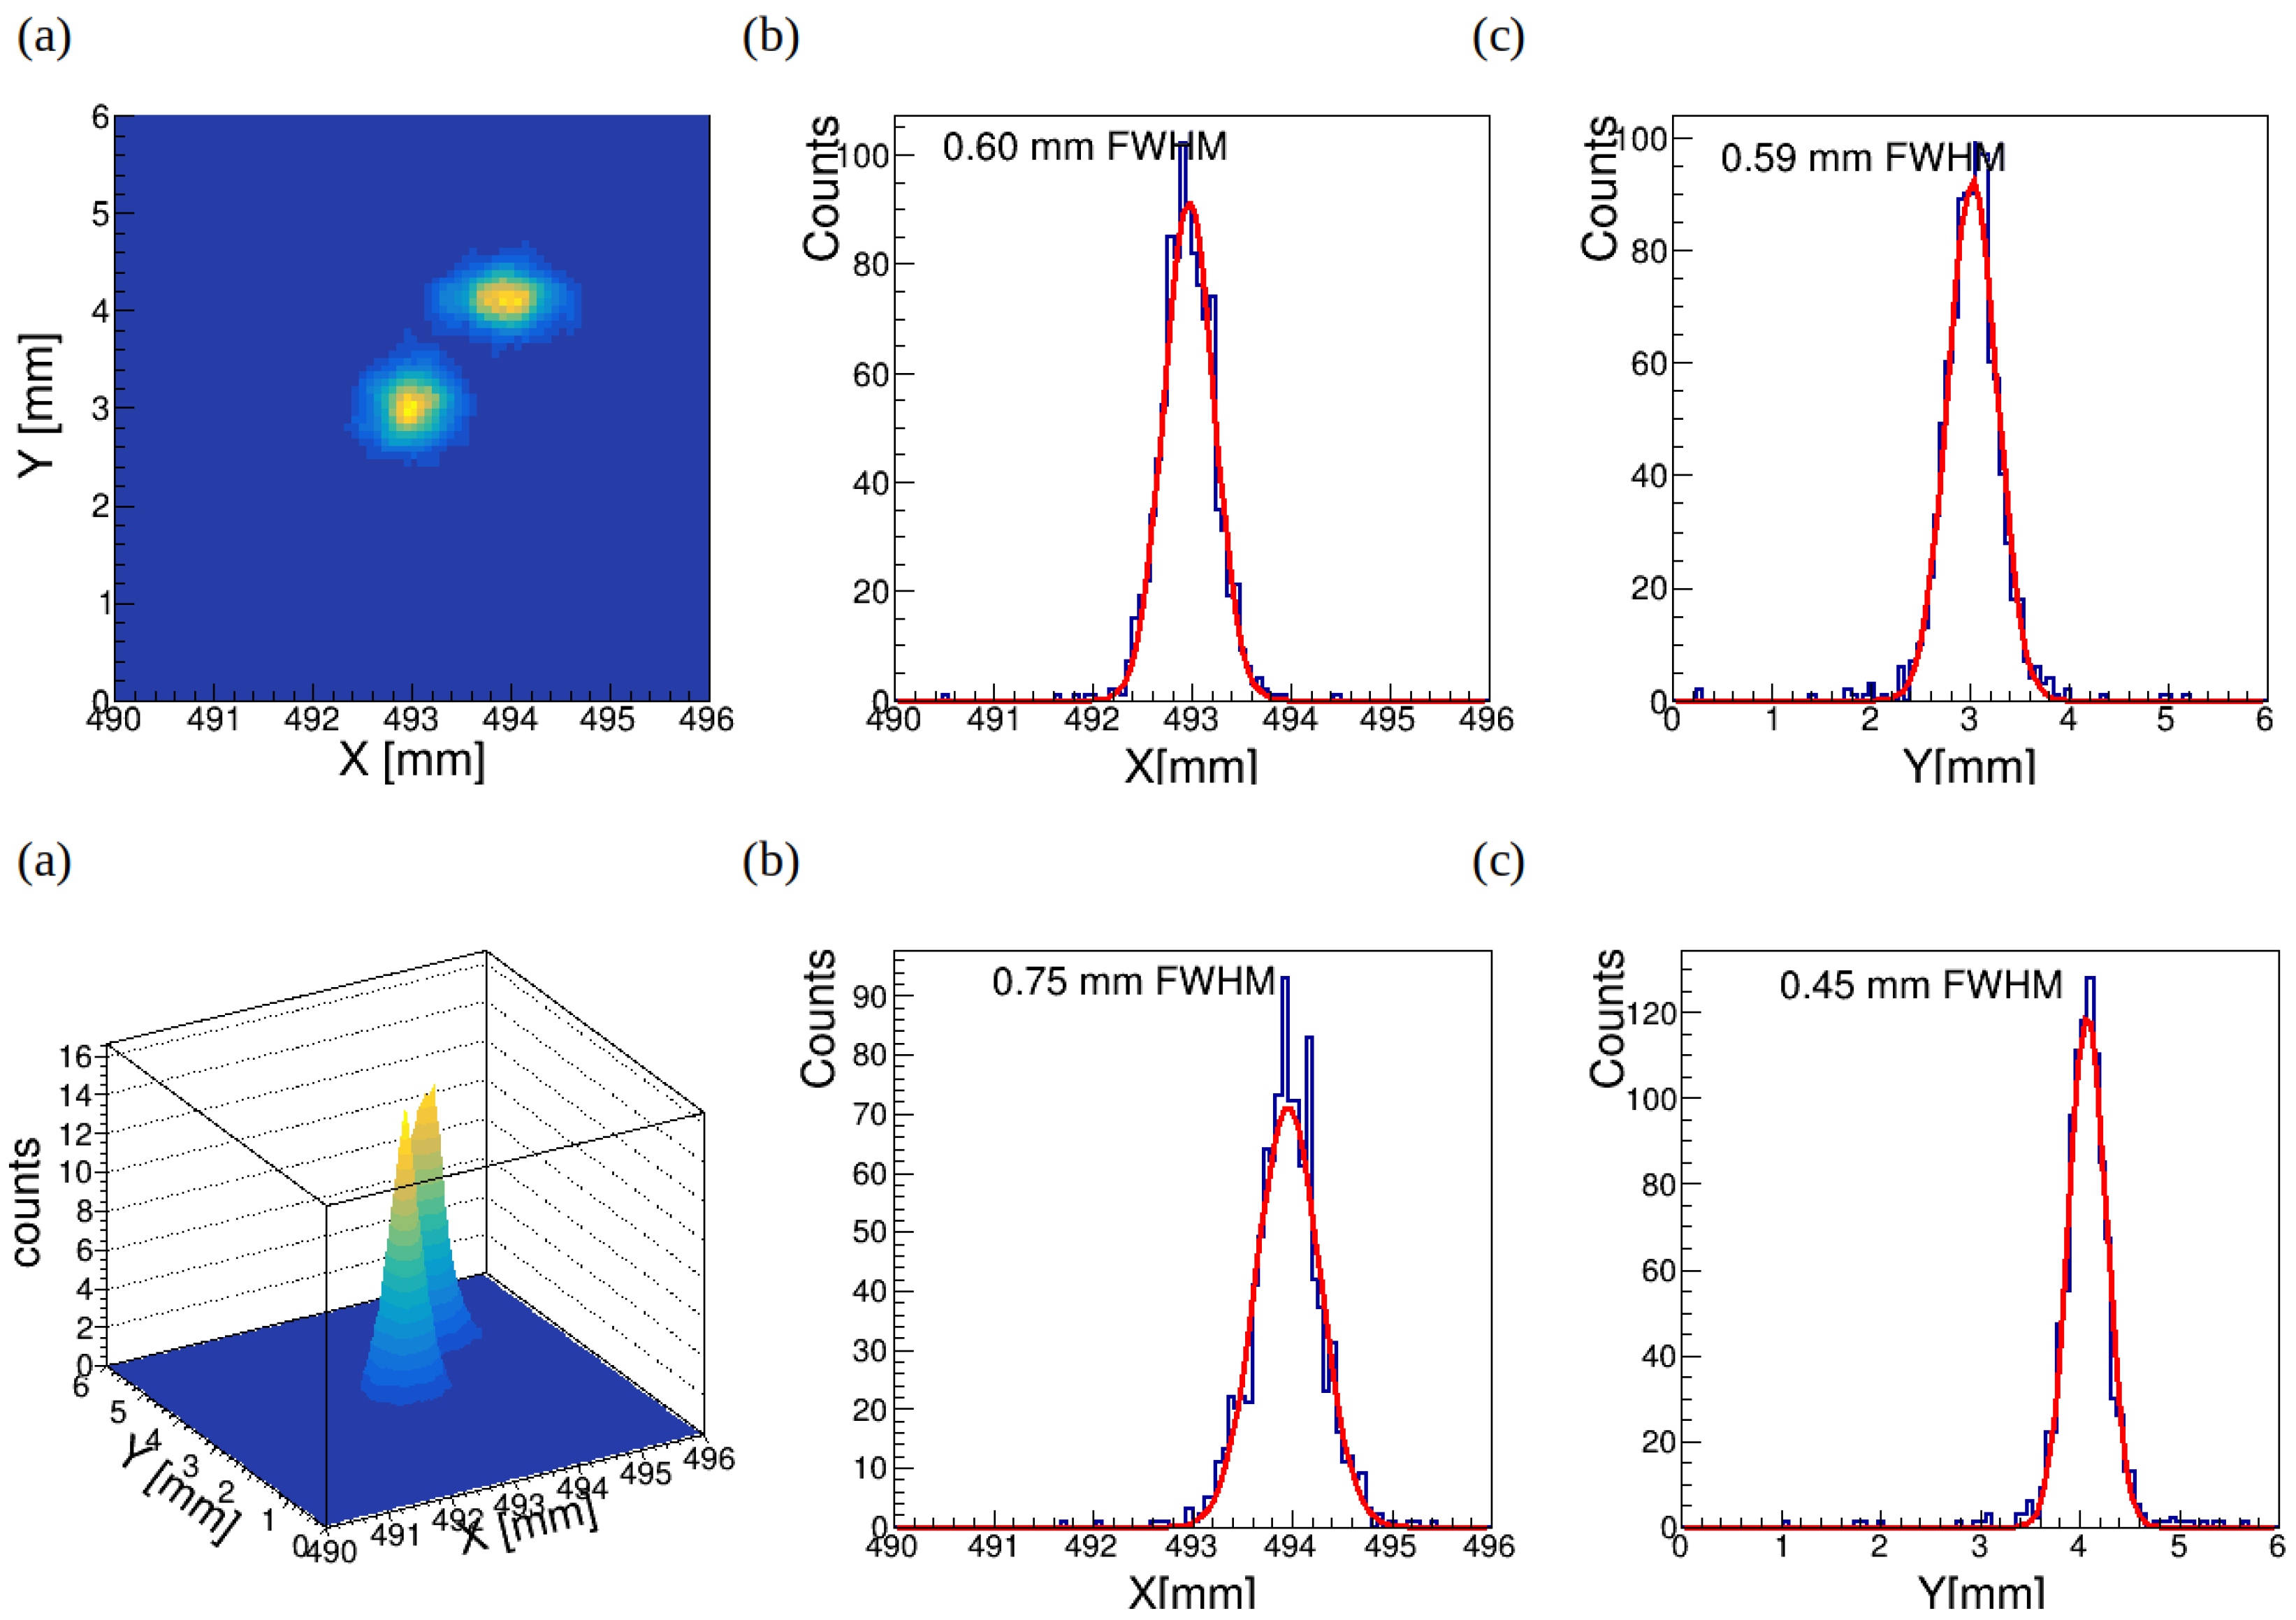
Figure 5.
Illustration of XY-plane positioning estimation.
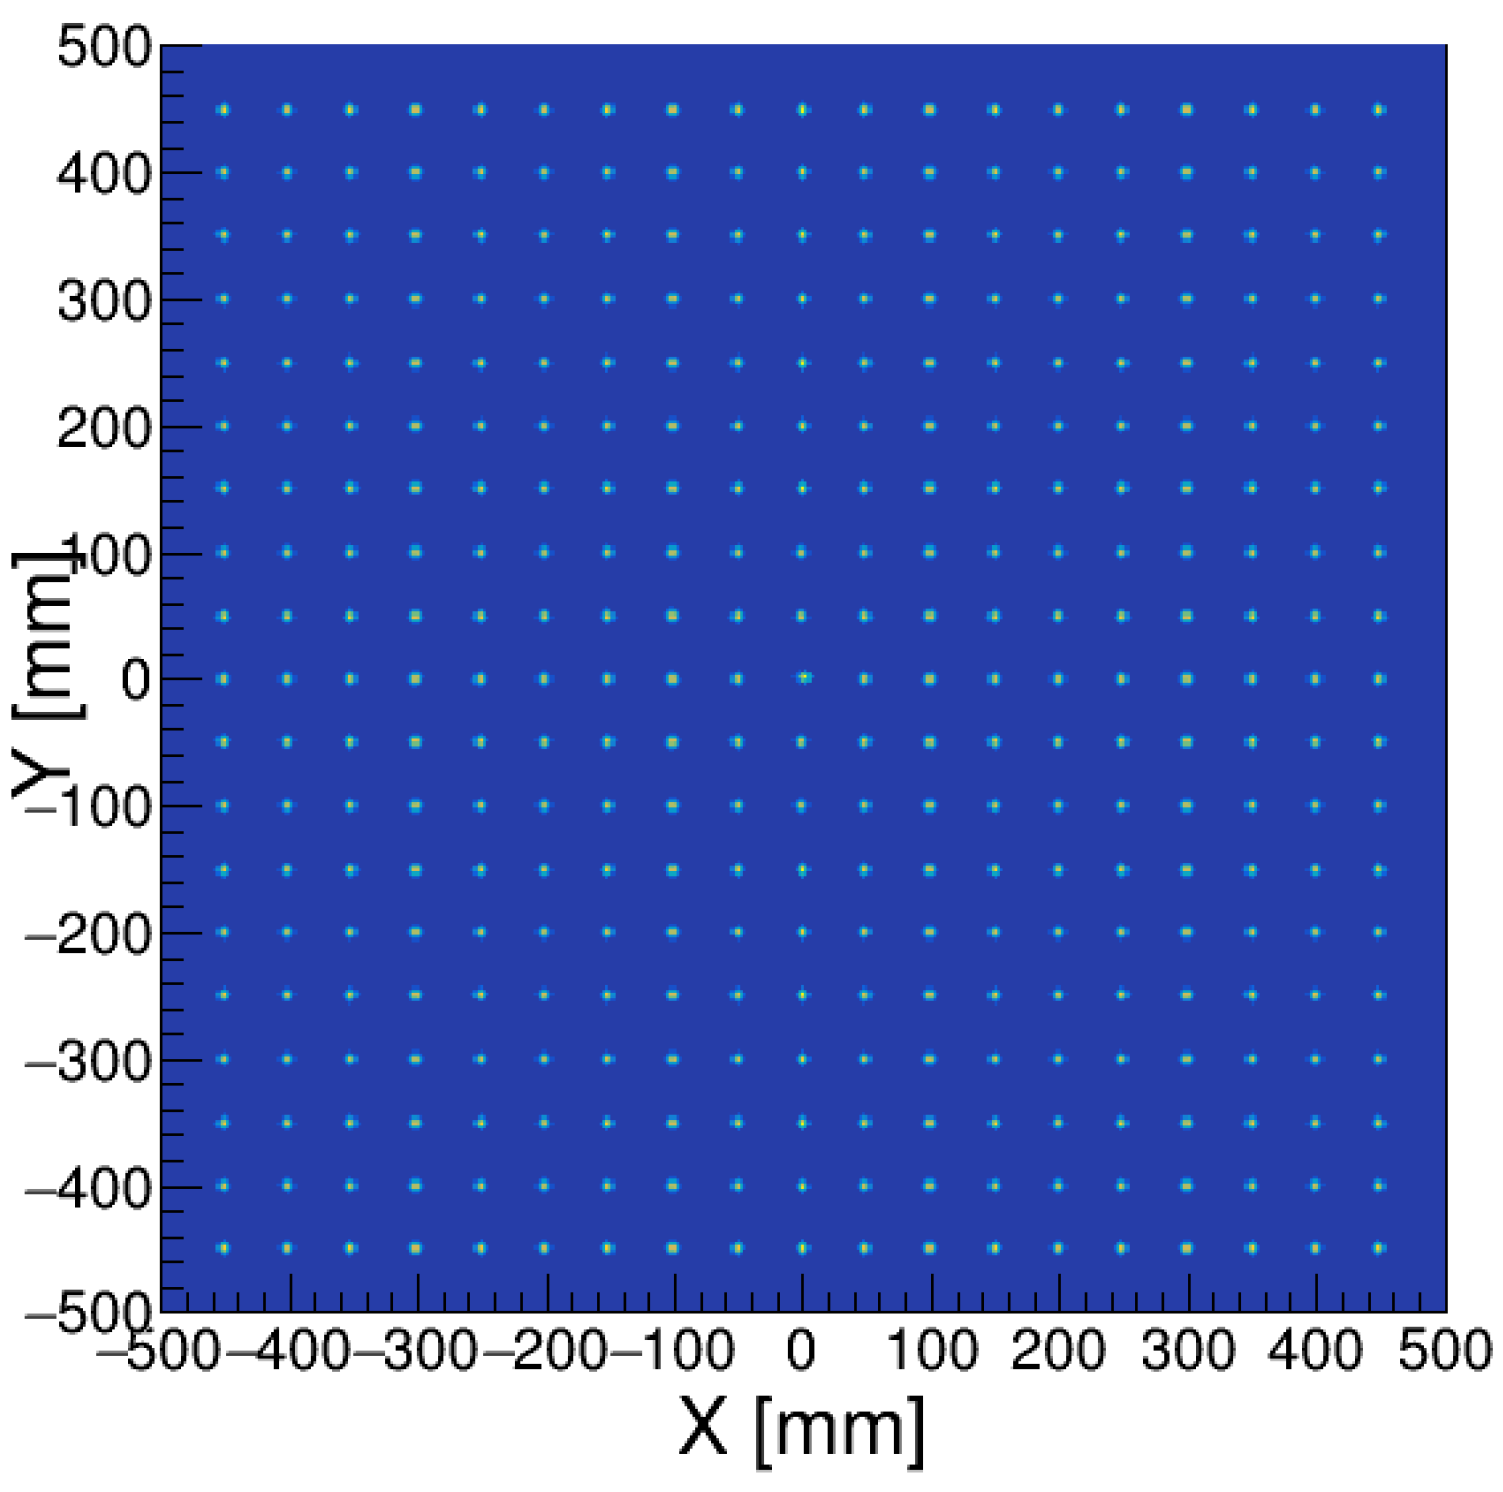
Figure 6.
Comparison of position resolution in central position (muon hit coordinates are x1 = 4 mm, y1 = 4 mm and x2 = 5, y2 = 5 mm) and near the detector edge (muon hit coordinates are x1 = 493 mm, y1 = 3 mm and x2 = 494, y2 = 4 mm).
Figure 6.
Comparison of position resolution in central position (muon hit coordinates are x1 = 4 mm, y1 = 4 mm and x2 = 5, y2 = 5 mm) and near the detector edge (muon hit coordinates are x1 = 493 mm, y1 = 3 mm and x2 = 494, y2 = 4 mm).
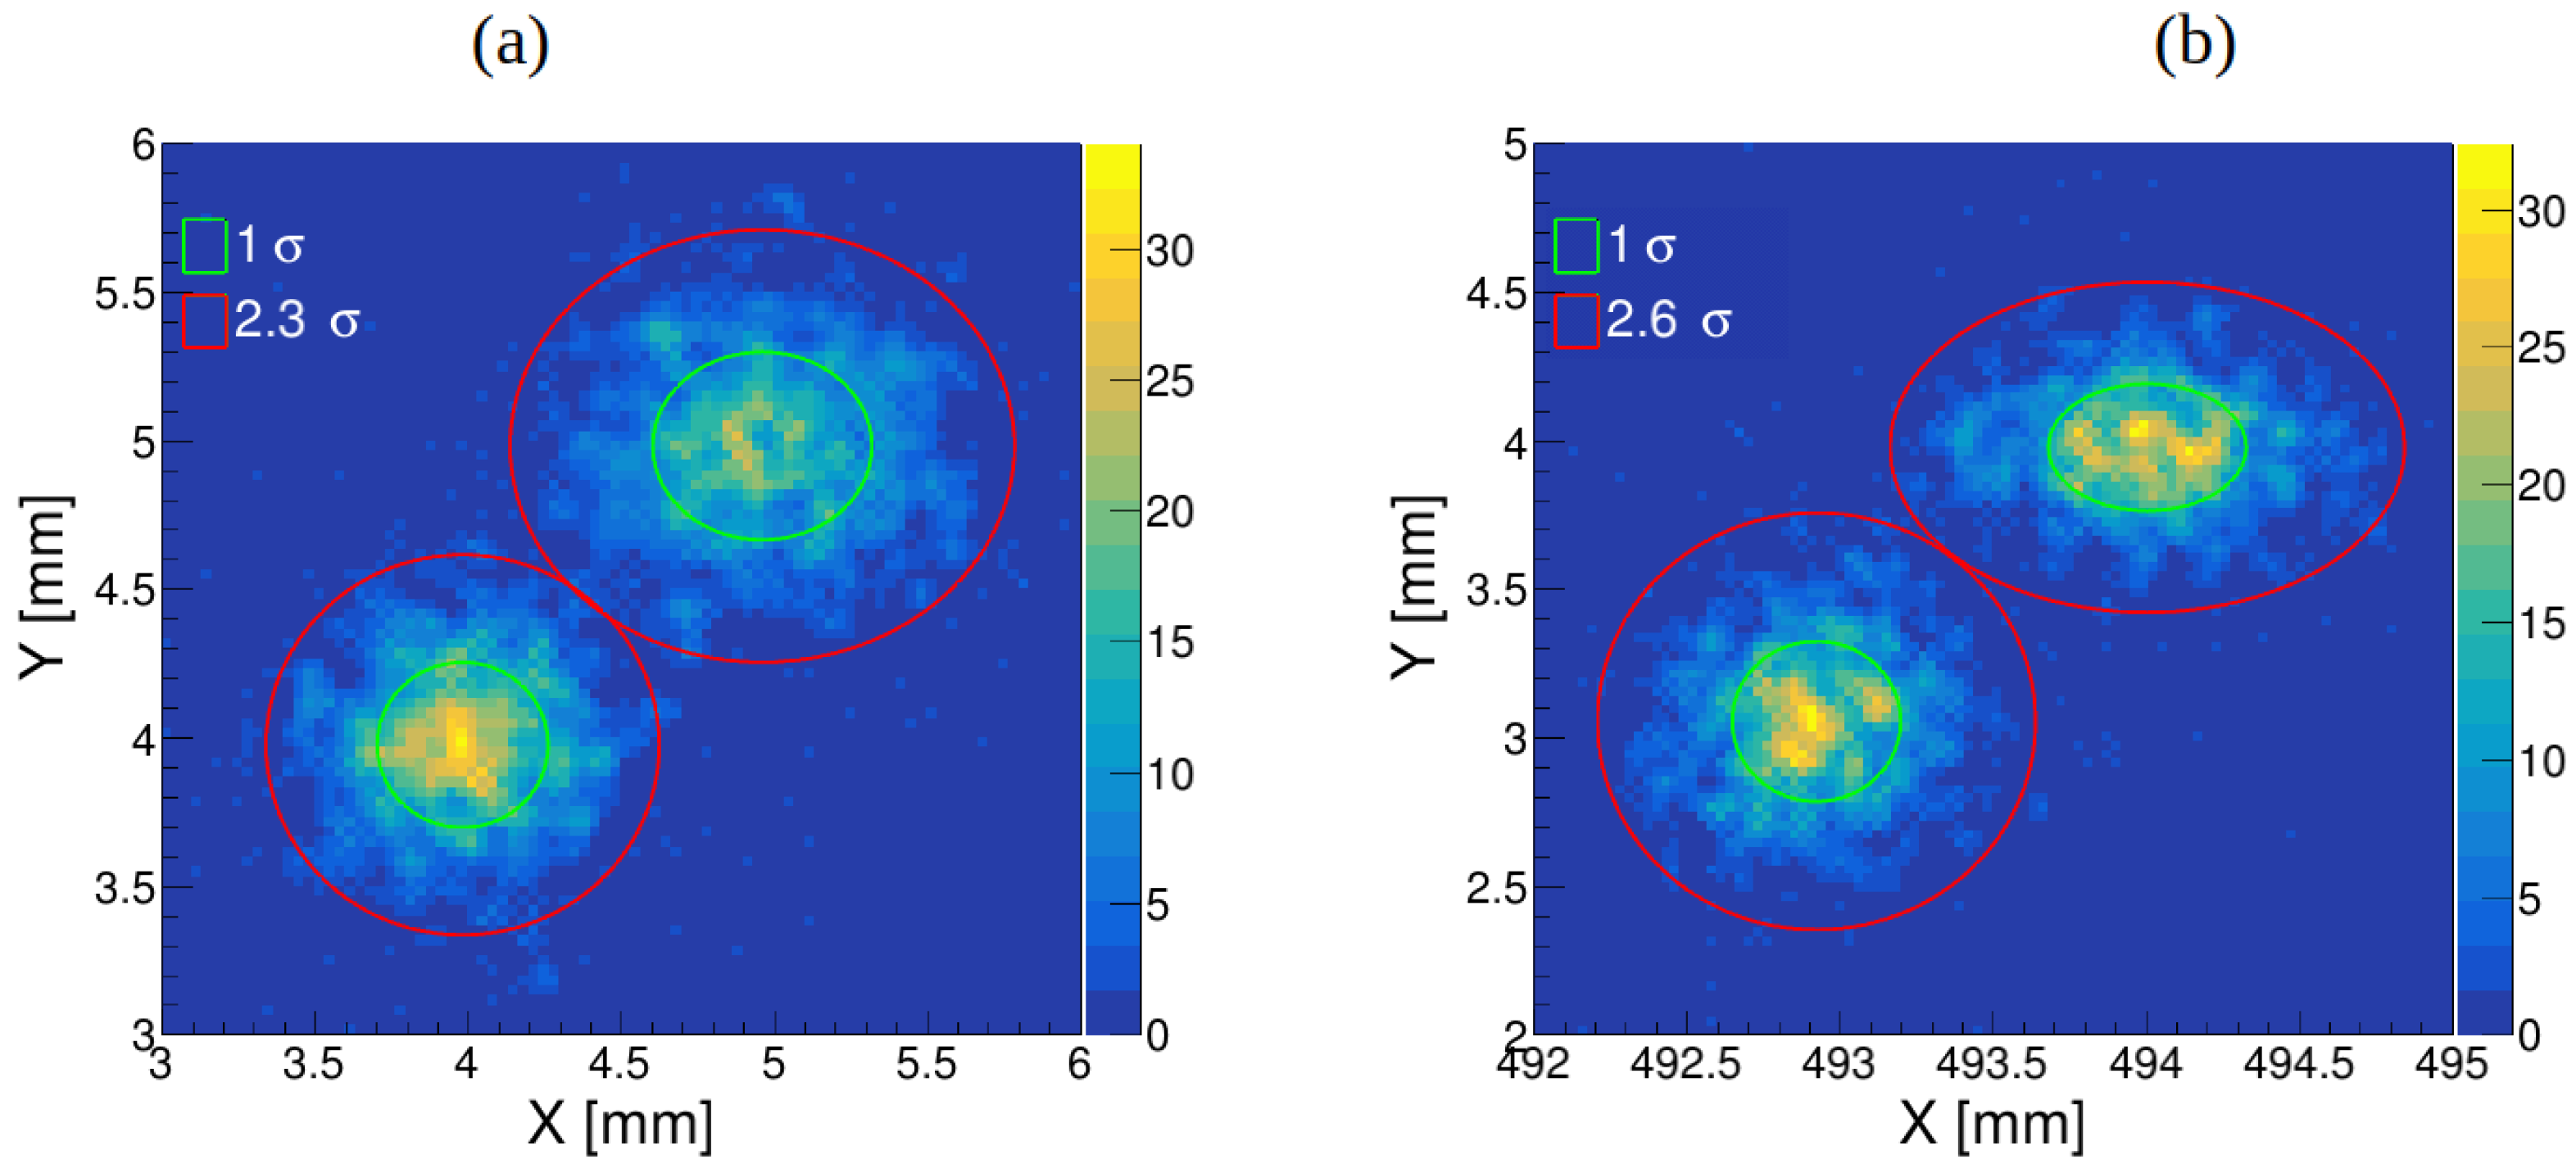
Figure 7.
GEANT4 model of muon tomography station with 9 muon trackers above and 9 below container made of plastic scintillators 1 m × 1 m × 1 cm with WLS-fibers readout. A space is allocated between the plastic scintillator detectors to accommodate the front-end electronics.
Figure 7.
GEANT4 model of muon tomography station with 9 muon trackers above and 9 below container made of plastic scintillators 1 m × 1 m × 1 cm with WLS-fibers readout. A space is allocated between the plastic scintillator detectors to accommodate the front-end electronics.
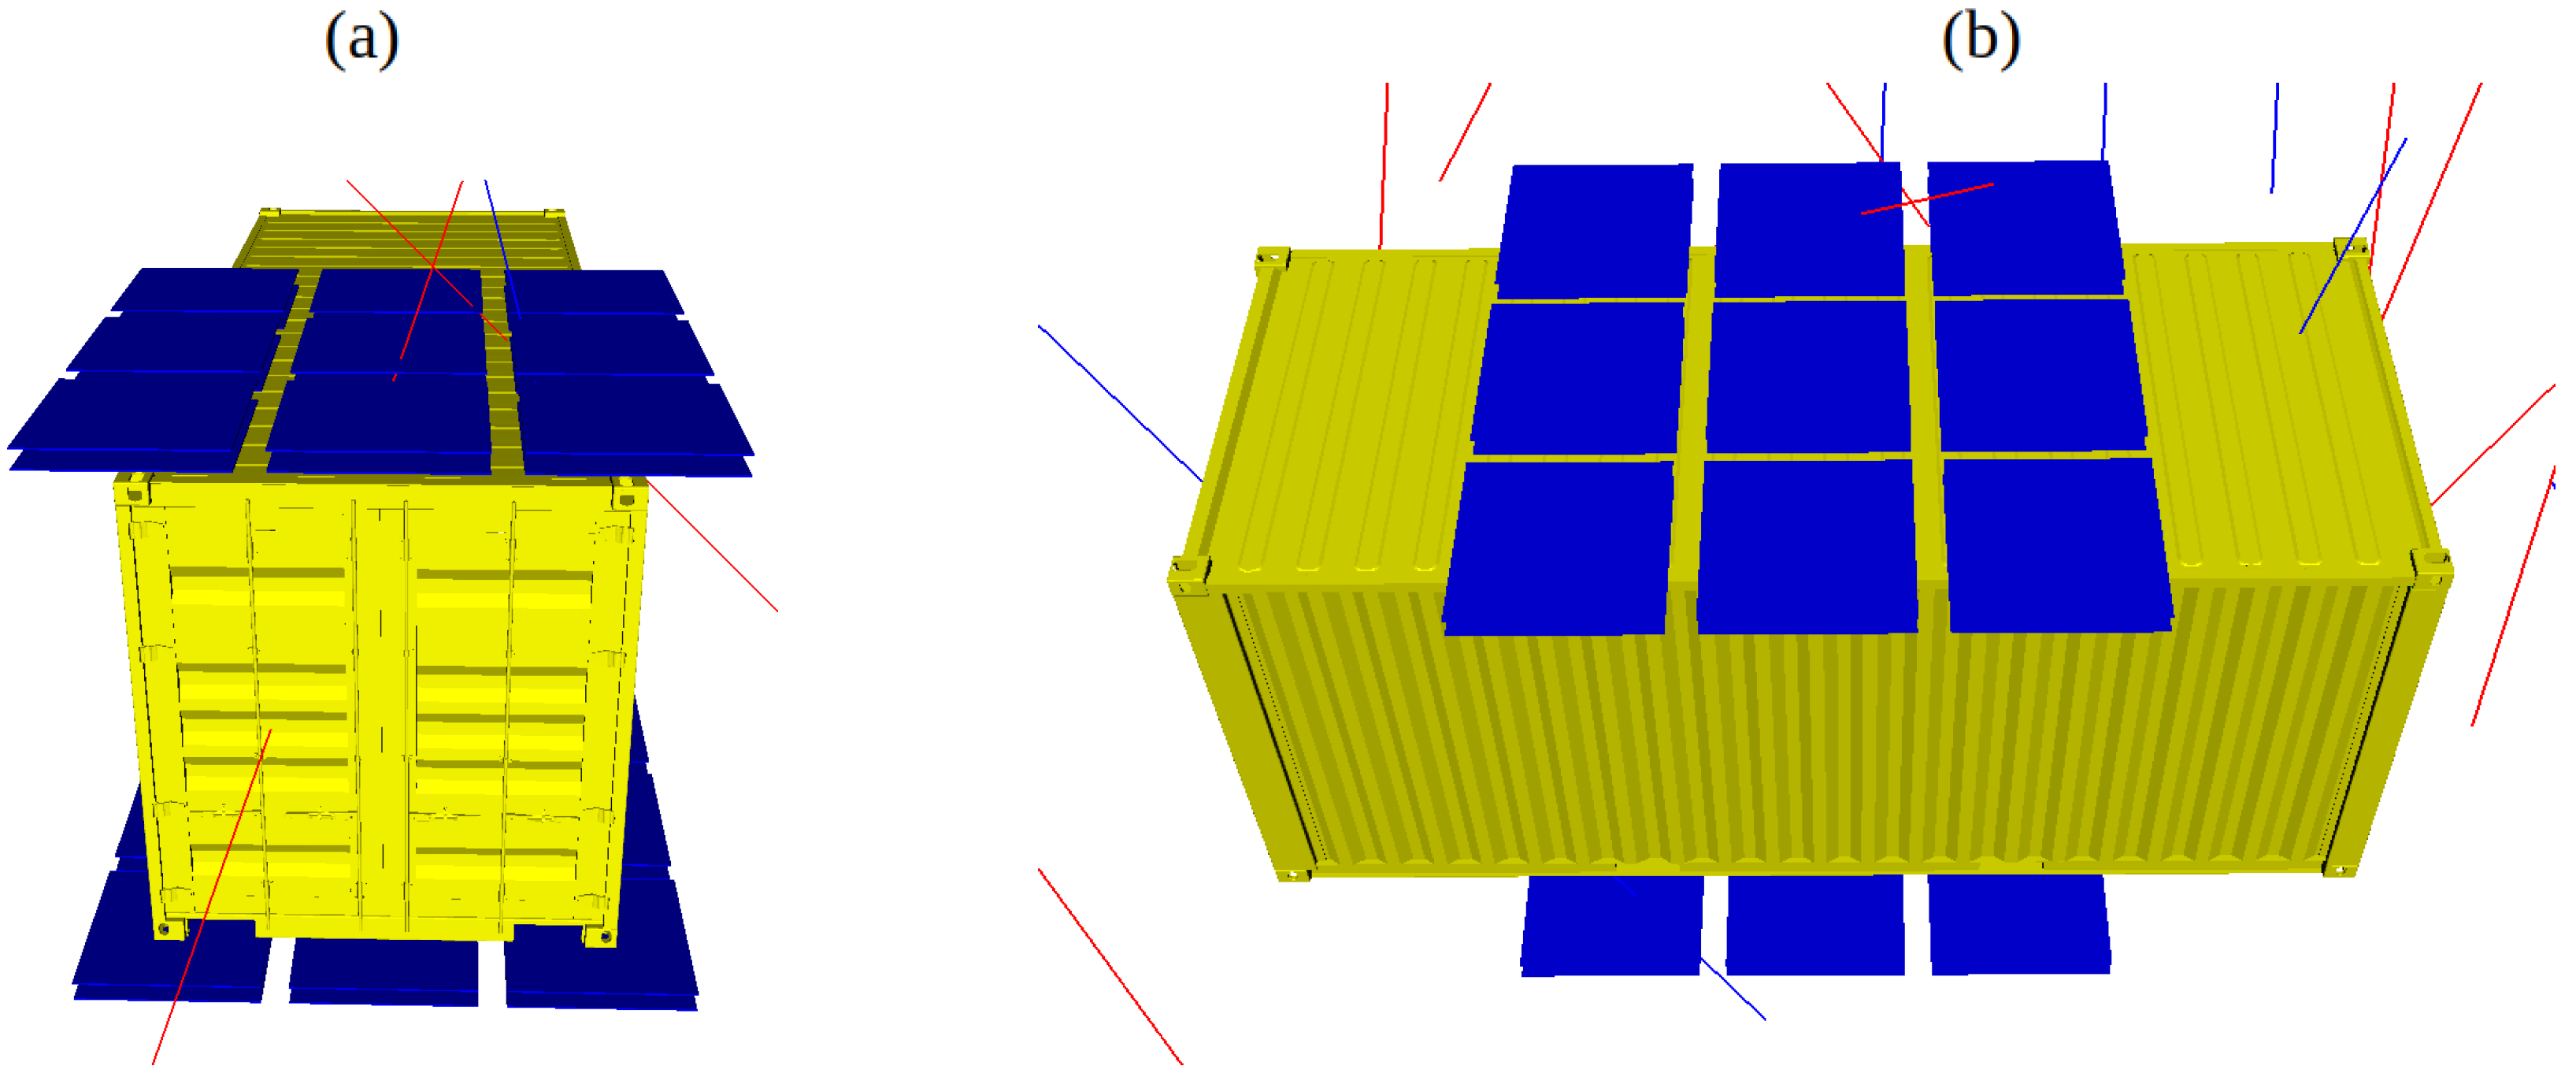
Figure 8.
(a) Simulated 200k muons (20 seconds) sampled on 10 m × 10 m surface using CRY generator. 3D image of PoCA reconstruction of cigarettes smuggling scenario. 2D (b) and 1D (c) profiles of PoCA image of tobacco in compact MTS (3×3×3 m3).
Figure 8.
(a) Simulated 200k muons (20 seconds) sampled on 10 m × 10 m surface using CRY generator. 3D image of PoCA reconstruction of cigarettes smuggling scenario. 2D (b) and 1D (c) profiles of PoCA image of tobacco in compact MTS (3×3×3 m3).
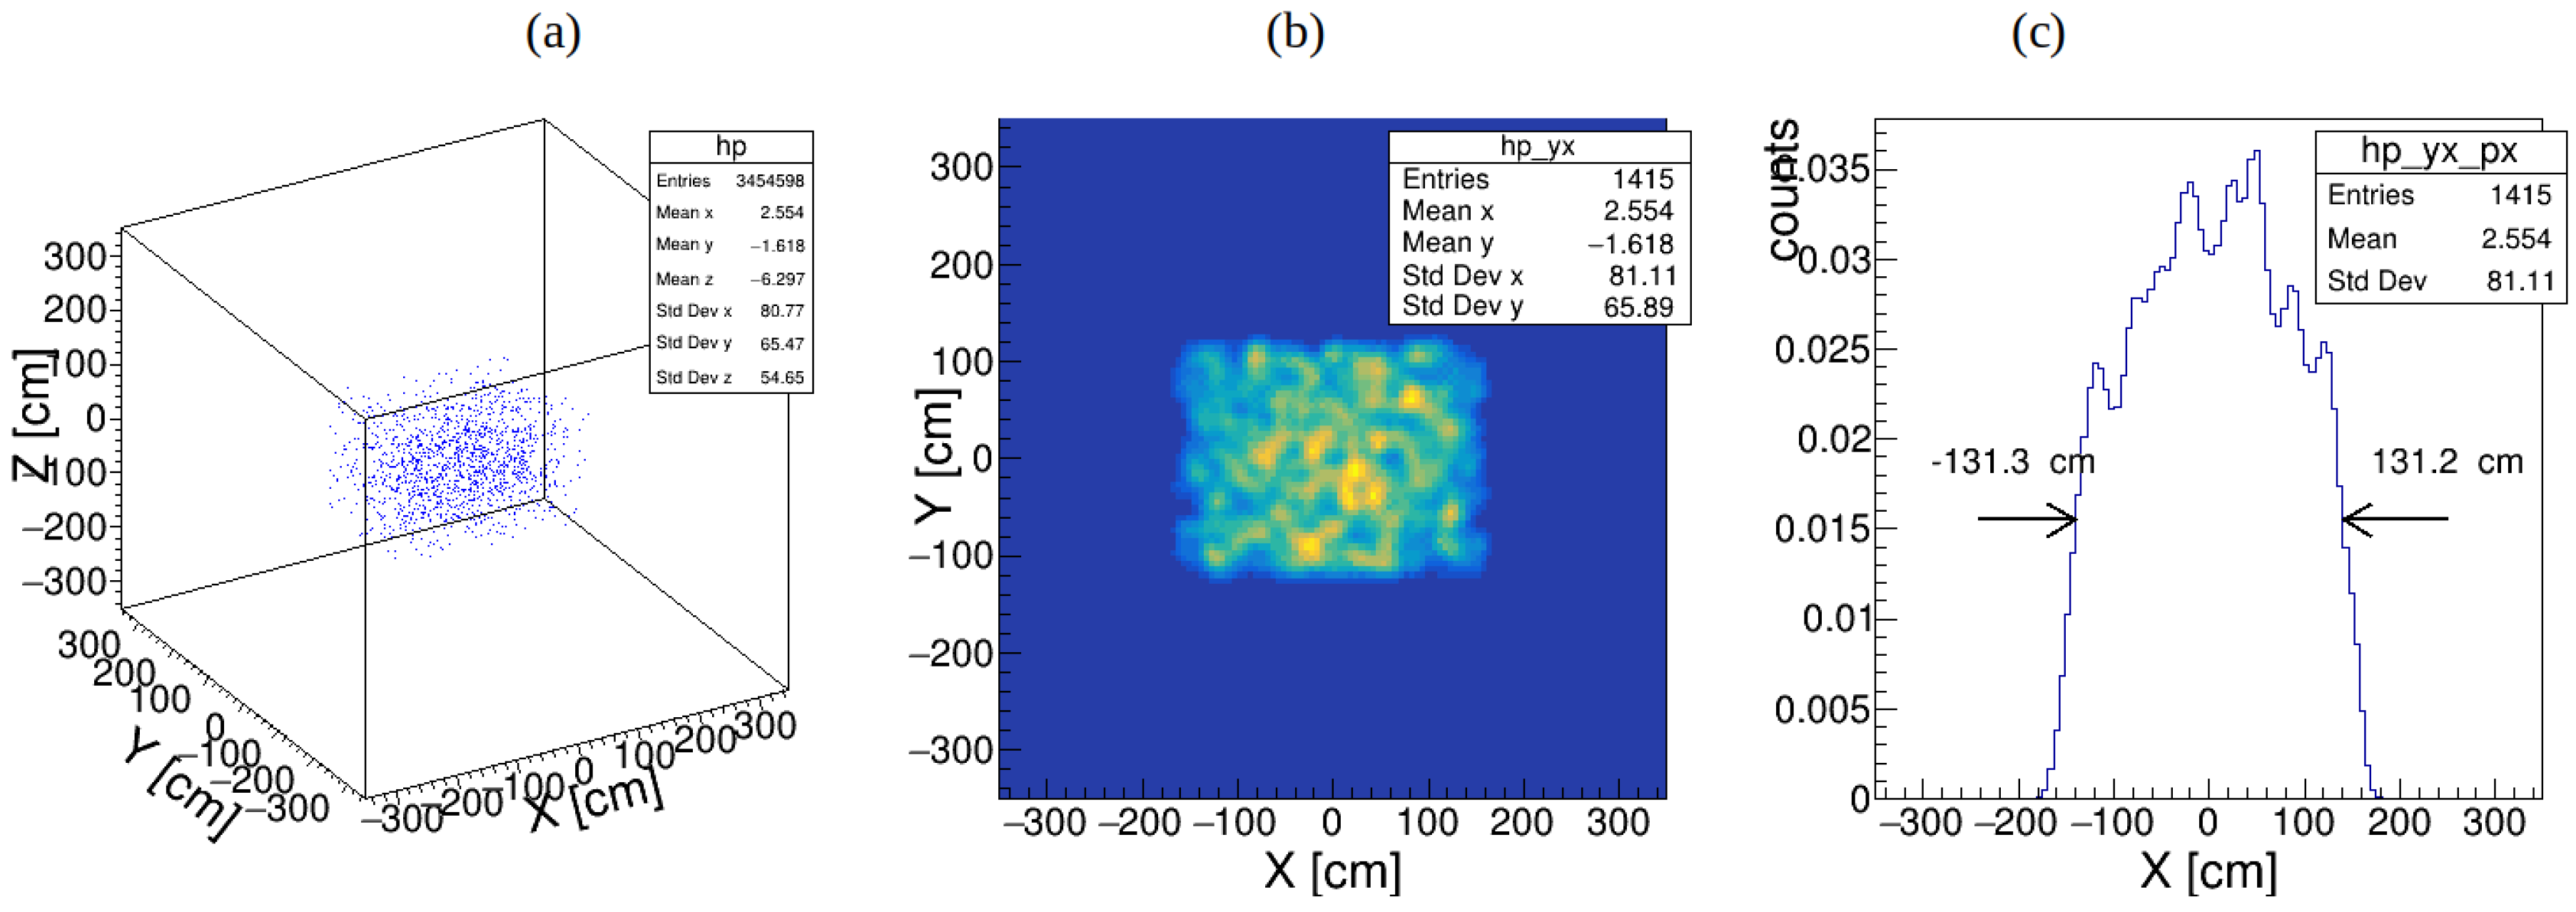
Figure 9.
(a) Scatter plot showing the distributions of scattering and scattering-to-stopping ratio for paper towel rolls and tobacco. Data points for paper towel rolls are marked in blue, and data points for tobacco are marked in red. On the top of each 2D histogram we show the 1D histograms of the scattering distributions for paper towel rolls and tobacco, while on the right side we show the histogram of the corresponding scattering-to-stopping ratio distributions. (b) Scatter plot showing the distributions of scattering density versus stopped muons ratio for paper towel rolls and tobacco in small MTS for 20 seconds scanning time.
Disclaimer/Publisher’s Note: The statements, opinions and data contained in all publications are solely those of the individual author(s) and contributor(s) and not of MDPI and/or the editor(s). MDPI and/or the editor(s) disclaim responsibility for any injury to people or property resulting from any ideas, methods, instructions or products referred to in the content. |
© 2024 by the authors. Licensee MDPI, Basel, Switzerland. This article is an open access article distributed under the terms and conditions of the Creative Commons Attribution (CC BY) license (http://creativecommons.org/licenses/by/4.0/).
Copyright: This open access article is published under a Creative Commons CC BY 4.0 license, which permit the free download, distribution, and reuse, provided that the author and preprint are cited in any reuse.


