
Submitted:
26 December 2024
Posted:
27 December 2024
You are already at the latest version
Abstract
Dementia, including Alzheimer's disease, is a neurodegenerative illness characterized by progressive impairment of cognitive functions, posing a significant global health threat. Physical exercise is widely recognized for its preventive role, providing benefits for both body composition and brain health. This study aimed to explore the relationship between physical exercise, body composition, and the progression of dementia. The analysis was conducted using clinical and neuroradiology data from the Alzheimer's Disease Neuroimaging Initiative (ADNI). Our study mainly focused on crucial parameters such as Body Mass Index (BMI), Skeletal Muscle Index (SMI), and MRI biomarkers, including hippocampal volume and white matter integrity. We grouped the participants according to the similarities of their body compositions through clustering techniques. Then, atrophy-related changes in the brain structures were computed using the Kullback-Leibler divergence. Our findings suggest that higher BMI and greater muscle mass may slow down brain atrophy, suggesting a protective effect on the brain. Based on these results, preserving muscle mass and metabolic health through resistance and aerobic exercise appears crucial in reducing the risk of dementia. Body composition interventions may slow neurodegenerative changes and promote brain health. This is an essential piece of information about prevention strategies, especially for individuals at risk of dementia who may benefit from following structured physical activity strategies.
Keywords:
dementia progression
; physical activity
; Kullback-Leibler divergence
; clustering analysis
; neuroimaging biomarkers
1. Introduction
Physical activity is widely acknowledged as a key factor in preventing and managing neurodegenerative conditions such as dementia and Alzheimer’s disease. Among these, Alzheimer’s disease (AD) represents the most prevalent neurodegenerative disorder, characterized by progressive cognitive impairment and the eventual development of dementia [13]. Epidemiological studies have consistently demonstrated that regular physical activity delays the progression of dementia-related symptoms and enhances cognitive performance [28]. Evidence from randomized controlled trials indicates that aerobic exercise improves mental performance in individuals with Alzheimer’s disease, particularly in domains such as working memory and spatial abilities, while also promoting neuroplasticity in brain regions, including the hippocampus [1,2]. Furthermore, research suggests that sustained physical activity mitigates degenerative alterations in white matter integrity among older adults. This effect is particularly evident in APOE-4 allele carriers, a genetic variant associated with a higher risk of developing Alzheimer’s disease [3].
Body mass index (BMI) and body composition, intrinsically linked to physical activity levels, also represent significant determinants of dementia risk. Empirical evidence indicates that individuals with higher BMI and greater fat mass are at an elevated risk of cognitive impairment and neurodegeneration. The findings from [4] highlight that individuals with elevated BMI and increased body fat percentages often exhibit reduced levels of physical activity, further exacerbating their susceptibility to metabolic and neurodegenerative disorders [26,27]. Conversely, studies suggest that overweight or obese individuals who engage in regular physical activity experience notable cognitive benefits, likely attributable to enhanced cerebral perfusion and reduced systemic inflammation, both of which are exercise-induced effects [5,23].
The evidence further suggests that low muscle and high-fat mass are linked to diminished cognitive function, likely due to the metabolic and inflammatory dysregulation associated with such a body composition. The findings published in the European Review for Medical and Pharmacological Sciences emphasize that enhancing body composition through regular physical activity, particularly by increasing muscle mass and reducing adiposity, may be a critical factor in dementia prevention. This improvement supports better metabolic health and enhances neurovascular function, potentially delaying the onset and progression of neurodegenerative conditions [6].
Our study aims to evaluate the relationship between physical activity and the progression of dementia by employing clustering techniques and the Kullback-Leibler divergence analysis. Applied to MRI data, these methods enable the identification of structural brain changes, such as hippocampal atrophy and reduced white matter integrity, associated with varying levels of physical activity.
2. Materials and Methods
2.1. Method Overview
This examination is concerned with the association between physical exercise and body composition and how dimensional adjacencies impact the progression of dementia using clustering mechanisms and probabilistic divergence measures. To this end, an integrated methodological framework will be applied to combine clinical, demographic, and neuroimaging datasets to understand these interrelationships better. The data were sourced from the Alzheimer’s Disease Neuroimaging Initiative (ADNI), a publicly accessible resource offering high-resolution MRI scans and clinical evaluations. The key variables included:
- −
- Body Mass Index (BMI): Calculated as weight in kilograms divided by height in square meters, BMI is a standard measure for assessing body composition and classifying individuals into weight categories.
- −
- Skeletal Muscle Index (SMI): Defined as skeletal muscle mass normalized by height squared, SMI provides a standardized metric for evaluating muscle mass relative to body size. The complementary nature of BMI and SMI enables a detailed analysis of the influence of body composition on neurodegenerative processes, particularly dementia progression.
These parameters were selected for their relevance in differentiating physical profiles and their potential to elucidate the relationship between body composition and health outcomes.
Data preprocessing included z-score normalization to ensure comparability, multiple imputations to address missing data, and generating probability distributions for neuroimaging biomarkers, such as hippocampal volume and white matter integrity. Clustering methods were applied to stratify participants based on BMI and SMI, facilitating the identification of subgroups with distinct physical profiles. The k-means algorithm, optimized through k-means++ initialization to improve centroid placement and convergence, was chosen for its robustness and computational efficiency in handling continuous variables like BMI and SMI. To determine the optimal number of clusters, the Elbow Method was used to plot the within-cluster sum of squares (WCSS) against the number of clusters, identifying the point of diminishing returns for optimal data compactness and interpretability. The resulting clusters provided a foundation for exploring the association between physical profiles and neuroimaging outcomes.
To further analyze inter-cluster differences, Kullback-Leibler divergence was employed as a measure of dissimilarity between the probability distributions of neuroimaging biomarkers across clusters. This probabilistic approach quantified variations in brain structure and elucidated the potential role of physical activity in modulating neurodegenerative changes.
Cross-validation techniques were used to test the robustness of clustering results, while external metrics such as the Adjusted Rand Index assessed cluster stability. Differences in neuroimaging and clinical outcomes across clusters were statistically evaluated using Analysis of Variance (ANOVA) and post hoc tests for rigorous interpretation of findings.
2.2. Dataset Characteristics
The Alzheimer’s Disease Neuroimaging Initiative (ADNI) dataset is a publicly accessible resource available through the ADNI website [9]. This dataset provides a comprehensive collection of data on individuals involved in Alzheimer’s disease research, encompassing healthy controls, individuals with mild cognitive impairment (MCI), and patients diagnosed with Alzheimer’s disease. The dataset includes high-resolution neuroimaging data (such as structural MRI scans), clinical assessments (including cognitive and diagnostic tests), and demographic information (e.g., age, gender, and education level). The present dataset has been painstakingly preprocessed for research purposes, handling missing values and converting categorical variables into numerical representations to enhance data analysis capabilities. Each subject is assigned an anonymous unique ID to ensure participant privacy and allow longitudinal evaluation of change over time and across visits and assessments. The ADNI dataset represents a critical tool for understanding the progression of Alzheimer’s disease and its relationship to demographic, clinical, and imaging markers.
The dataset encompasses a variety of features that provide comprehensive information about the health status of participants. These include:
- −
- Magnetic Resonance Imaging (MRI) data that provide high-resolution scans of the brain, visualizing its structure and detailed anatomical regions used to assess brain volume, cortical thickness, and other neurodegenerative changes characteristic of Alzheimer’s disease;
- −
- Body Mass Index (BMI), calculated as weight in kilograms divided by height in square meters, which is a standard measure for assessing body composition and classifying individuals into weight categories, including underweight, normal weight, overweight, and obese;
- −
- Muscle mass estimates that refer to inferred values derived from physical examinations, imaging proxies, or other relevant clinical indicators, as direct muscle mass measurements are not explicitly provided;
- −
- Demographic characteristics such as age, gender, education, and ethnicity enable analyses of how these factors influence the progression of Alzheimer’s disease;
- −
- Clinical assessments that include cognitive tests, medical histories, and diagnostic evaluations, offering valuable insights into participants’ mental health and the severity of neurodegenerative conditions.
Each record in the dataset corresponds to a unique participant and includes data collected at multiple time points, enabling comprehensive longitudinal studies to monitor disease progression. Integrating neuroimaging, clinical, and demographic data establishes the ADNI dataset as a critical tool for exploring the complex relationships between Alzheimer’s disease, BMI, muscle mass, and other key health indicators. The dataset’s temporal aspect provides invaluable insights into the dynamic processes underlying neurodegeneration and its association with body composition and other physiological factors.
2.3. Clustering Analysis
Clustering algorithms are essential in unsupervised machine learning, enabling grouping data points based on patterns or inherent structures without predefined labels [10]. This study uses clustering to identify subgroups within the dataset that share similar physical and neuroimaging characteristics. In principle, all clustering methods differ with unique approaches and assumptions. Yet, most clustering techniques can also be turned to different datasets with the relevant pre-processing and careful adjustments of parameters. Clustering analysis can be divided into four main approaches:
- hierarchical clustering,
- density-based clustering,
- probabilistic clustering,
- partitioning clustering.
Hierarchical clustering forms one nested hierarchy of clusters using agglomerative (bottom-up) or divisive (top-down) strategies, enabling data analysis at many different granularity levels. This method is particularly suitable when the number of clusters is unknown or when relationships among clusters at multiple scales are of interest [19].
Density-based methods such as DBSCAN (Density-Based Spatial Clustering of Applications with Noise) group points based on dense regions in the feature space, identifying clusters of arbitrary shapes while isolating noise as outliers. This makes DBSCAN effective for datasets with non-linear cluster boundaries, though its performance can degrade with varying cluster densities [20]. Model-based clustering assumes that data are generated from a mixture of probability distributions, often Gaussian, and seeks to optimize these models to represent the data best. This approach accommodates overlapping clusters but relies on accurate model assumptions [21].
Probabilistic methods assume that data points are generated from a mixture of probability distributions, typically Gaussian. The clustering process involves estimating distribution parameters to represent the dataset accurately. The Expectation-Maximization (EM) algorithm is an example of a probabilistic approach. It alternates between two steps: the Expectation (E) step, where data points are probabilistically assigned to clusters based on current model estimates, and the Maximization (M) step, where the distribution parameters are updated to maximize the likelihood of the observed data.
Partitioning methods such as k-means direct the data into a fixed number of clusters by minimizing the within-cluster sum of squares; the spatial compactness of the resulting clusters will ensure that the partition is suitable. Due to its effectiveness and simplicity, k-means is commonly used in applications dealing with large continuous numerical data sets. However, the algorithm operates on the assumption of spherical clusters of equal size. It is susceptible to the initial placement of centroids, a limitation that can be alleviated through advanced initialization methods such as k-means++ [22]. Despite these limitations, the scalability and interpretability of k-means make it a popular choice in many domains, including medical and health-related research.
K-means clustering was selected for this study due to its ability to efficiently handle the continuous features: Body Mass Index (BMI) and Skeletal Muscle Index (SMI). The algorithm’s reliance on minimizing within-cluster variance aligns with group participants based on similar physical characteristics. The k-means++ initialization method enhanced the algorithm’s robustness by reducing the sensitivity to random centroid initialization, ensuring more consistent convergence.
The k-means algorithm operates by iteratively partitioning the dataset , comprising n data points into k clusters . The algorithm minimizes the within-cluster sum of squares (WCSS) to optimize the compactness of the clusters, with the objective function defined as formula 1 [11]:
where: represents the centroid of cluster , computed as the mean of all data points assigned to that cluster according to the formula 2:
The algorithm alternates between two steps:
- −
- assigning each data point to the nearest cluster centroid based on Euclidean distance, and
- −
- updating the cluster centroids by recalculating the mean of all assigned points.
The process iterates until the centroids stabilize or a predefined maximum number of iterations is reached.
This study’s clustering was based on two key physical characteristics: BMI and SMI. BMI, calculated as weight in kilograms divided by height in square meters, is a standard measure used to assess body composition and categorize individuals into underweight, normal weight, overweight, and obese groups. Skeletal muscle mass index (SMI) is a measure that has been defined as the skeletal muscle mass normalized by height squared; it is a standard measure of muscle mass relative to body size and gives information regarding body composition. This cluster of features was chosen because of its differentiating use in physical profiles and possible destinations in health outcomes, including dementia progression.
Normalization was performed using z-score transformation, standardizing the features to have a mean of zero and a standard deviation of one to ensure comparability between BMI and SMI as depicted in formula 3:
where is the feature value, is the mean, and is the standard deviation.
The normalization step was applied, as k-means clustering relies on Euclidean distance, which is sensitive to the scale of the features.
The optimal number of clusters k was determined using the elbow method. This method involves plotting the WCSS for different values of k and identifying the point where the rate of decrease slows significantly, indicating a balance between compactness and interpretability. The silhouette score was calculated to validate the optimal number of clusters further, providing an additional measure of cluster separation and cohesion. Based on this analysis, different cluster schemas were selected, each representing distinct patterns in BMI and SMI. These schemas provide a meaningful stratification of participants, facilitating subsequent analysis of their relationship with dementia progression.
2.4. Kullback-Leibler Divergence Measure
The Kullback-Leibler (KL) divergence was first introduced in [7]. It is also known as the Kullback–Leibler distance, cross-entropy, information divergence, and information for discrimination [8]. Kullback-Leibler (KL) divergence measures the difference between two probability distributions, i.e., it quantifies how one distribution P diverges from another Q [24,25,30]. Formally, KL divergence is defined as shown in Equation 4.
where: represents the probability of observing a specific feature (e.g., hippocampal volume) in the target distribution, and denotes the corresponding probability in the reference distribution.
KL divergence quantifies the relative entropy between these distributions, with larger values indicating more significant divergence. The measure is non-negative (), with a zero value when the distributions are identical. It is asymmetric, meaning , which emphasizes the importance of choosing an appropriate reference distribution. Unlike summary metrics such as mean or variance, KL divergence evaluates the entire shape of the distributions, capturing nuanced variations in atrophy patterns across groups. This is relevant for detecting the effects of physical activity on brain structures like the hippocampus, where the impact may manifest as small but significant differences in atrophy progression.
The distributions were extracted from preprocessed MRI scans, where voxel intensities or regional volumes were normalized to create valid probability distributions that sum to one. In the context of this study, KL divergence was applied to analyze:
- (A)
- intersubject variability;
- (B)
- intrasubject variability.
(A) The intersubject variability was analyzed to evaluate differences in hippocampal atrophy distributions between groups with varying physical activity levels. The target distribution, P, represented individuals with higher physical activity levels, while the reference distribution, Q, corresponded to sedentary individuals. By computing , the divergence highlights the extent to which physical activity mitigates brain atrophy.
(B) The Intrasubject variability was analyzed to compare MRI images of the same patient to analyze dementia progression and track how the divergence between active and passive groups evolves. The target distribution, P, represented the current state of the brain (the MRI taken at a later time point). In contrast, the reference distribution, Q, corresponded to the baseline state of the brain (the MRI taken at an earlier time point). A higher value indicates greater divergence, suggesting more significant structural changes, which may correspond to disease progression. Conversely, a lower value indicates minimal divergence, suggesting stability in brain structure over time.
As a result, our study offers more profound insights into the temporal dynamics of dementia progression and neuroprotection.
3. Results and Discussion
The following methodological steps were carried out to examine the relationship between Body Mass Index (BMI) values and brain alterations observed in MRI scans:
- Initially, a dataset comprising patients who underwent body weight, height, and musculature measurements was curated. To be included, patients were required to have undergone multiple assessments, with the initial examination indicating minimal changes and subsequent assessments reflecting advanced stages of dementia or Alzheimer’s disease.
- Cluster analysis was performed using numerical data, including calculated BMI values and muscularity scores, forming up to five distinct clusters.
- The Kullback-Leibler divergence was computed separately for each patient’s first and final MRI images.
- The mean Kullback-Leibler divergence value within each cluster was calculated to evaluate whether participants’ physical characteristics corresponded to the progression of brain changes.
The study employed cluster analysis on numerical data, focusing on BMI and muscle test scores, to explore patterns across different cluster configurations. The elbow method and the silhouette score were utilized to determine the optimal number of clusters. The scores were computed for clusters of two, three, four, and five. The results of the silhouette score are displayed in Figure 2 and Table 1.
Figure 1.
The overview of the experimental research process and methodology.
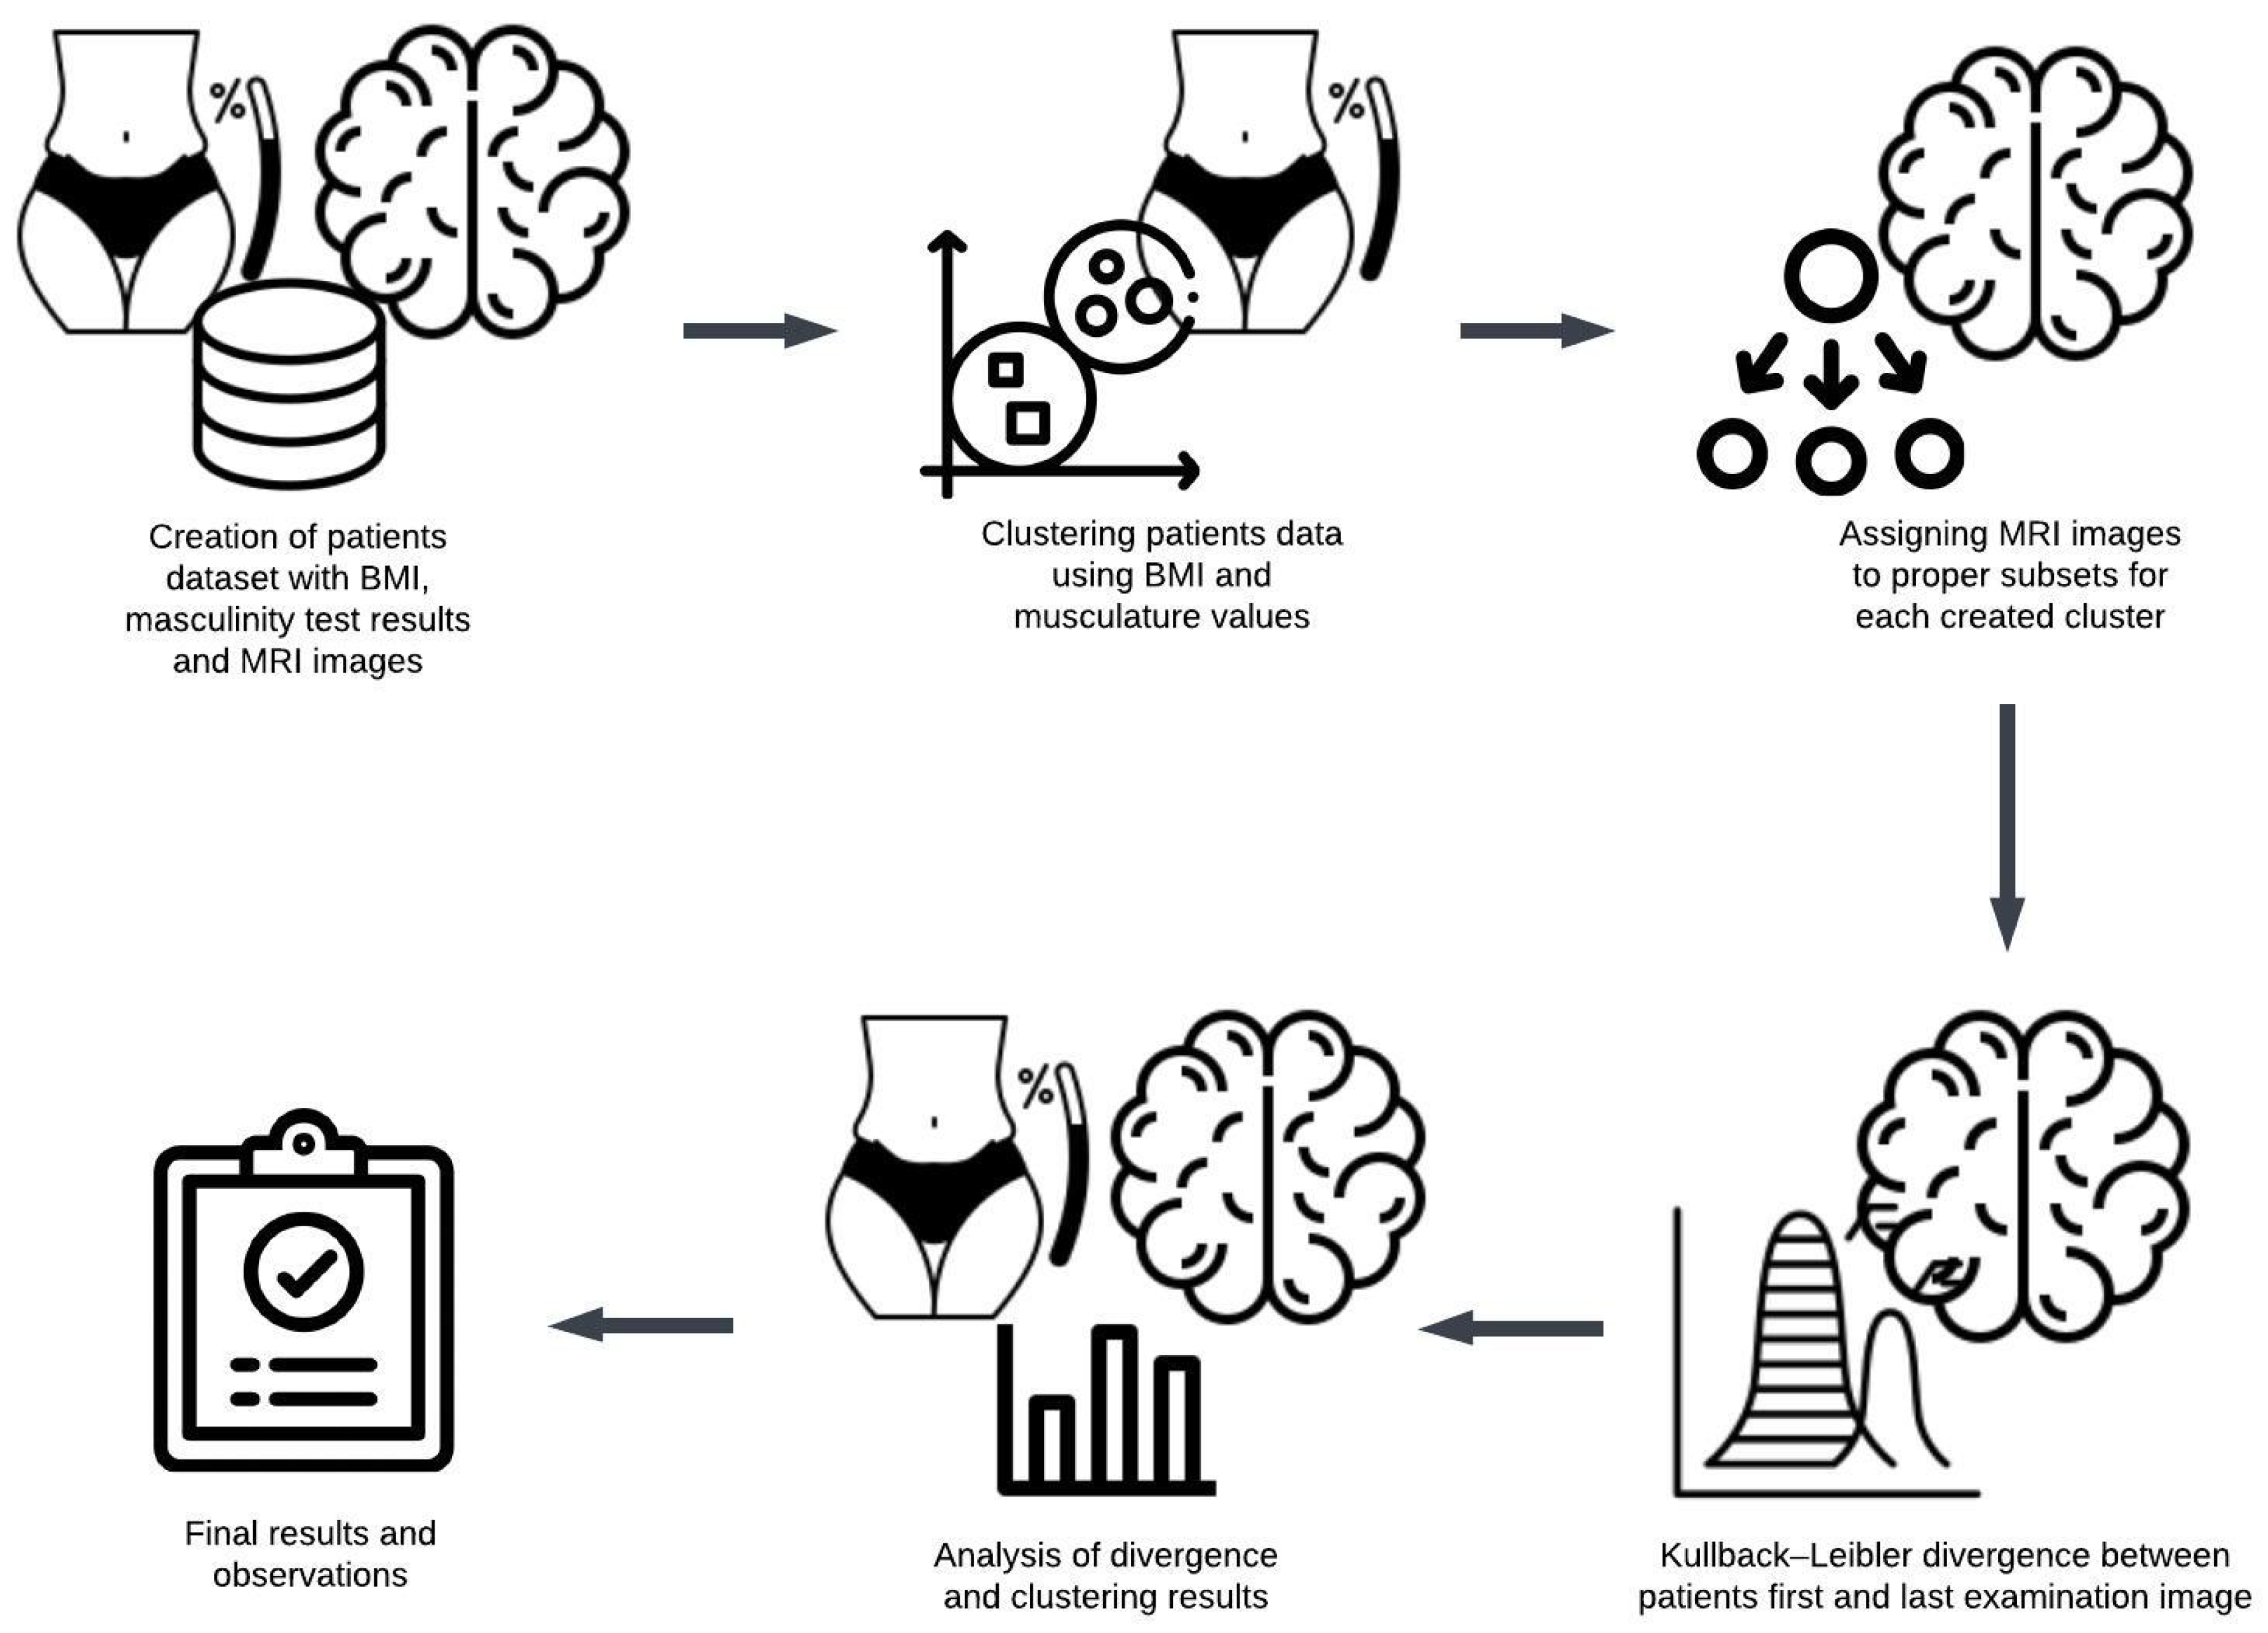
Figure 2.
The results of the silhouette score in different clustering schemas.
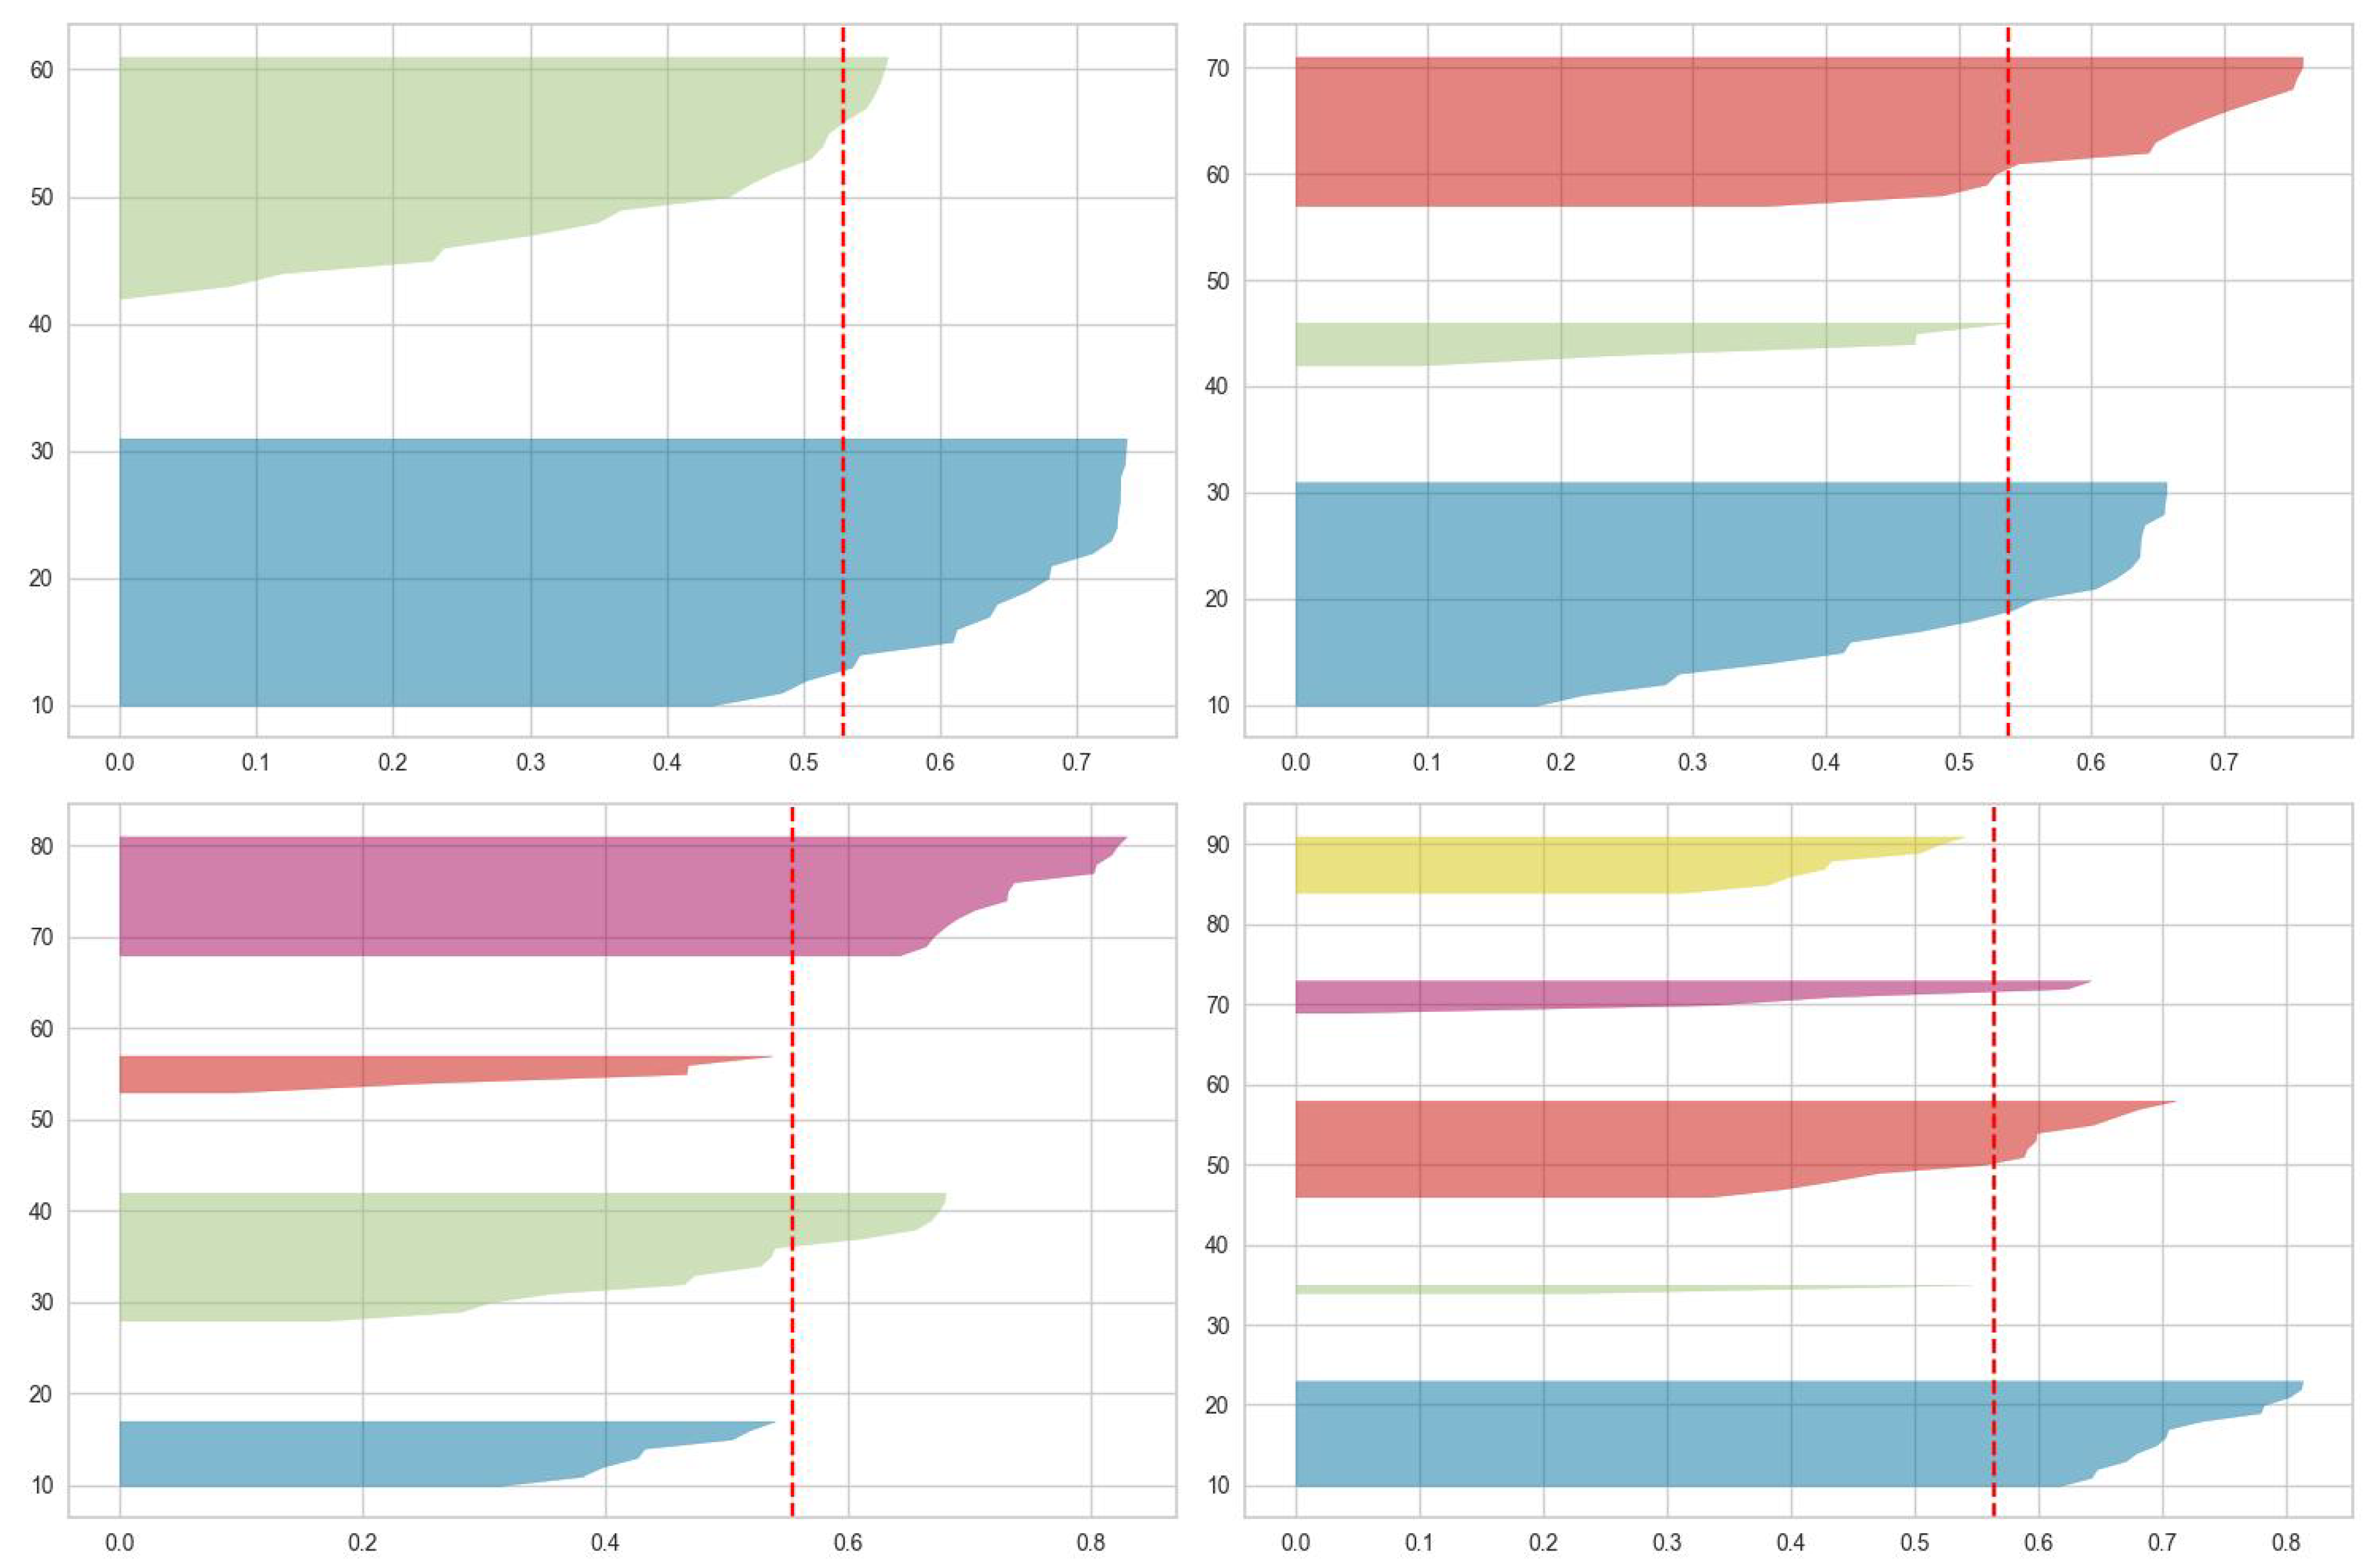
When analyzing the silhouette score about the overall average score of the entire dataset, the optimal number of clusters is two. This is because these clusters are the only ones with a maximum score exceeding the dataset as the whole’s average. For three clusters, one cluster’s score is equal to the average. In the case of four clusters, the scores for two are close enough to warrant consideration. However, when examining five clusters, the scores for two are too low to be significant.
The results derived from the workflow illustrated in Figure 1 are presented in Table 2 for two clusters, Table 3 for three clusters, and Table 4 for four clusters. Each table details the results for individual participants, with the average values for each cluster summarized in the final row.
Figure 3, Figure 4 and Figure 5 illustrate visual representations of the clusters. Each point represents an individual participant, with color intensity corresponding to the calculated Kullback-Leibler divergence value. The results are categorized into five groups based on divergence values:
- -
- divergence values below 0.02 are represented in light green;
- -
- divergence values ranging from 0.02 to less than 0.05 are shown in dark green;
- -
- divergence values between 0.05 and 0.15 are depicted in blue;
- -
- divergence values from 0.15 to less than one are marked in orange;
- -
- divergence values equal to or exceeding one are highlighted in red.
The comparison of patients grouped into two clusters reveals that individuals with a higher Body Mass Index (BMI) exhibit fewer brain changes over time. Moreover, these individuals achieve higher scores on muscle strength assessments.
The analysis of three clusters indicates that patients within the same cluster consistently exhibit higher BMI values and superior muscle test scores. These findings suggest a positive association between elevated BMI and a lower degree of brain changes.
The cluster analysis was extended to encompass four clusters, preserving the subgroup of patients with the lowest BMI and low muscle scores alongside those with higher BMI and superior muscle scores. Within the cohort of patients with average BMI values, individuals with relatively higher BMI were distinguished to form the fourth cluster. Interestingly, according to the divergence measure, this newly formed group demonstrated the most favorable outcomes.
Nevertheless, the classification of patients into separate subgroups showed that those with a moderate BMI and less physical activity exhibited the most significant differences in brain structure. These observations endorse the fact that the combined state of lower BMI and reduced muscle mass is the least beneficial condition for brain changes that occur in dementia or Alzheimer’s disease.
The comparison of results across clusters indicates a positive association between higher Body Mass Index (BMI) scores and a slower progression of structural brain changes. It should be noted that increased physical activity may lead to weight gain during specific lifestyle transitions, particularly following an athletic career, potentially resulting in elevated BMI values [12]. Considering this, alongside the longitudinal trajectory of brain changes, individuals with higher BMI in older age may have engaged in more excellent physical activity during their youth compared to those with lower BMI values.
4. Conclusions
The research aimed to investigate the impact of physical activity on the development of chronic diseases, with a particular focus on brain changes associated with Alzheimer’s disease.
A clustering analysis was performed to group patients into varying numbers of clusters based on data reflecting their physical condition. As the number of clusters increased, a more distinct correlation was observed between physical condition indicators and the progression of brain changes associated with Alzheimer’s disease or dementia.
The results from the two-cluster analysis provided limited insights, as dividing patients into only two groups did not allow for detailed conclusions. Nonetheless, a consistent subgroup of patients was identified from the beginning: this group exhibited the lowest average Body Mass Index (BMI) and predominantly achieved a physical test score of 1. When the data were analyzed using a three-cluster division, the first cluster remained consistent with the grouping from the prior two-cluster analysis. The second cluster included patients with the highest BMI values, who also displayed elevated muscle tissue indices. Comparing the mean Kullback-Leibler divergence values between clusters revealed no statistically significant differences between the lowest and average BMI groups. In contrast, a considerable difference emerged when these two groups were compared with the third cluster, indicating that patients with higher BMI values experienced a slower disease progression.
The final methodology focused on creating four distinct clusters. One of these clusters remained unchanged. During this process, patients were further divided into three clusters, grouping individuals with an average BMI of 28.59 and a muscle index of 2. A subgroup from the original second cluster comprised patients with the highest average BMI. The average Kullback-Leibler measure revealed that participants in this subgroup exhibited the slightest degree of brain tissue changes. Interestingly, participants assigned to the second cluster demonstrated the most unfavorable outcomes.
Analysis of outcomes across varying numbers of clusters revealed a clear differentiation in results. The following methodological steps were carried out to examine the relationship between Body Mass Index (BMI) values and brain alterations observed in MRI scans. This observation corroborates earlier findings of fitting excess weight, which could reduce mortality risk in old age through protective influences against osteoporotic fractures and cognitive decline. Furthermore, higher body weight may serve as an energy reserve, protecting against protein-energy malnutrition. [14].
The concept of "frailty" pertains to the overall health status of older adults. Frailty is theoretically characterized as a clinically identifiable condition marked by heightened vulnerability due to age-related declines in physiological reserve and function across multiple systems, which impair the ability to manage routine or acute stressors [15]. Studies have proposed that excess body weight may protect against mortality in individuals experiencing moderate or severe frailty [16].
The findings suggest that older adults with higher BMI values may have been more active in physical activity during their youth. This hypothesis is reinforced by evidence that resistance training significantly influences body composition and muscle strength in older adults [17]. Since muscle tissue is denser than fat, higher muscle mass can result in an elevated BMI [18]. Within this framework, a higher BMI in older adults is more advantageous than a particularly low BMI.
Considering this assumption, the research findings—based on a comparison of brain tomography images taken at the start and conclusion of the study—highlight inappropriate clustering that reinforces the thesis. Through various clusters, the experiments were able to conduct a closer exploration of possible physical activity levels as inferred from the muscle tissue test values by the participants.
In summary, a high BMI was likely enough to invite neuroanatomical changes analogous to those caused by aging processes typical of Alzheimer’s disease. Studies highlighting the influence of physical activity during youth, combined with an analysis of BMI in older age, further reinforce this thesis.
Future research should explore a more extensive dataset, incorporating a broader range of demographic, clinical, and lifestyle variables to validate the observed relationships between BMI, muscle mass, and neurodegenerative processes. Longitudinal studies with repeated MRI assessments and advanced imaging techniques could provide deeper insights into the temporal dynamics of brain atrophy. Additionally, integrating genetic markers such as APOE-4 status and more detailed physical activity records could enhance the understanding of protective factors against dementia. Developing advanced clustering algorithms and applying deep neural networks may also improve patient stratification and disease progression prediction accuracy. These efforts could contribute to designing more personalized intervention strategies to mitigate cognitive decline in older adults.
Author Contributions
Conceptualization, A.W. and M.K.; methodology, A.W.; software, M.K.; validation, A.W., M.K. and K.Ż.; formal analysis, A.W. and M.K.; investigation, A.W. and K.Ż; resources, A.W. and K.Ż.; data curation, M.K.; writing—original draft preparation, A.W.; writing—review and editing, A.W., M.K. and K.Ż.; visualization, A.W. and M.K.; supervision, M.K.; project administration, A.W.. All authors have read and agreed to the published version of the manuscript.
Funding
This research received no external funding.
Institutional Review Board Statement
Ethical review and approval were waived for this study due to the retrospective nature of the research and the use of anonymized datasets, which do not involve identifiable human participants.
Informed Consent Statement
Written informed consent has been obtained from the patients to publish this paper.
Data Availability Statement
https://adni.loni.usc.edu/data-samples/adni-data/ (accessed on 20 November 2024).
Acknowledgments
Not applicable.
Conflicts of Interest
The authors declare no conflicts of interest.
References
- Yu, F.; Vock, D.M.; Zhang, L.; Salisbury, D.; Nelson, N.W.; Chow, L.S.; Smith, G.; Barclay, T.R.; Dysken, M.; Wyman, J.F. Cognitive Effects of Aerobic Exercise in Alzheimer’s Disease: A Pilot Randomized Controlled Trial. Journal of Alzheimer’s Disease 2021, 80, 233–244. Available online: https://pubmed.ncbi.nlm.nih.gov/33523004/ (accessed on 5 November 2024).
- Schmidt-Kassow, M.; Kulka, A.; Gunter, T.C.; Rothermich, K.; Kotz, S.A. Aerobic Exercise for Alzheimer’s Disease: A Randomized Controlled Pilot Trial. Alzheimer’s Research & Therapy 2017, 9, 53–60. Available online: https://www.ncbi.nlm.nih.gov/pmc/articles/PMC5302785/ (accessed on 5 November 2024).
- Williams, C.; Brown, M. Interactive Effects of Physical Activity and APOE-4 on White Matter Tract Diffusivity in Healthy Elders. Neurobiology of Aging 2018, 45, 72–82. Available online: https://www.ncbi.nlm.nih.gov/pmc/articles/PMC4746115/ (accessed on 5 November 2024).
- Mat Ludin, A.F.; Ahmad, Z. The Relationship between Physical Activity, Body Mass Index, and Body Composition among Students at a Pre-University Centre in Malaysia. Journal of Health and Fitness 2020. Available online: https://www.researchgate.net/publication/346450737 (accessed on 5 November 2024).
- Thompson, S.; Green, O. Lifestyle and Neurocognition in Older Adults with Cognitive Impairments: A Randomized Trial. Neurology Journal 2019, 92, e212–e220. Available online: https://n.neurology.org/content/92/3/e212 (accessed on 5 November 2024).
- Shalabi, K.M.; AlSharif, Z.A.; Alrowaishd, S.A.; Al Ali, R.E. Relationship between Body Mass Index and Health-Related Physical Fitness: A Cross-Sectional Study. European Review for Medical and Pharmacological Sciences 2023, 27, 9540–9549. Available online: https://www.europeanreview.org/wp/wp-content/uploads/9540-9549.pdf (accessed on 5 November 2024).
- Kullback, S.; Leibler, R.A. On Information and Sufficiency. The Annals of Mathematical Statistics 1951, 22, 79–86.
- Cover, T.M.; Thomas, J.A. Elements of Information Theory, 2nd ed.; John Wiley & Sons: Hoboken, NJ, USA, 2006.
- Alzheimer’s Disease Neuroimaging Initiative (ADNI). Available online: https://adni.loni.usc.edu/data-samples/adni-data/ (accessed on 20 November 2024).
- Tryon, R.C. Cluster Analysis; Edwards Brothers: Ann Arbor, MI, USA, 1939.
- Dalmaijer, E.S.; Nord, C.L.; Astle, D.E. Statistical Power for Cluster Analysis. BMC Bioinformatics 2022, 23, 205. Available online: https://doi.org/10.1186/s12859-022-04675-1 (accessed on 22 November 2024). [CrossRef]
- Buckley, G.L.; Hall, L.E.; Lassemillante, A.-C.M.; Ackerman, K.E.; Belski, R. Retired Athletes and the Intersection of Food and Body: A Systematic Literature Review Exploring Compensatory Behaviours and Body Change. Nutrients 2019, 11, 1395. Available online: https://doi.org/10.3390/nu11061395 (accessed on 27 November 2024). [CrossRef]
- Soleimani, R.; Guo, S.; Haley, K.L.; Jacks, A.; Lobaton, E. The Impact of Pause and Filler Word Encoding on Dementia Detection with Contrastive Learning. Applied Sciences 2024, 14, 8879. Available online: https://doi.org/10.3390/app14198879 (accessed on 2 December 2024). [CrossRef]
- Leigh, L.; Byles, J.E.; Jagger, C. BMI and Healthy Life Expectancy in Old and Very Old Women. British Journal of Nutrition 2016, 116, 692–699. Available online: https://doi.org/10.1017/S0007114516002403 (accessed on 11 December 2024). [CrossRef]
- Xue, Q.L. The Frailty Syndrome: Definition and Natural History. Clinical Geriatrics Medicine 2011, 27, 1–15. Available online: https://doi.org/10.1016/j.cger.2010.08.009 (accessed on 11 December 2024). [CrossRef]
- Jayanama, K.; Theou, O.; Godin, J.; Mayo, A.; Cahill, L.; Rockwood, K. Relationship of Body Mass Index with Frailty and All-Cause Mortality Among Middle-Aged and Older Adults. BMC Medicine 2022, 20, 404. Available online: https://doi.org/10.1186/s12916-022-02596-7 (accessed on 11 December 2024). [CrossRef]
- Choi, Y.; Kim, D.; Kim, S.K. Effects of Physical Activity on Body Composition, Muscle Strength, and Physical Function in Old Age: Bibliometric and Meta-Analyses. Healthcare 2024, 12, 197. Available online: https://doi.org/10.3390/healthcare12020197 (accessed on 11 December 2024). [CrossRef]
- Prior, B.M.; Modlesky, C.M.; Evans, E.M.; Sloniger, M.A.; Saunders, M.J.; Lewis, R.D.; Cureton, K.J. Muscularity and the Density of the Fat-Free Mass in Athletes. Journal of Applied Physiology 2001, 90, 1523–1531. Available online: https://doi.org/10.1152/jappl.2001.90.4.1523 (accessed on 11 December 2024). [CrossRef]
- Murtagh, F.; Contreras, P. Algorithms for Hierarchical Clustering: An Overview. Wiley Interdisciplinary Reviews: Data Mining and Knowledge Discovery 2012, 2, 86–97. Available online: https://doi.org/10.1002/ widm.53 (accessed on 11 December 2024). [CrossRef]
- Ester, M.; Kriegel, H.-P.; Sander, J.; Xu, X. A Density-Based Algorithm for Discovering Clusters in Large Spatial Databases with Noise. In Proceedings of the Second International Conference on Knowledge Discovery and Data Mining; AAAI Press: Portland, OR, USA, 1996; pp. 226–231.
- Fraley, C.; Raftery, A.E. Model-Based Clustering, Discriminant Analysis, and Density Estimation. Journal of the American Statistical Association 2002, 97, 611–631. Available online: https://doi.org/10.1198/0162145027 60047131 (accessed on 11 December 2024). [CrossRef]
- Arthur, D.; Vassilvitskii, S. k-Means++: The Advantages of Careful Seeding. In Proceedings of the Eighteenth Annual ACM-SIAM Symposium on Discrete Algorithms; Society for Industrial and Applied Mathematics: New Orleans, LA, USA, 2007; pp. 1027–1035.
- Binabaji, S.; Rahimi, M.; Rajabi, H.; et al. Effects of Physical Training on Coagulation Parameters, Interleukin-6, and Angiotensin-Converting Enzyme-2 in COVID-19 Survivors. Scientific Reports 2024, 14, 18968. Available online: https://doi.org/10.1038/s41598-024-67522-8 (accessed on 11 December 2024). [CrossRef]
- Lee, J.; Kang, J.; Park, C.-S.; Jeong, J. Distributed Fire Classification and Localization Model Based on Federated Learning with Image Clustering. Applied Sciences 2024, 14, 9162. Available online: https://doi. org/10.3390/app14209162 (accessed on 11 December 2024). [CrossRef]
- Bonnici, V. A Maximum Value for the Kullback–Leibler Divergence between Quantized Distributions. Information 2024, 15, 547. Available online: https://doi.org/10.3390/info15090547 (accessed on 11 December 2024). [CrossRef]
- Cardona, M.I.; Weißenborn, M.; Zöllinger, I.; Kroeber, E.S.; Bauer, A.; Luppa, M.; Pabst, A.; Czock, D.; König, H.-H.; Wiese, B.; et al. Physical Activity Determinants in Older German Adults at Increased Dementia Risk with Multimorbidity: Baseline Results of the AgeWell.de Study. International Journal of Environmental Research and Public Health 2022, 19, 3164. Available online: https://doi.org/10.3390/ijerph19063164 (accessed on 11 December 2024). [CrossRef]
- Bowes, A.; Dawson, A.; Jepson, R.; et al. Physical Activity for People with Dementia: A Scoping Study. BMC Geriatrics 2013, 13, 129. Available online: https://doi.org/10.1186/1471-2318-13-129 (accessed on 11 December 2024). [CrossRef]
- Schardt, D. Walk This Way, Please: 7 Reasons To Lace Up Your Sneakers. Nutrition Action Health Letter 2015, 42, 1–6.
- Ma, Y.; Sui, D.; Yang, S.; Fang, N.; Wang, Z. Application of the (fr)AGILE Scale in the Evaluation of Multidimensional Frailty in Elderly Inpatients from Internal Medicine Wards: A Cross-Sectional Observational Study. Frontiers in Aging Neuroscience 2024, 15, 1276250. Available online: https://doi.org/10.3389/fnagi.20 23.1276250 (accessed on 11 December 2024). [CrossRef]
- Nawa, V.; Nadarajah, S. Exact Expressions for Kullback–Leibler Divergence for Univariate Distributions. Entropy 2024, 26, 959. Available online: https://doi.org/10.3390/e26110959 (accessed on 11 December 2024). [CrossRef]
Figure 3.
The visual representation of the experimental research results for two clusters.
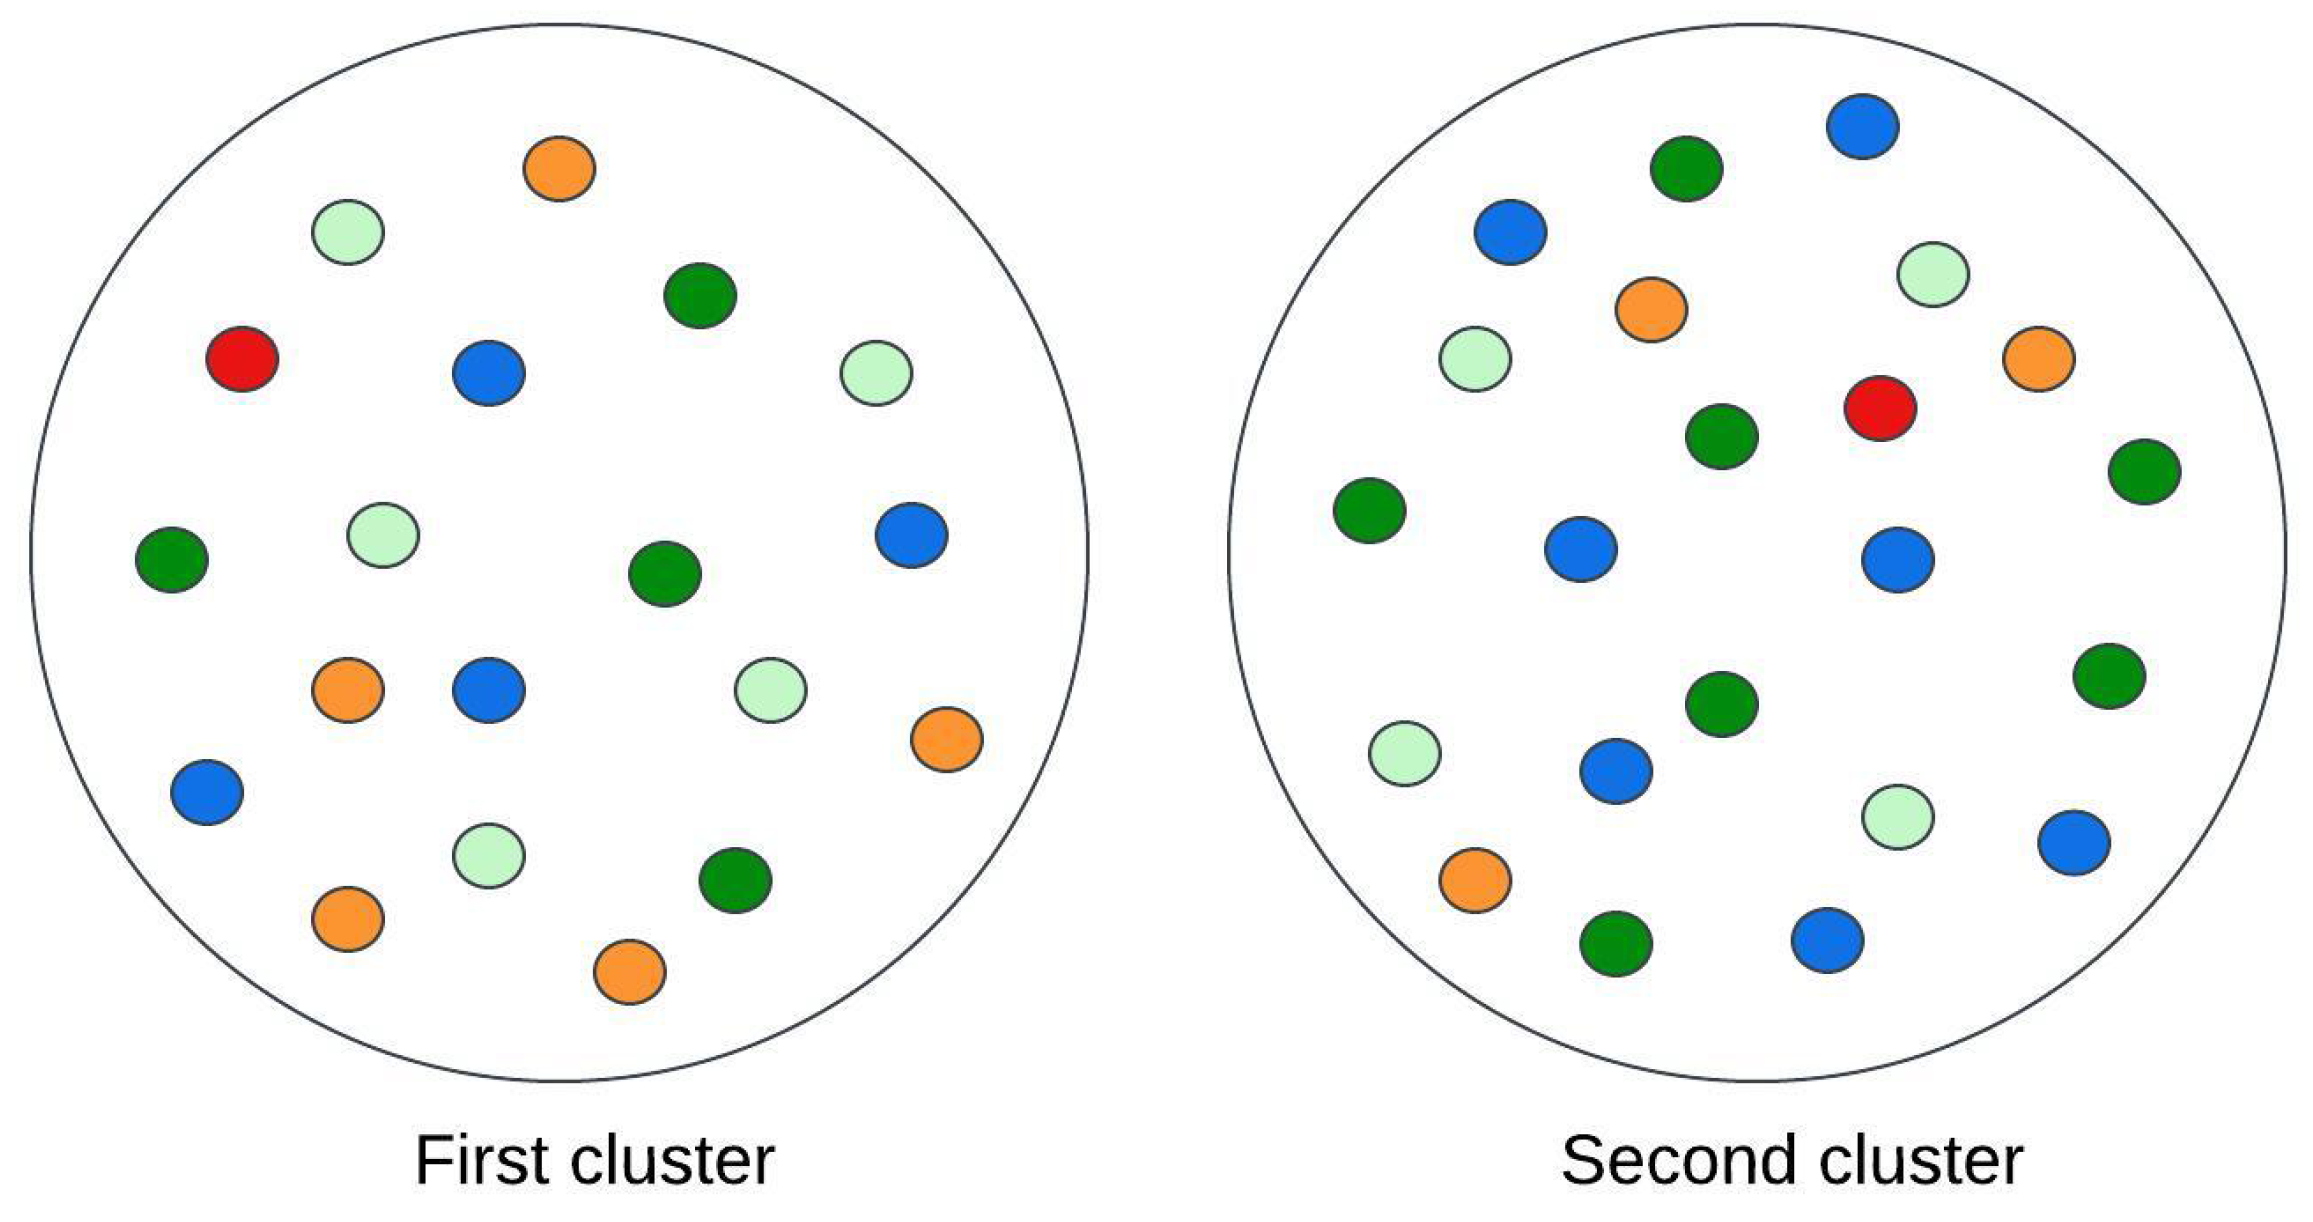
Figure 4.
The visual representation of the experimental research results for three clusters.
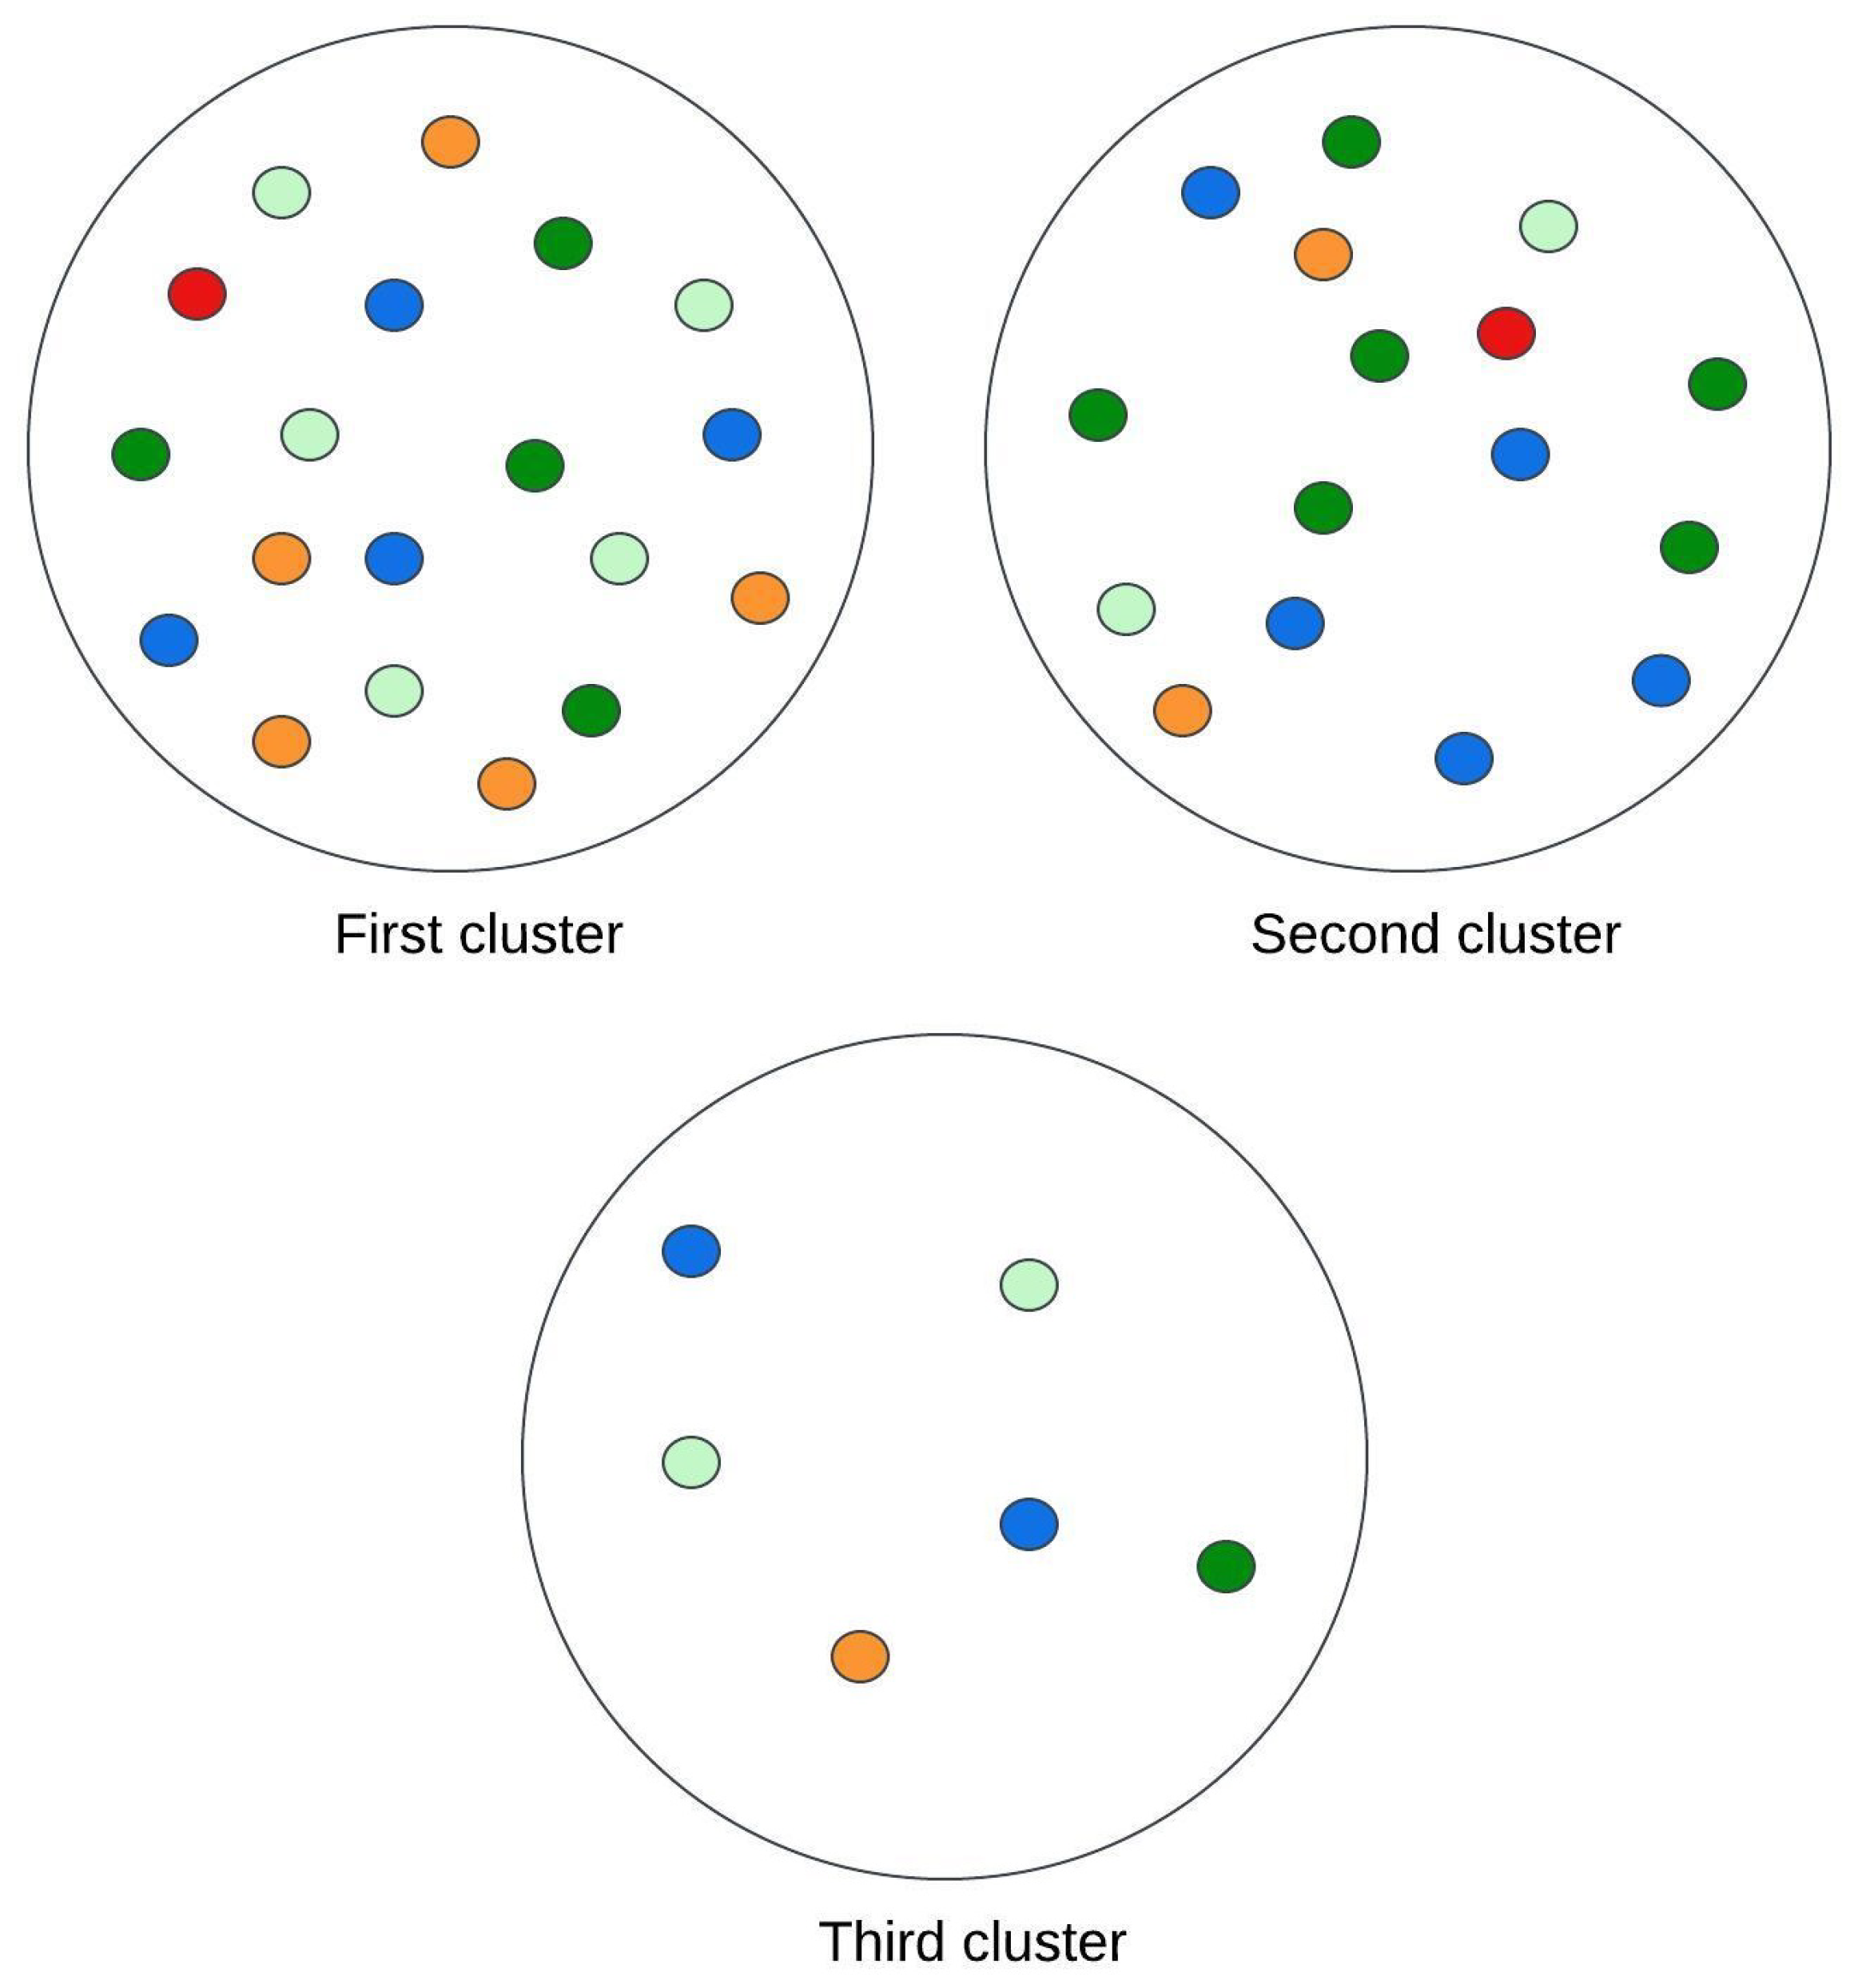
Figure 5.
The visual representation of the experimental research results for four clusters.
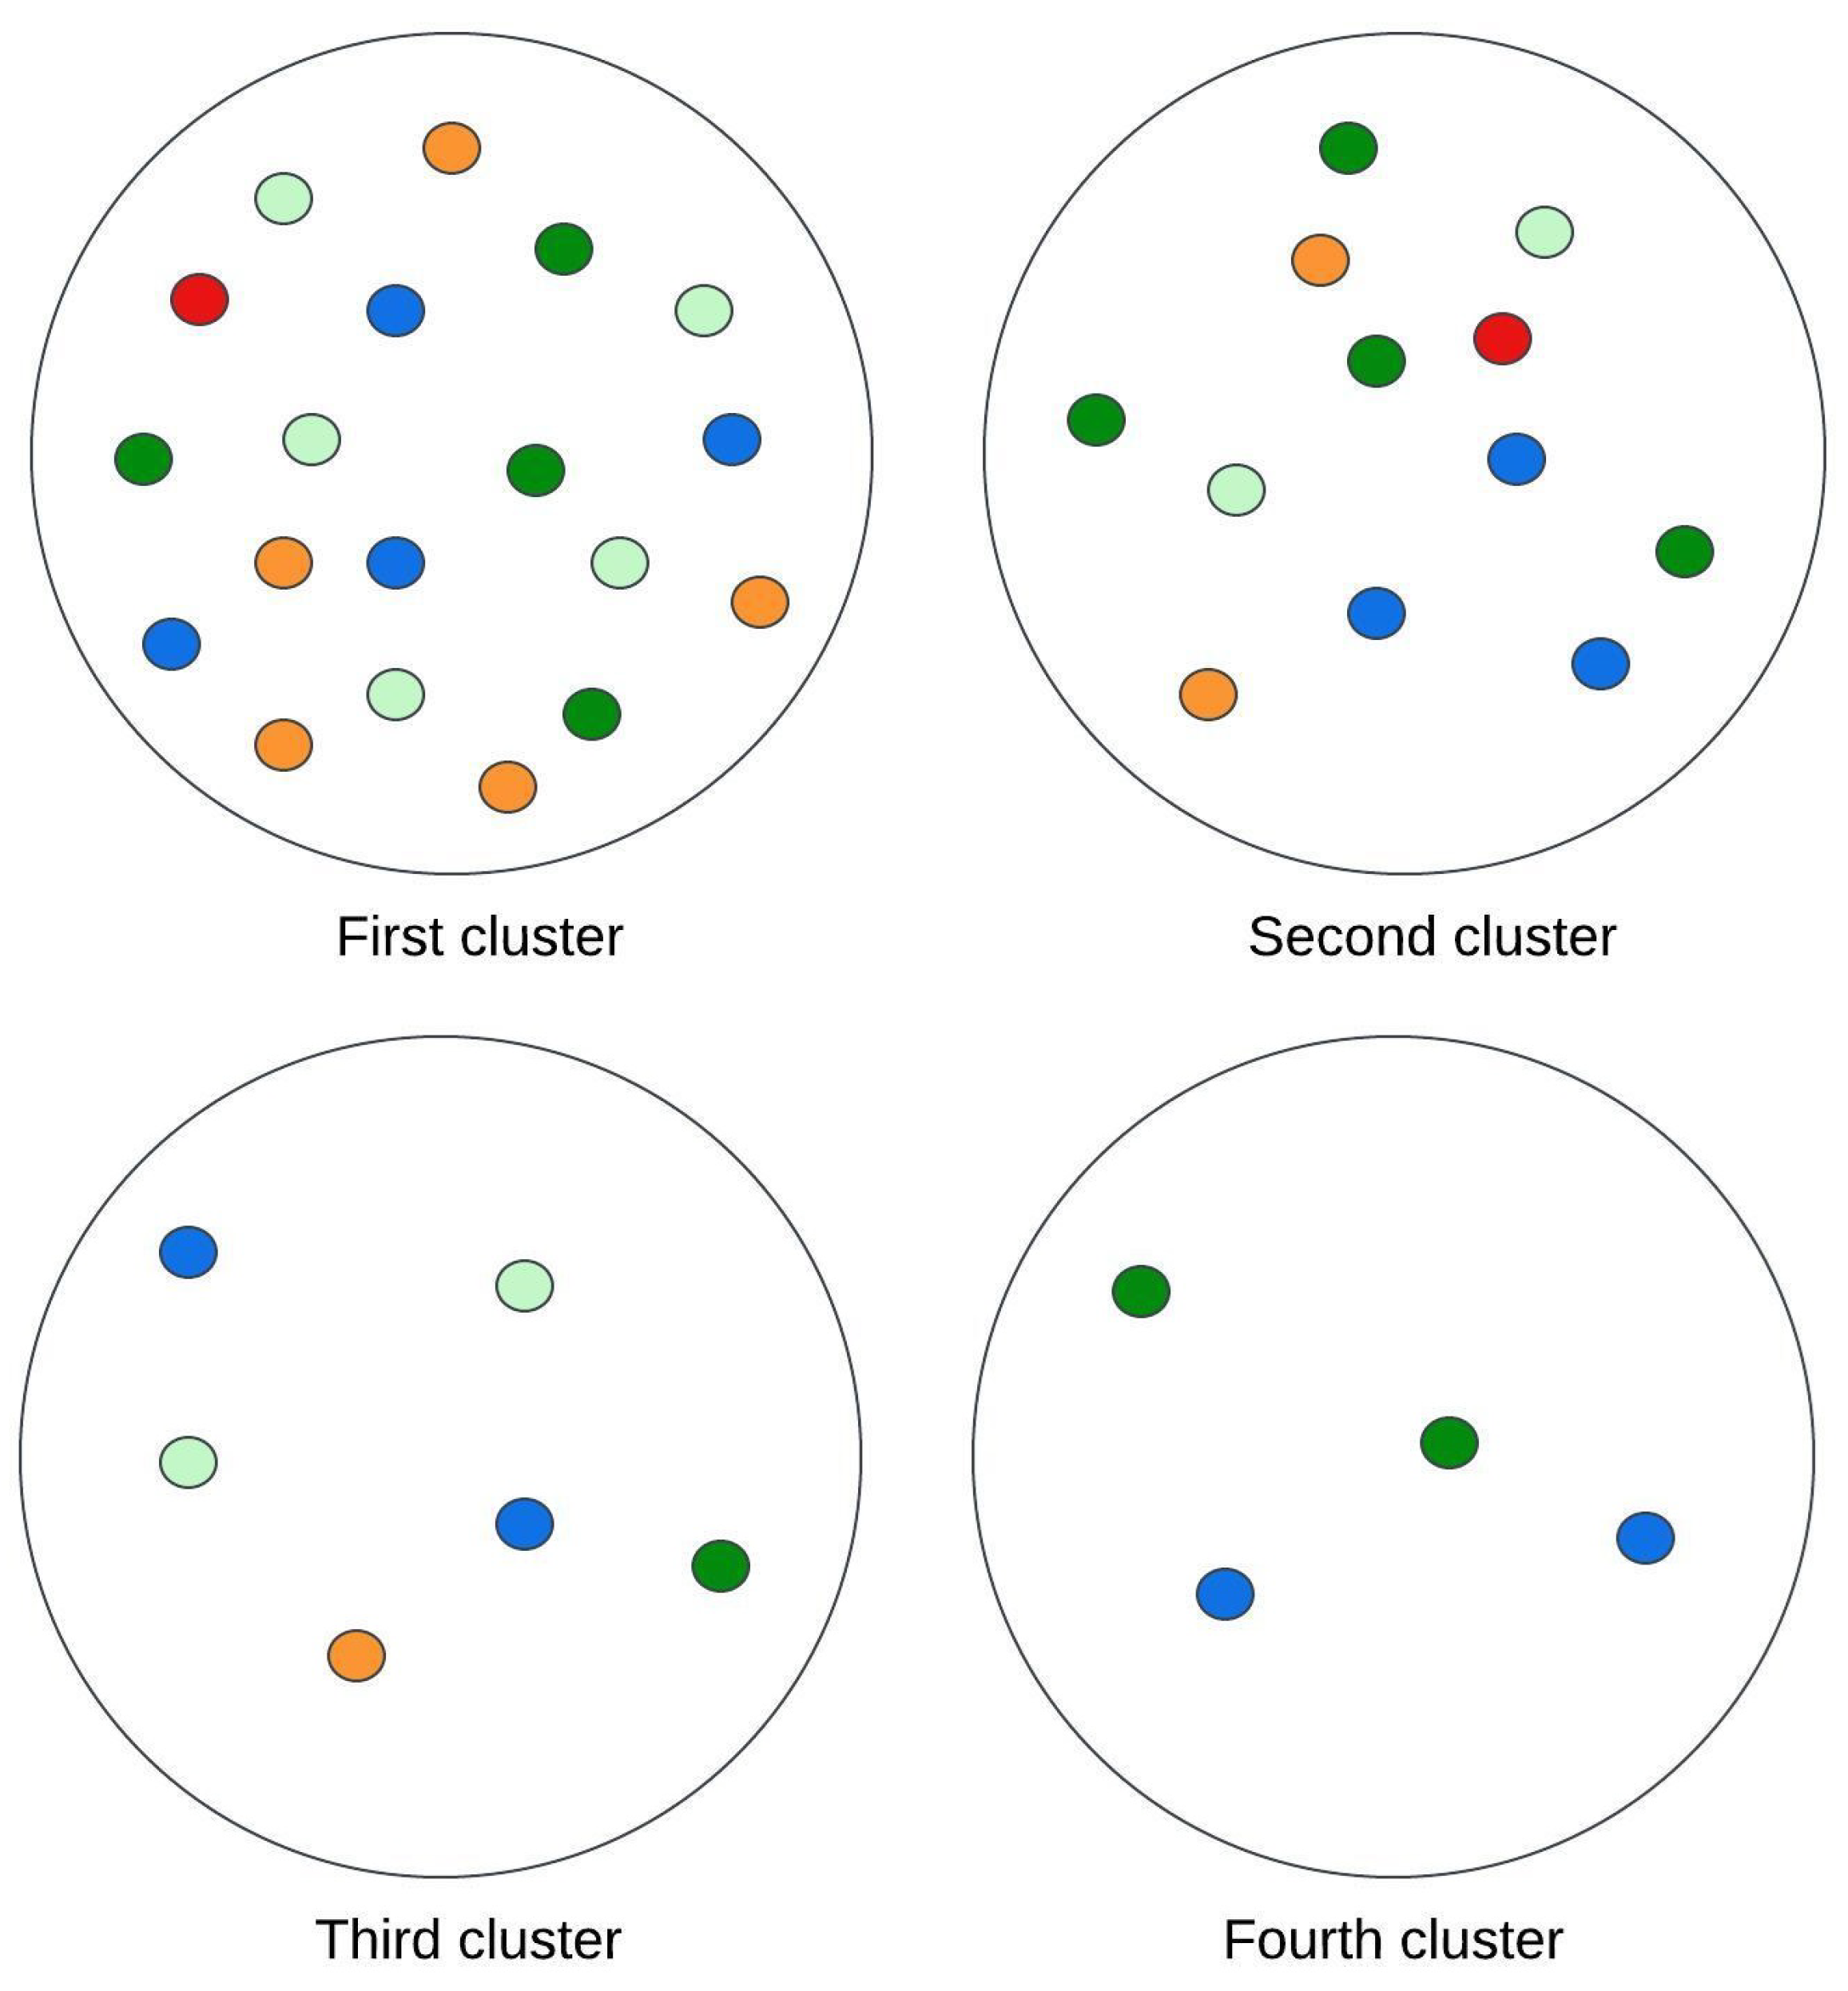

Table 1.
Silhouette scores for clustering schemas with two, three, four, and five clusters.
| Two clusters | Three clusters | Four clusters | Five clusters | ||||
|---|---|---|---|---|---|---|---|
| Avg. score | Max score | Avg. score | Max score | Avg. score | Max score | Avg. score | Max score |
| 0.6502 | 0.7357 | 0.5118 | 0.6569 | 0.4391 | 0.5397 | 0.7193 | 0.8126 |
| 0.3950 | 0.5613 | 0.3627 | 0.5378 | 0.5079 | 0.6799 | 0.3887 | 0.5460 |
| 0.6352 | 0.7596 | 0.3627 | 0.5378 | 0.5580 | 0.7100 | ||
| 0.7369 | 0.8290 | 0.4152 | 0.6417 | ||||
| 0.4391 | 0.5397 | ||||||
| 0.5287 | 0.5382 | 0.5538 | 0.5641 | ||||
Table 2.
Overview of BMI, muscle test values, and Kullback-Leibler divergence results, including average values calculated across two clusters.
Table 2.
Overview of BMI, muscle test values, and Kullback-Leibler divergence results, including average values calculated across two clusters.
| First cluster | Second cluster | ||||
|---|---|---|---|---|---|
| BMI | Muscle | Divergence | BMI | Muscle | Divergence |
| 24.98 | 1 | 0.00136 | 27.66 | 1 | 0.05977 |
| 22.6 | 1 | 0.02796 | 26.26 | 2 | 0.06558 |
| 17.71 | 2 | 0.05187 | 28.59 | 2 | 0.01234 |
| 21.3 | 1 | 0.03948 | 30.41 | 1 | 0.03011 |
| 23.82 | 1 | 0.02492 | 30.1 | 1 | 0.05837 |
| 24.74 | 1 | 0.01155 | 26.46 | 1 | 0.02117 |
| 22.65 | 1 | 0.01257 | 35.93 | 1 | 0.02827 |
| 24.75 | 1 | 1.53896 | 27.5 | 1 | 0.03298 |
| 24.99 | 1 | 0.65867 | 33.37 | 2 | 0.01563 |
| 22.67 | 1 | 0.00483 | 27.9 | 1 | 0.00188 |
| 21.87 | 1 | 0.37601 | 27.38 | 2 | 0.20965 |
| 23.97 | 1 | 0.08842 | 25.12 | 1 | 0.45746 |
| 23.89 | 1 | 0.07241 | 26.07 | 1 | 0.04343 |
| 23.77 | 1 | 0.04603 | 27.29 | 1 | 0.1067 |
| 22.32 | 1 | 0.3091 | 31.37 | 1 | 0.10691 |
| 24.37 | 1 | 0.0068 | 27.44 | 1 | 0.07368 |
| 22.59 | 1 | 0.14368 | 29.05 | 2 | 0.10412 |
| 23.83 | 1 | 0.18746 | 26.63 | 1 | 0.03395 |
| 24.48 | 1 | 0.21873 | 26.19 | 1 | 0.15898 |
| 24.61 | 1 | 0.01618 | 26.47 | 1 | 0.00457 |
| 26.86 | 2 | 0.03252 | |||
| 25.08 | 1 | 1.41732 | |||
| 23.3 | 1.05 | 0.19185 | 28.14 | 1.27 | 0.13979 |
Table 3.
Overview of BMI, muscle test values, and Kullback-Leibler divergence results, including average values calculated across three clusters.
Table 3.
Overview of BMI, muscle test values, and Kullback-Leibler divergence results, including average values calculated across three clusters.
| First cluster | Second cluster | Third cluster | ||||||
|---|---|---|---|---|---|---|---|---|
| BMI | Muscle | Div. | BMI | Muscle | Div. | BMI | Muscle | Div. |
| 24.98 | 1 | 0.00136 | 27.66 | 1 | 0.05977 | 26.26 | 2 | 0.06558 |
| 22.6 | 1 | 0.02796 | 30.41 | 1 | 0.03011 | 28.59 | 2 | 0.01234 |
| 17.71 | 2 | 0.05187 | 30.1 | 1 | 0.05837 | 33.37 | 2 | 0.01563 |
| 21.3 | 1 | 0.03948 | 26.46 | 1 | 0.02117 | 27.38 | 2 | 0.20965 |
| 23.82 | 1 | 0.02492 | 35.93 | 1 | 0.02827 | 29.05 | 2 | 0.10412 |
| 24.74 | 1 | 0.01155 | 27.5 | 1 | 0.03298 | 26.86 | 2 | 0.03252 |
| 22.65 | 1 | 0.01257 | 27.9 | 1 | 0.00188 | |||
| 24.75 | 1 | 1.53896 | 25.12 | 1 | 0.45746 | |||
| 24.99 | 1 | 0.65867 | 26.07 | 1 | 0.04343 | |||
| 22.67 | 1 | 0.00483 | 27.29 | 1 | 0.1067 | |||
| 21.87 | 1 | 0.37601 | 31.37 | 1 | 0.10691 | |||
| 23.97 | 1 | 0.08842 | 27.44 | 1 | 0.07368 | |||
| 23.89 | 1 | 0.07241 | 26.63 | 1 | 0.03395 | |||
| 23.77 | 1 | 0.04603 | 26.19 | 1 | 0.15898 | |||
| 22.32 | 1 | 0.3091 | 26.47 | 1 | 0.00457 | |||
| 24.37 | 1 | 0.0068 | 25.08 | 1 | 1.41732 | |||
| 22.59 | 1 | 0.14368 | ||||||
| 23.83 | 1 | 0.18746 | ||||||
| 24.48 | 1 | 0.21873 | ||||||
| 24.61 | 1 | 0.01618 | ||||||
| 23.3 | 1.05 | 0.19185 | 27.98 | 1 | 0.16472 | 28.59 | 2 | 0.07331 |
Table 4.
Overview of BMI, muscle test values, and Kullback-Leibler divergence results, including average values calculated across four clusters.
Table 4.
Overview of BMI, muscle test values, and Kullback-Leibler divergence results, including average values calculated across four clusters.
| First cluster | Second cluster | Third cluster | Fourth cluster | ||||||||
|---|---|---|---|---|---|---|---|---|---|---|---|
| BMI | Musc. | Div. | BMI | Musc. | Div. | BMI | Musc. | Div. | BMI | Musc. | Div. |
| 24.98 | 1 | 0.00136 | 27.66 | 1 | 0.05977 | 26.26 | 2 | 0.06558 | 30.41 | 1 | 0.03011 |
| 22.6 | 1 | 0.02796 | 26.46 | 1 | 0.02117 | 28.59 | 2 | 0.01234 | 30.1 | 1 | 0.05837 |
| 17.71 | 2 | 0.05187 | 27.5 | 1 | 0.03298 | 33.37 | 2 | 0.01563 | 35.93 | 1 | 0.02827 |
| 21.3 | 1 | 0.03948 | 27.9 | 1 | 0.00188 | 27.38 | 2 | 0.20965 | 31.37 | 1 | 0.10691 |
| 23.82 | 1 | 0.02492 | 25.12 | 1 | 0.45746 | 29.05 | 2 | 0.10412 | |||
| 24.74 | 1 | 0.01155 | 26.07 | 1 | 0.04343 | 26.86 | 2 | 0.03252 | |||
| 22.65 | 1 | 0.01257 | 27.29 | 1 | 0.1067 | ||||||
| 24.75 | 1 | 1.53896 | 27.44 | 1 | 0.07368 | ||||||
| 24.99 | 1 | 0.65867 | 26.63 | 1 | 0.03395 | ||||||
| 22.67 | 1 | 0.00483 | 26.19 | 1 | 0.15898 | ||||||
| 21.87 | 1 | 0.37601 | 26.47 | 1 | 0.00457 | ||||||
| 23.97 | 1 | 0.08842 | 25.08 | 1 | 1.41732 | ||||||
| 23.89 | 1 | 0.07241 | |||||||||
| 23.77 | 1 | 0.04603 | |||||||||
| 22.32 | 1 | 0.3091 | |||||||||
| 24.37 | 1 | 0.0068 | |||||||||
| 22.59 | 1 | 0.14368 | |||||||||
| 23.83 | 1 | 0.18746 | |||||||||
| 24.48 | 1 | 0.21873 | |||||||||
| 24.61 | 1 | 0.01618 | |||||||||
| 23.3 | 1.05 | 0.19185 | 26.65 | 1 | 0.20099 | 28.59 | 2 | 0.07331 | 31.95 | 1 | 0.05592 |
Disclaimer/Publisher’s Note: The statements, opinions and data contained in all publications are solely those of the individual author(s) and contributor(s) and not of MDPI and/or the editor(s). MDPI and/or the editor(s) disclaim responsibility for any injury to people or property resulting from any ideas, methods, instructions or products referred to in the content. |
© 2024 by the authors. Licensee MDPI, Basel, Switzerland. This article is an open access article distributed under the terms and conditions of the Creative Commons Attribution (CC BY) license (http://creativecommons.org/licenses/by/4.0/).
Copyright: This open access article is published under a Creative Commons CC BY 4.0 license, which permit the free download, distribution, and reuse, provided that the author and preprint are cited in any reuse.


