
Submitted:
25 July 2025
Posted:
30 July 2025
You are already at the latest version
Abstract
Background/Objectives: Frailty is a well-established risk factor for cognitive decline and dementia, yet how its distinct physical, functional, and psychosocial components relate to brain health in Alzheimer’s disease (AD) remains poorly understood. This proof-of-concept study aimed to identify data-driven frailty factors and examine their cross-sectional associations with cognition and brain structure in biomarker-confirmed AD. Methods: Forty-eight adults with amyloid-β (Aβ)-positive AD underwent comprehensive clinical assessments, neuropsychological testing, dual-energy X-ray absorptiometry, and 3.0T magnetic resonance imaging of the brain. Exploratory factor analysis (EFA) was applied to characterize the underlying structure of physical (body composition measures), functional (performance-based metrics), and psychosocial (patient-reported outcomes) frailty domains. Multiple linear regression analysis was used to examine associations between extracted frailty factors and cognition (memory and executive function) and neuroanatomy (total gray matter and hippocampal volumes), adjusting for age, sex, education, APOE4 status, and total intracranial volume. Results: EFA revealed eight distinct frailty factors. Psychological distress was associated with worse memory (p=0.02) and smaller hippocampal volume (p=0.05). Physical and social limitations were associated with smaller total gray matter volume (p=0.03). Cognitive-motor dual-task performance was associated with superior executive functioning (p=0.002) and larger total gray matter volume (p=0.01). Lean mass was associated with larger hippocampal volume (p=0.0004). Conclusions: Distinct frailty factors exhibited specific cognitive and neuroanatomical signatures in AD. These preliminary findings underscore the multifaceted nature of frailty and suggest unique mechanistic pathways through which it may influence brain health. Larger longitudinal studies are warranted to validate these results and inform clinically relevant interventions.
Keywords:
Alzheimer’s disease
; β-amyloid
; frailty
; cognitive performance
; memory
; executive function
; brain structure
; hippocampus
; neurodegeneration
; exploratory factor analysis
1. Introduction
Alzheimer’s disease (AD) is a progressive, age-related neurodegenerative disorder and the leading cause of dementia worldwide [1]. An estimated 416 million people—nearly one in five adults aged 50 and older—are currently living with AD across its preclinical, prodromal, and dementia stages [2]. As global populations age rapidly, AD poses one of the most formidable health, economic, and societal challenges of the 21st century.
Neuropathologically, AD is characterized by the extracellular accumulation of amyloid-β (Aβ) peptides and the intracellular aggregation of hyperphosphorylated tau into neurofibrillary tangles [3,4]. These processes begin decades before the onset of clinical symptoms, offering a critical window for early detection and targeted intervention [5,6]. However, despite substantial progress in biomarker development and biologically-based diagnostic frameworks, predicting the clinical and neurobiological manifestations of AD remains a major challenge. Patients with AD exhibit considerable heterogeneity in their cognitive symptoms, neuroimaging features, and longitudinal trajectories [7,8,9]. Large clinicopathological studies have revealed that Aβ and tau account for only a fraction of this variability, indicating that other factors likely modulate disease expression [10,11,12,13].
Frailty—broadly defined as a state of diminished homeostatic reserve resulting in heightened vulnerability to stressors [14,15,16]—offers a valuable framework for understanding the interindividual variability observed in AD. Higher frailty scores have been linked to numerous adverse health outcomes, such as falls, disability, hospitalization, and death [17,18]. Frailty and AD frequently co-occur [19,20] and share several common pathophysiological mechanisms, including chronic inflammation, mitochondrial dysfunction, and cellular senescence [21,22]. Furthermore, postmortem [23] and in vivo [24,25] studies suggest that frailty status may moderate the relationship between neuropathology and cognitive dysfunction.
Two conceptual models have traditionally guided frailty assessment. The Physical Phenotype model defines frailty as the presence of three or more of five specific criteria: unintentional weight loss, weakness, exhaustion, slow gait, and low physical activity [15]. In contrast, the Accumulation of Deficits model quantifies frailty as the proportion of health deficits accrued across multiple domains, yielding a continuous Frailty Index [26,27]. While both models have significantly advanced the field, each has limitations for AD research [28,29]. The Physical Phenotype model focuses narrowly on physical characteristics, potentially overlooking non-physical vulnerabilities (e.g., neuropsychiatric symptoms, social isolation) that commonly accompany or precede physical decline in AD [30]. The Accumulation of Deficits approach combines diverse variables into a single summary score, potentially obscuring the distinct contributions of specific frailty components to cognitive and neurobiological outcomes [31,32].
Frailty is increasingly recognized as a multidimensional construct with physical, functional, and psychosocial dimensions [33,34]. This perspective aligns with systems-based approaches to aging, which emphasize the dynamic interplay of biological, behavioral, and environmental factors in shaping health trajectories [35,36,37]. However, most AD research has utilized unidimensional or composite frailty measures, and relatively few studies have investigated how specific subdomains of frailty may relate to particular cognitive domains or brain structures [38,39,40].
Rather than relying on pre-existing frameworks, this proof-of-concept study employed exploratory factor analysis to characterize the latent structure underlying 25 interrelated clinical variables spanning these frailty domains. We then examined how these empirically-derived factors related to domain-specific cognitive performance (memory and executive function) and brain volumes (hippocampus and total gray matter) in patients with early AD. We hypothesized that this data-driven approach would reveal distinct frailty phenotypes with dissociable relationships to cognitive and neuroanatomical measures, reflecting different underlying mechanisms of vulnerability in AD. These insights may advance our understanding of body–brain interactions and support the development of personalized strategies for AD assessment, prevention, and care.
2. Materials and Methods
2.1. Participants
We conducted a cross-sectional analysis using baseline data from the first 48 participants enrolled in the Precision Recommendations for Environmental Variables, Exercise, Nutrition and Training Interventions to Optimize Neurocognition (PREVENTION) study (ClinicalTrials.gov Identifier: NCT04082611). PREVENTION is a 12-month randomized controlled trial evaluating the effects of a personalized, multimodal brain health coaching program in individuals with early AD. The WIRB-Copernicus Group Institutional Review Board (WCG® IRB) approved the study (Protocol #20190583), and all participants provided written informed consent prior to enrollment. This research was conducted in accordance with the principles of the Declaration of Helsinki.
The design and methodology of the PREVENTION trial, including all inclusion and exclusion criteria, have been published previously [41]. Briefly, eligible patients aged 50 years and older were recruited from the Pacific Brain Health Center at Providence St. John’s Health Center (Los Angeles, CA, USA). All study participants were evaluated by a board-certified, fellowship-trained behavioral neurologist and met criteria for one of the following clinical diagnoses: (1) subjective cognitive decline (SCD) based on the SCD Initiative Working Group criteria [42]; (2) mild cognitive impairment (MCI) based on Petersen-Mayo criteria [43,44]; or (3) probable AD dementia based on National Institute of Neurological and Communicative Disorders and Stroke and the Alzheimer’s Disease and Related Disorders Association criteria [45]. Diagnoses were reviewed and confirmed by a multidisciplinary team of geriatricians, neurologists, neuropsychologists, and psychiatrists prior to study enrollment. Biomarker confirmation of AD pathology (Aβ positivity) was established through either positron emission tomography (PET) imaging with ¹⁸F-florbetapir or cerebrospinal fluid (CSF) analysis, consistent with the 2018 National Institute on Aging–Alzheimer’s Association (NIA-AA) research framework guidelines [5].
2.2. Baseline Assessments
Participants completed a comprehensive baseline assessment at study entry. Demographic data, medical histories, and current medications were collected from participants and care partners, then verified using electronic health records. Trained research staff members, supervised by the study’s licensed clinical neuropsychologist, gathered data on diet, lifestyle factors, physical activity, sleep, and functional abilities. Patient-reported outcomes (PROs) included the PRO Measurement Information System® (PROMIS)-29 v2.0 profile [46], Perceived Stress Scale-4 (PSS-4) [47], and International Physical Activity Questionnaire (IPAQ) [48]. IPAQ responses were used to calculate metabolic equivalents (MET-minutes/week).
A certified personal trainer administered a standardized physical performance battery to assess gait, balance, cardiorespiratory fitness, muscular endurance, cognitive-motor dual-task abilities, and fall risk. Specific tests included the National Institutes of Health Toolbox (NIHTB) Motor Battery [49], Short Physical Performance Battery (SPPB) [50], Timed Up and Go (TUG) [51], TUG with cognitive dual-task (TUG-COG) [52], 30-Second Chair Stand Test [53], and Four Square Step Test (FSST) [54].
Blood samples were collected in the morning following an overnight fast. Apolipoprotein E (APOE) genotype was determined using two single nucleotide polymorphisms (rs429358 and rs7412) to identify ε2, ε3, and ε4 alleles.
Whole-body dual-energy X-ray absorptiometry (DXA) scans measured bone mineral density, body composition, and resting metabolic rate [55,56]. Fat-free mass index (FFMI) and height-adjusted FFMI were calculated using validated formulas [57]. All variables were normalized by height and/or weight to account for individual differences in body size.
2.3. Frailty Domains and Variable Selection
From the PREVENTION dataset, we identified 25 anthropometric, performance-based, and patient-reported measures representing various dimensions of frailty. Variable selection was based on (1) empirical support from prior frailty research; (2) clinical relevance to adults with AD; and (3) data availability and completeness within the study sample. To facilitate interpretable factor analyses with adequate variable-to-participant ratios, we classified each measure into one of three domains: physical frailty (6 variables), functional frailty (11 variables), or psychosocial frailty (8 variables). Although some variables could conceptually span multiple domains, we assigned each to the domain that best represented its primary construct. Figure 1 presents the complete variable list.
2.4. Imaging Measures
High-resolution structural magnetic resonance imaging (MRI) data were acquired using a 3.0 Tesla GE Signa 750 W scanner (General Electric, Milwaukee, WI, USA) equipped with a 19-channel head coil.
Cortical reconstruction and volumetric segmentation of the entire brain were performed using FreeSurfer software version 7.1 (http://surfer.nmr.mgh.harvard.edu). Detailed descriptions of these procedures have been published previously [58,59]. Briefly, the standard FreeSurfer processing pipeline involves motion correction and averaging of multiple volumetric T1-weighted images [60]; removal of non-brain tissue using a hybrid watershed/surface deformation procedure [61]; Talairach transformation, segmentation of subcortical white matter and deep gray matter volumetric structures, including the hippocampus, amygdala, caudate, putamen, and ventricles [62,63]; intensity normalization [64]; gray matter-white matter boundary tessellation; automated topology correction [65,66]; and surface deformation guided by intensity gradients to optimally position gray/white and gray/cerebrospinal fluid (CSF) boundaries [58,59,67].
For this study, we included two MRI-derived measures: total gray matter volume and hippocampal volume. Brain volumes were normalized by total intracranial volume (TIV) to account for individual differences in head size [68]. Three participants did not undergo MRI due to contraindications and were excluded from imaging-related analyses. All imaging data were visually inspected for quality assurance and preprocessing errors before inclusion in statistical analyses.
2.5. Cognitive Measures
All participants completed a standardized neuropsychological test battery administered by licensed psychometrists under the supervision of a board-certified neuropsychologist. Global cognitive function was evaluated using the Montreal Cognitive Assessment (MoCA). The Trail Making Test (TMT), Wechsler Memory Scale (WMS-IV), and NIHTB Cognition Battery (NIHTB-CB) subtests assessed performance across two cognitive domains: (1) memory (Rey Auditory Verbal Learning Test [immediate recall score], WMS-IV Verbal Paired Associates [VPA] I and II [total scaled scores], WMS-IV Visual Reproduction [VR] I and II [total scaled scores]); and (2) executive functioning (TMT – Part B [time to complete], NIHTB Oral Symbol Digit Test [raw score]).
All raw test scores were converted to standardized z-scores (mean = 0, standard deviation = 1). Z-scores were sign-reversed, when necessary (e.g., Trails B time), so that higher values consistently indicated better performance across all measures. Domain-specific composite scores were calculated by averaging the z-scores of the individual tests within each cognitive domain.
2.6. Sample Size Considerations
Established methodological guidelines for EFA recommend a minimum of 3 to 10 participants per observed variable to ensure stable and interpretable factor solutions [69]. To align with these recommendations, we employed a domain-specific strategy, conducting separate EFAs for physical (6 variables), functional (11 variables), and psychosocial (8 variables) frailty domains. This approach yielded participant-to-variable ratios of 8:1, 4.4:1, and 6:1, respectively, meeting established adequacy thresholds.
Moreover, simulation studies have demonstrated that valid factor solutions can be obtained from samples as small as 40–50 participants, particularly when communalities are moderate to high (>0.5) and primary factor loadings are strong (>0.6) [70]. Our sample of 48 participants meets these empirical benchmarks, supporting the robustness of the factor solutions reported in this study.
For regression analyses, an a priori power analysis was conducted to determine statistical sensitivity. At α = 0.05, a sample of 45 participants (excluding three cases with missing MRI data) provided ≥80% power to detect an R² of 0.20 attributable to five predictor variables. This calculation assumed adjustment for five covariates (age, sex, education, APOE-ε4 status, and TIV for imaging models), which were estimated to contribute an additional R² of approximately 0.20.
2.7. Statistical Analysis
All data were inspected for normality, outliers, and homoscedasticity to ensure suitability for parametric statistical tests. Prior to factor analysis, input variables were standardized to z-scores (mean = 0, SD = 1). Three separate EFAs—one for each frailty domain—were conducted using the iterated principal factor extraction method with varimax rotation to derive orthogonal (uncorrelated) latent constructs. Participant-to-variable ratios adhered to psychometric guidelines, as described above.
The number of extracted factors in each domain was determined through a two-step process. First, we generated scree plots with eigenvalues plotted against the number of factors and identified the inflection point (“elbow”) to determine the optimal number of factors to retain. Second, we examined the proportion of total variance explained by each solution, retaining only factors with eigenvalues greater than one. Factor loadings ≥ 0.50 were considered meaningful, and cross-loadings were reviewed to ensure clear factor separation. Visualizations of rotated factor loadings for each frailty domain were generated using the ggplot2 package in R.
Our study focused on four AD-related measures of interest: (1) memory z-scores, (2) executive functioning z-scores, (3) total gray matter volume, and (4) hippocampal volume. Neuroimaging analyses were conducted on the subsample with available structural MRI data (n = 45). Because fewer than 10% of participants were missing MRI scans, we applied listwise deletion for imaging analyses, assuming the missingness was random. Participants with and without MRI did not differ significantly in age (72.1 ± 7.3 vs. 68.0 ± 5.6 years, p = 0.33), education (16.7 ± 2.6 vs. 18.0 ± 2.0 years, p = 0.38), MoCA scores (21.7 ± 3.7 vs. 17.7 ± 3.1, p = 0.14), or sex (49% vs. 67% female, p = 1.00). All cognition-only analyses utilized the full cohort (n = 48). Multiple linear regression models were used to examine associations between frailty factor scores and these cognitive and neuroanatomical measures, controlling for age, sex, educational level, and APOE-ε4 status (and TIV for imaging measures).
To identify the most relevant frailty factors for each dependent variable, we employed a structured variable selection strategy. We first estimated a series of regression models including all factor scores from each frailty domain, retaining those with p-values < 0.10. As a secondary exploratory step, we applied stepwise selection with an entry criterion of α = 0.05 to identify independent predictors while accounting for multicollinearity. Final models were refined through significance testing and optimization of adjusted R² to improve explanatory power.
We then constructed multivariable regression models using the identified predictors. Non-significant variables were iteratively removed, and overall model fit was re-evaluated using adjusted R² to derive the most parsimonious model for each measure. To evaluate model robustness, we applied leave-one-out cross-validation as an internal validation method. Inferences regarding frailty factor-AD measure associations were drawn exclusively from final models, using a two-tailed significance threshold of p < 0.05. Given the exploratory, hypothesis-generating nature of this study, p-values were not corrected for multiple comparisons. All analyses were conducted using SAS version 9.4 (SAS Institute, Cary, NC), including PROC FACTOR and PROC GLMSELECT.
3. Results
3.1. Participant Characteristics
The study included 48 adults with Aβ-positive AD. Table 1 presents the demographic and clinical characteristics of the sample. The average age was 71.8 years (SD = 7.2), with an equal numbers of males and females (24/24). Most participants were White (83%), non-Hispanic (96%), right-handed (88%), and highly educated (mean = 16.8 years, SD = 2.6). Nearly three-quarters (73.9%) were carriers of the APOE ε4 allele. The mean MoCA score was 21.4 (SD = 3.8), indicating MCI.
3.2. Factor Analysis
EFA identified eight latent frailty factors across the physical, functional, and psychosocial domains, collectively accounting for 77–81% of the total variance. Figure 2 illustrates the rotated factor loadings.
3.2.1. Physical Frailty Domain
A single physical frailty factor (PhysFac1) accounted for 81% of the total variance among six highly correlated variables. Factor loadings ranged from 0.790 (adjusted FFMI) to 0.965 (lean mass, arms), indicating a robust unidimensional structure representing overall lean mass.
3.2.2. Functional Frailty Domain
Four functional frailty factors (FuncFac1, FuncFac2, FuncFac3, FuncFac4) accounted for 77% of the total variance among eleven variables. FuncFac1 exhibited positive loadings from SPPB gait speed (0.939) and chair stand scores (0.760), and negative loadings from IPAQ total METs (-0.600) and TUG score (-0.716), representing mobility performance and activity levels. FuncFac2 featured high loadings from dominant (0.959) and non-dominant grip strength (0.944) scores, representing upper body strength. FuncFac3 showed high loadings from TUG-COG (0.836) and FSST (0.798) scores, representing dual-task performance. FuncFac4 included loadings from the 30-Second Chair Stand score (0.762), SPPB balance score (0.707), and 2-Minute Walk Endurance Test score (0.589), representing lower body strength and endurance.
3.2.3. Psychosocial Frailty Domain
Three psychosocial frailty factors (PsychFac1, PsychFac2, and PsychFac3) accounted for 78% of the total variance among eight variables. PsychFac1 was characterized by positive loadings from PROMIS Depression (0.841) and PROMIS Anxiety (0.816) T-scores and a negative loading from the PROMIS Physical Function T-score (-0.507), representing psychological distress. PsychFac2 was marked by positive loadings from PROMIS Pain Interference (0.856) and PROMIS Fatigue (0.604) T-scores, and a negative loading from the PROMIS Ability to Participate in Social Roles and Activities (PROMIS-APS) T-score (-0.531), representing physical and social limitations. PsychFac3 demonstrated positive loadings from the Perceived Stress Scale score (0.775) and PROMIS Sleep Disturbance T-score (0.658), representing stress and sleep disturbance.
3.3. Associations with Cognition and Brain Volumes
Four factors were associated with at least one AD-related measure (Table 2; Figure 3). PsychFac1 (Psychological Distress) was negatively associated with memory (β = -0.35, SE = 0.14, t = -2.49, p = 0.02) and hippocampal volume (β = -206.2, SE = 99.9, t = -2.06, p = 0.05). FuncFac3 (Cognitive-Motor Dual-Task Performance) was negatively associated with executive functioning (β = -0.55, SE = 0.17, t = -3.27, p = 0.002) and total gray matter volume (β = - 15676.8, SE = 6111.9, t = -2.56, p = 0.01). PsychFac2 (Physical and Social Limitations) was negatively associated with total gray matter volume (β = -8619.3, SE = 3141.8, t = -2.08, p = 0.05). PhysFac1 (Lean Mass) was positively associated with hippocampal volume (β = 781.5, SE = 202.2, t = 3.87, p = 0.0004).
4. Discussion
This proof-of-concept study employed a data-driven approach to identify distinct frailty phenotypes and examine their cross-sectional relationships with cognition and brain structure in early AD. EFA identified eight orthogonal factors, four of which demonstrated significant associations with specific AD-related measures. Our findings highlight the multidimensional nature of frailty and suggest distinct pathways through which different dimensions of vulnerability may relate to disease heterogeneity.
4.1. Physical Frailty
A single physical frailty factor (PhysFac1) explained 81% of the variance among six highly correlated DXA-derived measures of lean mass. This robust single-factor model reinforces the central role of sarcopenia—the age-related loss of muscle mass and strength—in physical frailty. Lean mass was positively associated with hippocampal volume.
These results corroborate previous research linking sarcopenia to brain atrophy in early AD [71]. Several studies have shown that muscle structure and function directly correlate with hippocampal size [72,73,74]. Moreover, strength training interventions have been shown to protect against age- and AD-related hippocampal atrophy. A secondary analysis of the SMART Trial demonstrated that just six months of progressive resistance exercise attenuated 2-3% of volume loss across several hippocampal subfields vulnerable to AD, including the subiculum, CA1, and dentate gyrus [75]. These benefits persisted for up to 18 months post-intervention [75]. Furthermore, a meta-analysis of physical exercise studies concluded that resistance training was associated with increased total hippocampal volume (0.49 cm³, 95% CI: 0.09-0.89, p = 0.015) [76].
Our findings provide additional evidence of a “muscle-brain axis”—the bidirectional communication network between skeletal muscle and the central nervous system [77]. Beyond its mechanical functions, skeletal muscle serves as an active endocrine organ, secreting signaling molecules including myokines (e.g., irisin, IL-6, myostatin), neurotrophins (e.g., BDNF, NGF), exosome-encapsulated microRNAs (e.g., miR-1, miR-133b, miR-206), and metabolic intermediates (e.g., lactate, β-hydroxybutyrate) into the circulation [78,79,80,81,82,83,84,85]. These muscle-derived factors traverse the blood–brain barrier and regulate key neural processes, including neurogenesis, synaptic plasticity, mitochondrial bioenergetics, neuroinflammation, and cerebral perfusion [84]. Preserving lean muscle mass also supports brain health indirectly by improving metabolic control, reducing inflammation, strengthening antioxidant defenses, and enhancing vascular function [86]. Collectively, our results underscore the neuroprotective role of skeletal muscle and suggest that strategies targeting sarcopenia—such as resistance exercise, nutritional support, or myokine-based therapies—may help mitigate hippocampal degeneration in AD.
4.2. Functional Frailty
Among the four functional frailty factors identified, only FuncFac3—defined primarily by high loadings from TUG-COG and FSST scores—exhibited robust relationships with cognitive performance and brain structure. The TUG-COG and FSST are both established clinical assessments that require the simultaneous execution of motor and cognitive tasks (i.e., dual-tasking), with higher scores indicating greater impairment [87,88].
In this study, poor cognitive-motor dual-task performance (higher FuncFac3 scores) was associated with worse executive functioning. Dual-tasking inherently depends on higher-order cognitive processes such as attentional control, working memory, cognitive flexibility, and motor planning [89,90,91,92]. Evidence suggests that Trail-Making Test-B performance explains almost half the variance in FSST time [93], confirming that this test challenges executive control rather than balance alone. Previous investigations have reported a direct correlation between dual-task impairments (e.g., slower gait speed, increased gait variability, greater dual-task costs, decreased balance) and executive dysfunction [94,95].
FuncFac3 showed an inverse relationship with total gray matter volume, indicating that poorer dual-task performance is linked to reduced brain volume. These results reinforce prior research demonstrating that dual-task deficits are related to widespread atrophy across cortical, subcortical, and cerebellar regions [96,97]. Importantly, several small-scale intervention trials have shown that cognitive-motor training can improve cognitive performance, increase neural efficiency in the prefrontal cortex, reduce AD-related brain changes, and enhance quality of life across diverse older adult populations [98,99,100,101,102].
These findings suggest that dual-task assessments may serve as sensitive, practical “stress tests” of executive functioning and brain structural integrity, revealing subtle deficits that might otherwise remain undetected in early disease stages. While our cross-sectional study cannot determine causality, it provides a foundation for future longitudinal research to examine whether changes in dual-task ability could serve as valuable markers for monitoring frailty interventions.
4.3. Psychosocial Frailty
Our analysis uncovered three psychosocial frailty factors, two of which were significantly associated with AD-related measures. The first, PsychFac1 (“Psychological Distress”), was characterized by positive loadings from PROMIS Depression and Anxiety T-scores and a negative loading from Physical Function T-scores. The co-loading of depression and anxiety reflects their well-documented comorbidity and aligns with contemporary transdiagnostic approaches to psychopathology, which emphasize dimensional rather than categorical conceptualizations of mental health [103,104].
The incorporation of perceived physical dysfunction into PsychFac1 underscores the interdependence of psychiatric symptoms and functional self-efficacy in our older adult AD cohort. This pattern diverges from those observed in younger populations, in which psychological distress and physical function typically segregate into distinct constructs [105,106]. Several mechanisms may explain this convergence. Depression and anxiety often foster negative cognitive biases that lead individuals to underestimate their physical capabilities [107]. Conversely, functional decline may precipitate or exacerbate psychiatric symptoms by threatening one’s sense of autonomy and independence [108,109]. These psychological and functional changes may also arise from shared neurobiological substrates—namely, alterations within circuits governing mood regulation, self-perception, and goal-directed behavior [110,111,112].
PsychFac1 was associated with worse memory performance and smaller hippocampal volume. Neuropsychiatric symptoms are nearly universal in AD and predict greater neuropathological burden, faster cognitive decline, and earlier loss of independence [113,114,115,116,117]. The hippocampus—critical for both memory and emotion regulation—is particularly vulnerable to the deleterious effects of chronic psychological distress [118,119]. Neuroimaging studies have linked depression and anxiety to structural and functional abnormalities in medial temporal lobe regions, including the hippocampus [120,121,122,123,124]. These brain changes are closely tied to episodic memory deficits [125,126,127,128], paralleling the associations observed in our cohort. Our findings extend this literature by demonstrating that these established relationships persist when internalizing symptoms are conceptualized as part of a broader, empirically-derived construct that integrates perceived functional limitations. Rather than treating psychological and functional deficits as isolated variables, this data-driven approach captures their shared variance and offers a more ecologically valid and clinically meaningful representation of distress in AD patients.
The second psychosocial factor, PsychFac2 (“Physical & Social Limitations”), was defined by positive loadings from PROMIS Pain Interference and Fatigue T-scores, coupled with a negative loading from PROMIS Ability to Participate in Social Roles and Activities T-scores. Pain, fatigue, and social isolation constitute another prevalent yet underrecognized symptom cluster affecting older adults with cognitive impairment [129,130,131,132]. Pain and fatigue can create barriers to social participation [133], while isolation may amplify somatic symptom burden via various biobehavioral pathways[134]. This self-reinforcing cycle is particularly harmful in AD, which progressively impairs communication, undermines social confidence, and restricts access to meaningful relationships [135].
PsychFac2 was associated with reduced total gray matter volume, suggesting that this constellation of physical and social limitations may reflect more widespread brain atrophy. This finding aligns with prior research linking each of these components—pain, fatigue, and social isolation—to structural brain changes. Chronic pain reduces gray matter volume by up to 11%—equivalent to 10-20 years of normal aging—with pronounced effects in the prefrontal cortex, anterior cingulate, and insula [136,137,138,139]. Similarly, excessive fatigue correlates with decreased gray matter in regions governing cognitive control and motivation, including the prefrontal cortex, anterior cingulate cortex, insula, amygdala, and basal ganglia [140]. Finally, social isolation predicts volume loss across frontal, temporal, and subcortical regions underlying social behavior [141]. The convergence of these symptoms into a unified factor associated with global gray matter reduction suggests that pain, fatigue, and social limitations may be best addressed as an integrated syndrome rather than isolated symptoms in AD care.
4.4. Strengths and Limitations
This study possesses several notable strengths. Restricting enrollment to participants with biomarker-confirmed Aβ pathology enhanced diagnostic precision and increased the specificity of our findings to AD. Additionally, we leveraged an extensive clinical dataset encompassing detailed neuropsychological assessments, objective physical performance measures, comprehensive body composition analyses, and high-resolution structural neuroimaging, which collectively facilitated robust phenotypic characterization. The study’s principal strength, however, was the successful application of EFA to model the underlying structure of physical, functional, and psychosocial frailty in our cohort. This approach effectively distilled 25 interrelated variables into eight latent phenotypes, which minimized multicollinearity, improved model interpretability, and yielded composite scores that are both statistically robust and clinically meaningful. Beyond providing mechanistic insights into the real-world expression of frailty, this work demonstrates the feasibility and utility of adapting latent-variable methods from the psychological sciences to characterize multifactorial constructs like frailty, which lack discrete boundaries and emerge from complex systems-level interactions.
However, key limitations must be acknowledged. First, the factor structure was limited by our variable selection, and inclusion of additional frailty-related measures, such as polypharmacy, falls history, or comorbidity burden, might reveal different phenotypic patterns. Second, the cross-sectional design precludes causal inference regarding the relationships between frailty phenotypes and AD-related measures. It also prevents comprehensive examination of frailty’s dynamic nature or its long-term impact on AD progression. Longitudinal studies are required to determine the temporal dynamics and predictive value of these frailty factors. Third, our sample size of 48 participants met methodological requirements for EFA but remains modest, limiting statistical power to detect smaller effects. Moreover, the cohort was predominantly White (83%), highly educated (mean 16.8 years), and recruited from a single academic center, restricting generalizability to more diverse populations. This demographic homogeneity is especially important given the well-documented disparities in frailty prevalence and AD outcomes across racial and socioeconomic groups. Fourth, we did not systematically account for co-pathologies—such as cerebrovascular disease, Lewy body pathology, or TDP-43 proteinopathy—which are prevalent in AD and influence frailty presentations, cognitive profiles, and neuroimaging phenotypes.
5. Conclusions
This proof-of-concept study demonstrates that empirically-derived frailty phenotypes are associated with specific cognitive and neuroanatomical signatures in early AD. EFA identified eight distinct frailty factors, four of which exhibited significant cross-sectional associations with cognitive performance or brain structure: lean muscle mass with hippocampal volume; cognitive-motor dual-task performance with executive function and total gray matter volume; psychological distress with memory performance and hippocampal volume; and physical-social limitations with total gray matter volume. These preliminary findings challenge traditional unidimensional conceptualizations of frailty and suggest that distinct mechanistic pathways may contribute to the clinical heterogeneity observed in AD. Although the cross-sectional design and modest sample size limit causal inference and generalizability, our data-driven approach provides a methodological framework for decomposing frailty into its component dimensions, generating testable hypotheses for future longitudinal studies. As the field moves toward precision medicine in geriatric care, capturing the multidimensional nature of frailty may enable more nuanced assessment and personalized interventions aimed at optimizing clinical outcomes and quality of life for older adults with neurodegenerative disease.
Author Contributions
Conceptualization, J.F.H., P.S., and D.A.M.; Methodology, J.F.H. and P.S.; Software, J.F.H. and P.S.; Validation, J.F.H., P.S., and J.E.B.; Formal Analysis, P.S.; Investigation, J.F.H., J.E.B., A.S.G., R.M.G., M.K.R., C.B.S., C.L.W., V.R.P., M.K., Y.M.T., S.M., R.V.D., T.B., E.S.P., J.C.R., D.A.M., and P.S.; Resources, J.F.H., P.S., D.A.M., and J.E.B.; Data Curation, J.F.H., P.S., D.A.M., J.E.B., A.S.G., R.M.G., M.K.R., C.B.S., C.L.W., V.R.P., M.K., Y.M.T., S.M., R.V.D., T.B., E.S.P., and J.C.R.; Writing—Original Draft Preparation, J.F.H., P.S., D.A.M., and J.E.B.; Writing—Review & Editing, J.F.H., P.S., D.A.M., J.E.B., A.S.G., R.M.G., M.K.R., C.B.S., C.L.W., V.R.P., M.K., Y.M.T., S.M., R.V.D., T.B., E.S.P., and J.C.R.; Visualization, J.F.H.; Supervision, P.S. and D.A.M.; Project Administration, J.F.H. and P.S.; Funding Acquisition, D.A.M. All authors have read and agreed to the published version of the manuscript.
Funding
This work was supported by the Alzheimer’s Tra nslational Pillar of Providence St. Joseph Health; Saint John’s Health Center Foundation; Pacific Neuroscience Institute Foundation; and generous philanthropic gifts from Will & Cary Singleton and the McLoughlin family. The funders had no role in study design, data collection, analysis, or manuscript preparation.
Institutional Review Board Statement
The study was conducted in accordance with the Declaration of Helsinki and approved by the Western Institutional Review Board–Copernicus Group (WCG® IRB; PREVENTION protocol #20190583, 7 May 2019).
Informed Consent Statement
Written informed consent was obtained from all PREVENTION participants (or their legally authorized representatives). The retrospective chart review was granted a waiver of consent by the Providence St. Joseph Health IRB.
Data Availability Statement
De-identified individual participant data and the analysis code that support the findings of this study are available from the corresponding author (jhodes@pacificneuro.org) upon reasonable request. Release of the dataset is subject to approval by Providence St. Joseph Health Institutional Review Board and execution of a data-use agreement in accordance with institutional and HIPAA policies.
Acknowledgements
We are incredibly grateful to our patients and their care partners who selflessly donated their time, effort, and biosamples to advance our understanding of Alzheimer’s disease and related disorders. We thank the following individuals for their invaluable contributions to the PREVENTION trial: Lesley Bell, Natsuko Nomura, Pema Choden, Susan Bookheimer, Elena Berezhnikh, Dale Bredesen, Elizabeth Baron Cole, Melissa Coleman, Lee Hood, Richard Isaacson, Daniel F. Kelly, Cory Funk, Mariah Harris-Moseley, Scott A. Kaiser, Santosh Kesari, Neil Martin, Sarah C. McEwen, Karen J. Miller, Kori Otero, Stella E. Panos, Corwin Patis, Cyrus A. Raji, Evette Richardson, Jessica Serna, Jordan Stachel, Tori Togashi, Spencer Loong, and Fatima Iqbal. Additionally, we sincerely appreciate the dedicated clinicians, clinical/translational research teams, and staff of the Pacific Brain Health Center and Pacific Neuroscience Institute who work tirelessly to improve the lives of our patients.
Conflicts of Interest
The authors declare no conflicts of interest.
Abbreviations
The following abbreviations are used in this manuscript:
| AD | Alzheimer’s disease |
| APOE | Apolipoprotein E |
| Aβ | Amyloid-β (amyloid-beta) |
| BDNF | Brain-derived neurotrophic factor |
| CA1 | Cornu Ammonis 1 (hippocampal subfield) |
| CSF | Cerebrospinal fluid |
| DXA | Dual-energy X-ray absorptiometry |
| EFA | Exploratory factor analysis |
| FFMI | Fat-free mass index |
| FSST | Four Square Step Test |
| HIPAA | Health Insurance Portability and Accountability Act |
| IL-6 | Interleukin-6 |
| IPAQ | International Physical Activity Questionnaire |
| IRB | Institutional Review Board |
| MCI | Mild cognitive impairment |
| MET | Metabolic equivalent of task |
| miR | microRNA |
| MoCA | Montreal Cognitive Assessment |
| MRI | Magnetic resonance imaging |
| NCT | National Clinical Trial (ClinicalTrials.gov) identifier |
| NGF | Nerve growth factor |
| NIH | National Institutes of Health |
| NIHTB | NIH Toolbox |
| NIHTB-CB | NIH Toolbox Cognition Battery |
| NIA-AA | National Institute on Aging–Alzheimer’s Association |
| PET | Positron emission tomography |
| PREVENTION | Precision Recommendations for Environmental Variables, Exercise, Nutrition and Training Interventions to Optimize Neurocognition (trial) |
| PRO | Patient-reported outcome |
| PROMIS | Patient-Reported Outcomes Measurement Information System |
| PSS-4 | Perceived Stress Scale-4 |
| SAS | Statistical Analysis System |
| SCD | Subjective cognitive decline |
| SMART | Study of Mental and Resistance Training (trial) |
| SPPB | Short Physical Performance Battery |
| TDP-43 | Transactive response DNA-binding protein 43 |
| TIV | Total intracranial volume |
| TMT | Trail Making Test |
| TUG | Timed Up and Go |
| TUG-COG | Timed Up and Go with cognitive dual-task |
| VPA | Verbal Paired Associates |
| VR | Visual Reproduction |
| WCG | Western Copernicus Group |
| WMS | Wechsler Memory Scale |
References
- Comas-Herrera, A.; International, A.D.; Aguzzoli, E.; Farina, N.; Read, S.; Evans-Lacko, S. World Alzheimer Report 2024: Global Changes in Attitudes to Dementia. 2024.
- Gustavsson, A.; Norton, N.; Fast, T.; Frölich, L.; Georges, J.; Holzapfel, D.; Kirabali, T.; Krolak-Salmon, P.; Rossini, P.M.; Ferretti, M.T.; et al. Global Estimates on the Number of Persons across the Alzheimer’s Disease Continuum. Alzheimer’s & Dementia 2023, 19, 658–670, . [CrossRef]
- Grundke-Iqbal, I.; Iqbal, K.; Tung, Y.C.; Quinlan, M.; Wisniewski, H.M.; Binder, L.I. Abnormal Phosphorylation of the Microtubule-Associated Protein Tau (Tau) in Alzheimer Cytoskeletal Pathology. Proc Natl Acad Sci U S A 1986, 83, 4913–4917, . [CrossRef]
- Glenner, G.G.; Wong, C.W. Alzheimer’s Disease: Initial Report of the Purification and Characterization of a Novel Cerebrovascular Amyloid Protein. Biochemical and Biophysical Research Communications 1984, 120, 885–890, . [CrossRef]
- Jack, C.R.; Bennett, D.A.; Blennow, K.; Carrillo, M.C.; Dunn, B.; Haeberlein, S.B.; Holtzman, D.M.; Jagust, W.; Jessen, F.; Karlawish, J.; et al. NIA-AA Research Framework: Toward a Biological Definition of Alzheimer’s Disease. Alzheimers Dement 2018, 14, 535–562, . [CrossRef]
- Bateman, R.J.; Xiong, C.; Benzinger, T.L.S.; Fagan, A.M.; Goate, A.; Fox, N.C.; Marcus, D.S.; Cairns, N.J.; Xie, X.; Blazey, T.M.; et al. Clinical and Biomarker Changes in Dominantly Inherited Alzheimer’s Disease. New England Journal of Medicine 2012, 367, 795–804, . [CrossRef]
- Young-Pearse, T.L.; Lee, H.; Hsieh, Y.-C.; Chou, V.; Selkoe, D.J. Moving beyond Amyloid and Tau to Capture the Biological Heterogeneity of Alzheimer’s Disease. Trends in Neurosciences 2023, 46, 426–444, . [CrossRef]
- Verdi, S.; Kia, S.M.; Yong, K.X.X.; Tosun, D.; Schott, J.M.; Marquand, A.F.; Cole, J.H. Revealing Individual Neuroanatomical Heterogeneity in Alzheimer Disease Using Neuroanatomical Normative Modeling. Neurology 2023, 100, e2442–e2453, . [CrossRef]
- Duara, R.; Barker, W. Heterogeneity in Alzheimer’s Disease Diagnosis and Progression Rates: Implications for Therapeutic Trials. Neurotherapeutics 2022, 19, 8–25, . [CrossRef]
- Schneider, J.A.; Arvanitakis, Z.; Bang, W.; Bennett, D.A. Mixed Brain Pathologies Account for Most Dementia Cases in Community-Dwelling Older Persons. Neurology 2007, 69, 2197–2204, . [CrossRef]
- Boyle, P.A.; Yu, L.; Wilson, R.S.; Leurgans, S.E.; Schneider, J.A.; Bennett, D.A. Person-Specific Contribution of Neuropathologies to Cognitive Loss in Old Age. Ann Neurol 2018, 83, 74–83, . [CrossRef]
- Nelson, P.T.; Alafuzoff, I.; Bigio, E.H.; Bouras, C.; Braak, H.; Cairns, N.J.; Castellani, R.J.; Crain, B.J.; Davies, P.; Del Tredici, K.; et al. Correlation of Alzheimer Disease Neuropathologic Changes with Cognitive Status: A Review of the Literature. J Neuropathol Exp Neurol 2012, 71, 362–381, . [CrossRef]
- Tosun, D.; Demir, Z.; Veitch, D.P.; Weintraub, D.; Aisen, P.; Jack, C.R.; Jagust, W.J.; Petersen, R.C.; Saykin, A.J.; Shaw, L.M.; et al. Contribution of Alzheimer’s Biomarkers and Risk Factors to Cognitive Impairment and Decline across the Alzheimer’s Disease Continuum. Alzheimers Dement 2022, 18, 1370–1382, . [CrossRef]
- Bohn, L.; Zheng, Y.; McFall, G.P.; Andrew, M.K.; Dixon, R.A. Frailty in Motion: Amnestic Mild Cognitive Impairment and Alzheimer’s Disease Cohorts Display Heterogeneity in Multimorbidity Classification and Longitudinal Transitions. Journal of Alzheimer’s Disease 2025, 104, 732–750, . [CrossRef]
- Fried, L.P.; Tangen, C.M.; Walston, J.; Newman, A.B.; Hirsch, C.; Gottdiener, J.; Seeman, T.; Tracy, R.; Kop, W.J.; Burke, G.; et al. Frailty in Older Adults: Evidence for a Phenotype. J Gerontol A Biol Sci Med Sci 2001, 56, M146-156, . [CrossRef]
- Clegg, A.; Young, J.; Iliffe, S.; Rikkert, M.O.; Rockwood, K. Frailty in Elderly People. Lancet 2013, 381, 752–762, . [CrossRef]
- Vermeiren, S.; Vella-Azzopardi, R.; Beckwée, D.; Habbig, A.-K.; Scafoglieri, A.; Jansen, B.; Bautmans, I.; Gerontopole Brussels Study group Frailty and the Prediction of Negative Health Outcomes: A Meta-Analysis. J Am Med Dir Assoc 2016, 17, 1163.e1-1163.e17, . [CrossRef]
- Kojima, G.; Iliffe, S.; Walters, K. Frailty Index as a Predictor of Mortality: A Systematic Review and Meta-Analysis. Age Ageing 2018, 47, 193–200, . [CrossRef]
- Buchman, A.S.; Boyle, P.A.; Wilson, R.S.; Tang, Y.; Bennett, D.A. Frailty Is Associated with Incident Alzheimer’s Disease and Cognitive Decline in the Elderly. Psychosom Med 2007, 69, 483–489, . [CrossRef]
- Buchman, A.S.; Schneider, J.A.; Leurgans, S.; Bennett, D.A. Physical Frailty in Older Persons Is Associated with Alzheimer Disease Pathology. Neurology 2008, 71, 499–504, . [CrossRef]
- Franceschi, C.; Garagnani, P.; Morsiani, C.; Conte, M.; Santoro, A.; Grignolio, A.; Monti, D.; Capri, M.; Salvioli, S. The Continuum of Aging and Age-Related Diseases: Common Mechanisms but Different Rates. Front Med (Lausanne) 2018, 5, 61, . [CrossRef]
- Walston, J.; Hadley, E.C.; Ferrucci, L.; Guralnik, J.M.; Newman, A.B.; Studenski, S.A.; Ershler, W.B.; Harris, T.; Fried, L.P. Research Agenda for Frailty in Older Adults: Toward a Better Understanding of Physiology and Etiology: Summary from the American Geriatrics Society/National Institute on Aging Research Conference on Frailty in Older Adults. J Am Geriatr Soc 2006, 54, 991–1001, . [CrossRef]
- Wallace, L.M.K.; Theou, O.; Godin, J.; Andrew, M.K.; Bennett, D.A.; Rockwood, K. Investigation of Frailty as a Moderator of the Relationship between Neuropathology and Dementia in Alzheimer’s Disease: A Cross-Sectional Analysis of Data from the Rush Memory and Aging Project. The Lancet Neurology 2019, 18, 177–184, . [CrossRef]
- Koch, G.; Belli, L.; Giudice, T.L.; Lorenzo, F.D.; Sancesario, G.M.; Sorge, R.; Bernardini, S.; Martorana, A. Frailty among Alzheimer’s Disease Patients. CNS Neurol Disord Drug Targets 2013, 12, 507–511, . [CrossRef]
- Gabelle, A.; Schraen, S.; Gutierrez, L.-A.; Pays, C.; Rouaud, O.; Buée, L.; Touchon, J.; Helmer, C.; Lambert, J.-C.; Berr, C. Plasma β-Amyloid 40 Levels Are Positively Associated with Mortality Risks in the Elderly. Alzheimers Dement 2015, 11, 672–680, . [CrossRef]
- Mitnitski, A.B.; Mogilner, A.J.; Rockwood, K. Accumulation of Deficits as a Proxy Measure of Aging. ScientificWorldJournal 2001, 1, 323–336, . [CrossRef]
- Rockwood, K.; Mitnitski, A. Frailty in Relation to the Accumulation of Deficits. J Gerontol A Biol Sci Med Sci 2007, 62, 722–727, . [CrossRef]
- Vella Azzopardi, R.; Beyer, I.; Vermeiren, S.; Petrovic, M.; Van Den Noortgate, N.; Bautmans, I.; Gorus, E. Increasing Use of Cognitive Measures in the Operational Definition of Frailty—A Systematic Review. Ageing Research Reviews 2018, 43, 10–16, . [CrossRef]
- Dent, E.; Kowal, P.; Hoogendijk, E.O. Frailty Measurement in Research and Clinical Practice: A Review. Eur J Intern Med 2016, 31, 3–10, . [CrossRef]
- Panza, F.; Lozupone, M.; Solfrizzi, V.; Sardone, R.; Dibello, V.; Di Lena, L.; D’Urso, F.; Stallone, R.; Petruzzi, M.; Giannelli, G.; et al. Different Cognitive Frailty Models and Health- and Cognitive-Related Outcomes in Older Age: From Epidemiology to Prevention. J Alzheimers Dis 2018, 62, 993–1012, . [CrossRef]
- Song, X.; Mitnitski, A.; Rockwood, K. Age-Related Deficit Accumulation and the Risk of Late-Life Dementia. Alzheimers Res Ther 2014, 6, 54, . [CrossRef]
- Searle, S.D.; Rockwood, K. Frailty and the Risk of Cognitive Impairment. Alzheimers Res Ther 2015, 7, 54, . [CrossRef]
- De Witte, N.; Gobbens, R.; De Donder, L.; Dury, S.; Buffel, T.; Schols, J.; Verté, D. The Comprehensive Frailty Assessment Instrument: Development, Validity and Reliability. Geriatr Nurs 2013, 34, 274–281, . [CrossRef]
- Gobbens, R.J.; Luijkx, K.G.; Wijnen-Sponselee, M.T.; Schols, J.M. Toward a Conceptual Definition of Frail Community Dwelling Older People. Nurs Outlook 2010, 58, 76–86, . [CrossRef]
- López-Otín, C.; Blasco, M.A.; Partridge, L.; Serrano, M.; Kroemer, G. Hallmarks of Aging: An Expanding Universe. Cell 2023, 186, 243–278, . [CrossRef]
- Kirkwood, T.B.L. Understanding the Odd Science of Aging. Cell 2005, 120, 437–447, . [CrossRef]
- Ferrucci, L.; Gonzalez-Freire, M.; Fabbri, E.; Simonsick, E.; Tanaka, T.; Moore, Z.; Salimi, S.; Sierra, F.; de Cabo, R. Measuring Biological Aging in Humans: A Quest. Aging Cell 2020, 19, e13080, . [CrossRef]
- Brigola, A.G.; Rossetti, E.S.; Santos, B.R. dos; Neri, A.L.; Zazzetta, M.S.; Inouye, K.; Pavarini, S.C.I. Relationship between Cognition and Frailty in Elderly: A Systematic Review. Dement. neuropsychol. 2015, 9, 110–119, . [CrossRef]
- Grande, G.; Haaksma, M.L.; Rizzuto, D.; Melis, R.J.F.; Marengoni, A.; Onder, G.; Welmer, A.-K.; Fratiglioni, L.; Vetrano, D.L. Co-Occurrence of Cognitive Impairment and Physical Frailty, and Incidence of Dementia: Systematic Review and Meta-Analysis. Neurosci Biobehav Rev 2019, 107, 96–103, . [CrossRef]
- Franz, C.E.; Buchholz, E.; Reynolds, C.A.; Hunt, J.F.V.; Schroeder, A.; Cortes, I.; Kremen, W.S. Frailty, Brain Aging and Alzheimer’s Disease Brain Signatures: Longitudinal Associations from Middle to Old Age. Alzheimer’s & Dementia 2023, 19, e080643, . [CrossRef]
- McEwen, S.C.; Merrill, D.A.; Bramen, J.; Porter, V.; Panos, S.; Kaiser, S.; Hodes, J.; Ganapathi, A.; Bell, L.; Bookheimer, T.; et al. A Systems-Biology Clinical Trial of a Personalized Multimodal Lifestyle Intervention for Early Alzheimer’s Disease. Alzheimers Dement (N Y) 2021, 7, e12191, . [CrossRef]
- Jessen, F.; Amariglio, R.E.; van Boxtel, M.; Breteler, M.; Ceccaldi, M.; Chételat, G.; Dubois, B.; Dufouil, C.; Ellis, K.A.; van der Flier, W.M.; et al. A Conceptual Framework for Research on Subjective Cognitive Decline in Preclinical Alzheimer’s Disease. Alzheimers Dement 2014, 10, 844–852, . [CrossRef]
- Petersen, R.C.; Doody, R.; Kurz, A.; Mohs, R.C.; Morris, J.C.; Rabins, P.V.; Ritchie, K.; Rossor, M.; Thal, L.; Winblad, B. Current Concepts in Mild Cognitive Impairment. Archives of Neurology 2001, 58, 1985–1992, . [CrossRef]
- Petersen, R.C.; Caracciolo, B.; Brayne, C.; Gauthier, S.; Jelic, V.; Fratiglioni, L. Mild Cognitive Impairment: A Concept in Evolution. J Intern Med 2014, 275, 214–228, . [CrossRef]
- McKhann, G.M.; Knopman, D.S.; Chertkow, H.; Hyman, B.T.; Jack Jr., C.R.; Kawas, C.H.; Klunk, W.E.; Koroshetz, W.J.; Manly, J.J.; Mayeux, R.; et al. The Diagnosis of Dementia Due to Alzheimer’s Disease: Recommendations from the National Institute on Aging-Alzheimer’s Association Workgroups on Diagnostic Guidelines for Alzheimer’s Disease. Alzheimer’s & Dementia 2011, 7, 263–269, . [CrossRef]
- Cella, D.; Riley, W.; Stone, A.; Rothrock, N.; Reeve, B.; Yount, S.; Amtmann, D.; Bode, R.; Buysse, D.; Choi, S.; et al. The Patient-Reported Outcomes Measurement Information System (PROMIS) Developed and Tested Its First Wave of Adult Self-Reported Health Outcome Item Banks: 2005-2008. J Clin Epidemiol 2010, 63, 1179–1194, . [CrossRef]
- Cohen, S.; Kamarck, T.; Mermelstein, R. A Global Measure of Perceived Stress. J Health Soc Behav 1983, 24, 385–396.
- Hagströmer, M.; Oja, P.; Sjöström, M. The International Physical Activity Questionnaire (IPAQ): A Study of Concurrent and Construct Validity. Public Health Nutr 2006, 9, 755–762, . [CrossRef]
- Reuben, D.B.; Magasi, S.; McCreath, H.E.; Bohannon, R.W.; Wang, Y.-C.; Bubela, D.J.; Rymer, W.Z.; Beaumont, J.; Rine, R.M.; Lai, J.-S.; et al. Motor Assessment Using the NIH Toolbox. Neurology 2013, 80, S65-75, . [CrossRef]
- Guralnik, J.M.; Simonsick, E.M.; Ferrucci, L.; Glynn, R.J.; Berkman, L.F.; Blazer, D.G.; Scherr, P.A.; Wallace, R.B. A Short Physical Performance Battery Assessing Lower Extremity Function: Association with Self-Reported Disability and Prediction of Mortality and Nursing Home Admission. J Gerontol 1994, 49, M85-94, . [CrossRef]
- Podsiadlo, D.; Richardson, S. The Timed “Up & Go”: A Test of Basic Functional Mobility for Frail Elderly Persons. J Am Geriatr Soc 1991, 39, 142–148, . [CrossRef]
- Shumway-Cook, A.; Brauer, S.; Woollacott, M. Predicting the Probability for Falls in Community-Dwelling Older Adults Using the Timed Up & Go Test. Phys Ther 2000, 80, 896–903.
- Jones, C.J.; Rikli, R.E.; Beam, W.C. A 30-s Chair-Stand Test as a Measure of Lower Body Strength in Community-Residing Older Adults. Res Q Exerc Sport 1999, 70, 113–119, . [CrossRef]
- Dite, W.; Temple, V.A. A Clinical Test of Stepping and Change of Direction to Identify Multiple Falling Older Adults. Arch Phys Med Rehabil 2002, 83, 1566–1571, . [CrossRef]
- Salamone, L.M.; Fuerst, T.; Visser, M.; Kern, M.; Lang, T.; Dockrell, M.; Cauley, J.A.; Nevitt, M.; Tylavsky, F.; Lohman, T.G. Measurement of Fat Mass Using DEXA: A Validation Study in Elderly Adults. J Appl Physiol (1985) 2000, 89, 345–352, . [CrossRef]
- Visser, M.; Fuerst, T.; Lang, T.; Salamone, L.; Harris, T.B. Validity of Fan-Beam Dual-Energy X-Ray Absorptiometry for Measuring Fat-Free Mass and Leg Muscle Mass. Health, Aging, and Body Composition Study--Dual-Energy X-Ray Absorptiometry and Body Composition Working Group. J Appl Physiol (1985) 1999, 87, 1513–1520, . [CrossRef]
- Kyle, U.G.; Schutz, Y.; Dupertuis, Y.M.; Pichard, C. Body Composition Interpretation. Contributions of the Fat-Free Mass Index and the Body Fat Mass Index. Nutrition 2003, 19, 597–604, . [CrossRef]
- Dale, A.; Fischl, B.; Sereno, M.I. Cortical Surface-Based Analysis: I. Segmentation and Surface Reconstruction. NeuroImage 1999, 9, 179–194.
- Fischl, B.; Dale, A.M. Measuring the Thickness of the Human Cerebral Cortex from Magnetic Resonance Images. Proceedings of the National Academy of Sciences of the United States of America 2000, 97, 11050–11055.
- Reuter, M.; Rosas, H.D.; Fischl, B. Highly Accurate Inverse Consistent Registration: A Robust Approach. NeuroImage 2010, 53, 1181–1196, . [CrossRef]
- Segonne, F.; Dale, A.M.; Busa, E.; Glessner, M.; Salat, D.; Hahn, H.K.; Fischl, B. A Hybrid Approach to the Skull Stripping Problem in MRI. NeuroImage 2004, 22, 1060–1075, . [CrossRef]
- Fischl, B.; Salat, D.H.; Busa, E.; Albert, M.; Dieterich, M.; Haselgrove, C.; van der Kouwe, A.; Killiany, R.; Kennedy, D.; Klaveness, S.; et al. Whole Brain Segmentation: Automated Labeling of Neuroanatomical Structures in the Human Brain. Neuron 2002, 33, 341–355.
- Fischl, B.; van der Kouwe, A.; Destrieux, C.; Halgren, E.; Ségonne, F.; Salat, D.H.; Busa, E.; Seidman, L.J.; Goldstein, J.; Kennedy, D.; et al. Automatically Parcellating the Human Cerebral Cortex. Cerebral Cortex 2004, 14, 11–22, . [CrossRef]
- Sled, J.G.; Zijdenbos, A.P.; Evans, A.C. A Nonparametric Method for Automatic Correction of Intensity Nonuniformity in MRI Data. IEEE Trans Med Imaging 1998, 17, 87–97.
- Fischl, B.; Liu, A.; Dale, A.M. Automated Manifold Surgery: Constructing Geometrically Accurate and Topologically Correct Models of the Human Cerebral Cortex. IEEE Medical Imaging 2001, 20, 70–80.
- Segonne, F.; Pacheco, J.; Fischl, B. Geometrically Accurate Topology-Correction of Cortical Surfaces Using Nonseparating Loops. IEEE Trans Med Imaging 2007, 26, 518–529.
- Dale, A.M.; Sereno, M.I. Improved Localization of Cortical Activity by Combining EEG and MEG with MRI Cortical Surface Reconstruction: A Linear Approach. J Cogn Neurosci 1993, 5, 162–176, . [CrossRef]
- Whitwell, J.L.; Crum, W.R.; Watt, H.C.; Fox, N.C. Normalization of Cerebral Volumes by Use of Intracranial Volume: Implications for Longitudinal Quantitative MR Imaging. AJNR Am J Neuroradiol 2001, 22, 1483–1489.
- Guadagnoli, E.; Velicer, W.F. Relation of Sample Size to the Stability of Component Patterns. Psychological Bulletin 1988, 103, 265–275, . [CrossRef]
- de Winter*, J.C.F.; Dodou*, D.; Wieringa, P.A. Exploratory Factor Analysis With Small Sample Sizes. Multivariate Behavioral Research 2009, 44, 147–181, . [CrossRef]
- Burns, J.M.; Johnson, D.K.; Watts, A.; Swerdlow, R.H.; Brooks, W.M. Reduced Lean Mass in Early Alzheimer Disease and Its Association with Brain Atrophy. Arch Neurol 2010, 67, 428–433, . [CrossRef]
- Carson, R.G. Get a Grip: Individual Variations in Grip Strength Are a Marker of Brain Health. Neurobiol Aging 2018, 71, 189–222, . [CrossRef]
- Firth, J.A.; Smith, L.; Sarris, J.; Vancampfort, D.; Schuch, F.; Carvalho, A.F.; Solmi, M.; Yung, A.R.; Stubbs, B.; Firth, J. Handgrip Strength Is Associated With Hippocampal Volume and White Matter Hyperintensities in Major Depression and Healthy Controls: A UK Biobank Study. Psychosom Med 2020, 82, 39–46, . [CrossRef]
- Meysami, S.; Raji, C.A.; Glatt, R.M.; Popa, E.S.; Ganapathi, A.S.; Bookheimer, T.; Slyapich, C.B.; Pierce, K.P.; Richards, C.J.; Lampa, M.G.; et al. Handgrip Strength Is Related to Hippocampal and Lobar Brain Volumes in a Cohort of Cognitively Impaired Older Adults with Confirmed Amyloid Burden. J Alzheimers Dis 2023, 91, 999–1006, . [CrossRef]
- Zhang, X.-X.; Tian, Y.; Wang, Z.-T.; Ma, Y.-H.; Tan, L.; Yu, J.-T. The Epidemiology of Alzheimer’s Disease Modifiable Risk Factors and Prevention. J Prev Alzheimers Dis 2021, 8, 313–321, . [CrossRef]
- Feter, N.; Penny, J.C.; Freitas, M.P.; Rombaldi, A.J. Effect of Physical Exercise on Hippocampal Volume in Adults: Systematic Review and Meta-Analysis. Science & Sports 2018, 33, 327–338, . [CrossRef]
- Isaac, A.R.; Lima-Filho, R.A.S.; Lourenco, M.V. How Does the Skeletal Muscle Communicate with the Brain in Health and Disease? Neuropharmacology 2021, 197, 108744, . [CrossRef]
- Lam, N.T.; Gartz, M.; Thomas, L.; Haberman, M.; Strande, J.L. Influence of microRNAs and Exosomes in Muscle Health and Diseases. J Muscle Res Cell Motil 2020, 41, 269–284, . [CrossRef]
- El Hayek, L.; Khalifeh, M.; Zibara, V.; Abi Assaad, R.; Emmanuel, N.; Karnib, N.; El-Ghandour, R.; Nasrallah, P.; Bilen, M.; Ibrahim, P.; et al. Lactate Mediates the Effects of Exercise on Learning and Memory through SIRT1-Dependent Activation of Hippocampal Brain-Derived Neurotrophic Factor (BDNF). J Neurosci 2019, 39, 2369–2382, . [CrossRef]
- Safdar, A.; Saleem, A.; Tarnopolsky, M.A. The Potential of Endurance Exercise-Derived Exosomes to Treat Metabolic Diseases. Nat Rev Endocrinol 2016, 12, 504–517, . [CrossRef]
- Matthews, V.B.; Aström, M.-B.; Chan, M.H.S.; Bruce, C.R.; Krabbe, K.S.; Prelovsek, O.; Akerström, T.; Yfanti, C.; Broholm, C.; Mortensen, O.H.; et al. Brain-Derived Neurotrophic Factor Is Produced by Skeletal Muscle Cells in Response to Contraction and Enhances Fat Oxidation via Activation of AMP-Activated Protein Kinase. Diabetologia 2009, 52, 1409–1418, . [CrossRef]
- Pedersen, B.K.; Febbraio, M.A. Muscles, Exercise and Obesity: Skeletal Muscle as a Secretory Organ. Nat Rev Endocrinol 2012, 8, 457–465, . [CrossRef]
- Wrann, C.D.; White, J.P.; Salogiannnis, J.; Laznik-Bogoslavski, D.; Wu, J.; Ma, D.; Lin, J.D.; Greenberg, M.E.; Spiegelman, B.M. Exercise Induces Hippocampal BDNF through a PGC-1α/FNDC5 Pathway. Cell Metab 2013, 18, 649–659, . [CrossRef]
- Di Liegro, C.M.; Schiera, G.; Proia, P.; Di Liegro, I. Physical Activity and Brain Health. Genes (Basel) 2019, 10, 720, . [CrossRef]
- Di Liegro, C.M.; Schiera, G.; Proia, P.; Di Liegro, I. Physical Activity and Brain Health. Genes (Basel) 2019, 10, 720, . [CrossRef]
- Delezie, J.; Handschin, C. Endocrine Crosstalk Between Skeletal Muscle and the Brain. Front Neurol 2018, 9, 698, . [CrossRef]
- de Aquino, M.P.M.; de Oliveira Cirino, N.T.; Lima, C.A.; de Miranda Ventura, M.; Hill, K.; Perracini, M.R. The Four Square Step Test Is a Useful Mobility Tool for Discriminating Older Persons with Frailty Syndrome. Experimental Gerontology 2022, 161, 111699, . [CrossRef]
- Tang, P.-F.; Yang, H.-J.; Peng, Y.-C.; Chen, H.-Y. Motor Dual-Task Timed Up & Go Test Better Identifies Prefrailty Individuals than Single-Task Timed Up & Go Test. Geriatr Gerontol Int 2015, 15, 204–210, . [CrossRef]
- Woollacott, M.; Shumway-Cook, A. Attention and the Control of Posture and Gait: A Review of an Emerging Area of Research. Gait & Posture 2002, 16, 1–14, . [CrossRef]
- Lacour, M.; Bernard-Demanze, L.; Dumitrescu, M. Posture Control, Aging, and Attention Resources: Models and Posture-Analysis Methods. Neurophysiologie Clinique/Clinical Neurophysiology 2008, 38, 411–421, . [CrossRef]
- Tian, Q.; Chastan, N.; Bair, W.-N.; Resnick, S.M.; Ferrucci, L.; Studenski, S.A. The Brain Map of Gait Variability in Aging, Cognitive Impairment and Dementia-A Systematic Review. Neurosci Biobehav Rev 2017, 74, 149–162, . [CrossRef]
- Beauchet, O.; Annweiler, C.; Montero-Odasso, M.; Fantino, B.; Herrmann, F.R.; Allali, G. Gait Control: A Specific Subdomain of Executive Function? Journal of NeuroEngineering and Rehabilitation 2012, 9, 12, . [CrossRef]
- McKee, K.E.; Hackney, M.E. The Four Square Step Test in Individuals with Parkinson’s Disease: Association with Executive Function and Comparison with Older Adults. NRE 2014, 35, 279–289, . [CrossRef]
- Amboni, M.; Barone, P.; Hausdorff, J.M. Cognitive Contributions to Gait and Falls: Evidence and Implications. Mov Disord 2013, 28, 1520–1533, . [CrossRef]
- Yogev, G.; Hausdorff, J.M.; Giladi, N. The Role of Executive Function and Attention in Gait. Mov Disord 2008, 23, 329–472, . [CrossRef]
- Doi, T.; Blumen, H.M.; Verghese, J.; Shimada, H.; Makizako, H.; Tsutsumimoto, K.; Hotta, R.; Nakakubo, S.; Suzuki, T. Gray Matter Volume and Dual-Task Gait Performance in Mild Cognitive Impairment. Brain Imaging Behav 2017, 11, 887–898, . [CrossRef]
- Hupfeld, K.E.; Geraghty, J.M.; McGregor, H.R.; Hass, C.J.; Pasternak, O.; Seidler, R.D. Differential Relationships Between Brain Structure and Dual Task Walking in Young and Older Adults. Frontiers in Aging Neuroscience 2022, 14.
- Parvin, E.; Mohammadian, F.; Amani-Shalamzari, S.; Bayati, M.; Tazesh, B. Dual-Task Training Affect Cognitive and Physical Performances and Brain Oscillation Ratio of Patients With Alzheimer’s Disease: A Randomized Controlled Trial. Frontiers in Aging Neuroscience 2020, 12.
- Kuo, H.-T.; Yeh, N.-C.; Yang, Y.-R.; Hsu, W.-C.; Liao, Y.-Y.; Wang, R.-Y. Effects of Different Dual Task Training on Dual Task Walking and Responding Brain Activation in Older Adults with Mild Cognitive Impairment. Sci Rep 2022, 12, 8490, . [CrossRef]
- Wang, R.-Y.; Huang, Y.-C.; Zhou, J.-H.; Cheng, S.-J.; Yang, Y.-R. Effects of Exergame-Based Dual-Task Training on Executive Function and Dual-Task Performance in Community-Dwelling Older People: A Randomized-Controlled Trial. Games for Health Journal 2021, 10, 347–354, . [CrossRef]
- Nam, S.-M.; Kim, S. Dual-Task Training Effect on Cognitive and Body Function, β-Amyloid Levels in Alzheimer’s Dementia Patients: A Randomized Controlled Trial. J Kor Phys Ther 2021, 33, 136–141, . [CrossRef]
- Ali, N.; Tian, H.; Thabane, L.; Ma, J.; Wu, H.; Zhong, Q.; Gao, Y.; Sun, C.; Zhu, Y.; Wang, T. The Effects of Dual-Task Training on Cognitive and Physical Functions in Older Adults with Cognitive Impairment; A Systematic Review and Meta-Analysis. J Prev Alzheimers Dis 2022, 9, 359–370, . [CrossRef]
- Insel, T.R.; Cuthbert, B.N. Medicine. Brain Disorders? Precisely. Science 2015, 348, 499–500, . [CrossRef]
- Cuthbert, B.N. Research Domain Criteria: Toward Future Psychiatric Nosologies. Dialogues Clin Neurosci 2015, 17, 89–97, . [CrossRef]
- Elsman, E.B.M.; Roorda, L.D.; Smidt, N.; de Vet, H.C.W.; Terwee, C.B. Measurement Properties of the Dutch PROMIS-29 v2.1 Profile in People with and without Chronic Conditions. Qual Life Res 2022, 31, 3447–3458, . [CrossRef]
- Hays, R.D.; Spritzer, K.L.; Schalet, B.D.; Cella, D. PROMIS®-29 v2.0 Profile Physical and Mental Health Summary Scores. Qual Life Res 2018, 27, 1885–1891, . [CrossRef]
- Szu-Ting Fu, T.; Koutstaal, W.; Poon, L.; Cleare, A.J. Confidence Judgment in Depression and Dysphoria: The Depressive Realism vs. Negativity Hypotheses. J Behav Ther Exp Psychiatry 2012, 43, 699–704, . [CrossRef]
- Wilcox, M.E.; Freiheit, E.A.; Faris, P.; Hogan, D.B.; Patten, S.B.; Anderson, T.; Ghali, W.A.; Knudtson, M.; Demchuk, A.; Maxwell, C.J. Depressive Symptoms and Functional Decline Following Coronary Interventions in Older Patients with Coronary Artery Disease: A Prospective Cohort Study. BMC Psychiatry 2016, 16, 277, . [CrossRef]
- Ormel, J.; Rijsdijk, F.V.; Sullivan, M.; van Sonderen, E.; Kempen, G.I.J.M. Temporal and Reciprocal Relationship between IADL/ADL Disability and Depressive Symptoms in Late Life. J Gerontol B Psychol Sci Soc Sci 2002, 57, P338-347, . [CrossRef]
- Russo, S.J.; Nestler, E.J. The Brain Reward Circuitry in Mood Disorders. Nat Rev Neurosci 2013, 14, 609–625, . [CrossRef]
- Price, J.L.; Drevets, W.C. Neural Circuits Underlying the Pathophysiology of Mood Disorders. Trends Cogn Sci 2012, 16, 61–71, . [CrossRef]
- Price, J.L.; Drevets, W.C. Neurocircuitry of Mood Disorders. Neuropsychopharmacol 2010, 35, 192–216, . [CrossRef]
- Kales, H.C.; Gitlin, L.N.; Lyketsos, C.G. Management of Neuropsychiatric Symptoms of Dementia in Clinical Settings: Recommendations from a Multidisciplinary Expert Panel. J Am Geriatr Soc 2014, 62, 762–769, . [CrossRef]
- Ruthirakuhan, M.; Ismail, Z.; Herrmann, N.; Gallagher, D.; Lanctôt, K.L. Mild Behavioral Impairment Is Associated with Progression to Alzheimer’s Disease: A Clinicopathological Study. Alzheimers Dement 2022, 18, 2199–2208, . [CrossRef]
- Ismail, Z.; Smith, E.E.; Geda, Y.; Sultzer, D.; Brodaty, H.; Smith, G.; Agüera-Ortiz, L.; Sweet, R.; Miller, D.; Lyketsos, C.G. Neuropsychiatric Symptoms as Early Manifestations of Emergent Dementia: Provisional Diagnostic Criteria for Mild Behavioral Impairment. Alzheimer’s & Dementia 2016, 12, 195–202, . [CrossRef]
- Devanand, D.P.; Lee, S.; Huey, E.D.; Goldberg, T.E. Associations Between Neuropsychiatric Symptoms and Neuropathological Diagnoses of Alzheimer Disease and Related Dementias. JAMA Psychiatry 2022, 79, 359–367, . [CrossRef]
- Gibson, L.L.; Grinberg, L.T.; ffytche, D.; Leite, R.E.P.; Rodriguez, R.D.; Ferretti-Rebustini, R.E.L.; Pasqualucci, C.A.; Nitrini, R.; Jacob-Filho, W.; Aarsland, D.; et al. Neuropathological Correlates of Neuropsychiatric Symptoms in Dementia. Alzheimers Dement 2023, 19, 1372–1382, . [CrossRef]
- Kim, J.J.; Yoon, K.S. Stress: Metaplastic Effects in the Hippocampus. Trends Neurosci 1998, 21, 505–509, . [CrossRef]
- Conrad, C.D. Chronic Stress-Induced Hippocampal Vulnerability: The Glucocorticoid Vulnerability Hypothesis. Rev Neurosci 2008, 19, 395–411, . [CrossRef]
- Santos, M.A.O.; Bezerra, L.S.; Carvalho, A.R.M.R.; Brainer-Lima, A.M. Global Hippocampal Atrophy in Major Depressive Disorder: A Meta-Analysis of Magnetic Resonance Imaging Studies. Trends Psychiatry Psychother 2018, 40, 369–378, . [CrossRef]
- McKinnon, M.C.; Yucel, K.; Nazarov, A.; MacQueen, G.M. A Meta-Analysis Examining Clinical Predictors of Hippocampal Volume in Patients with Major Depressive Disorder. Journal of Psychiatry and Neuroscience 2009, 34, 41–54.
- Geerlings, M.I.; Gerritsen, L. Late-Life Depression, Hippocampal Volumes, and Hypothalamic-Pituitary-Adrenal Axis Regulation: A Systematic Review and Meta-Analysis. Biological Psychiatry 2017, 82, 339–350, . [CrossRef]
- Cha, J.; Greenberg, T.; Song, I.; Blair Simpson, H.; Posner, J.; Mujica-Parodi, L.R. Abnormal Hippocampal Structure and Function in Clinical Anxiety and Comorbid Depression. Hippocampus 2016, 26, 545–553, . [CrossRef]
- Videbech, P.; Ravnkilde, B. Hippocampal Volume and Depression: A Meta-Analysis of MRI Studies. AJP 2004, 161, 1957–1966, . [CrossRef]
- Gorbach, T.; Pudas, S.; Lundquist, A.; Orädd, G.; Josefsson, M.; Salami, A.; de Luna, X.; Nyberg, L. Longitudinal Association between Hippocampus Atrophy and Episodic-Memory Decline. Neurobiology of Aging 2017, 51, 167–176, . [CrossRef]
- Fjell, A.M.; Walhovd, K.B.; Amlien, I.; Bjørnerud, A.; Reinvang, I.; Gjerstad, L.; Cappelen, T.; Willoch, F.; Due-Tønnessen, P.; Grambaite, R.; et al. Morphometric Changes in the Episodic Memory Network and Tau Pathologic Features Correlate with Memory Performance in Patients with Mild Cognitive Impairment. American Journal of Neuroradiology 2008, 29, 1183–1189, . [CrossRef]
- Sexton, C.E.; Mackay, C.E.; Lonie, J.A.; Bastin, M.E.; Terrière, E.; O’Carroll, R.E.; Ebmeier, K.P. MRI Correlates of Episodic Memory in Alzheimer’s Disease, Mild Cognitive Impairment, and Healthy Aging. Psychiatry Research: Neuroimaging 2010, 184, 57–62, . [CrossRef]
- James, T.A.; Weiss-Cowie, S.; Hopton, Z.; Verhaeghen, P.; Dotson, V.M.; Duarte, A. Depression and Episodic Memory across the Adult Lifespan: A Meta-Analytic Review. Psychol Bull 2021, 147, 1184–1214, . [CrossRef]
- Shen, C.; Rolls, E.T.; Cheng, W.; Kang, J.; Dong, G.; Xie, C.; Zhao, X.-M.; Sahakian, B.J.; Feng, J. Associations of Social Isolation and Loneliness With Later Dementia. Neurology 2022, 99, e164–e175, . [CrossRef]
- van Kooten, J.; Smalbrugge, M.; van der Wouden, J.C.; Stek, M.L.; Hertogh, C.M.P.M. Prevalence of Pain in Nursing Home Residents: The Role of Dementia Stage and Dementia Subtypes. J Am Med Dir Assoc 2017, 18, 522–527, . [CrossRef]
- Powell, V.D.; Abedini, N.C.; Galecki, A.T.; Kabeto, M.; Kumar, N.; Silveira, M.J. Unwelcome Companions: Loneliness Associates with the Cluster of Pain, Fatigue, and Depression in Older Adults. Gerontol Geriatr Med 2021, 7, 2333721421997620, . [CrossRef]
- Angioni, D.; Raffin, J.; Ousset, P.-J.; Delrieu, J.; de Souto Barreto, P. Fatigue in Alzheimer’s Disease: Biological Basis and Clinical Management-a Narrative Review. Aging Clin Exp Res 2023, 35, 1981–1989, . [CrossRef]
- Bannon, S.; Greenberg, J.; Mace, R.A.; Locascio, J.J.; Vranceanu, A.-M. The Role of Social Isolation in Physical and Emotional Outcomes among Patients with Chronic Pain. General Hospital Psychiatry 2021, 69, 50–54, . [CrossRef]
- Stijovic, A.; Forbes, P.A.G.; Tomova, L.; Skoluda, N.; Feneberg, A.C.; Piperno, G.; Pronizius, E.; Nater, U.M.; Lamm, C.; Silani, G. Homeostatic Regulation of Energetic Arousal During Acute Social Isolation: Evidence From the Lab and the Field. Psychol Sci 2023, 34, 537–551, . [CrossRef]
- 2024 Alzheimer’s Disease Facts and Figures. Alzheimers Dement 2024, 20, 3708–3821, . [CrossRef]
- Rodriguez-Raecke, R.; Niemeier, A.; Ihle, K.; Ruether, W.; May, A. Structural Brain Changes in Chronic Pain Reflect Probably Neither Damage nor Atrophy. PLoS One 2013, 8, e54475, . [CrossRef]
- Cruz-Almeida, Y.; Fillingim, R.B.; Riley, J.L.; Woods, A.J.; Porges, E.; Cohen, R.; Cole, J. Chronic Pain Is Associated with a Brain Aging Biomarker in Community-Dwelling Older Adults. Pain 2019, 160, 1119–1130, . [CrossRef]
- Apkarian, A.V.; Sosa, Y.; Sonty, S.; Levy, R.M.; Harden, R.N.; Parrish, T.B.; Gitelman, D.R. Chronic Back Pain Is Associated with Decreased Prefrontal and Thalamic Gray Matter Density. J Neurosci 2004, 24, 10410–10415, . [CrossRef]
- Neumann, N.; Domin, M.; Schmidt, C.-O.; Lotze, M. Chronic Pain Is Associated with Less Grey Matter Volume in the Anterior Cingulum, Anterior and Posterior Insula and Hippocampus across Three Different Chronic Pain Conditions. European Journal of Pain 2023, 27, 1239–1248, . [CrossRef]
- Putra, H.A.; Park, K.; Yamashita, F.; Mizuno, K.; Watanabe, Y. Regional Gray Matter Volume Correlates to Physical and Mental Fatigue in Healthy Middle-Aged Adults. Neuroimage: Reports 2022, 2, 100128, . [CrossRef]
- Shen, C.; Rolls, E.T.; Cheng, W.; Kang, J.; Dong, G.; Xie, C.; Zhao, X.-M.; Sahakian, B.J.; Feng, J. Associations of Social Isolation and Loneliness With Later Dementia. Neurology 2022, 99, e164–e175, . [CrossRef]
Figure 1.
Variable Categorizations Across 3 Frailty Domains.
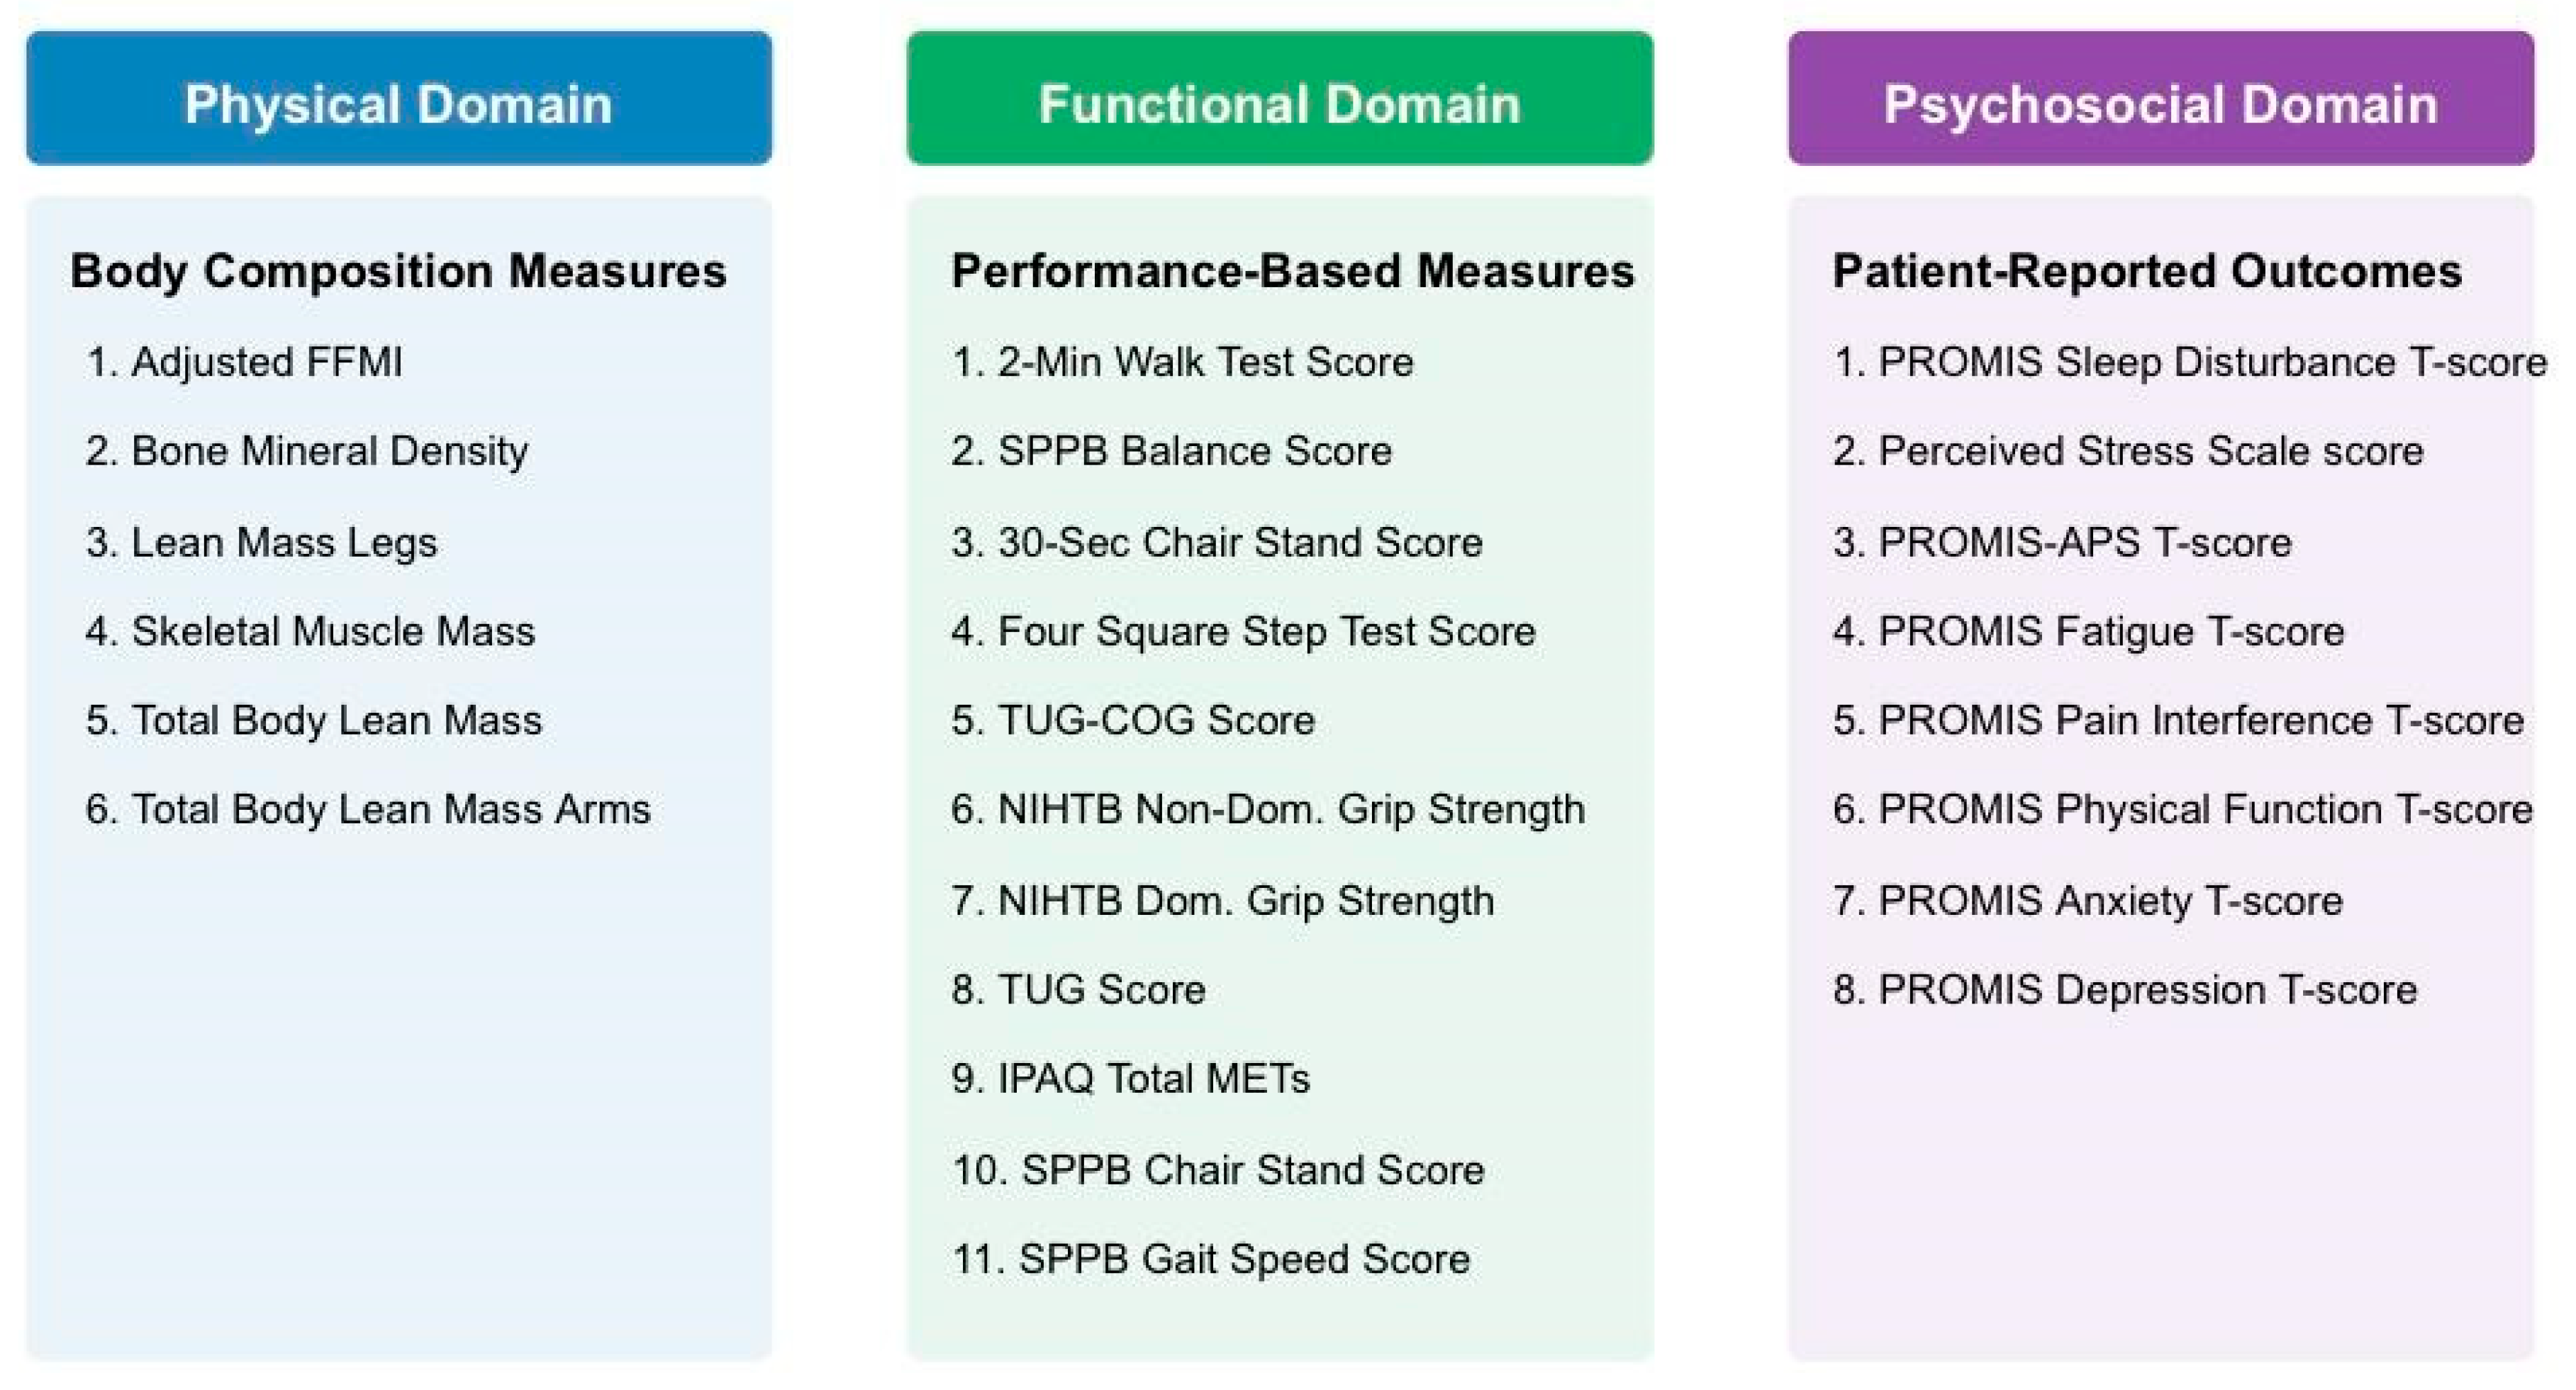
Figure 2.
Factor Loadings of 25 Risk Indicators Across 3 Frailty Domains.
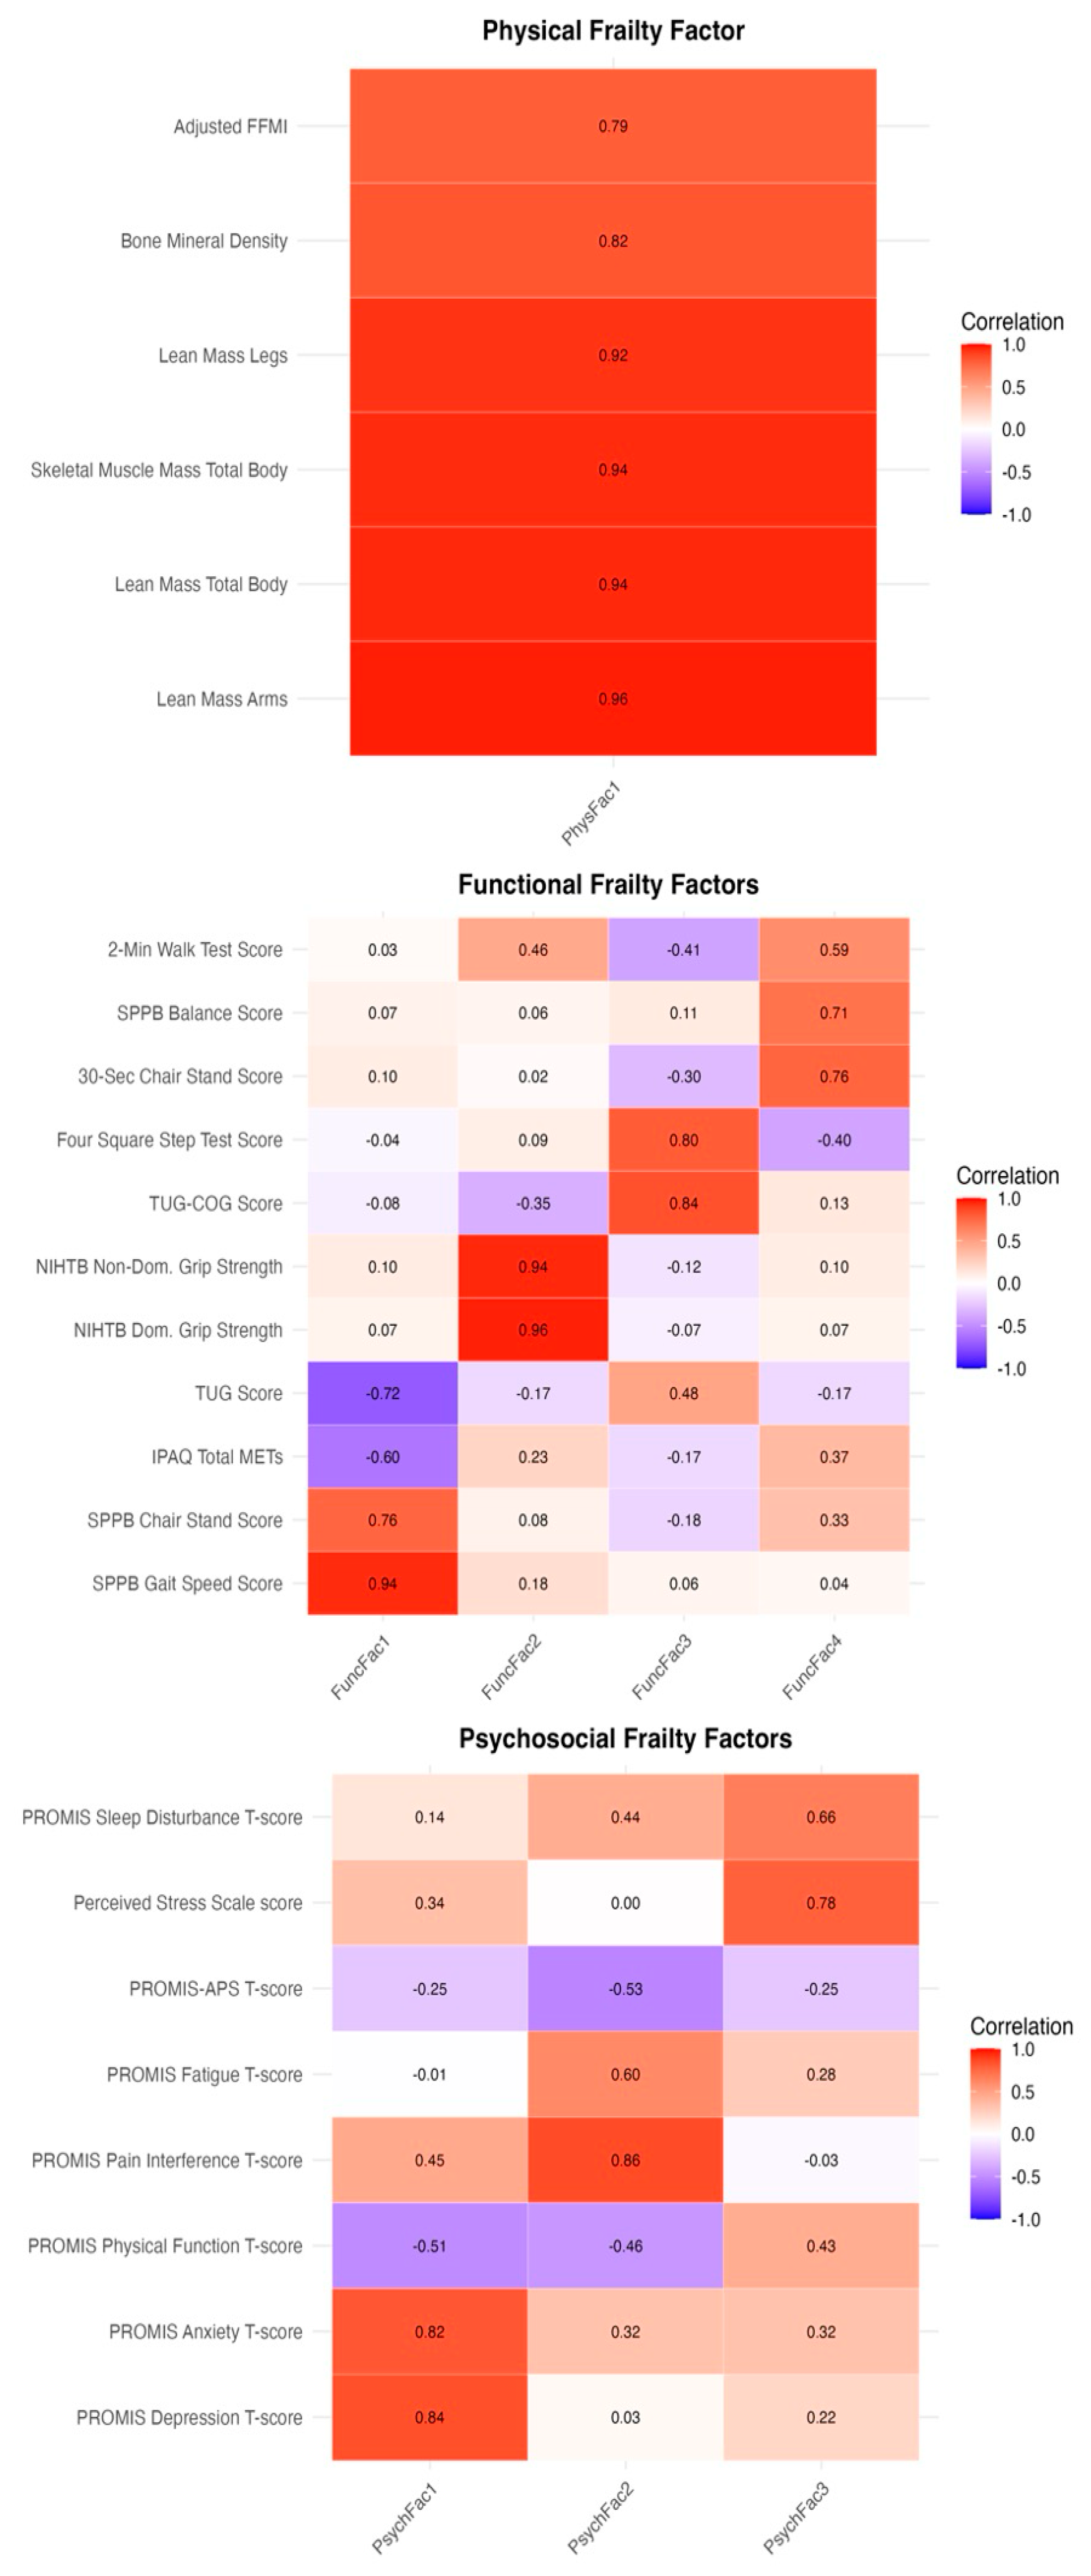
Figure 3.
Significant Associations Between EFA-Derived Frailty Factor Scores and AD-Related Measures.
Figure 3.
Significant Associations Between EFA-Derived Frailty Factor Scores and AD-Related Measures.
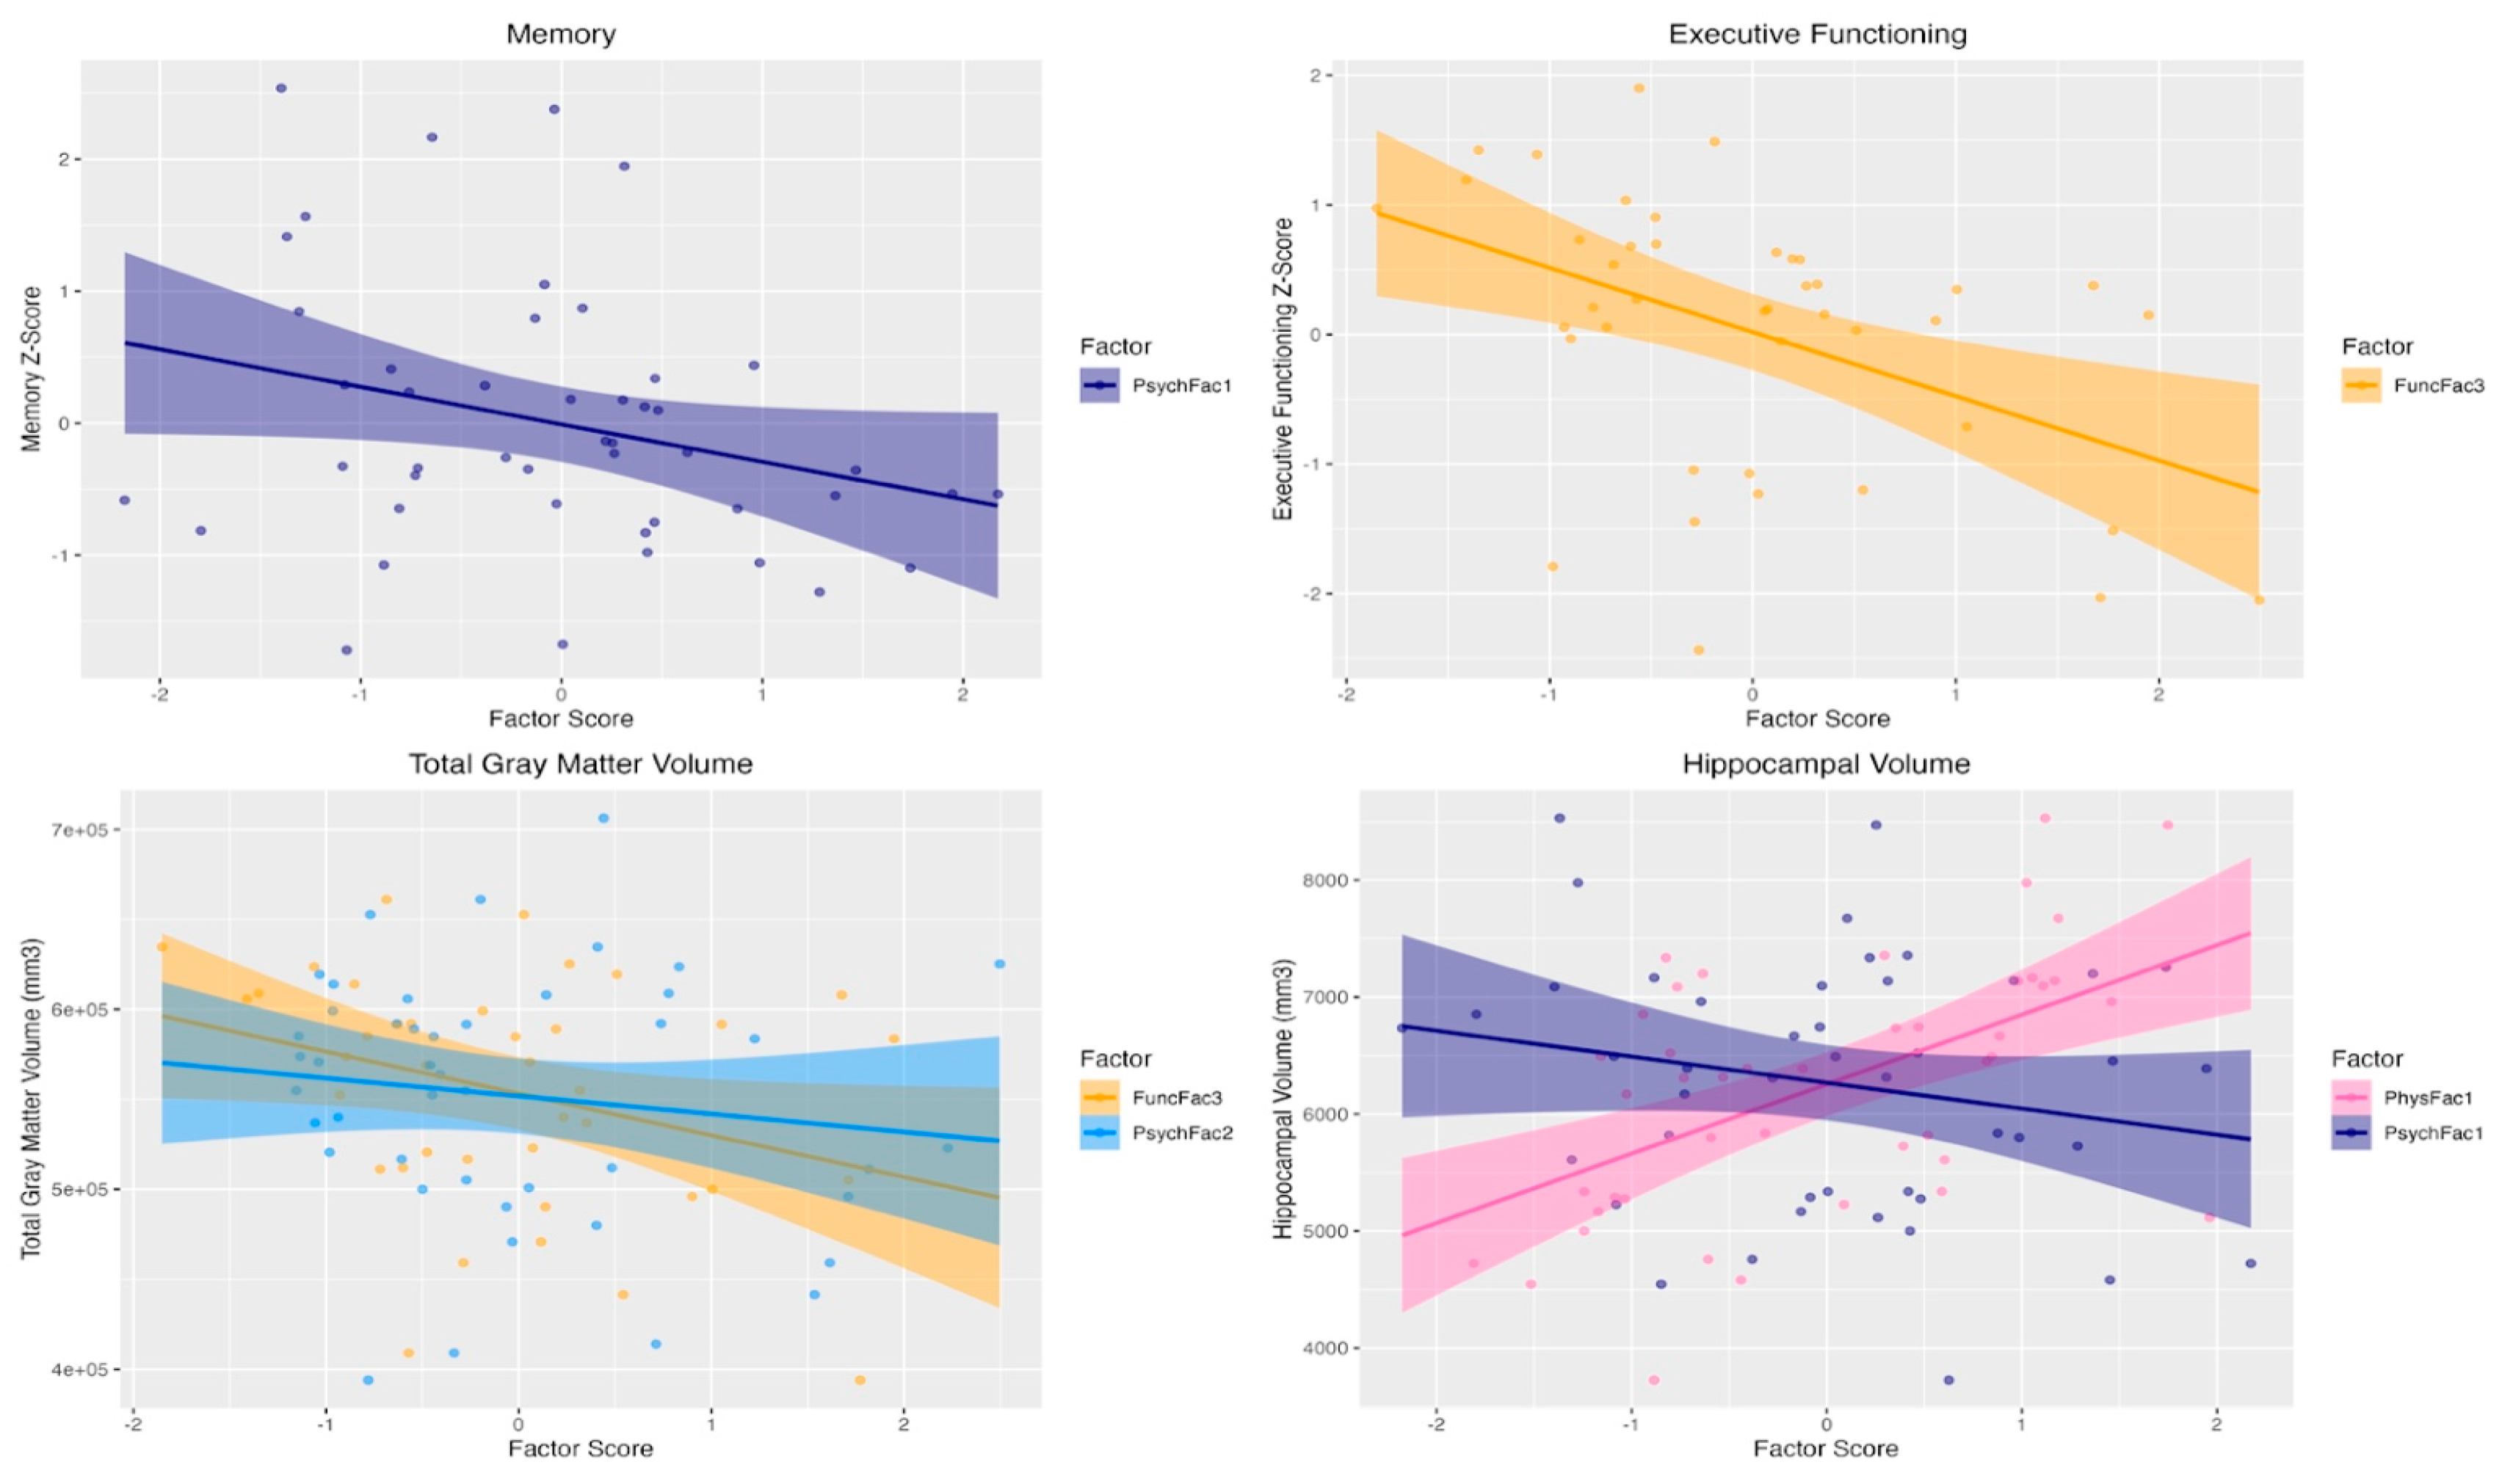

Table 1.
Demographic and clinical characteristics*.
| Characteristic | Value |
| Age (years) | 71.8 ± 7.2 |
| Biological Sex (F/M) | (24/24) |
| Years of Education | 16.8 ± 2.6 |
| Race | |
| American Indian or Alaska Native | 1 (2.1%) |
| Asian | 5 (10.4%) |
| Black or African American | 1 (2.1%) |
| White | 40 (83.3%) |
| Other | 1 (2.1%) |
| Ethnicity (Hispanic) | 2 (4.2%) |
| Handedness (Right/Left/Ambidextrous) | (42/4/2) |
| APOE-ε4 carriers, n (%)# | 35 (73.9%) |
| MoCA (total score, 0-30) | 21.4 ± 3.8 |
| Memory Test Scores | |
| Rey Auditory Verbal Learning Test (words recalled) | 14.5 ± 6.2 |
| WMS-IV Verbal Paired Associates I (scaled score) | 6.5 ± 3.3 |
| WMS-IV Verbal Paired Associates II (total scaled score) | 7.4 ± 3.8 |
| WMS-IV Verbal Paired Associates II (scaled score) | 6.6 ± 3.6 |
| WMS-IV Verbal Paired Associates I (scaled score) | 5.7 ± 3.6 |
| Executive Functioning Test Scores | |
| Trail Making Test – Part B (seconds) | 138 ± 64 |
| NIH Toolbox Oral Symbol Digit Test (correct responses) | 45.4 ± 18.4 |
| Imaging Measures$ | |
| Total Gray Matter Volume (mm³) | 551943 ± 69353 |
| Hippocampal Volume (mm³) | 6263 ± 1083 |
* Values indicate mean ± standard deviation (SD) for continuous measures and n (%) for categorical measures #Participants with ε3/ε4 or ε4/ε4 polymorphism $Imaging measures were available for N=45 participants
Table 2.
Predictors of cognitive and brain volumetric measures.
| Outcome | Model Statistics* | Predictor | β (95%CI); r (p-value) |
| Memory z-score | F(5, 41) = 2.98, p = 0.02; adj R2 = 0.27 | Psychosocial Factor 1 (Psychological Distress) | -0.35 (-0.64, -0.07); -0.36 (0.02) |
| Executive functioning z-score | F(5, 41) = 2.78, p = 0.03; adj R2 = 0.28 | Functional Factor 3 (Dual-task Performance) |
-0.55 (-0.89, -0.21); -0.48 (0.002) |
| Total Gray Matter Volume (mm³) | F(7, 37) = 19.09, p < 0.0001; adj R2 = 0.81 | Functional Factor 3 (Dual-task Performance) |
-15676.8 (-28142.1,-3211.4); -0.42 (0.01) |
| Psychosocial Factor 2 (Physical & Social Limitations) |
-8619.3 (-19106.2,-1867.5); -0.33 (0.05) | ||
| Hippocampal Volume (mm³) | F(7, 37) = 14.54, p < 0.0001; adj R2 = 0.73 | Physical Factor 1 (Lean Mass) |
781.5 (371.8, 1191.2); 0.54 (0.0004) |
| Psychosocial Factor 1 (Psychological Distress) |
-206.2 (-408.6, -3.8); -0.32 (0.05) |
*For all models, age, sex, education, and ε4 status (and total intracranial volumes for the volumetric outcomes) were included as covariates.
Disclaimer/Publisher’s Note: The statements, opinions and data contained in all publications are solely those of the individual author(s) and contributor(s) and not of MDPI and/or the editor(s). MDPI and/or the editor(s) disclaim responsibility for any injury to people or property resulting from any ideas, methods, instructions or products referred to in the content. |
© 2025 by the authors. Licensee MDPI, Basel, Switzerland. This article is an open access article distributed under the terms and conditions of the Creative Commons Attribution (CC BY) license (http://creativecommons.org/licenses/by/4.0/).
Copyright: This open access article is published under a Creative Commons CC BY 4.0 license, which permit the free download, distribution, and reuse, provided that the author and preprint are cited in any reuse.


