1. Introduction
The carbon emission of buildings during operation accounts for about 40% of the total carbon emission of the whole society in China. As an effective way to achieve low carbon or even zero carbon emission in the construction industry, zero-carbon buildings have far-reaching development significance [[1[
3]. Zero-carbon buildings aim to avoid the consumption of traditional energy sources such as coal, electricity and oil, and provide all energy consumption by the renewable energy generated on the site. By strengthening the passive energy-saving design of the building envelope and shifting the building's energy demand to renewable energy sources such as solar energy, wind energy, shallow geothermal energy and biomass energy, the greenhouse gas emissions are minimized. It does not have any negative impact on climate change [[4[
6]. For example, London Beddington Zero Carbon Community, China Academy of Building Science Zero carbon Building, Shanghai World Expo Zero Carbon Pavilion, etc. are all typical representatives of zero carbon buildings, which demonstrate the feasibility and advantages of zero carbon buildings in practical applications. However, the operation and scheduling of the complex energy system in zero-carbon buildings are faced with many challenges. The complex energy system usually contains different types of energy such as electricity, heat, cold and gas, and there are complex coupling relations among the energy subsystems [
7]. In addition, the dynamic energy use characteristics of zero-carbon buildings are different from traditional buildings, and the composite energy system needs to meet the needs of low-carbon, efficient, flexible, reliable and safe building energy use [
8]. The above characteristics put forward high requirements for realizing optimal scheduling strategies for zero-carbon building complex energy systems.
Therefore, it is of great significance to study the operation scheduling method of complex energy system in zero-carbon building, which can effectively promote the research and application of zero-carbon building technology.
Many scholars around the world have carried out research on the optimization of building energy system. Wang et al. [
9] studied the building integrated energy system with photovoltaic, collector, underground pipe storage and heat pump as the core, and took improving the cross-season energy storage capacity of heat pump as the main goal of optimizing the system design. Wang et al. [
10] studied the integrated building energy system coupled with photovoltaic, wind power and molten salt, solid heat storage, electrode boiler and battery, and achieved the goal of reducing the total operating cost by 20%. Li et al. [
11] compared different configuration schemes of cogeneration units, wind power generation, ground source heat pump, electricity storage, heat storage, cold storage and other equipment, and found that energy consumption could be reduced by 3.86% under different schemes. In terms of operation optimization of building coupled energy system, Luthander et al. [
12,
13] visually analyzed the supply-demand matching performance of distributed PV and building electricity in different types of buildings through the "supply-demand matching chart". Sibbitt et al. [
14] studied a solar thermal system with borehole cross-season energy storage and improved the system's operating energy efficiency by 5% through operation optimization. Chu et al. [
15] studied the solar-coupled cross-season energy storage system and reduced the operating cost by 8% by optimizing the operating strategy. Jeong et al. [
16] made a comparative study on the operation adjustability of the coupled system of solar photovoltaic power generation and ground source heat pump, and the Seasonal performance factors increased by 55.3% compared with the single ground source heat pump system by optimizing operation strategies.
Many scholars have carried out related research on coupling control methods of complex energy systems. Zhu Yanmei et al. [
17] established an optimal scheduling model that took into account the fluctuations of power generation and output to reduce the volatility of new energy. Wei et al. [
18] constructed a functional relationship between the fluctuation of new energy output and the rescheduling of generator set in view of the scheduling problem of the combined operation system. Li Pai et al. [
19] put forward an optimization scheduling model of wind power-pumping and storage power station collaboration, which reduces the influence of randomness of wind power output on power grid operation. Nystrup et al. [
20] proposed a time estimation series method considering autocorrelation and cross-correlation, which significantly improved the accuracy of load prediction. Zhao Fengzhan et al. [
21] proposed a multi-time scale energy coordinated optimization scheduling model based on the combination of model prediction and mode decomposition, which effectively improved the operational energy efficiency of the integrated energy system. YILDIRANU et al. [
22] proposed a real-time operation method of stochastic predictive control for risk avoidance of the combined power generation system involving the extraction and storage power stations.
In terms of considering demand response and flexible interaction, Daneshvar et al. [
23] proposed a two-stage day-day-day stochastic programming model for the combined operation system of wind power, thermal power, hydropower, extraction and storage, aiming to maximize the potential of clean energy in the combined operation system. Meng Yan et al. [
24] conducted modeling research on the uncertainty of regulating load resources in optimal scheduling. Liu Xiaocong et al. [
25] considered the uncertainty of new energy and established a two-stage stochastic programming model to improve the absorption capacity of new energy. Zhao Bo et al. [
26] introduced demand response to optimize the power consumption mode of users, improve the load curve, and improve the stability of the system. Wang et al. [
27] established an integrated energy system optimization scheduling model with refined demand response mechanism considering environment, economic benefits and energy supply reliability, thus improving the utilization efficiency of integrated energy. Guo et al. [
28] applied the demand response strategy to the new renewable hybrid energy power generation system, and studied the effectiveness of the strategy in both typical and extreme situations. Chen Baorui et al. [
29] applied incentive demand response to transmission network expansion planning to reduce costs by reasonably selecting the proportion of demand response. Mingbo et al. [
30] took Longyangxia water-light complementary power Station as an object to study the planning of water-light complementary power generation and the method of smoothing PV output fluctuation respectively. Yin et al. [
31] adopted Copula theory to capture the correlation between the amount of wind power and photovoltaic power generation, and proposed a random scheduling model to carry out day-ahead coordinated scheduling. Karimi et al. [
32] established a multi-energy complementary optimal scheduling model including the pumping and storage units, and demonstrated the service capability of the pumping and storage units to the power grid through the actual data of the power grid. Hu et al. [
33] established a two-stage model of day-ahead scheduling and real-time scheduling for the wind-water-pumping and storage combined operating system, and proposed a benefit distribution method based on the improved Shapley value method to improve the overall operating efficiency.
To sum up, although relevant researches on building complex energy systems have been carried out at home and abroad, the following problems still exist:
Most of the research on building complex energy systems carried out by the building industry focuses on the related content of building cold and heat source systems, failing to cover the main system equipment of electrothermal and cold complex energy systems;
The power industry has carried out research on energy system scheduling methods based on day-ahead and day-day coupling control, but this method is mainly aimed at power generation equipment, does not take into account the flexible energy use requirements of zero-carbon building terminals, and does not consider the complex characteristics of coupling with heat and cold source systems;
Due to the small number of practical projects of zero-carbon buildings, the existing researches mostly stay at the theoretical level and fail to verify the actual effect of the control method in the practical projects of zero-carbon buildings.
Therefore, this study selected a zero-carbon building practical project, considering the flexible and adjustable capacity of equipment in zero-carbon buildings, and adopted the day-ahead flexible planning-intraday rolling optimization algorithm to complete the operation optimization of photovoltaic, electricity storage, heat pump and water storage systems in zero-carbon buildings, which has important practical significance.
2. Materials and Methods
2.1. Composition and Operation of a Typical Zero-Carbon Building Compound Energy System
In this paper, an office building in Beijing is taken as a typical zero-carbon office building, with a total of 4 floors, construction area of 4025㎡, mainly including office, conference room, equipment room, toilet and stairwell and other functional parts. The building adopts high-performance envelope structure to reduce energy demand, and the external wall comprehensive heat transfer system reaches 0.2W/ (㎡.k). The roof comprehensive heat transfer coefficient reaches 0.25W/ (㎡.k), the exterior doors and Windows comprehensive heat transfer system reaches 1.0W/ (㎡.k), the building full heat fresh air heat recovery efficiency reaches 70%, the intelligent lighting system, the building air tightness and indoor environmental parameters meet the requirements of the current Chinese near-zero energy building standards.
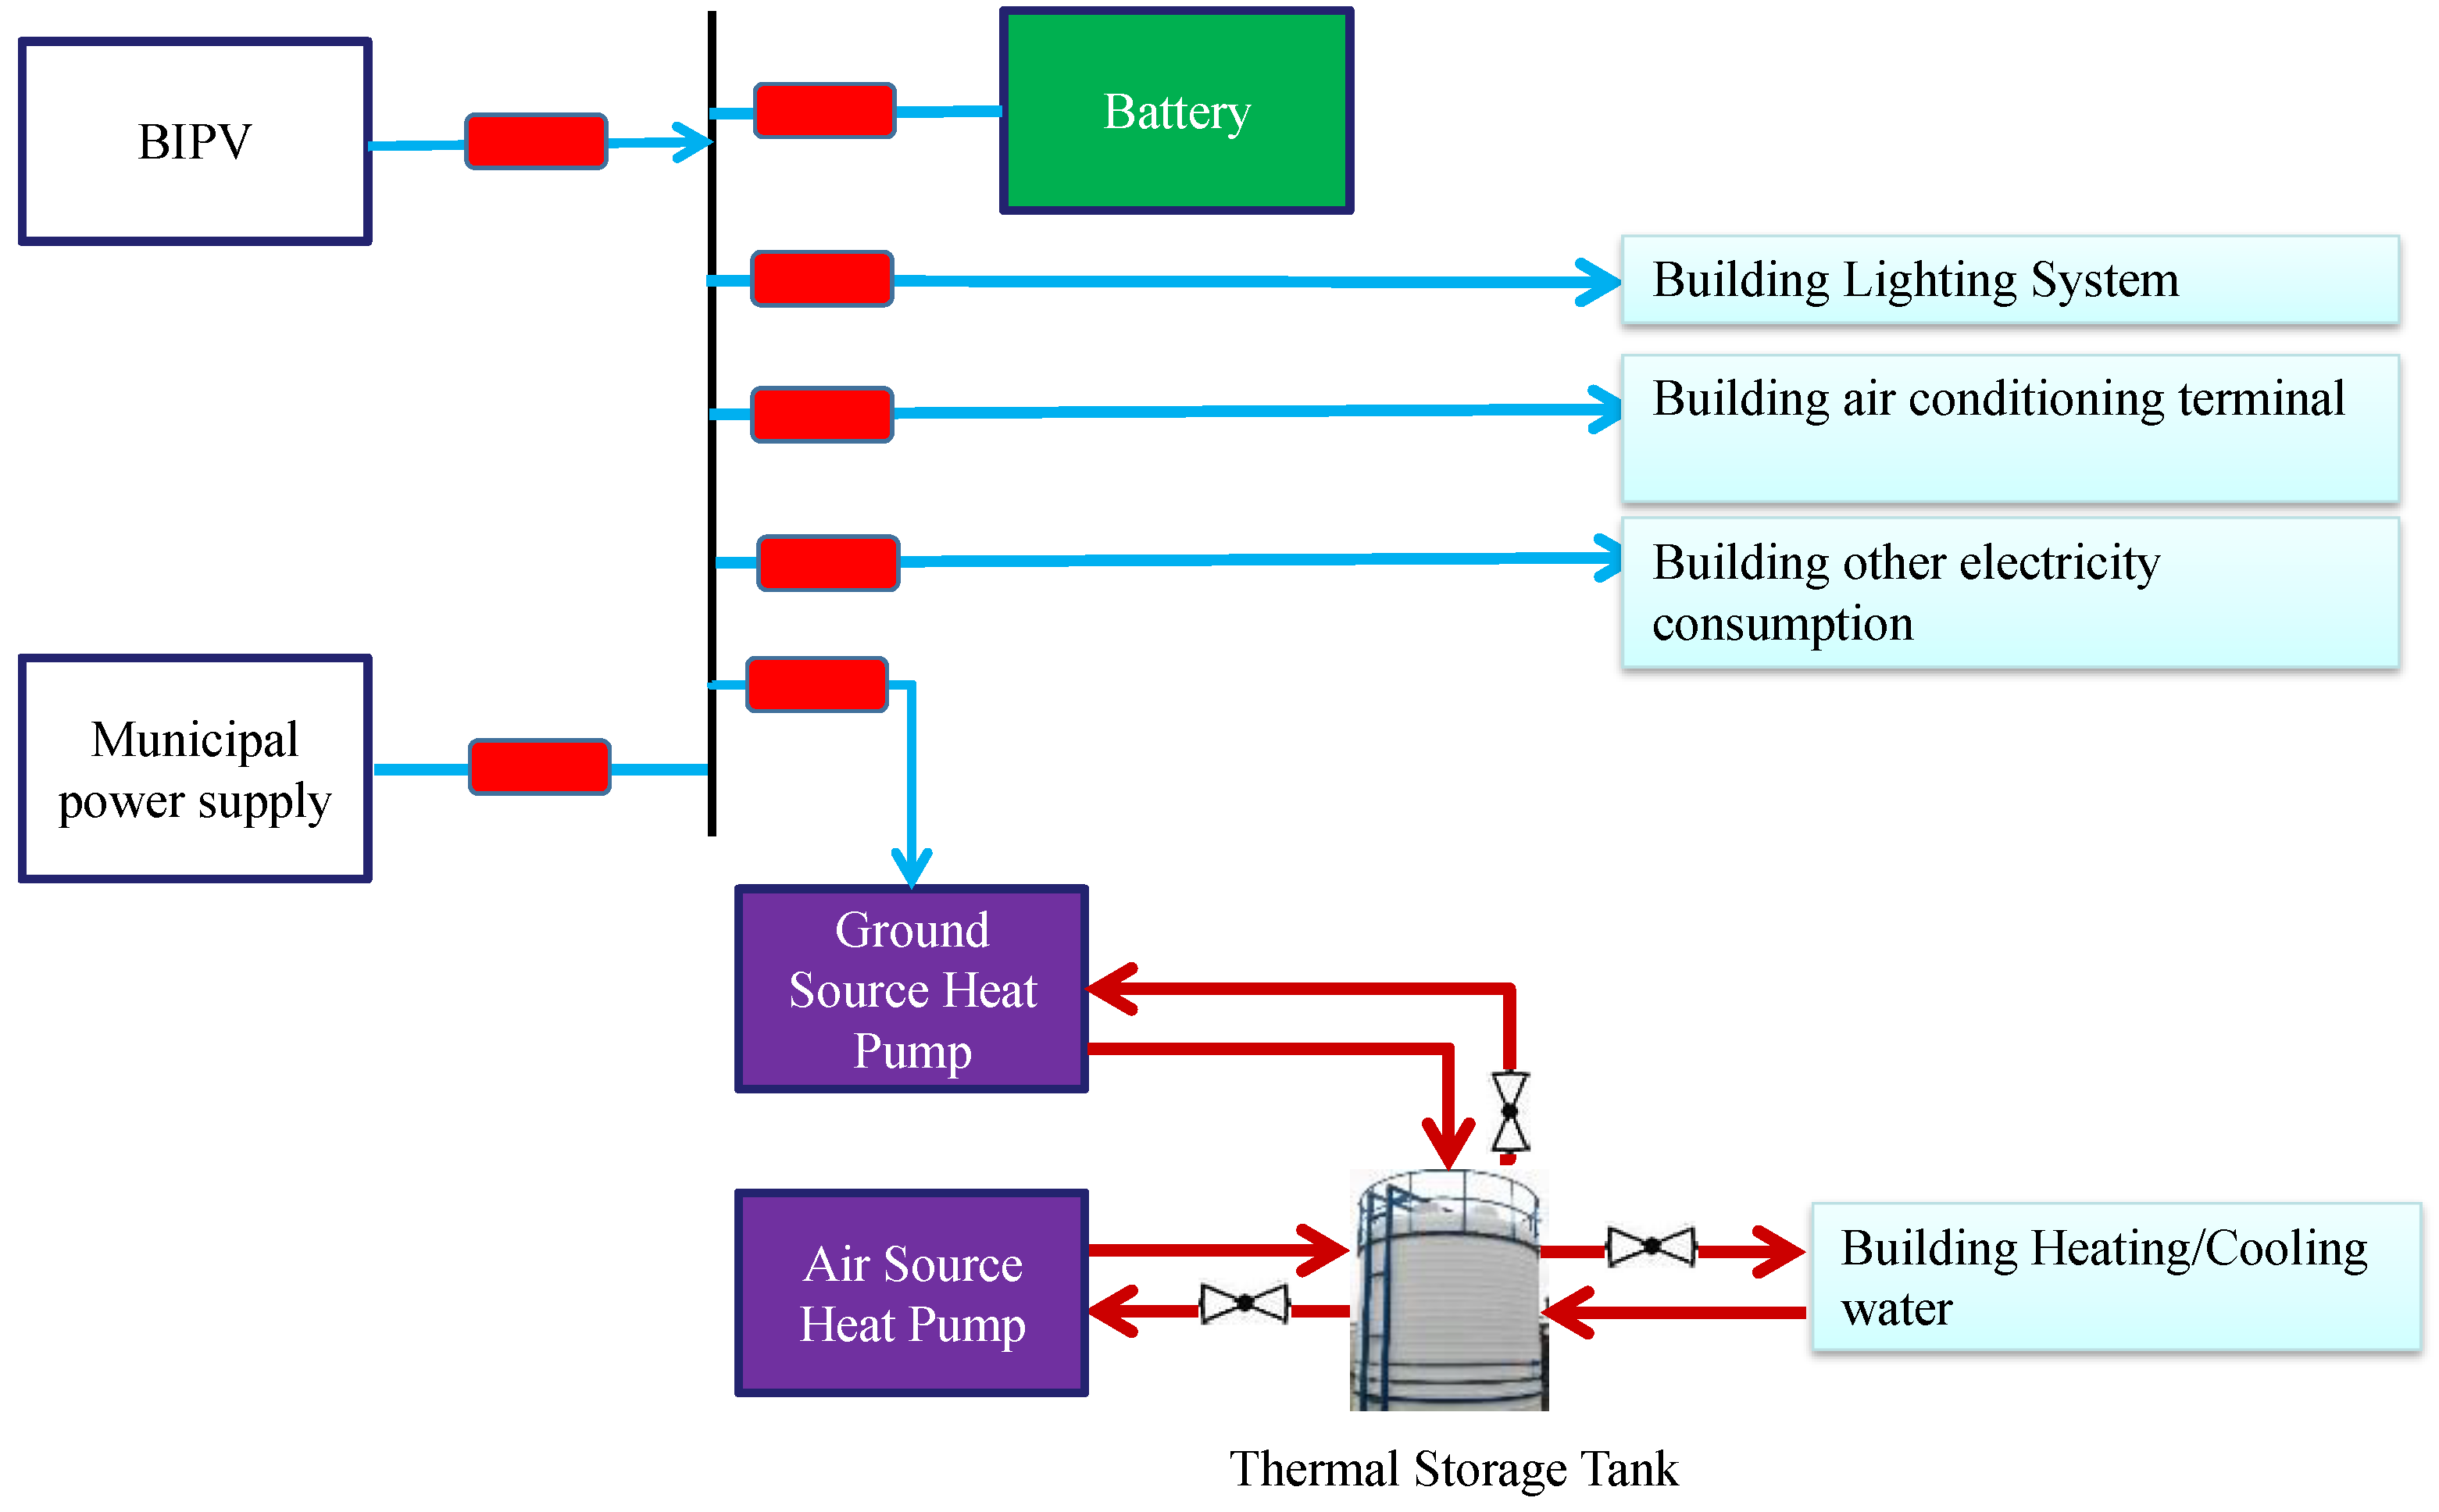
Typical zero-carbon buildings adopt compound energy systems, including photovoltaic power generation system, electricity storage system, ground source heat pump system, air source heat pump system, and water storage system. Under the premise of good energy-saving foundation of the building body, through the utilization of efficient cold and heat source system and photovoltaic renewable energy system, efforts are made to achieve the annual balance of energy consumption and production capacity of typical buildings. The flow chart of a typical zero-carbon building compound energy system is shown in
Figure 1.
The installed capacity of the roof photovoltaic power generation and the facade photovoltaic power generation in the site is 235kW, and the battery with a capacity of 50kWh is equipped for demonstration. The photovoltaic power generation system first meets the power demand of the building, and the excess power is sold online. When there is a shortage of on-site renewable energy generation, the building draws electricity from the grid. The office building uses the ground source heat pump system as the main energy system and the air source heat pump as the auxiliary energy system. A low temperature cold water ground source heat pump unit with a rated cooling capacity of 50kW and a rated heat production of 52kW bears the fresh air load in the building (except for the other floors on the third floor), and a high temperature cold water ground source heat pump unit with a rated cooling capacity of 105kW and a rated heat production of 103kW and a water cooling and heat storage system bears the cold and heat load in the main room of the building.
Before December 2023, the operation control of the compound energy system of a typical zero-carbon building is based on the TOU price policy and manual experience control. According to the average energy consumption of the peak section of the building in the previous week, the system completes cold and heat storage and electricity storage at night during the valley price electricity period, and gives priority to energy release during the peak section electricity price period the next day. The table of TOU peak and Valley electricity price in Beijing is shown in
Table 1.
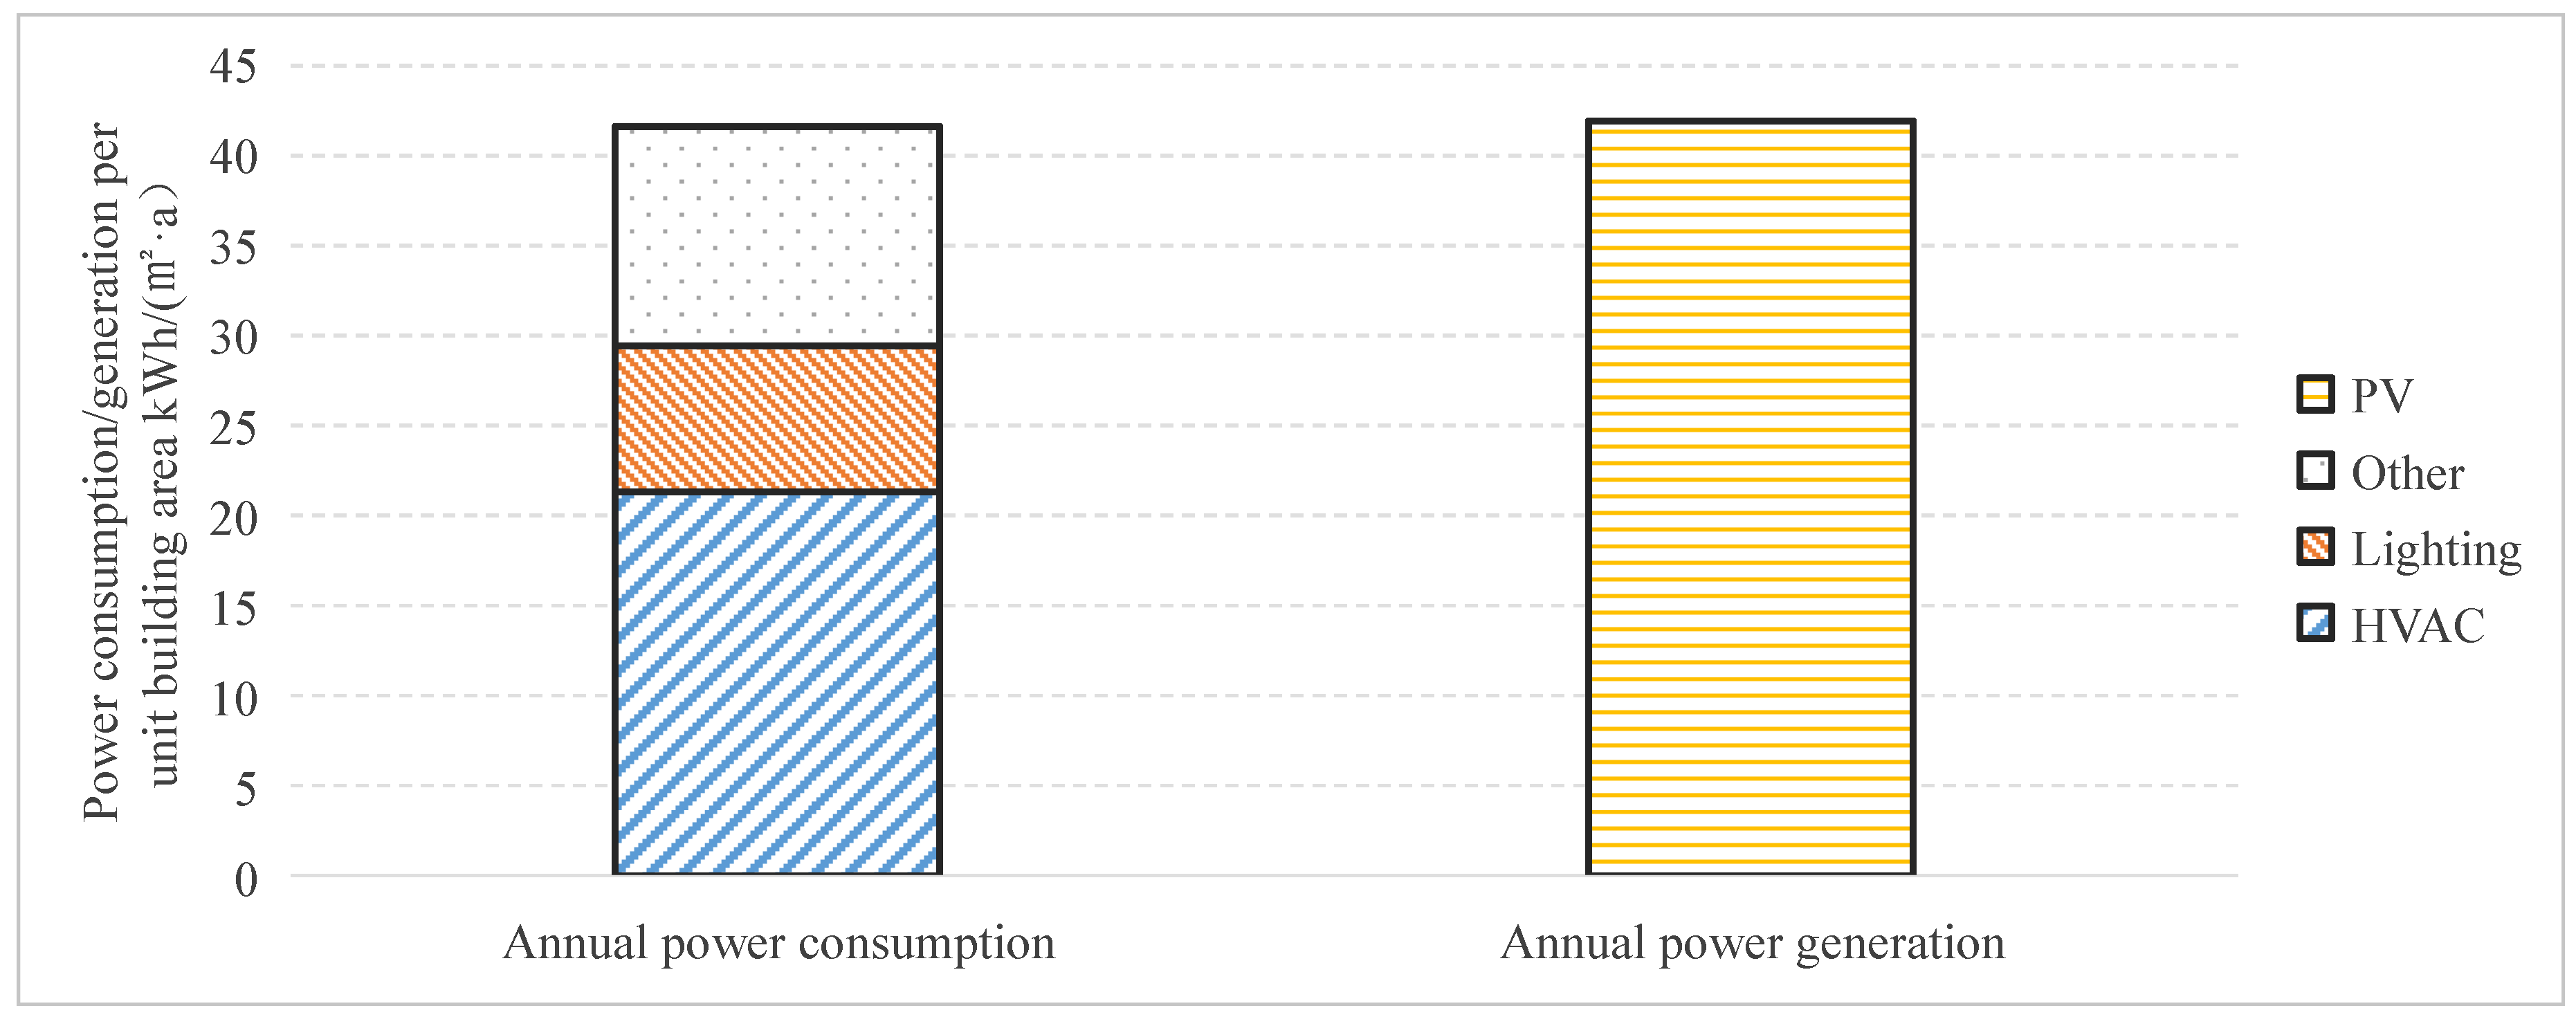
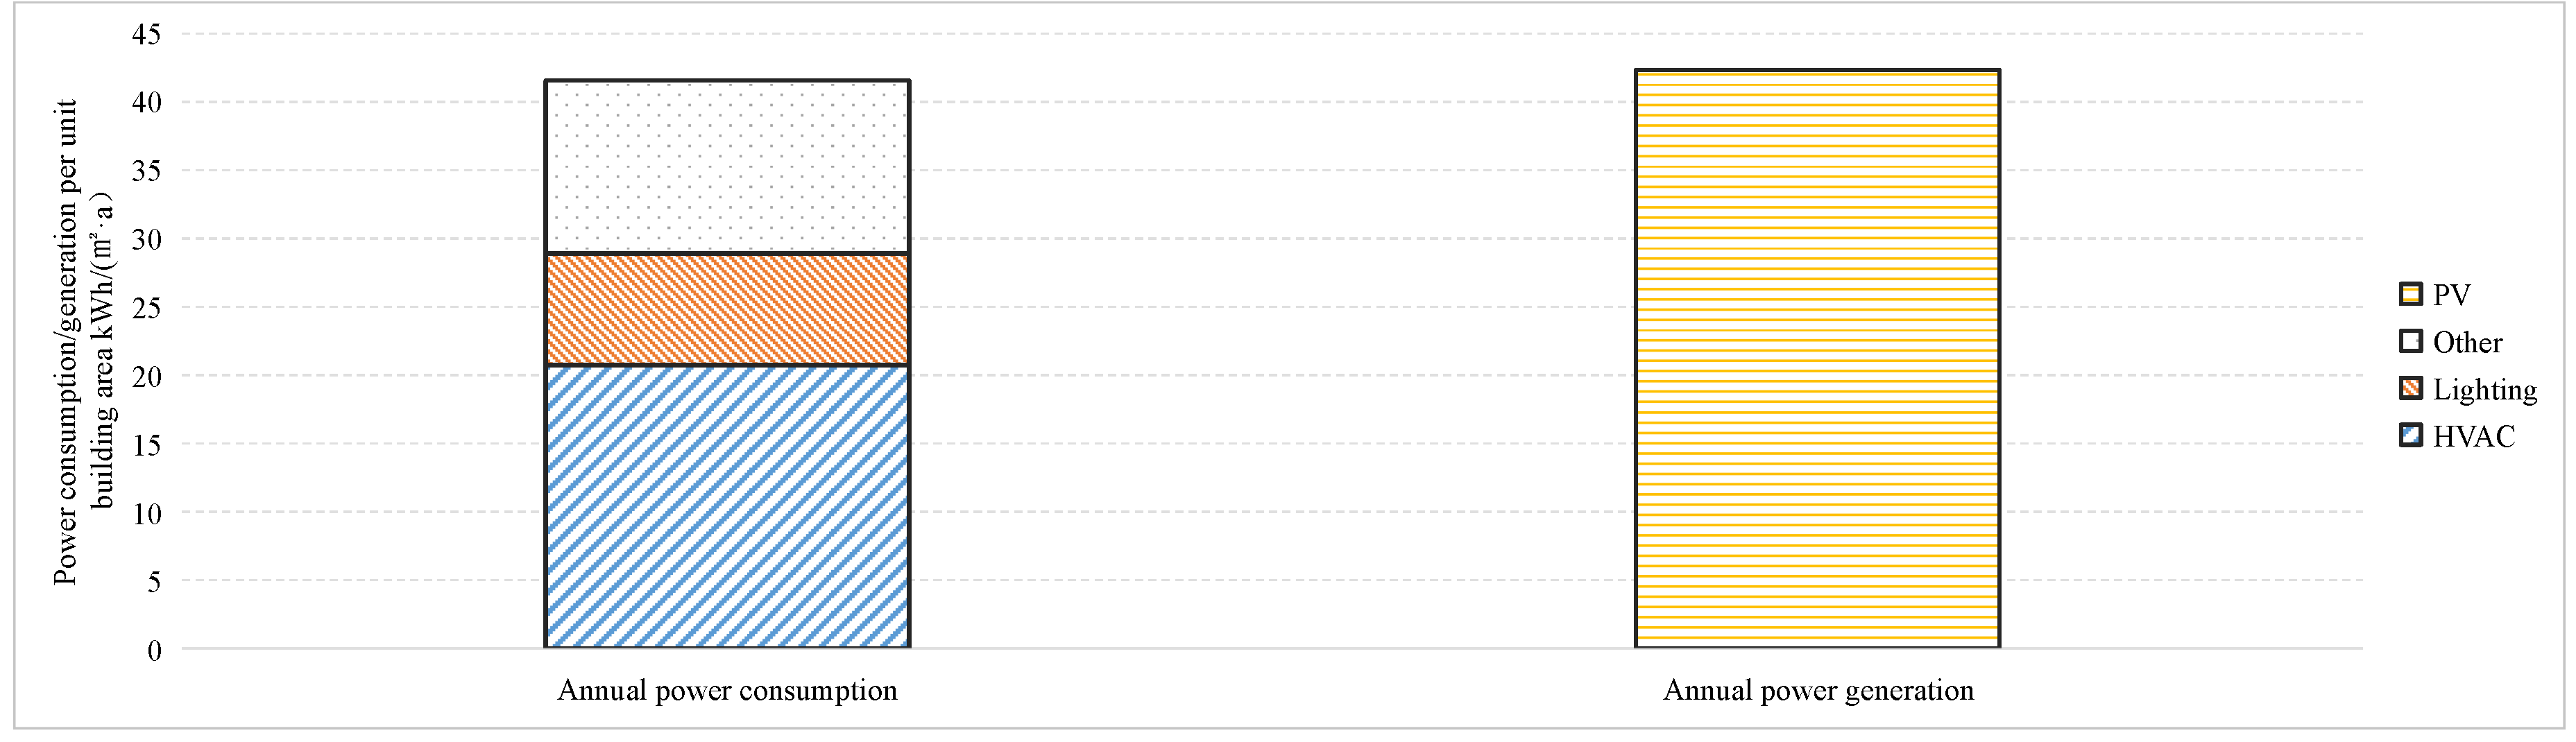
According to the annual actual operation data of zero-carbon buildings from December 2022 to November 2023, the actual monitoring data of annual on-site photovoltaic power generation and building electricity consumption of typical zero-carbon office buildings are shown in
Figure 2 and
Table 2. The total power generation of on-site photovoltaic system is 41.93kWh/ (㎡·a) (per unit building area). The annual electricity consumption per unit area of the building is 41.61kWh/ (㎡·a). In the "year" time scale, the total amount of on-site renewable energy power generation can meet the total electricity demand of the building. In terms of theoretical calculation, the carbon emissions generated by building energy consumption and the carbon reduction amount of renewable energy power generation are balanced annually.
When analyzing the actual consumption of photovoltaic, this paper adopts the self-consumption proportion of renewable energy generation buildings as the basis for analysis of the utilization of photovoltaic power generation. The part of photovoltaic power generation that does not sell electricity online is considered to be the local self-consumption of photovoltaic power generation. The calculation formula of the self-consumption rate of photovoltaic power generation buildings is shown in formula (1). The actual local photovoltaic power generation consumed by typical zero-carbon buildings throughout the year accounted for 81.18% of the total annual photovoltaic power generation (excess photovoltaic power generation sold online), and the carbon emission balance of buildings was not achieved in the actual operation process.
In the formula, indicates the photovoltaic power generation consumed by the building itself, indicates the photovoltaic electricity sold online, and indicates the total photovoltaic power generation.
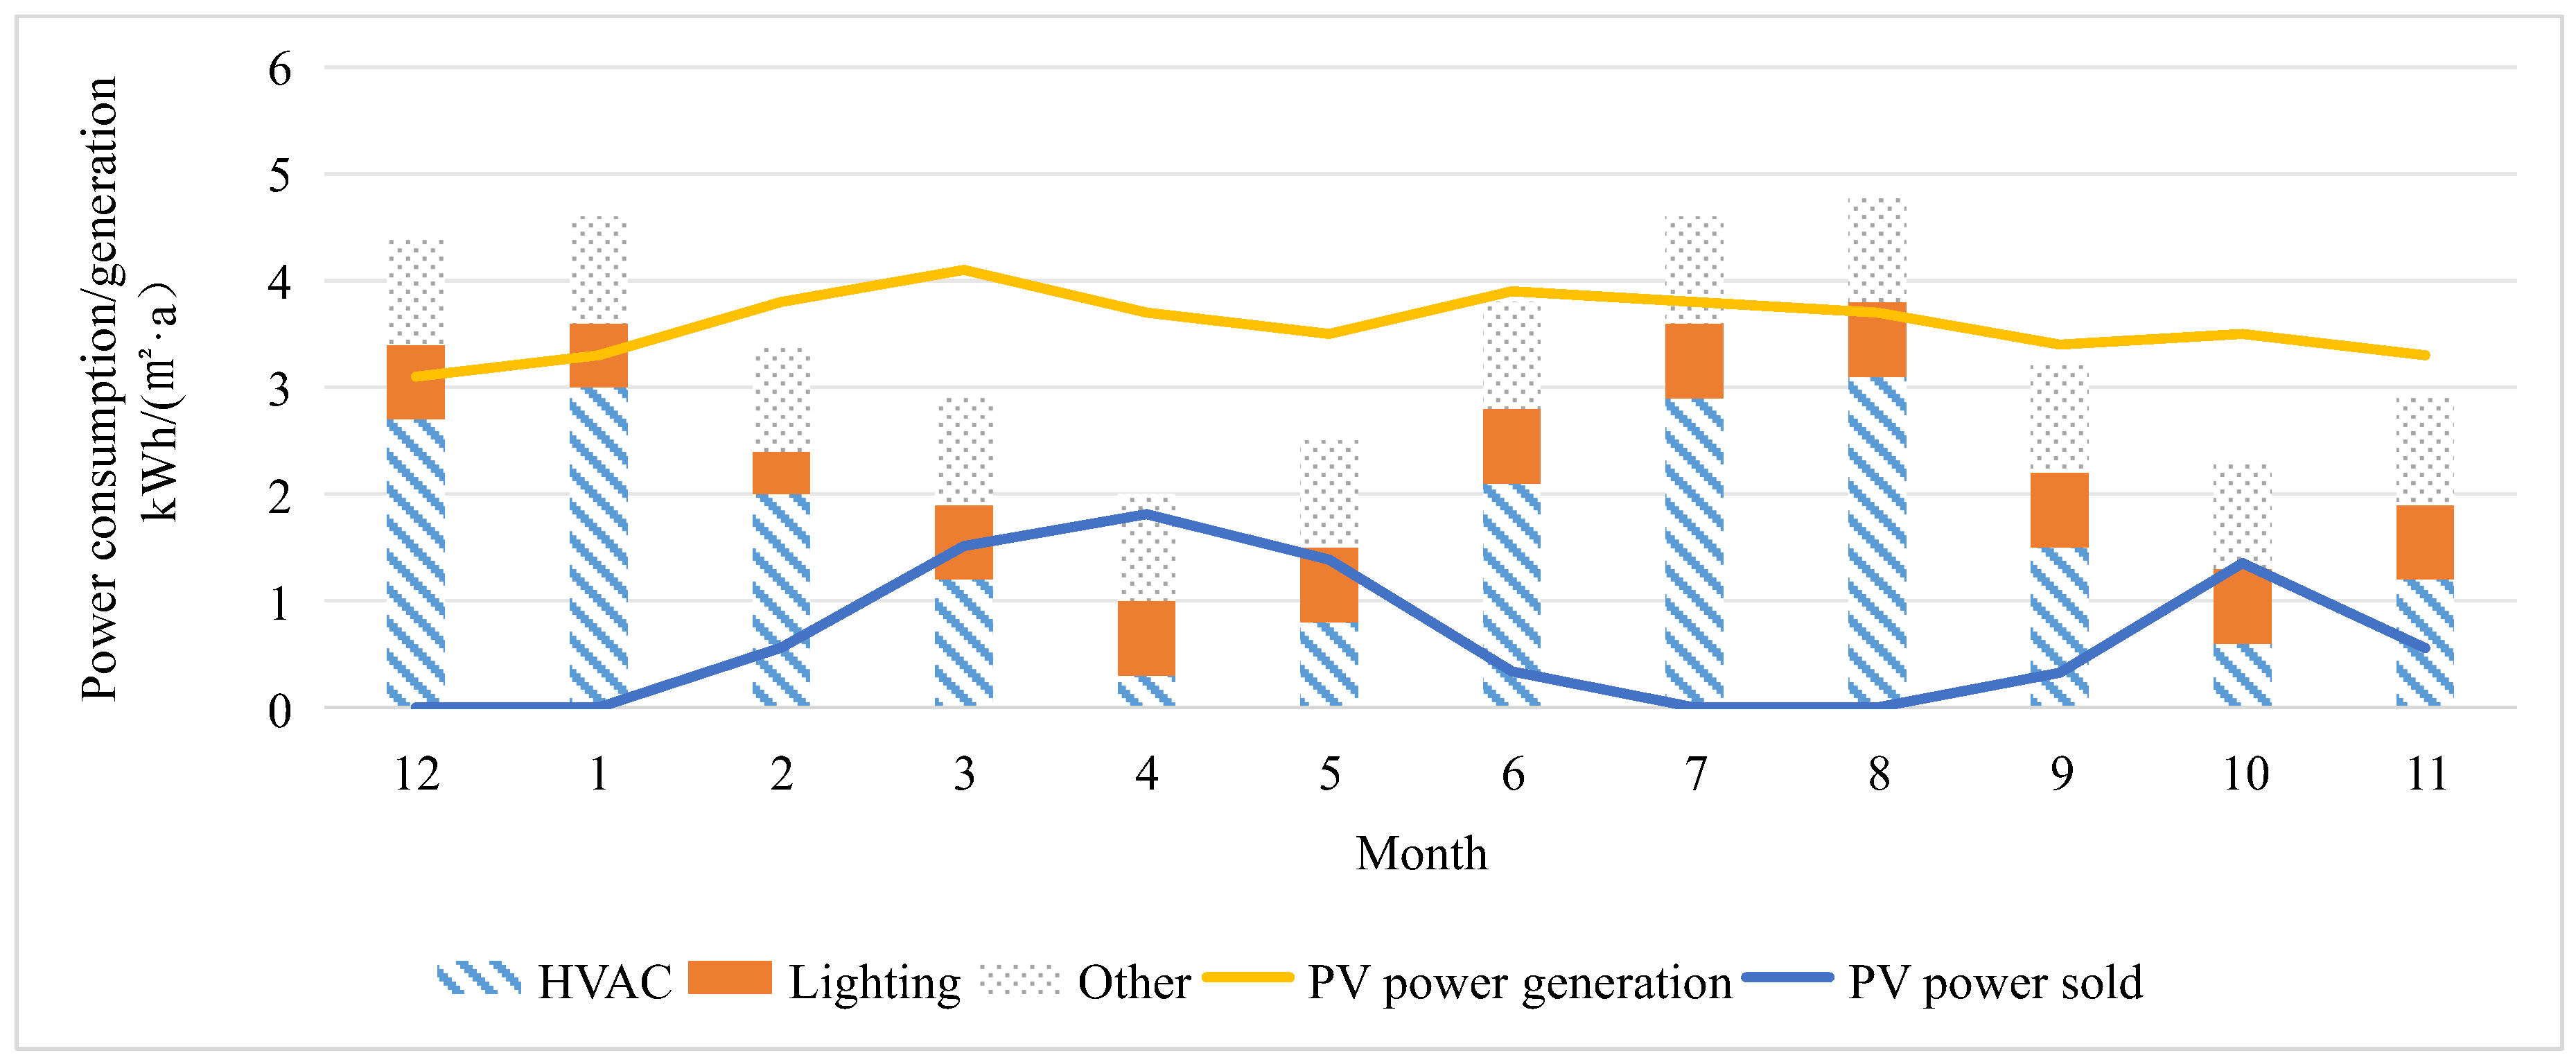
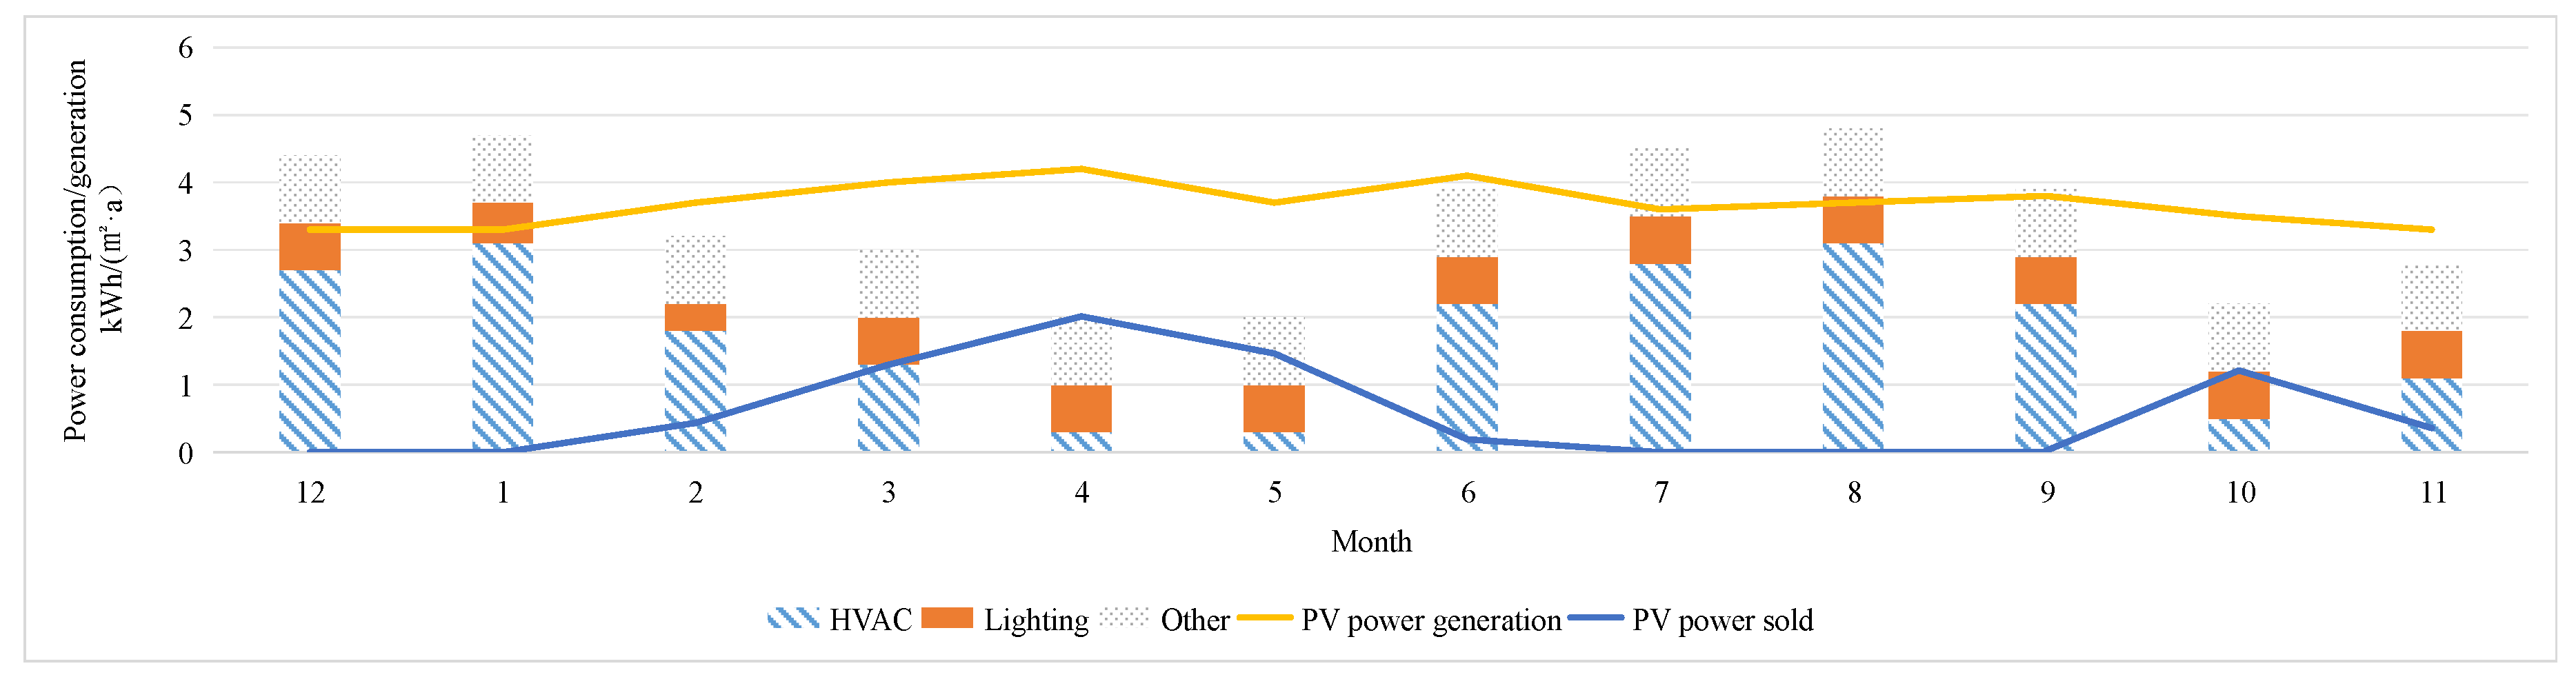
When we analyze the monthly energy system operation of a typical zero-carbon building, the monthly electricity consumption and local photovoltaic power generation of a zero-carbon office building are shown in
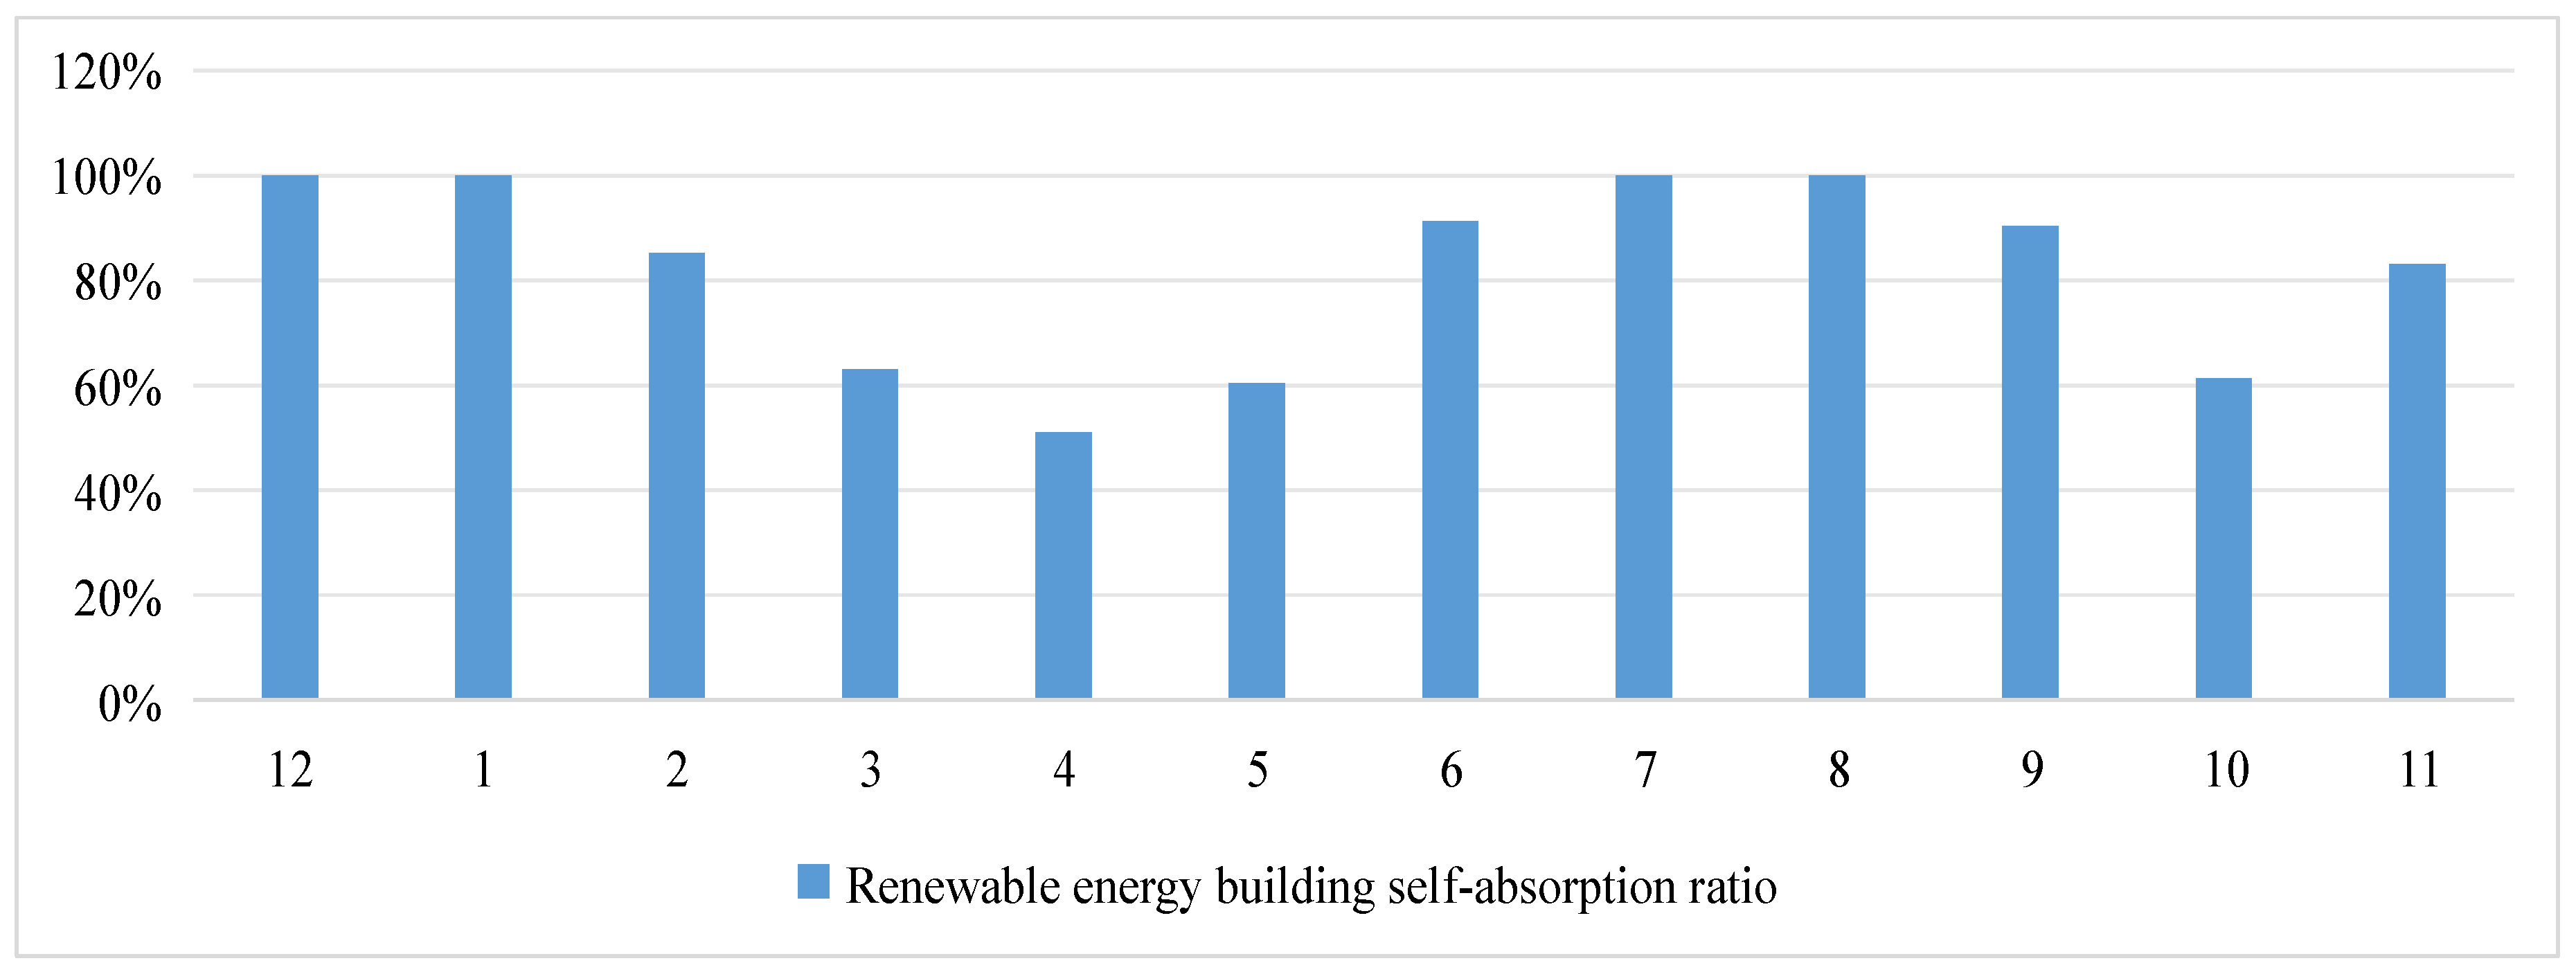
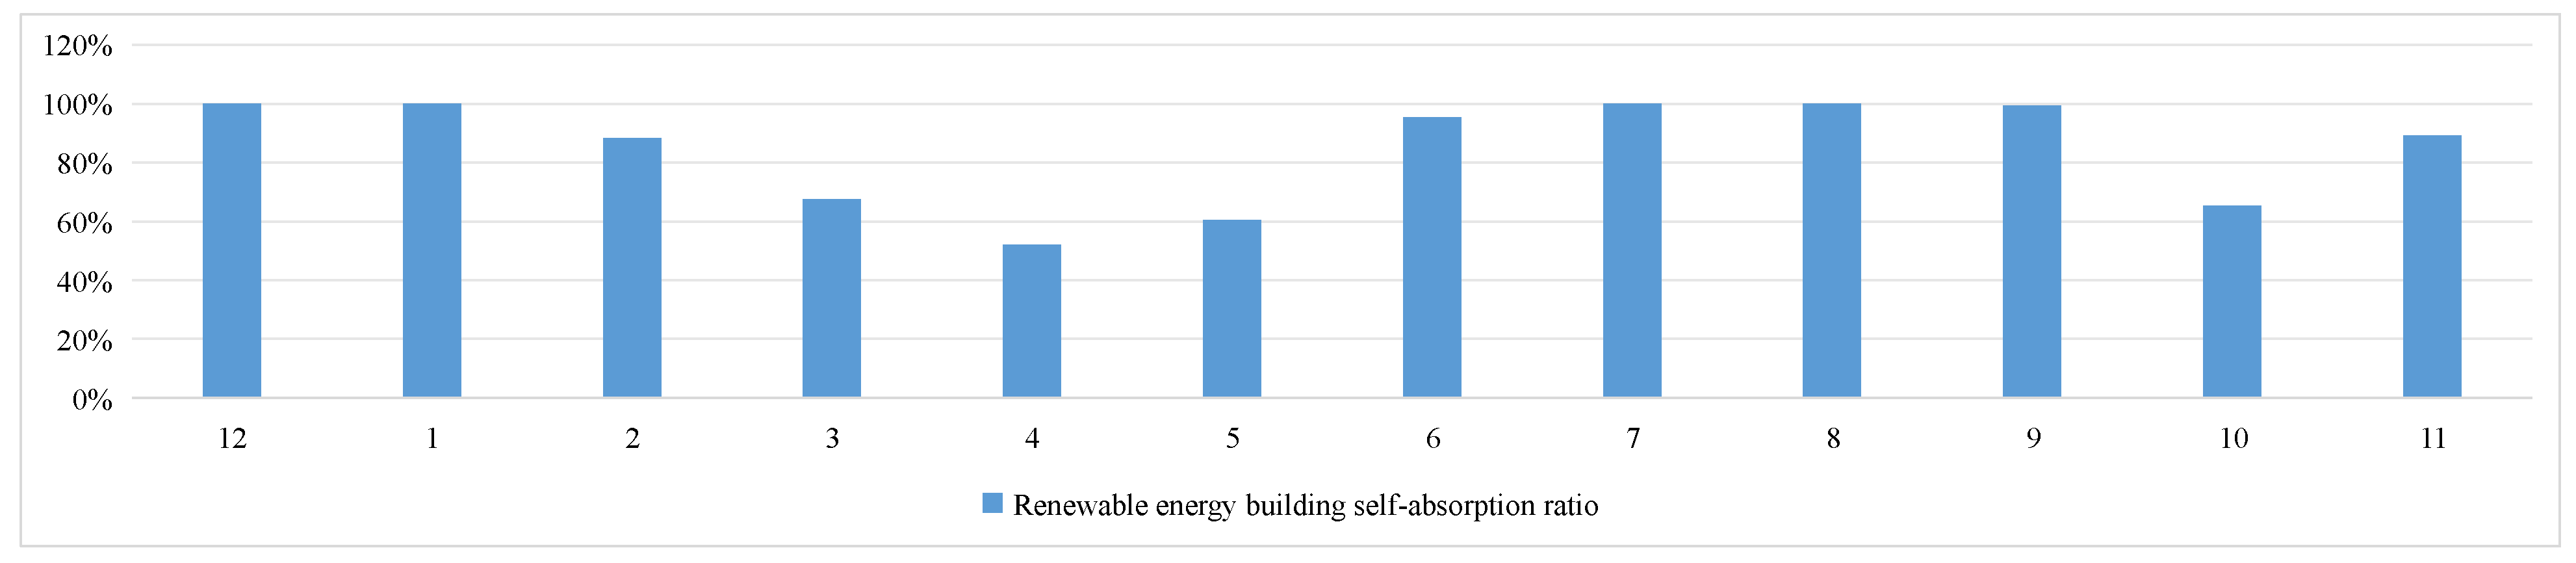
Figure 3. The monthly self-consumption ratio of renewable energy buildings in zero-carbon buildings is shown in
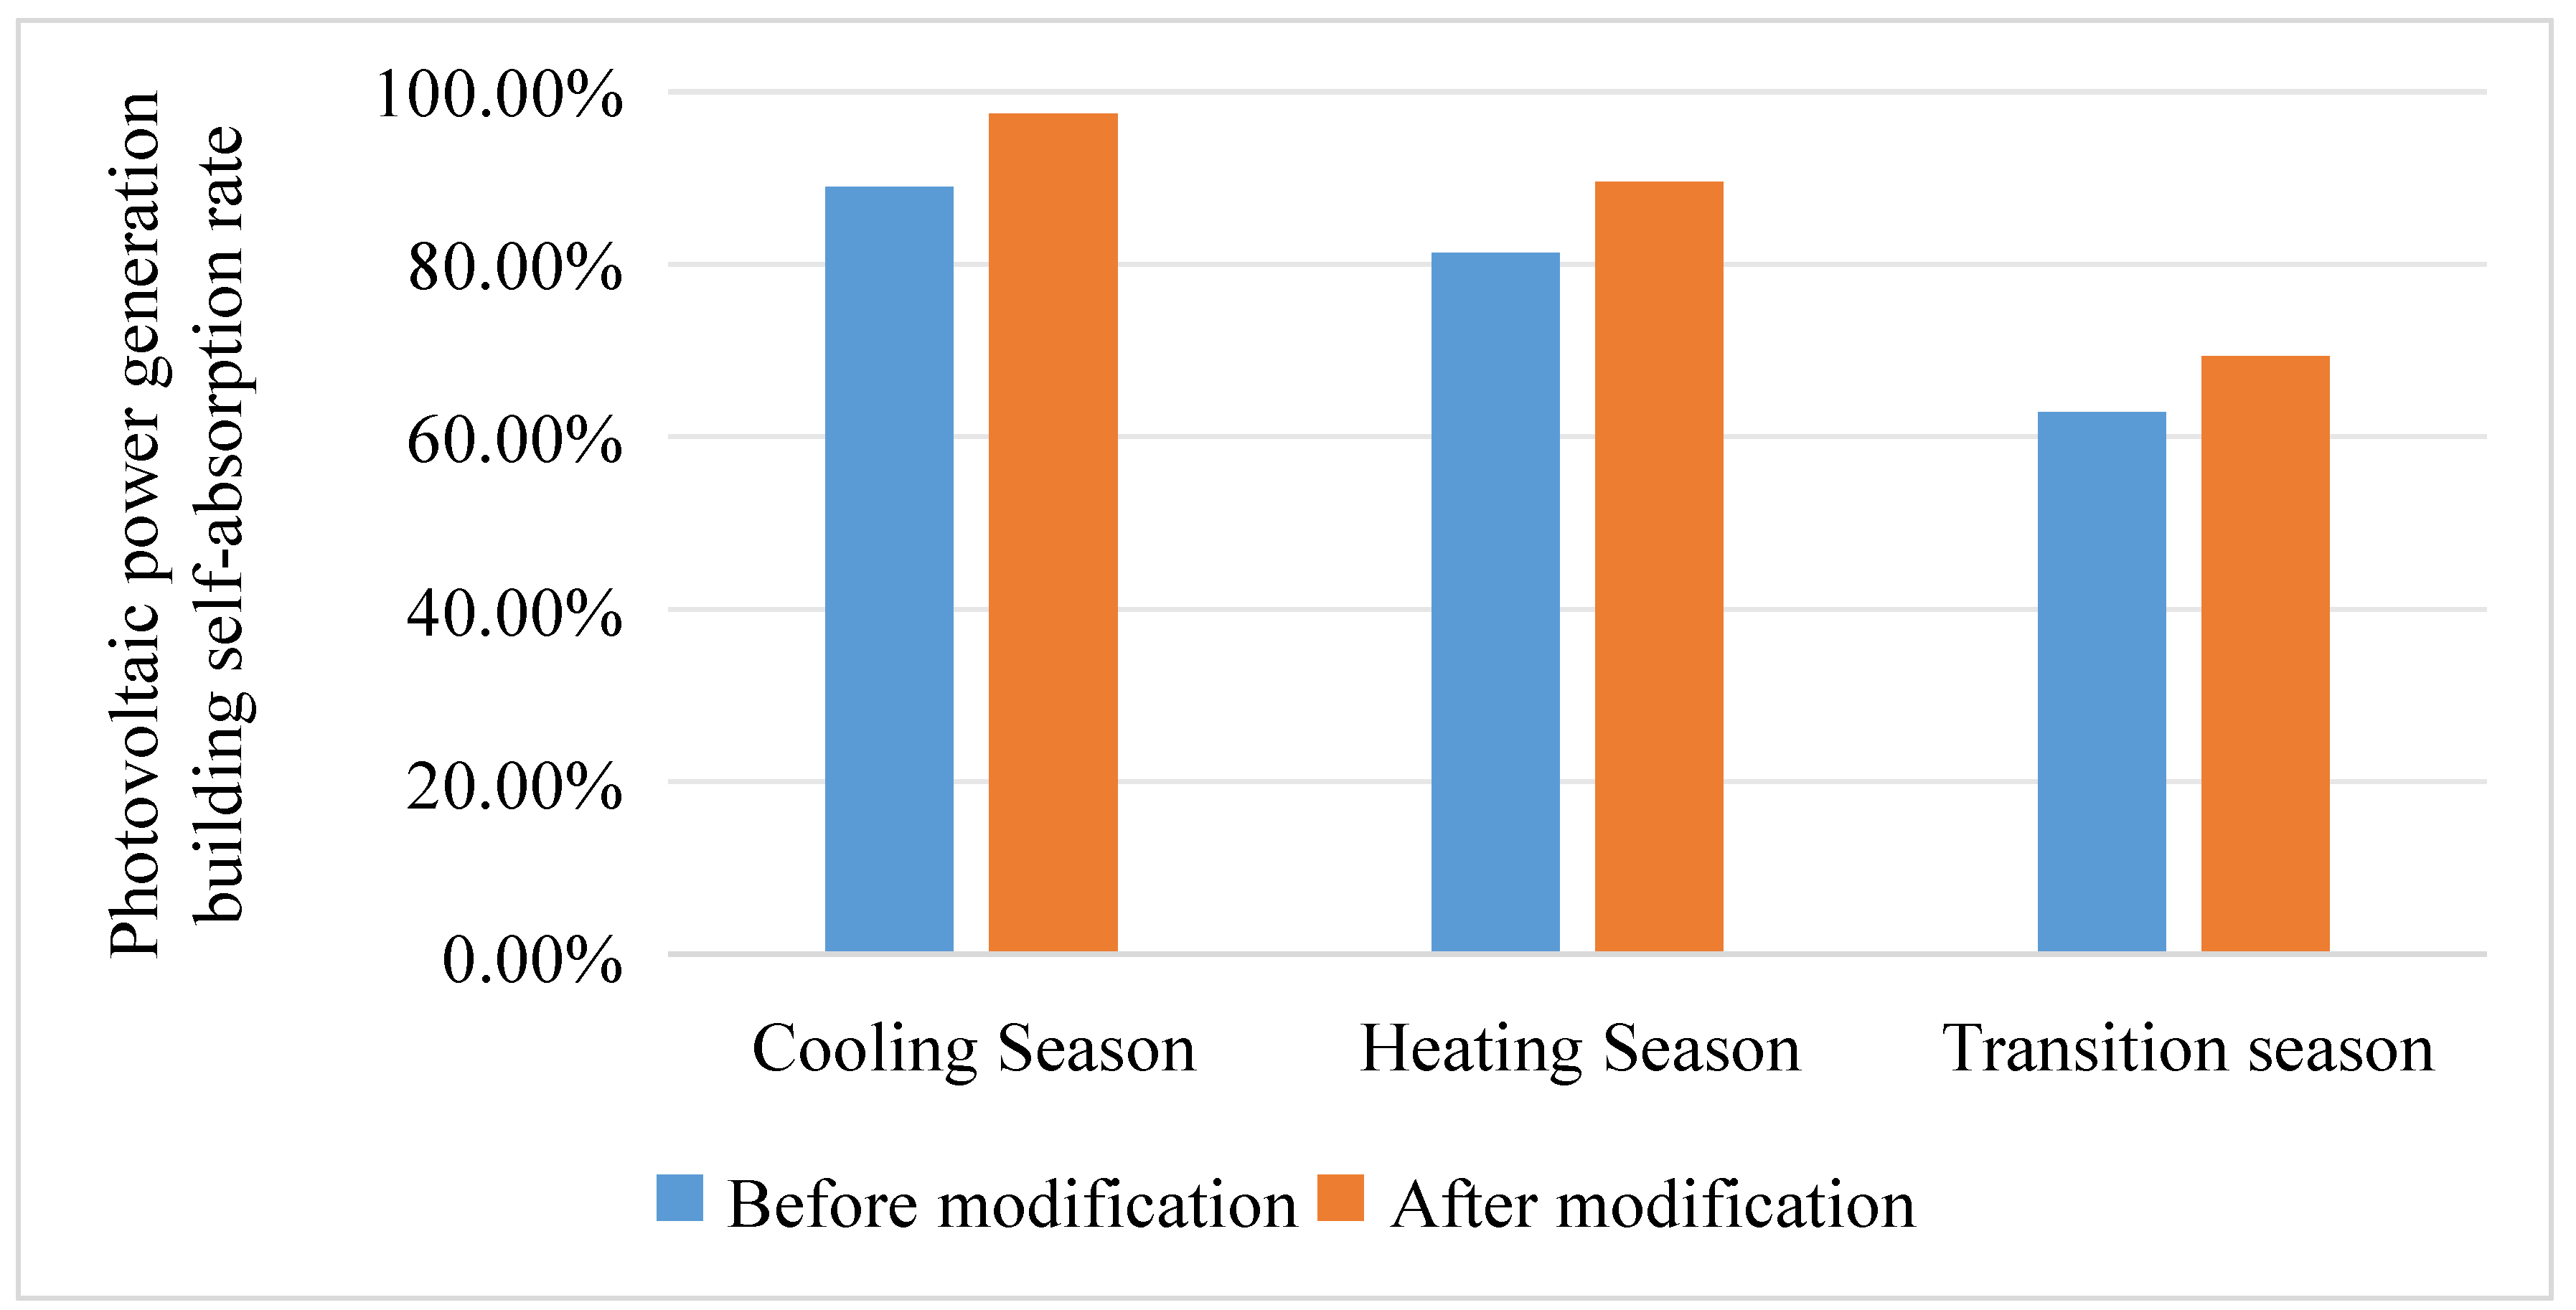
Figure 4. In the cooling season (June-August), HVAC electricity demand is high, among which the self-consumption rate of photovoltaic power generation buildings is 91.61%. The building self-absorption rate of photovoltaic power generation in heating season is 81.30%. The monthly electricity demand of transitional seasonal buildings is low, and the self-absorption rate of photovoltaic power generation buildings is 62.82%.
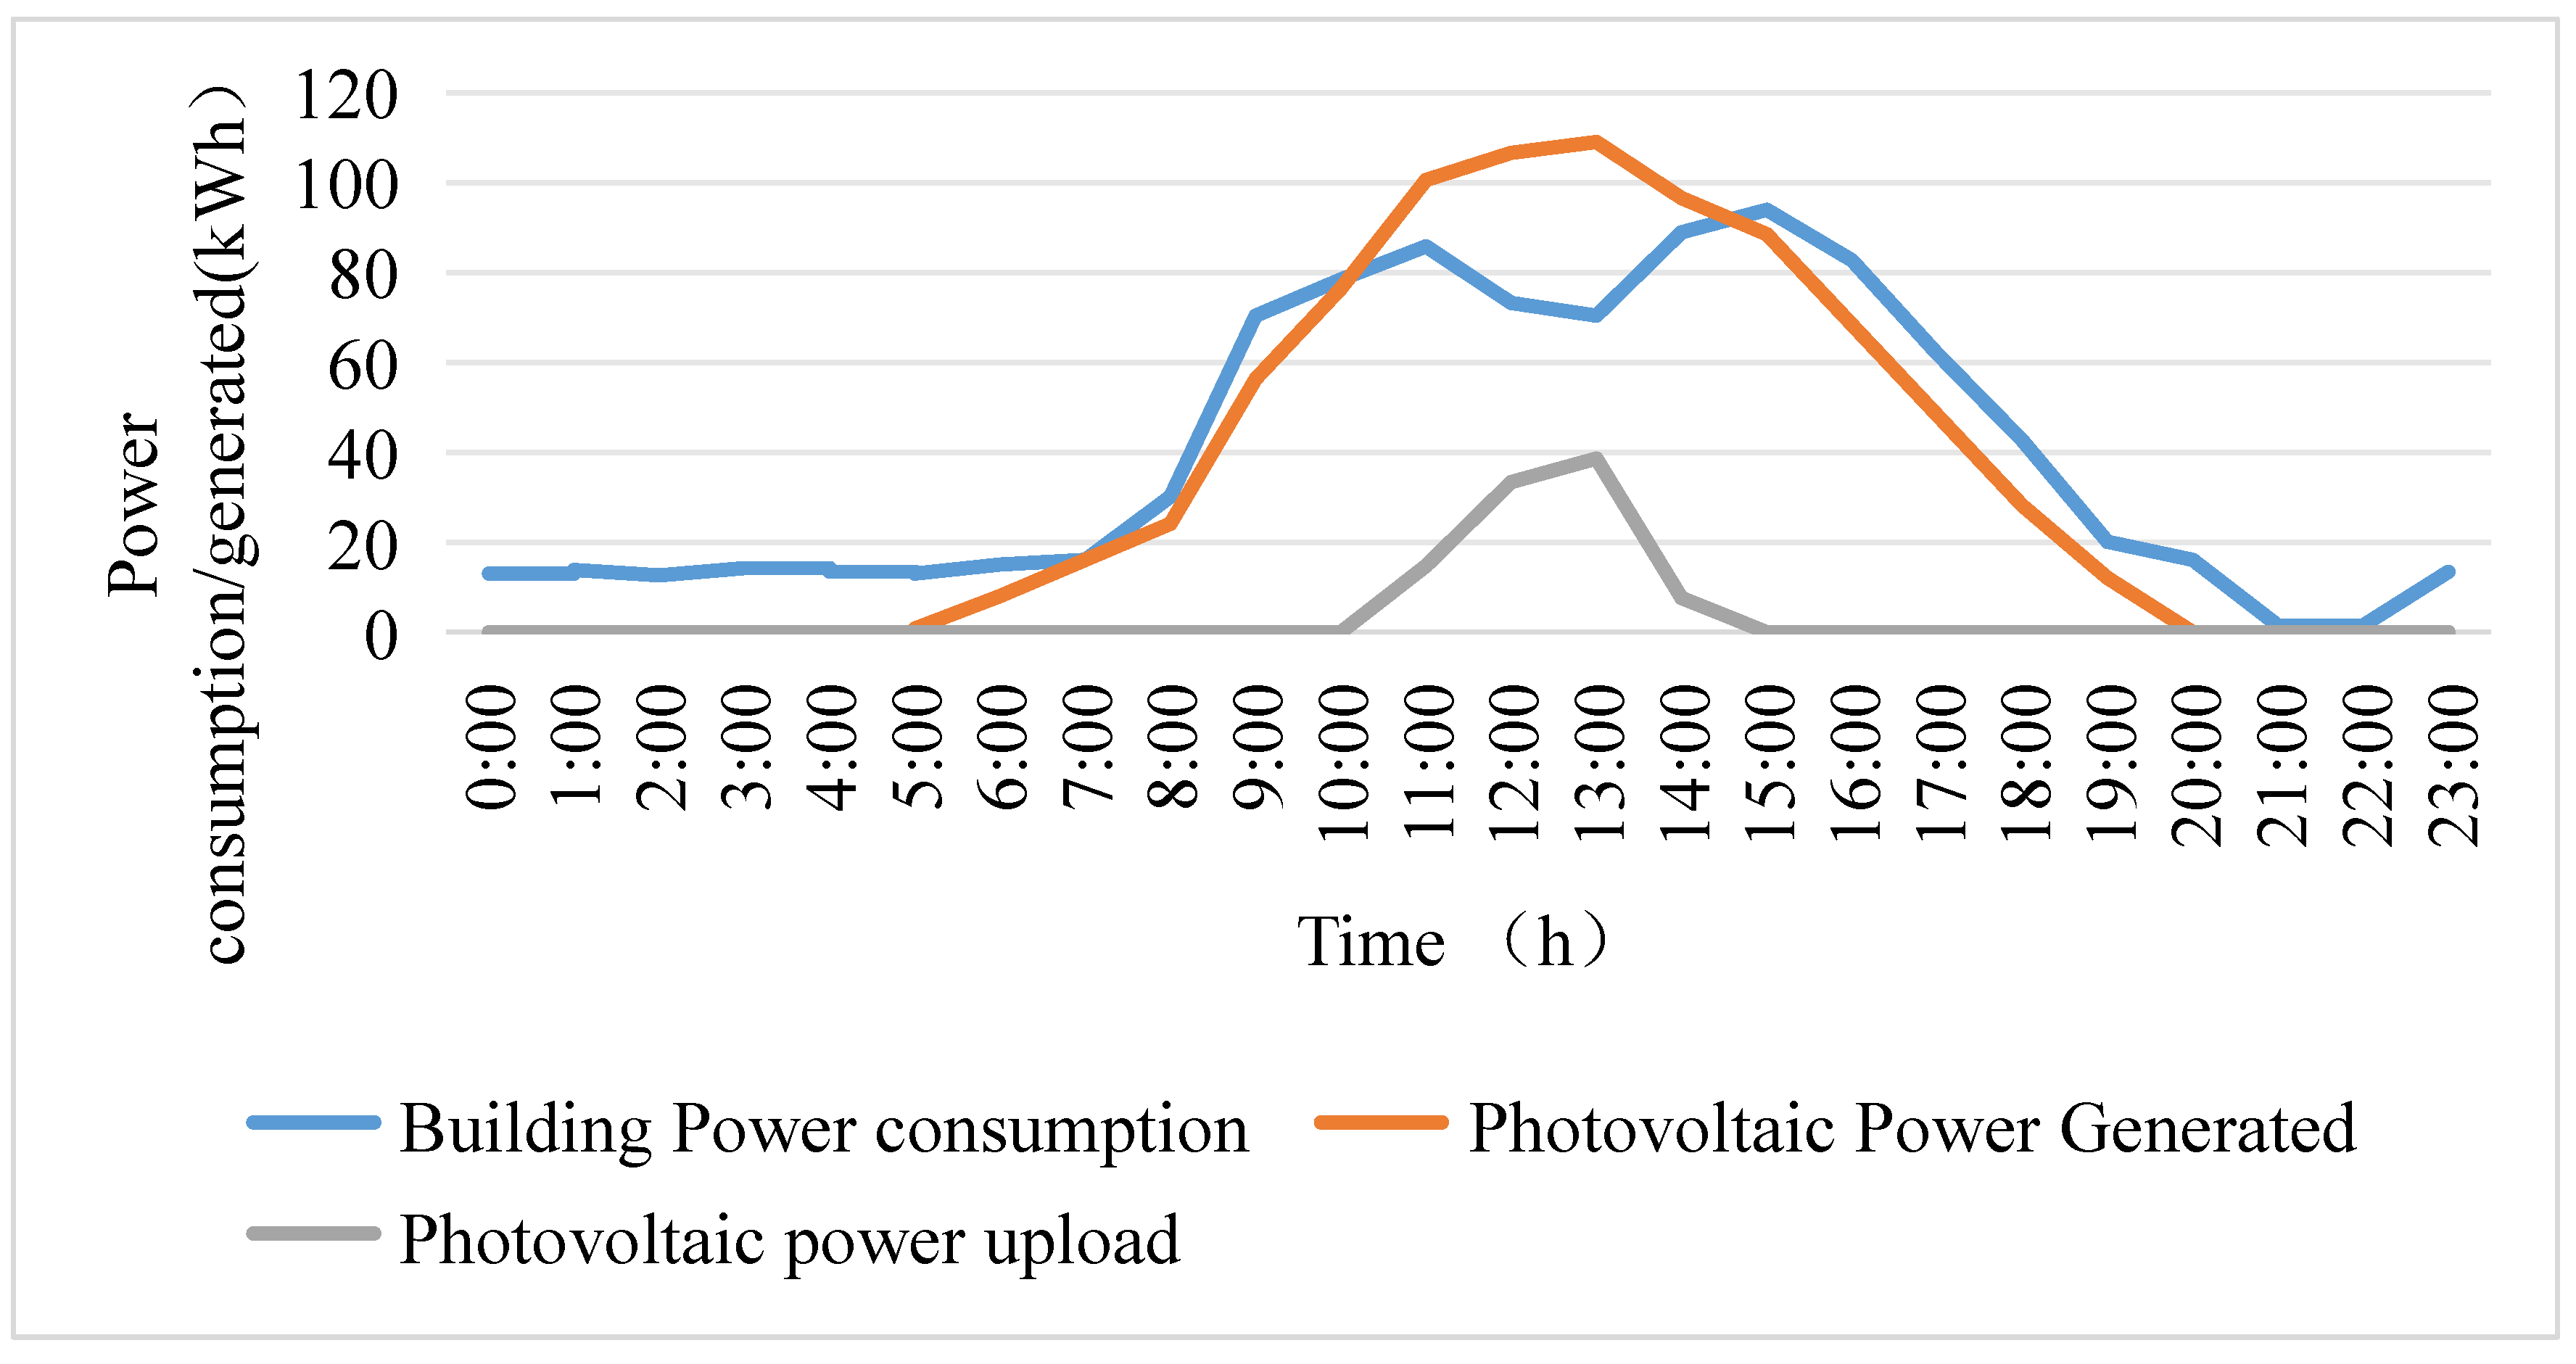
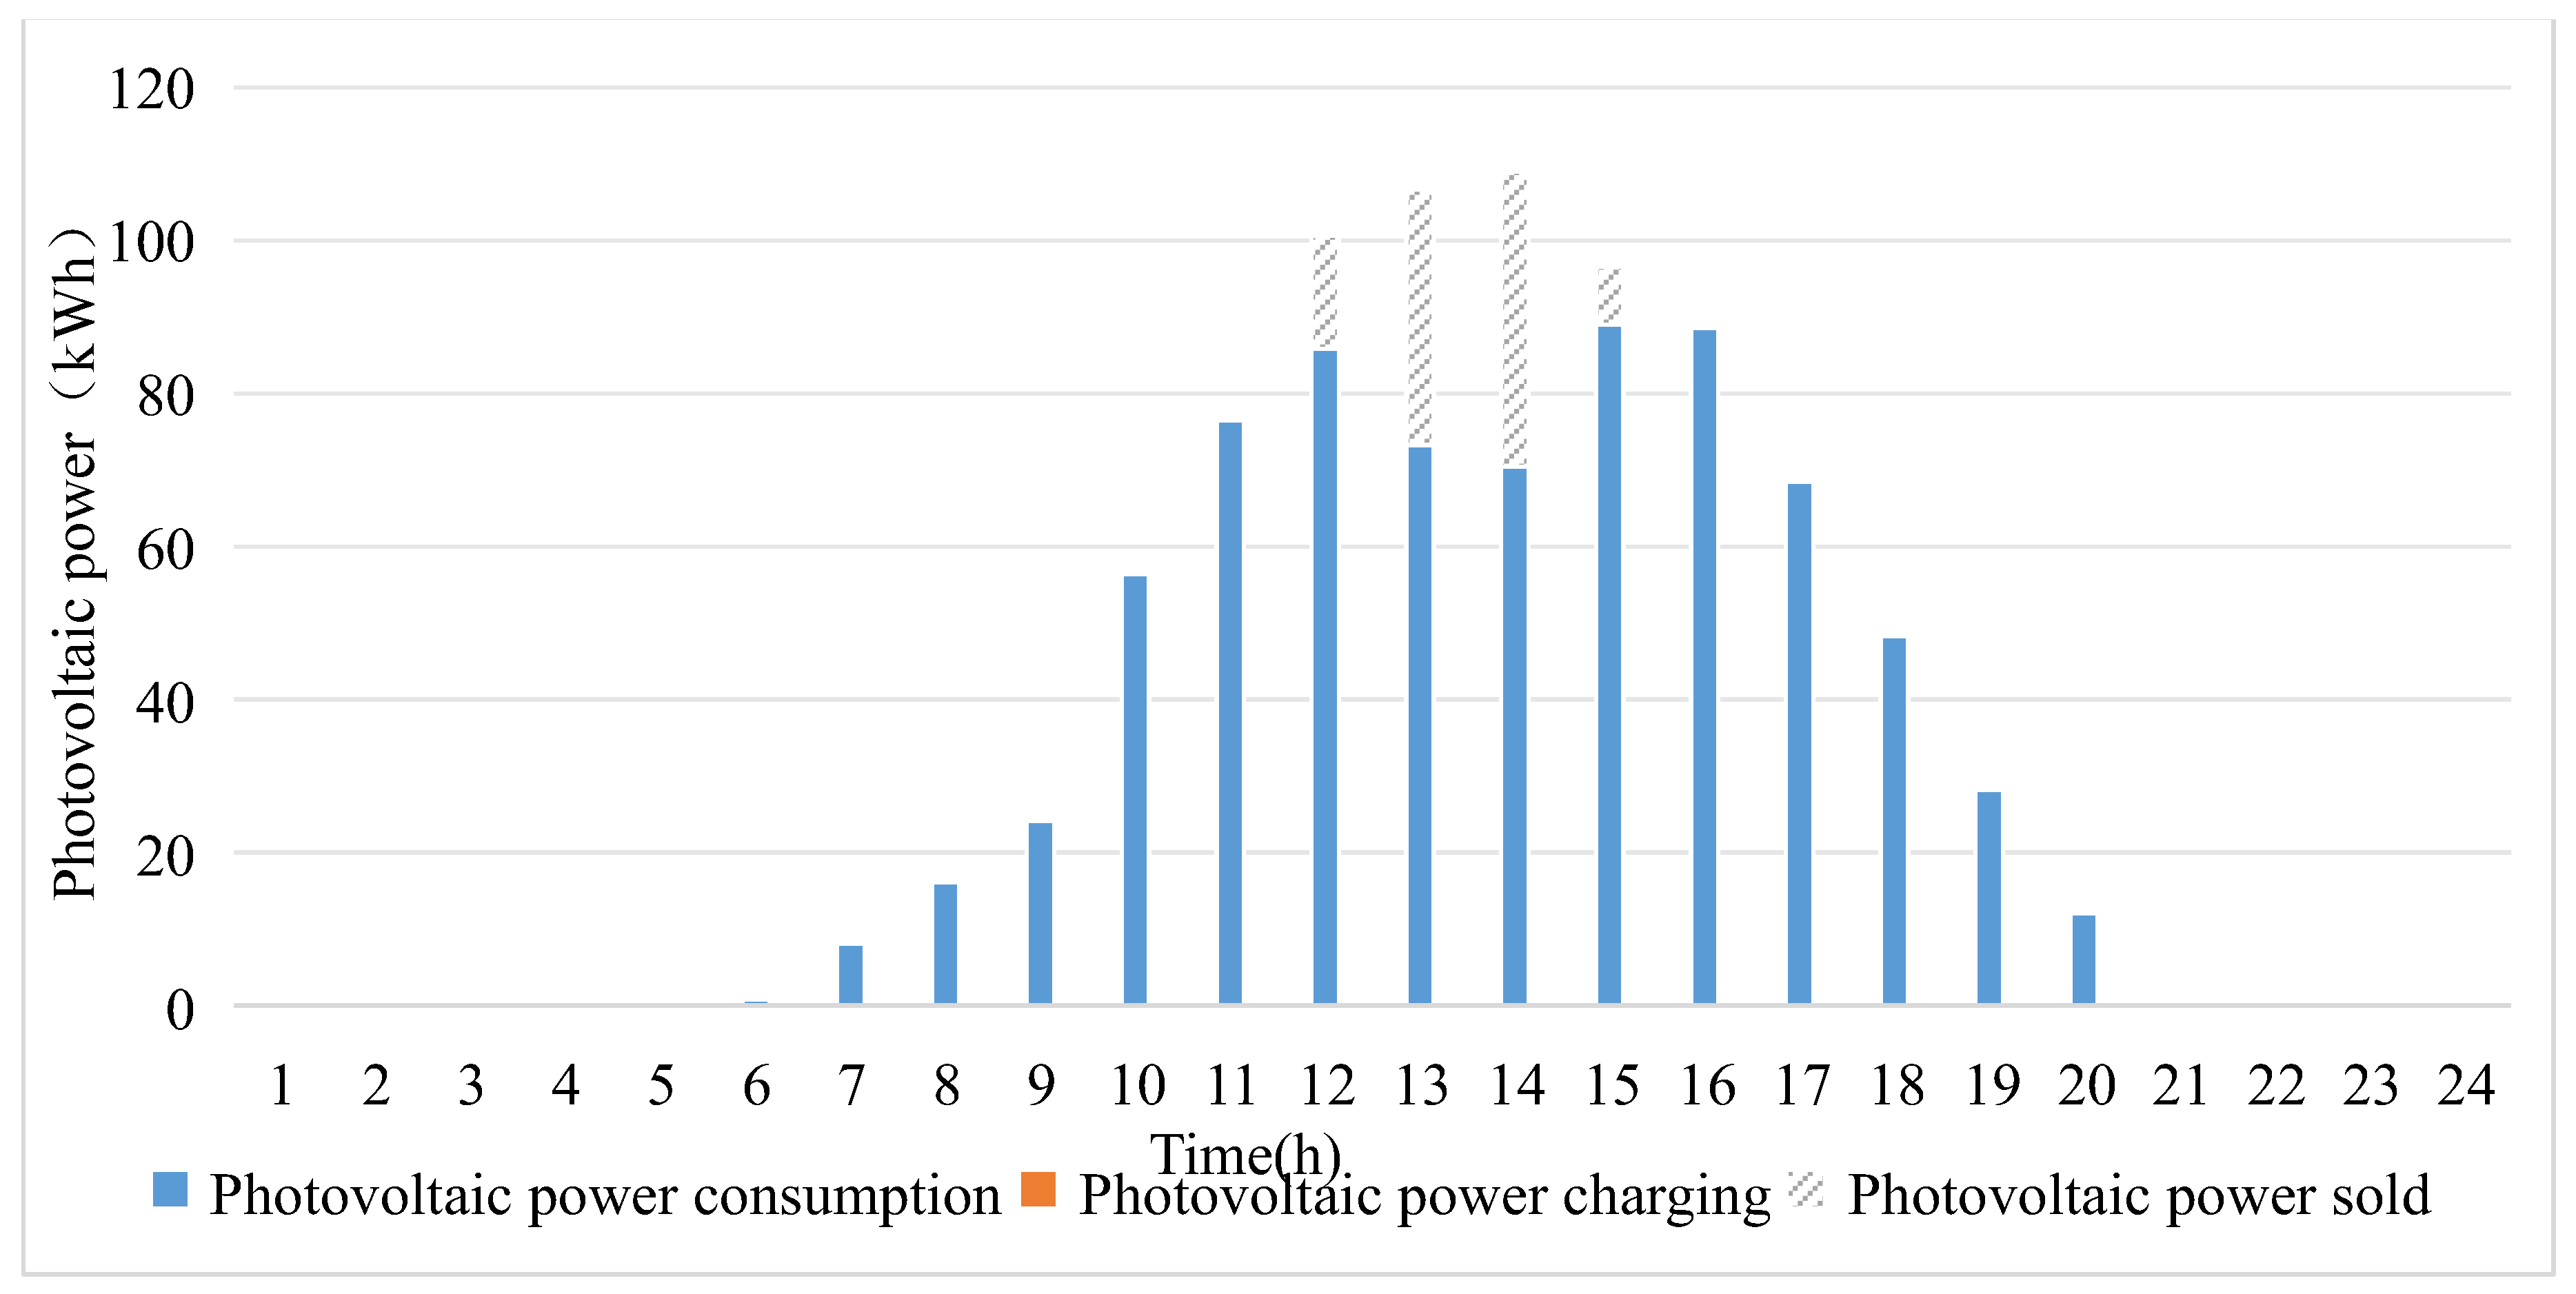
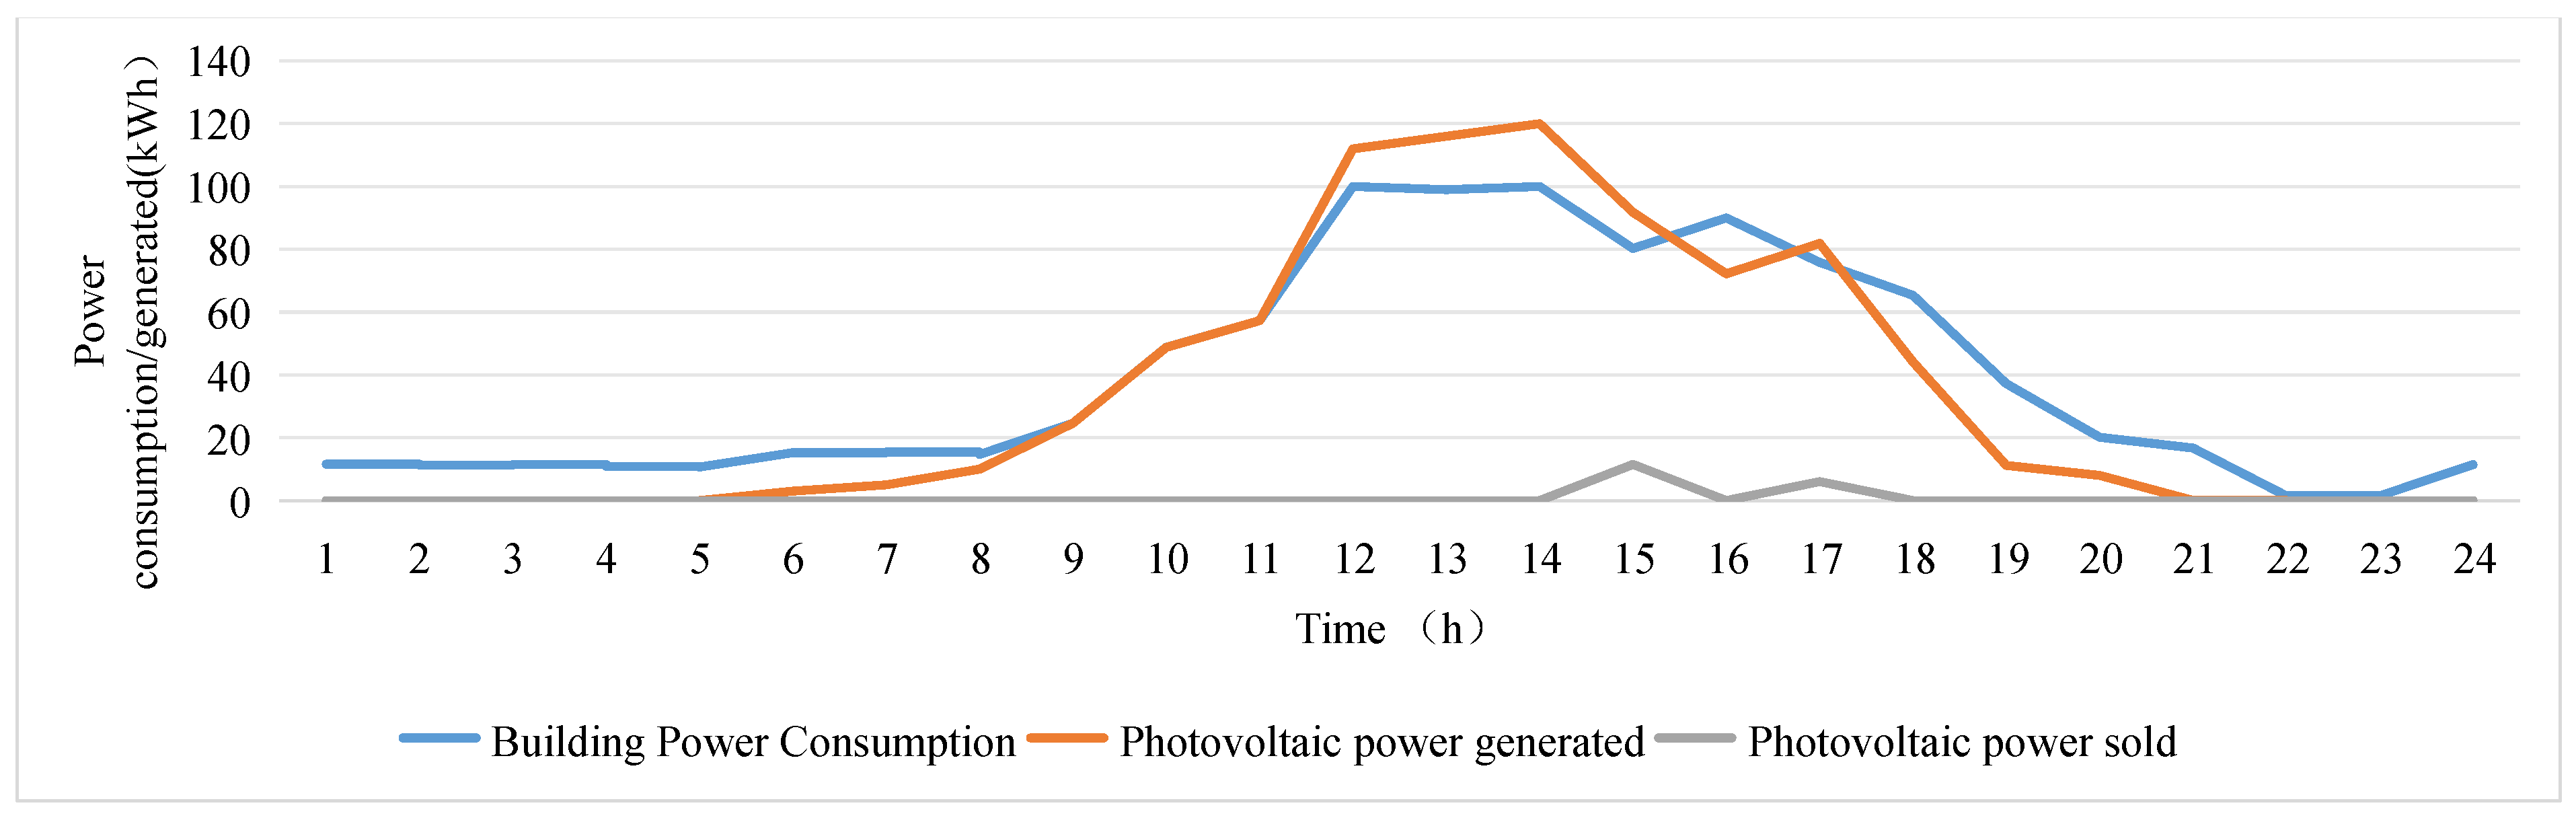
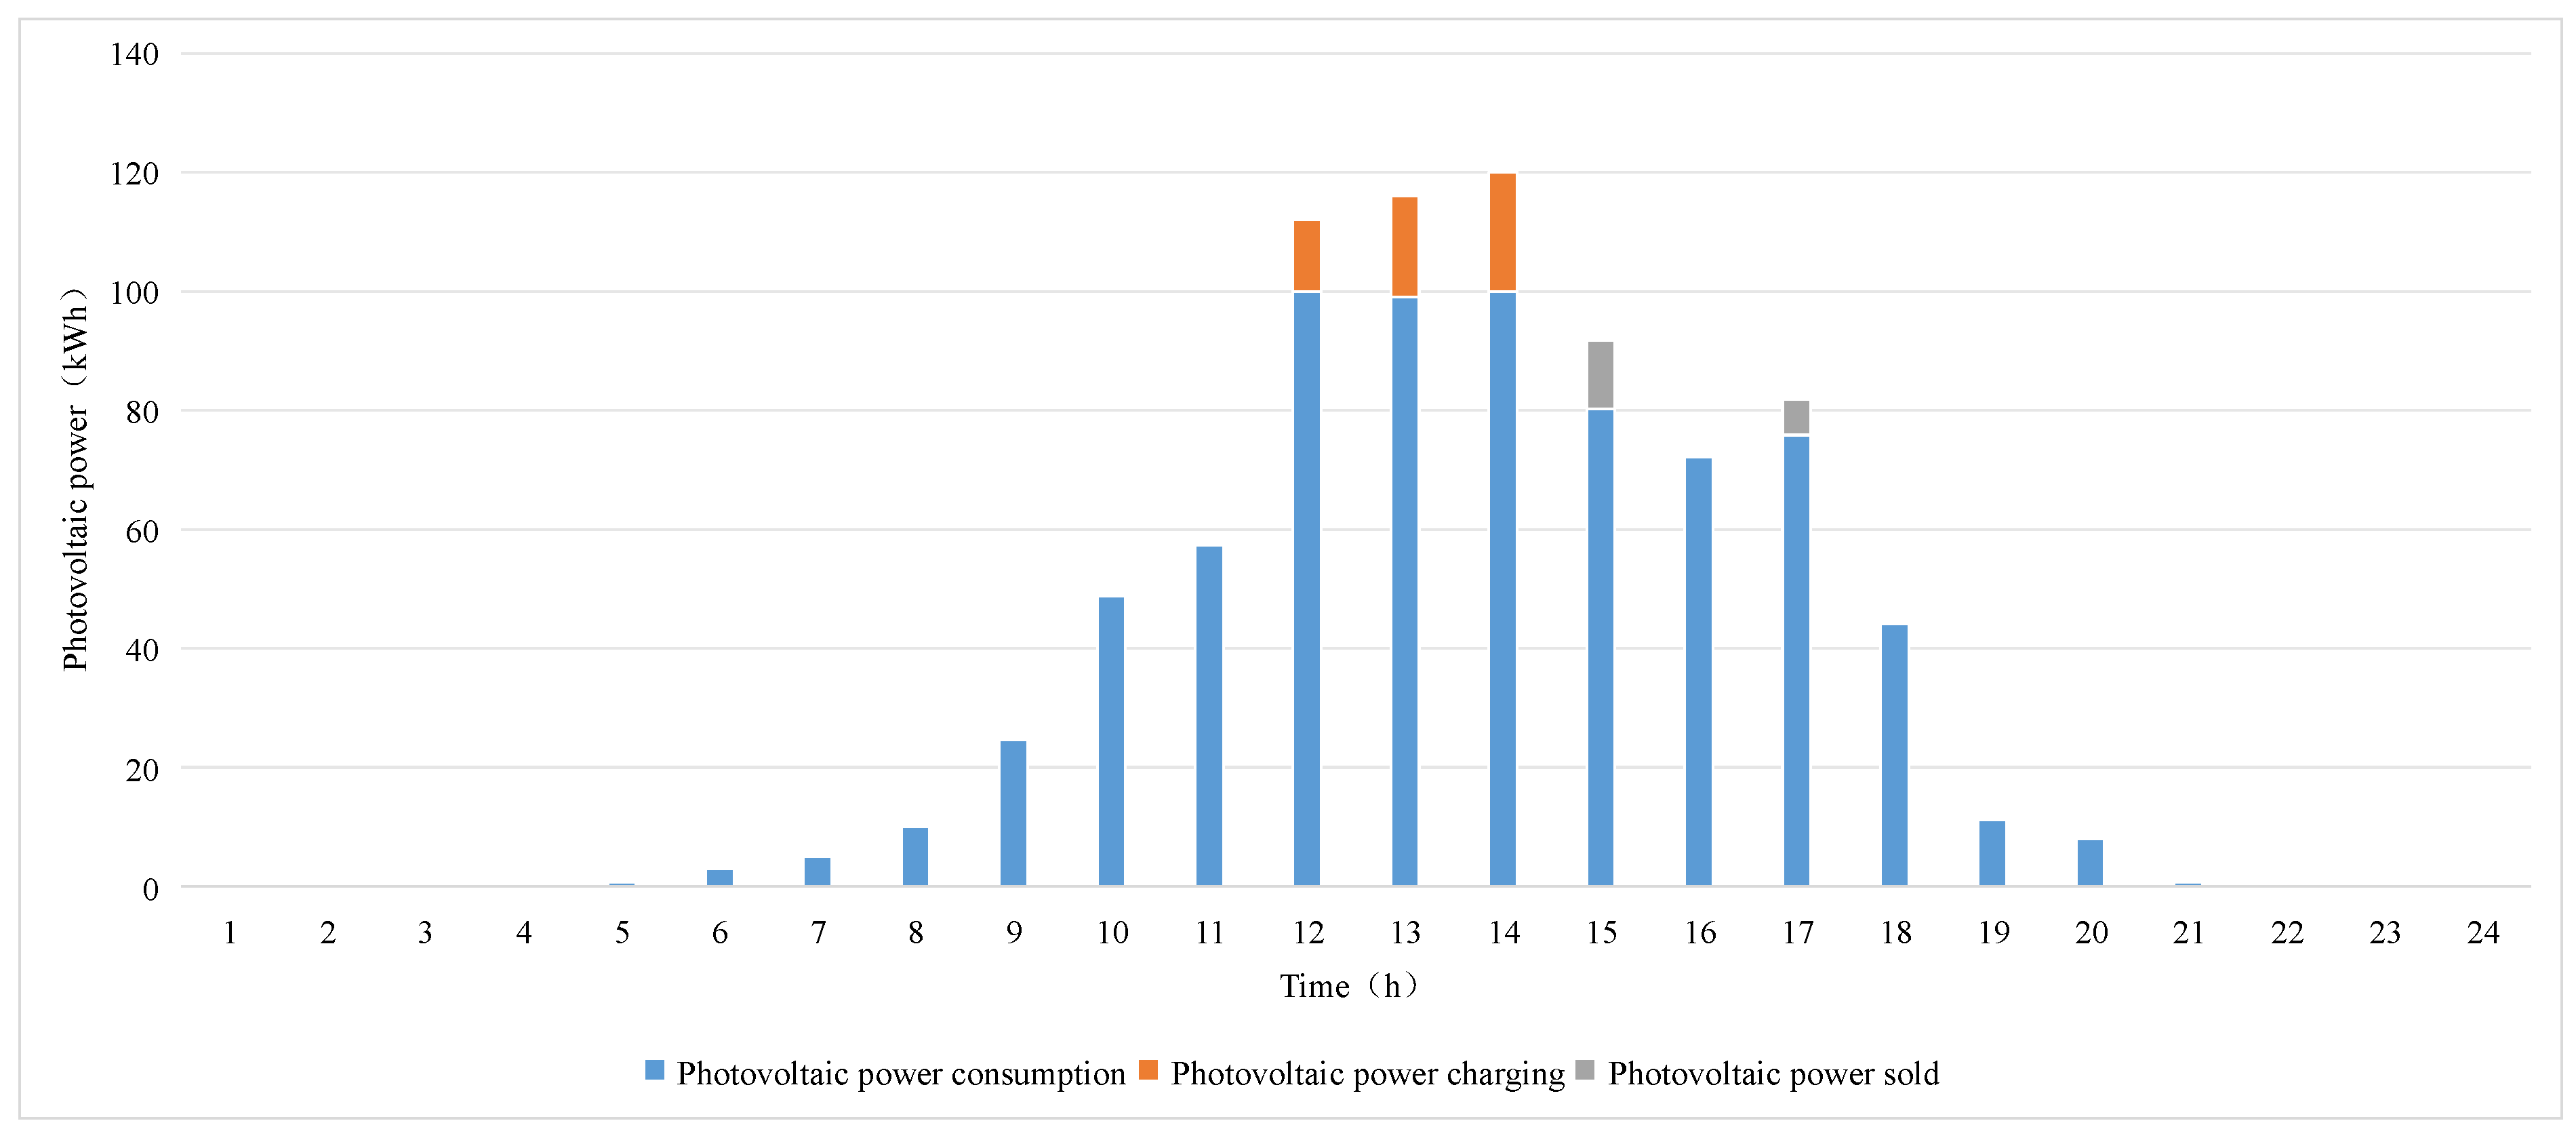
When we analyze the operation of the energy system of a typical zero-carbon building on a typical cooling day in June 2023, the office hours of a zero-carbon building are 8:30-17:30, the typical daily electricity and local photovoltaic power generation of a zero-carbon office building during the cooling season and heating season are shown in the figure, and the matching between electricity consumption and power generation is shown in
Figure 5 and
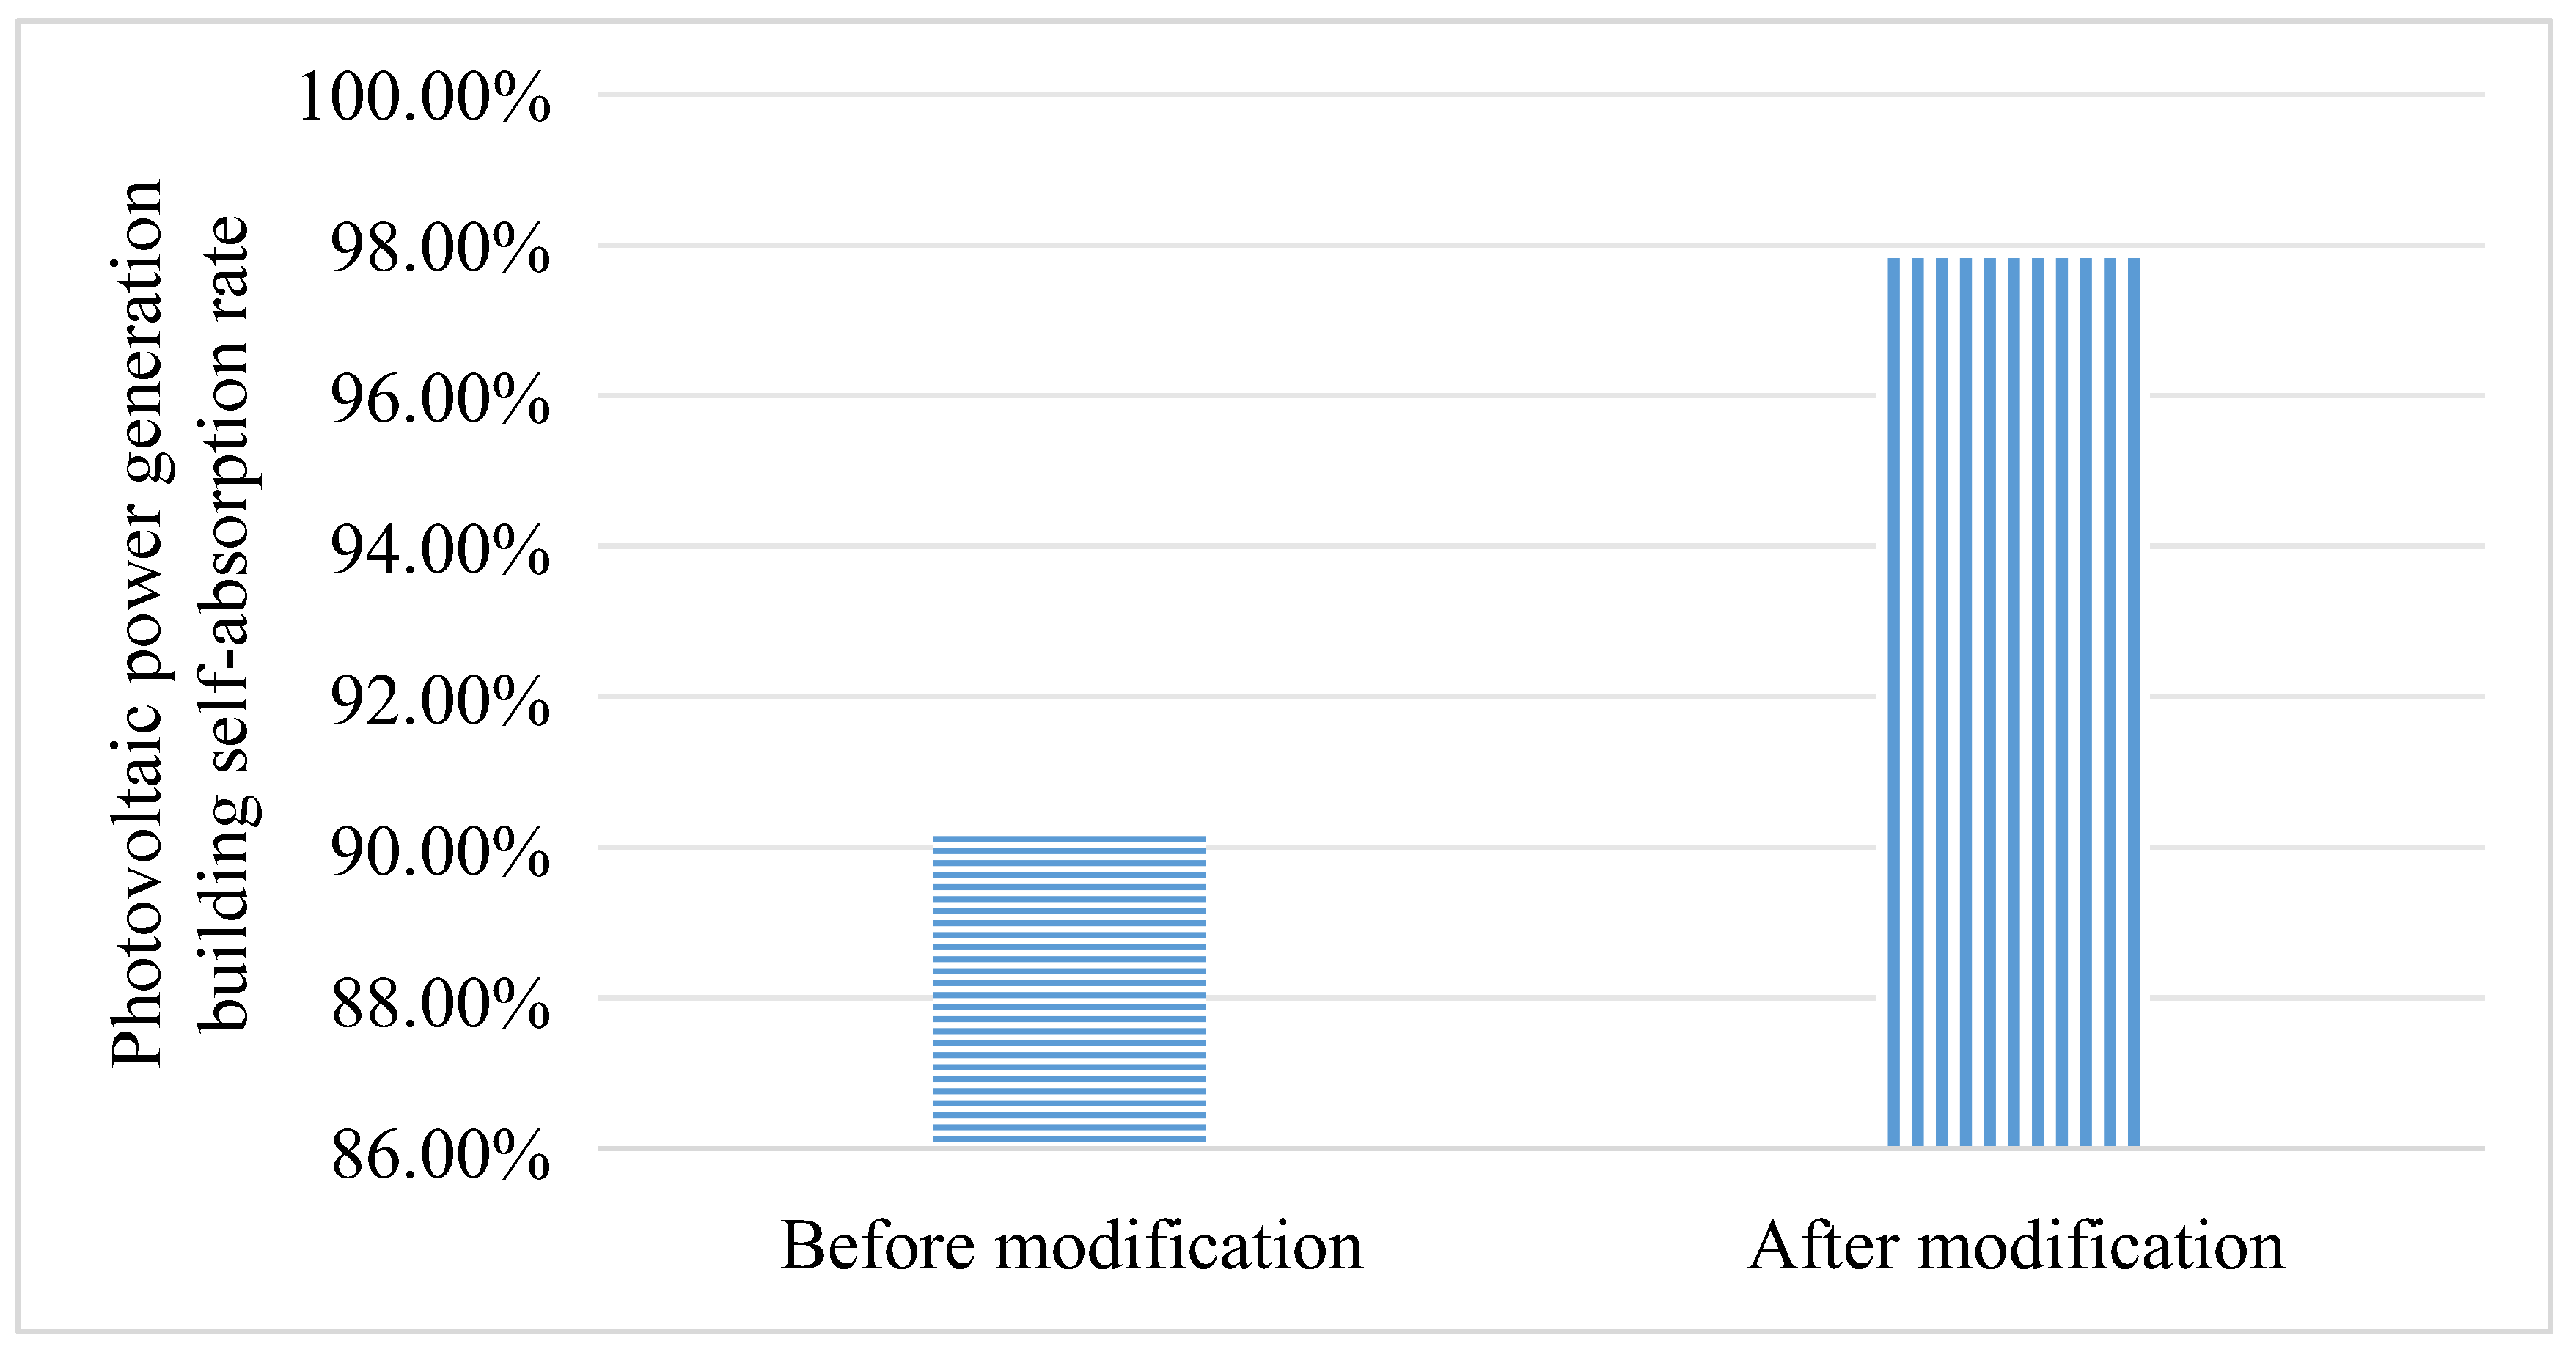
Figure 6. The total daily electricity demand of the building is 943.19kWh, and the total daily photovoltaic power generation is 840.42kWh, theoretically the building power consumption is greater than the photovoltaic power generation. However, the on-grid electricity of photovoltaic power generation reached 94.43kWh, and the self-absorption rate of photovoltaic power generation buildings throughout the day was 90.22%.
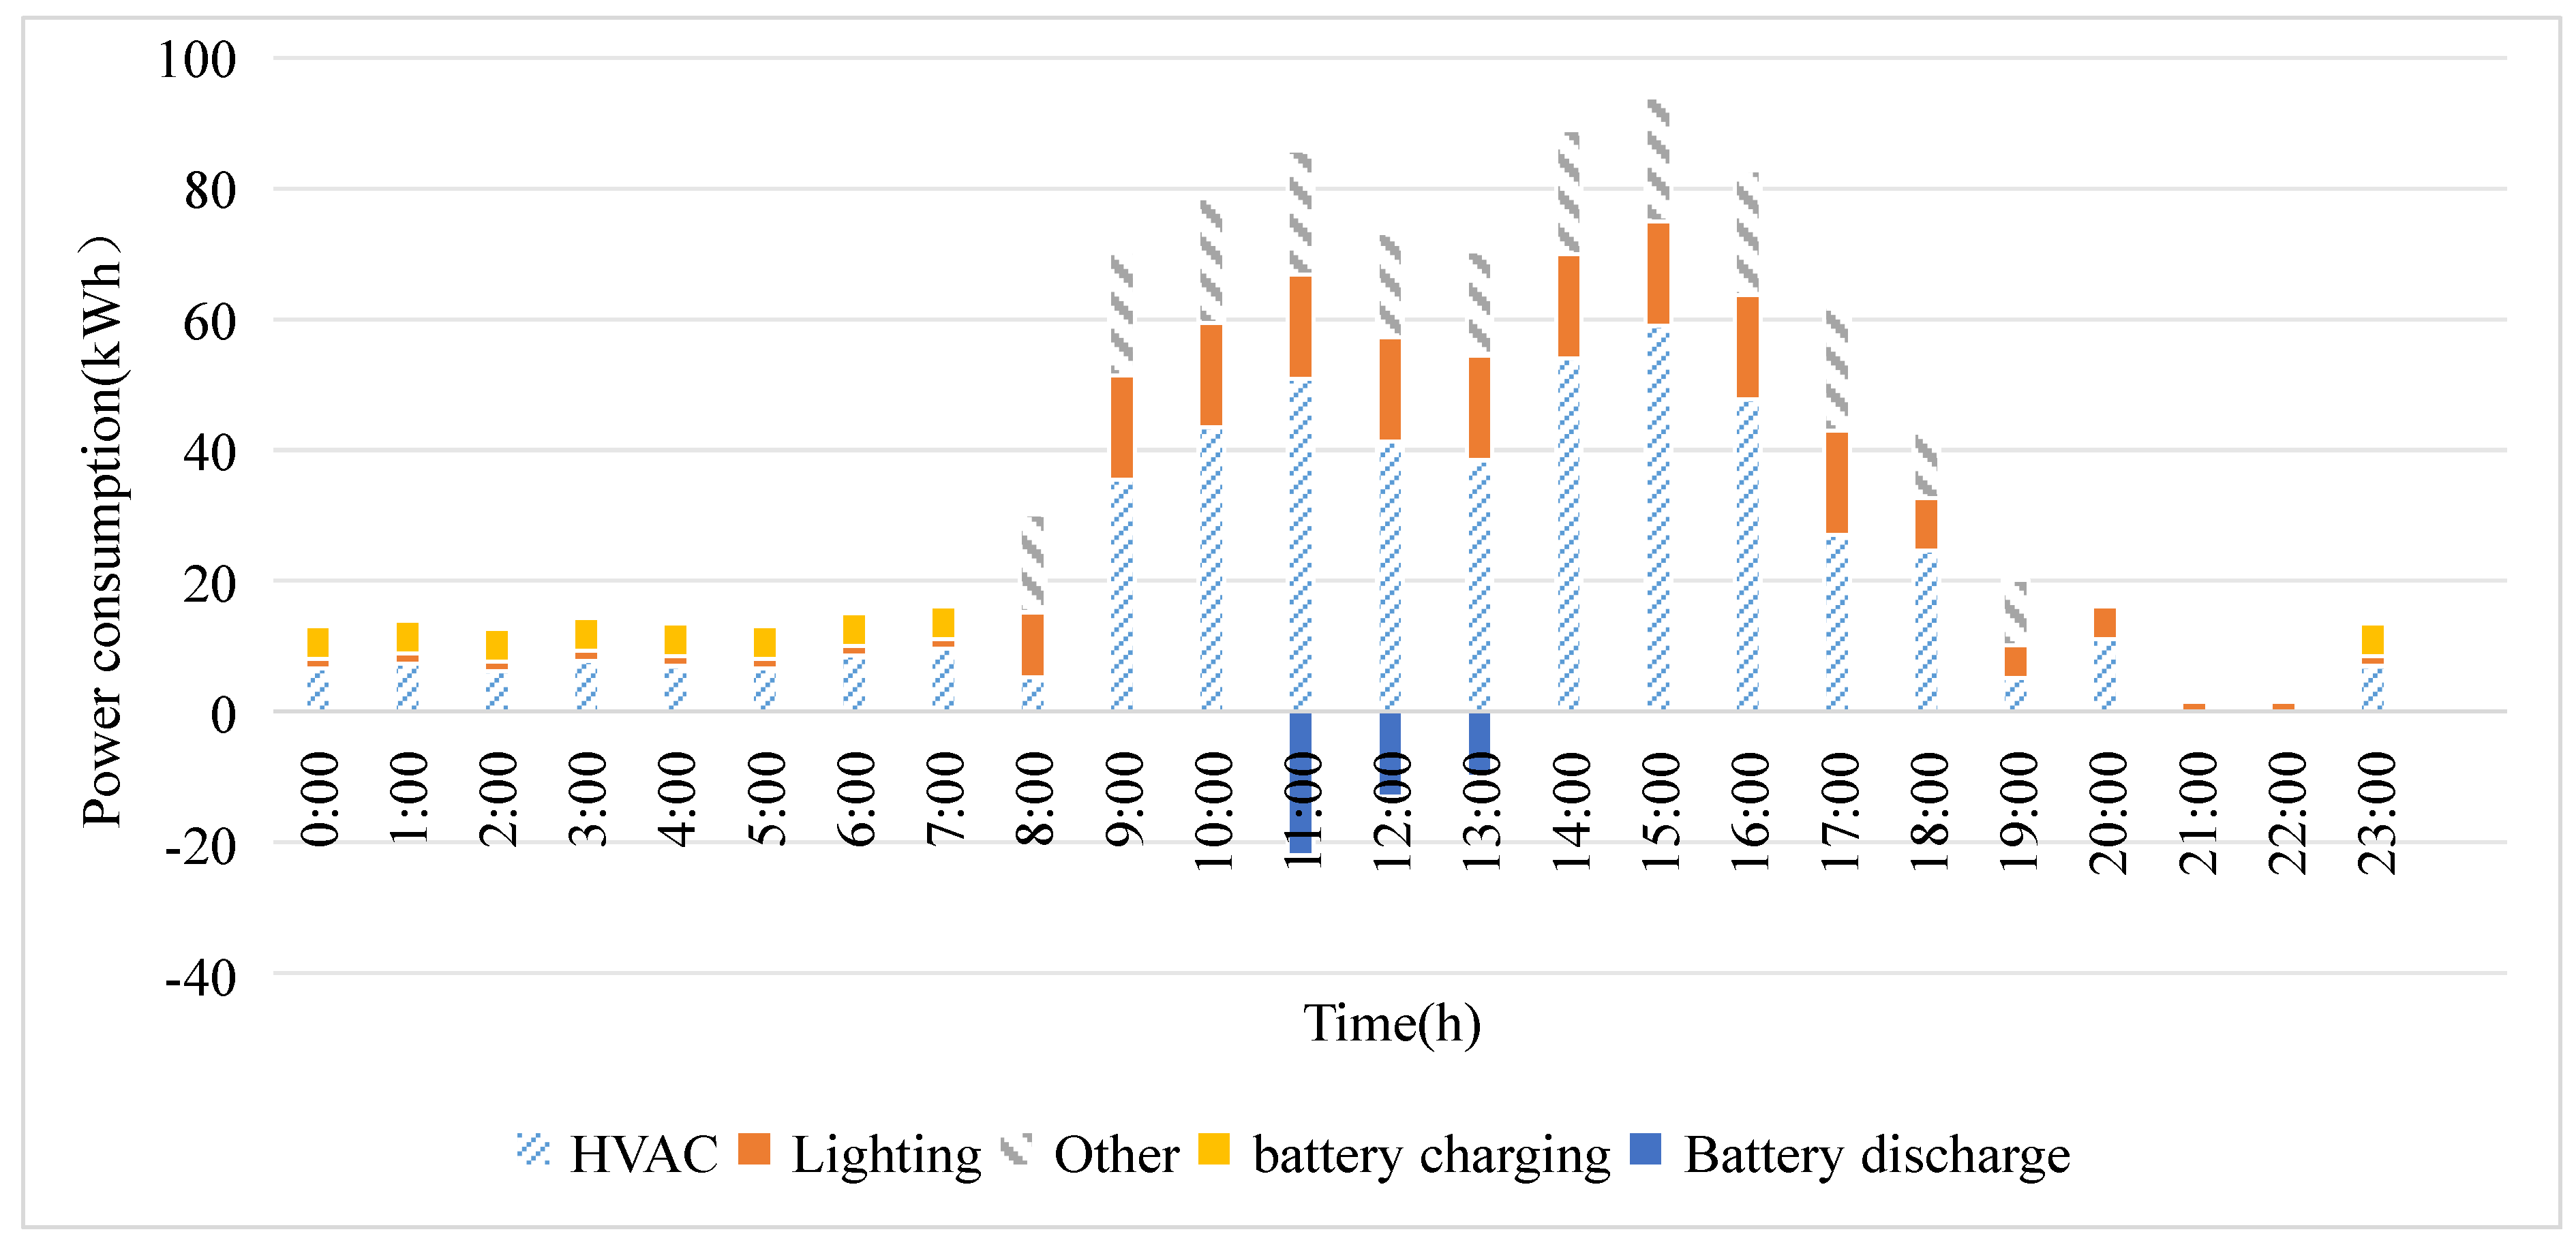
Through the analysis of the hourly electricity consumption of typical days in the cooling season, as shown in
Figure 6, the night project uses the valley price electricity for electricity storage and releases electricity during the peak electricity price of the next day. From 11:00 to enter the peak hours of electricity consumption, and the peak hours of photovoltaic power generation basically match, but because the peak electricity price period (11:00-13:00) cold storage and electricity storage system is also released at noon, resulting in the system at this time the building electricity consumption is reduced, noon photovoltaic power generation can not be absorbed or stored in time.
From the above analysis, it can be seen that although the annual overall data analysis shows that the zero-carbon building is equipped with sufficient photovoltaic renewable energy capacity, due to the unreasonable operation control mode, the actual self-absorption ratio of photovoltaic fails to meet the design expectation.
2.2. Energy System Control Scheduling Algorithm Considering day-Ahead Flexible Programming - Day-Day Rolling Optimization
2.2.1. Overall Technical Path
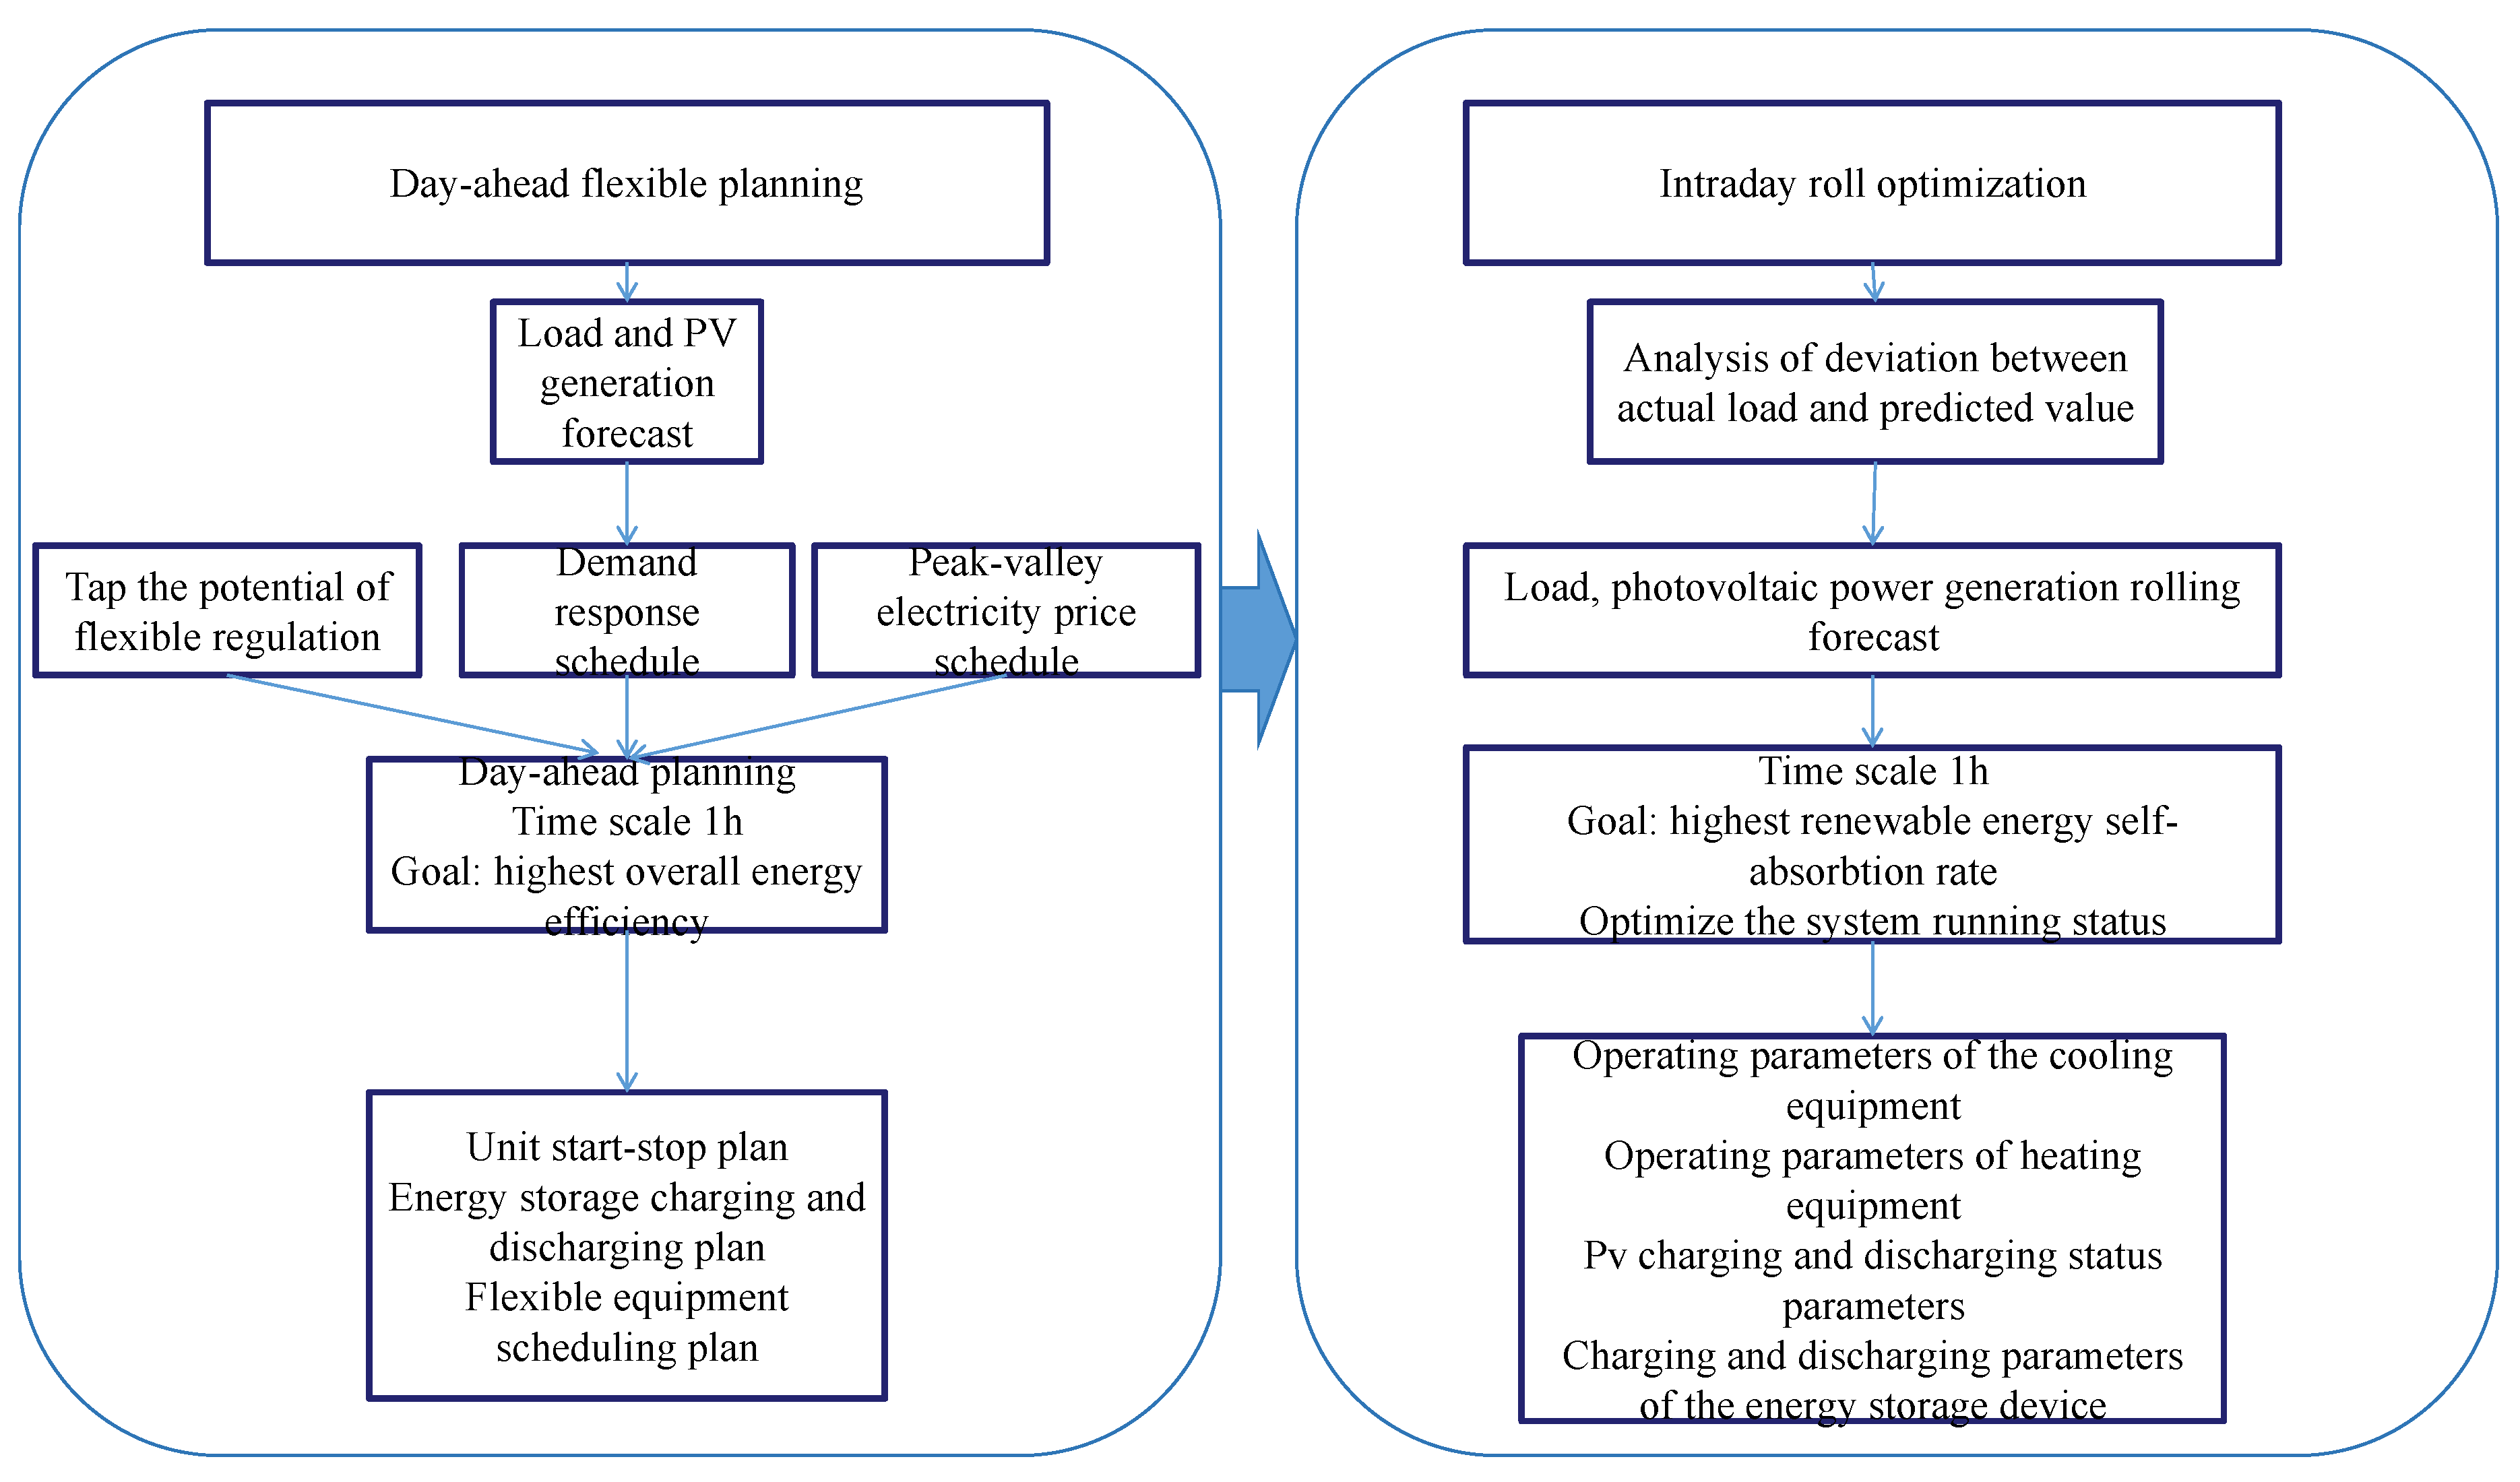
In order to realize the intelligent control goal of zero-carbon building complex energy system, this paper proposes a day-ahead planning and day-day rolling optimization algorithm considering the flexibility and adjustable ability of buildings. The overall technical path of the algorithm is shown in
Figure 8. Based on the prediction of building thermal and cold power load and renewable power generation, the day-ahead planning stage takes 24 hours as a cycle and 1 hour as a scale step. Considering the time-of-use price, equipment operation and energy balance constraints, the unit start-stop plan, the charging and discharging plan of electricity storage and water storage equipment, the flexible load transfer and reduction scheduling plan of the building energy system are developed. Based on day-ahead planning, day-day rolling optimization takes 24 hours as a cycle and 1 hour as a scale step. Considering the difference between the actual energy demand of the building and the predicted results, the operation strategy of the building energy system is modified through rolling optimization to improve the energy efficiency of the system and reduce the carbon emission of the operation [
34].
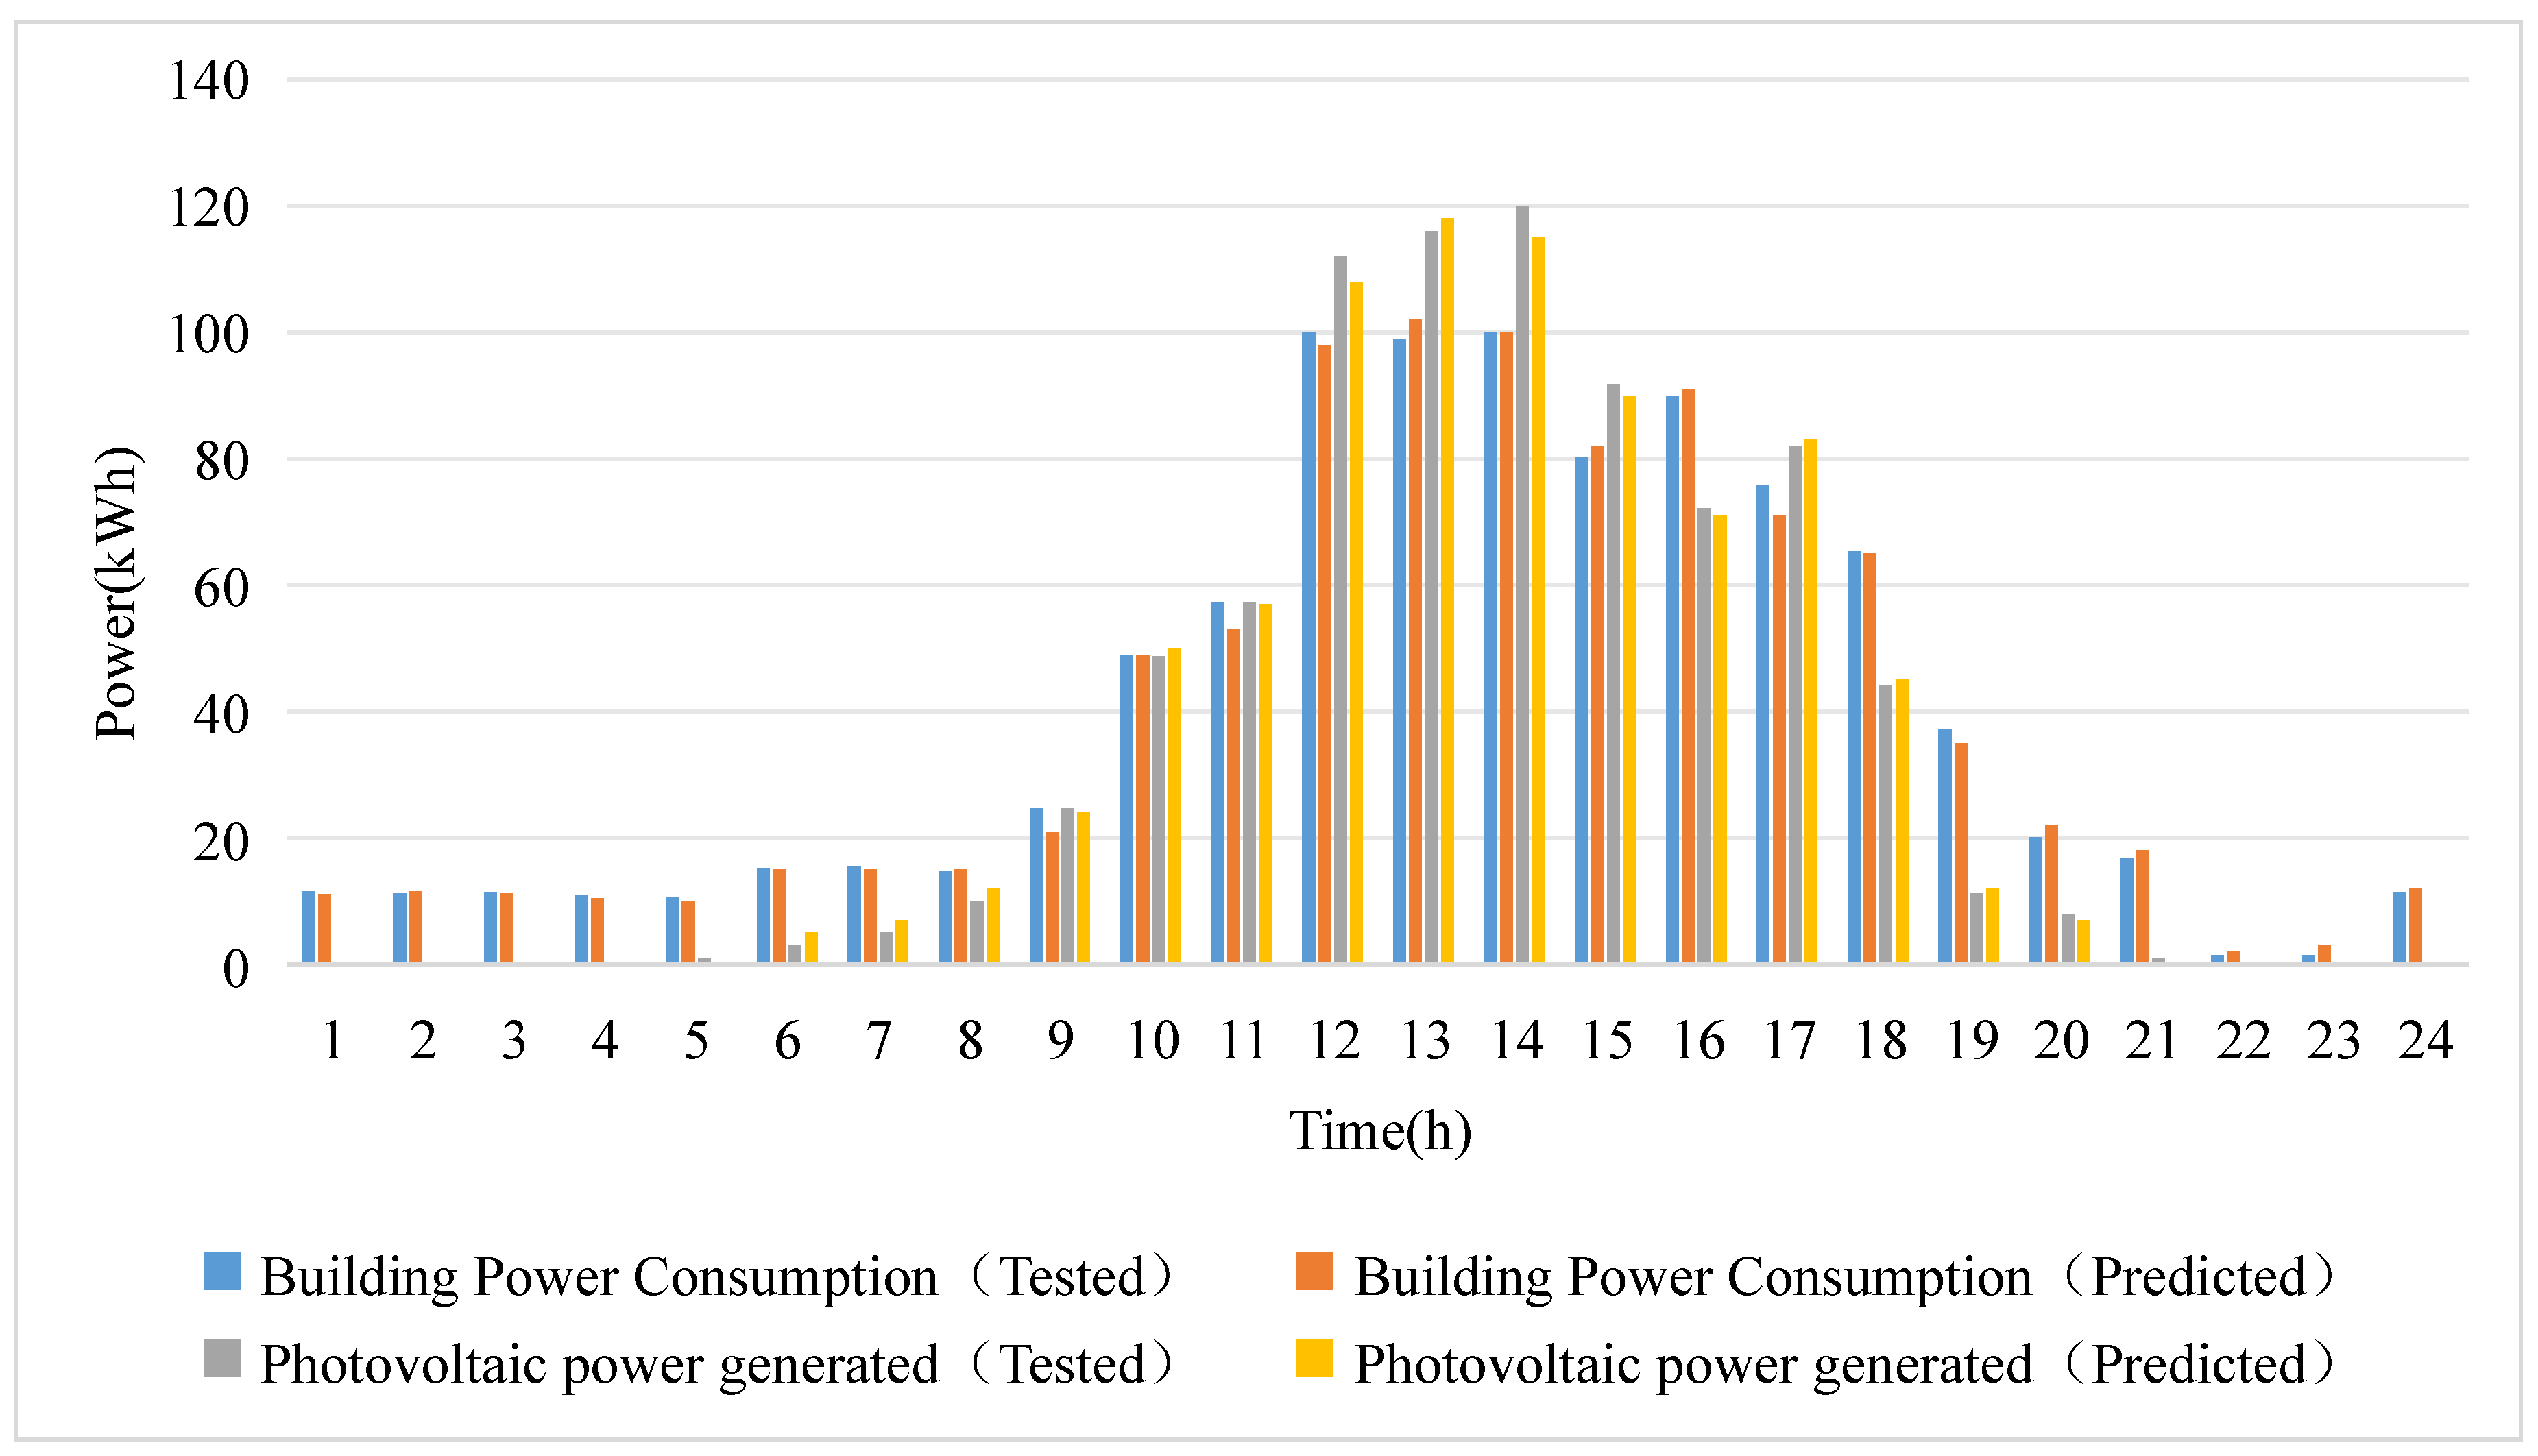
2.2.2. Load Forecasting Algorithm
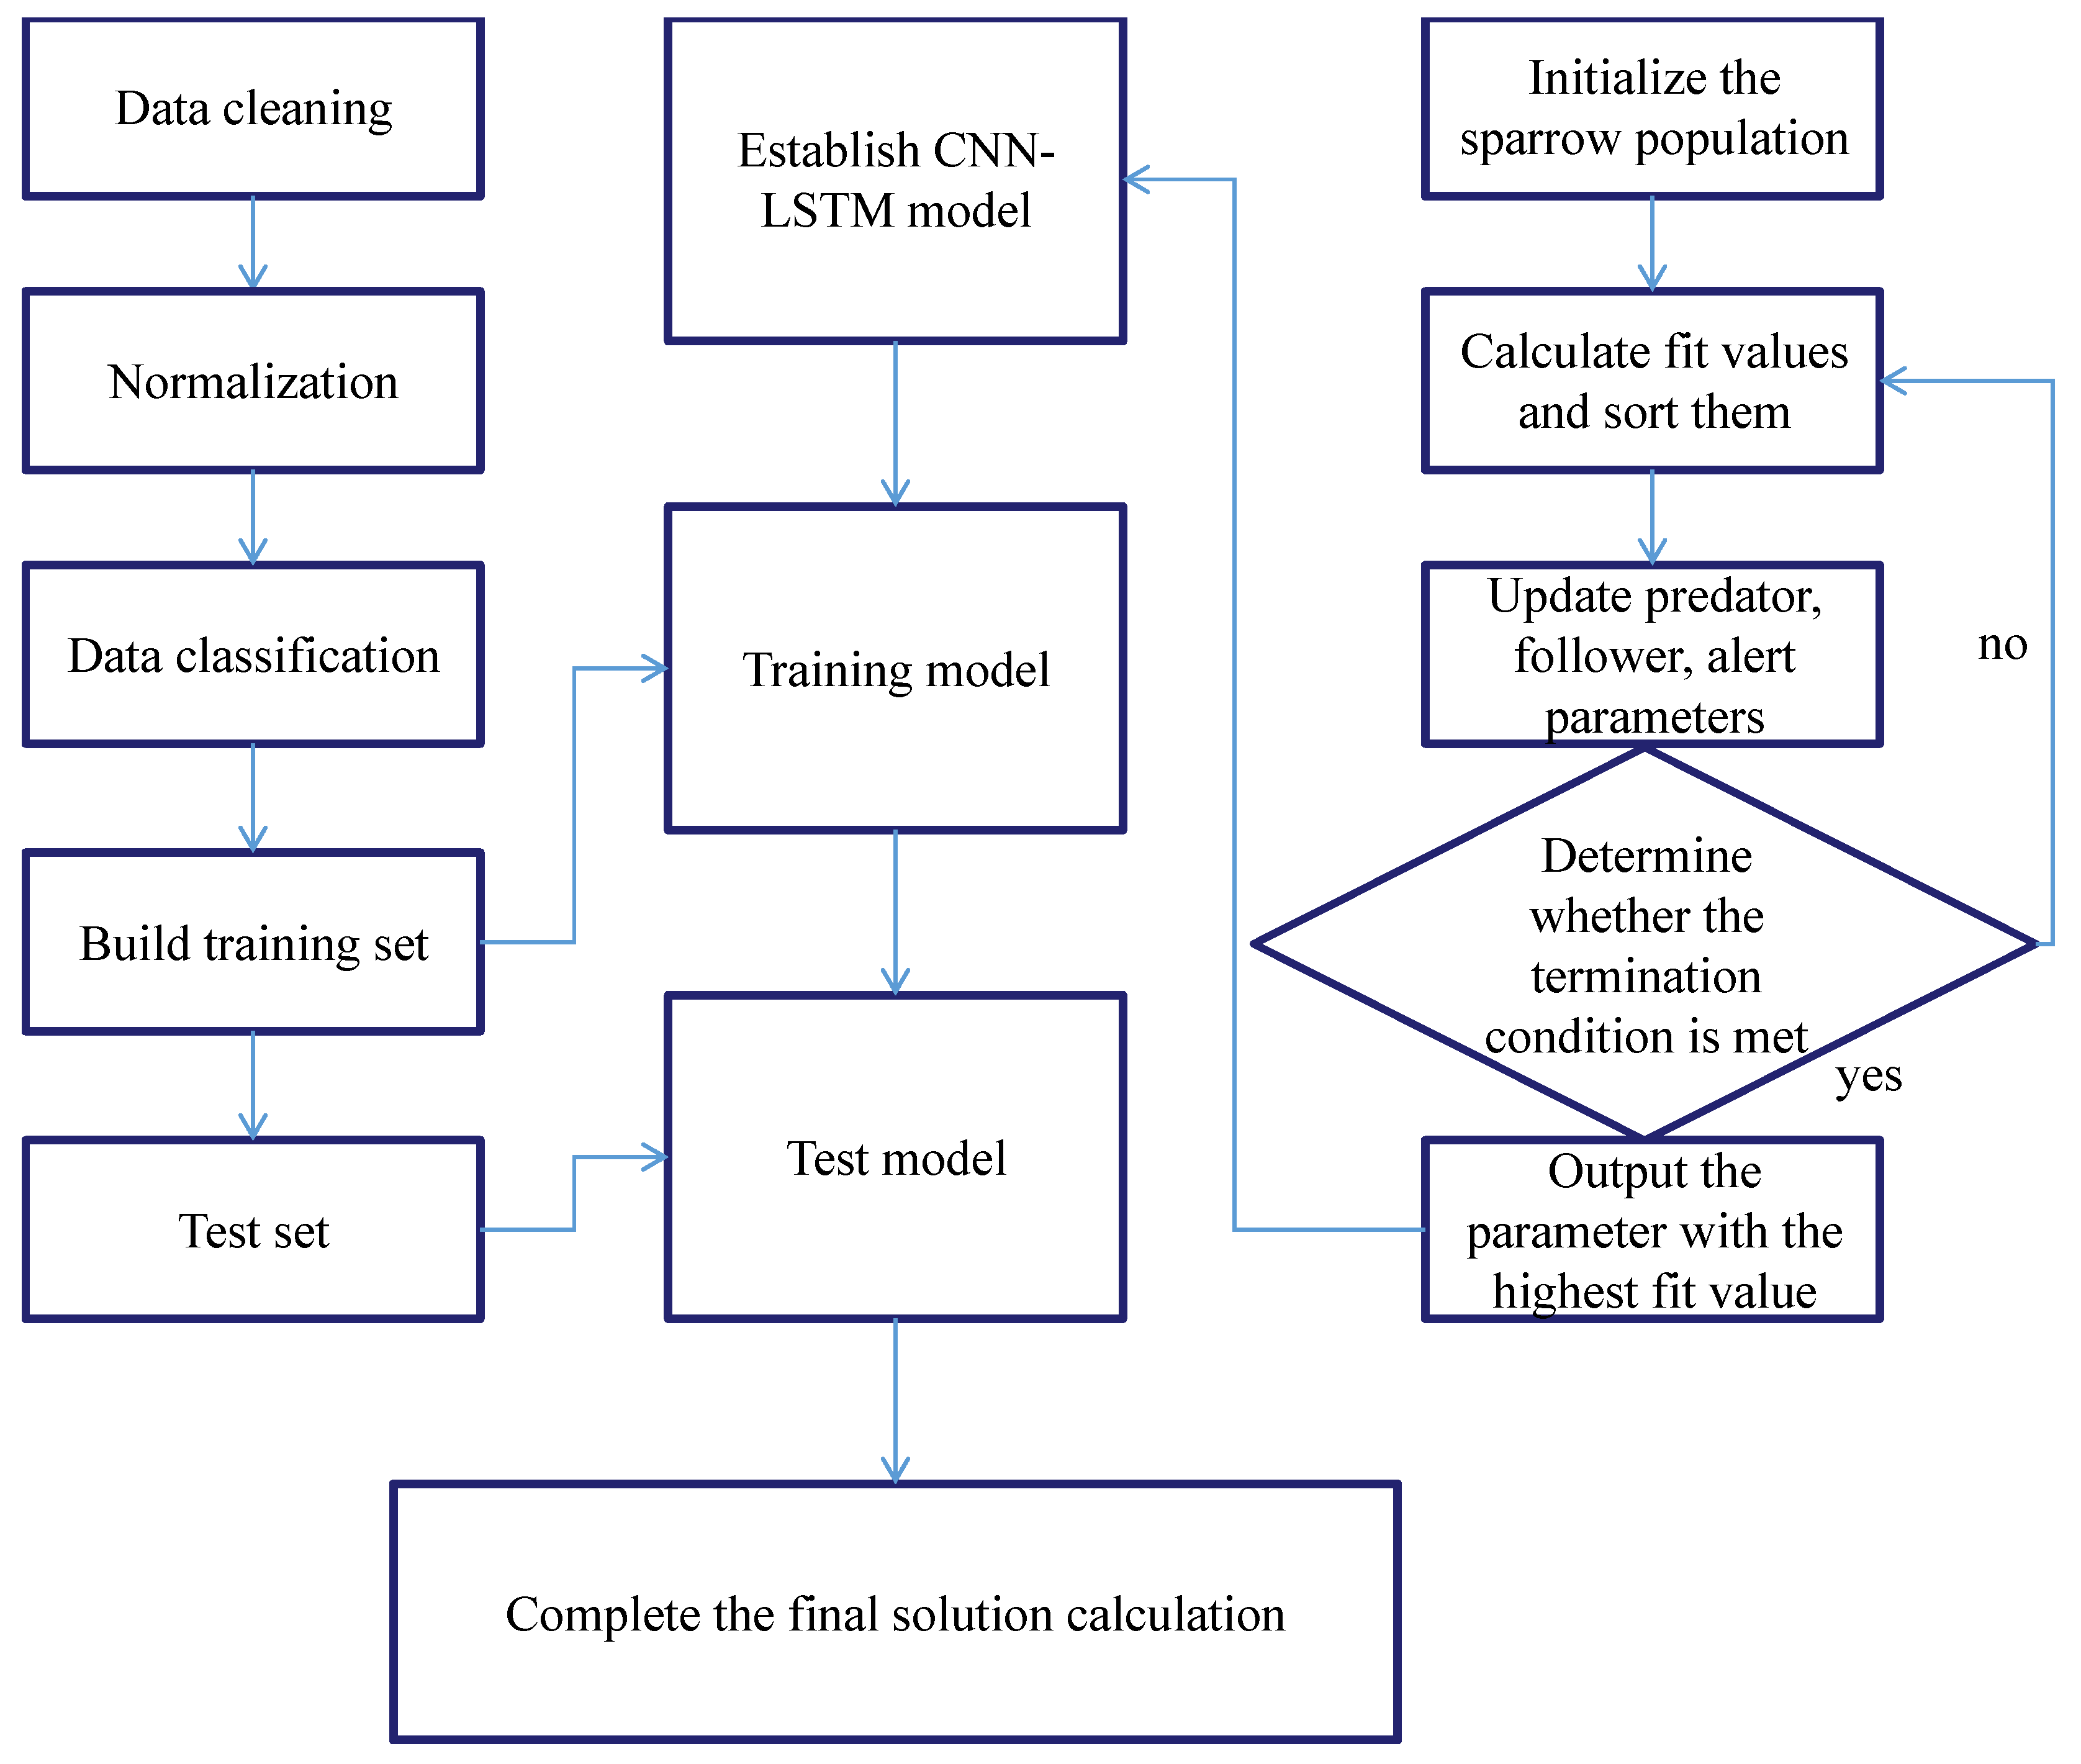
The prediction of building load and photovoltaic power generation is the basis of building energy system operation control. In this paper, the coupling Algorithm model of Sparrow Search Algorithm (SSA), Convolutional neural network (CNN) and LSTM (long short-term memory network) is used to predict the load, which improves the accuracy and stability of the prediction on both sides of the renewable power generation and source load. First, the SSA algorithm is used to carry out dynamic update global search, optimize the hyperparameters of CNN and LSTIM, and rapidly narrow the range of global optimal solutions. Then, the CNN model is used to locally extract important features in time series prediction to provide rich input information for LSTM. Finally, the long-term dependency relationship is further explored through LSTM. Through the combination of SSA optimization, CNN local feature extraction, and LSTM long-term dependence capture, the model can improve prediction accuracy and efficiency in complex prediction tasks, and complete 24-hour hourly building electricity, heat, and cooling load prediction and hourly photovoltaic power generation [
35]. The structure of the SSA-CNN-LSTM prediction model is shown in
Figure 9.
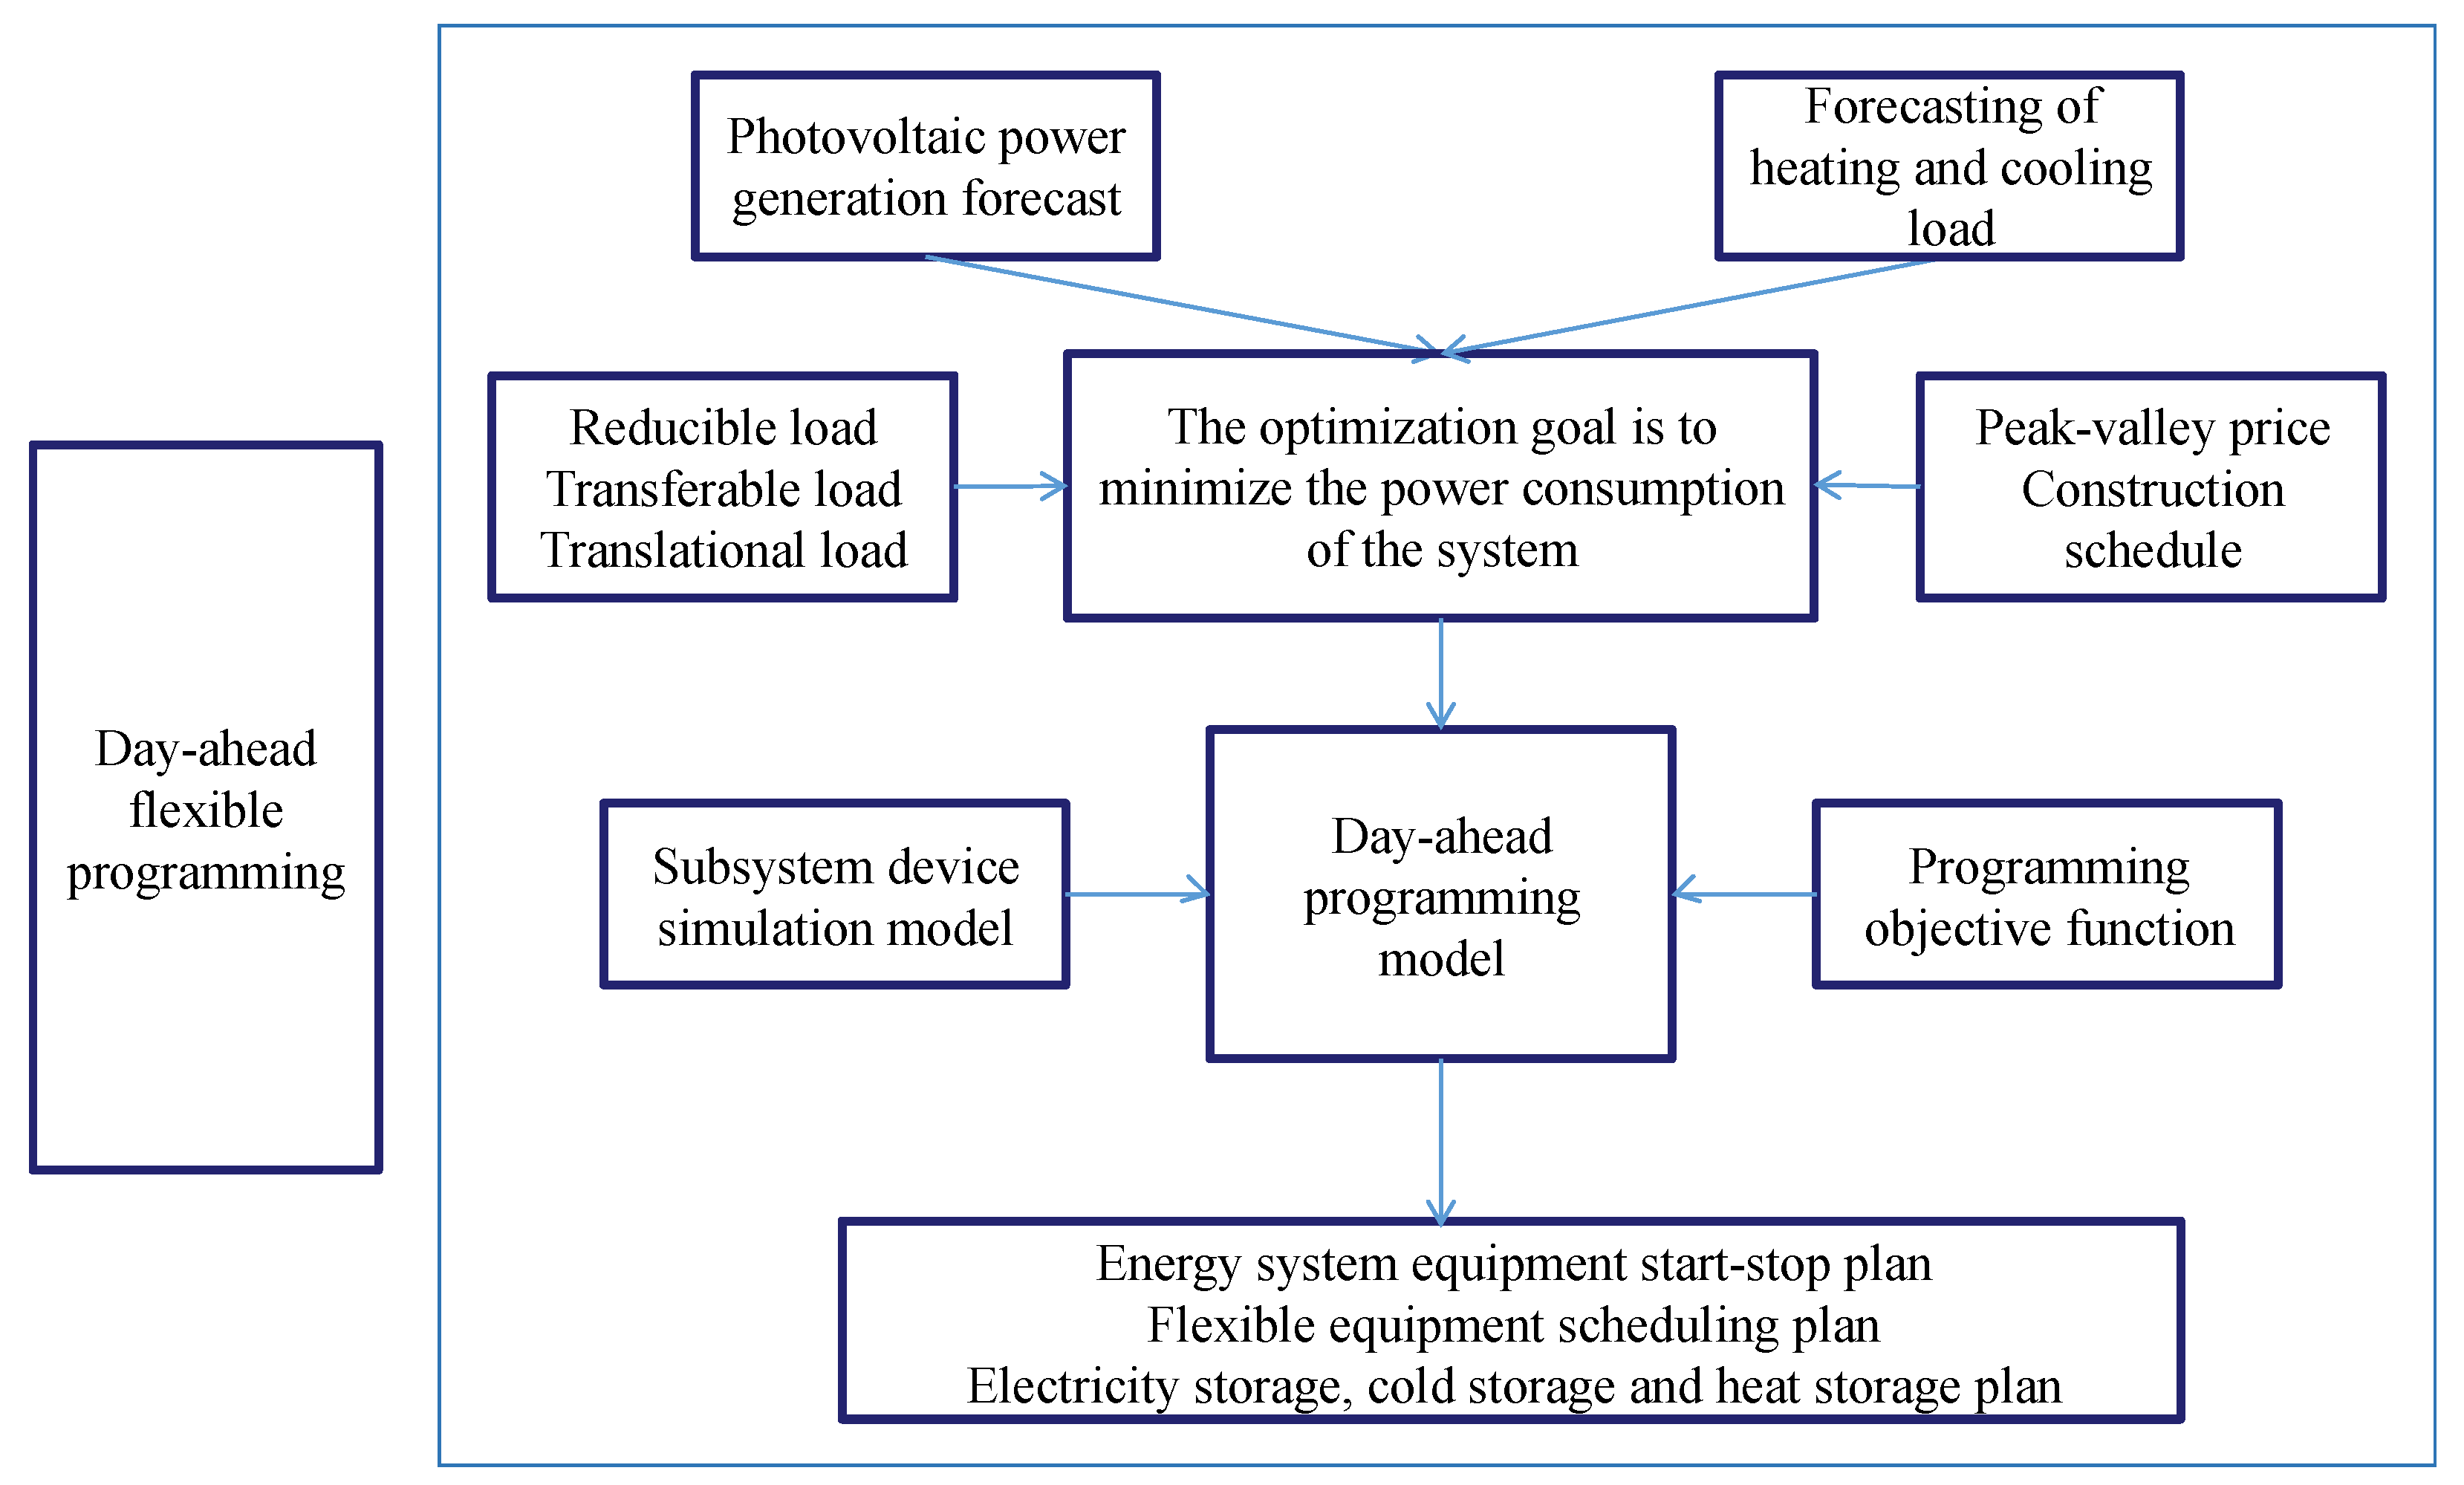
2.2.3. Day-ahead Planning Algorithm Considering Flexible Adjustment Ability
According to the forecast results of building thermal and cold power load and renewable energy power generation, the day-ahead planning of the operation strategy of the building complex energy system is carried out considering the flexible adjustment ability of the zero-carbon building energy system, peaking and valley electricity price, and the demand response plan of construction activities. The day-ahead planning model flow diagram is shown in
Figure 10.
According to the way of participating in the energy system demand response, the flexible load of zero-carbon buildings can be divided into translation load, transfer load and reduction load. Shiftable load Shiftable load is a load with fixed power and continuous working time in a certain period of time, which needs to continue to consume energy without interruption after starting, and can be shifted to multiple periods. Transferable load is a type of load with adjustable power and duration during the cycle under the condition that the total load remains unchanged. Reducible loads are loads that can reduce power, shorten time or interrupt operation to a certain extent. This paper analyzes the composition of flexible load equipment in typical zero-carbon buildings, and the classification is shown in
Table 3. [
36]
Day-ahead planning considers the schedule of construction activities and the schedule of peak and valley electricity prices, takes the lowest electricity cost of the system operation as the optimization goal, takes into account the characteristics of zero-carbon building load and flexible load, and gets the hourly output plan of battery, water storage, cold and heat source host, photovoltaic power generation, building flexible energy use equipment in the next 24 hours through optimization calculation. In the day-ahead stage, it is necessary to determine the start-stop plan of the main unit, the transferable flexible load response amount of the day-ahead energy storage equipment, the reducible and transferable load response amount of the building operation, and substitute it into the day-ahead planning as the determined quantity. In the day-ahead stage, unit operation energy consumption, unit start-stop loss, time-of-day electricity price cost, day-ahead flexible response energy consumption, and light abandonment penalty cost should be taken into account, and the day-ahead objective function should be constructed with the lowest system operation electricity cost, as shown in formula (2) [
37].
is the total day-ahead system cost, is the state variable of unit i at time t, is the operating cost parameter of unit i, is the power of unit i at time t, is the start-stop cost of unit, and is the compensation coefficient and response quantity before the load can be shifted, transferred and reduced, respectively, is the penalty coefficient of light abandonment. Respectively andare the photovoltaic forecast power and absorption power.
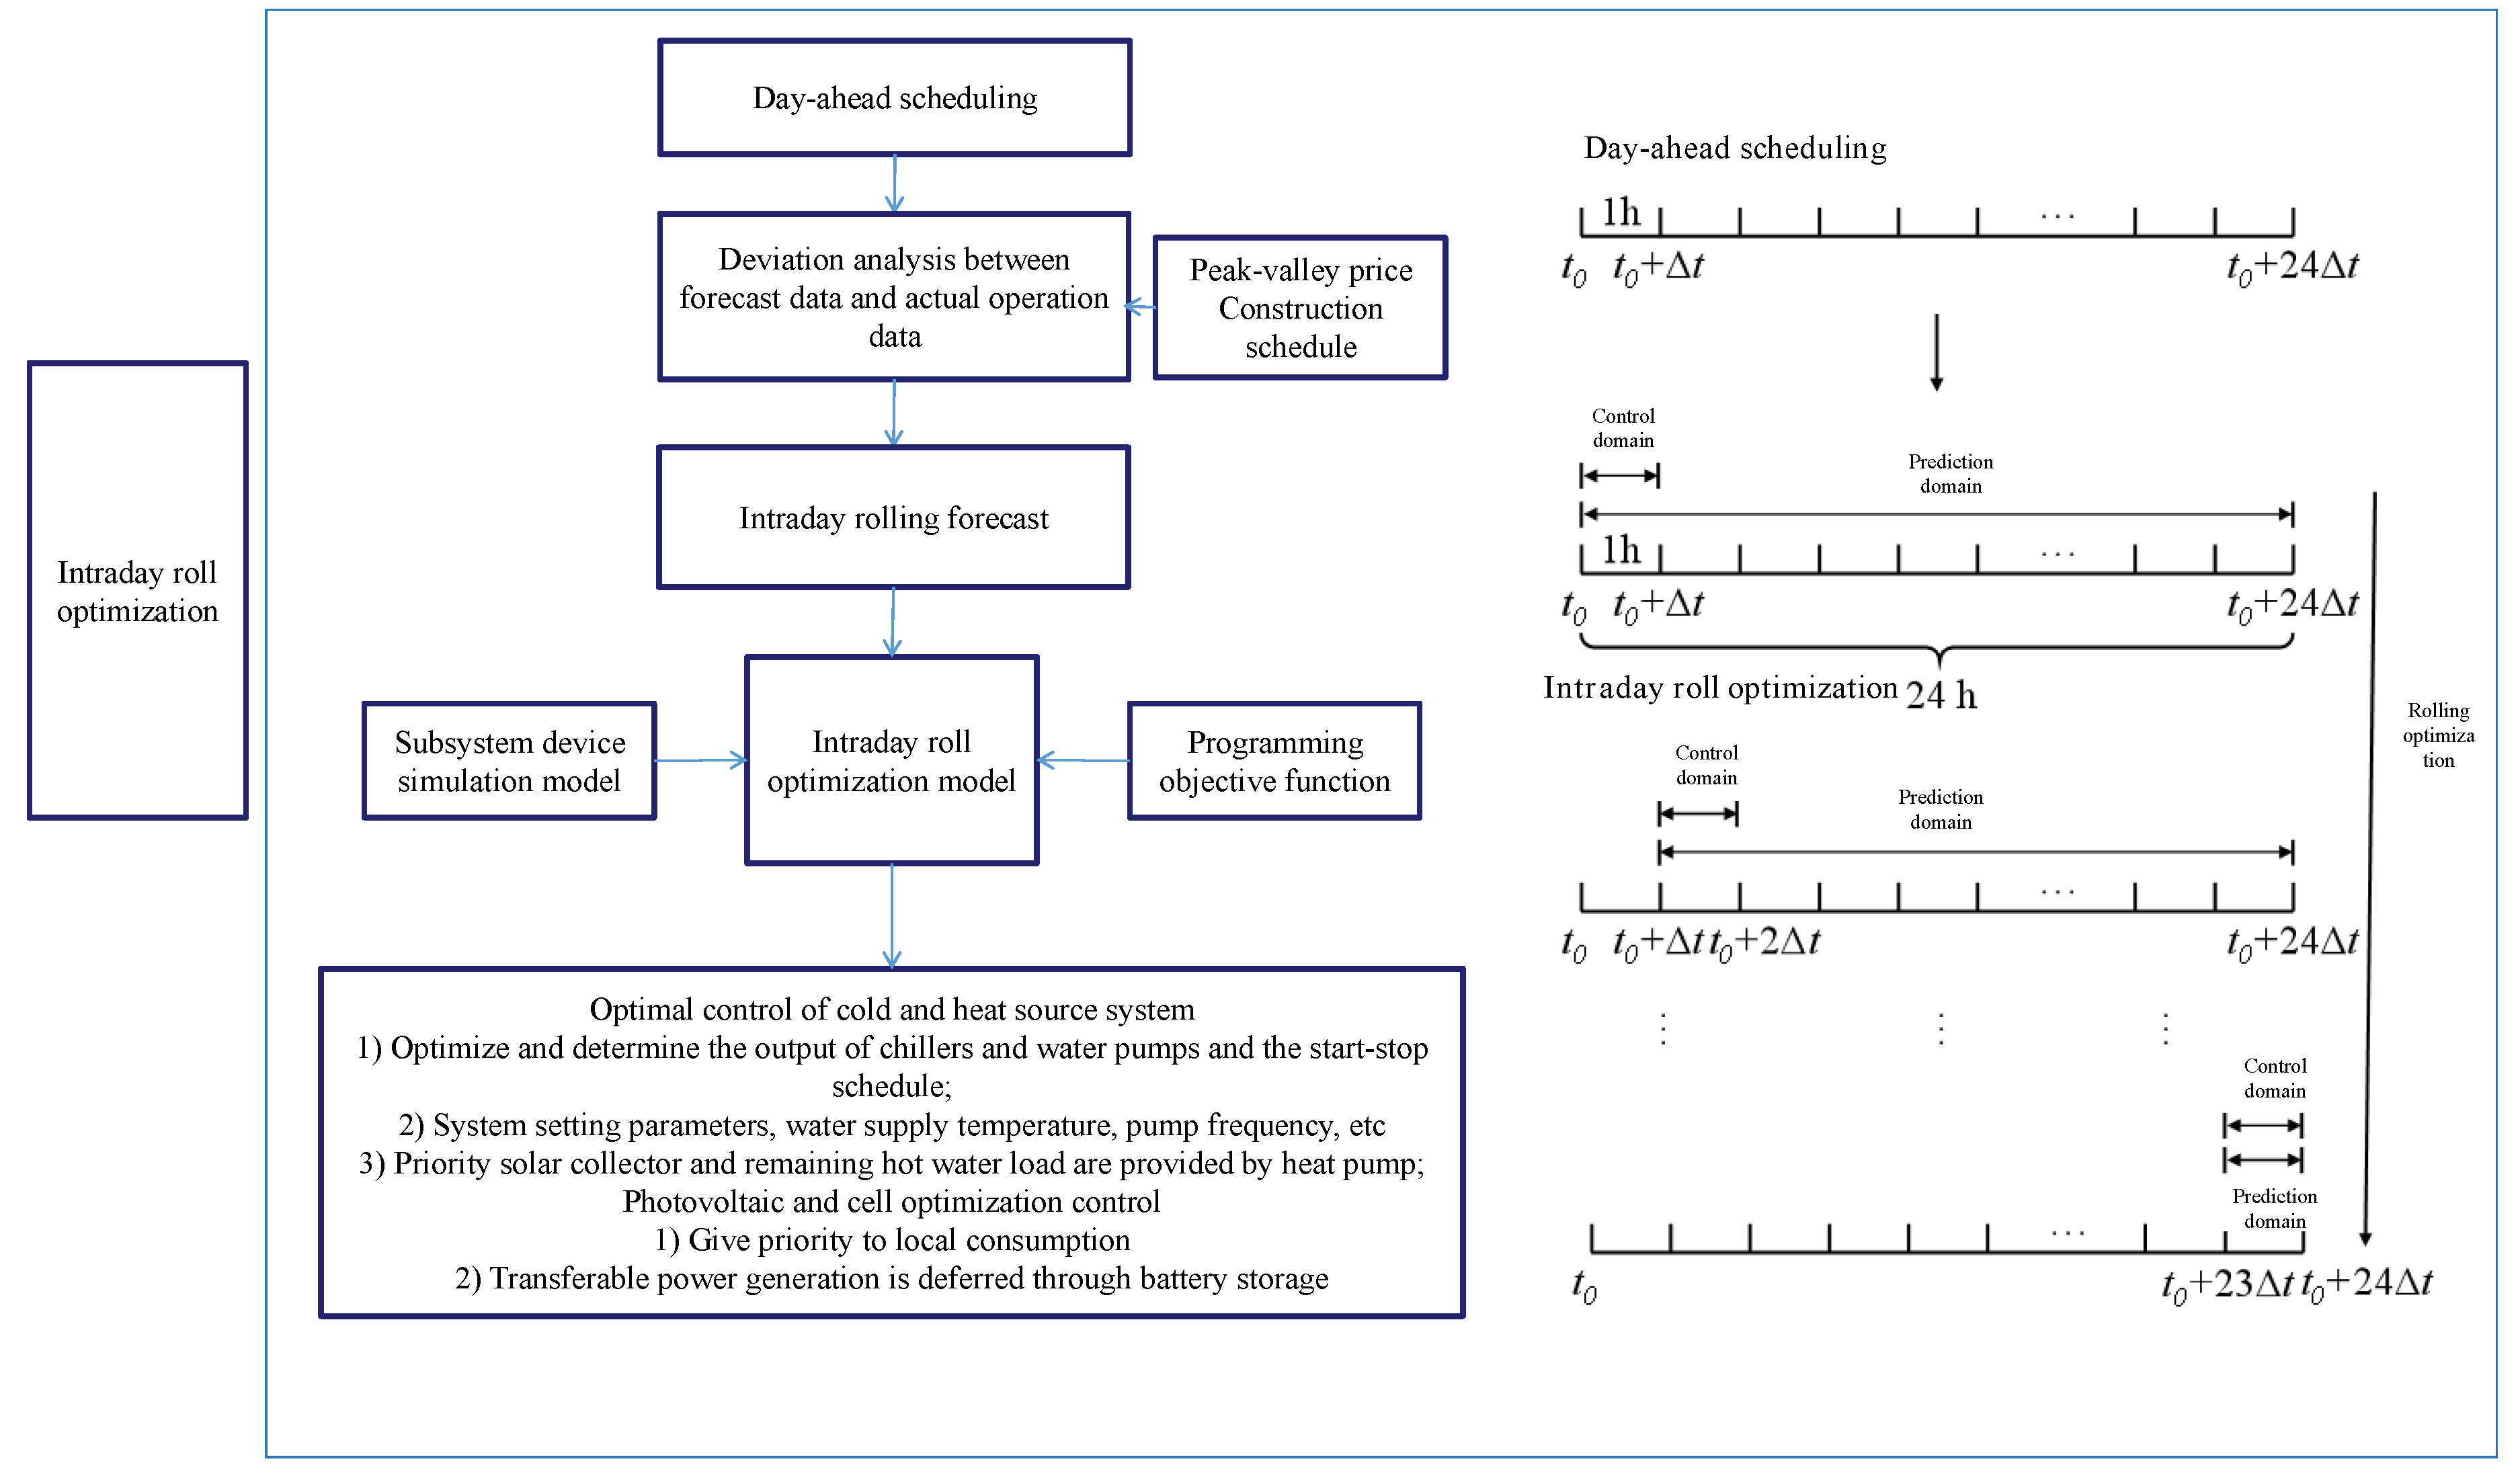
2.2.4. Intraday Rolling Optimization Algorithm
Figure 11 shows the frame diagram of the intraday rolling optimization algorithm. The intraday rolling optimization is based on the actual generation situation of renewable energy monitored in real time (such as the current actual photovoltaic output, the real-time power of wind turbines, etc.) and the actual load change of the building (which may be caused by the temporary addition of large electrical equipment, the change of the number of personnel, etc.). The energy scheduling plan is revised every 1 hour for the rest of the period. Based on the pre-planned start-stop plan of the complex energy system, the charging and discharging plan of the energy storage equipment, the output plan of the energy equipment and the scheduling plan of the demand response of the portable electric load, based on the real-time updated renewable power generation output and the ultra-short-term forecast data of the power of the electric, hot and cold loads, Predictive control is used to build the output prediction model of all controllable equipment in a limited period of time in the future, and further establish the intra-day rolling optimization scheduling model of regional integrated energy system with the minimum output deviation and regulation amount as the goal, and carry out intra-day optimization control of battery, energy storage water tank, cold and heat source system equipment and building flexible energy use equipment with the set parameter level on an hourly basis.
In the intra-day rolling optimization scheduling, the previously completed power storage and water cold storage and heat storage related plans are no longer considered. According to the deviation of load forecast and actual energy supply and demand, the intra-day load adjustment response cost is extra considered. In addition, the penalty cost of abandoning light also changes due to the change of cheap situation. Therefore, the day-ahead objective function is constructed with the lowest operating power cost of the system as shown below to complete the control optimization of the day-ahead operating parameter level. The day-ahead objective function based on the lowest electricity cost for system operation is shown in formula (3) [
36].
is the total day-ahead system cost,
is the day-day rolling optimization scheduling cycle, and is the day-day flexible compensation coefficient and the day-day flexible response quantity that can be translated, transferred and reduced, respectively, is the daily rolling forecast power in PV.
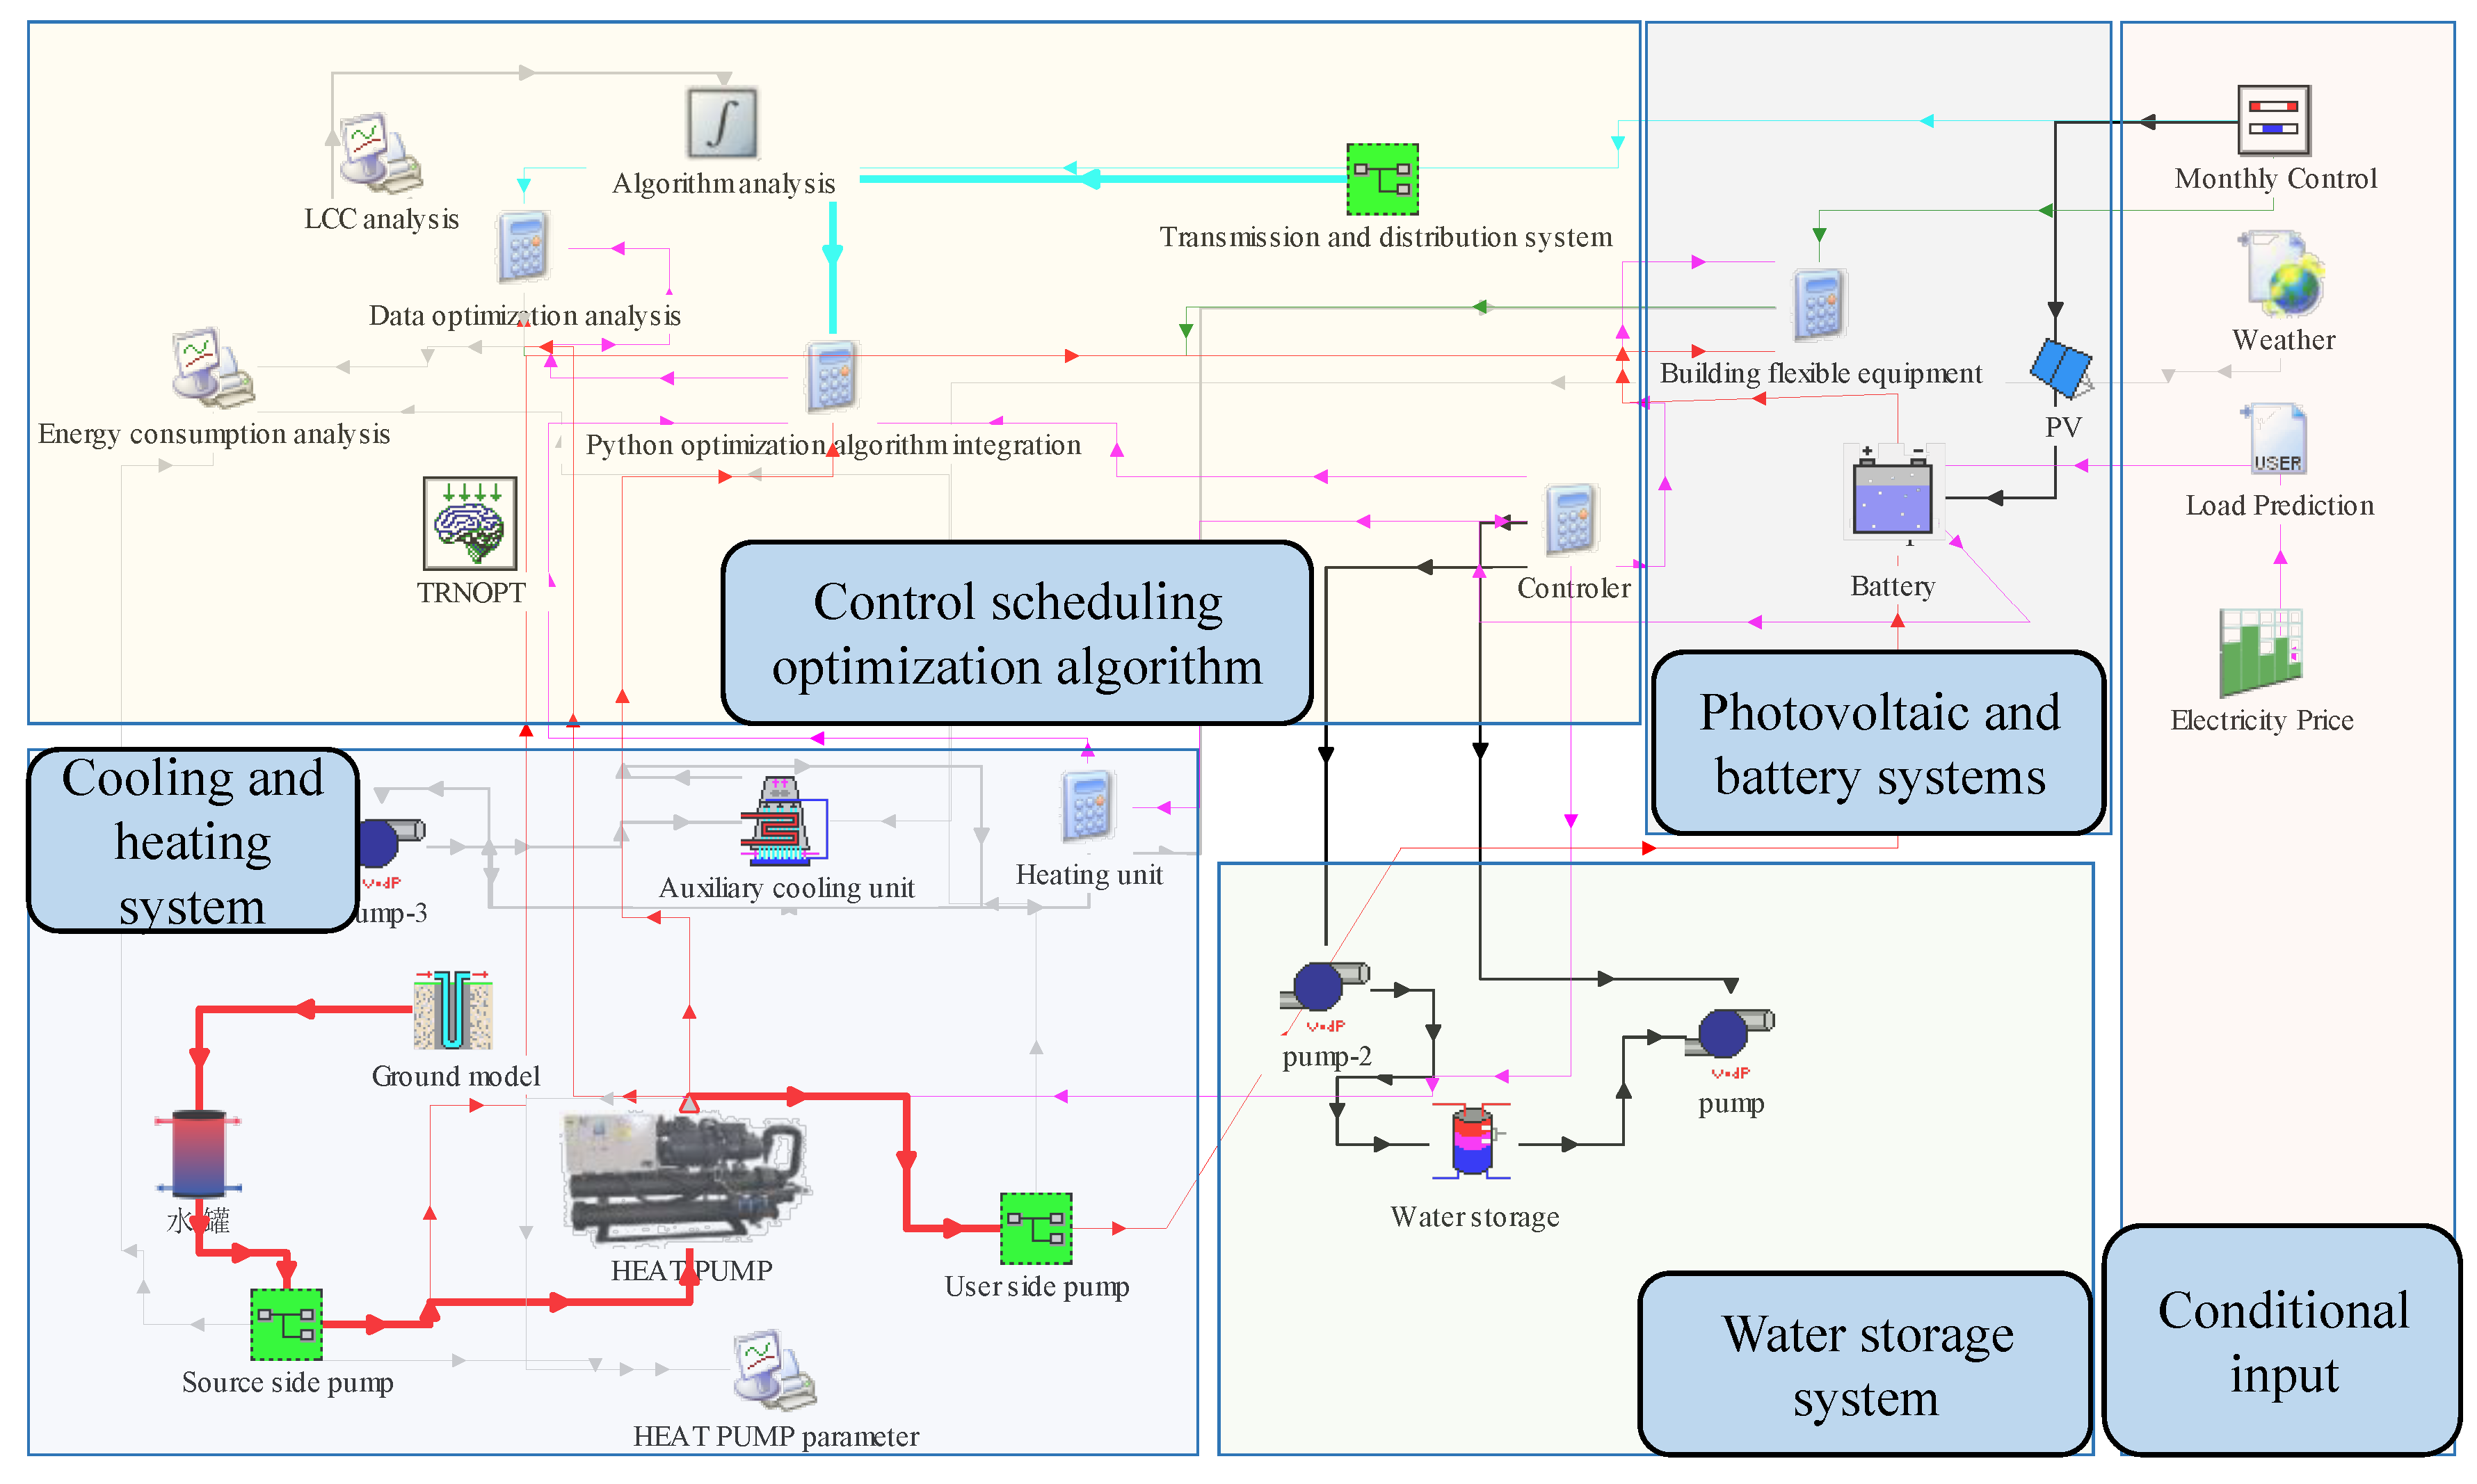
2.3. Python-TRNSYS Based Multi-Energy Flow Coupling Optimization Control Model
In this paper, Python programming and TRNSYS software dynamic simulation are combined to build a multi-energy flow coupling optimization control model for a zero-carbon building complex energy system, as shown in
Figure 12. The establishment of multi-energy flow model of zero-carbon building complex energy system is the basis for realizing control optimization calculation. In this paper, TRNSYS18 software is used for modular modeling advantages to complete the establishment of photovoltaic power generation model, battery storage model, heat pump system model, water storage tank model and zero-carbon building energy equipment model, and to clarify the inputoutput and coupling characteristics of different system equipment. Realize 8760h dynamic simulation of zero-carbon building complex energy system. In this paper, Python was used to complete the load prediction algorithm programming of building power consumption, heating and cooling loads and photovoltaic power generation, and the day-ahead flexible planning-day-day rolling optimization algorithm programming, so as to realize the global optimization control of the complex energy system across time scales.
The multi-energy flow coupling optimization control model was packaged in the building energy control interactive software. The construction of building energy control interactive software for typical zero-carbon buildings was carried out in early December 2023, and the control algorithm proposed in this paper was actually applied in the energy system control process of typical zero-carbon buildings.
4. Discussion
Aiming at the problem that the operation control method of zero-carbon building complex energy system lacks actual data support, mature theoretical guidance and algorithm model tools, this paper selects a typical zero-carbon building practical project as the research object, and proposes an energy system control scheduling algorithm based on day-ahead flexible programming and day-day rolling optimization. A multi-energy flow coupling optimization control model is developed which can be used in practical engineering. By applying the control algorithm model to a typical practical project, this paper makes a comparative analysis of the operation data of the zero-carbon building energy system before and after the transformation. The overall conclusion is as follows:
This paper proposes an energy system control algorithm based on day-ahead flexible planning and day-day rolling optimization suitable for zero-carbon buildings, and develops a multi-energy flow coupling optimization control model for heat pump, photovoltaic, electricity storage, cold and heat storage combined systems, and this algorithm model can be applied to practical projects. It provides a reproducible algorithm model tool for the operation control of zero-carbon building complex energy system.
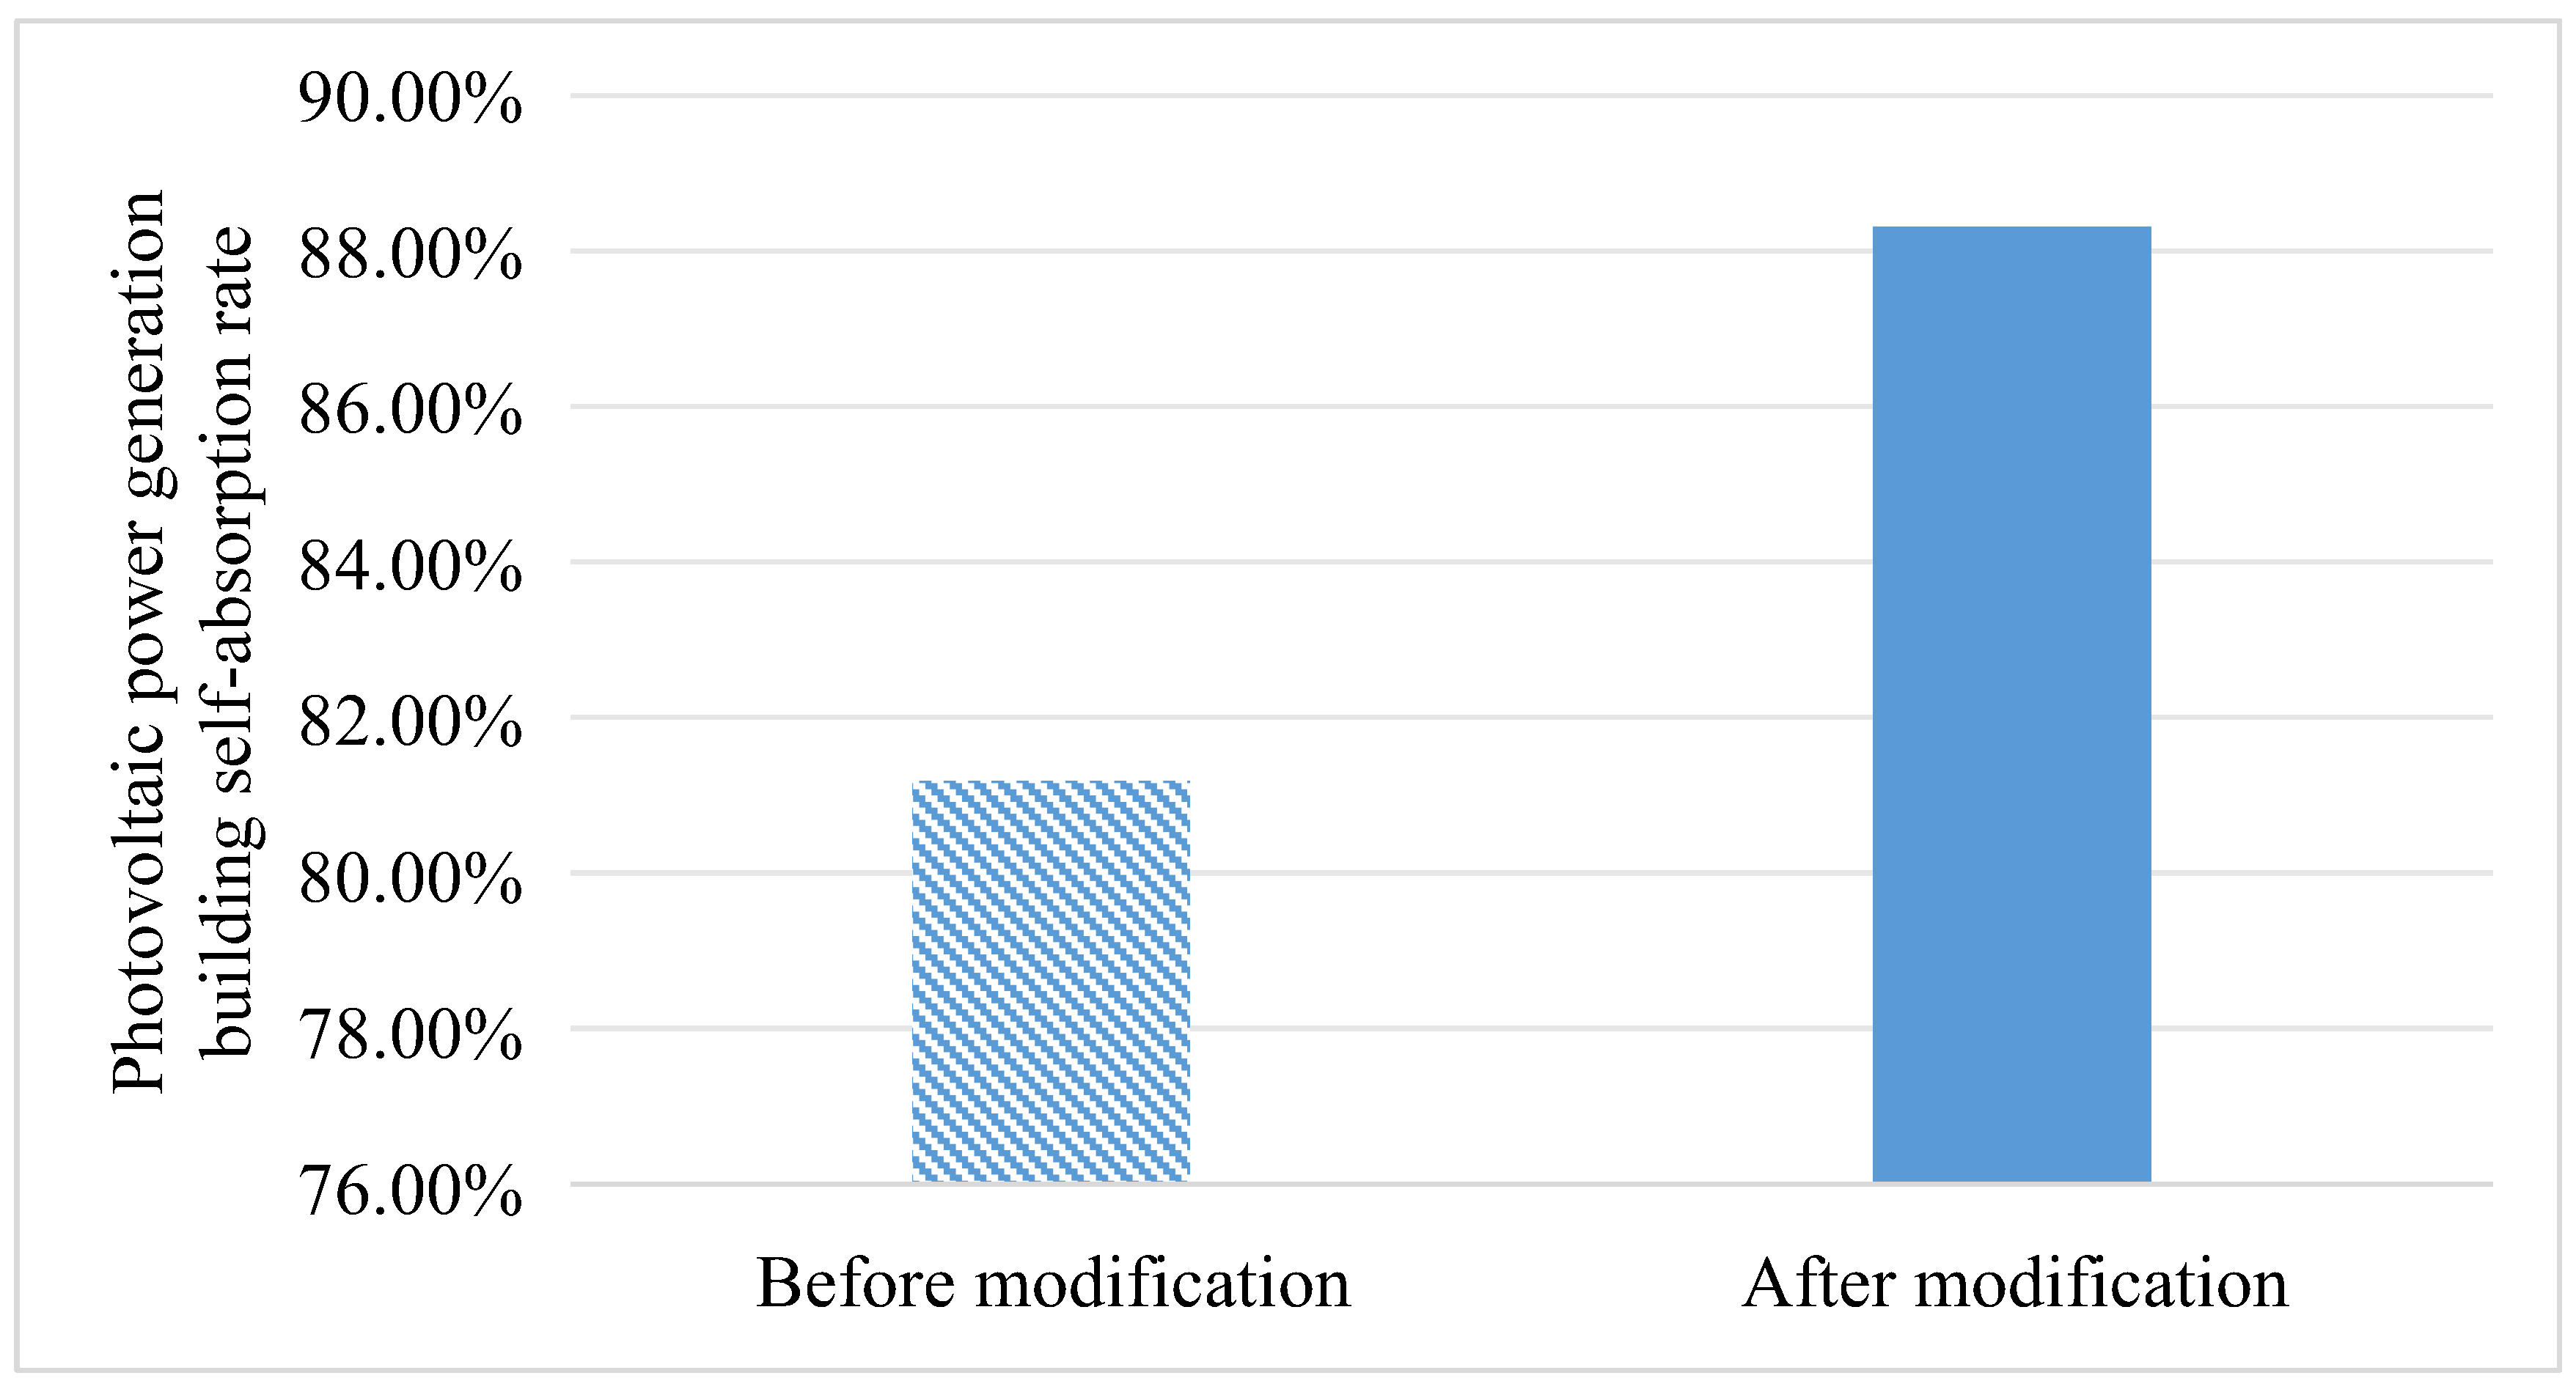
This paper analyzes the two-year operation data of a zero-carbon building project, and the results show that the annual self-absorption rate of photovoltaic power generation buildings is increased by 7.13% by using the flexible adjustment ability of equipment such as electricity storage. The algorithm model established in this study has a good effect of improving the utilization of renewable energy.
This paper provides measured data for the research and engineering construction of zero-carbon building complex energy systems, which is conducive to promoting the coupling system application of photovoltaic, heat pump and energy storage systems. Through in-depth research on the integration and cooperative scheduling of zero-carbon building energy system, the renewable energy utilization effect of buildings can be effectively improved and the effect of buildings in reducing carbon emissions can be guaranteed.
However, although this paper has formed the energy system control algorithm and control model, there are still shortcomings, which need to be deepened in the follow-up research. First , the multi-energy flow coupling optimization control model developed in this paper only includes heat pump, photovoltaic, battery, water storage and building end-use energy systems, and cannot cover all types of building thermal and cold energy equipment. Subsequent studies should further expand the equipment types of the multi-energy flow system model and improve the scope of application of the model. Second, this paper only conducted effect verification for one specific building in Beijing area, and the amount of operational data is not rich enough. The application effect analysis should be carried out in more practical projects in the future, and the algorithm model should be continuously trained and improved through actual data.
Figure 1.
Flow chart of zero-carbon building complex energy system.
Figure 1.
Flow chart of zero-carbon building complex energy system.
Figure 2.
Comparison of annual electricity consumption and power generation of zero-carbon buildings before transformation.
Figure 2.
Comparison of annual electricity consumption and power generation of zero-carbon buildings before transformation.
Figure 3.
Monthly electricity consumption and power generation of zero-carbon buildings before transformation.
Figure 3.
Monthly electricity consumption and power generation of zero-carbon buildings before transformation.
Figure 4.
Monthly self-absorption rate of photovoltaic power generation building before the transformation.
Figure 4.
Monthly self-absorption rate of photovoltaic power generation building before the transformation.
Figure 5.
Hourly electricity demand and photovoltaic power generation of zero-carbon buildings in typical summer days before the renovation.
Figure 5.
Hourly electricity demand and photovoltaic power generation of zero-carbon buildings in typical summer days before the renovation.
Figure 6.
Usage of photovoltaic power generation in typical summer days before renovation.
Figure 6.
Usage of photovoltaic power generation in typical summer days before renovation.
Figure 7.
Hourly electricity consumption of zero-carbon buildings in typical summer days before renovation.
Figure 7.
Hourly electricity consumption of zero-carbon buildings in typical summer days before renovation.
Figure 8.
Technical path diagram of day-ahead planning and day-day rolling optimization algorithm.
Figure 8.
Technical path diagram of day-ahead planning and day-day rolling optimization algorithm.
Figure 9.
Structure of SSA-CNN-LSTM prediction model.
Figure 9.
Structure of SSA-CNN-LSTM prediction model.
Figure 10.
Flowchart of the forward-planning algorithm model.
Figure 10.
Flowchart of the forward-planning algorithm model.
Figure 11.
Intraday rolling optimization algorithm frame diagram.
Figure 11.
Intraday rolling optimization algorithm frame diagram.
Figure 12.
Python-TRNSYS multi-energy flow coupling optimization control model of zero-carbon building complex energy system.
Figure 12.
Python-TRNSYS multi-energy flow coupling optimization control model of zero-carbon building complex energy system.
Figure 13.
Comparison of annual electricity consumption and power generation of zero-carbon buildings after transformation.
Figure 13.
Comparison of annual electricity consumption and power generation of zero-carbon buildings after transformation.
Figure 14.
Monthly electricity consumption and local PV generation of zero-carbon office buildings.
Figure 14.
Monthly electricity consumption and local PV generation of zero-carbon office buildings.
Figure 15.
Monthly building self-absorption rate of photovoltaic power generation in zero-carbon office buildings.
Figure 15.
Monthly building self-absorption rate of photovoltaic power generation in zero-carbon office buildings.
Figure 16.
Hourly electricity demand and photovoltaic power generation of zero-carbon buildings in typical summer days after renovation.
Figure 16.
Hourly electricity demand and photovoltaic power generation of zero-carbon buildings in typical summer days after renovation.
Figure 17.
Photovoltaic power generation usage of buildings in typical summer days before renovation.
Figure 17.
Photovoltaic power generation usage of buildings in typical summer days before renovation.
Figure 18.
Comparison between field test data and load prediction data.
Figure 18.
Comparison between field test data and load prediction data.
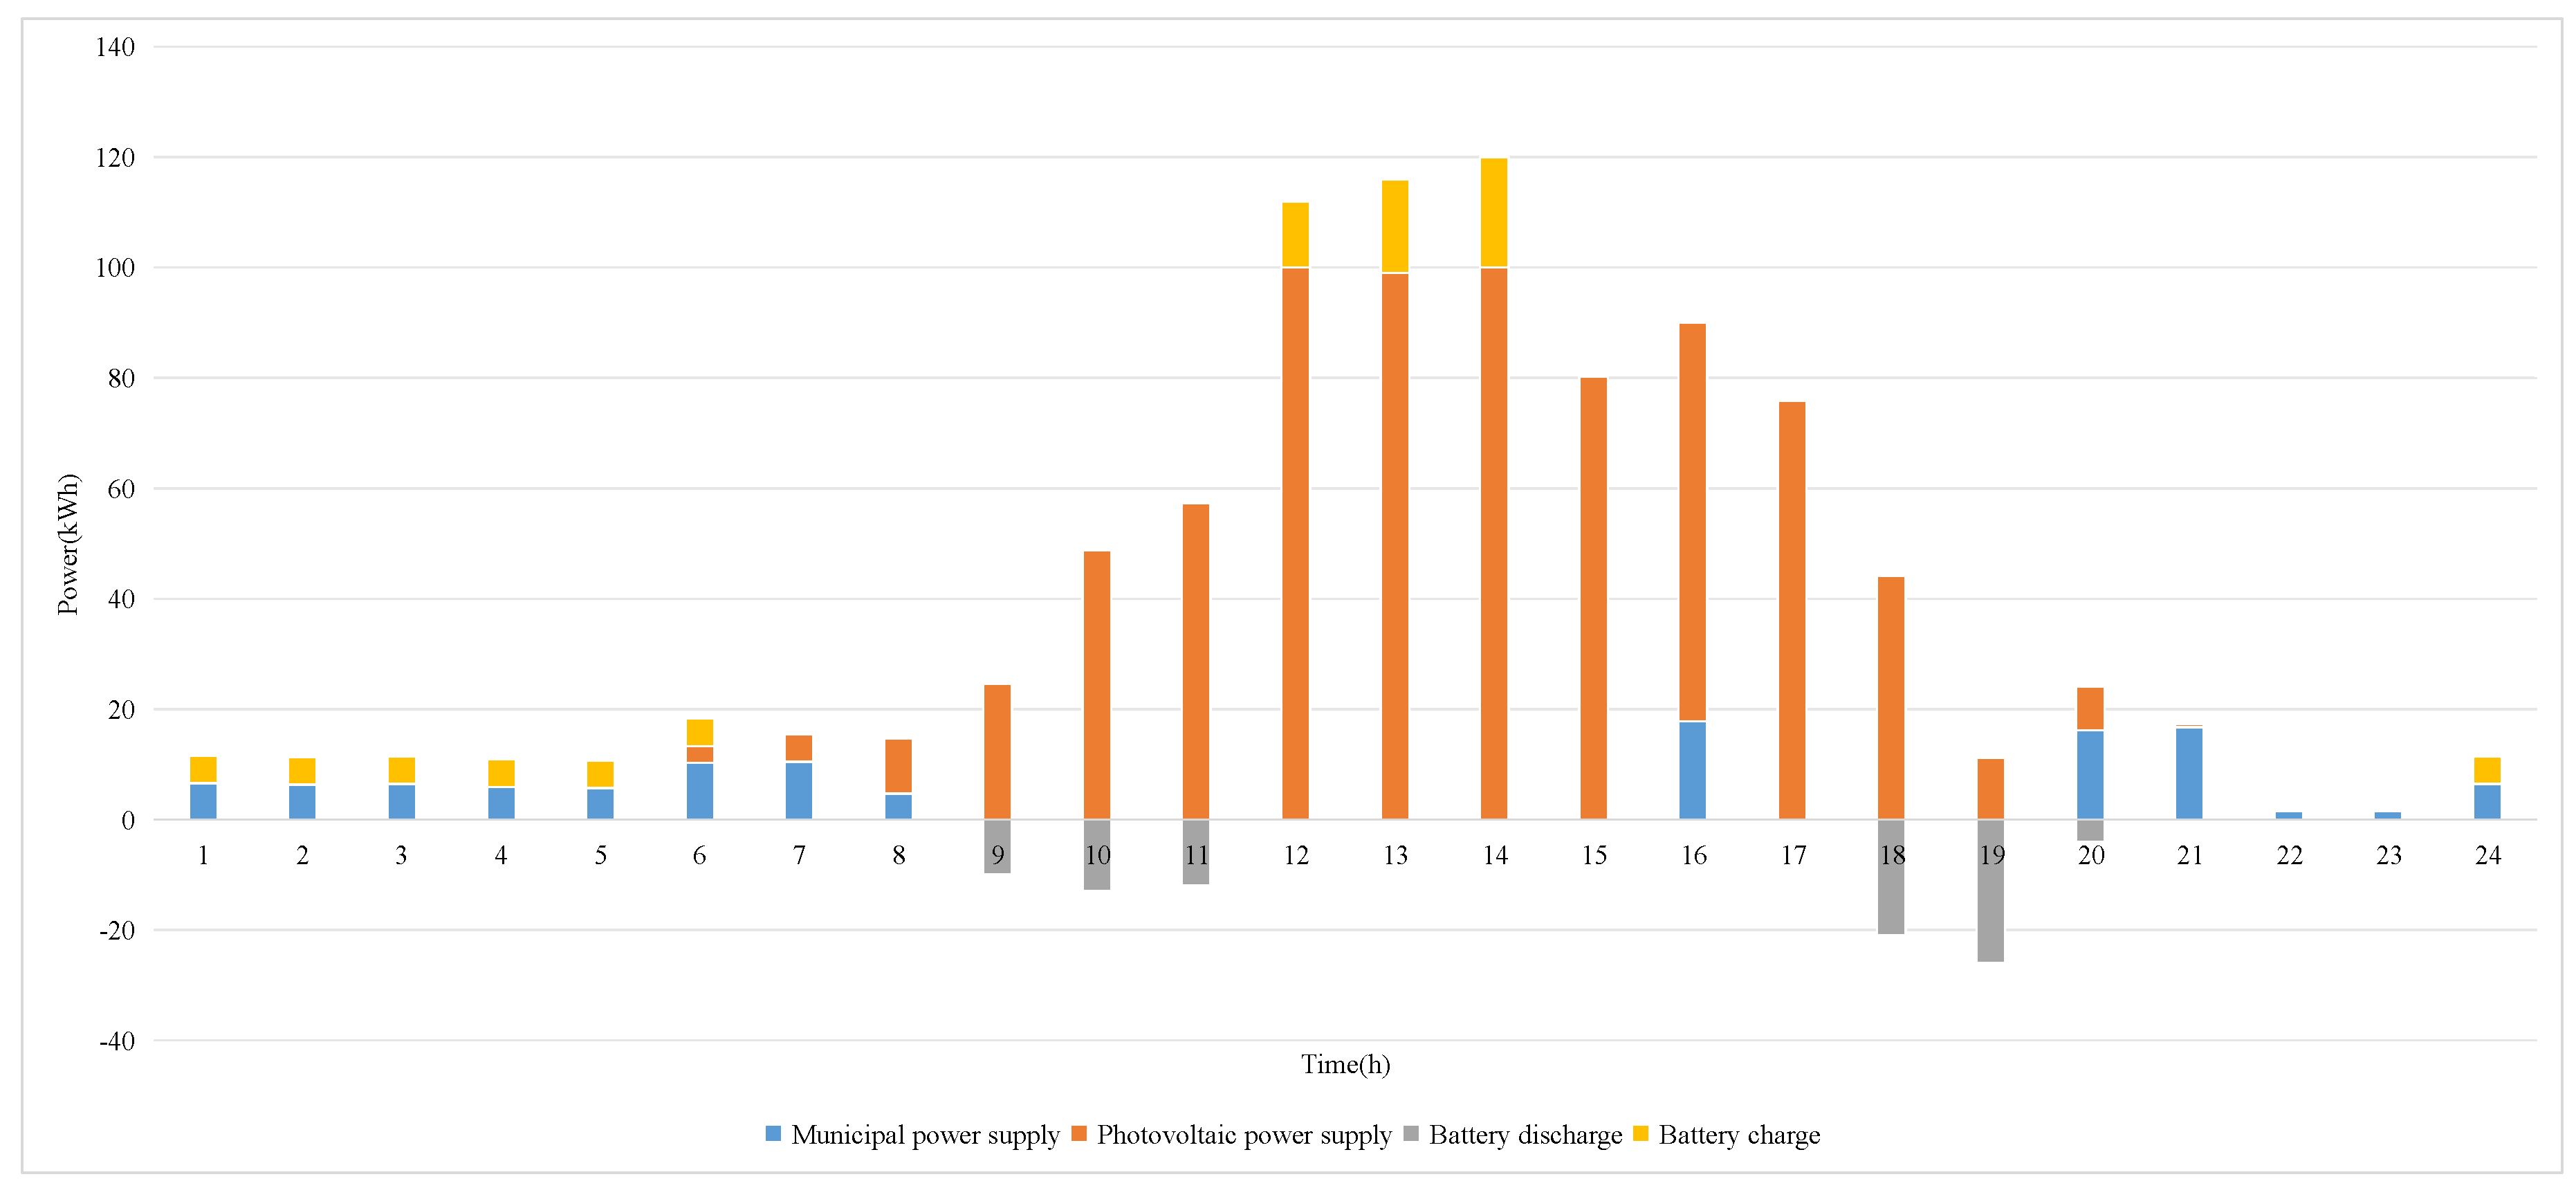
Figure 19.
Supply side sources of hourly electricity for zero-carbon buildings.
Figure 19.
Supply side sources of hourly electricity for zero-carbon buildings.
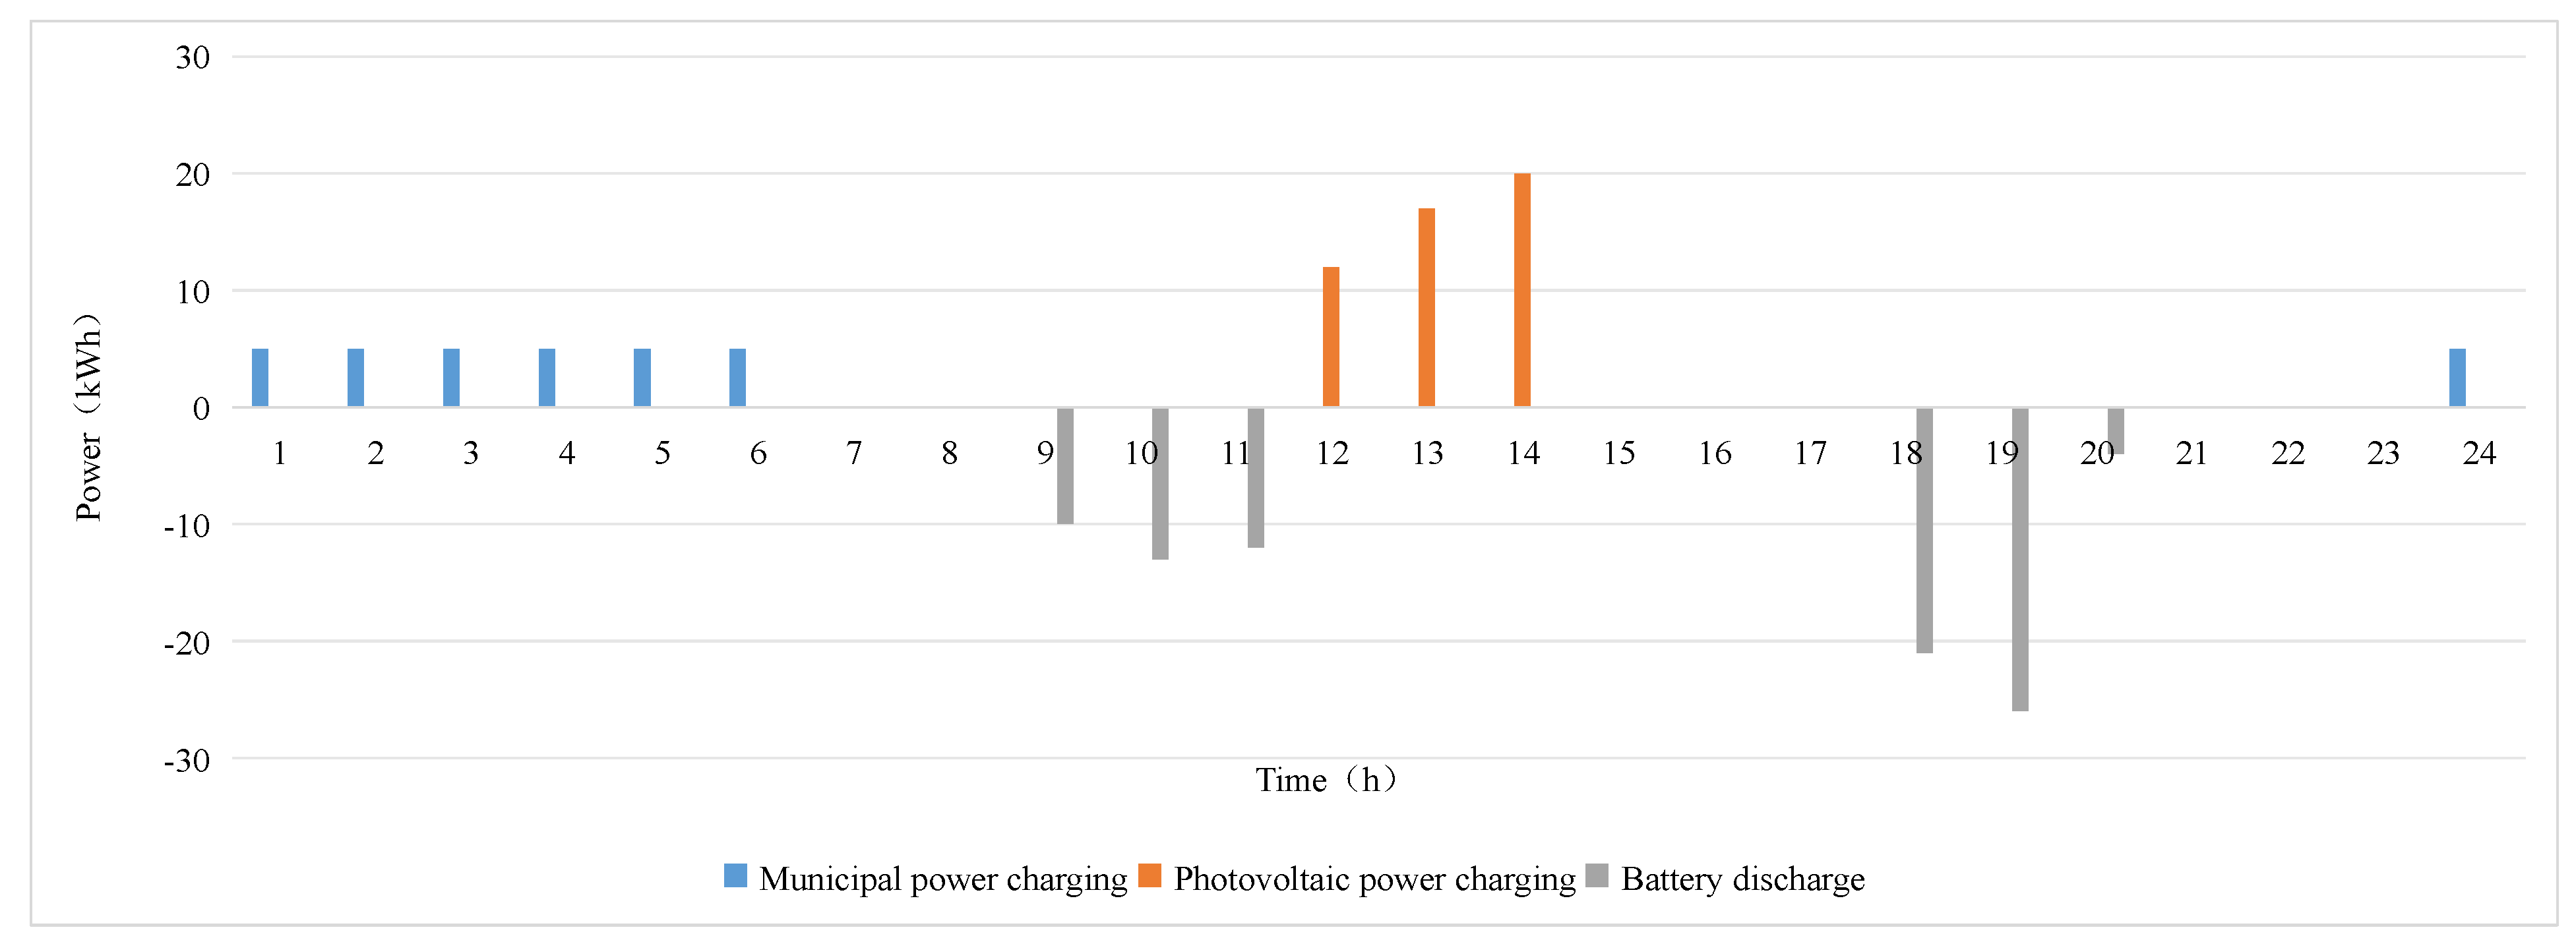
Figure 20.
Utilization schedule of photovoltaic power generation and battery conditions.
Figure 20.
Utilization schedule of photovoltaic power generation and battery conditions.
Figure 21.
Comparison of self-absorption rate of zero-carbon photovoltaic power generation buildings before and after renovation.
Figure 21.
Comparison of self-absorption rate of zero-carbon photovoltaic power generation buildings before and after renovation.
Figure 22.
Comparison of self-absorption rate of zero-carbon photovoltaic power generation buildings in different seasons before and after renovation.
Figure 22.
Comparison of self-absorption rate of zero-carbon photovoltaic power generation buildings in different seasons before and after renovation.
Figure 23.
Comparison of self-absorption rate of PV power generation buildings in typical summer days before and after renovation.
Figure 23.
Comparison of self-absorption rate of PV power generation buildings in typical summer days before and after renovation.
Table 1.
Beijing time-sharing peak-valley electricity price table.
Table 1.
Beijing time-sharing peak-valley electricity price table.
| Time-of-use period |
Time |
Price(Yuan/kWh)
|
| Summer peak hours |
11:00-13:00, 16:00-17:00 |
1.32 |
| Peak hours |
10:00-11:00, 17:00-22:00 |
1.17 |
| Flat hours |
07:00-10:00, 13:00-16:00,22:00-23:00 |
0.85 |
| Valley hours |
23:00-07:00 |
0.56 |
Table 2.
Annual itemized electricity statistics of zero-carbon buildings before renovation.
Table 2.
Annual itemized electricity statistics of zero-carbon buildings before renovation.
| Category |
Data kWh/(㎡·a)
|
| HVAC Power consumption |
21.31 |
| Lighting Power consumption |
8.12 |
| Other Power consumption |
12.18 |
| PV Power generation |
41.93 |
| PV Power online sales |
7.89 |
Table 3.
Structure of building flexible load.
Table 3.
Structure of building flexible load.
| Flexible load type |
Typical equipment |
| Reducible load |
Lighting, some socket outlets to use electricity |
| Translational load |
Overall movement, non-deformation + unvariable + non-interruptible load: some socket equipment, printers, etc |
| Transferable load |
Deforming + Unvariable: battery, charging pile, energy storage tank; Deable + Variable: HVAC, heat pump system, air conditioning system |