
Submitted:
25 December 2024
Posted:
26 December 2024
You are already at the latest version
Abstract
A photovoltaic-thermal side-absorption concentrated module (PT-SACM) based on planar optics for photovoltaic-thermal hybrid applications is carried out. In order to reduce the absorption by materials and the axial-chromatic aberration caused by the transmissive optical system and to improve the performance of the entire system, the reflective-focusing mirror array fabricated by the ultra-precision diamond turning technology is proposed for the system herein. For the purposes of spectrum division, thinner volume, light weight, and wide acceptance angle, the proposed module is designed with a diffraction optical element (DOE), a light-guide plate with a micro-structure array, and a reflective-focusing mirror array. Among them, the DOE can separate the solar spectrum into the visible band, which is converted to electrical energy via photovoltaics, and the infrared band, whose thermal energy is collected. Experimental measurements show that the overall optical efficiency of the entire system can reach 46.63%, while an error of 4.5% is calculated based on the simulation. The system has successfully demonstrated the separation of visible and infrared bands of the solar spectrum. Meanwhile, the lateral displacement between the micro-structures of the light-guide plate and the focus of the reflective-focusing mirror array can be used to compensate for the angular deviation of the sun incidence, thereby achieving wide-angle acceptance via the proposed solar concentration system.
Keywords:
wide acceptance angle
; diffraction optical element
; planar light-guide array
1. Introduction
Since the industrial revolution, humans have used a large amount of petrochemical energy, which has caused the gradual deterioration of environmental ecology and global climate. Due to the accumulation of large amounts of greenhouse gases, the greenhouse effect has caused the global average temperature to rise gradually, threatening the human living environment. Therefore, researchers are doing their best to develop technologies for non-polluting renewable energy sources, such as solar, geothermal, wind, biomass, and tidal energy. Among them, solar energy has become the focus of public attention in recent years because of its inexhaustible energy, no geographical restrictions on use, and no secondary pollution in the energy conversion process.
Solar energy technologies contain diverse types, such as the technologies of solar thermal energy [1], photovoltaics [2,3], and solar lighting [4,5]. Among the photovoltaic technologies, the silicon cell is the most popular because of its cost-effective advantage. However, their conversion efficiency is insufficient (about 20%~25% [6]). Currently, the most efficient solar cell is the four-junction IIIV cells, whose conversion efficiency has reached 47.6% in the laboratory [7]. These highly efficient cells are high-cost and generally equipped with a light-condensing optical system, thereby reducing the number of high unit-price solar cells and the construction cost of the system. They are usually combined with a large-scale solar tracking system to form a concentrated photovoltaic system (CPV) so that the price and performance of the whole system are further acceptable and improved, respectively.
Solar cells can directly convert light energy into electrical energy and be assembled in modules, so they are regarded as one of the mainstream technologies in the future. However, whether the use of solar energy to generate electricity is focused on economic benefits or ecological environmental protection, further development should focus on improving the photoelectric conversion efficiency. Generally speaking, if the light energy of the sun shining on the wafer is not converted into electrical energy, most of it will be converted into thermal energy, resulting in the increasing temperature of the solar cell and the decreasing photoelectric conversion efficiency [8]. Some scholars use nanotechnology to capture photons to improve photoelectric conversion efficiency [9,10,11,12]. On the other hand, some studies use the remaining waste heat to produce hot water to achieve the purpose of heating, cooling [12,13], storing chemical energy [14,15], desalinating salt water [16], and solar hydrogen production [17]. Many recent studies have focused on developing thermoelectric materials and devices to generate electricity when the system temperature increases [18,19].
Although the CPV has the mentioned benefits, due to its large entrance pupil size, it can only be installed in widespread areas and is difficult to integrate with urban buildings. Also, the heavy and large-scale solar tracking system consumes a lot of electricity. In a traditional CPV, the solar cell is placed near the focus of the concentrating optics. It is bulky and too thick owing to the requirement of an appropriate focusing distance to collect solar light. In addition, most CPVs do not separate the infrared spectrum that produces thermal effects from the spectrum that illuminates the solar cells, causing the waste heat. Some scholars use natural airflow [20] to remove the heat on the solar cell or use multi-layer dielectric film technology to separate the visible and the infrared light. These approaches have achieved the desired effect of thermoelectric separation. However, the multi-layer dielectric film, which is challenging to prepare and coat, still needs more climate and ambient temperature vibration tolerance. Thus, its future development might be limited.
Another luminescent solar concentration system employs sunlight to excite a fluorescent flat plate [21]. After the fluorescent dye absorbs the solar energy, fluorescent light will be concentrated and transmitted to the side of the flat plate if it meets the criteria of total internal reflection (TIR). This system mainly converts part of the solar spectrum into visible light for indoor lighting. Although this system has the advantages of low cost and flexibility, part of the light that does not meet the criteria of TIR cannot propagate to the sides of the panel, resulting in low optical efficiency. In order to improve the problem of poor light-guide efficiency of fluorescent flat panels, some literature further published a wedge-shaped light-plate architecture [22]. Although the problem of transmission loss has been solved, as the length of the flat panel increases, the thickness of the flat panel also increases and becomes thicker.
It can be seen from the literature that planar side-concentrated photovoltaic systems [23,24] utilize spherical lens arrays to focus the sunlight and then use the light-guide plate to transmit the sunlight energy to the side of the light-guide plate [25]. They reduced the focusing area of sunlight and saved the cost of solar cells. Later, the same optical structure was used with a light-guide plate made of gradient refractive index to gradually guide sunlight to the sides of the light-guide plate, thereby improving the light-guide efficiency [26]. However, these optical systems only used a part of the light energy of the solar spectrum to generate electricity and did not separate the infrared band from the solar spectrum. Therefore, the solar cells should be heated by the energy from the infrared band, causing the increased temperature and the reduced photoelectric conversion efficiency. In addition, spherical lenses have aberrations such as axial chromatic aberration and spherical aberration, which obstruct the microstructure area on the lower surface of the light-guide plate to be appropriately reduced, thus affecting the light-guide efficiency of the light-guide plate.
Some other researchers used the compound parabolic concentrator (CPC) to increase the acceptance angle of the planar photovoltaic system [27]. Although this technology solves the problem of the oblique incidence, the thickness of the system increases as the light-collecting area increases. Another literature reported the light-collecting structure with a wedge-shaped light-guide plate and two upper and lower diffraction gratings [28]. Although this structure can effectively increase the acceptance angle and the absorption of solar energy, the light-receiving area and the thickness of the wedge-shaped light-guide plate gradually become thicker and heavier as the light-receiving area increases, which hinders the development and application of large-area photovoltaic systems. Another technique exploited a microlens array to collect solar energy and a plurality of light-guide columns to transfer the light at the focus of each microlens [29,30]. By controlling the movement of the light-guide columns, the acceptance angle has been improved [31,32,33]; however, the fabrication and precise assembly of the light-guide columns is the most critical for this system. Applying the concept of a fly's compound eye is another method combining microlenses and light guides to increase the acceptance angle of the CPV [34]. However, this optical structure remains conceptual due to the hardship of the manufacturing process.
To improve the performance of CPV and reduce the absorption by materials and the axial-chromatic aberration caused by the transmissive optical system [35], we propose a photovoltaic-thermal side-absorption concentrated module (PT-SACM) integrating with reflective-focusing mirror and diffraction optical elements (DOE) to separate the visible and infrared bands of sunlight with an acceptable acceptance angle. The separated bands are focused on the micro-structures of the light-guide plate and reflected to both sides of the light-guide plate, respectively. Finally, solar energy can be obtained by different devices attached to both sides of the light-guide plate. The surface of developed DOE herein comprises fine scratched structures, which not only separate the solar spectrum but also withstand climate variation and temperature change outdoors. In addition, the developed PT-SACM can be modulized by connecting light-guide plates to obtain a high concentration ratio and maintain the thinness of the entire system simultaneously.
2. Methods
2.1. System Configuration of photovoltaic-thermal side-absorption concentrated module
As shown in Figure 1, the proposed PT-SACM with micro-structures for spectrum division has three components. They are a spectrum-division optical element, a reflective-focusing mirror, and a light-guide plate. The spectrum-division optical element is a DOE that splits sunlight into two independent beams for photovoltaic and thermal applications. The reflective-focusing mirror focuses the light onto the corresponding microstructure on the first surface of the light-guide plate, making the visible and the infrared bands be transmitted towards different sides of the plate, respectively. The visible light can be absorbed by a solar cell attached to one side of the light-guide plate to generate electricity. The infrared light is transmitted to the opposite side of the light-guide plate and can be absorbed by the thermal device, such as a thermoelectric chip. Accordingly, the proposed module can generate electricity based on the absorption band of the solar cell and filter out the other band of sunlight for other applications.
In order to improve the performance of the whole system and eliminate the axial chromatic aberration of the refractive-focusing system, a reflective-focusing mirror can be used to reduce on-axis and off-axis dispersion effects. As shown in Figure 1, sunlight is incident on a high-dispersion DOE, diffracting the lightwaves with different wavelengths to different angular directions. Based on our design, the lightwave with a wavelength greater than 850 nm has the maximum diffraction efficiency in the zeroth diffraction order, and others have the maximum diffraction efficiency in the +1st diffraction order. According to the diffraction theory, the diffracted light of the zeroth and the +1st diffraction orders have corresponding diffraction angles and are separated. At this time, the diffracted light generated by the DOE will pass through the light-guide plate. The diffractive beams of the zeroth order and the +1st order are individually incident on the reflective-focusing mirror below the light-guide plate and then focused on the microstructure at the light-guide plate. Finally, sunlight in the infrared band with a wavelength greater than 850nm and sunlight in the visible band with a wavelength less than 850nm are respectively focused on the opposite sides of a V-groove microstructure at the first surface of the light-guide plate and then zig-zag propagate to the opposite sides of the light-guide plate.
As shown in Figure 2, the spectrum-division optical element herein is a diffraction grating. The division point between the infrared band of the zeroth diffraction order and the visible band of the +1st diffraction order is at the wavelength of 850 nm. Figure 2(a) shows the perspective and cross-sectional views of the diffraction grating. Figure 2(b) shows the spectrum distribution of the solar light, visible and infrared bands. It also depicts the spectral intensity distribution of the solar spectrum under the condition of AM1.5G. To maximize the grating efficiency within the whole solar spectrum, we optimized the blaze angle based on the rigorous coupled wave theory. The optimized blaze angle is 3.51º, equivalent to a grating height of 0.92 μm.
According to the relevant parameters of the above diffraction grating, commercial optical design software OSLO was used to design and analyze the overall system. The entrance pupil of a single unit of PT-SAM is 20 mm x 20 mm, the curvature radius of the reflective-focusing mirror is 50 mm, and the material of the light-guide plate is quartz glass. Figure 3(a) shows the ray-tracing results of the +1st order diffraction light of the visible band focusing on the upper side of the V-groove of the light-guide plate. Green, blue, and red lines are the rays in the wavelength of 400 nm, 550 nm, and 850 nm, respectively. Figure 3(b) shows the rays of the zeroth diffraction order of the infrared band, which are focused on the lower side of the V-groove. As shown in this figure, the focused spots of the +1st order diffracted beam move upward as the wavelength increases, and the focused position of the zeroth order diffracted beam is independent of the incident wavelength. The function of the V-groove microstructure is to reflect the diffraction light of visible and infrared bands toward the output ports of the light-guide plate. The first and second surfaces of the light-guide plate guide the rays to the output ports via the effect of total internal reflection (TIR).
In addition, the divergence angle of 0.267º (half angle) of sunlight must be considered for subsequent experiments. Figure 4 shows the simulation results considering the solar divergence angle of 0.267º (half-angle). Figure 4(a) shows that the spot focused by the +1st order diffractive beam also moves upward as the wavelength increases. The spot of a single wavelength focused onto the V-groove becomes larger than the original. As shown in Figure 4(b), although the focused spot of the zeroth order diffractive beam does not vary from the wavelength change, the focused spot also becomes larger due to the solar divergence angle. This phenomenon can be perceived by the image of the sun on the side of the V-groove.
2.2. Performance Evaluation
Among them, the diffraction optical element is a linear diffraction grating, and the diffraction efficiency can be defined as Eq. (1)-(3). Here, , defined as the proportion of visible light to the radiant flux in the visible light band of incident sunlight, is the optical efficiency of the visible band. is the optical efficiency of the infrared band and can be defined as the proportion of infrared light to the radiant flux in the infrared light band of incident sunlight. , defined as the proportion of visible and infrared light to the radiant flux of incident sunlight, is the total efficiency of the diffraction grating.
Here, indicates the diffraction efficiency of light as the function of wavelength passing through the diffraction grating. The superscript 0 and 1 represent the zeroth and the +1st diffraction orders, respectively. is the solar irradiance as a function of wavelength. The optical efficiency of diffraction grating coated with an anti-reflection (AR) layer reaches 64.70%, while the corresponding efficiencies for the visible and infrared spectra are 75.97% and 54.95%, respectively. Arraying the PT-SACM can increase the overall light concentration ratio without increasing the thickness of the optical system, thereby enlarging the light-collecting area and increasing the output energy of the system. However, arraying PT-SACM also needs to consider the structural optimization of the light-guide plate, and the thickness of the light-guide plate must be adjusted appropriately to match the solar cells.
After the relevant parameters of the reflective-focusing mirror and diffraction grating in the light-gathering optical system are determined, the software OSLO is used to calculate the +1st order diffractive beam of the visible light band and the zeroth order diffractive beam of the infrared band. Without considering the solar divergence angle, the focused spot in the infrared band is close to 3 μm. Due to the dispersion effect in the visible light band, the focused spot is approximately 327 μm in diameter. If the solar divergence, a half-angle of 0.267º, is considered, the focused spot will be slightly enlarged.
By adjusting the position of the V-groove on the first surface of the light-guide plate, the two sides of the V-groove can simultaneously cover the spots of the +1st diffraction order of the visible light and the zeroth diffraction order of the infrared band. The detailed parameters of the V-groove are shown in Table 2. Since an excessive number of arrays increases costs, and the efficiency of one unit is insufficient, a 15-unit PT-SACM is fabricated herein for demonstration.
In order to analyze the acceptance of the developed PT-SACM under the oblique incidence of sunlight, we utilized OSLO to model it. Unlike conventional CPVs equipped with trackers to adapt to the changes in the incident angle of sunlight, the proposed system maintains the optical performance by lateral movement of the light-guide plate relative to the reflective-focusing mirror. As shown in Figure 5, for different incident angles of sunlight, different distances of lateral movement of the light-guide plate are used to compensate for the angular deviation of solar incidence. According to the simulation results shown in Figure 5, the relationship between the incident angle of sunlight and the lateral movement of the light-guide plate is depicted in Figure 6, and the equation of the displacement curve is fitted as follows:
Here, x is the distance of lateral movement of the light-guide plate. is the changes in the incident angle of sunlight.
3. Experimental and Analytical Methods
The experimental equipment and procedures used in this research are described as follows. First, the fabricated optical components are tested individually to ensure the optical functions and qualities are consistent with the design values. Meanwhile, the surface quality of each component is inspected using a surface profile meter, while the optical properties of the component materials can be measured using a spectrum analyzer. The optical performance of overall PT-SACM after assembly is then verified. The assembled array PT-SACM is inspected by an integrating sphere, optical power meter, and spectrum analyzer to count the system efficiency of the overall optical system.
In order to make the developed diffraction grating suitable for large-area solar concentration systems, the designed diffraction grating is made using the industry's micro-structure imprinting technology. Figure 7(a) shows the completed diffraction grating film. Figure 7(b) shows the surface profile of the used diffraction grating film. The average grating period of the grating film is 15 μm, the average height of the grating profile is 1μm, the measured blaze angle of the diffraction grating is 3.81º, and the blaze angle error is 3.6%.
This research developed a solar thermoelectric division optical system with an array of 15 units, as shown in Figure 8. Figure 9 shows the light emission situation of the light-guide plate of the PT-SACM for the visible light band after the precise alignment of the light-guide plate array and the reflective-focusing mirror array. The preliminary inspection shows that the solar light collection device has a strong light collection effect. As shown in Figure 10, the divergence angles of the visible light are ±10 º and ±40º in the orthogonal direction of the light-guide plate outlet.
The experimental condition of the developed PT-SACM array is under outdoor sunlight, which is the object of light concentration and spectrum division. Therefore, the experimental light source is outdoor sunlight. First, a sun tracking system is used to keep the incident sunlight vertically incident on the developed PT-SACM. The irradiance of the sun at that time was measured by using an optical power meter to be 62.1 mW/cm2, and the irradiance of the visible and infrared light bands were measured to be 3.78 mW/cm2 and 2.56 mW/cm2, respectively. The sensing radius of the optical power meter is a circular sensing surface of 6 mm. The detection efficiency can be converted using the following formula,
Here, is the total radiant flux of incident sunlight. is the light-collecting area of a single reflective-focusing mirror, and Es is the unit irradiance measured by the optical power meter. Since the solar irradiance measured by the optical power meter is 62.1 mW/cm2, the total solar radiation flux of the entire system is calculated to be 3726.0 mW.
The spectrum inspection results of the visible and infrared bands of the solar concentration system are shown in Figure 11 and Figure 12. The visible band spectrometer used in the experiment can measure the range from 350nm to 1020nm, while the infrared band spectrometer can measure the range of 950 nm to 1700 nm. Therefore, in order to present the light collection spectrum of the optical system in the visible and infrared band range from 380 nm to 1700 nm, it is necessary to use a visible light spectrometer and an infrared spectrometer to measure the overall optical spectrum at each outlet of the light-guide plate. The blue and red curves in Figure 11 and Figure 12 are the measured results of the visible and infrared spectrometers, respectively.
According to the experimental measurement results, it can be seen that the solar spectrum at the visible light outlet end of the light-guide plate contains most of the visible light energy and a small amount of infrared light energy. Meanwhile, the solar spectrum at the infrared light outlet side contains the most infrared energy and a small amount of visible energy. Therefore, if the two outlet ends of the PT-SACM array are not limited to visible or infrared energy, all solar energy can be used, and energy waste can be reduced. For example, for the visible light outlet end, the usable spectrum width of the +1st order diffracted light can be extended to the wavelength of 1.1μm because the spectrum range is still within the absorption band of many solar cell wafers [36].
In the infrared light outlet side of the PT-SACM array, the spectrum range of the zeroth-order diffracted light also includes the visible light band. Although the visible light band energy is not as significant as that of pure infrared light band energy in the practical application of thermal energy, it is still a small supplement. If the developed solar spectrum division and concentrating optical system considers both visible light energy and infrared light energy, the overall efficiency of the optical system can be improved. Therefore, this paper further calculates the entire system efficiency under the quantifiable visible light energy and infrared light energy at the same time, as shown in Table 3, and further defines the calculation parameters of the efficiency as (6)-(9),
Here, means taking into account the total diffraction efficiency of the +1st order and zeroth order diffracted beams in the whole spectrum. indicates the total optical efficiency of the full-band system considering the visible and infrared outlet surface of the light-guide plate.
4. Discussion
The thickness and width of the fabricated light-guide plate are 5.0 mm and 22.0 mm, respectively. The light-guide plate is divided into several parts, fabricated separately and glued to each other, followed by leveling and polishing. As a result, the thickness and width of the light-guide plate are slightly smaller than the optimized values by the simulation calculation. The opening size of the integrating sphere used in the measurement process is formulated based on the simulation calculation parameters, so the area of the opening size will be larger than the area of the actual outlet surface of the light-guide plate. In the actual measurement, it is easy for stray light from the environment to penetrate the integrating sphere during measurement. In addition, ambient light will be incident from the other side of the light-guide plate. Considering those factors that influence the measurement process, the system efficiency is recalculated, as shown in item (1) of Table 3. When the number of arrays is increased to 15 units, the total optical efficiency will be reduced to 55.57% due to the V-groove reflection loss caused by arraying, as shown in item (2) of Table 3. For the simulated calculation of solar concentration efficiency of the PT-SACM array, the reflectivity of the V-groove reflective film on the light-guide plate is usually assumed to be 100%. Although the silver reflective film has a high reflectivity in the visible light band, the reflectivity in the infrared band is not ideal. Therefore, this research decided to use an aluminum reflective film with better performance in both visible and infrared bands as the reflective coating material for the V-groove. In order to reduce the error between simulation calculation and actual measurement, the reflectivity of the aluminum film is substituted for further simulation calculations, and the calculated overall optical performance is summarized in item (3) of Table 3. In addition, the reflectance of the diffuse reflection material (barium sulfate) coated on the integrating sphere for the energy inspection of visible and infrared bands will also affect the actual measurement results. When calculating the overall efficiency of the PT-SACM array, this effect is included in the system efficiency evaluation, as shown in item (4) of Table 3. The initial design of this research only considers the diffraction light energy of the +1st and zeroth orders. Although the diffraction energy of other diffraction orders is very low, it may still be reflected to both sides of the light-guide plate through the V-groove structure, causing errors between simulation calculations and experimental results. So, it is necessary to calculate the impact of other diffraction orders (+2nd order and -1st order) on the overall optical efficiency and compare them. The results are shown in the item (5) of Table 3. As shown in Figure 10 and Figure 11, in the infrared light outlet side of PT-SACM, the spectrum range of the zeroth-order diffracted light also includes the visible light band. Therefore, this paper further calculates the overall system efficiency under the quantifiable visible and infrared energy simultaneously, as shown in item (5) of Table 3. It can be seen from the table that the spectrum division efficiency of the outlet side of the light-guide plate in the visible light band increases from 49.64% to 50.82%, while the spectrum division efficiency of the outlet side in the infrared band increases from 27.36% to 28.41%. It can be seen that the +2nd order and -1st order diffracted energy in the visible band and infrared band are also reflected to the light-emitting surfaces on both sides of the light-guide plate through the V-groove—the reason for the increase in spectrum division efficiency and total optical efficiency.
In order to test the impact of arraying on the overall system efficiency, the PT-SACM array developed in this paper was designed in a 15 x 1 array type to confirm the improvement of arraying on the total optical efficiency of the entire system. Based on the measurement results, the array-type PT-SACM has a spectrum division efficiency of 49.31% and 27.06% for the visible and infrared bands. The total optical efficiency can reach 38.32%, and the error comparison with the simulation calculation results is 2.9%, 4.7%, and 3.5%. When only the preset spectral bands of the visible light and infrared light emission surfaces are considered, the total optical efficiency is only 38.64%, and the deviation to the simulation calculation is only 0.83%. By exploring the influence of ambient stray light and other diffraction orders of the diffraction grating, we can further understand the sources of errors in simulation calculations and experimental measurements.
4. Conclusions
This paper proposes to use reflective-focusing mirror arrays, diffraction gratings with high focusing and spectrum division functions, and light-guide plates to form a diffraction array-type PT-SACM, which is different from the conventional solar energy concentration systems. The developed PT-SACM array comprises reflective high-concentration optical elements, a diffraction grating, and a light-guide plate. By optimizing the structure of the diffraction grating, the +1st order diffracted light and the zeroth order diffracted light, respectively, correspond to the visible light band (380nm~780nm) and infrared light band (780nm~2520nm) have high diffraction efficiency, and then use the V-groove structure inside the light-guide plate to respectively transmit the visible light band and infrared light band reflection to the corresponding side of the light-guide plate. This design successfully separates the solar energy of different spectrums so that it can be guided to appropriate devices for utilization, thus forming a hybrid solar system, which is expected to successfully improve the utilization efficiency of solar energy.
In terms of simulation calculations, this research uses optical design software, optical analysis software, and grating analysis software to optimize the parameters of the diffraction element and calculate the diffraction efficiency of the +1st and zeroth orders. The surface structure of the diffraction element is obtained after optimizing the diffraction efficiency of each diffraction order. Then, the diffraction efficiency of the diffraction element is substituted into the optical analysis software to calculate the optical efficiency of the array system, thereby optimizing the V-groove parameters required inside the light-guide plate.
After the experimental measurement, the measured total optical efficiency of the solar concentrator system was 38.32%, and the error compared with the simulation calculation was 0.83%. When the actual output light energy at both ends of the light-guide plate is considered (not only the designed spectral band), the total optical efficiency of the PT-SACM array is 39.73%, and the error compared with the simulation is 3.5%. Finally, the simulation calculation is performed for error analysis with measured efficiency. By analyzing the stray light in the measurement environment and the diffraction light of other diffraction orders of the diffraction grating, the cause of the error is analyzed.
Author Contributions
Conceptualization, J.-R.S.; formal analysis, J.-R.S.; funding acquisition, J.-R.S.; investigation, J.-R.S.; methodology, J.-R.S.; project administration, J.-R.S.; resources, A.-C.W.; software, J.-R.S.; supervision, J.-R.S.; validation,A.-C.W.; writing—original draft,J.-R.S.; writing—review and editing, A.-C.W. All authors have read and agreed to the published version of the manuscript.
Funding
This research was funded by the National Science and Technology Council, Taiwan, R.O.C., grant number NSTC 113-2221-E-492-005, NSTC 113-2622-E-492 -012 and MOST 107-2221-E-492 -026 -MY3
Acknowledgments
The authors thank Wei-Jie Chang, Department of Mechanical Engineering, National Central University, Taiwan, R.O.C., for the technical support on the measurements.
Conflicts of Interest
The authors declare no conflict of interest.
References
- Iodice, P.; Amoresano, A.; Langella, G.; Marra, F.S. Energy Advantages and Thermodynamic Performance of Scheffler Receivers as Thermal Sources for Solar Thermal Power Generation. Energies. 2024, 17, 5393. [Google Scholar] [CrossRef]
- Kunatsa, T.; Myburgh, H.C.; De Freitas, A. Efficient Charging Prioritisation and Optimisation of Solar PV-Powered Portable Electronic Devices. Energies 2024, 17, 6039. [Google Scholar] [CrossRef]
- Machado, E.P.; Pinto, A.C.; Ramos, R.P.; Prates, R.M.; Sá, J.d.S.; de Lima, J.I., Jr.; Costa, F.B.; Fernandes, D., Jr.; Pereira, A.C. Modeling, Control and Validation of a Three-Phase Single-Stage Photovoltaic System. Energies 2024, 17, 5953. [Google Scholar] [CrossRef]
- Tsai, M.; Whang, J.W.; Lee, T.X. Design of a High-efficiency Collection Structure for Daylight Illumination Applications. Appl. Opt. 2013, 52, 8789–8794. [Google Scholar] [CrossRef] [PubMed]
- Blakers, A.; Zina, N.; McIntosh, K.R.; Fong, K. High Efficiency Silicon Solar Cells. Energy Procedia. 2013, 33, 1–10. [Google Scholar] [CrossRef]
- Ali, M.; Maiyalagan, T.; Lee, K.H.; Choi, I.; Ko, M.J. Utilizing Molecular States of Carbon Quantum dots (CQDs) to Efficiently Harvest Outdoor and Indoor Energy via Luminescent Solar Concentrator, Surfaces and Interfaces. 2024, 52, 104953.
- National Renewable Energy Laboratory. Best Research-Cell Efficiency Chart. Rev, 2024.
- Singh, P.; Ravindra, N.M. Temperature Dependence of Solar Cell Performance—an analysis. Solar Energy Materials and Solar Cells. 2012, 101, 36–45. [Google Scholar] [CrossRef]
- Ishii, S.; Sugavaneshwar, R.P.; Nagao, T. Titanium Nitride Nanoparticles as Plasmonic Solar-Heat Transducers. J. Phys. Chem. C. 2016, 120, 2343–2348. [Google Scholar] [CrossRef]
- Kumar, M.; Umezawa, N.; Ishii, S.; Nagao, T. Examining the Performance of Refractory Conductive Ceramics as Plasmonic Materials: A Theoretical Approach. ACS Photonics 2016, 3, 43–50. [Google Scholar] [CrossRef]
- Oberlehner, G.K.; Bardosova, M.; Pemble, M.; Richards, B.S. Planar Photonic Solar Concentrators for Building-Integrated Photovoltaics. Solar Energy Materials & Solar Cells 2012, 104, 53–57. [Google Scholar]
- Toroxel, J.L.; Silva, S.M. A Review of Passive Solar Heating and Cooling Technologies Based on Bioclimatic and Vernacular Architecture. Energies 2024, 17, 1006. [Google Scholar] [CrossRef]
- Chu, S.; Zhang, H.; Chen, H. Performance Analysis and Optimization of a Combined Cooling, Heating and Power System Based on Active Regulation of Thermal Energy Storage. Energy. 2024, 312, 133694. [Google Scholar] [CrossRef]
- Byeon, J.; Park, H.; Ko, W. Comparative Analysis of Electrostatic Charging Characteristics Considering the Flow Conditions of Nonconductive Flammable Liquids. Energies 2024, 17, 5987. [Google Scholar] [CrossRef]
- Kodama, T.; Gokon, N.; Yamamoto, R. Thermochemical Two-Step Water Splitting by ZrO2-Supported NixFe3-xO4 for Solar Hydrogen Production. Solar Energy 2008, 82, 73–79. [Google Scholar] [CrossRef]
- Quispe Cohaila, A.B.; Sacari Sacari, E.J.; Lanchipa Ramos, W.O.; Canahua Loza, H.B.; Tamayo Calderón, R.M.; Medina Salas, J.P.; Gamarra Gómez, F.; Mangalaraja, R.V.; Rajendran, S. Improving Photocatalytic Hydrogen Production with Sol–Gel Prepared NiTiO₃/TiO₂ Composite. Energies 2024, 17, 5830. [Google Scholar] [CrossRef]
- Abhat. Low Temperature Latent Heat Thermal Energy Storage: Heat Storage Materials. Solar Energy 1983, 10, 313–332. [Google Scholar]
- Hoshia, Millsb, D. R.; Bittarb, A.; Saitohc, T.S. Screening of High Melting Point Phase Change Materials (PCM) in Solar Thermal Concentrating Technology based on CLFR. Solar Energy 2005, 79, 332–339. [Google Scholar] [CrossRef]
- Tonui, J.K.; Tripanagnostopoulos, Y. Performance Improvement of PV/T Solar Collectors with Natural Air Flow Operation. Solar Energy 2008, 82, 1–12. [Google Scholar] [CrossRef]
- Earp, A.; Smith, G.B.; Swift, P.D.; Franklin, J. Maximising the Light Output of a Luminescent Solar Concentrator. Solar Energy 2004, 76, 655–667. [Google Scholar] [CrossRef]
- Hughes, M.D.; Maher, C.; Borca-Tasciuc, D.; Polanco, D.; Kaminski, D. Performance Comparison of Wedge-Shaped and Planar Luminescent Solar Concentrators. Renewable Energy 2013, 52, 266–272. [Google Scholar] [CrossRef]
- Karp, J.H.; Tremblay, E.J.; Ford, J.E. Planar Micro-Optic Solar Concentrator. Opt. Express 2010, 18, 1122–1133. [Google Scholar] [CrossRef]
- P. Xie, H. Lin, Y. Liu, and B. Li," Total internal reflection-based planar waveguide solar concentrator with symmetric air prisms as couplers. Opt. Express 2014, 22, A1389–A1398. [Google Scholar] [CrossRef]
- J. H. Karp, E.J. Tremblay, J.M. Hallas, and J. E. Ford, “Orthogonal and secondary concentration in planar micro-optic solar collectors. Opt. Express. 2011, 19, 685. [Google Scholar]
- S. Bouchard and S. Thibault,"Graded-index planar waveguide solar concentrator. Opt. Lett. 2014, 39, 1197–1200. [Google Scholar] [CrossRef]
- R. Winston, J.M. Gordon,"Planar concentrators near the étendue limit," Opt. Lett. 2005, 30, 2617–2619.
- T. Waritanant, S. Boonruang and Te-Yuan Chung, “High angular tolerance thin profile solar concentrators designed using a wedge prism and diffraction grating. Solar Energy. 2013, 87, 35–41. [Google Scholar] [CrossRef]
- Al-Hamdani, A.H. , Hasan, A.B., Al-hamdani, H.A. et al. Solar energy collector utilizing micro-lens array technology coupled with V-shaped mirror prisms as a light guide interface. J. Opt. 2024. [Google Scholar]
- Alsaigh, R.E. , Bauer, R. & Lavery, M.P.J. Multi-element lenslet array for efficient solar collection at extreme angles of incidence. Sci. Rep. 2020, 10, 8741. [Google Scholar]
- Liu, Y.; Huang, R.; Madsen, C.K. Two-axis tracking using translation stages for a lens-to-channel waveguide solar concentrator. Opt. Express 2014, 22(S6), 1567. [Google Scholar] [CrossRef] [PubMed]
- Liu, Y.; Huang, R.; Madsen, C.K. Design of a lens-to-channel waveguide system as a solar concentrator structure. Opt. Express 2014, 22(S2), A198. [Google Scholar] [CrossRef] [PubMed]
- Selimoglu, O.; Turan, R. Exploration of the Horizontally Staggered Light Guides for High Concentration CPV Applications, Opt. Express 2014, 20, 19137. [Google Scholar] [CrossRef]
- Dhakal, R.; Lee, J.; Kim, J. Bio-inspired thin and flat solar concentrator for efficient, wide acceptance angle light collection. Appl. Opt. 2014, 53, 306. [Google Scholar] [CrossRef]
- Wei, A.C.; Chang, W.J.; Sze, J.R. A Side-Absorption Concentrated Module with a Diffractive Optical Element as a Spectral-Beam-Splitter for a Hybrid-Collecting Solar System. Energies 2020, 13, 192. [Google Scholar] [CrossRef]
- Haase, F.; Hollemann, C.; Schaefer, S.; Merkle, A.; Rienaecker, M.; Krügener, J.; Brendel, R.; Peibst, R. Laser contact openings for local poly-Si-metal contacts enabling 26.1%-efficiency POLO-IBC solar cells. Sol. Energy Mater. Sol. Cells 2018, 186, 184–193. [Google Scholar] [CrossRef]
Figure 1.
Schematic of photovoltaic-thermal side-absorption concentrated module (PT-SACM).
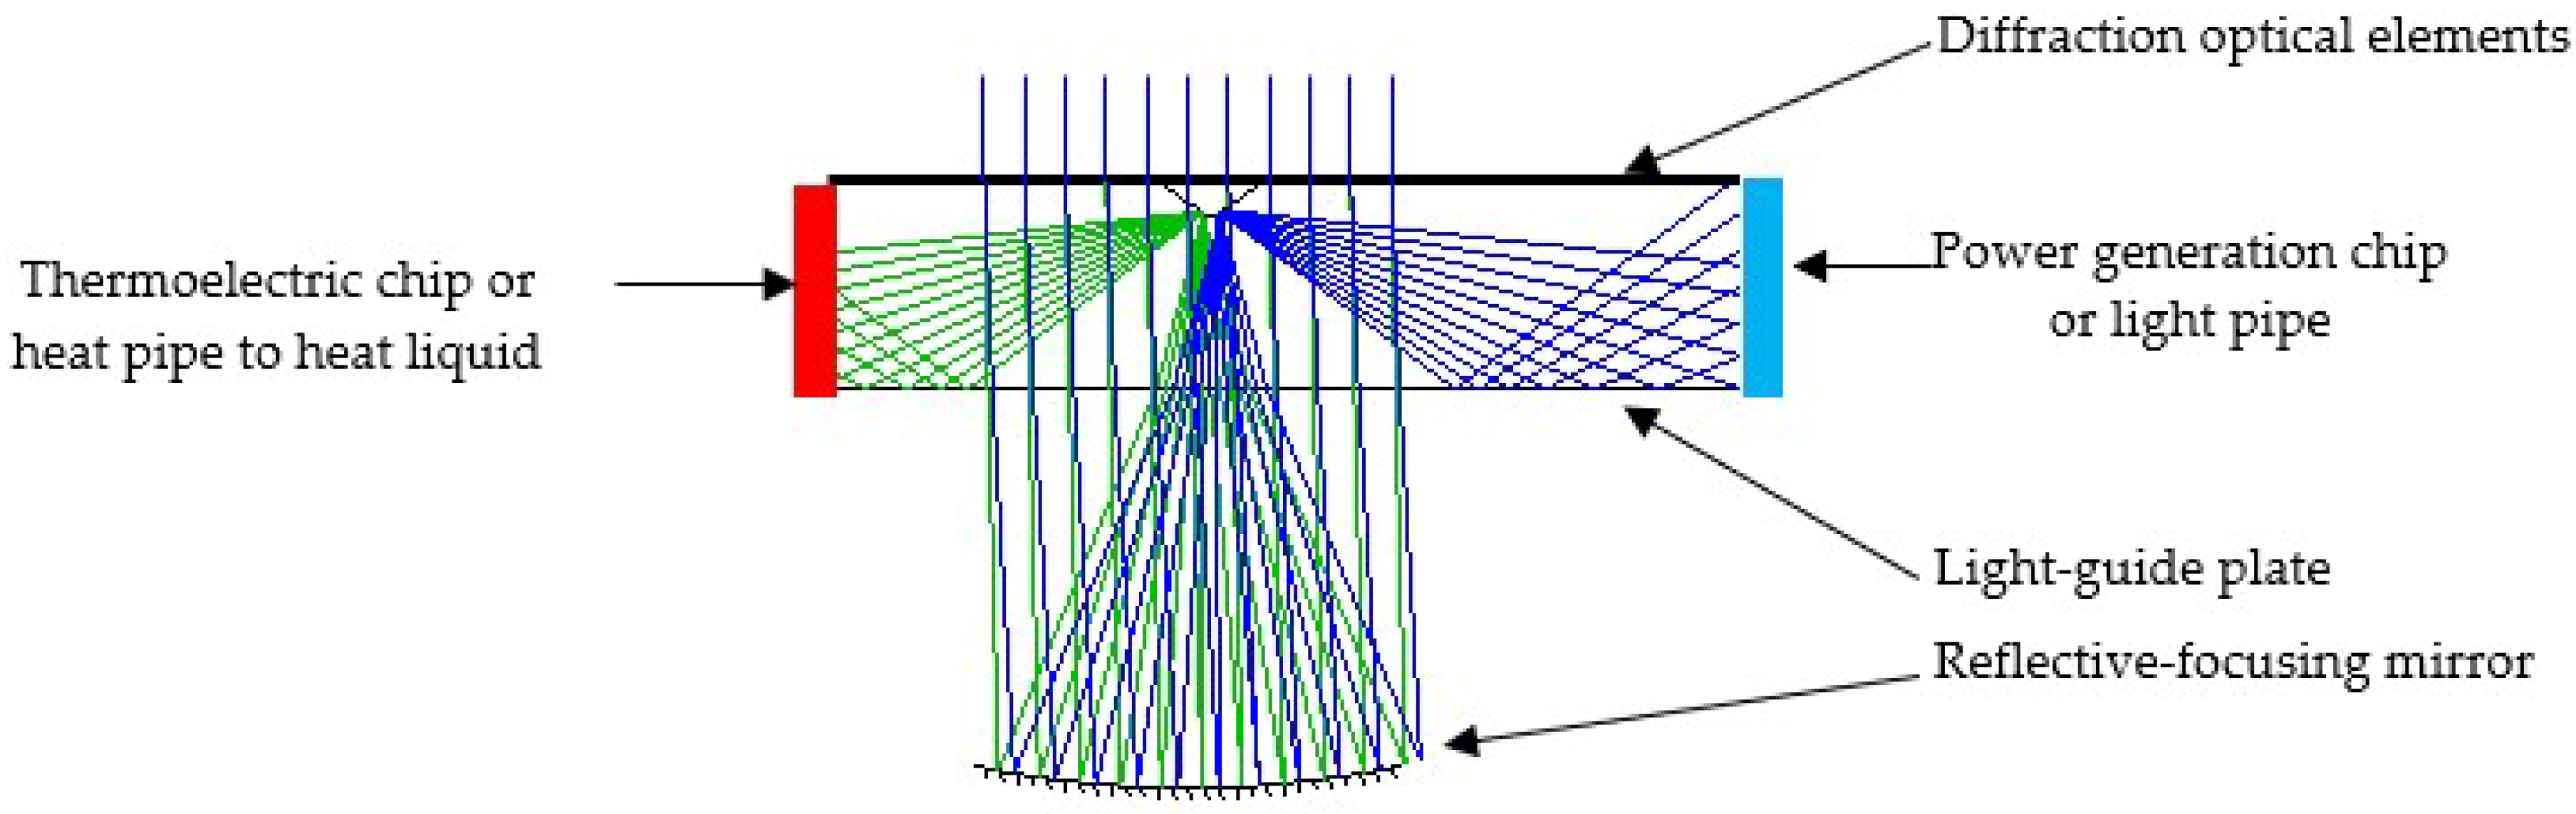
Figure 2.
Optimized design results of diffraction grating. (a) Perspective and cross-sectional views. (b) Spectrum distribution of visible and infrared bands.
Figure 2.
Optimized design results of diffraction grating. (a) Perspective and cross-sectional views. (b) Spectrum distribution of visible and infrared bands.
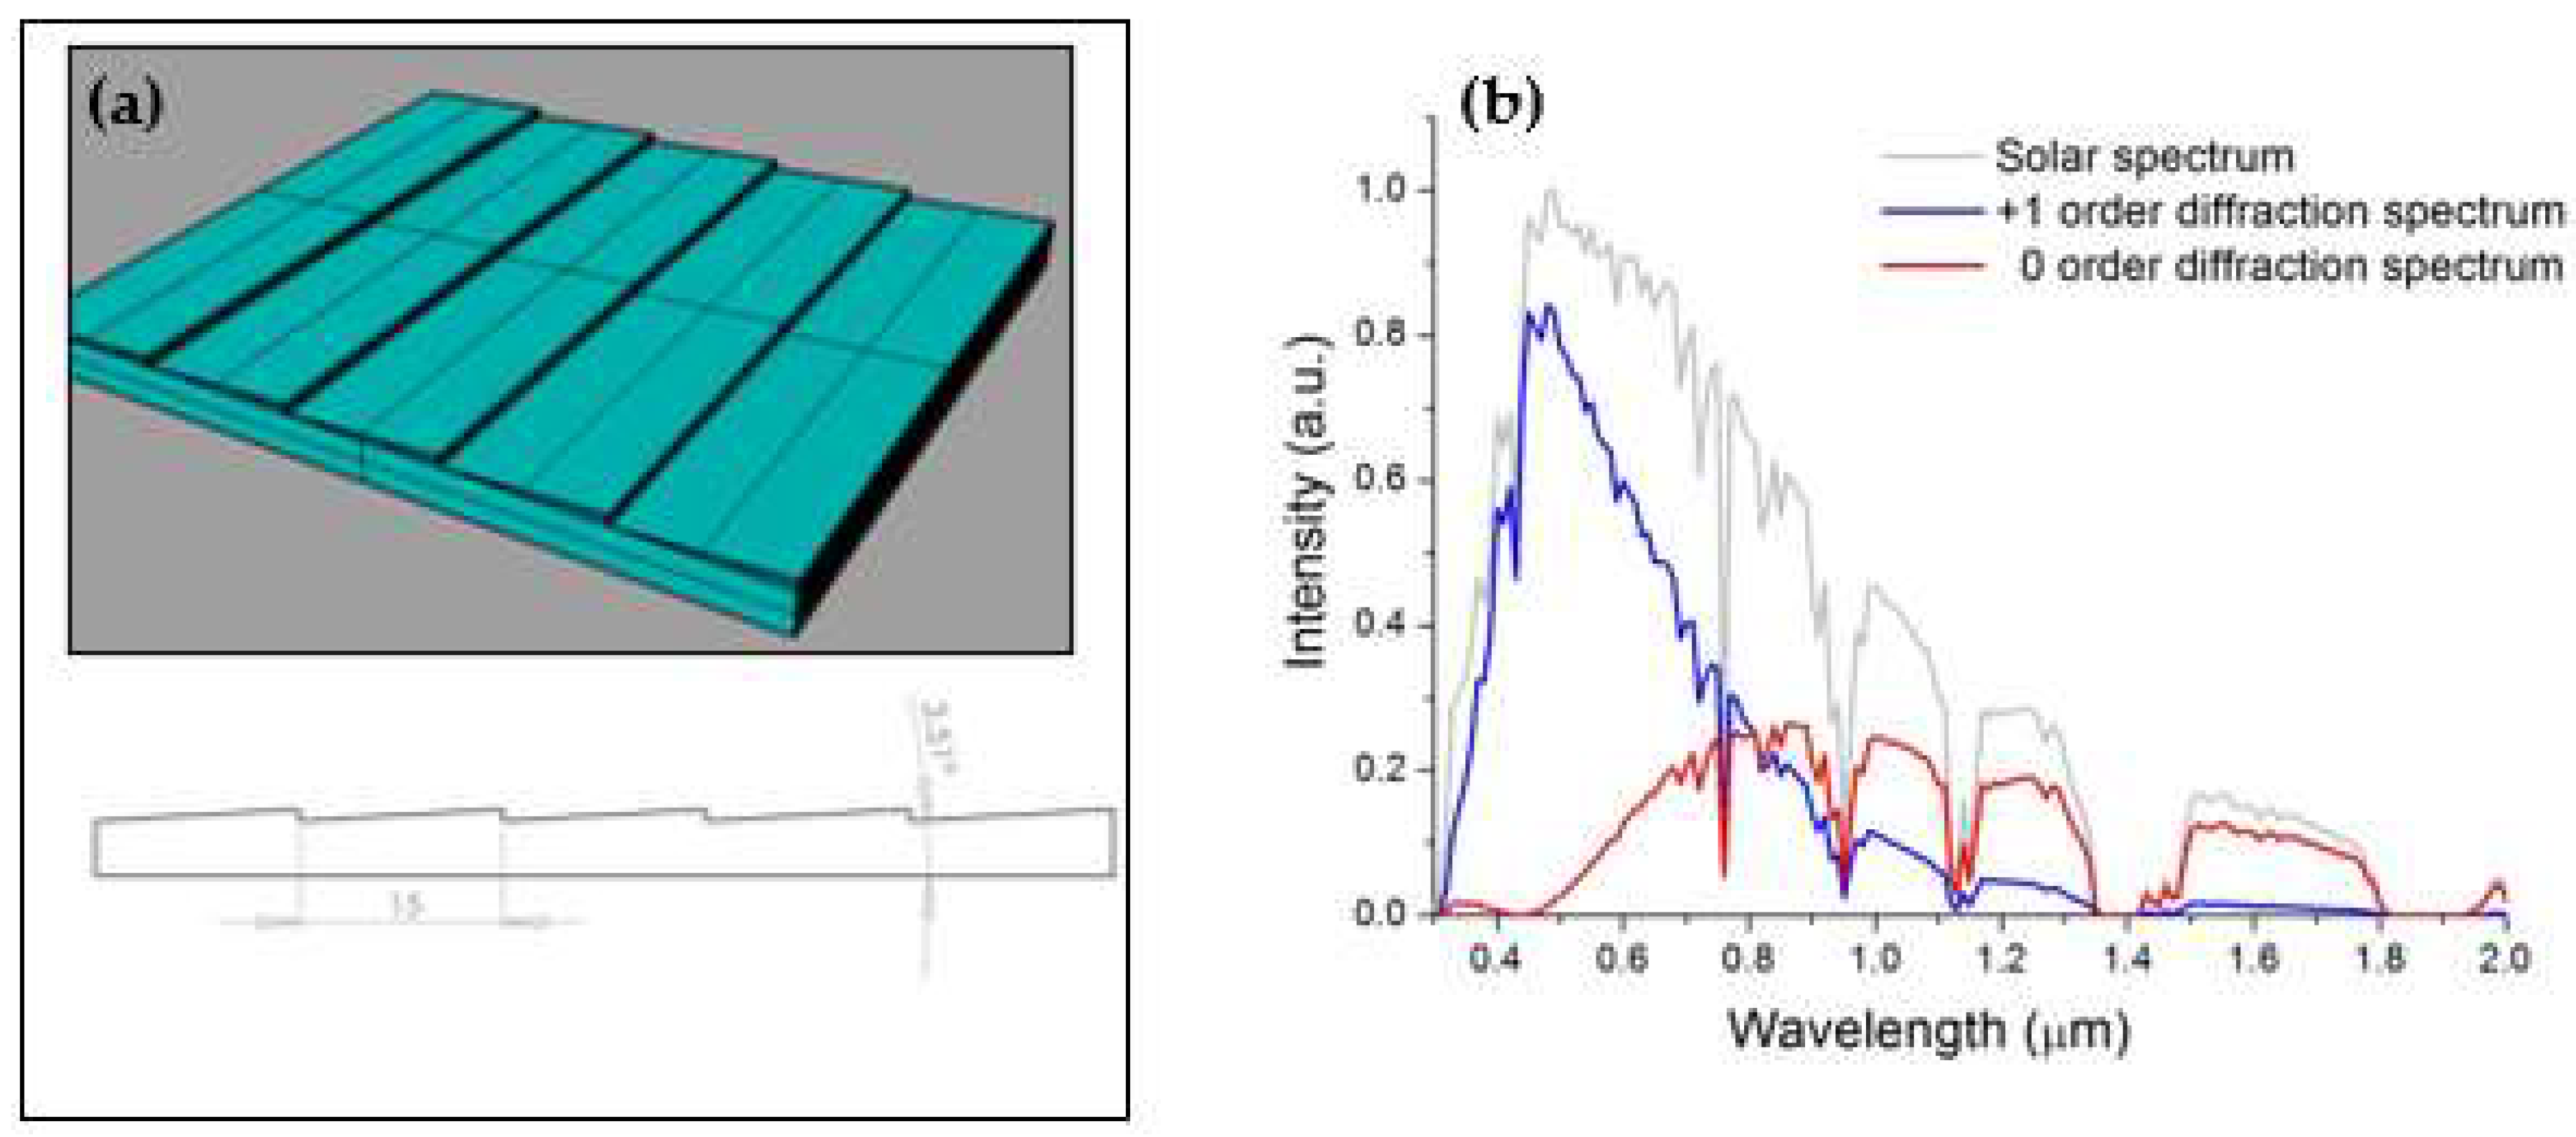
Figure 3.
(a) The condensing visible beams of the +1 diffraction order are reflected from the top side of the V-groove structure. The green, blue, and red lines denote the rays in the wavelength of 400 nm, 550 nm, and 850 nm, respectively. (b) The condensing infrared beams of the zeroth order are reflected from the bottom side of the V-groove structure.
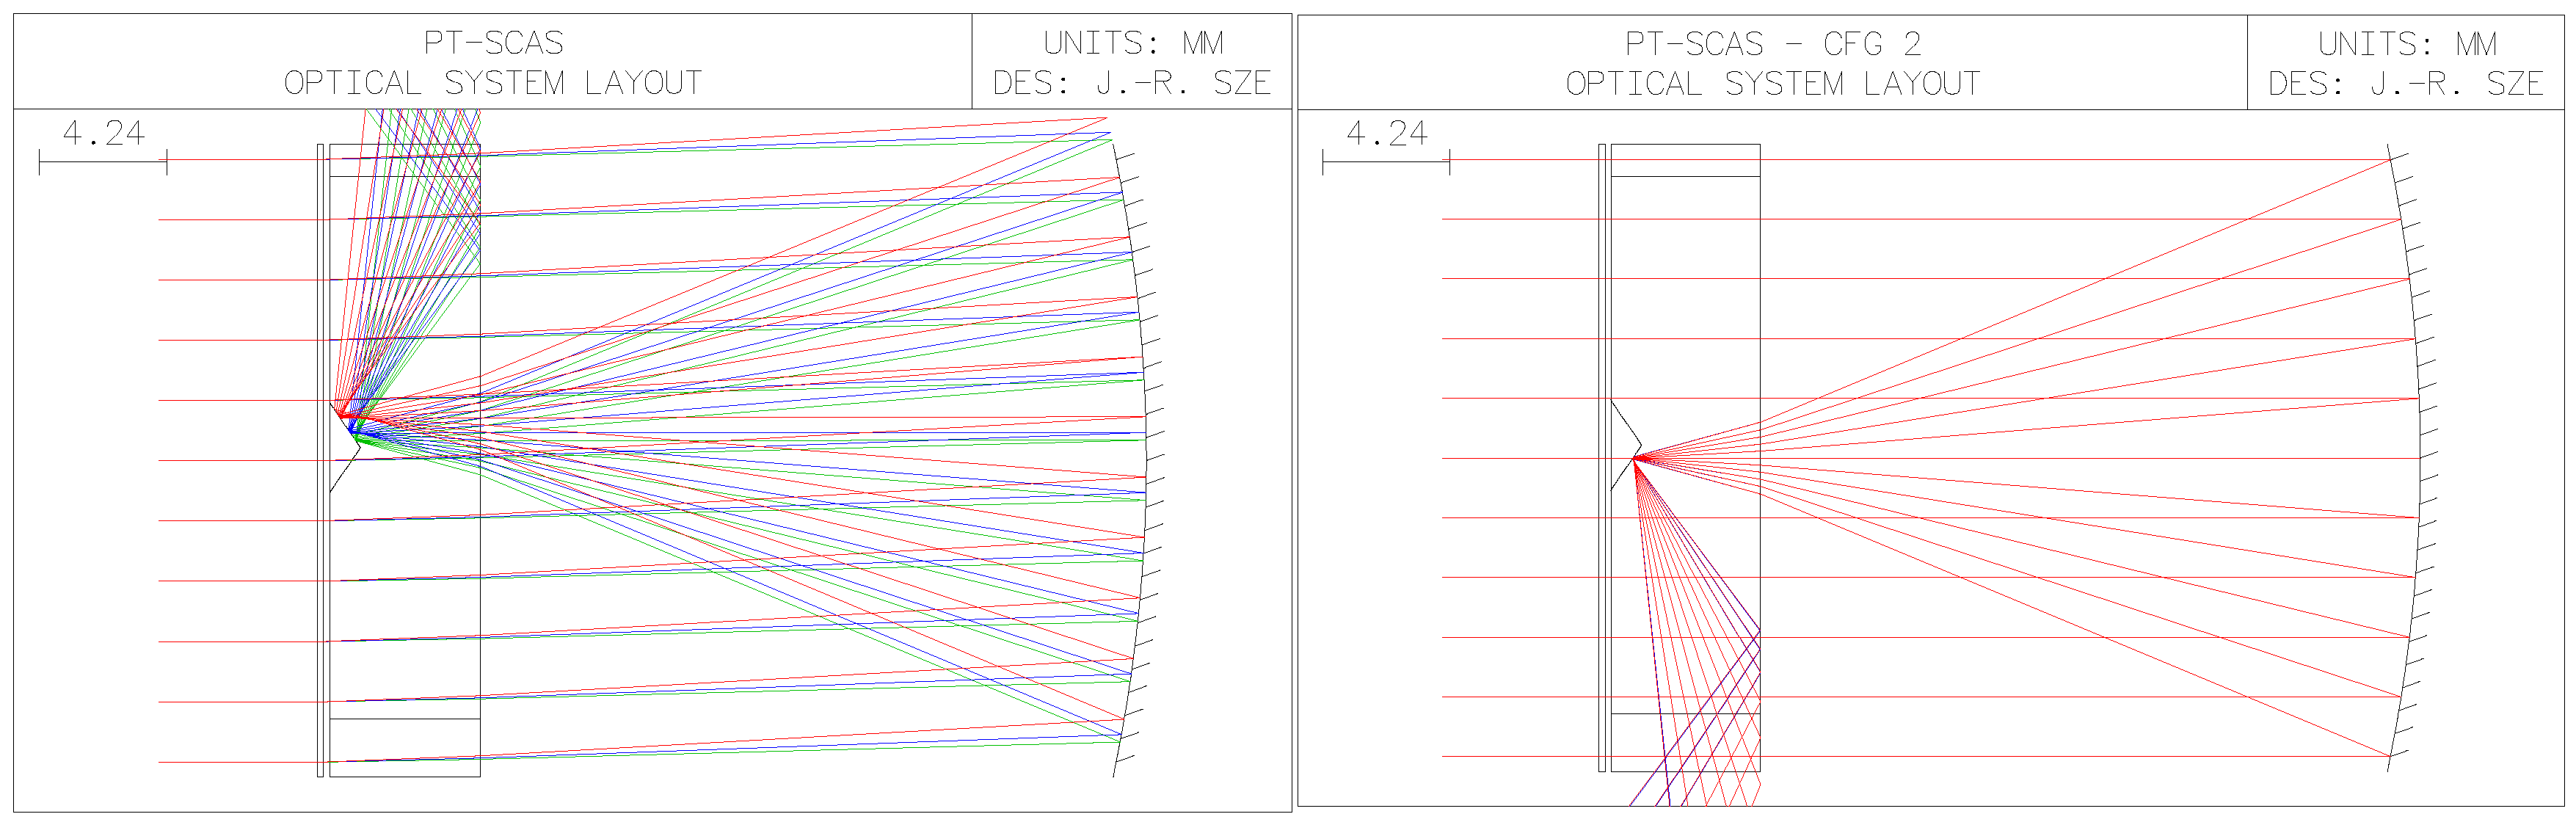
Figure 4.
Calculation results by considering the solar divergence angle of 0.267º (half-angle). (a) The focal visible beams of the +1st diffraction order are reflected from the top side of the V-groove structure. The blue, black, and green lines are denoted as the wavelength of 400 nm, 550 nm, and 850 nm, respectively. (b) The focal infrared beams of the zeroth diffraction order are reflected from the bottom side of the V-groove structure. The red and magenta lines are denoted as the wavelength of 380 nm and 2520 nm, respectively.
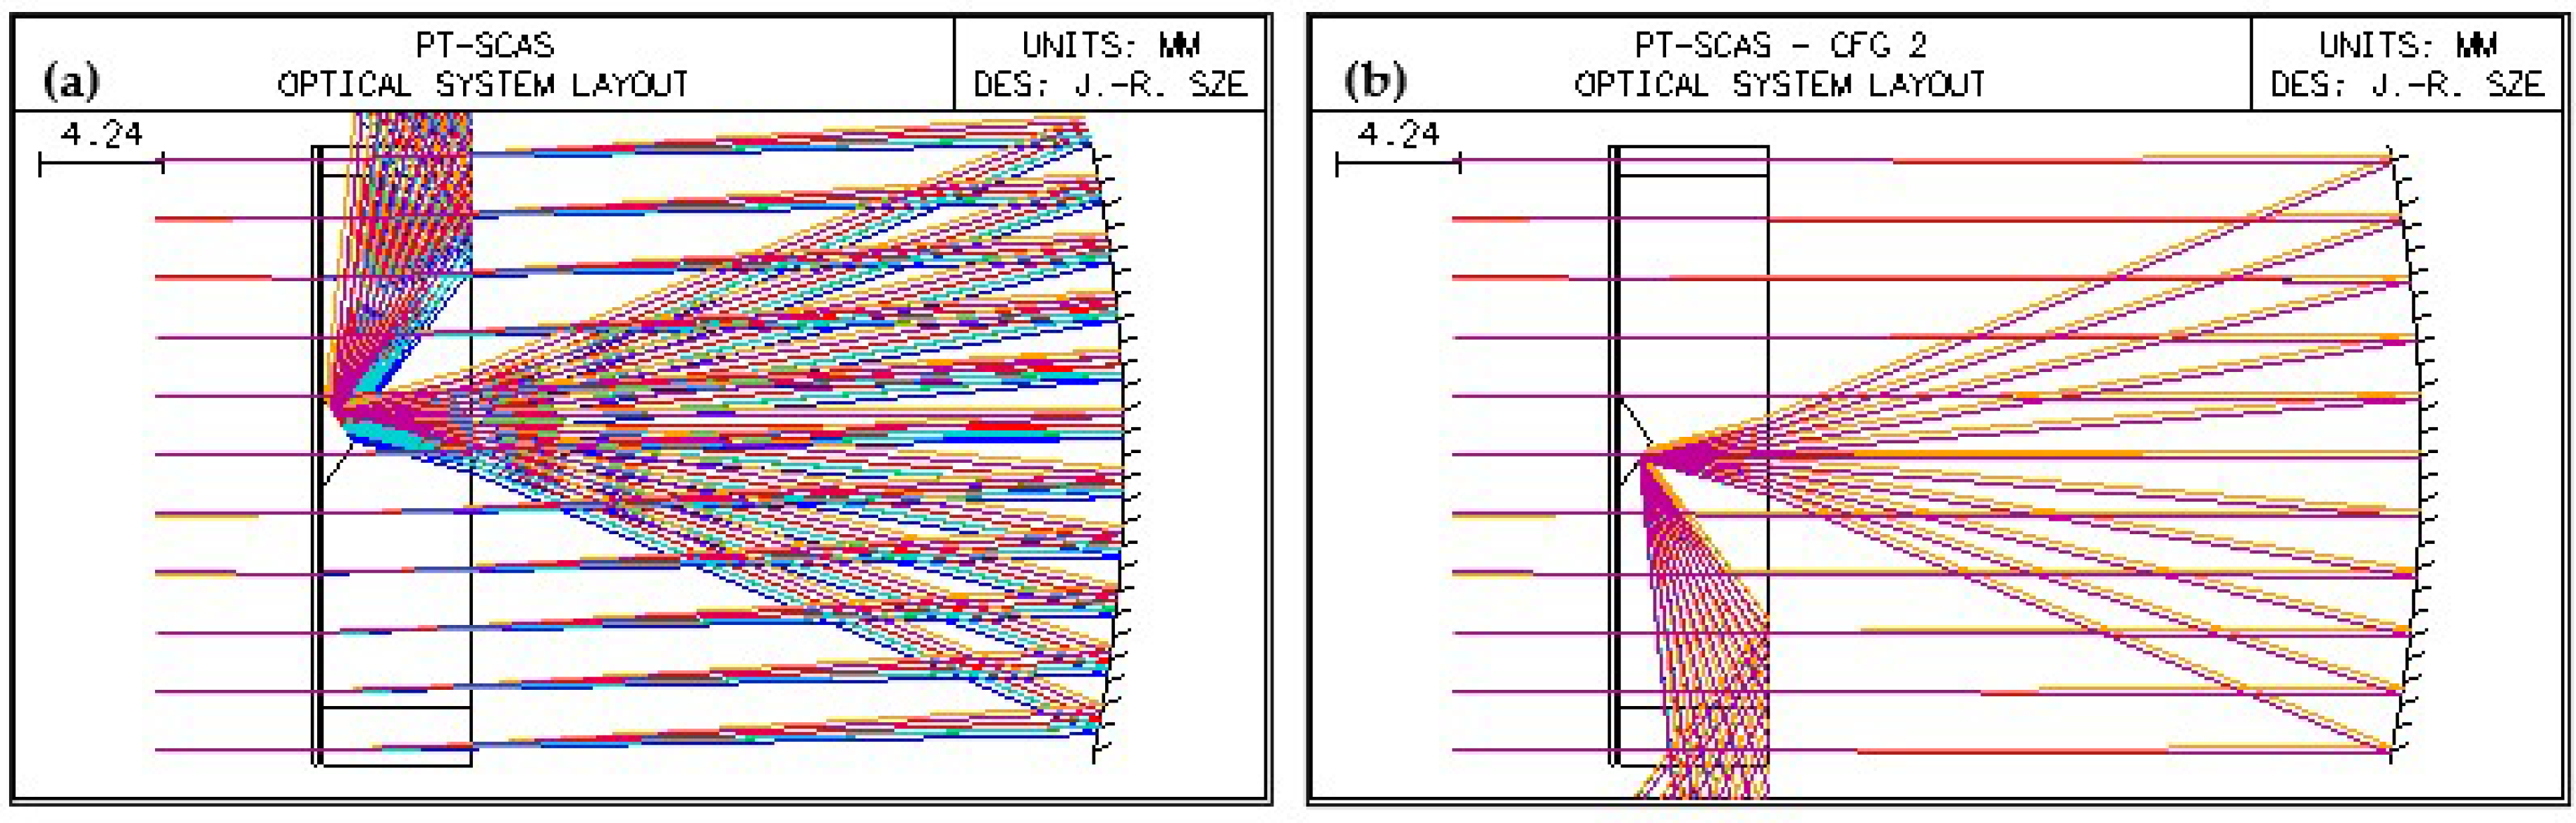
Figure 5.
The ray tracing results and the corresponding lateral movement of the light-guide plate and the reflective-focusing mirror are illustrated for the varied incident angle of sunlight (0 ~ 10º). It shows that such lateral relative movement can compensate for the angular deviation of solar incidence. The upper and bottom subplots of each figure are for the visible and infrared bands, respectively.
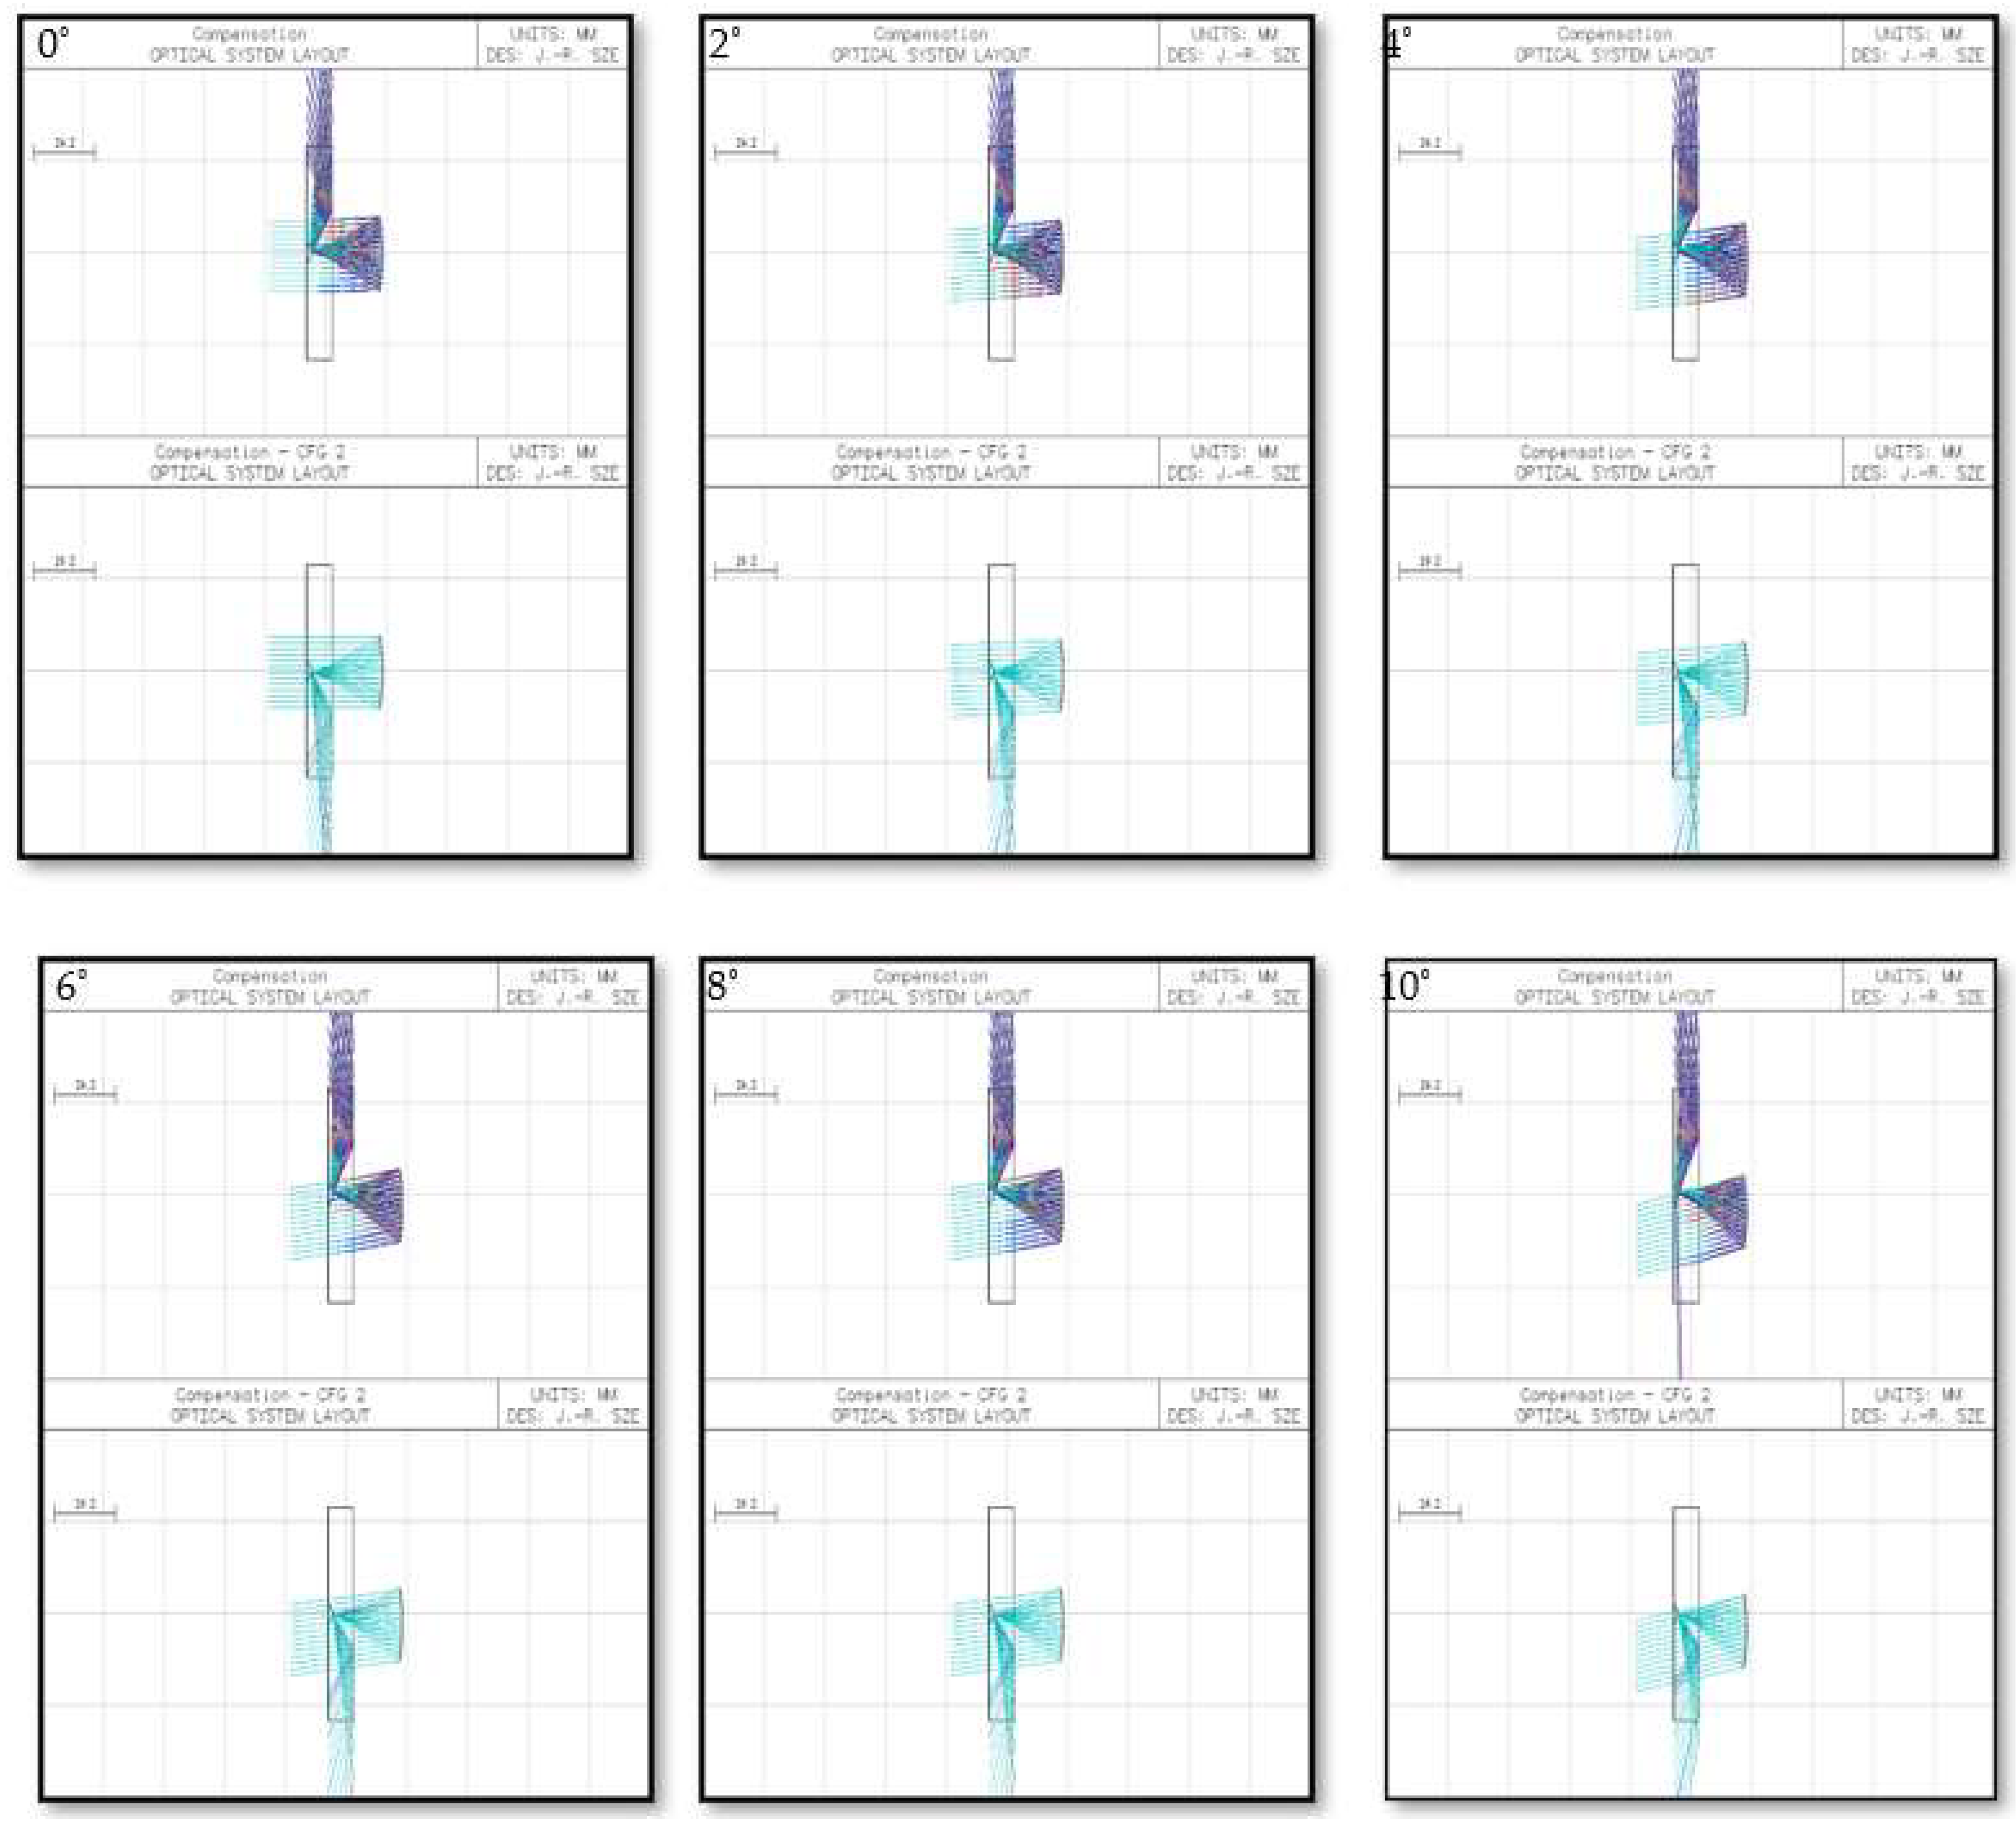
Figure 6.
The relationship between the incident angle of sunlight and the distance of the lateral movement of the light-guide plate.
Figure 6.
The relationship between the incident angle of sunlight and the distance of the lateral movement of the light-guide plate.
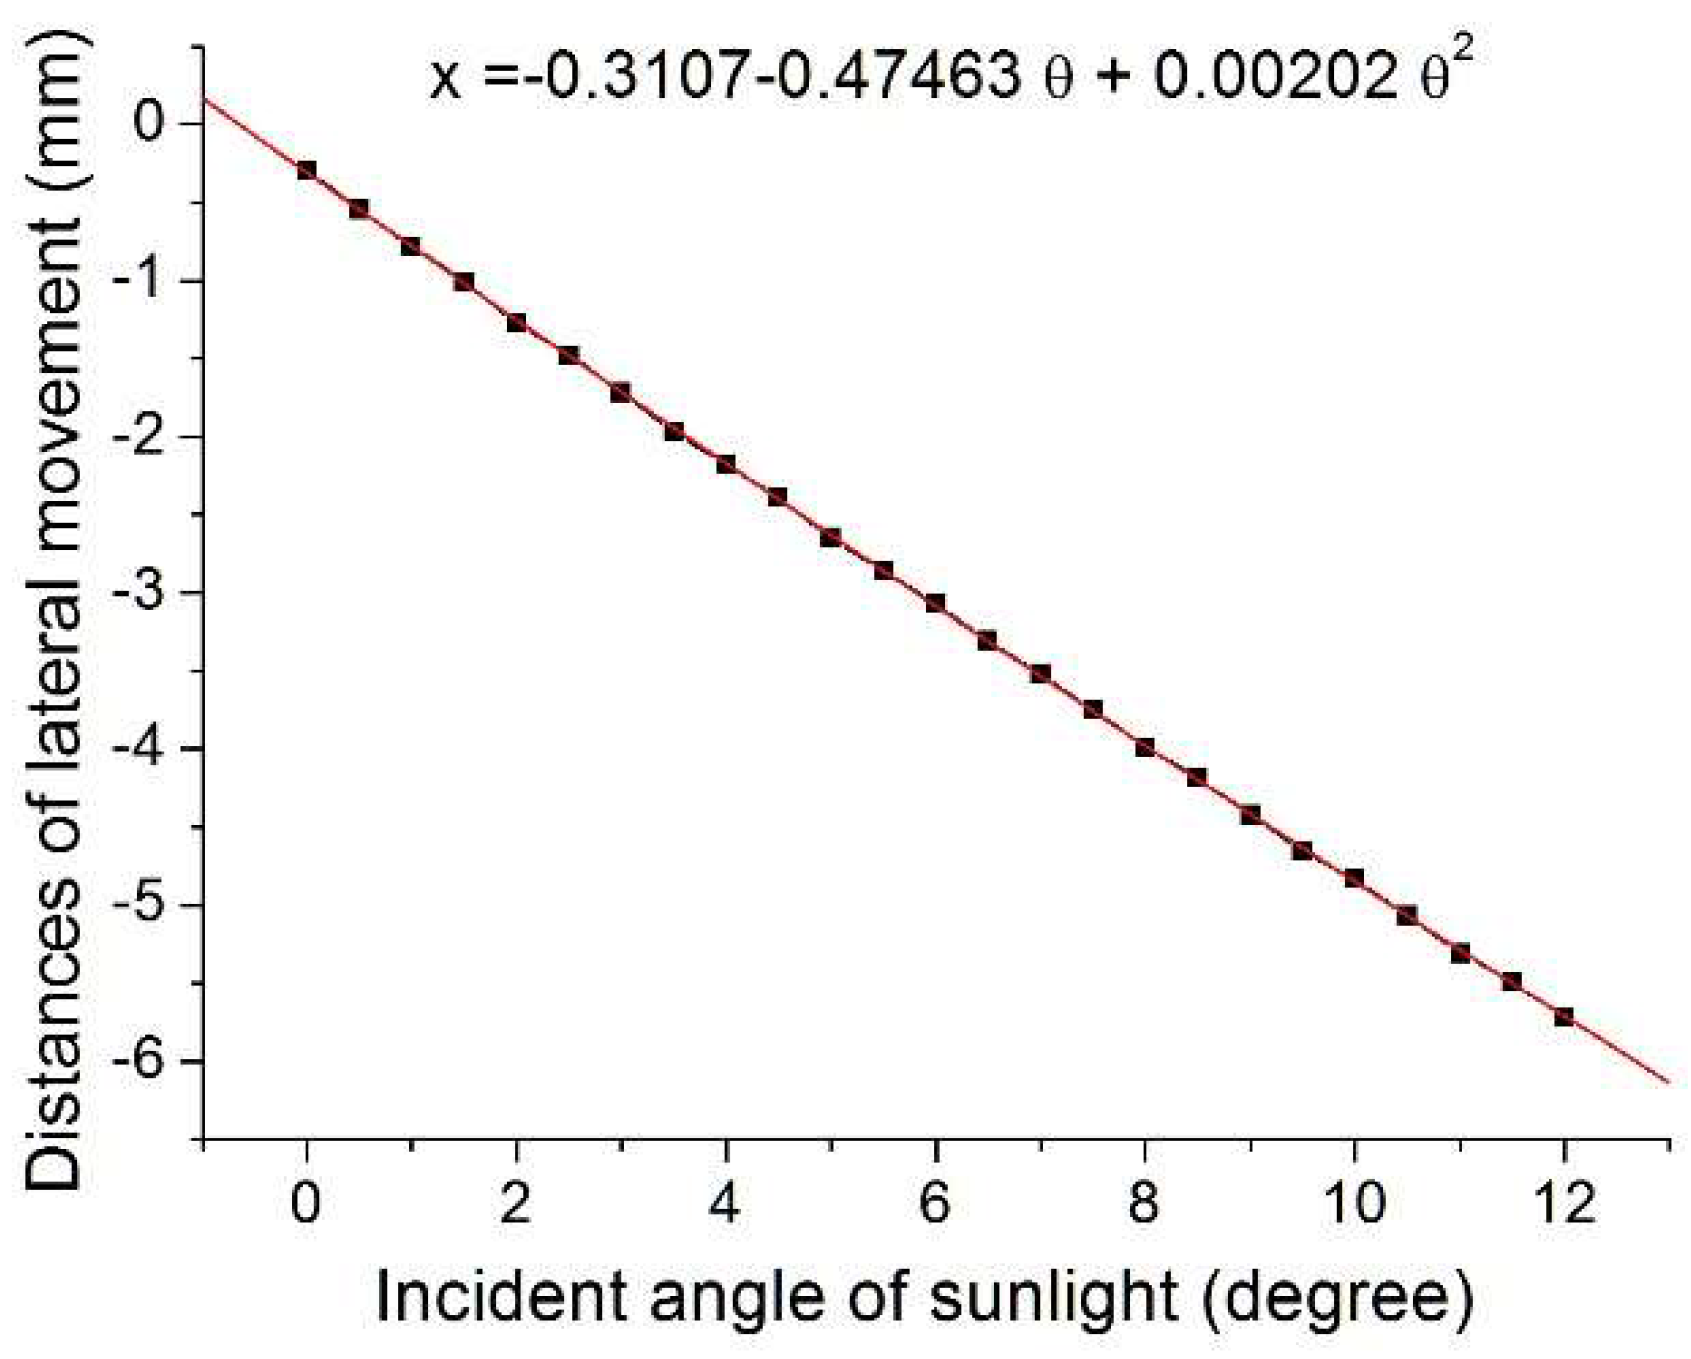
Figure 7.
Fabrication results of diffraction grating diaphragm. (a) Actual grating diaphragm film. (b) Measured surface profile of grating diaphragm.
Figure 7.
Fabrication results of diffraction grating diaphragm. (a) Actual grating diaphragm film. (b) Measured surface profile of grating diaphragm.
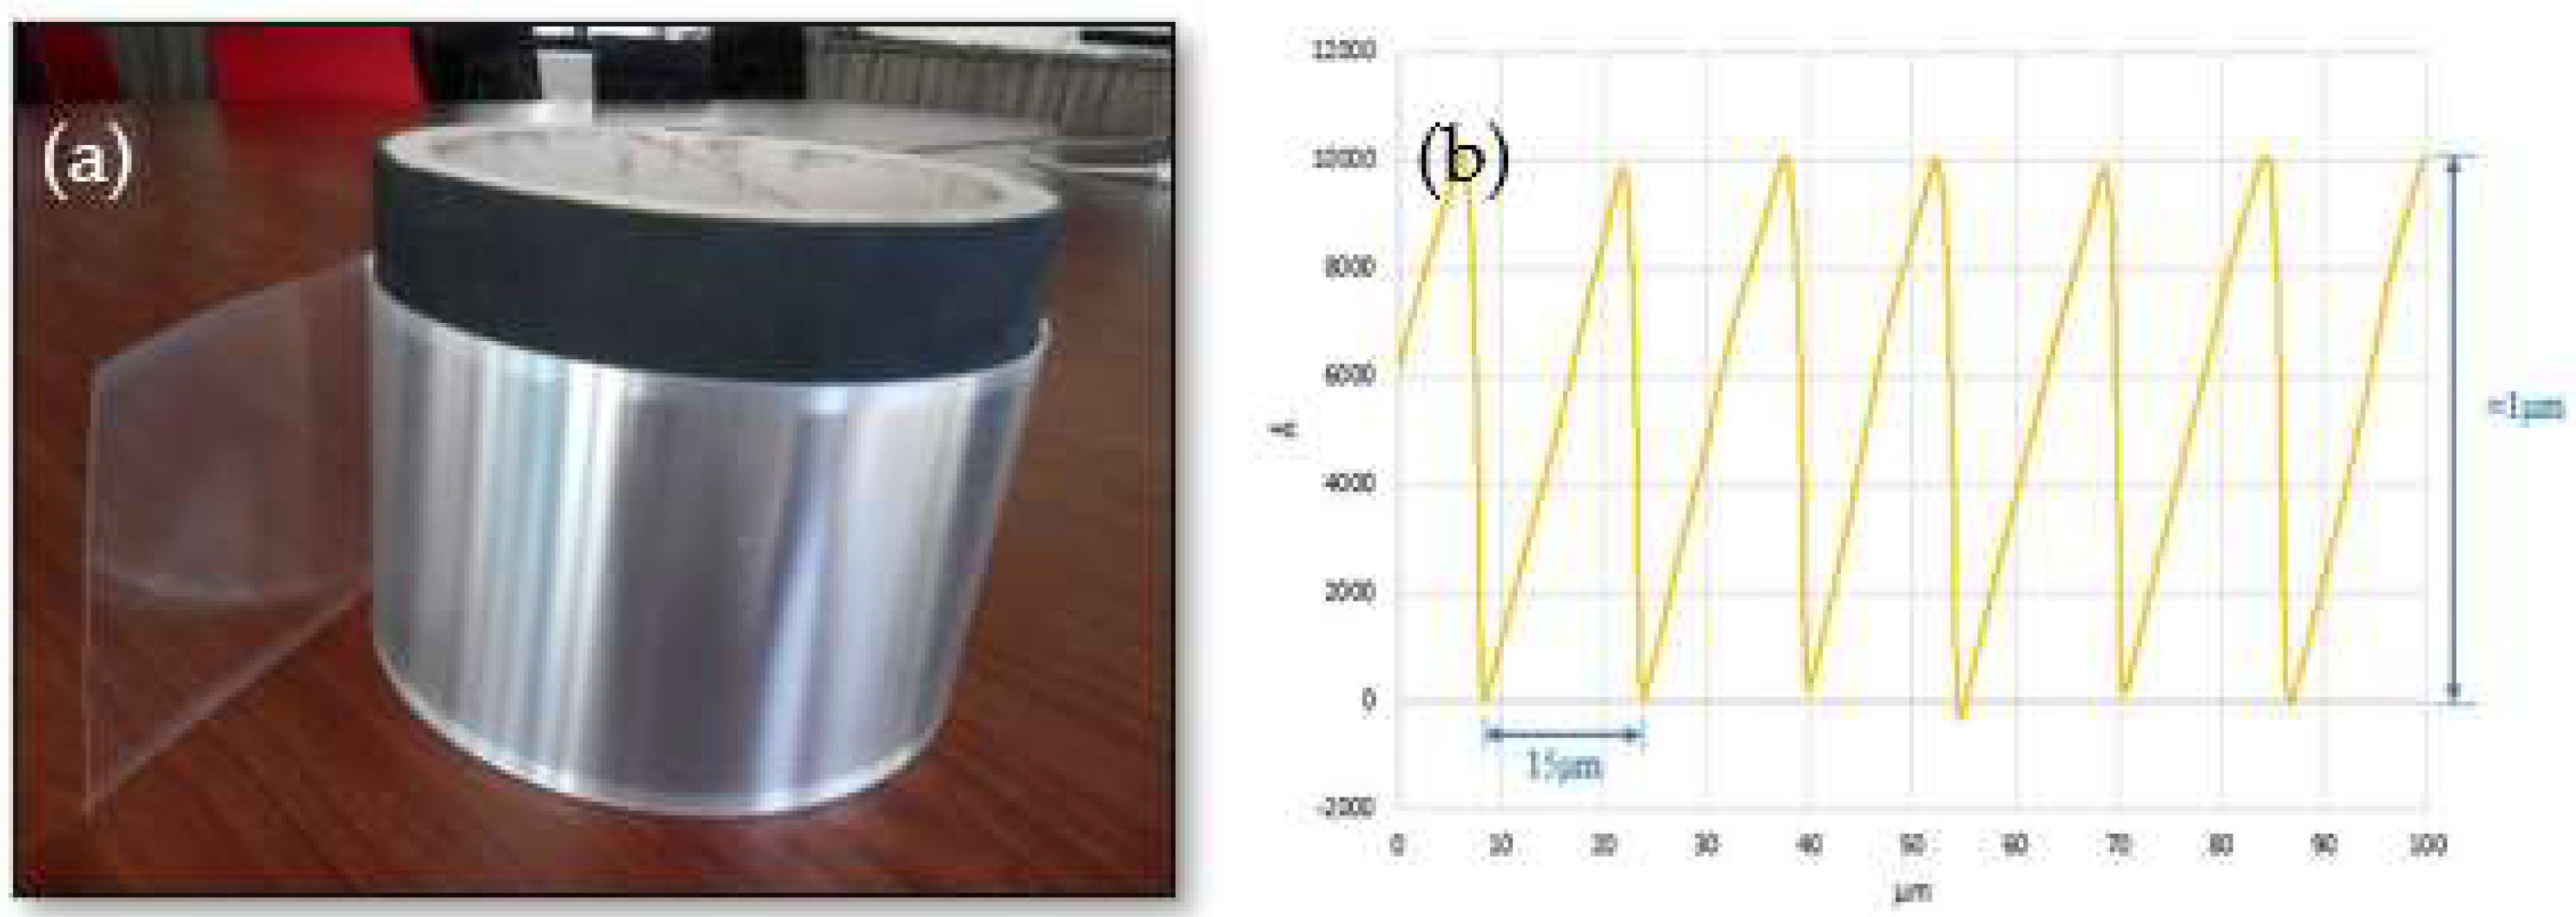
Figure 8.
Physical photo of proposed PT-SACM array.
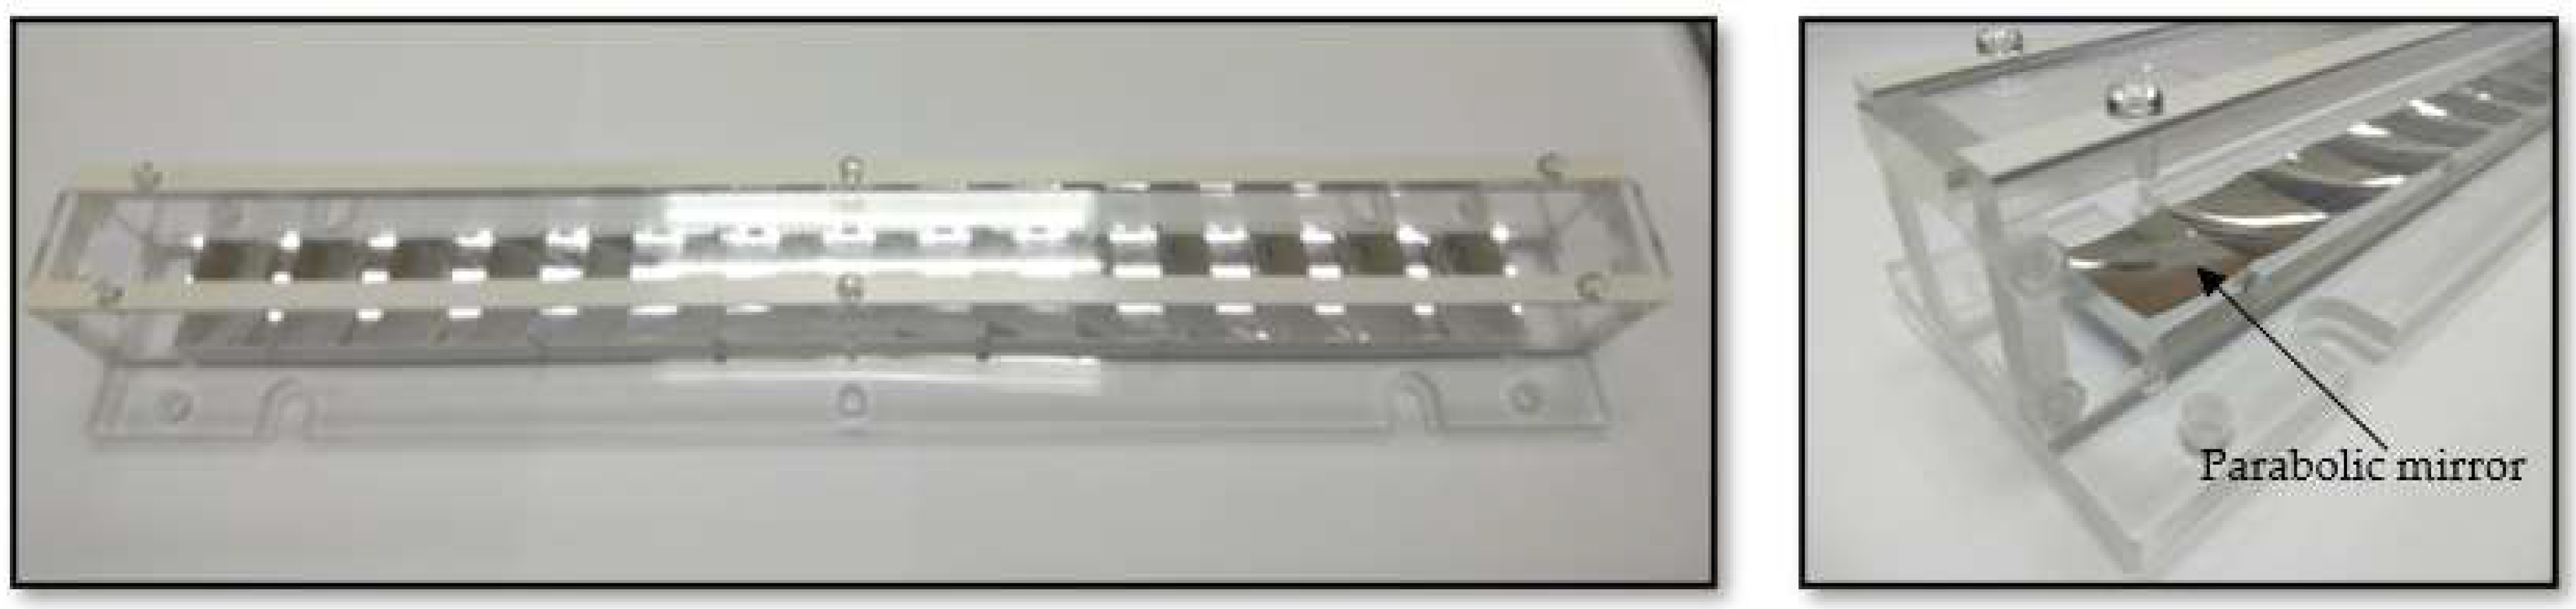
Figure 9.
The light emission situation of the light-guide plate of the PT-SACM for the visible light band.
Figure 9.
The light emission situation of the light-guide plate of the PT-SACM for the visible light band.
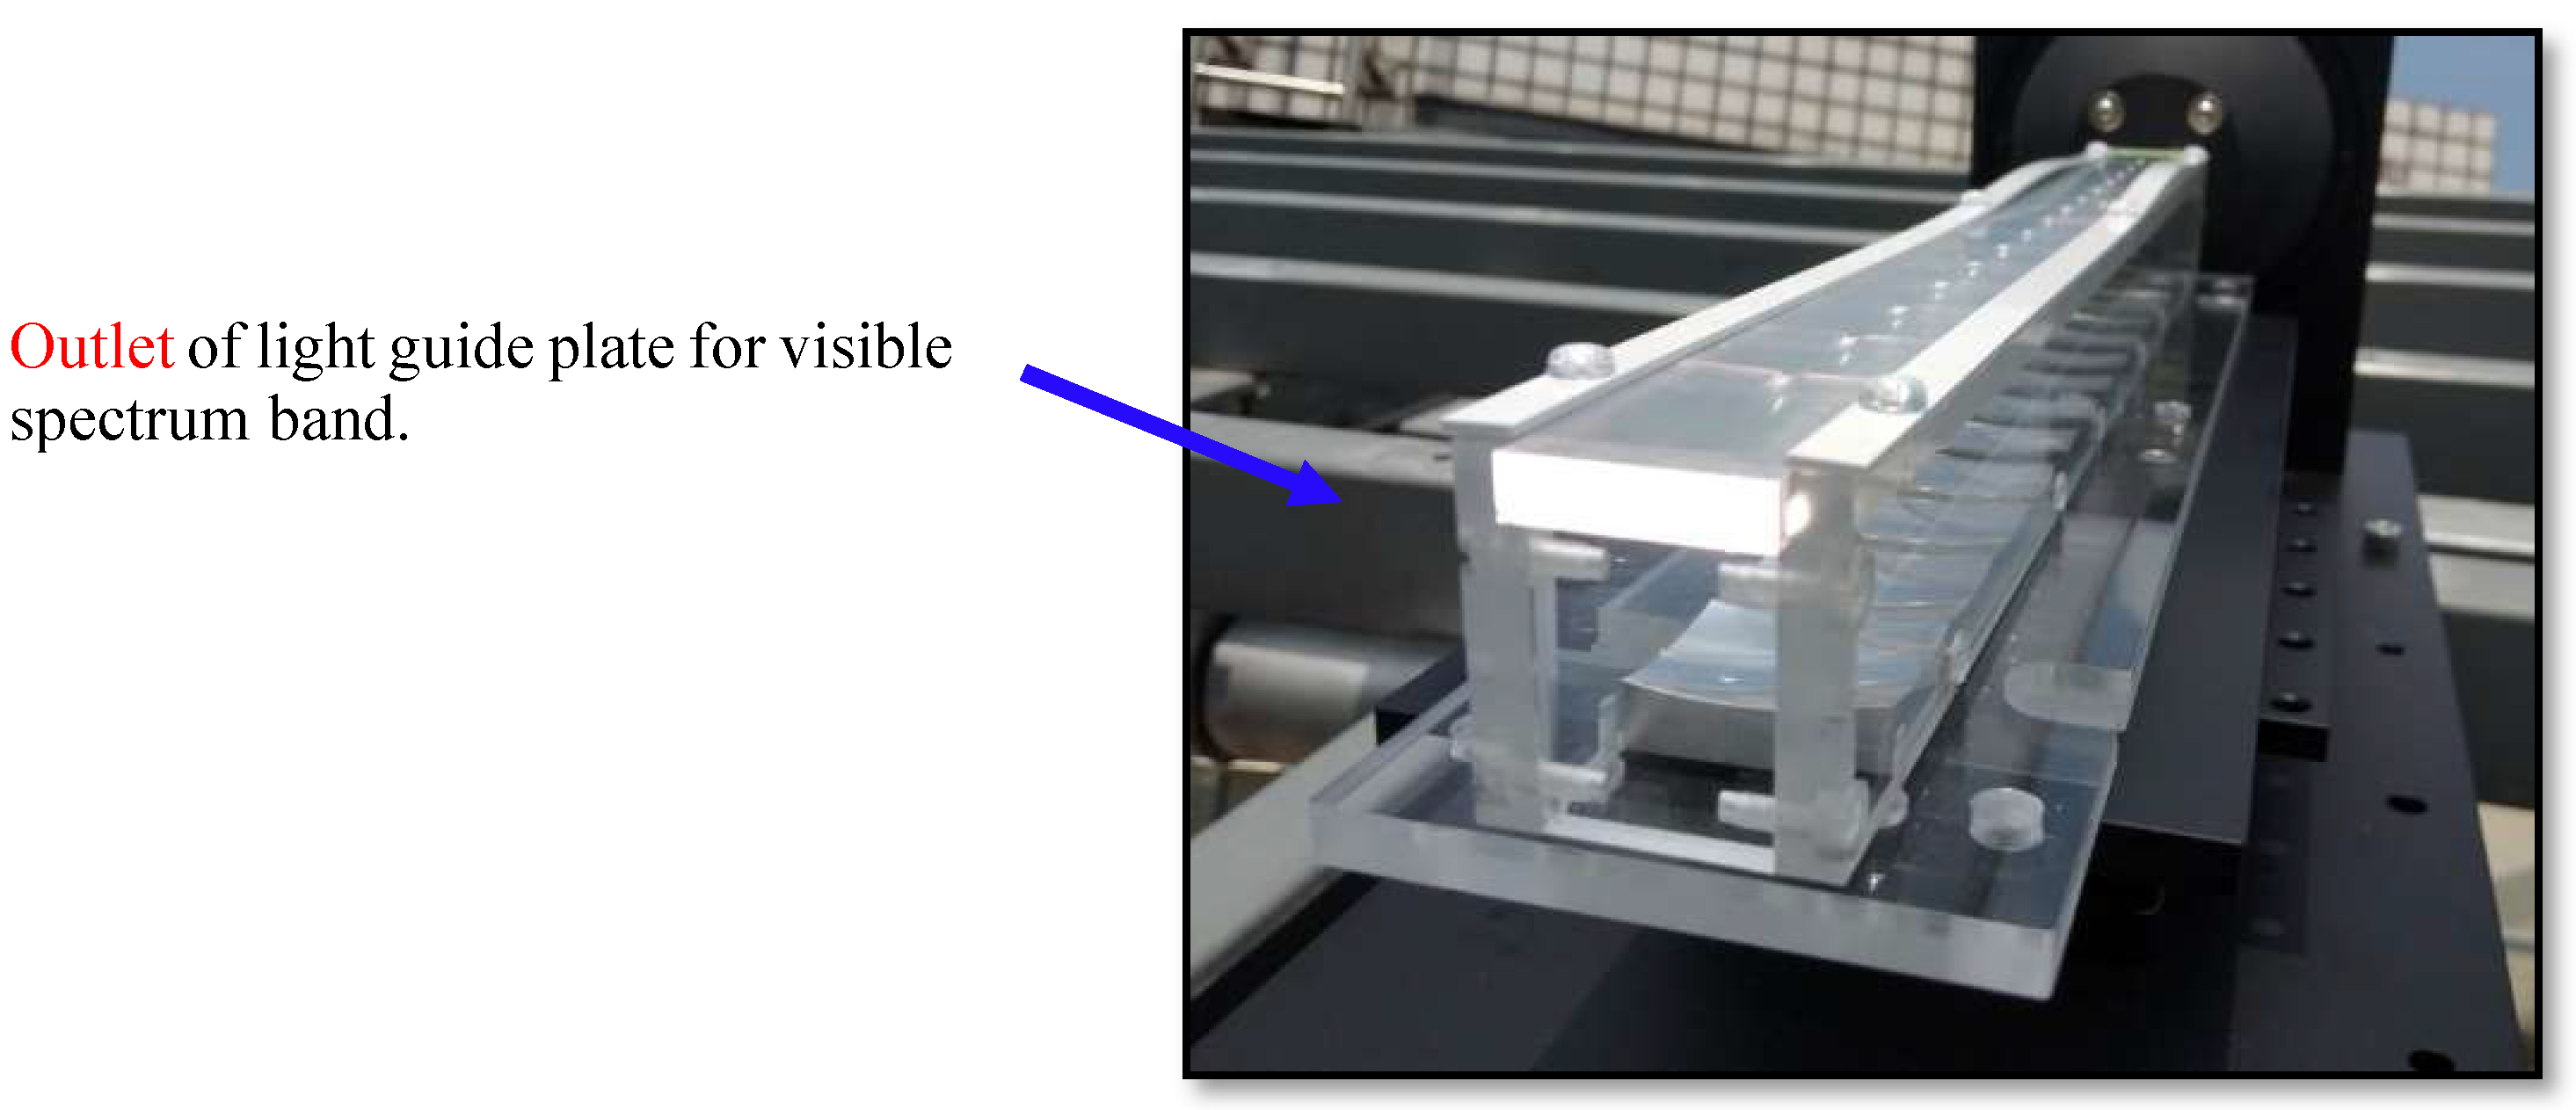
Figure 10.
The light emission situation of the light-guide plate of the PT-SACM array. (a) Horizontal light emission, and (b) vertical light emission.
Figure 10.
The light emission situation of the light-guide plate of the PT-SACM array. (a) Horizontal light emission, and (b) vertical light emission.
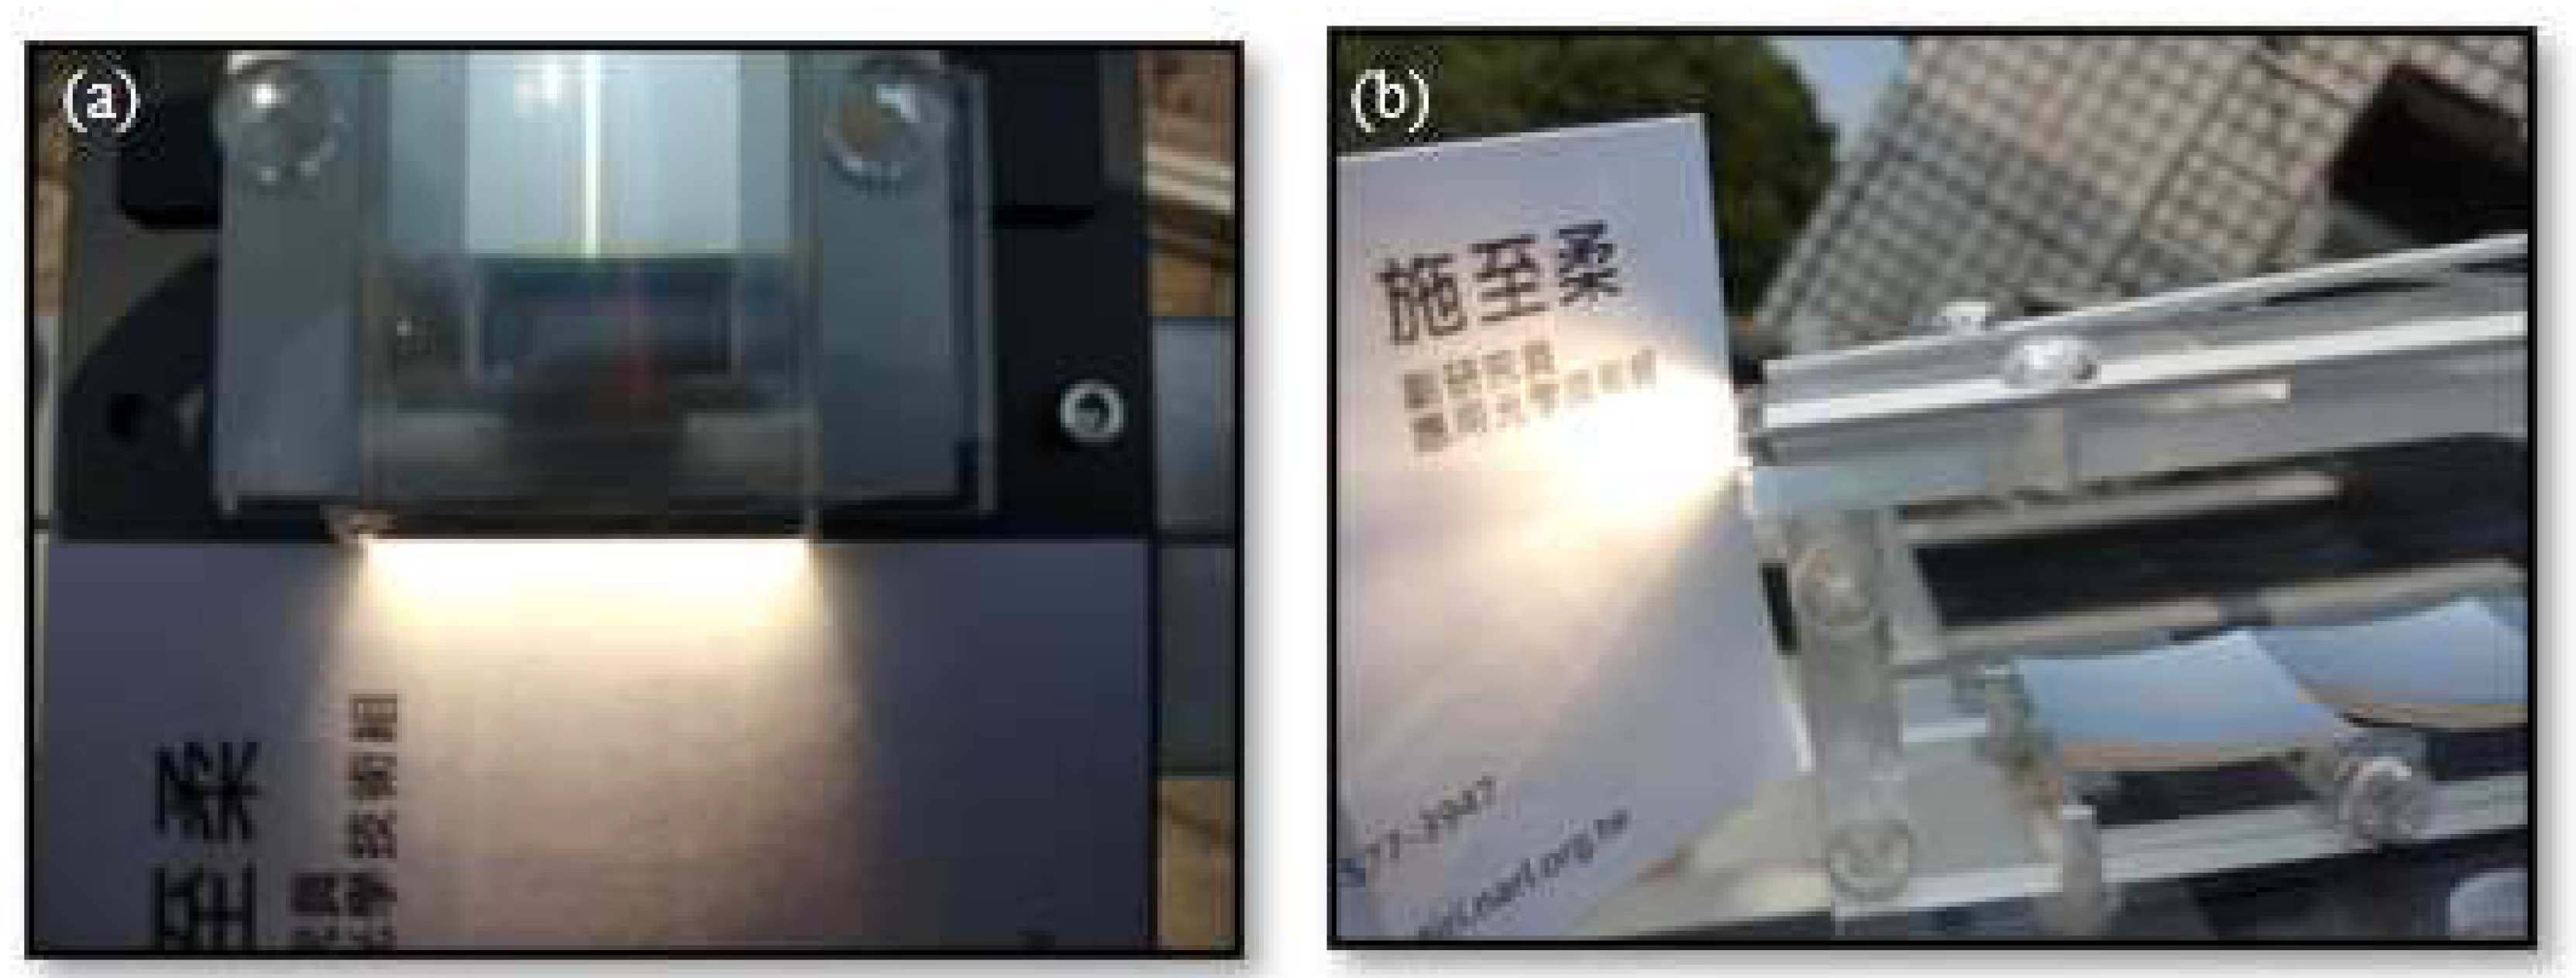
Figure 11.
Detected spectrum at the visible light outlet of the light-guide plate.
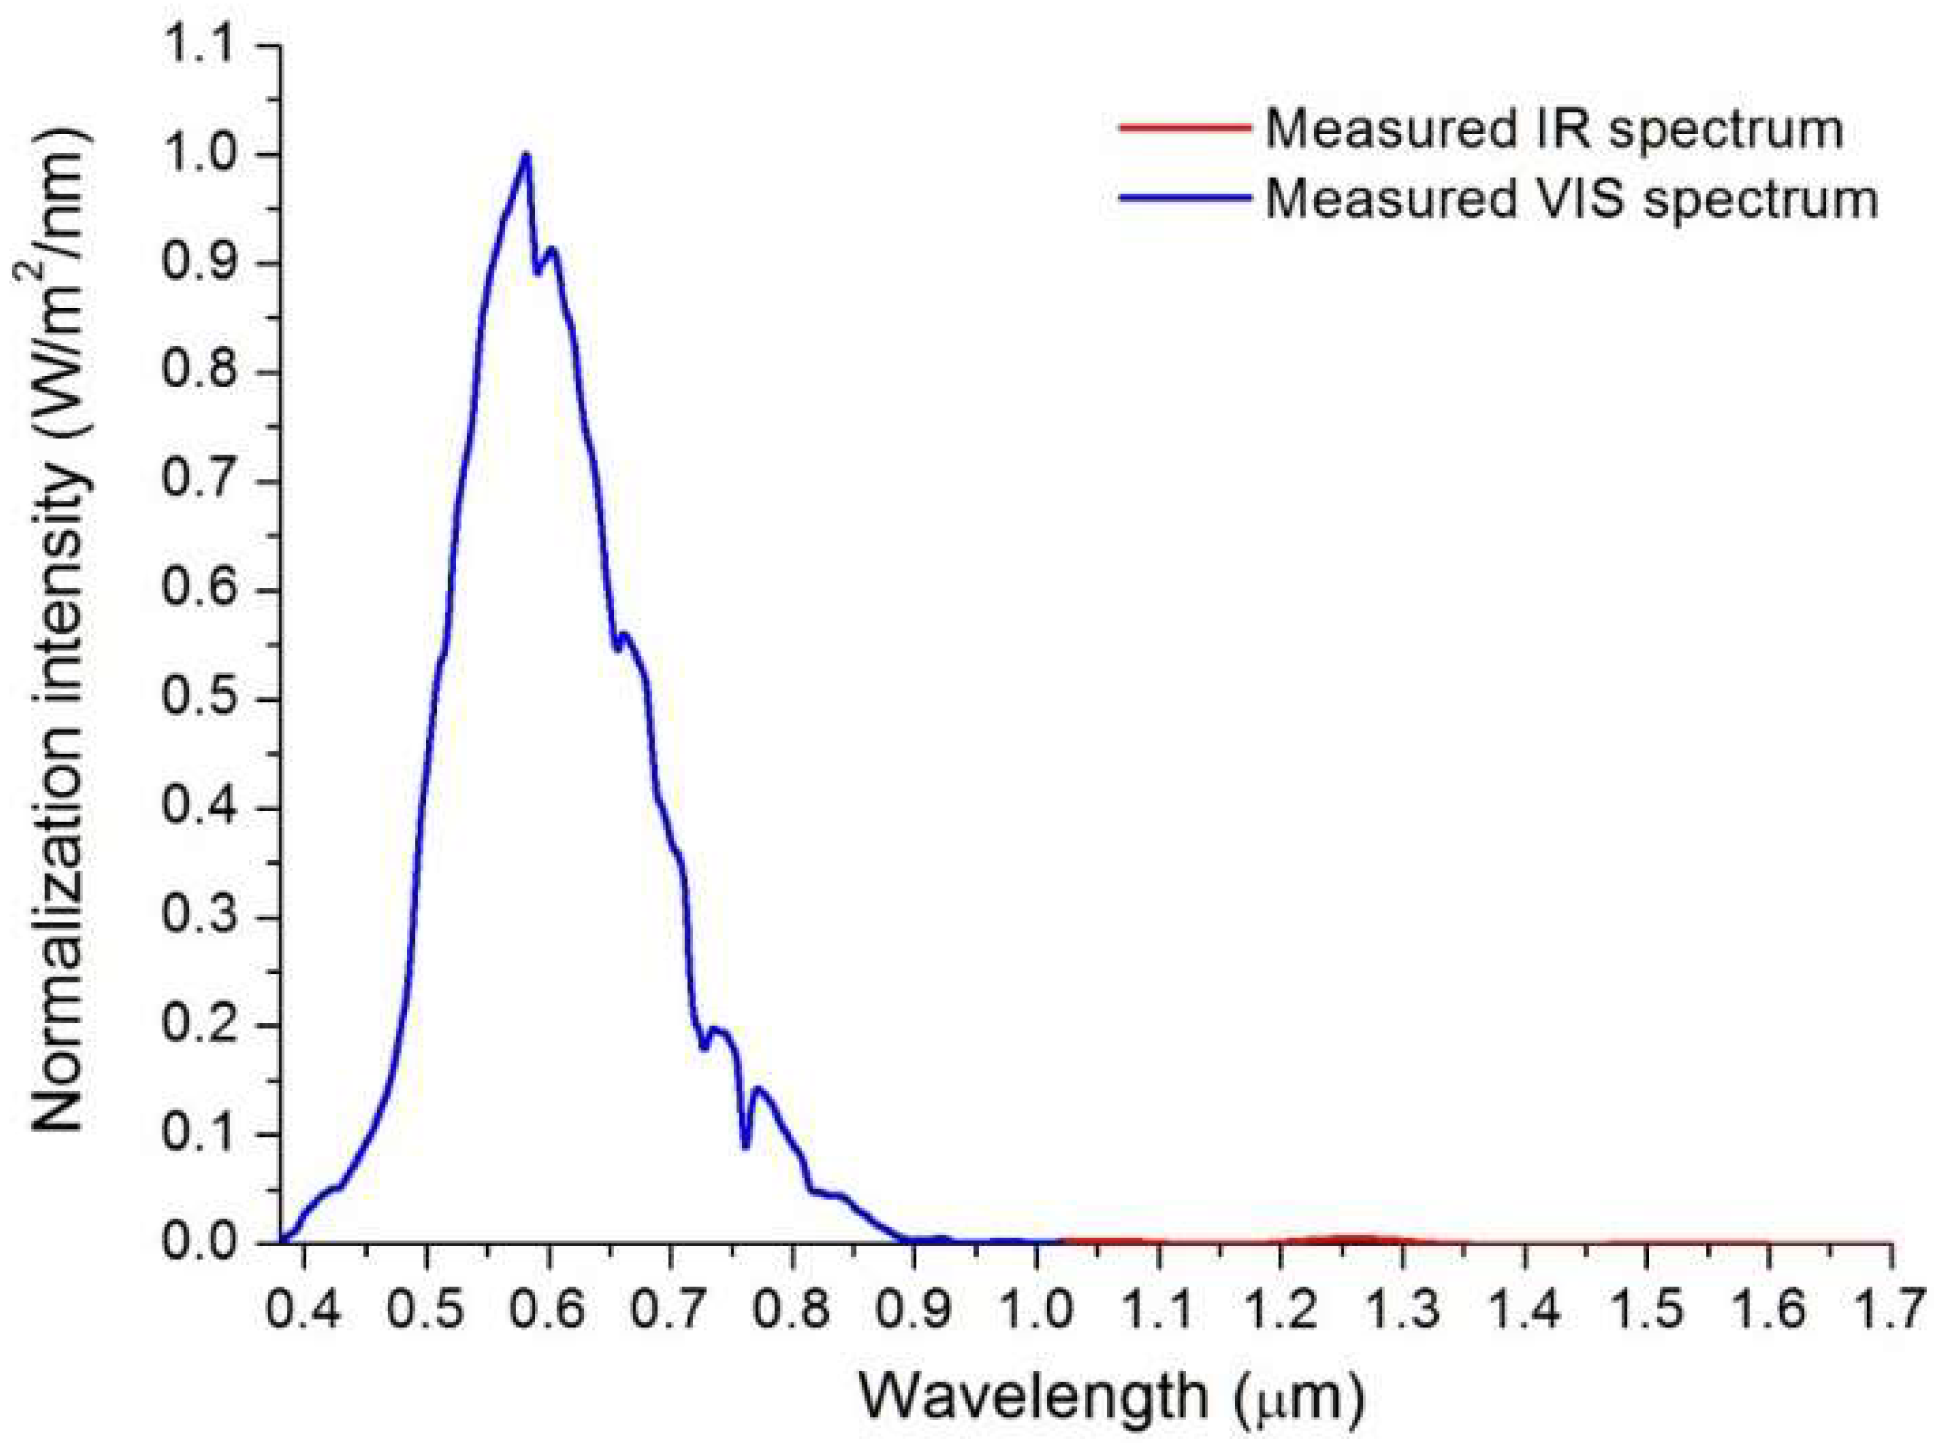
Figure 12.
Detected spectrum at the infrared light outlet of the light-guide plate.
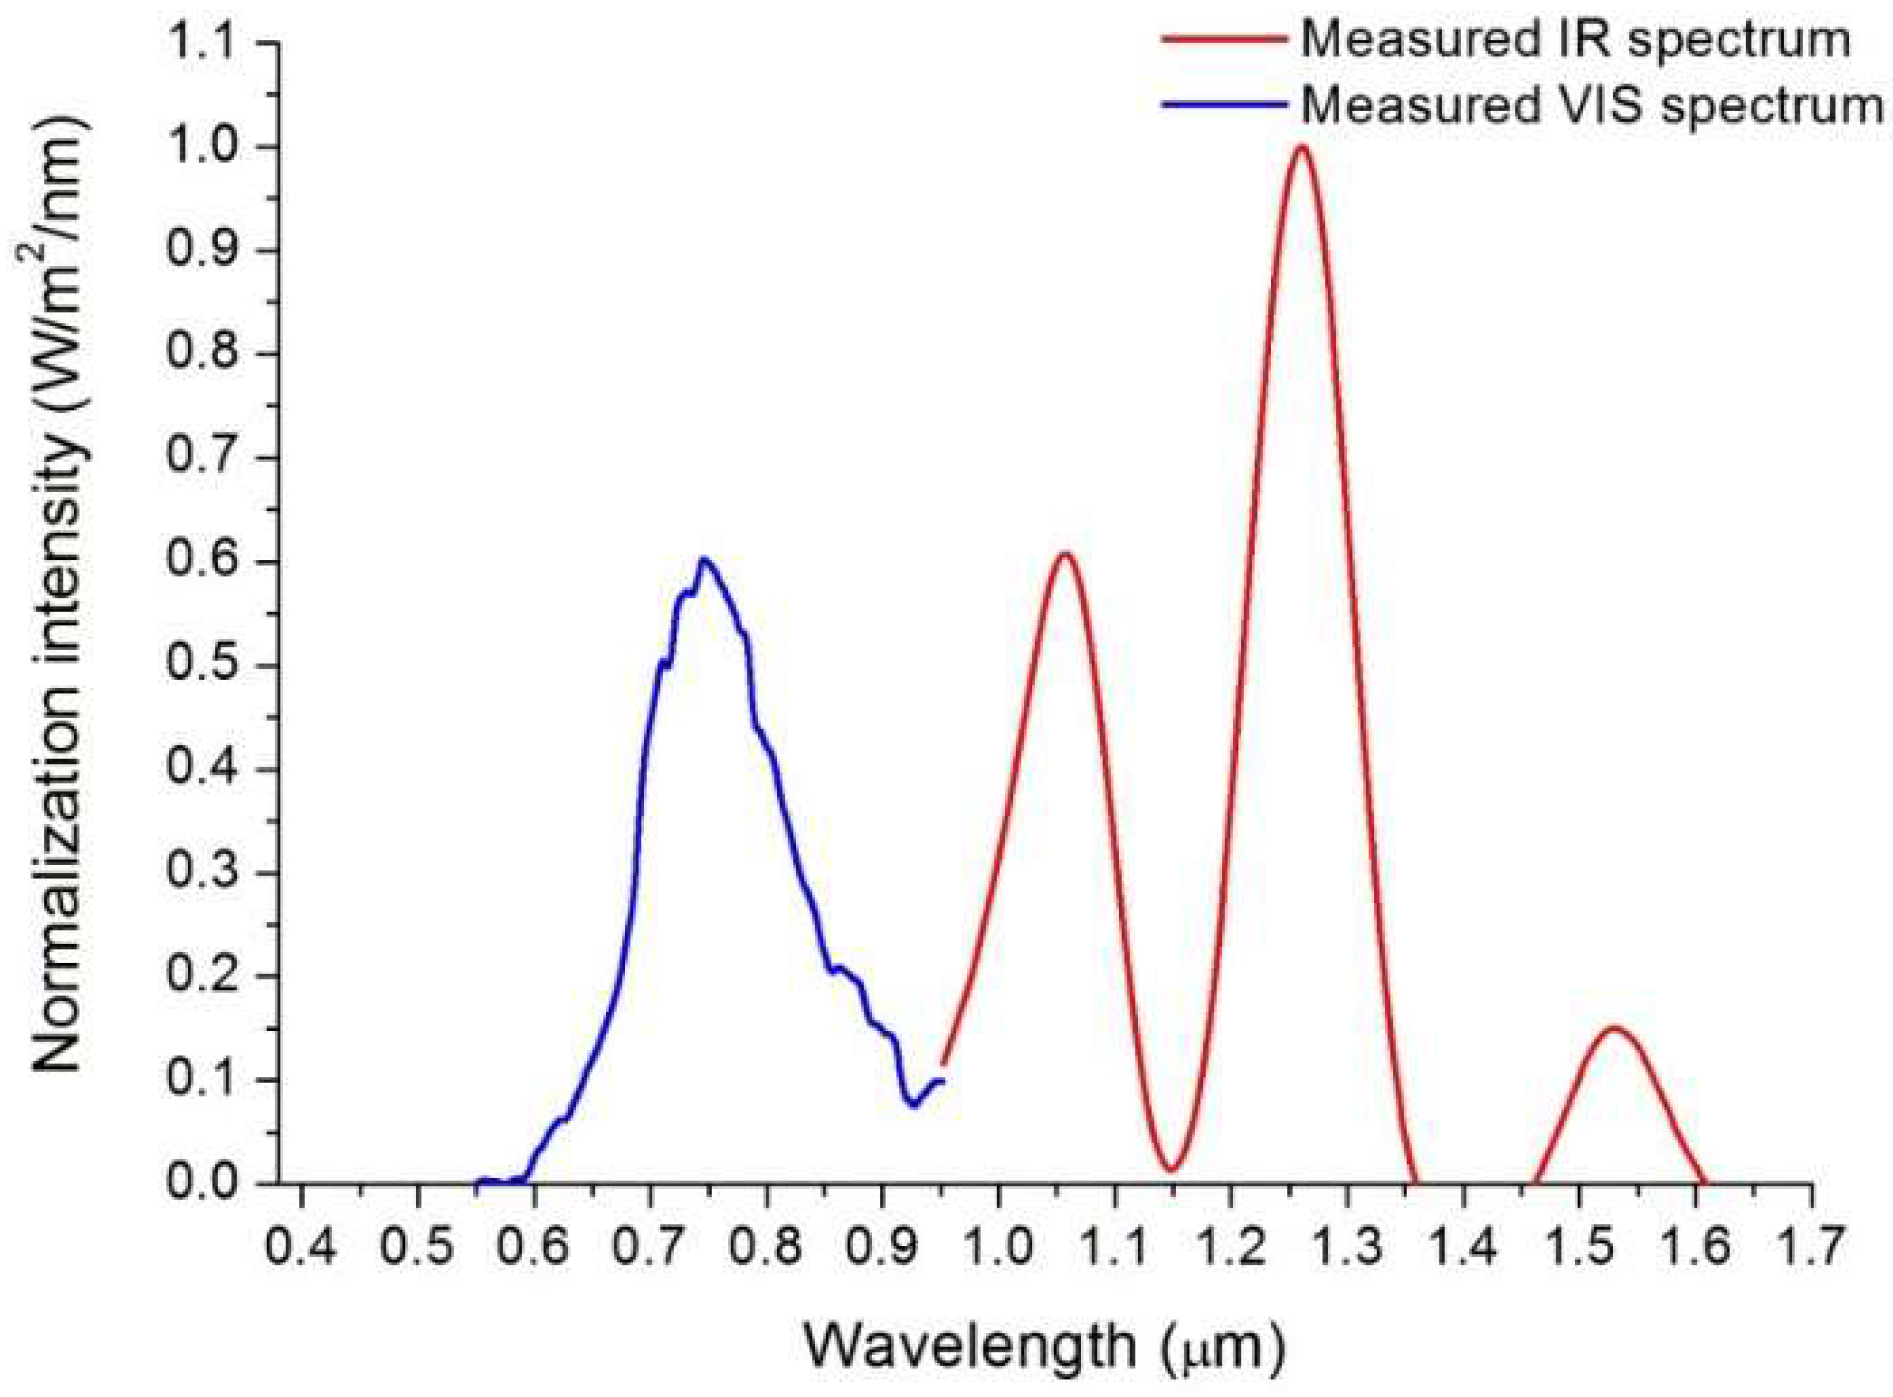

Table 2.
Parameters of V-groove inside the light-guide plate.
| Structure parameter | Design value |
| Vertex angle | 111.36 º |
| Height | 1.02 mm |
| Length | 6 mm |
| Width | 3 mm |
Table 3.
Analyses of the module efficiency for a module with specific fabrication factors.
| No. | Simulation conditions | Visible light band | Infrared light band | Both spectrum bands |
|---|---|---|---|---|
| (1) | Primary modela | 57.37% | 40.81% | 48.57% |
| (2) | (1)+ Scattering effect | 55.57% | 33.08% | 44.30% |
| (3) | (2)+Reflectance of Al-coated film | 50.44% | 28.41% | 39.52% |
| (4) | (3)+Reflectance of BaSO4 | 49.64% | 27.36% | 38.64% |
| (5) | (4)+Else diffraction order efficiency | 50.82% | 28.41% | 39.73 |
| Measurement | 49.31% | 27.06% | 38.32% |
a The primary model considered the array geometry and material of each component, the high reflection coating of the reflective-focusing mirror, the Fresnel loss at every refractive interface, and the half angle subtended by the sun.
Disclaimer/Publisher’s Note: The statements, opinions and data contained in all publications are solely those of the individual author(s) and contributor(s) and not of MDPI and/or the editor(s). MDPI and/or the editor(s) disclaim responsibility for any injury to people or property resulting from any ideas, methods, instructions or products referred to in the content. |
© 2024 by the authors. Licensee MDPI, Basel, Switzerland. This article is an open access article distributed under the terms and conditions of the Creative Commons Attribution (CC BY) license (http://creativecommons.org/licenses/by/4.0/).
Copyright: This open access article is published under a Creative Commons CC BY 4.0 license, which permit the free download, distribution, and reuse, provided that the author and preprint are cited in any reuse.


