
Submitted:
24 December 2024
Posted:
25 December 2024
You are already at the latest version
Abstract
Acoustic emission, AE, belonging to rubber-like deformation in martensitic state after stress induced martensite stabilization (SIM) of Ni51Fe18Ga27Co4 single crystals, in compression were investigated. AE activity in the plateau regions of the stress-strain loop is due to massive reorientation from variant, produced by SIM aging, to the variants preferred by the compressive stress (perpendicular to the stress used in SIM aging) and vice versa. For unloading the large AE activity just at the knee point of the stress-stain curve is attributed to the difficulty of the re-nucleation of the SIM aging stabilized martensite variant. The amplitude, peak energy and area of signals can be described by power-like distributions and the characteristic exponents, are in good agreement with data obtained in other alloys. Power law cross-correlations between the energy, E, and amplitude, A, as well as between the area, S, and the amplitude, A, were also analyzed. It was found that the exponents are given by 3-φ as well as 2-φ, respectively with φ≅0.7. Normalized universal temporal shapes of avalanches (i.e. the UA versus tA1-φ plots, where U is the detected voltage) for fixed area, scale very well together. The tail of the normalized temporal shape decays more slowly than the theoretical prediction, which can be attributed to intrinsic absorption of AE signals and/or to overlap of sub-avalanches.
Keywords:
rubberlike effect
; martensite stabilization
; acoustic emission
; noise analysis
1. Introduction
Deformation of shape memory materials in martensitic state can result in large residual strain due to the rearrangement of martensite variants (superplastic behavior) into a single variant structure preferred by the applied stress [1]. Aging in martensitic state under uniaxial stress (also called as stress induced martensite aging, SIM) [2,3,4,5,6,7,8,9,10,11,12] leads to stabilization of the induced martensite variant and its deformation (under a stress perpendicular to the direction applied during SIM aging) shows a hysteresis on the stress strain curve without significant residual strain (rubber like behavior) [4]. Thus, this rubber like behavior can have important practical applications due to the large reversible shape change induced either by uniaxial stress (or magnetic field in ferromagnetic shape memory alloys) [10,11,12,13,14,15]. The most important mechanism of the variant rearrangement is the twin boundary motion, which has a discontinuous character, leading to acoustic emission, AE, signals [16,17,18,19,20].
The above intermittent character is manifested in emission of signal avalanches, which have characteristic statistical behavior. The probability distribution density function of a typical signal parameter, x (like the peak amplitude, A, area, S, or energy, E), according to the tuned criticality behavior [21], follows a truncated power law form [17,20,21,22]:
where μ is the characteristic exponent and xc is the cutoff value. Here x denotes a measured parameter of the avalanche, like the amplitude, A, area, S, or energy, E, or duration, D. Furthermore, well-known power law relations exist between the measured avalanche parameters and e.g. the mean field theory, MFT, [21,22,23,24,25,26] predicts that with and , .
It is well known that due to experimental difficulties (finite threshold values [26] and transfer distortions of the original source signal [26,27,28]), most of the measured parameters can not reflect the features of the source (i.e. the rate of the intermittent local shape changes during twin reorientations). For example the duration time, D, (and related parameters containing D in their definitions) for AE avalanches can be strongly polluted by the internal absorption of the AE waves (which can be characterized by an exponential expression, , where τa is the attenuation time) [26,27]. It was shown in [27] that, although the exponents of the probability distribution functions can be more or less free of such effects, the scaling relations between the measured parameters can by strongly influenced. Moreover, it was also pointed out in [27] that the correlations between S and A as well as E and A can be characterized by exponents considerably less than the values given by the MFT. This called as “enigma” for acoustic emission [27]. In a recent communication [26] the above enigma was investigated by assuming a power relation between A and the rising time, R of the AE signal (), and it was found that and holds, respectively. The values of were the same for intermittent motions of interfaces between martensite and austenite in two different shape memory single crystals, (of Ni45Co5Mn36.6In13.4 and Ni49Fe18Ga27Co6 alloys) with for both alloys.
It is also well-known that the above mentioned exponents in eqn. (1) are quite robust, and change only slightly for different mechanisms [26,29]. Thus, the focus is increasingly on the average temporal shapes of avalanches, i.e. the average of the detected voltage signal () of magnetic or acoustic emission for fixed size or duration [20,23,24,25,31], which can be better related to the given type of the mechanism [23,24,25]. Regarding the average avalanche shape for fixed area, S, it was obtained from the theory [30,31] hat
where and U(t) are the interface velocity and the detected voltage. a and are non-universal (material-dependent) constants: is the characteristic time of the avalanche decay [32]. On the basis the self-similarity of the emitted avalanches [22] it is expected, that using appropriate scaling parameters, the normalized U(t) functions should fall on a common curve for different bins of S. For the experimental verification, whether an appropriate scaling can indeed lead to good scaling together, dividing both axes by (based on the power relations predicted by MFT, i.e, as well as ) was used [28,32,33]. However, no good scaling was achieved and the curves did not scale completely in a universal way. As it was mentioned above, there exist a power relation between A and R as well: . Thus, scaling the voltage by A and the time by nice common functions were obtained not only for motion of interfaces between austenite and martensite in Ni49Fe18Ga27Co6 single crystal [26], but for motion of individual twin boundary (of type I) in Ni-Mn-Ga single crystal [34] too.
This paper we present experimental results on AE measurements during rubber like deformation (i.e. during twin re-arrangements) of Ni51Fe18Ga27Co4 ferromagnetic shape memory single crystals. Besides the determination of the characteristic exponents in eqn. (1) the scaling relations between the area and peak amplitude as well as between energy and peak amplitude are also determined and the obtained power exponents of these are used to find normalization factors for the construction of universal average temporal avalanche shapes. Our results will also be compared with AE results, obtained during stress or magnetic field induced motion of single twin boundaries or different ensembles of twin boundaries in Ni2MnGa alloys. Universal averaged temporal avalanches are also constructed at fixed area, by dividing the voltage and time scales by A as well as by , using the ϕ value calculated from the exponents of power relations between the S and A as well as between E and A.
2. Experimental
The Ni51Fe18Ga27Co4 single crystals were prepared using vacuum induction melting and the single crystals were grown by Bridgman method in helium atmosphere at Tomsk University, Russia. Dimensions of the sample were 3x3x5 mm. Homogenization heat treatment was performed at 1175 0C for 1h, which was followed by quench to room temperature. The B2 high temperature phase of the quenched crystals undergoes to a martensitic transformation to the L10-martensite. SIM (Stress Induced Martensite) aging was performed by compression along [110]A direction at 150 0C for 1h.
Compression tests were made by an Instron 4465 tensile test machine at room temperature along the [001]A direction. Acoustic emission (AE) measurements were performed by piezoelectric sensor, attached to the steel compression anvil. For conditioning and acquisition of acoustic data a Sensophone (Geréb and Co GmbH, Budapest, Hungary) AE measurement system was used with 8MS/s sampling rate (for the details see [35]). In the evaluation of acoustic signals 0.04V threshold value and 4x10⁻⁵s hit detection time was used.
3. Results
The stress-strain curve, taken with a strain rate 1.25x10⁻³ s-1, during rubber like behaviour of the Ni51Fe18Ga27Co4 sample, is presented in Figure 1a. The cycles were stable and curves of more than 10 cycles were fully collapsed. As the result of SIM aging (see e.g. [11]), the recoverable strain is around 15%. Fig1b shows the stress curves, the simultaneously measured AE signals as well as the cumulative energy of the AE signals () as the function of time. The number of AE events remarkably increases on the unloading curve (at around 125s on Figure1b), with a large jump in .
The AE data were used for the calculation of the characteristic exponents in eqn. (1) for the area, S, energy, E, and amplitude, A. The S, E, and A, of acoustic avalanches were calculated from the detected voltage, U(t) (temporal avalanche shape) according to their usual definitions [36,37]: A is the maximum value, , and , where Ro is an arbitrarily chosen resistance (Ro=1MΩ).
In order to get the exponents from Equation (1), the probability density functions, PDF, (calculated using logarithmic boxing of the quantities , where Ni and N denote the number of events at a certain value of xi and the number of all hits, respectively) were fitted using a two parametrical nonlinear fitting by the Levenberg-Marquardt least squares method. As an illustration, Figure 2 shows the energy probability distribution density of acoustic signals, averaged for both directions. It can be seen that a straight line can very well fit the points over about four-five orders of magnitude. The maximum likelihood fit is a recommended method to check the reliability of exponents calculated from the log P versus log E plots [38]. We obtained that in all cases, the exponents determined by the two methods were the same within the error bars given in Table 1 (see also Figure 2a,b). Table 1 shows the calculated exponents for energy, amplitude and area.
Figure 3 and Figure 4 show the power relations between the energy and amplitude as well as area and amplitude, respectively. It can be seen that, besides the first parts, belonging to small amplitudes, where the amplitude is comparable to the threshold (0.04 V) and a downward curvature is observed (see also Figure 6 and Figure 7 in [26]), a straight line can be fitted. Using the prediction of [26] the exponents for the power relations between E and A as well as S and A can be expressed as as well as , respectively. Table 2 also contains the values of ϕ obtained from our measurements.
It is worth mentioning that the data collected during the forward and reverse deformation were collapsed into one file, thus the above exponents were calculated using all (up and down) points. This is in contrast to the results obtained from austenite/martensite transformations in different shape memory alloys, where frequently the exponents for the up and down processes were different [39]. We will turn to this below commenting the difference of the total numbers () and total AE energy () during loading and unloading branches as well as we will discuss fine details of the obtained AE data.
4. Discussion
4.1. AE during Loading and Unloading
The origin of the rubber-like behaviour is the so-called symmetry conforming short range ordering [40] during SIM aging (which leads to diffusional stabilization of the given single variant martensite, preferred by applied stress). It is not surprising that the recoverable strain is large for our Ni51Fe18Ga27Co4 single crystals since in this case the aged martensite structure is dominantly a single martensite variant and the aging temperature and time was high enough to reach the complete sort range order according to this martensite structure [11]. The single variant martensite reorients during the application of the compressive uniaxial stress (in [001]A direction, perpendicular to the [110]A SIM aging direction of austenite) and if it is a complete reorientation then a recoverable strain close to the theoretical value can be reached, which is about 16.6% in this alloy [11]. In our case the experimental value is about 15% (see Figure 1a), which indicates that not the full potential of the transformation strain realized in our experiment. This can be related to the fact that the SIM aged state or the reoriented state (or both) is not a fully detwinned structure of the corresponding martensite (see also Figure 5). Here we use the notations of [11] and [41] for this alloy: the dominant variant V1 ([001]A || [001]M) is formed during SIM aging, while V2 ([010]A || [001]M) and V3 ([100]A || [001]M) are the reoriented variants [41] (preferred by the stress under which the rubber-like behaviour is investigated: see also Figure 3a in [11], as well as Figure 2 in [41]) The presence of variants V2 and V3 is the indication of the incomplete detwinning [41]. Nevertheless, during loading reorientation from the (initially dominant) V1 to V2/V3 takes place and the reveres process sets in during unloading.
It can be seen from Figure 1 that for loading there are some AE signals already before the start of the plateau (at about 3.5% strain), but these most probably can be attributed to micro-friction in the course of matching the sample to the testing machine [42,43]. The sporadic AE activity and a slight gradual increase of the cumulative AE energy in the whole remaining part of the loading stress-strain/time curve belongs to the reorientation process from V1 to V2/V3. For the unloading part the situation is different in that sense that here a large number of AE signals and a large jump in appear at the beginning of the plateau (at around 125s), which is followed by a similar lower activity (like along the loading branch) until the end. In this latter plateau region jerky rearrangement of the variant structure takes place, either by nucleation of V2/V3 variant or by the motion the already existing boundaries between V1 and V2/V3 boundaries. The above picture is also in a good qualitative agreement with the simulation results on dynamical tweed, and mobile kinks, movement in the twin walls in ferroelastic materials [44,45]. The amplitude of jumps was higher in the yield regime during nucleation (at around the beginning of the plateau in our case) as compared to the plateau region where transition between V1 and V2/V3 took place.
The high local activity on the unloading curve also leads to a remarkable difference in the total number of acoustic events and in the total acoustic energy (1250 and 2500 as well as 0.5x10⁻⁴ V2s and 5.5x10⁻⁴ V2s for loading and unloading, respectively), which suggests that there is an AE asymmetry. Since the nucleation processes typically provide high AE activity [35,44,45], we interpret the asymmetry and large local AE activity on the unloading branch by the difficulty of the re-nucleation of the initial, differently oriented martensite variant V1. Furthermore, the remaining part reflects, similarly for the loading branch, the jerky propagation of the boundaries between the two variants. The relatively large dissipation (wide hysteresis loop in Figure 1a) can also be a fingerprint of the difficult re-nucleation of the V1 variant.
Thus, it seems that while the processes in the plateau are similar in both branches, the above asymmetry is an indication that there are no nucleation difficulties for the appearance/further growth of the V2/V3 variant in loading but in unloading the re-nucleation of V1 is difficult. Understanding of the structural details of this, calls for detailed microscopic investigation. Nevertheless, the fact that the observed transformation strain is less than the theoretically predicted value also reflects that the V1 and V2/V3 end states should not be fully detwinned variants.
The above asymmetry in and , suggests that it is worth to check whether the exponents of signals collected from the large local activity region only for unloading are the same as the average values given in Table 1 or not. We will turn back to this point below.
4.2. Power Exponents of the Acoustic Emission Parameters
First we compare the exponents of the amplitude or energy probability density functions, with exponents given in previous publications obtained either from magnetic field or stress field induced martensite variant rearrangements in ferromagnetic shape memory alloys [16,18,34,46,47,48,49,50]. Table 2 contains the summary of the measured exponents, with our value calculated from all measured points
In [18,34] and [47] AE results for type I twin boundary were analysed in Ni2MnGa, while in [48] rearrangements of magnetic field induced twin boundary network was investigated. In Ni2MnGa single crystals the same energy and amplitude exponents can be concluded (if we do not take into account the results of [18] for type II twin boundary, where less than one order of manitude wide energy range was covered), which can be summarized by ε=1.5±0.2 and α=2.1±0.2, respectively. It can also be seen from Table 2 that our present results are in good agreement with the above average data.
Thus, we can also conclude that the energy and amplitude exponents were the same both for stress or magnetic field induced motion of single boundary or for the motion of different ensembles of twin boundaries in two different ferromagnetic shape memory materials. This result is similar to the conclusion drown on AE exponents (with a bit different average values as obtained for twin boundary motions) collected during the austenite/martensite transformations in Ni2MnGa, Ni51Fe18Ga27Co4 and Ni45Co5Mn36.6In13.4 single crystals [50].
The above results nicely demonstrate the robustness of the characteristic exponents present in relations given by eqn. (1). It can be also be seen that the ϕ values, as expected [26,34], are the same as calculated either from cross-correlation between E and A or S and A.
As it was a mentioned already in the introduction, it is worth to go beyond the comparison of the energy and amplitude exponents only and investigate scaling properties of the temporal avalanche shapes at fixed area. Before this, it is worth to check the exponents of the AE parameters collected after the separation of AE signals belonging to the large local AE activity during the re-nucleation of the SIM ageing stabilized variant, V1. We carefully carried out this analysis and found that all the energies given in Table 1were the same for both the separated and the remaining signals within the error bars. In addition, in Figure 3 and Figure 4, and on the corresponding plots after separation, no any branching was observed. As it has been shown in a series of papers [51,52,53,54] the multibranching (i.e. and for i=1 and 2, ) stems from the overlapping of sub-avalanches within one acoustic emission signal and the extent of this overlap can be different for different avalanche mechanisms. It was also shown that this effect can be very useful in making distinction between different avalanche mechanisms [51]. Thus, we can conclude that on the basis of our results no distinction can be made between AE signals belonging to re-nucleation of the V1 variant and to the massive reorientation of the two variants (in the plateau regions).
4.3. Normalized Temporal Avalanche Shapes for Fixed Duration and Area
The next step is the construction of the normalized (universal) temporal avalanche shapes for fixed area. The normalized functions for fixed area, in accordance with [26] and [34], can be obtained from (2) by scaling the voltage scale with A and the time scale with , since according to [26] with (see Table 1). Constructing the average avalanche shapes, first different avalanche size ranges (bins) were selected. Within each size range, the avalanches were averaged, and the common avalanche parameters (amplitude, size, energy, rising time) were determined for the average function, belonging to this bin (see Figure 9). As a second step these functions were scaled together by dividing the U axis by A and the t axis by , as it is shown in Figure 10. It can be seen that, as expected, the averaged curves are collapsed showing the self-similarity of the avalanches over wide size range. It is worth commenting two characteristics of Figure 10: a) fluctuations (i.e. only a smoothed curve would fit to the shape predicted from eqn. (2)), b) the last part (above about 300 reduced time) decays much slowly than predicted by eqn. (2). The fluctuating behaviour can be a consequence of our relatively bad statistics as compared e.g. with similar AE measurements on motion of individual twin boundary in Ni2MnGa single crystal (the number of events was about five times larger in [34] than here). Another possibility is the effect of mechanical oscillations in the otherwise monotonic driving force [55]: if the typical durations of avalanches is comparable to the period of oscillations of the testing machine, some oscillations can appear on the temporal avalanche shape (this effect is expected to be more expressed in experiments made on micro-pillars [55]). However, as compared to our measurements, in Ni49Fe18Ga27Co6 [26] the duration times of avalanches emitted during martensitic transformation covered similar range and the testing machine was the same, no oscillations were observed on the averaged temporal shapes. Regarding the behaviour b) it can be noted that while in [34] the tail of the normalized temporal shapes at fixed area followed eqn. (2) (, ) with exponent 2, as expected, for Ni2MnGa [34] or in Ni49Fe18Ga27Co6 [26,34], here an exponent of about 1 can be obtained (see Figure 11). This latter value is similar to the exponent obtained in [32] where it was mentioned that it can be related to the absorption of the acoustic signals [26,32] characterized by an type function. From such a fit attenuation time can be estimated which is in reasonable agreement with data obtained from AE experiments in BaTiO3 (τa=20μs) [27] and from AE plastic deformation of Sn [56] (τa=50-90μs). However, in [32] it was also discussed as a still open question, that the presence of slower decay in the tail region can also be related to the contribution of sub-avalanches. This can lead to Omori-type decay (postseismic slip), observed in earthquakes [57]): with Figure 12 shows the versus plot and it can be seen that it can also be fitted with a straight line and the slope of this is p=0.91. Deciding between the above two possible explanations calls for further investigations.
5. Conclusions
- It is shown that, after SIM aging, there is a well detectable acoustic emission activity during rubber like deformation (up to about 15%) of Ni51Fe18Ga27Co4 single crystals
- The observed large AE activity at the beginning of unloading plateau on the stress-stain curve and the observed large AE asymmetry for loading and unloading, is attributed to difficulties in the re-nucleation of SIM aged martensite variant.
- The characteristic exponents, calculated either from all data points, or from the separation of the two types of AE signals (belonging to re-nucleation of the SIM aged variant as well as to re-orientations of the competing variants) are the same within the error bars
- Normalized universal temporal shapes of avalanches for fixed area, using the amplitude, A, and scaling parameters (i.e. the versus plots), were very well scaled together, with ϕ values obtained from the and cross-correlation exponents. The tail of this function decays slower by a smaller exponent than the theoretically predicted one, which can be attributed to either intrinsic absorption of AE signals and/or to overlap of sub-avalanches.
Author Contributions
Conceptualization, D.L.B. and L.D.; methodology, L.D., E.P, Y.I.C. and S.M.K.; software, L.Z.T.; validation, D..L.B. E.P, Y.I.C, L.D. and L.Z.T.; formal analysis, D.L.B., L.D., LZ.T.; investigation, L.D. and S.M.K.; data curation, L.D. and L.Z. ; writing—original draft preparation, D.L.B. and L.D.; writing—review and editing, D.L.B. and L.D.; visualization, L.D.; supervision, D.L.B. and L.D. All authors have read and agreed to the published version of the manuscript.
Funding
This research was supported by the Ministry of Science and Higher Education of the Russian Federation, project No FSWM-2024-0007.
Data Availability Statement
The data that support the finding of this study are available from the corresponding author upon reasonable request.
Conflicts of Interest
The authors declare no conflicts of interest.
References
- Otsuka, K.; Wayman, C.M.; Shape memory materials. Cambridge University Press, Cambridge, UK,1999.
- Miura, S.; Maeda, S.; Nakanishi, N. Pseudoelasticity in Au-Cu-Zn thermoelastic martensite, Phil. Mag. 1974, 30:3, 565-581. [CrossRef]
- Murakami, Y.; Nakajima, Y.; Otsuka, K.; Ohba, T,; Matsuo, R.; Ohshima K. Characteristics and mechanism of martensite ageing effect in Au-Cd alloys, Mat. Sci. and Eng. 1997, A237, 87-101. [CrossRef]
- Ren, X,; Otsuka, K.; Origin of rubber-like behaviour in metal alloys, Nature 1997, 389/9, 579-582. [CrossRef]
- Likhachev A.A; Sozinov, A.; Ullakko, K. Different modeling concepts of magnetic shape memory and their comparison with some experimental results obtained in Ni–Mn–Ga, Mat. Sci. and Eng. 2004, A378, 513-518. [CrossRef]
- Beke, D.L.; Daróczi, L.; Shamy, N.M.; Tóth, L.Z.; Bolgár, M.K. On the thermodynamic analysis of martensite stabilization treatments, Acta Mater. 2020, 200, 490-501. [CrossRef]
- Ahlers, M.; Pellegrina J.L. Ageing of martensite: stabilisation and ferroelasticity in Cu-based shape memory alloys, Mater. Sci. Eng. 2003, A356, 298–315. [CrossRef]
- Suzuki, T.; Kojima, R.; Fujii Y.; Nagasawa A. Reverse transformation behaviour of the stabilized martensite in CuZnAl alloy, Acta Metall. 1989, 37, 163–168. [CrossRef]
- Kustov, S,; Pons J.; Cesari E.; van Humbeeck J. Chemical and mechanical stabilization of martensite, Acta Mater. 2004, 52, 4547–4559. [CrossRef]
- Niendorf, T.; Krooβ, P.; Somsen C.; Eggeler G.; ChumlyakovY.I.; Maier H.J. Martensite aging –avenue to new high temperature shape memory alloys, Acta Mater. 2015, 89, 298–304. [CrossRef]
- Panchenko, E.; Timofeeva, E.; Eftifeeva, A,; Osipovich, S.; Surikov, N.; Chumlyakov, Y.; Gerstein, G.; Maier, H.J. Giant rubber-like behavior induced by martensite aging in Ni51Fe18Ga27Co4 single crystals. Scripta Materialia 2019, 162, 387–390. [CrossRef]
- Panchenko, E.Yu; Timofeeva, E.E.; Chumlyakov, Y.I.; Osipovich, K.S.; Tagiltsev, A.I.; Gerstein, G.; Maier H.J., Compressive shape memory actuation response of stress-induced martensite aged Ni51Fe18Ga27Co4 single crystals. Mat. Sci. & Eng. 2019, A746, 448–455. [CrossRef]
- Morito, H.; Fujita A.; Oikawa K.; Ishida K.; Fukamichi K.; Kainuma, R. Stress assisted magnetic-field-induced strain in Ni-Fe-Ga-Co ferromagnetic shape memory alloys, Appl. Phys. Lett. 2007, 90, 062505. [CrossRef]
- Otsuka, K.; Ren, X. Recent developments in the research of shape memory alloys, Intermetallics 1999, 7, 511-528. [CrossRef]
- Daróczi, L.; Gyöngyösi, S.; Tóth, L.Z.; Szabó, S.; Beke D.L. Jerky magnetic noises generated by cyclic deformation of martensite in Ni2MnGa single crystalline shape memory alloys, Appl. Phys. Lett. 2015, 106, 041908. [CrossRef]
- Daróczi L.; Gyöngyösi, S.; Tóth, L.Z.; Beke D.L., Effect of the martensite twin structure on the deformation induced magnetic avalanches in Ni2MnGa single crystalline samples Scr. Mater. 2016, 114, 161-164. [CrossRef]
- Bronstein, E.; Tóth, LZ.; Daróczi L.; Beke D.L.; Talmon R.; Shilo D.; Tracking Twin Boundary Jerky Motion at Nanometer and Microsecond Scales, Adv. Funct. Mater. 2021, 31, 2106573. [CrossRef]
- Perevertov, A.; Sevcik, M.; Heczko O. Correlation between Acoustic Emission and Stress Evolution during Single Twin Boundary Motion in Ni-Mn-Ga Magnetic Shape Memory Single Crystal, Phys, Status Solidi, RRL 2022, 17, 2200245. [CrossRef]
- Vives, E.; Soto-Parra, D.; Manosa, L.; Romero R.; Planes A. Driving-induced crossover in the avalanche criticality of martensitic transitions Phys. Rev. B 2009, 80, 180101. [CrossRef]
- Beke, D.L.; Daróczi, L.; Tóth, L.Z.; Kalmárné Bolgár, M.; Samy, N.M.; Hudák, A., Acoustic Emissions during Structural Changes in Shape Memory Alloys, Metals 2019, 9, 58; https://. [CrossRef]
- Setna, J.P.; Dahmen, K.A.; Myers, C.R. Crackling noise. Nature 2001, 410, 242–250. [CrossRef]
- Kuntz, M.C.; Setna, J.P. Noise in disordered systems: The power spectrum and dynamic exponents in avalanche models. Phys. Rev. B 2000, 62, 11699. [CrossRef]
- LeBlanc, M.; Angheluta, L.; Dahmen, K.; Goldenfeld, N., Universal fluctuations and extreme statistics of avalanches near the depinning transition. Phys. Rev. E 2013, 87, 022126. [CrossRef]
- Papanikolaou, S.; Bohn, F.; Sommer, R.L.; Durin, G.; Zapperi, S.S.; Setna, J.P. Universality beyond power laws and the average avalanche shape. Nat. Phys. 2011, 7, 316–320. [CrossRef]
- Laurson, L.; Illa, X.; Santucci, S.; Tallakstad, K.T.; Maloy, K.J.; Alava, M.J. Evolution of the average avalanche shape with the universality class. Nat. Commun. 2013, 4, 2927. [CrossRef]
- Kamel, S.M.; Samy, N.M.; Tóth, L.Z.; Daróczi, L.; Beke, D.L. Denouement of the Energy-Amplitude and Size-Amplitude Enigma for Acoustic-Emission Investigations of Materials. Materials 2022, 15, 4556. [CrossRef]
- Casals, B.; Dahmen, K.A.; Gou, B.; Rooke, S.; Salje, E.K.H. The duration-energy-size enigma for acoustic emission. Sci. Rep. 2021, 11, 5590. [CrossRef]
- Spark, G.; Maas, R. Shapes and velocity relaxation of dislocation avalanches in Au and Nb microcrystals. Acta Mater. 2018, 152, 86–95. [CrossRef]
- Planes, A.; Manosa, L; Vives, E.; J. Alloys Compd. Acoustic emission in martensitic transformations2013, 577, S699-S704. [CrossRef]
- Dobrinevski, A.; Le Doussal, P.; Wiese, K. J. Statistics of avalanches with relaxation and Barkhausen noise: a solvable model. Phys. Rev. E, 2013, 88, 032106. [CrossRef]
- Dobrinevski, A.; Le Doussal, P.; Weise, K.J. Avalanche shape and exponents beyond mean-field theory. EPL 2015, 108, 66002. [CrossRef]
- Chi-Cong, Vu.; Weiss, J. Asymmetric Damage Avalanche Shape in Quasibrittle Materials and Subavalanche (Aftershock) Clusters. Phys. Rev. Lett. 2020, 125, 105502. [CrossRef]
- Antonaglia, J.; Wright, W.J.; Gu, X.; Byer, R.R.; Hufnagel, T.C.; LeBlanc, M.; Uhl, J.T.; Dahmen, K.A. Bulk metallic glasses deform via avalanches. Phys. Rev. Lett. 2014, 112, 1555501. [CrossRef]
- Tóth, L.Z.; Bronstein, E.; Daróczi, L.; Shilo, D.; Beke D.L. Scaling of average avalanche shapes for acoustic emission during jerky motion of single twin boundary in single-crystalline Ni2MnGa, Materials, 2023, 16, 2089. [CrossRef]
- Kamel, S.M.; Daróczi, L.; Tóth, L.Z.; Panchenko, E.Y.; Chumlyakov, Y.I.; Samy, N.M.; Beke D.L. Acoustic emission and DSC investigations of anomalous stress-stain curves and burst like shape recovery of Ni49Fe18Ga27Co6 shape memory single crystals, Intermetallics 2023, 159, 107932. [CrossRef]
- Bolgár, M.K.; Tóth, L.Z.; Szabó, S.; Gyöngyösi, S.; Daróczi, L.; Panchenko, E.I.; Chumlyakov, Y.I; Beke D.L. Thermal and acoustic noises generated by austenite/martensite transformation in NiFeGaCo single crystals.J. Alloys Compd. 2016, 658, 29–35. [CrossRef]
- Tóth, L.Z. Daróczi, L.; Szabó, S.; Beke, D.L. Simultaneous investigation of thermal, acoustic, and magnetic emission during martensitic transformation in single-crystalline Ni2MnGa, Phys. Rev. 2017, B93, 144108. [CrossRef]
- Clauset, A.; Shalizi, C.R.; Newman, M.E. Power-Law Distributions in Empirical Data. SIAM Rev. 2009, 51, 661–703. http://www.jstor.org/stable/25662336.
- Beke, D.L.; Bolgar, M.K.; Toth, L.Z.; Daroczi L., On the asymmetry of the forward and reverse martensitic transformations in shape memory alloys, J. Alloys Compd. 2018, 741, 106–115. [CrossRef]
- Otsuka, K.; Ren, X,; Mechanism of martensite aging effects and new aspects, Mater. Sci. Eng. 2001, A312, 207–218. [CrossRef]
- Timofeeva, .E..; Panchenko, E. Yu.; Tokhmetova, A.B.; Eftifeeva, A.B.; Chumlyakov, Yu.I; Volochaev, M.N.; The cyclic stability of rubber-like behaviour in stress-induced martensite aged Ni49Fe18Ga27Co6 (at.%) single crystals, Mat. Lett. 2021, 300, 130207. [CrossRef]
- Li, J.; Zhang, J.-z.; Zeng, L.-y.; Wang, S.; Song, X.-y.; Chen, N.-l.; Zuo, X.-w.; Rong, Y.-h. Revealing dislocation activity modes 980 during yielding and uniform deformation of low-temperature tempered steel by acoustic emission. Journal of Iron and Steel 981 Research International 2024. [CrossRef]
- Ozgowicz, W.; Grzegorczyk, B.; Pawełek, A.; Pia̧tkowski, A.; Ranachowski, Z. The Portevin - Le Chatelier effect and acoustic 923 emission of plastic deformation CuZn30 monocrystals. Arch Metall Mater 2014, 59, 183-188. [CrossRef]
- Zhao, Y.; Ding, X.; Sun J.; Salje, E.K.H. Thermal and athermal crackling noise in ferroelastic nanaostuctures, J of Phys. Condens Matter 2014, 26, 142201. [CrossRef]
- Nataf G.; Salje, E.K.H. Avalanches in ferroelectric and coelastic materials: Phase transition, domain switching and propagation, Feroelectrics, 2020, 569, 82-107. [CrossRef]
- Zreihan N.; Faran E.; Vives E.; Planes A.; Shilo D. Coexistence of a well-determined kinetic law and a scale-invariant power law during the same physical process. Phys. Rev. B 2018, 97, 014103. [CrossRef]
- Zreihan N.; Faran E.; Vives E.; Planes A.; Shilo D. Relations between stress drops and acoustic emission measured during mechanical loading. Phys. Rev. Mater, 2019, 3, 043603. [CrossRef]
- Daróczi, L.; Piros, E.; Tóth, L.Z.; Beke, D.L. Magnetic field induced random pulse trains of magnetic and acoustic noises in martensitic single-crystal Ni2MnGa. Phys. Rev. B 2016, 96, 014416. [CrossRef]
- Daróczi, L.; Hudák, A.; Tóth, L.Z.; Beke, D.L. Investigation of magnetic and acoustic emission during stress induced superplastic deformation of martensitic Ni2MnGa single crystal. In Proceedings of the 11th European Symposium on Martensitic Transformations, ESOMAT 2018, Section 5 No. 142, Metz, France, 27–31 August 2018.
- Samy, N.M.; Bolgár, M.K.; Barta N.;, Daróczi, L.; Tóth, L.Z.; Chumlyakov Y.I.; Karaman I.; Beke, D.L. Thermal, acoustic and magnetic noises emitted during martensitic transformation in single crystalline Ni45Co5Mn36.6In13.4 meta-magnetic shape memory alloy, J of Alloys and Comp. 2019, 778, 669-680. [CrossRef]
- Chen, Y.; Gou, B.; Yuan, B.; Ding, X.; Sun, J.; Salje, E.K.H. Multiple Avalanche Processes in Acoustic Emission Spectroscopy: Multibranching of the Erenergy-Amplitude Scaling, Phys. Stat. Sol. B 2021 2100465. [CrossRef]
- Chen, Y.; Gou, B.; Ding, X.; Sun, J.; Salje, E.K.H.; Fine structure of acoustic emission spectra: How to separate dsiclocation movements and entanglements in 316L stainless steel, Appl. Phy. Lett. 2020, 117, 262901. [CrossRef]
- Chen, Y.; Gou B.; Ding, X.; Sun, J.; Salje, E.K.H. Real-time monitoring dislocations, martensitic transfromations and detwinning in stainless steel: statistical analysis and mashine learning, J. Mat. Sci &Techn. 2021, 92, 31-39. [CrossRef]
- Chen, Y.; Gou, B,; Xu, X.; Ding, X.; Sun, J.; Salje E.K.H. Multibranches of acoustic emission as identifier for deformation mechanisms in additively manufactured 316L stainless steel, Additive Manufacturing 2023, 78, 103819. [CrossRef]
- McFaul, L.W.;Wright, W.J.;Sickle, J.; Dahmen, J.A., Force oscillations distort avalanche shapes, Mater. Res. Lett. 2019, 7, 456-502. [CrossRef]
- Tóth, L.Z.; Daróczi, L.; Elrasasi, T.Y.; Beke, D.L. Clustering Characterization of Acoustic Emission Signals Belonging to Twinning and Dislocation Slip during Plastic Deformation of Polycrystalline Sn. Materials 2022, 15, 6696. [CrossRef]
- Utsu, T.; Ogata, Y.; Matsu'ura, R.S. The Centenary of the Omori Formula for a Decay Law of Aftershock Activity, J. Phys. Earth, 1995, 43, 1-33. [CrossRef]
Figure 1.
(a) compression stress-strain curve; (b) stress (black), energy of acoustic emission signals (red) and the cumulative AE energy, , (blue) as a function of time (taken with 1.25x10⁻³ s-1 strain rate). Large acoustic activity and large jump in can be observed on the unloading curve.
Figure 1.
(a) compression stress-strain curve; (b) stress (black), energy of acoustic emission signals (red) and the cumulative AE energy, , (blue) as a function of time (taken with 1.25x10⁻³ s-1 strain rate). Large acoustic activity and large jump in can be observed on the unloading curve.
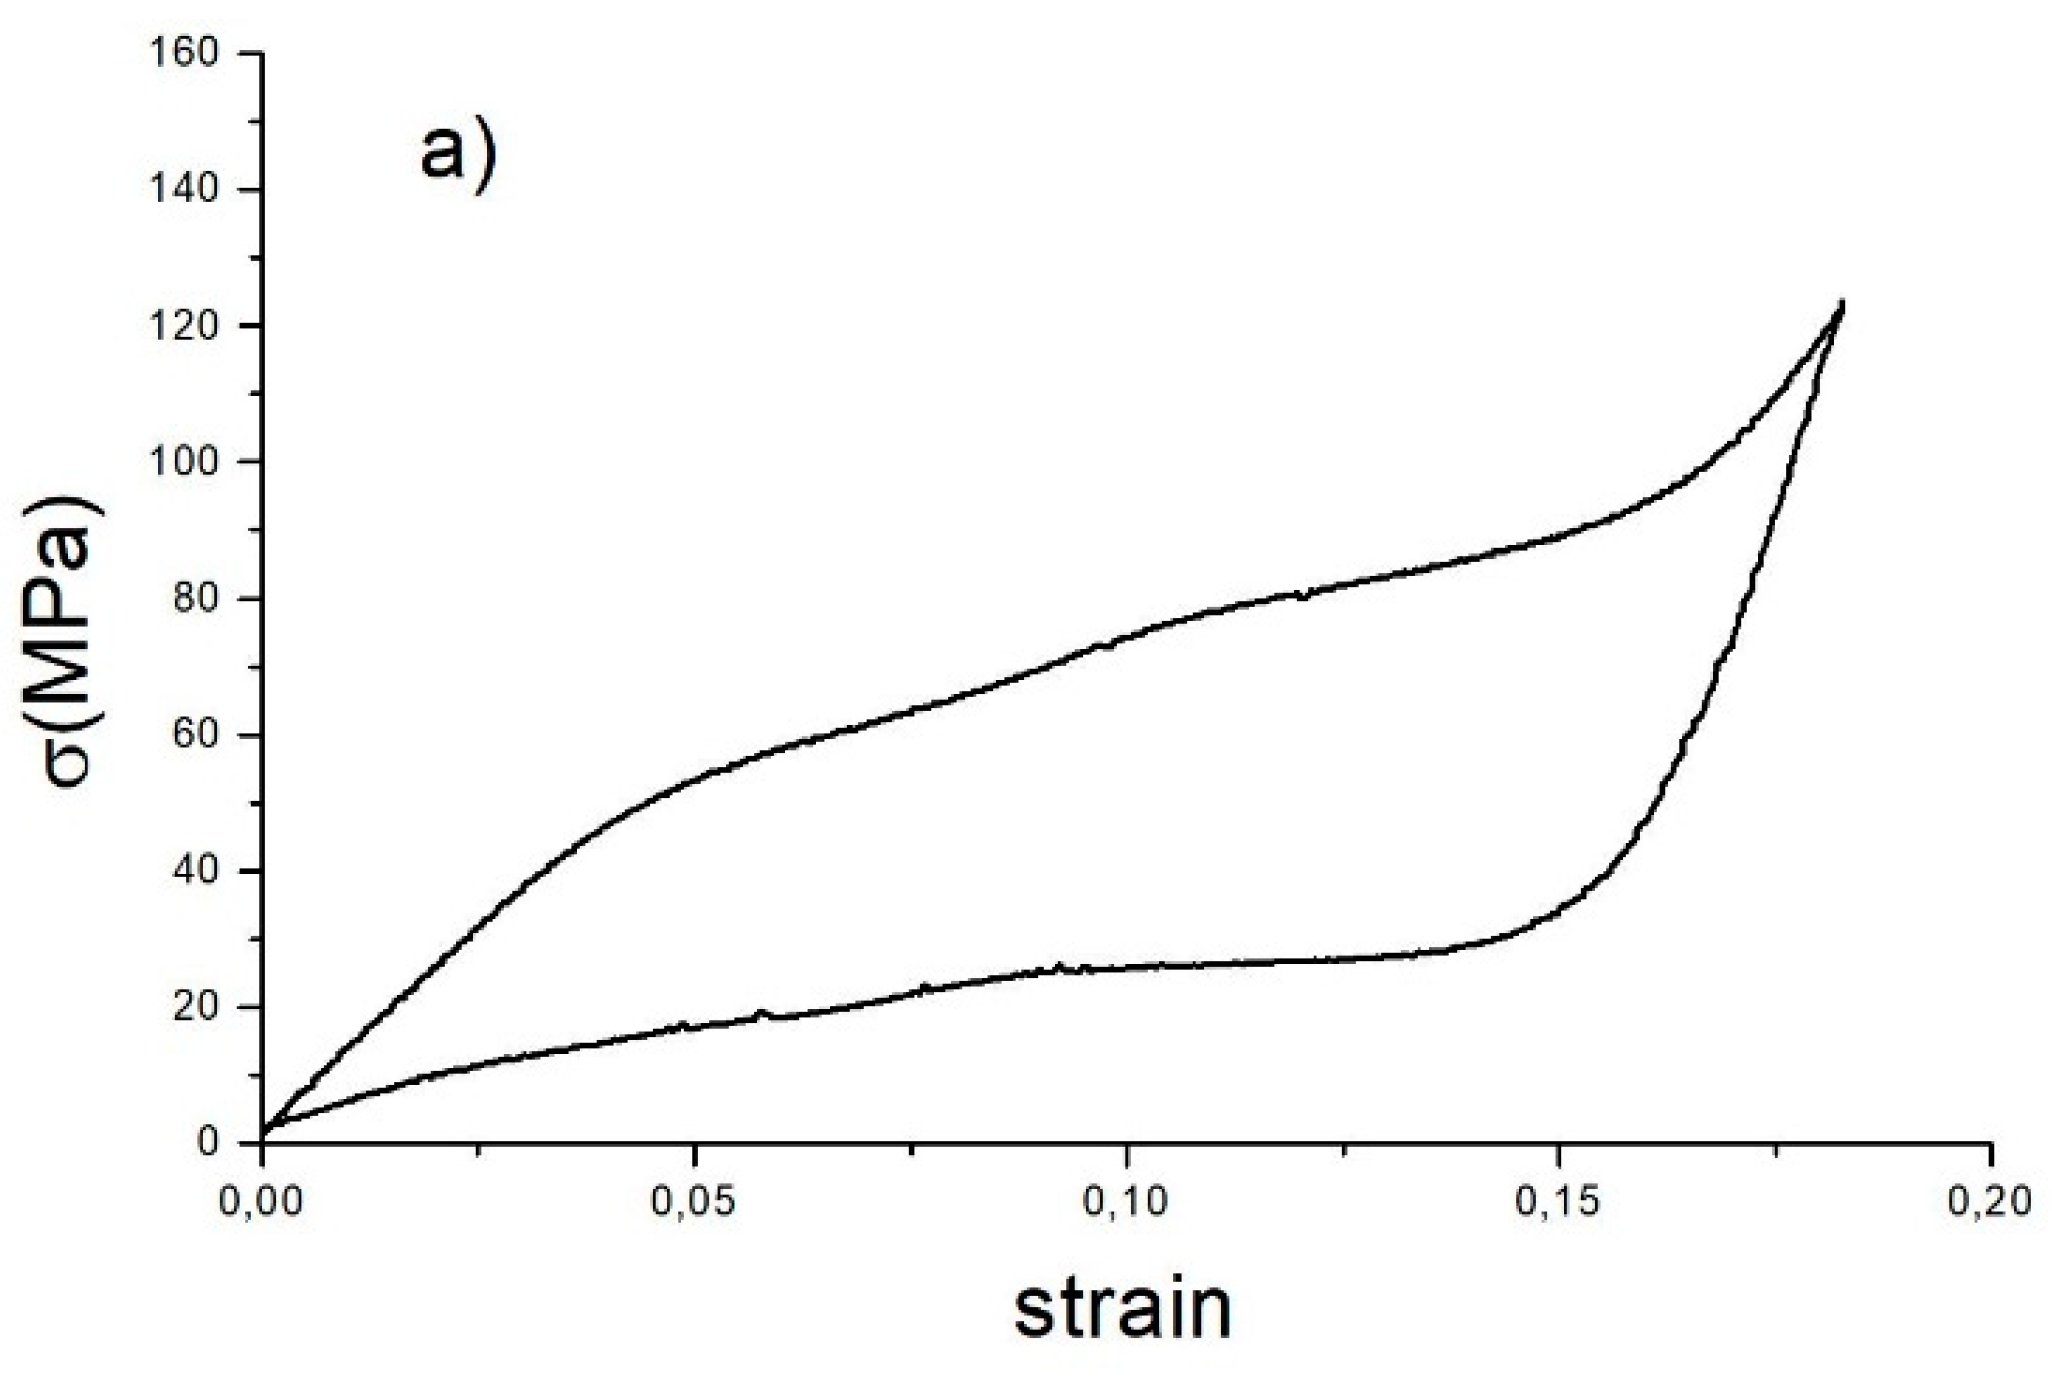
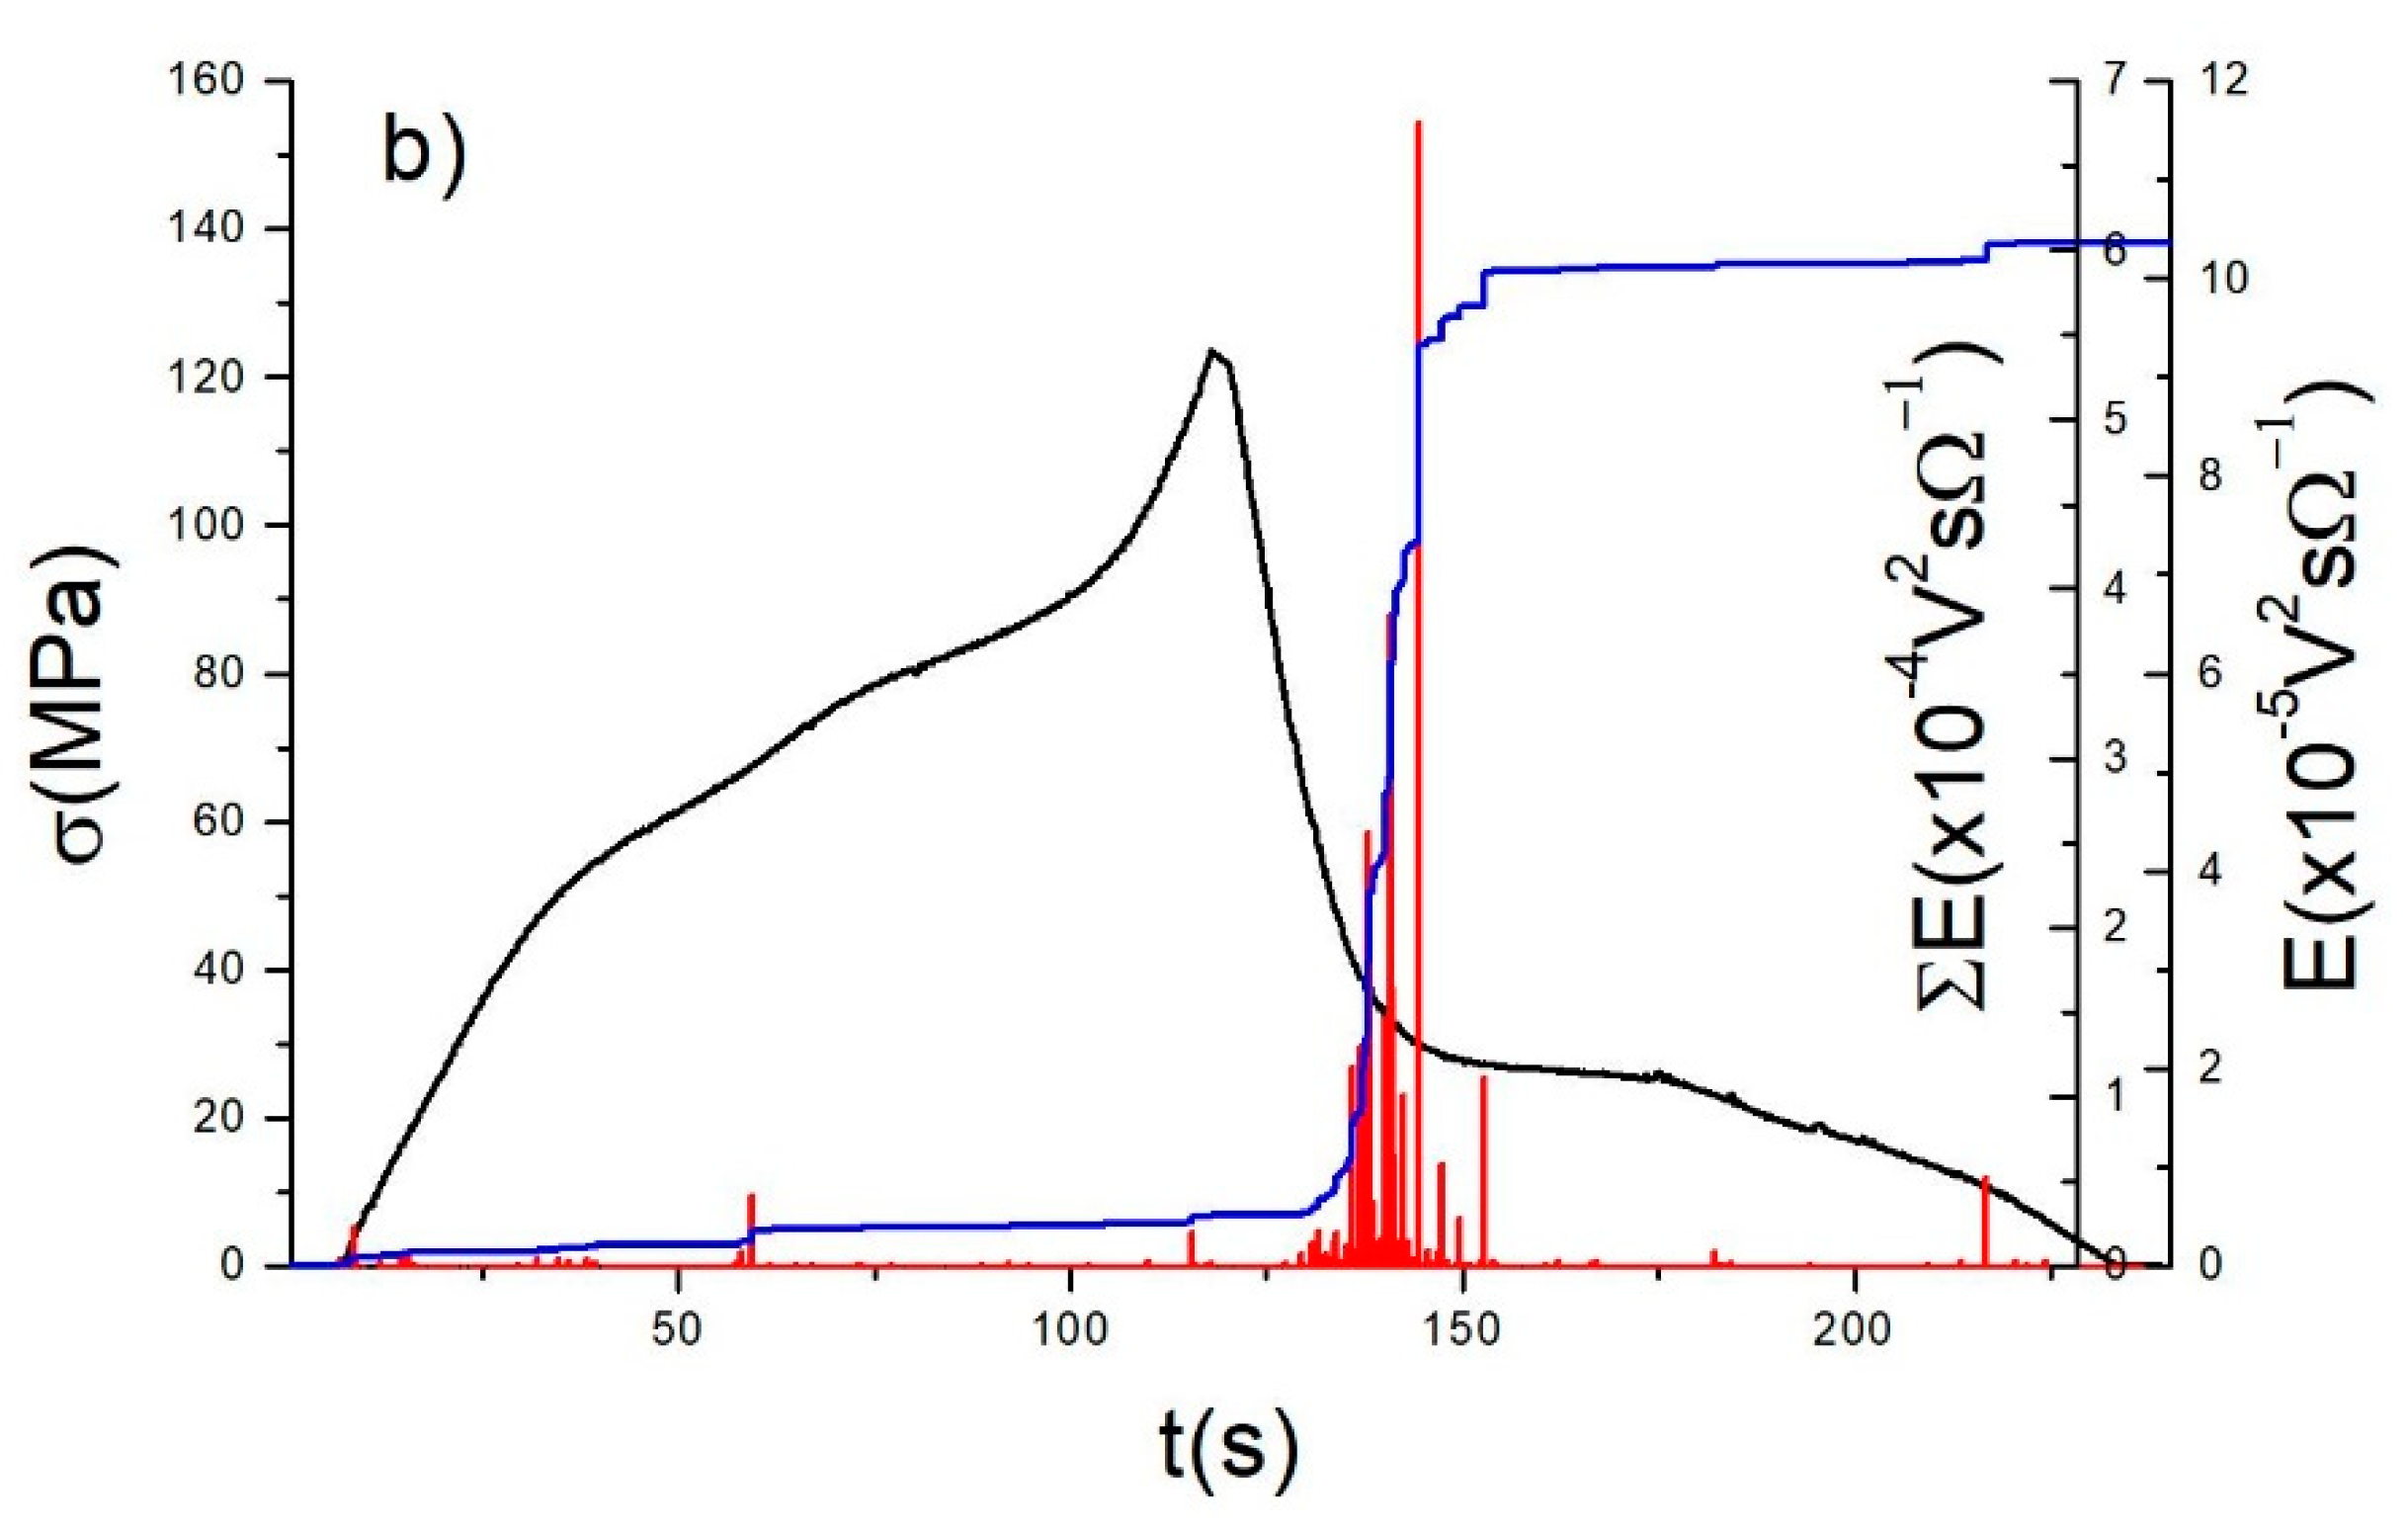
Figure 2.
Energy probability distribution density function of acoustic signals obtained during rubber like deformation (a). (b) shows the maximum likelihood fit for the exponent.
Figure 2.
Energy probability distribution density function of acoustic signals obtained during rubber like deformation (a). (b) shows the maximum likelihood fit for the exponent.
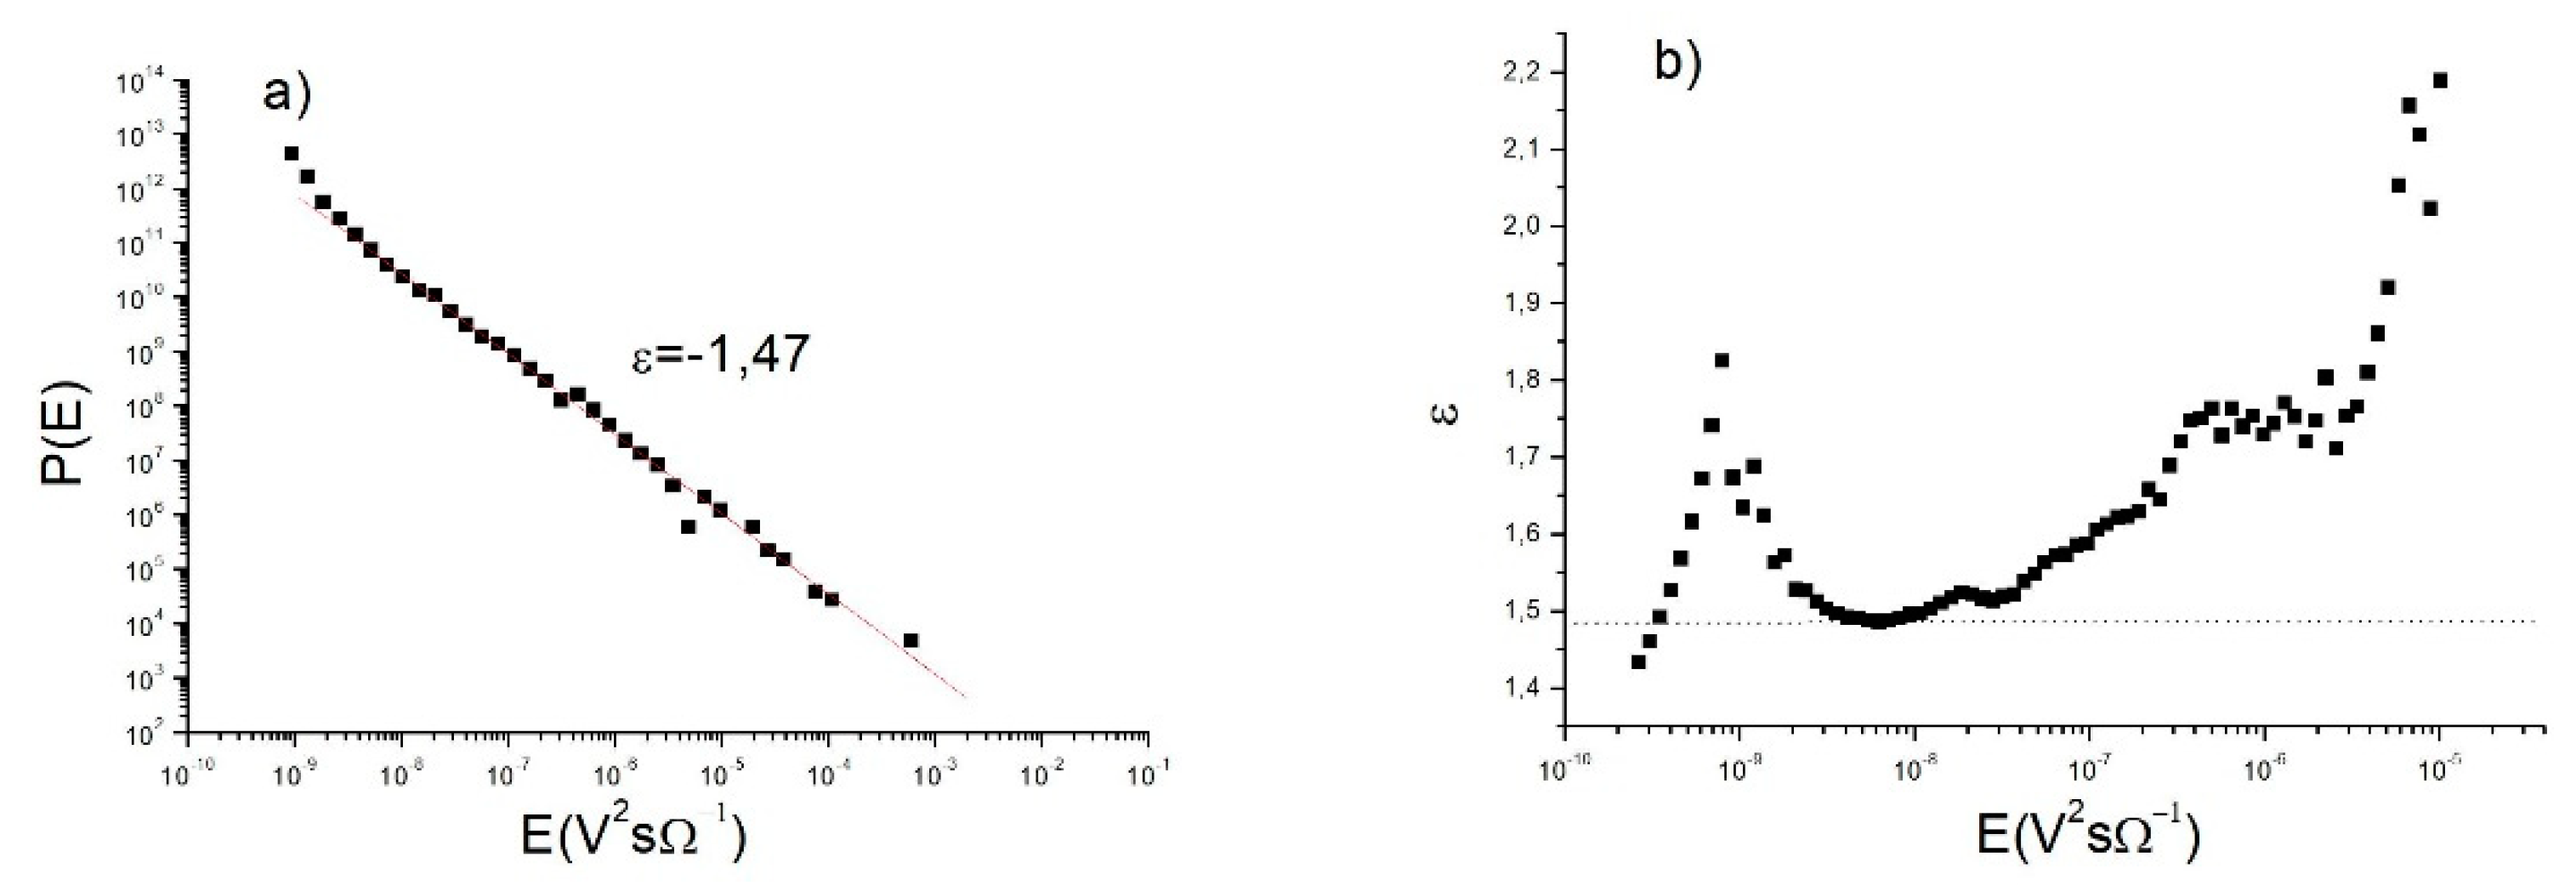
Figure 3.
LogE versus LogA. The insert shows the slope of the straight line fitted.
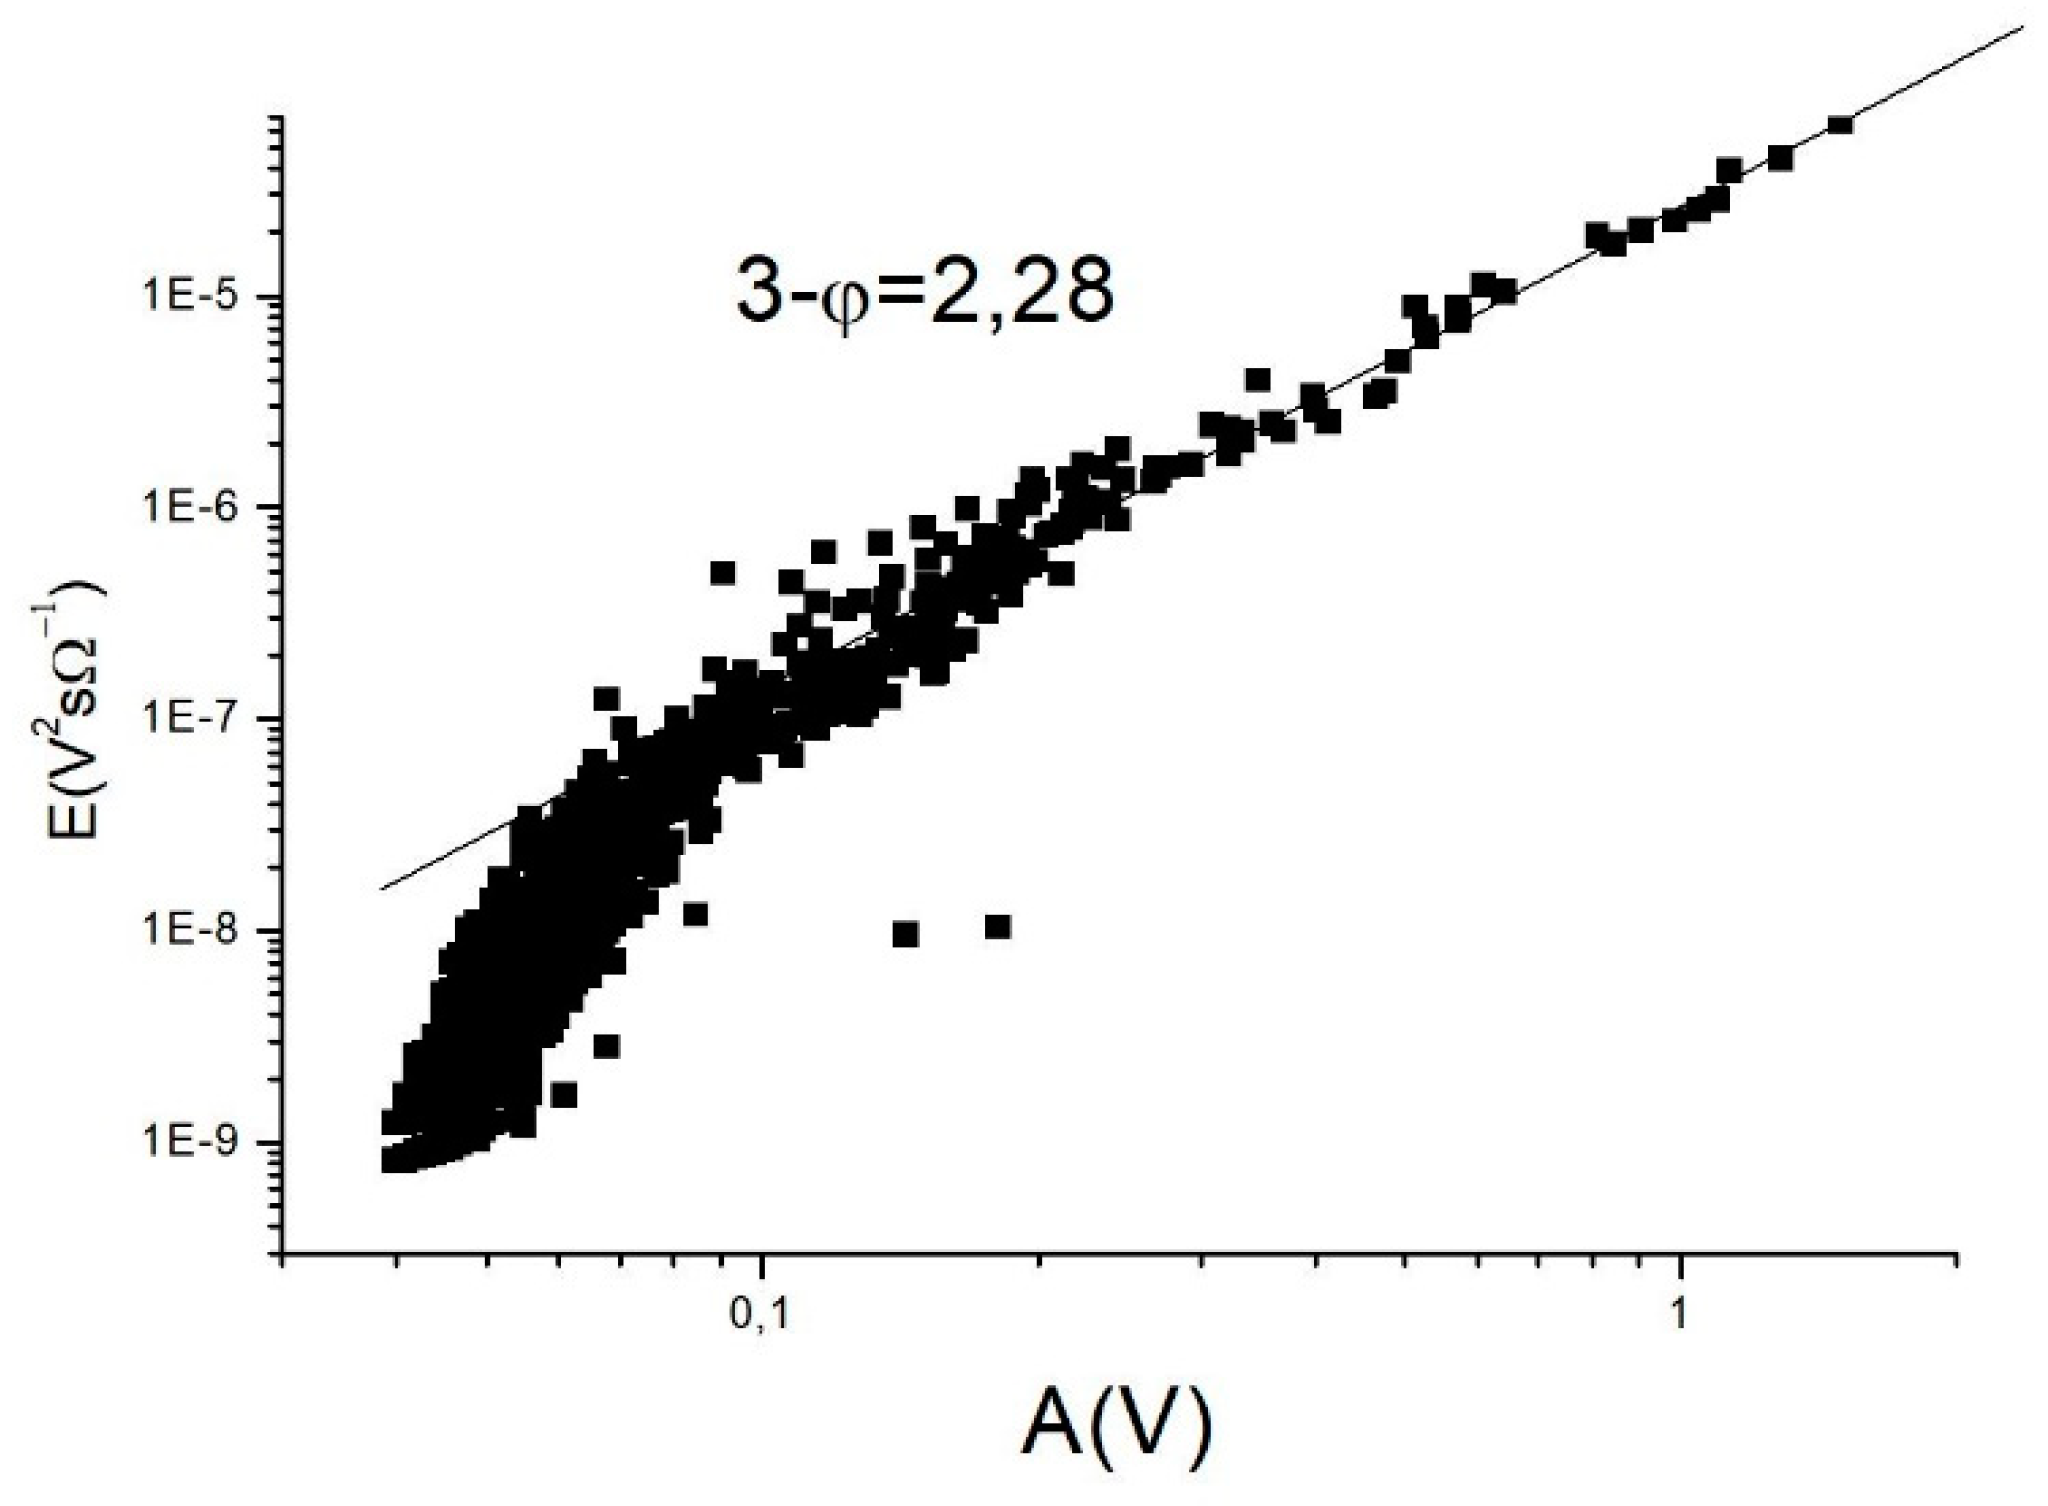
Figure 4.
LogS versus LogA. The insert shows the slope of the straight line fitted.
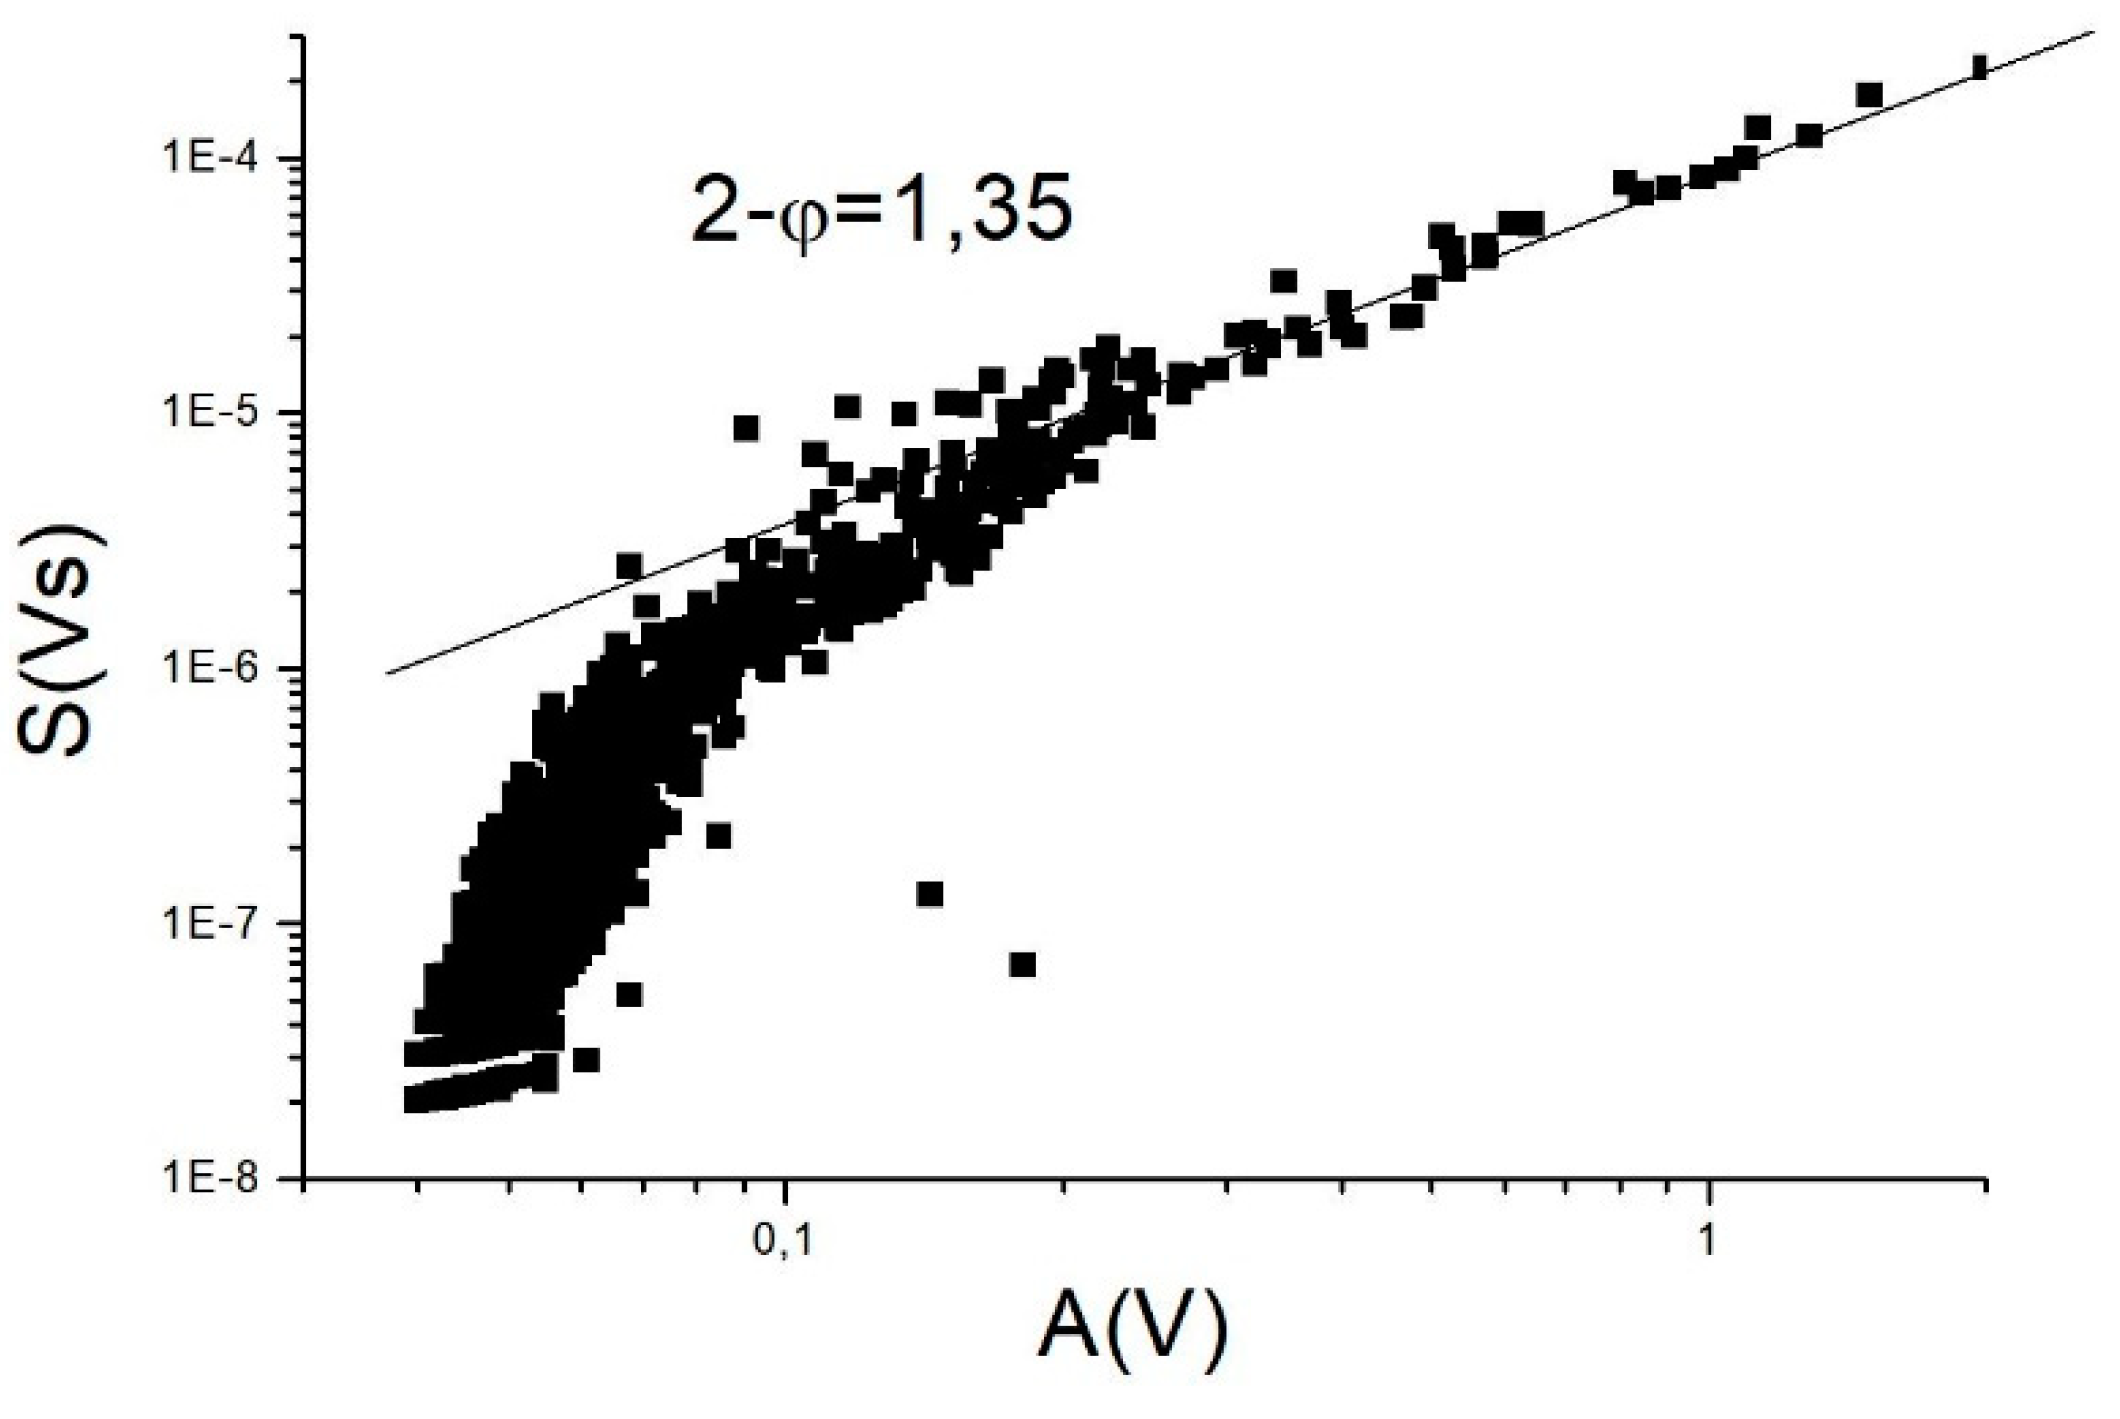
Figure 5.
Optical micrograph of the martensite structure: (a) original, V1, state with dominantly detwinned region, with minor residual twins, (b) twinned, reoriented,V2/V3, martensite and (c) the final state, which is equivalent to the initial state.
Figure 5.
Optical micrograph of the martensite structure: (a) original, V1, state with dominantly detwinned region, with minor residual twins, (b) twinned, reoriented,V2/V3, martensite and (c) the final state, which is equivalent to the initial state.
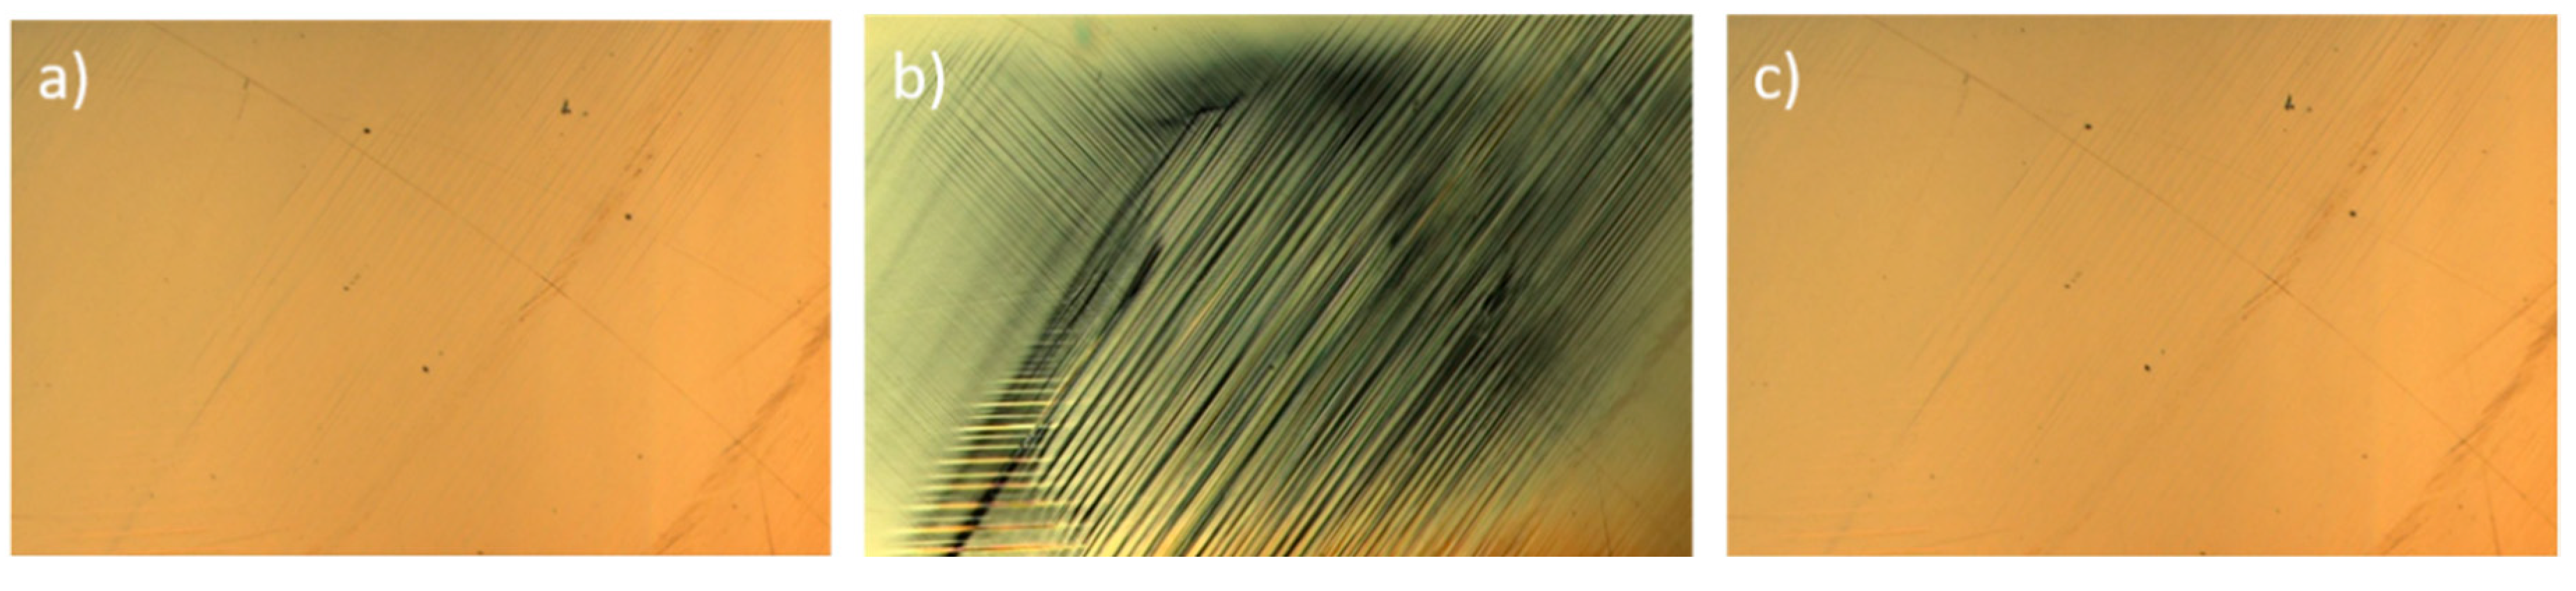
Figure 9.
Averaged AE signals in different size (area) ranges (the insert gives the centre values of S within which the averaging was made.
Figure 9.
Averaged AE signals in different size (area) ranges (the insert gives the centre values of S within which the averaging was made.
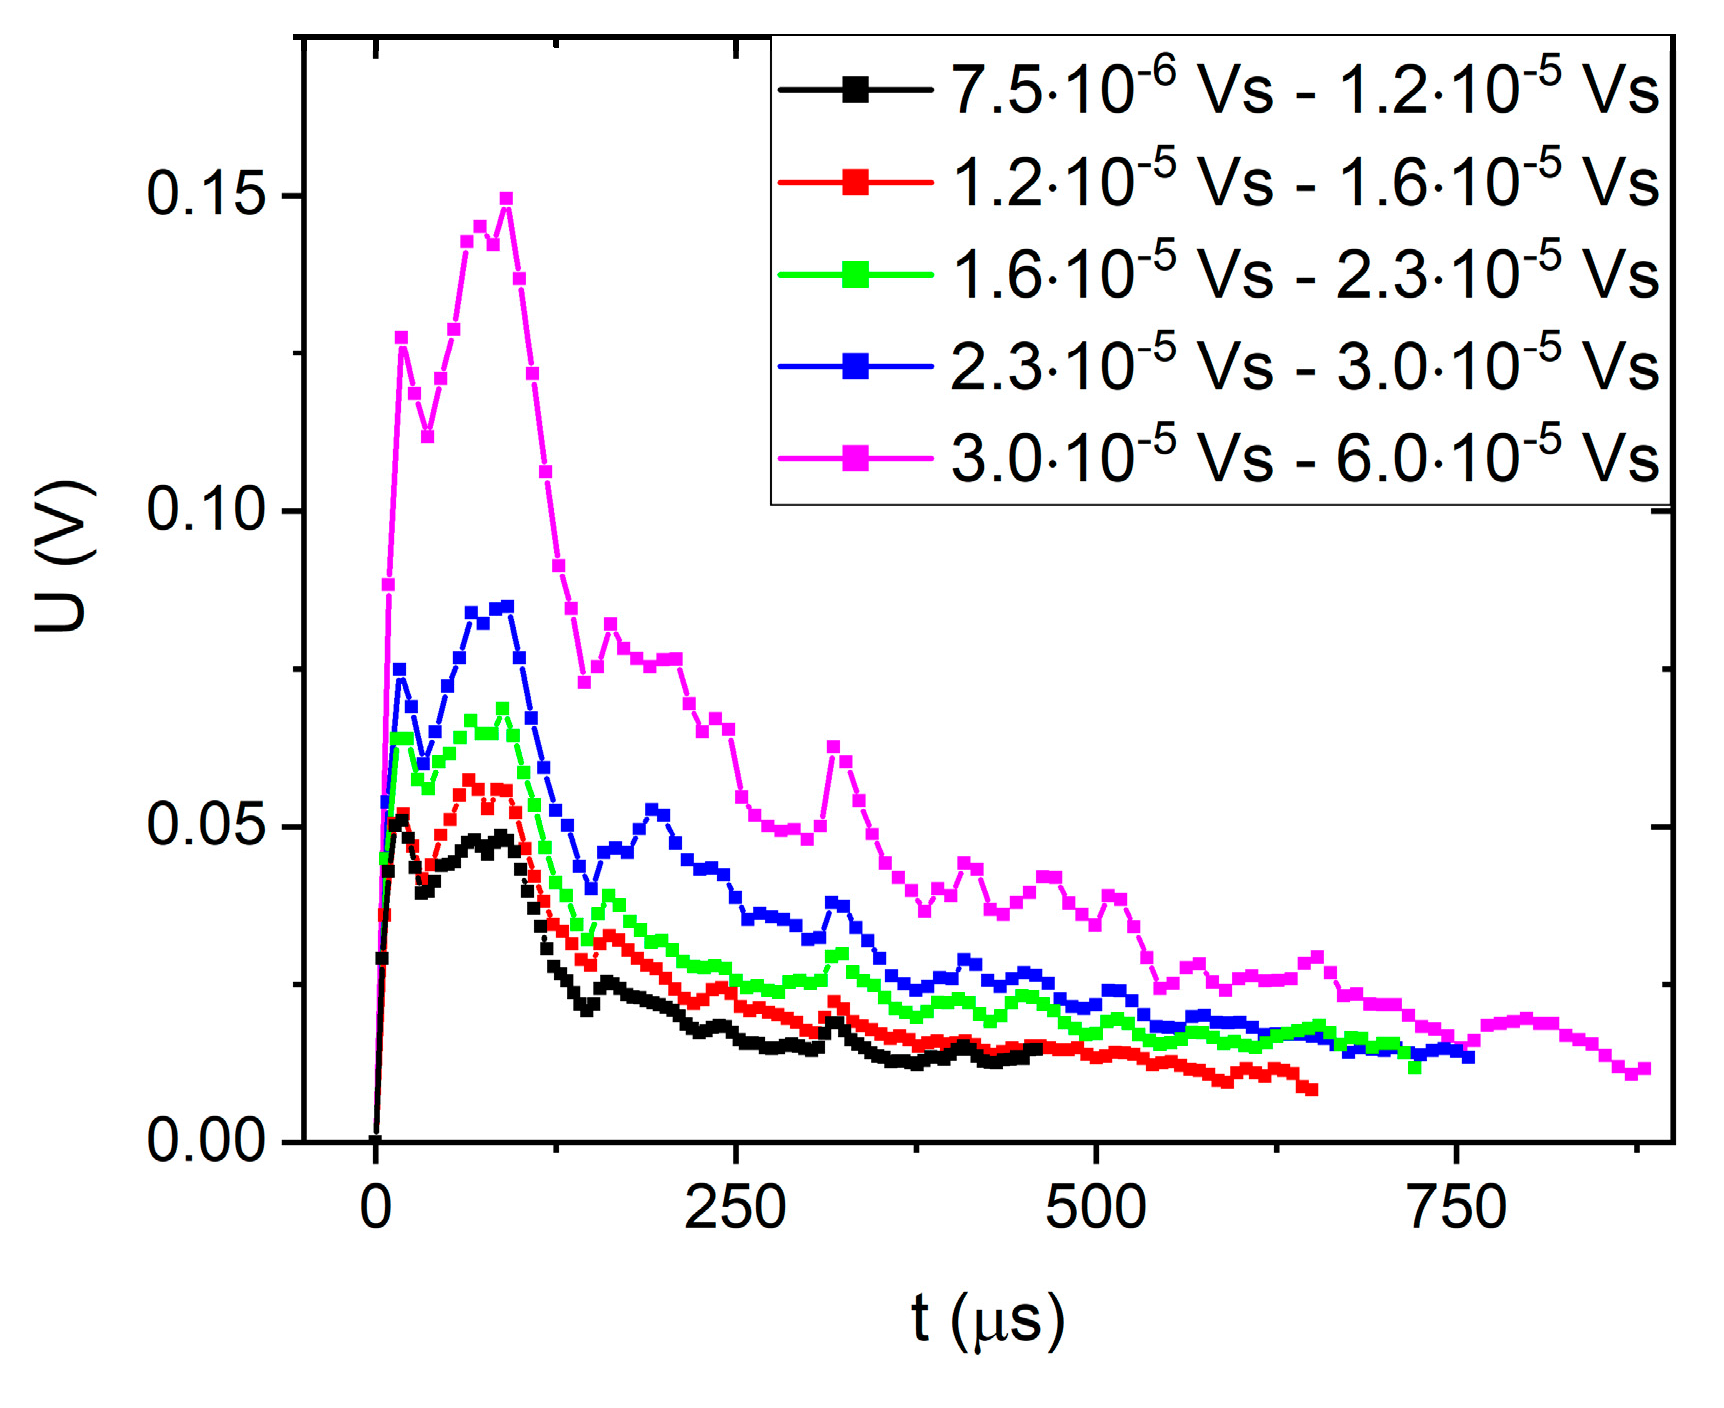
Figure 10.
Averaged AE signals after normalization the vertical and horizontal axes by Am and Am1-φ respectively.
Figure 10.
Averaged AE signals after normalization the vertical and horizontal axes by Am and Am1-φ respectively.
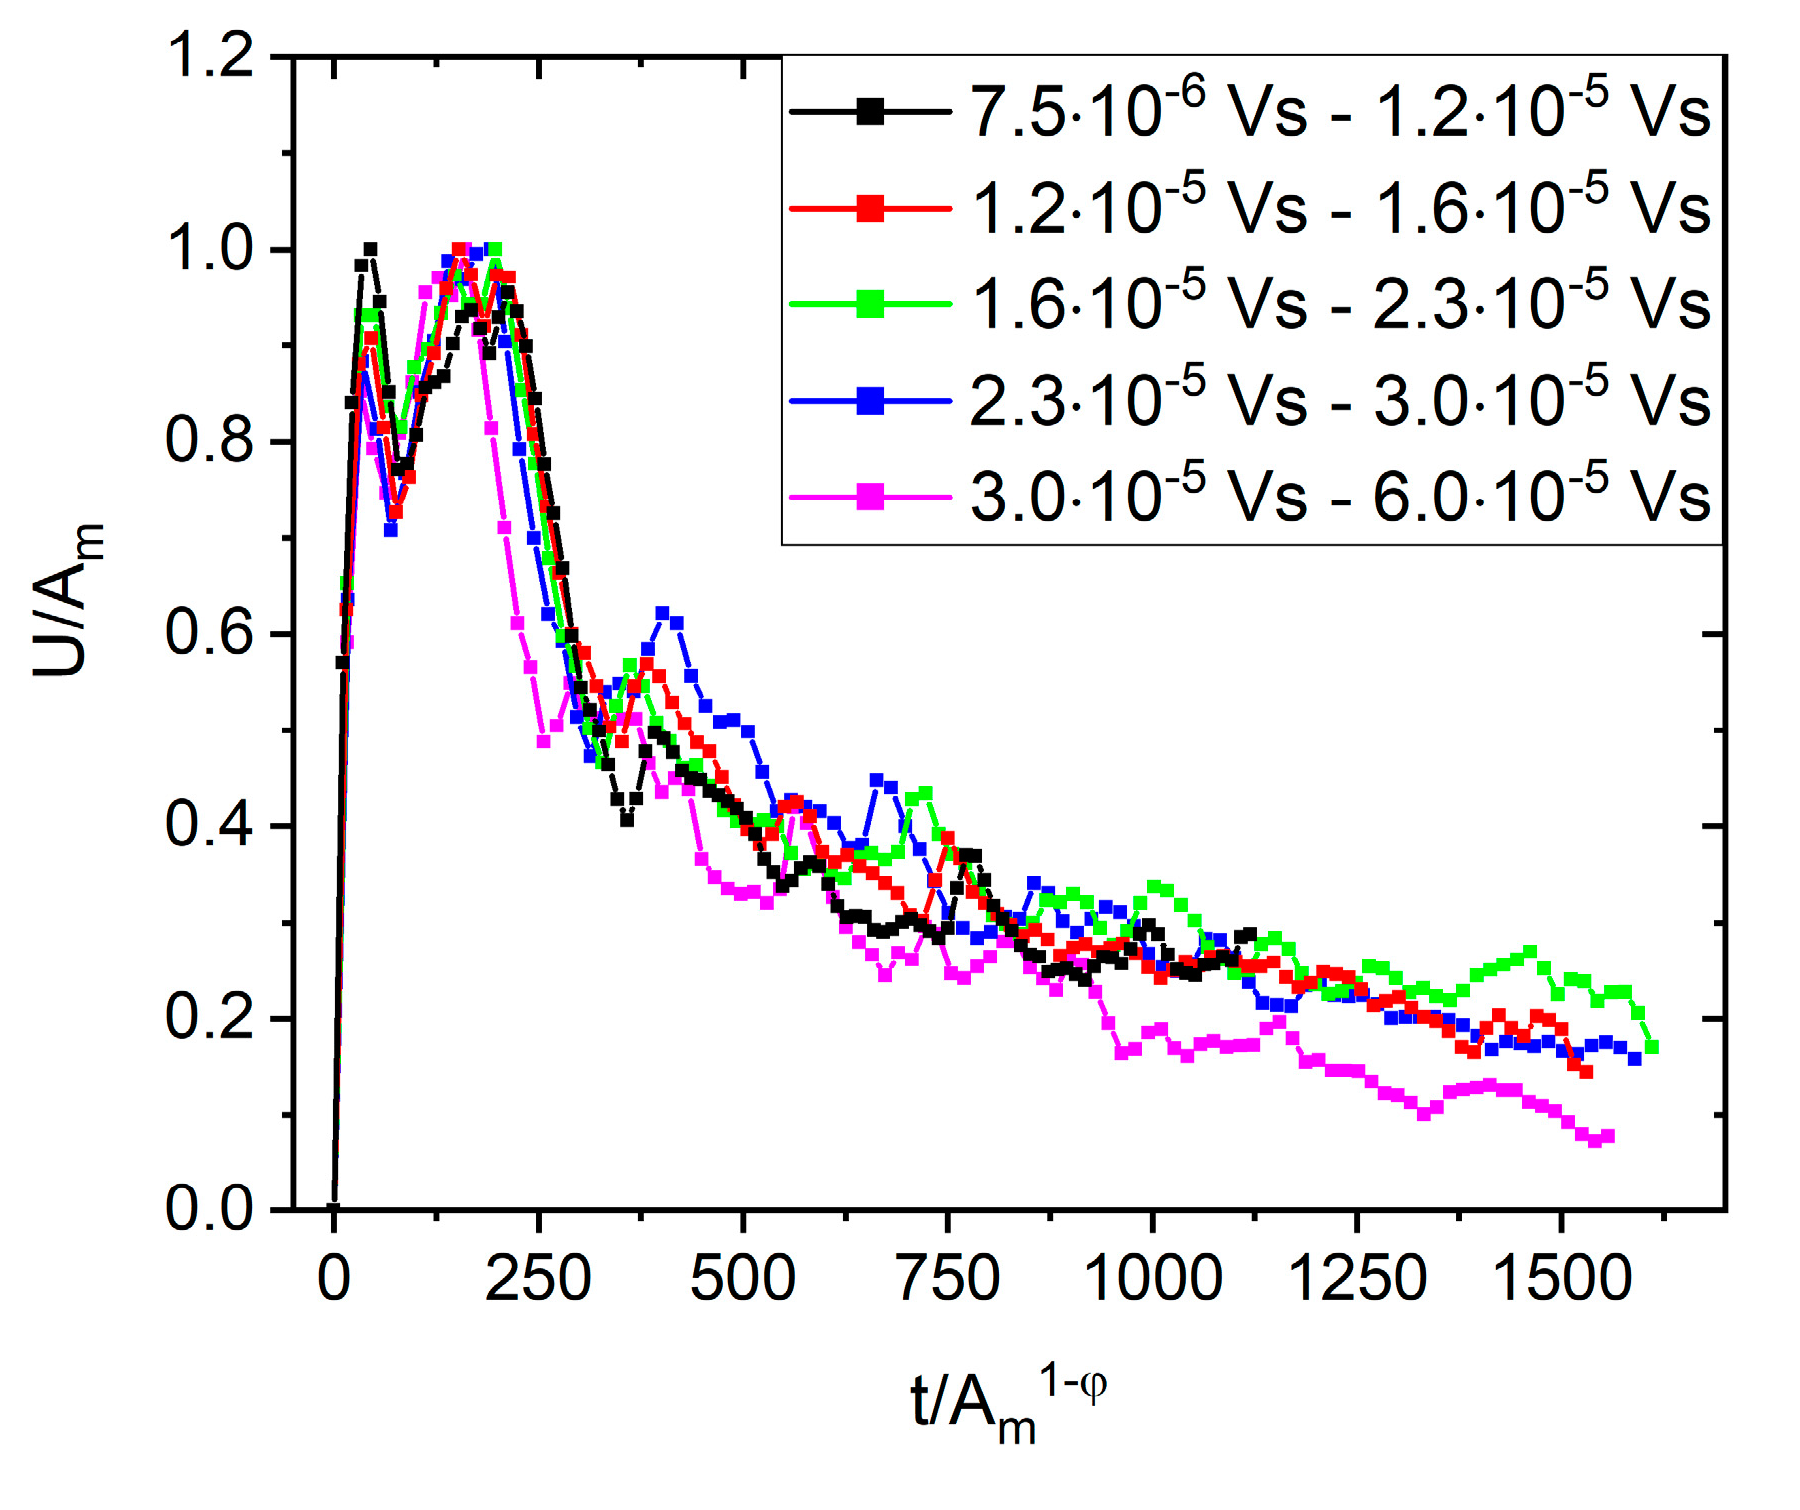
Figure 11.
Fitting the exponentially decaying tail of the curve on Figure 10 (and ): according to equation (2) (left) as well as by type function (right). It can be seen that the fit is better, and it yields τa≅ 150μs.
Figure 11.
Fitting the exponentially decaying tail of the curve on Figure 10 (and ): according to equation (2) (left) as well as by type function (right). It can be seen that the fit is better, and it yields τa≅ 150μs.
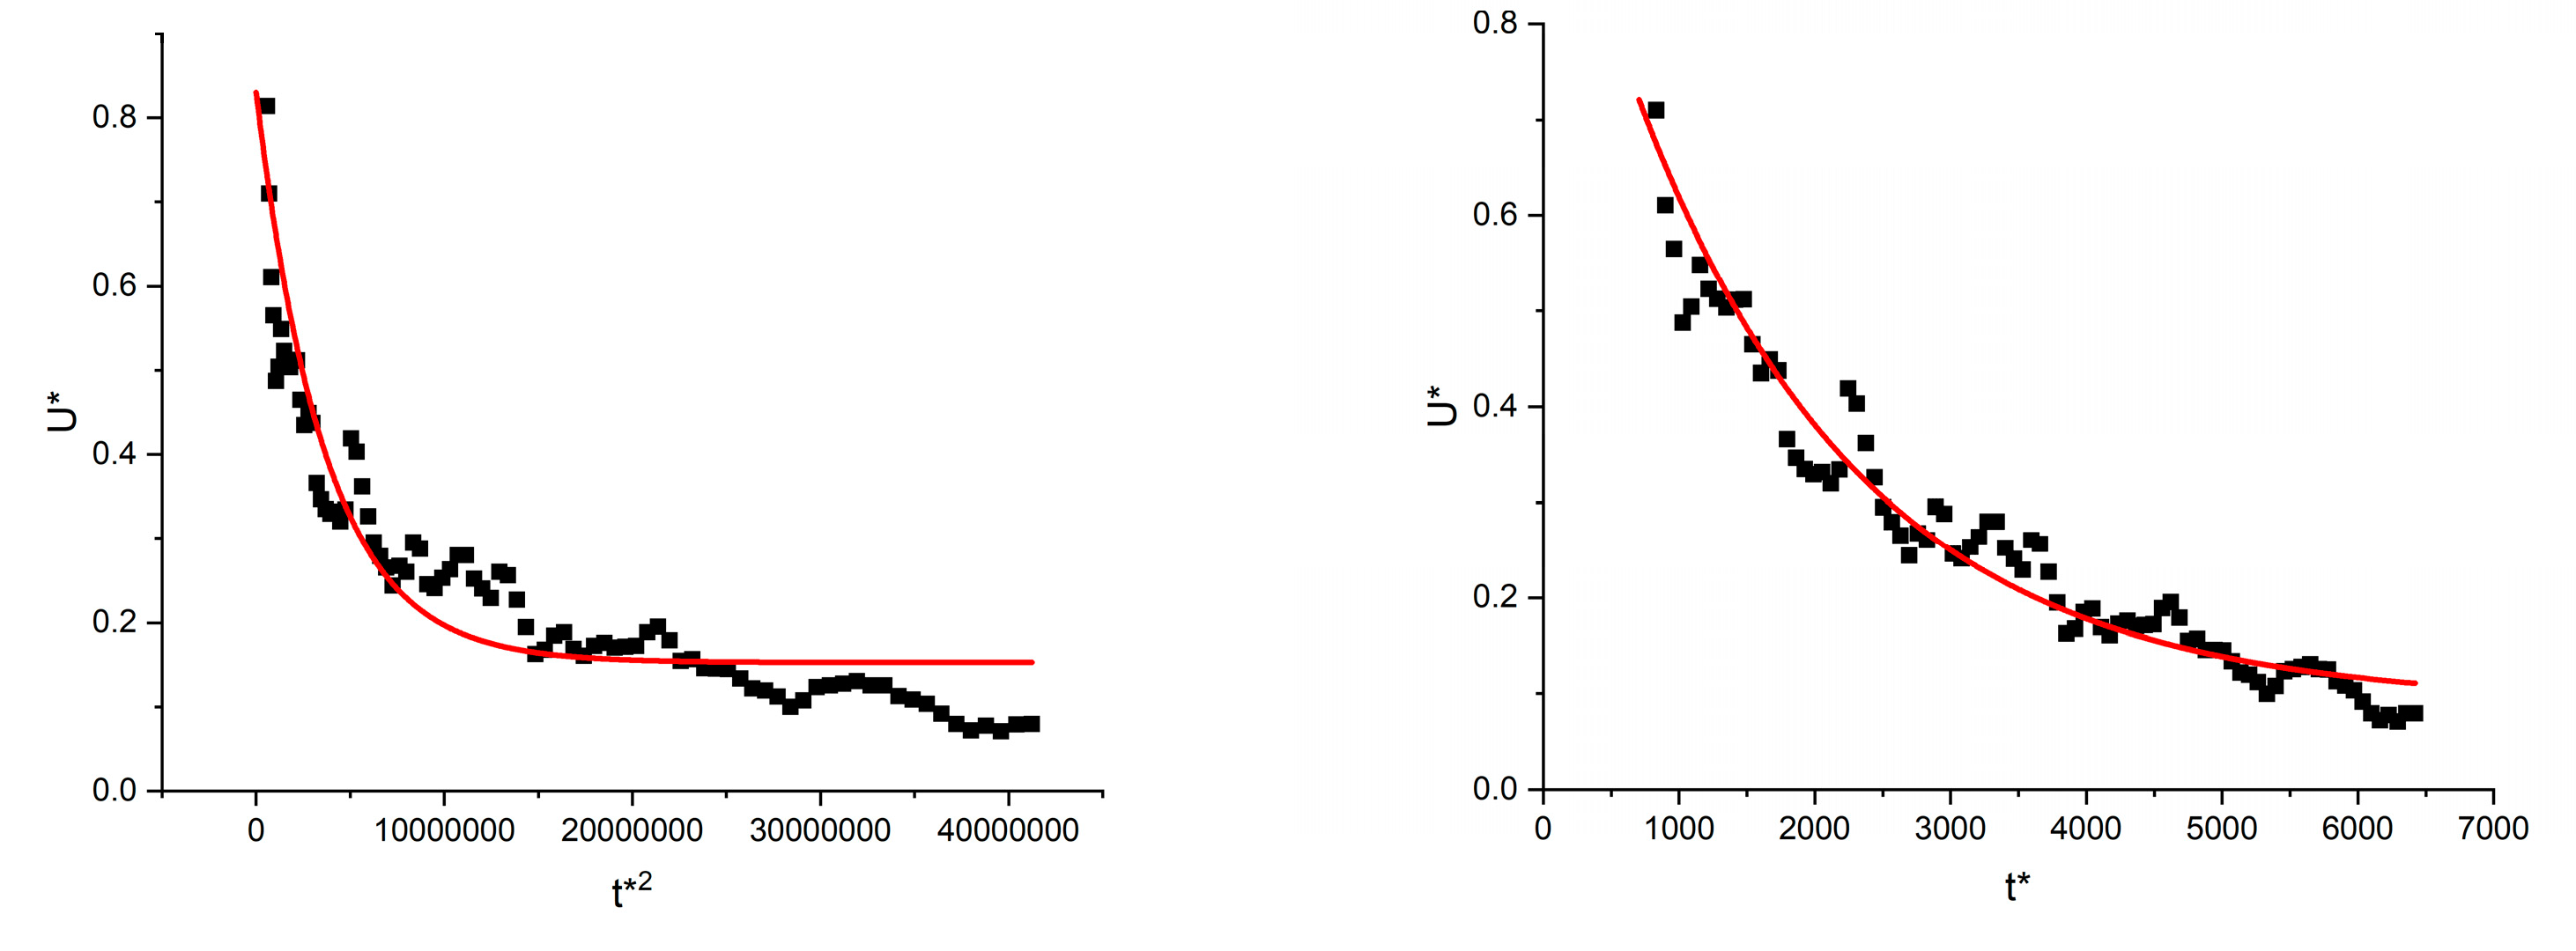
Figure 12.
versus plot from the tail region of Figure 10.
Figure 12.
versus plot from the tail region of Figure 10.
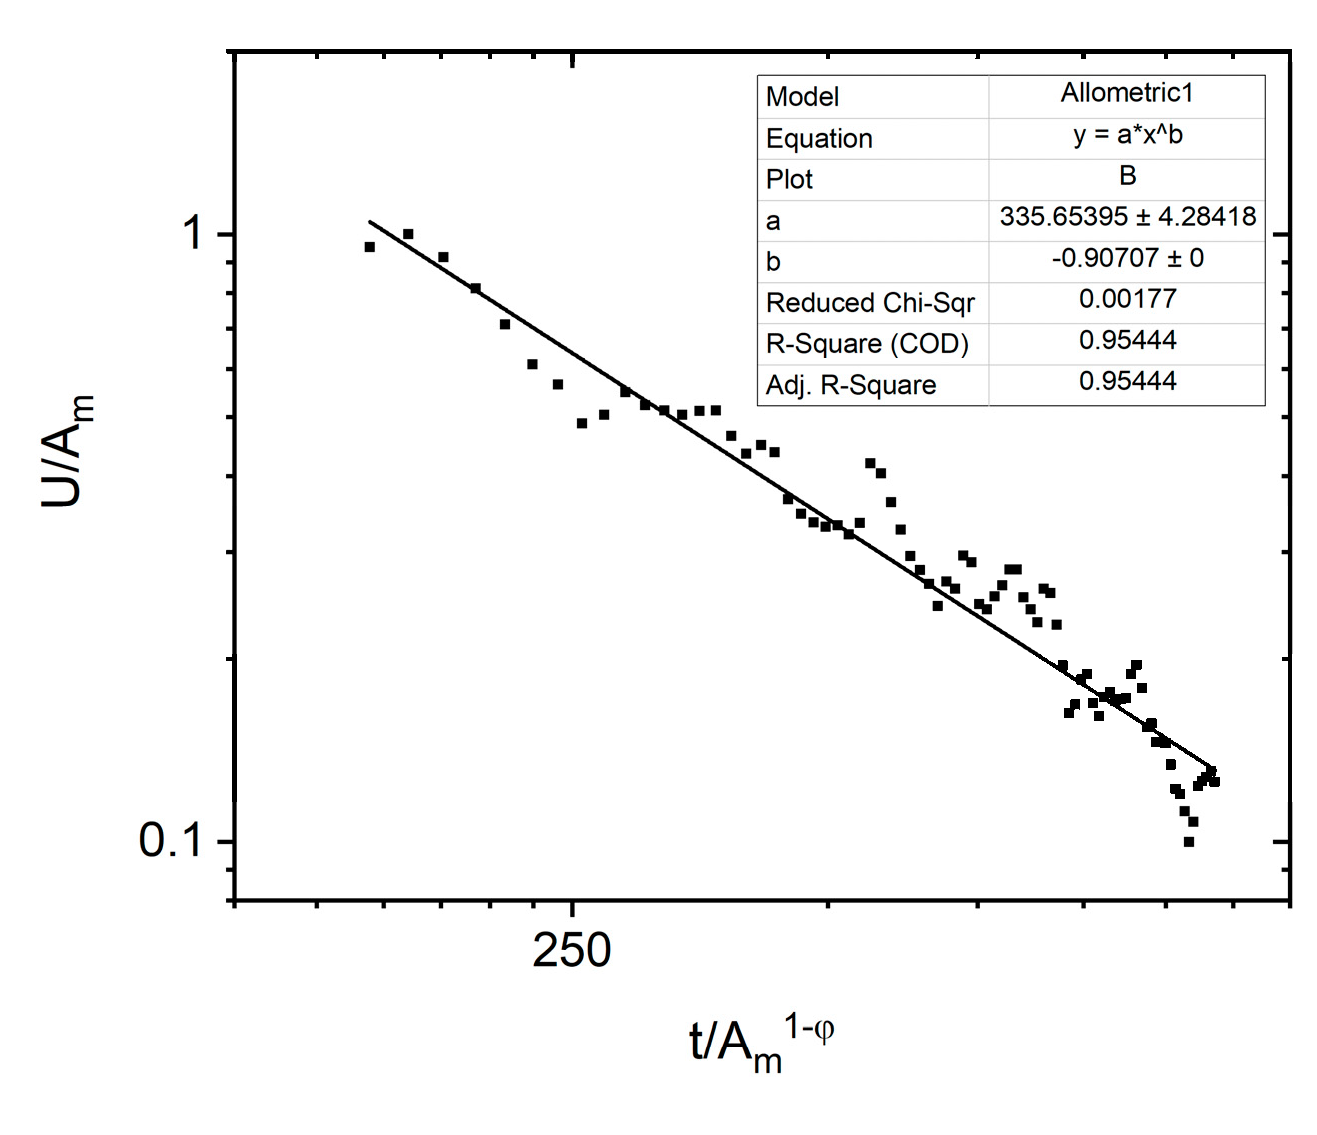

Table 1.
Power exponents of acoustic emission parameters.
| P(E) ~ ε |
P(A) ~ α |
P(S) ~ δ |
ϕ |
ϕ |
| 1.5 | 2.3 | 1.6 |
Table 2.
Characteristic exponents of energy (ε) and amplitude (α) distributions measured during external field induced rearrangements of martensite variants and/or during jerky shift of individual twin boundaries.
Table 2.
Characteristic exponents of energy (ε) and amplitude (α) distributions measured during external field induced rearrangements of martensite variants and/or during jerky shift of individual twin boundaries.
| Single crystal | Summary | ε | α |
| Ni51Fe18Ga27Co4, this work, averaged | Rubber like, stress induced |
1.5±0.1 | 2.3±0.2 |
| Ni2MnGa [18] |
Single twin boundary Type I, stress induced |
2.3±0.2 | |
| Ni2MnGa [18] |
Single twin boundary Type II, stress induced (less than one decade energy range) |
3.0±0.2 | |
| Ni2MnGa [46] | Type II | 1.5±0.1 | |
| Ni2MnGa [47] | Type I | 1.5±0.1 | |
| Ni2MnGa [34] | Single twin boundary Type I, stress induced |
1.5±0.1 | 2.1±0.1 |
| Ni2MnGa [48] | after compression along the [100] direction, magnetic field induced | 1.5 ±0.1 | 1.8±0.2 |
Disclaimer/Publisher’s Note: The statements, opinions and data contained in all publications are solely those of the individual author(s) and contributor(s) and not of MDPI and/or the editor(s). MDPI and/or the editor(s) disclaim responsibility for any injury to people or property resulting from any ideas, methods, instructions or products referred to in the content. |
© 2024 by the authors. Licensee MDPI, Basel, Switzerland. This article is an open access article distributed under the terms and conditions of the Creative Commons Attribution (CC BY) license (http://creativecommons.org/licenses/by/4.0/).
Copyright: This open access article is published under a Creative Commons CC BY 4.0 license, which permit the free download, distribution, and reuse, provided that the author and preprint are cited in any reuse.


