
Submitted:
23 December 2024
Posted:
24 December 2024
You are already at the latest version
Abstract
The use of low-cost biowaste adsorbents for the removal of toxic metal ions from aqueous solutions offers significant environmental benefits and demonstrates strong potential. This research studied the adsorption and recovery of Cd2+ and Pb2+ ions in batch and column modes with luffa peels and chamomile flowers. Metal ion concentrations were determined with ICP-OES. The biosorbents were treated with either acid or base. FTIR characterization indicated that surface carboxylic acid groups played a role in the adsorption process. L-type isotherms were obtained for Pb2+, fitting both the Langmuir and Freundlich models, with maximum adsorption capacities of 34.0 mg/g for luffa peels and 49.5 mg/g for chamomile flowers. Adsorption isotherm for Cd2+fitted better with the Freundlich model with smaller adsorption capacity than Pb2+. Base treated sorbents have higher adsorption capacity. The adsorption kinetic for both ions followed a pseudo-second order chemosorption model. Fixed-bed column dynamic adsorption with luffa peels obtained a Thomas dynamic adsorption capacity of 32.9 mg/g for Pb2+ and 25.8 mg/g for Cd2+. The recovery efficiency remained above 87% over three adsorption-regeneration cycles.
Keywords:
luffa peels
; chamomile flowers
; lead and cadmium ions
; adsorption
; recovery
; biosorbent column
; wastewater treatment
Enju Wang *
Department of Chemistry, St. John’s University, Jamaica, NY 11439, USA.; liang.feng17@my.stjohns.edu
1. Introduction
Over the past few decades, water pollution caused by both natural processes and human activities has become a major concern [1]. Heavy metal contamination is one of the most significant forms of pollution which occurs when toxic metals and metalloids such as lead, mercury, cadmium, arsenic, chromium, and others are deposited into the environment [2]. While these metals naturally exist in trace amounts in the Earth's crust, human activities can release them at much higher concentrations, posing significant risks. Their ability to persist in the environment, bioaccumulate in living organisms, and cause toxic effects makes them a serious threat to ecosystems and human health [3].
From previous studies, biowaste sorbents, such as potato peels and pumpkin peels, showed great potential for adsorbing cadmium ions in aqueous solutions [4,5,6,7]. Adsorption of metal ions onto biosorbents provides a relatively low cost and efficient method to reduce these metal ions in aqueous medium. Biowaste sorbents offer numerous advantages for heavy metal ion adsorption, making them an attractive option for environmental remediation [8]. One of the most significant benefits is their cost-effectiveness, as biowaste materials such as fruit and vegetable peels are abundant and inexpensive compared to synthetic alternatives [9]. This makes them a viable option for large-scale water treatment applications [10]. The presences of functional groups on the surface of biowaste sorbents such as COOH, C=O, C-O, CONH, NH, and -OH, which can physically adsorb, ion-exchange, or chemically bind with metal ions, retaining them, particularly when these groups are above the iso-electric point [11,12]. Studies have provided evidence that chemical treatments can significantly enhance the adsorption capacity of biowaste sorbents by activating potential binding sites and minimizing structural interferences [13].
Luffa plants are well known for producing natural sponges. Luffa presents significant potential for various environmental applications due to its sustainable and biodegradable properties. The increasing interest in luffa for environmental technologies underscores its value as a cost-effective and sustainable solution for pollution mitigation and resource conservation [14,15]. A study showed that when the moisture percentage was minimized to 12.40% in luffa peels, the composition resulted in 38.94% carbohydrate, 14.26% protein, 6.10% fat, 20.60% fiber and 7.7% ash [16]. It was also shown that luffa peels contain phenolics flavonoids. oleanolic acid, carotenoid and chlorophyll [17]. While the inner parts of luffa have been the subject of various studies, limited research has been conducted on the adsorption capacities of luffa peels for different heavy metal ions. Only one study has shown that luffa peels are effective in adsorbing dyes and heavy metal ions, such as Pb²⁺ and Ni²⁺, from water on a small scale. The adsorption capacity is attributed to the presence of -OH and -COOH functional groups, which facilitate the binding of these contaminants [18].
Chamomile is a flowering plant from the Asteraceae family, best known for its calming properties when used in teas or essential oils. Chamomile flower has a long history of use in medicine and health products, known for its wide range of pharmacological activities [19]. Studies have identified a variety of organic acids, flavonoids, coumarins, and volatile oils in chamomile, which are abundant in functional groups such as -COOH, -OH, C=C, and C-O. These functional groups are believed to play a crucial role in the herb's ability to absorb heavy metals [19,20]. A study demonstrated that nano chamomile waste is an effective material for use as a solid phase extractant for the removal of heavy metals. The extraction of ions such as Pb²⁺, Cu²⁺, and Fe³⁺ achieved a removal efficiency exceeding 98% [21].
This current research focused on investigating the adsorption capacity of cadmium and lead ions in water onto luffa peels and compared them to chamomile flowers, aiming to find alternative biosorbents for heavy metal ion contaminated wastewater treatment. Efforts were also extended to evaluate the recovery of these metal ions from aqueous solutions with luffa peels.
2. Materials and Methods
2.1. Chemicals and Reagents
All solutions were made and diluted with Ultrapure (UP) deionized water obtained from a Direct-Q 3 UV-R purification system with a product resistivity of 18.2 M Ω·cm at 25 °C.
2.1.1. Metal Ion Solutions
Cadmium sulfate octahydrate with a purity of 99% was purchased from JT Baker Chemicals. A stock solution of 1000 ppm of cadmium ion solution was prepared by adding 2.282 g of cadmium sulfate octahydrate in a 1L volumetric flask with UP deionized water. Using the stock solution, serial dilutions were made to make 500, 250, 100, 50, 20 and 10 ppm of cadmium ion solutions.
Lead (II) nitrate crystals with a purity of 99% were purchased from JT Baker Chemicals. A stock solution containing 1000 ppm of lead ions was prepared by adding 1.598 g of lead (II) nitrate to a 1L volumetric flask with UP deionized water. Serial dilutions were followed to make 500, 250, 100, 50, 20 and 10 ppm solutions of lead ions.
2.1.2. Buffer Solutions
ACS grade glacial acetic acid and solid sodium acetate were purchased from JT Baker Chemicals. To prepare a 0.1 M acetic acid/acetate buffer solution, 800 mL of UP deionized water was added to a 1-liter volumetric flask. Then, 340 microliters of glacial acetic acid and 7.7 grams of sodium acetate were added to the volumetric flask and mixed thoroughly. The pH was measured with an Orion pH electrode connected to Thermo Scientific Orion STAR A112 pH-meter and adjusted accordingly using either acetic acid or sodium acetate to reach a pH of 5.6. UP deionized water was finally added for the volumetric flask to reach 1 liter and solution was mixed thoroughly.
Trizma base (Tris(hydroxymethyl)aminomethane) was purchased from Millipore Sigma. The four Trizma buffers were prepared separately in a similar manner to the acetic acid/acetate buffer by adding 800 mL of UP deionized water to 1-liter volumetric flasks. Then, 12 grams of Trizma base were added to each volumetric flask. The pH was measured again and adjusted accordingly with nitric acid to reach a final pH of 6.7, 7.0, 7.5, and 8.0. UP deionized water was then added to each volumetric flask to reach 1 liter. These buffers were used only for cadmium solutions, as the lead solutions precipitated at any pH above 7. For lead solutions, the acetic acid/acetate buffer was used for all measurements.
2.1.3. Nitric Acid for ICP-OES
Ultra-pure nitric acid (67%–70%) was purchased from JT Baker ULTREX® II ultrapure reagents. A 4% nitric acid stock solution was prepared by adding 800 mL of UP deionized water to a 1-liter beaker. Then, 29 mL of 67%–70% nitric acid was added slowly to the beaker with constant stirring. The solution was transferred to a 1-liter volumetric flask, and UP deionized water was then added to the volumetric flask to reach 1 liter. This 4% stock solution was mixed with every sample before conducting the ICP-OES.
2.2. Instrumentation
2.2.1. ICP-OES
Cadmium and lead ion concentrations after biosorbent adsorption were all measured using Thermo Scientific™ iCAP™ 7200 ICP-OES, inductively coupled plasma atomic emission spectroscopy. The wavelengths used for cadmium and lead measurements were 214.438 nm and 220.353 nm both in radial mode. Calibration curves were obtained every time before analysis with 1, 5, 10, 25, 50, 75, 100, 125 ppm of both Cd2+ and Pb2+ solution to maximize the accuracy. All samples were mixed with 4% nitric acid 2+1:1 ratio one day before performing the experimentation. Linear correlation curves were obtained every day in use with correlation coefficient R2 equal to 1 for both ions in the range of 1 to 125 ppm.
2.2.2. FTIR
FTIR analysis was performed using a Perkin Elmer Spectrum 100 FTIR spectrometer (LR 64912C) with a diamond-attenuated total reflectance (ATR) accessory. Measurements were taken with 4 scans at 1 cm−1 resolutions and were recorded within the 4000–650 cm−1 region. A background measurement of air was taken before every first measurement of the day. In between each measurement, the sample compartment was cleaned using an acetone-dipped Q-tip and left to dry for at least 30 seconds.
2.3. Biosorbents Treaments
Luffa and chamomile flowers were ordinary kinds obtained from New York City stores. For luffa, the peels were collected, rinsed with tap water, then with distilled water several times and air dried for three days at ambient conditions. The dried luffa peels and chamomile flowers were hand-milled in a mortar and pestle and sieved through an 18-mesh sieve. To find the best adsorption conditions, biosorbents were treated with acid or base. Their treatment was done by adding 6.0 g of the biosorbent to 200 mL of 0.4 M HNO3 or NaOH. The mixture was left for 24 hours, and then filtered with filter paper and washed with UP deionized water until the filtrate was clear before they were collected. The biosorbents were left to air dry in the laboratory for 3 to 5 days before use.
2.4. Batch Experiments
2.4.1. Equilibrium Adsorption
The equilibrium study was performed under isothermal conditions at 20 ± 2 °C for 24 hours using a batch equilibration procedure. Each biosorbent (0.100 g) was treated with 10 mL of Cd2+ and Pb2+ solutions at 10, 20, 50, 100, 250, and 500 ppm, mixed with 10 mL of acetic buffer at pH 5.6 for both ions and Tris buffer at pH 8.0 only for Cd2+, in 20 mL scintillation vials with stirring for 24 hours. The solution was then filtered with filter paper followed by a Millipore syringe filter. Two milliliters of the filtered solution was mixed with 2 mL of 4% HNO₃ for ICP-OES analysis. The biosorbents were collected for FTIR analysis. Three experimental sets were conducted to obtain average values.
The adsorption efficiency (A%) was calculated using the initial concentration introduced into the solution (C₀) and the equilibrium concentration (Ceq), as shown in Equation (1) below. The mass ratio between the amount of adsorbed species and the amount of adsorbent (Qe) can be calculated as shown in Equation (2) below.
(1)
(2)
The Freundlich isotherm model is an empirical model to analyze the relationship between the concentration (Ce) of an adsorbate in solution and Qe onto the heterogenic surface at equilibrium. At low-solute concentrations, the amount of adsorbate adsorbed increased with an increase in solution concentration. The non-linear form of the Freundlich isotherm equation is shown in Equation (3) and the linear form in Equation (4) below [22,23].
(3)
(4)
By plotting Log(Qe) vs. LogCeq, a straight line is expected. Correlation coefficient R2 will be used to evaluate the significant linearity. The Kf constant is given by the intercept, and the n value is calculated from the slope of the straight line. Large Kf and 1/n value favor the adsorption with this model. The definitions of the constant and all the symbols used are listed at the end.
The Langmuir isotherm model is also used as an empirical model for equilibrium adsorption studies. It enables the determination of the maximum monolayer adsorption capacity (Qomax) for an adsorbent. The nonlinear and linear forms of the Langmuir isotherm are represented by Equations (5) and (6) below [24].
(5)
(6)
Here Ceq/Qe will be plotted vs the Ceq to evaluate the linear fit, Qomax can be obtained from the slope of the curve, KL then can be obtained from the intercept.
2.4.2. Adsorption Kinetics
Kinetic studies were performed in batch mode with 0.100 g of biosorbents and 20 mL of 250 ppm initial concentration of both metal ions mixed with buffer under constant stirring for 1, 2, 3, 5, 10, 15, 20, 30, and 60 minutes. The supernatants were immediately collected and filtered using a Millipore syringe filter. Three experimental sets were conducted, and the same manner was used for sample preparation for ICP-OES analysis as in the equilibrium studies. The adsorption kinetics can be fitted to the Pseudo-second order model, as shown in Equation (7) below [25].
(7)
with
(8)
Here Ct is the concentration at time t of the adsorption, by plotting t/Qt, a linear line is expected. The equilibrium Qe can be calculated with the slope of the curve, the K2 can be calculated with the intercept in equation (7).
2.5. Fixed Bed Column Adsorption and Recovery
Waste treatment—dynamic adsorption of cadmium and lead from aqueous solution was carried out as follows. Six grams of base-treated luffa peels were packed in two 300 mm x 30 mm flash chromatography columns with UP deionized water for each metal ion study. The column for cadmium adsorption and recovery was preconditioned with Tris buffer at pH 8.0, while the column for lead adsorption and recovery was preconditioned with acetic acid buffer at pH 5.6. Adsorption was performed by feeding solutions of 250 ppm of cadmium or lead mixed with buffer continuously at a draining speed of 4 mL/min. The draining solution was collected in 80 mL batches initially, or 20 mL batches after 320 mL, and monitored with ICP-OES. The process was stopped when the biosorbents reached 80% saturation. The dynamic breakthrough curve was evaluated with the Thomas model shown in Equation (9) and the linear form in Equation (10) below [22,26].
(9)
(10)
The breakthrough capacity (Qb) was obtained using Equation (11), shown below.
(11)
The adsorbed cadmium and lead ions were then recovered by feeding 0.4 M HNO₃ at a draining speed of 4 mL/min until no heavy metal ions were present in the drained solution, monitored by ICP-OES. The biosorbents were then washed with UP deionized water until the draining solution reached a neutral pH. The adsorption-desorption processes were repeated three times to evaluate the reuse ability of the luffa peels. The recovery efficiency (R%) was obtained using Equation (12), shown below.
(12)
3. Results and Discussion
3.1. Biosorbent Characterization
The bulk density of untreated (natural form) luffa peels was measured to be 0.42 g/cm³. After chemical treatments, a slight increase in bulk density was observed, with the base-treated luffa peels (luffa-base) exhibiting the highest density. In contrast, the untreated chamomile flowers exhibited a lower bulk density of 0.29 g/cm³. Unlike luffa peels, both acid and base treatments reduced the bulk density of chamomile flowers, as shown in Table 1.
Figure 1 illustrates the FTIR spectra of untreated, acid-treated, and base-treated luffa peels. All sorbent types exhibit characteristic peaks corresponding to O-H stretching at 3294 cm⁻¹, C-H stretching at 2919.8 cm⁻¹, and C=O stretching at 1731.3 cm⁻¹, indicative of the presence of carboxylic acid groups. The base treatment resulted in a significant reduction in the C=O stretching intensity at 1731.3 cm⁻¹, and two additional peaks were observed at 1601.5 cm⁻¹ and 1412.3 cm⁻¹, corresponding to C-O stretching. These peaks indicate the full deprotonation of carboxylic acids and the formation of carboxylates (COO⁻). In contrast, the acid treatment led to full protonation of the carboxylates, resulting in an increase in C=O stretching intensity.
The FTIR analysis of chamomile flowers also indicated the presence of carboxylic acids and carboxylates after base treatment as illustrated in Figure 2. Both luffa peels and chamomile flowers possess similar active adsorption sites for heavy metal ions.
In an acidic environment, during the adsorption of heavy metal ions by carboxylic acids, the metal ions must compete with protons (H⁺) for binding sites. This competition causes ion exchange and deprotonation of carboxylic acids, resulting in the formation of carboxylate-metal complexes. In this case, Pb²⁺ exchanged protons, resulting a reduction of COOH and forming COO-Pb complexes. This is evidenced by the decrease in C=O stretching intensity at 1729.8 cm⁻¹ and appearance of deprotonated C-O stretching peaks at 1585.1 cm⁻¹ and 1414.9 cm⁻¹ at pH 2.8 as illustrated in Figure 3.
For base-treated sorbents, the deprotonation of most COOH groups is achieved through the treatment process. During the adsorption of heavy metal ions, the negative charge of the COO⁻ groups attract the metal ions, resulting in significantly less proton exchange. As shown in Figure 4, following the adsorption of Cd²⁺, the base-treated chamomile showed a decrease in C=O stretching intensity at 1727.7 cm⁻¹, attributed to ion exchange. Additionally, C-O stretching peaks at 1602.1 cm⁻¹ and 1410.6 cm⁻¹ are observed due to the adsorption of Cd²⁺.
The FTIR spectra of luffa peels indicated a similar adsorption mechanism to that of chamomile flowers, which can be attributed to the similarities in their surface functional groups. In an acidic environment, heavy metal ions primarily undergo ion exchange with protons, as shown in process (1) of Figure 5. In a basic environment, the adsorption mechanism, as illustrated in process (2), proceeds without the need for ion exchange with protons.
3.2. Batch Adsorption
3.2.1. Equilibrium Adsorption
The adsorption of Pb2+ was carried out using an acetic acid (AA) buffer at pH 5.6 to prevent precipitation. Figure 6(a) presents Qe for both acid- and base-treated luffa peels at various initial Pb2+ concentrations in the range of 5-250 ppm. The base-treated luffa peels exhibited a consistently higher adsorption capacity as the concentration of Pb²⁺ increased compared to the acid-treated luffa peels. This could be attributed to the higher presence of deprotonated COO⁻ groups on the surface of the base-treated sorbents, which require less free energy for Pb²⁺ binding compared to the proton exchange required by COOH groups, resulting in a higher binding affinity. Figure 6 (a) plotted with the Qe vs C0 shows a L-shaped curve, the Freundlich isotherm model linear plots shown in Figure 6(b), for both types of luffa peels shows good R2 values, indicating that the Freundlich model effectively describes the Pb2+ adsorption process, which indicates chemisorption plays a critical role. The slope 1/n values for Pb2+ both less than 0.5 indicating a favorable adsorption.
The adsorption of Cd²⁺ was conducted using luffa peels under the same conditions as Pb²⁺ adsorption for comparison. Figure 7 illustrates the isotherm plots, Qe vs. C0 7(a), and the Freundlich linear plots for Cd²⁺ (7b) are very similar to those for Pb²⁺. Lower Qe values were observed for all concentrations of Cd²⁺ compared to Pb²⁺ on both sorbents. In addition, Kf calculated from the intercept and the slope 1/n values for Cd2+ were higher than 0.5, all confirming that Cd²⁺ had a lower affinity for the binding sites on the luffa peels than Pb²⁺. The R2 values from both linear plots suggest that the Freundlich model also effectively describes the Cd²⁺ adsorption process.
Due to the higher solubility of Cd²⁺ at pH values below 10, its adsorption is not confined to acidic conditions. A pH study was conducted on a 250 ppm Cd²⁺ solution to investigate the maximum adsorption capacity of the biosorbents. An AA buffer at pH 5.6 and Tris buffers at pH levels of 6.7, 7.0, 7.5, and 8.0 were used to identify the optimal pH conditions. As illustrated in Figure 8, the Qe values of both base-treated chamomile and luffa peels increased significantly from pH 5.6 to 6.7 and slowly increased up to pH 8.0 with no precipitation observed. Consequently, pH 8.0 was selected for further analysis of Cd²⁺ adsorption.
Isotherms were obtained for Cd2+ adsorption at pH 8 with Tris buffer. The F Freundlich linear plots data together with values for Pd2+ and Cd2+ ions at pH 5.6 were summarized in Table 2. It can be seen from Table 2 that chamomile flowers exhibited a higher Qe and adsorption capacity (Kf) than luffa peels at both pH values for Cd2+ adsorption, suggesting a greater number of active binding sites on its surface. Low Freundlich adsorption constants (Kf) were observed for Cd²⁺ adsorption at pH 5.6; however, when equilibrium adsorption was re-evaluated at pH 8.0, significantly higher adsorption capacities were observed for both chamomile and luffa peel adsorbents. These results indicated that both base-treated biosorbents had an average equilibrium adsorption Qe exceeding 31 mg/g for Pb2+ ions at pH 5.6 and 36 mg/g for Cd2+ ions at pH 8.0 when C0 was 250 ppm. The high R2 values with the Freundlich model indicate that Cd²⁺adsorption may involve multilayer adsorption.
The equilibrium studies showed higher adsorption quantity (Qe) for both base-treated biosorbents across all pH ranges, suggesting that the base-treated biosorbents have more active surface binding sites due to the complete deprotonation of COOH groups at pH 8.0. At this pH, H+ ion exchange no longer occurs, effectively eliminating the H+ matrix effect observed with the acid-treated biosorbents. Density differences may also be a factor that acid and base treatment results in slightly different surface property composition-porosity, especially the chamomile treated sorbents.
Figure 9(a) displays the Langmuir isotherm model for Pb²⁺ adsorption using both base- and acid-treated luffa peels plotted by Qe vs Ceq, shows an L-type (concave down) isotherm for both types of peels. The R2 values from the linear plots, as shown in Figure 9(b), confirm that the Langmuir model effectively describes the Pb²⁺ adsorption process.
Although the adsorption of Pb²⁺ fits the Langmuir model well, the adsorption of Cd²⁺ did not follow the L-type Langmuir model well (R2<0.85). Table 3 summarizes the monolayer maximum adsorption capacity (Qomax), Langmuir adsorption affinity (KL), and R² values for the linear plots. Higher KL values with the base treated sorbents indicate a higher binding affinity. The maximum adsorption capacities are ranked in the following order: base-treated chamomile flowers > acid-treated chamomile flowers > base-treated luffa peels > acid-treated luffa peels, consistent with the results obtained from the Freundlich model. Based on the R² values, the Langmuir model provides a better description of Pb²⁺ adsorption. Which indicates that adsorption occurred on the adsorption sites, i.e. functional groups, as a monolayer adsorption.
3.2.2. Adsorption Kinetics
The kinetics study of Pb²⁺ adsorption was conducted using a 250 ppm Pb²⁺ initial solution over a time range of 1–60 minutes at pH 5.6, under the same conditions as the equilibrium studies. The adsorption process occurred rapidly, with approximately 32% of Pb²⁺ in the solution adsorbed onto both base-treated and acid-treated luffa peels within 1 minute of contact. This instantaneous adsorption process suggests that luffa peels have a strong affinity for Pb²⁺ ions in solution. The adsorptions reached equilibrium within approximately 60 minutes. At this time, the base-treated luffa peels exhibited a Pb²⁺ adsorption efficiency of 68%, while the acid-treated luffa peels showed an efficiency of 48%. Both values closely align with those obtained from the equilibrium studies, indicating that adsorption equilibrium was achieved at 60 minutes. Figure 10(a) shows the linear plot based on the pseudo-second order model for Pb2+ adsorption onto luffa peel biosorbent. The slope from the linear plot of the base-treated luffa peels is smaller, resulting in a higher Qe due to the inverse relationship between Qe and the slope of the linear plot shown in equation (7). Additionally, the strong linearity of both plots indicates that the pseudo-second order model effectively describes the bio-adsorption kinetics of the processes.
The kinetics studies of Cd²⁺ were conducted at pH 8.0 under the same conditions as the Pb²⁺ kinetics studies. Rapid adsorption of Cd²⁺ was observed, with approximately 37% adsorption efficiency for both types of luffa peels within 1 minute contacting time. Similar to Pb²⁺, the Cd2+ adsorption reached equilibrium at 60 minutes, achieving 75% adsorption efficiency for the base-treated luffa peels and 61% for the acid-treated luffa peels. Higher Qe of the base-treated luffa peels was found, as shown in Figure 10(b).
As summarized in Table 4, the adsorbed amount calculated from the pseudo-second-order kinetic plots (Qecal) closely match the equilibrium adsorption values (Qem) measured experimentally, further confirming that the adsorption process follows a pseudo-second-order kinetic model and reaches equilibrium within 60 minutes. The higher fitting of the adsorption data to both ions to this model implies that the rate limiting step involves interactions of the ions with surface functional groups. This agrees with the IR spectra changes of the COOH and OH bonds after the adsorption, that both ions bind with these sites.
3.3. Fixed Bed Column Adsorption
Although base-treated chamomile flowers exhibited a higher adsorption affinity for both Pb²⁺ and Cd²⁺ in batch adsorption studies, its physical properties and chemical stability limit its suitability as a column sorbent. For instance, the low density of chamomile flowers leads to large void spaces within the column in a self-made column without applied pressure, and its low stability causes blockages, resulting in inconsistent flow and operational issues. In contrast, base-treated luffa peels were easier to pack into the columns and produced consistent free solution flow rate. Therefore, only base-treated luffa peels were focused on the dynamic adsorption and recovery studies for the two metal ions.
The fixed-bed column adsorption of Cd²⁺ was performed using a 250 ppm Cd²⁺ solution at pH 8.0, while Pb²⁺ adsorption was performed at pH 5.6. Continuous flow was maintained at a rate of 4 mL/min until the Ct/C₀ ratio reached 0.8, indicating 80% saturation of the luffa peels. The initial fixed-bed height of approximately 15 cm reduced to ~10 cm after the first regeneration cycle and further to ~8 cm after the final adsorption-regeneration cycle, consistent across both columns. This reduction in bed height may have contributed to the observed decrease in dynamic adsorption capacity, as shown by the shifts in breakthrough curves in Figure 11.
As shown in Figure 11(a), the breakthrough points occurred when the Ct/C₀ ratio reached 0.1. The breakthrough curves for Cd²⁺ indicate a decrease in breakthrough time with each adsorption-regeneration cycle: 125 minutes for the first cycle, 92 minutes for the second cycle, and 78 minutes for the third cycle. The decrease in breakthrough time indicates a reduction in breakthrough capacity (Qb), and the overall shift in the breakthrough curves reflects a continuous decline in dynamic capacity (Q₀). This suggests that the luffa peels lost active binding sites after each cycle, likely due to incomplete release of Cd2+ ions as well as the reduction in bed height which may result in a denser pack of the sorbents, that reduced the accessible sites for adsorption.
Similar to Cd²⁺ adsorption, Figure 11(b) illustrates the shift in breakthrough curves for Pb²⁺ after each adsorption-regeneration cycle. The breakthrough time for the first cycle was 145 minutes, indicating a higher adsorption affinity of luffa peels for Pb²⁺, consistent with the batch study results. The breakthrough times decreased to 90 minutes in the second cycle and 75 minutes in the third cycle, with a corresponding decrease in breakthrough capacity (Qb) also observed. Both fixed-bed column studies stated that luffa peels maintained a high adsorption capacity even after three cycles.
Table 5 summarizes the parameters derived from the Thomas model, with R² values indicating a strong fit of the model to the fixed-bed column adsorption data. Across all cycles, luffa peels showed a higher dynamic adsorption capacity for Pb²⁺, as seen in the Qb and Q₀ values, consistent with the batch adsorption results. For Pb²⁺, the Q₀ in the first cycle was 32.9 mg/g, decreasing by 40% to 20.0 mg/g in the second cycle and by another 9% to 18.2 mg/g in the third cycle. Similarly, the Q₀ for Cd²⁺ started at 25.8 mg/g in the first cycle, dropped by 33% to 17.2 mg/g in the second cycle, and further by 8% to 15.9 mg/g in the third cycle. The slower rate of capacity loss across cycles suggests that luffa peels retain potential for adsorption even after three adsorption-regeneration cycles. The continuous increase in the Thomas adsorption rate constant (KT) with each cycle may be due to the luffa peels becoming more homogeneous after prolonged soaking in the column.
Recovery
The luffa peels were regenerated by introducing a 0.4 M HNO₃ solution to both columns at a flow rate of 2-4 mL/min until the effluent concentration of Pb²⁺ or Cd²⁺ (Ce) dropped below 0.01 ppm. As shown in Figure 12(a) and Figure 12(b), rapid releases of Pb²⁺ and Cd²⁺ were observed, with the Pb²⁺ column exhibiting a faster rapid release rate, likely due to the higher quantity of adsorbed Pb²⁺ ions.
The recovery curves remained consistent across all cycles. By calculating the total mass of Pb²⁺ and Cd²⁺ adsorbed from the breakthrough curves and comparing it with the total mass recovered from the recovery curves, the recovery efficiency for both Pb²⁺ and Cd²⁺ was determined, as summarized in Table 6. The recovery efficiency remained above 87% for Pb²⁺ and 90% for Cd²⁺, indicating that luffa peels serve as a reliable adsorbent with strong reusability. These recovery studies also highlight the potential of luffa peels as an effective solid-phase extraction (SPE) sorbent for Pb²⁺ and Cd²⁺. To achieve recovery, higher nitric acid concentration might be needed, which could alter the nature of the sorbent.
The FTIR spectra (Figure 13) indicates that the luffa peels retained surface carboxylic acid (COOH) groups after three adsorption-desorption cycles. An increase in all peak intensities is observed, which may be attributed to the homogenization of the sorbent following prolonged soaking in solution. Additionally, the increased intensity of the C=O stretching band at 1729.8 cm⁻¹ and the absence of C–O stretches are likely due to the sorbent being at pH 4.5 after acid washing, resulting in protonation of the surface functional groups. The presence of COOH groups observed in the FTIR spectra further suggests that the luffa peels retain adsorption capacity even after three usage cycles. This retention of functional groups highlights the durability and reusability of luffa peels as an adsorbent in repeated adsorption-desorption processes.
3.4. Comparison of Other Studies
Table 7 and Table 8 summarize a comparison of the adsorption efficiency of luffa peels, chamomile flowers, and other adsorbents reported in the literature, under batch and column methods, respectively. According to these tables, both luffa peels and chamomile exhibited relatively high affinities for lead and cadmium in batch experiments, while luffa peels showed high dynamic adsorption affinity for these metals in column experiments. These results suggest that luffa peels and chamomile flowers are promising adsorbents for the removal of lead and cadmium from aqueous solutions.
4. Conclusions
The use of Luffa peels and chamomile flowers have been evaluated for the removal and recovery of lead and cadmium ions from aqueous solutions. FTIR spectra indicates that both adsorbents are rich in surface carboxylic acid (-COOH) groups, which contribute to adsorption through ion exchange or electrostatic interactions, depending on pH. The base-treated adsorbents have higher adsorption capacities for both ions likely due to higher deprotonation of the carboxylate and phenolate groups. The isotherm for both metal ions fit well with the Freundlich model, an indicator for chemisorption, although the Langmuir model fit better for the Pb(II) adsorption. Adsorption kinetics obeyed a pseudo-second-order model, confirming chemical interaction as the rate limiting step in the adsorption process. The successful fixed-bed dynamic column adsorption with base-treated luffa peels for both metal ions suggest that luffa peels have high potential to be used as low-cost reuseable biosorbents for the adsorption and recovery of toxic heavy metals.
Author Contributions
Conceptualization, E.W and L.F.; methodology, L.F. and E.W.; formal analysis, L.F.; investigation, L.F.; resources, E.W.; data curation, L.F.; writing—original draft preparation, L.F.; writing—review and editing, E.W. L.F.; visualization, E.W. and L.F.; supervision, E.W.; project administration, E.W.; funding acquisition, E.W. All authors have read and agreed to the published version of the manuscript.
Funding
This research was funded by Saint John’s University for financial support for this investigation.
Data Availability Statement
We encourage all authors of articles published in MDPI journals to share their research data. In this section, please provide details regarding where data supporting reported results can be found, including links to publicly archived datasets analyzed or generated during the study. Where no new data were created, or where data is unavailable due to privacy or ethical restrictions, a statement is still required. Suggested Data Availability Statements are available in section “MDPI Research Data Policies” at https://www.mdpi.com/ethics.
Acknowledgments
The authors thanks St. John’s University for all the financial support for this research. Authors also thanks Dr. Victor Cesear for checking the grammar of the manuscript.
Conflicts of Interest
The authors declare no conflicts of interest.
| Symbols | Definition (unit) |
| %A | Adsorption efficiency (%) |
| C0 | Initial concentration of heavy metal ions in aqueous solution (ppm) |
| Ceq | Equilibrium concentration of heavy metal ions in aqueous solution (ppm) |
| V | Volume of heavy metal ion solution (L) |
| M | Mass of the biosorbent (g) |
| Qe | Mass ratio of adsorbed heavy metal ions to the sorbent at equilibrium (mg/g) |
| Qem | Equilibrium Adsorption capacity of the biosorbent for 250ppm of heavy metal ion (mg/g) |
| Kf | Freundlich adsorption isotherm constant for adsorption capacity (L/g) |
| n | Freundlich adsorption isotherm constant for adsorption intensity |
| Qomax | Maximum adsorption capacity of the biosorbent (mg/g) |
| KL | Langmuir equilibrium adsorption constant for adsorption affinity (L/g) |
| Qt | Adsorption capacity of the biosorbent at time response (mg/g) |
| Ct | Concentration of heavy metal ions in aqueous solution over time (ppm) |
| K2 | Second-order adsorption rate constant (g·mg−1·min−1) |
| Qecal | Adsorption capacity of the biosorbent for 250ppm of heavy metal ion obtained from pseudo-second order kinetics model (mg/g) |
| Q0 | Dynamic adsorption capacity of the biosorbent (mg/g) |
| Q | Flow rate of the fixed bed column (mL/min) |
| KT | Thomas rate constant (10-3 mL·min-1·mg-1) |
| t | Total flow time (min) |
| Qb | Breakthrough capacity of the biosorbent (mg/g) |
| Cb | Metal ions concentration at breakthrough point (ppm) |
| tb | Breakthrough time (min) |
| Ce | Metal ions concentration in effluent (ppm) |
| R% | Recovery efficiency (%) |
| MT | Total mass of adsorbed metal ions by the biosorbent (mg) |
| MR | Total mass of recovered metal ions from the biosorbent (mg) |
References
- Wang, S.-L.; Xu, X.-R.; Sun, Y.-X.; Liu, J.-L.; & Li, H.-B.; Li, H. -B. Heavy metal pollution in coastal areas of South China: A review. Marine Pollution Bulletin 2013, 76, 7–15. [Google Scholar] [CrossRef] [PubMed]
- Vareda, J.P.; Valente, A.J. M.; & Durães, L.; Durães, L. Assessment of heavy metal pollution from anthropogenic activities and remediation strategies: A review. Journal of Environmental Management 2019, 246, 101–118. [Google Scholar] [CrossRef] [PubMed]
- Huff, J.; Lunn, R.N.; Waalkes, M.P.; Tomatis, L. and Infante, P.F. Cadmium-induced Cancers in Animals and in Humans. Int J Occup Environ Health 2007, 13, 202–212. [Google Scholar] [CrossRef] [PubMed]
- Allah, T.F.; Jusuf, K.; Shohatee, A.A.; Feng, L.; Trombetta, L.; & Wang, E.; Wang, E. Studies of Adsorption of Cadmium Ions by Biowaste Adsorbent from Aqueous Solutions with Ion-Selective Electrodes and ICP-OES. American Journal of Analytical Chemistry 2023, 14, 274–286. [Google Scholar] [CrossRef]
- Aschale, M.; Tsegaye, F.; & Amde, M.; Amde, M. Potato peels as promising low-cost adsorbent for the removal of lead, cadmium, chromium and copper from wastewater. DESALINATION and WATER TREATMENT 2021, 222, 405–415. [Google Scholar] [CrossRef]
- Kwikima, M.M.; Marteso, S. and Chebude, Y. (2021) Potentials of Agricultural Wastes as the Ultimate Alternative Adsorbent for Cadmium Removal from Wastewater: A Review. Scientific African, 13, e00934.
- Palabıyıka, B.B.; Selcukb, H. and Oktem, Y.A. (2019) Cadmium Removal Using Potato Peels as Adsorbent: Kinetic Studies. Desalination and Water Treatment, 172, 148-157.
- Salim, R.; Al-Subu, M. and Dawod, E. (2008) Efficiency of removal of cadmium from aqueous solutions by plant leaves and the effects of interaction of combinations of leaves on their removal efficiency. ( 87, 521–532.
- Zheng, W.; Li, X.; Wang, F.; Yanga, Q.; Dengb, P. and Zenga, G. (2008) Adsorption removal of cadmium and copper from aqueous solution by areca-a food waste. J. Hazard. Mater,.
- Tan, G. and Xiao, D. (2009) Adsorption of cadmium ion from aqueous solution by ground wheat stems. ( 164, 1359–1363.
- Azouaou, N.; Sadaouia, Z. and Djaafri, A.; Mokaddem, H. Adsorption of cadmium from aqueous solution onto untreated coffee grounds: equilibrium kinetics and thermodynamics. J. Hazard. Mater. 2010, 184, 126–134. [Google Scholar] [CrossRef]
- Semerjian, L. Equilibrium and kinetics of cadmium adsorption from aqueous solutions using untreated Pinus halepensis sawdust. J. Hazard. Mater 2010, 173, 236–242. [Google Scholar] [CrossRef]
- Inoue, K.; Parajuli, D.; Ghimire, K.N.; Biswas, B.K.; Kawakita, H.; Oshima, T. and Keisuki, O. (2017) Biosorbents for Removing Hazardous Material and Metalloids. Materials.
- Shen, J.; Min Xie, Y.; Huang, X.; Zhou, S.; & Ruan, D.; Ruan, D. Mechanical properties of luffa sponge. Journal of the Mechanical Behavior of Biomedical Materials 2012, 15, 141–152. [Google Scholar] [CrossRef]
- Verma, D.K.; Hasan, S.H.; Ranjan, D.; & Banik, R.M.; Banik, R. M. Modified biomass of Phanerochaete chrysosporium immobilized on luffa sponge for biosorption of hexavalent chromium. International Journal of Environmental Science and Technology 2014, 11, 1927–1938. [Google Scholar] [CrossRef]
- Swetha, M.P.; Muthukumar, S.P. Characterization of nutrients, amino acids, polyphenols and antioxidant activity of Ridge gourd (Luffa acutangula) peel. J Food Sci Technol. 2016, 53, 3122–3128. [Google Scholar] [CrossRef] [PubMed]
- Azeez, M.; BELLO, O.; & Adedeji, A.; Adedeji, A. Journal of Medicinal Plants Studies Traditional and medicinal uses of Luffa cylindrica : a Review. Journal of Medicinal Plants Studies 2013, 1, 2320–3862. [Google Scholar]
- Mallampati, R.; Tan, K.S.; & Valiyaveettil, S.; Valiyaveettil, S. Utilization of corn fibers and luffa peels for extraction of pollutants from water. International Biodeterioration & Biodegradation 2015, 103, 8–15. [Google Scholar]
- Dai, Y.-L.; Li, Y.; Wang, Q.; Niu, F.-J.; Li, K.-W.; Wang, Y.-Y.; … Gao, L.-N. Chamomile: A Review of Its Traditional Uses, Chemical Constituents, Pharmacological Activities and Quality Control Studies. Molecules 2022, 28, 133. [Google Scholar] [CrossRef]
- Singh, O.; Khanam, Z.; Misra, N.; & Srivastava, M.K.; Srivastava, M. K. Chamomile (Matricaria chamomilla L.): An overview. Pharmacognosy reviews 2011, 5, 82–95. [Google Scholar] [CrossRef]
- Hasanin, T.; Ahmed, S.; & Barakat, T.; Barakat, T. Nano-chamomile Waste as a Low-cost Biosorbent for Rapid Removal of Heavy Metal Ions from Natural Water Samples. Egyptian Journal of Chemistry 2019, 62, 937–953. [Google Scholar] [CrossRef]
- Van, H.T.; Nguyen, L.H.; Nguyen, V.D.; Nguyen, X.H.; Nguyen, T.H.; Nguyen, T.V.; … Tran, H.N. Characteristics and mechanisms of cadmium adsorption onto biogenic aragonite shells-derived biosorbent: Batch and column studies. Journal of Environmental Management 2019, 241, 535–548. [Google Scholar] [CrossRef]
- Masel, R. (2019) Principles of Adsorption and Reaction on Solid Surfaces. Wiley, Hoboken, 235-248.
- Islam, M.A.; Chowdhury, M.A.; Mozumder, Md. S. I.; & Uddin, Md. T.; Uddin, Md. T. Langmuir Adsorption Kinetics in Liquid Media: Interface Reaction Model. ACS Omega 2021, 6, 14481–14492. [Google Scholar] [CrossRef]
- Bullen, J.C.; Saleesongsom, S.; Gallagher, K.; & Weiss, D.J.; Weiss, D. J. A Revised Pseudo-Second-Order Kinetic Model for Adsorption, Sensitive to Changes in Adsorbate and Adsorbent Concentrations. Langmuir 2021, 37, 3189–3201. [Google Scholar] [CrossRef]
- Chu, K.H. Fixed bed sorption: Setting the record straight on the Bohart–Adams and Thomas models. Journal of Hazardous Materials 2010, 177, 1006–1012. [Google Scholar] [CrossRef] [PubMed]
- Hai, N.T.; Huan-Ping Chao. Adsorption and desorption of potentially toxic metals on modified biosorbents through new green grafting process. Environmental Science and Pollution Research 2018, 25, 12808–12820. [Google Scholar]
- Gustavo Ferreira Coelho, Affonso Celso Gonçalves, Schwantes, D.; Esperanza Álvarez Rodríguez, Teixeira, R.; Dragunski, D.; & Élio Conradi Junior. Removal of Cd(II), Pb(II) and Cr(III) from water using modified residues of Anacardium occidentale L. Applied Water Science.
- Lavecchia, R.; & Zuorro, A.; Zuorro, A. Adsorption of Pb(II) on Spent Leaves of Green and Black Tea. American Journal of Applied Sciences 2010, 7, 153–159. [Google Scholar]
- Chao, H.-P.; Chang, C.-C.; & Nieva, A.; Nieva, A. Biosorption of heavy metals on Citrus maxima peel, passion fruit shell, and sugarcane bagasse in a fixed-bed column. Journal of Industrial and Engineering Chemistry 2014, 20, 3408–3414. [Google Scholar] [CrossRef]
- Wang, Q.; Wang, Y.; Tang, J.; Yang, Z.; Zhang, L.; & Huang, X.; Huang, X. New insights into the interactions between Pb(II) and fruit waste biosorbent. Chemosphere 2022, 303, 135048. [Google Scholar] [CrossRef]
- Apiratikul, R.; & Pavasant, P.; Pavasant, P. Batch and column studies of biosorption of heavy metals by Caulerpa lentillifera. Bioresource Technology 2008, 99, 2766–2777. [Google Scholar] [CrossRef]
Figure 1.
FTIR spectra of luffa peels before and after treatments.
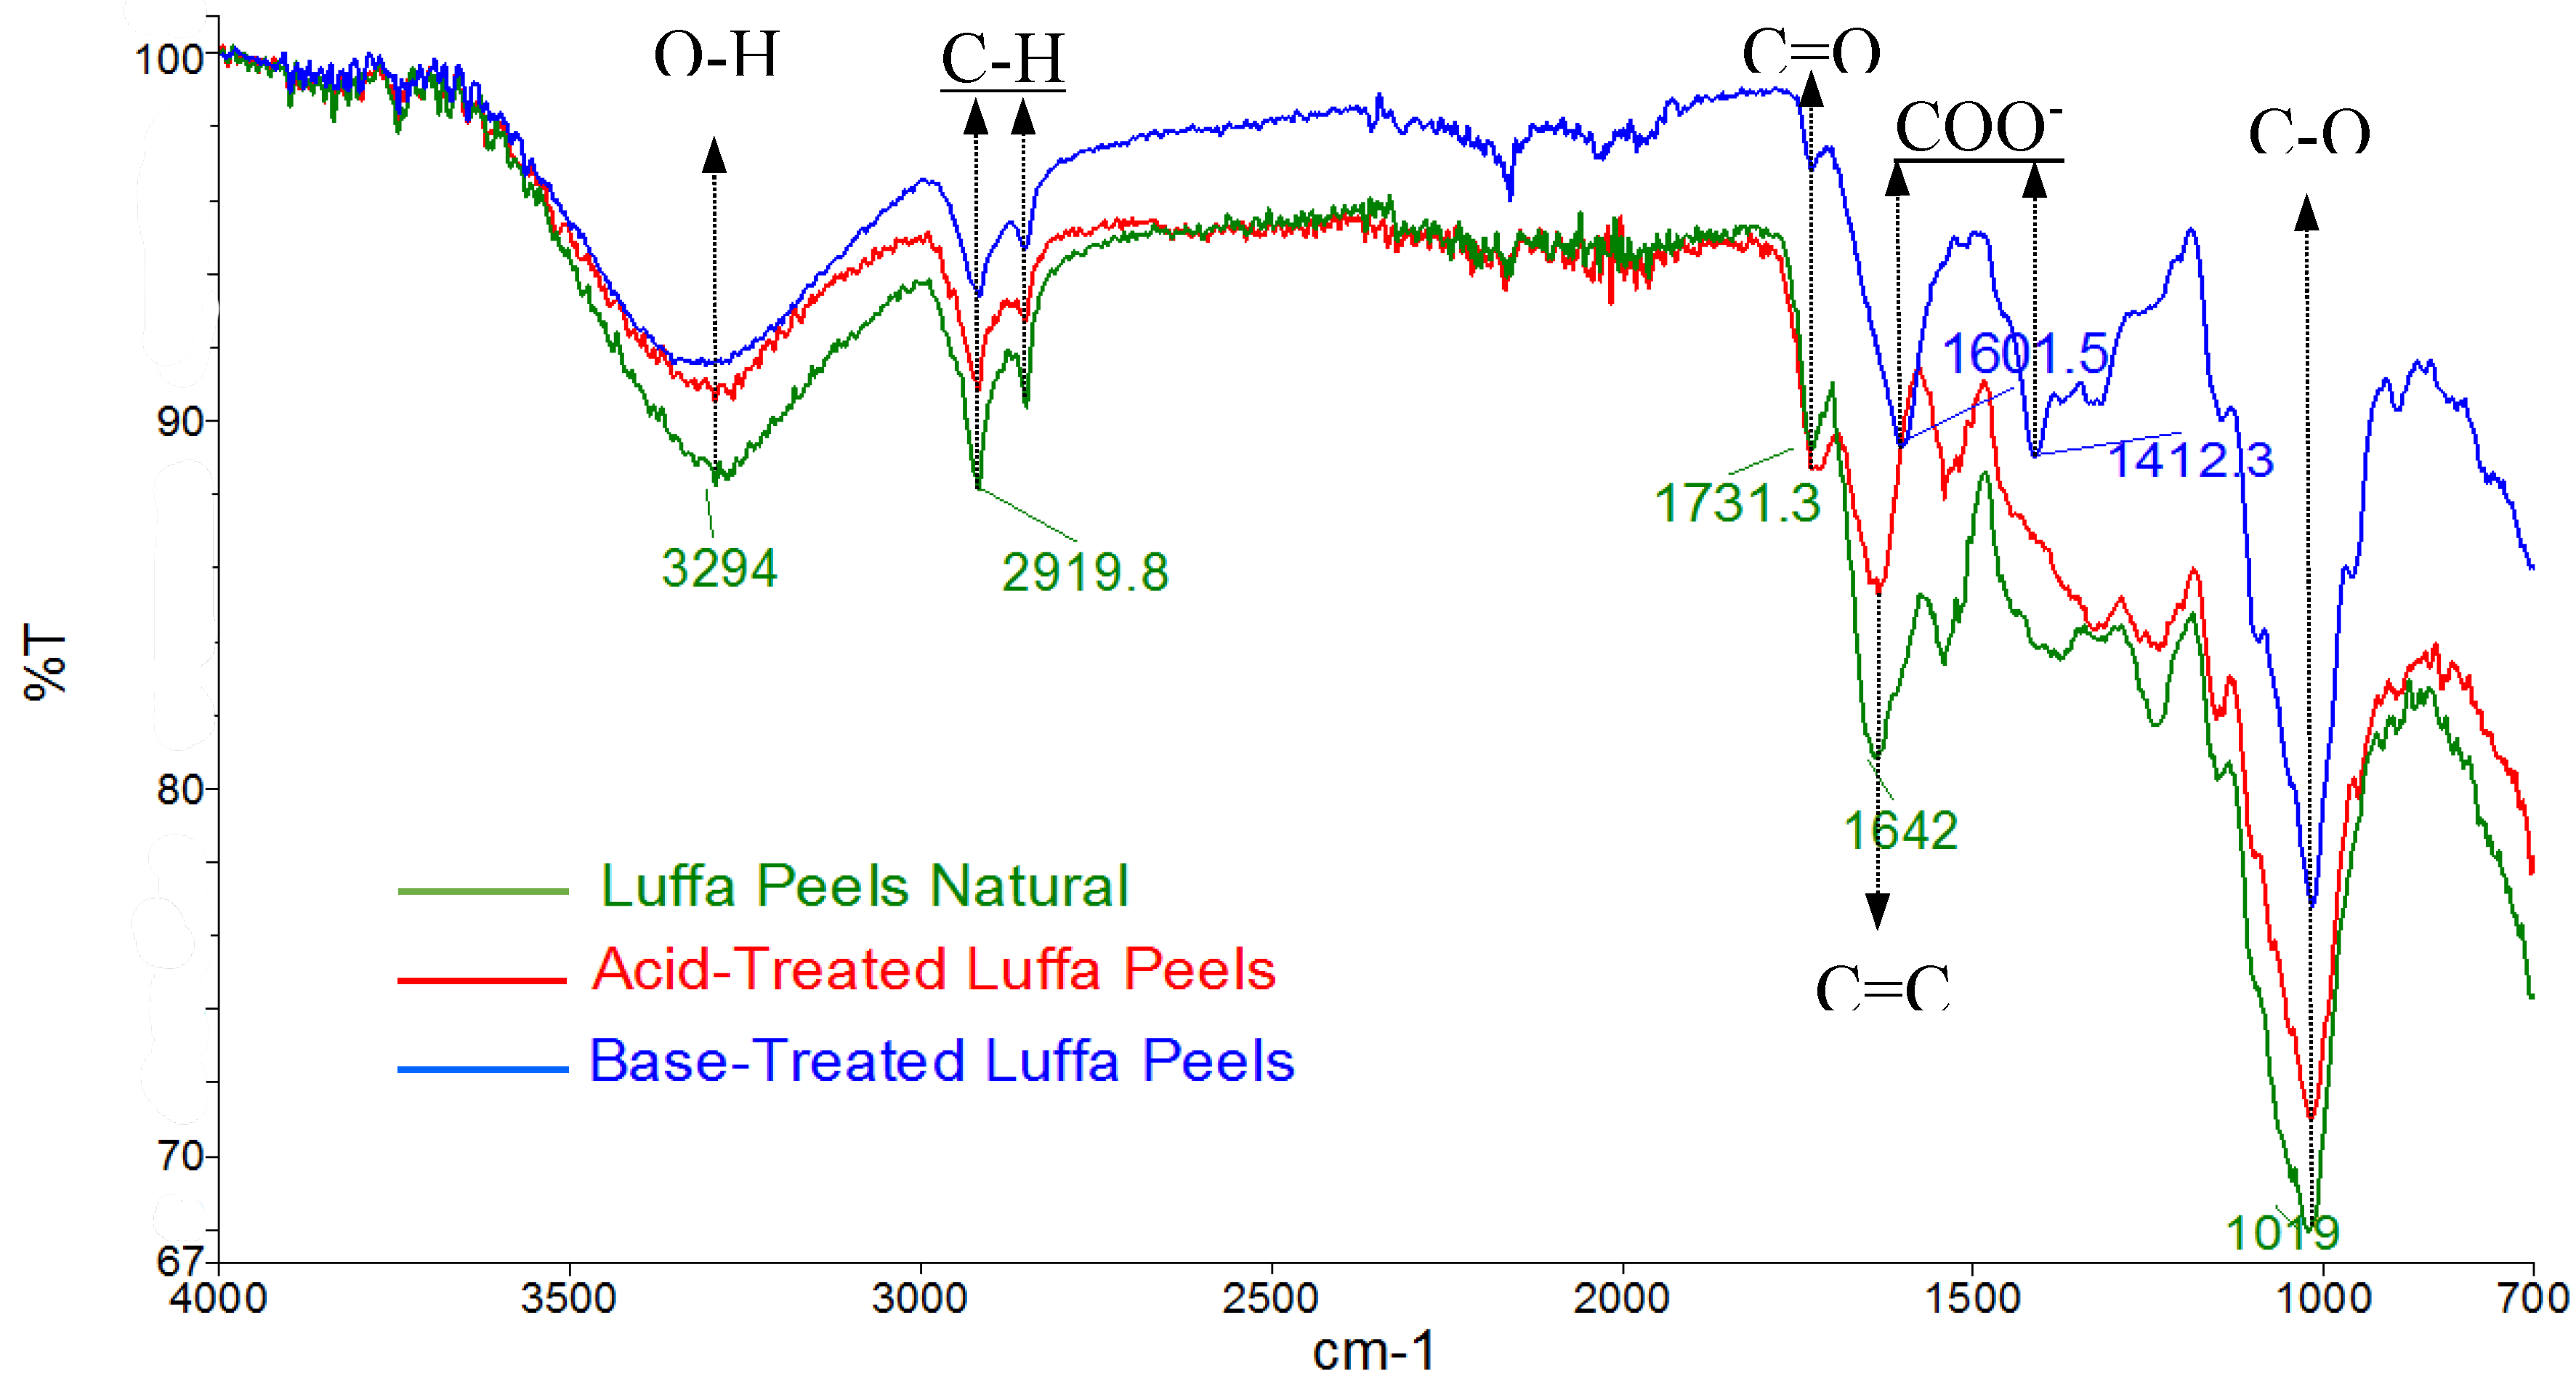
Figure 2.
FTIR spectra of chamomile flowers before and after treatments.
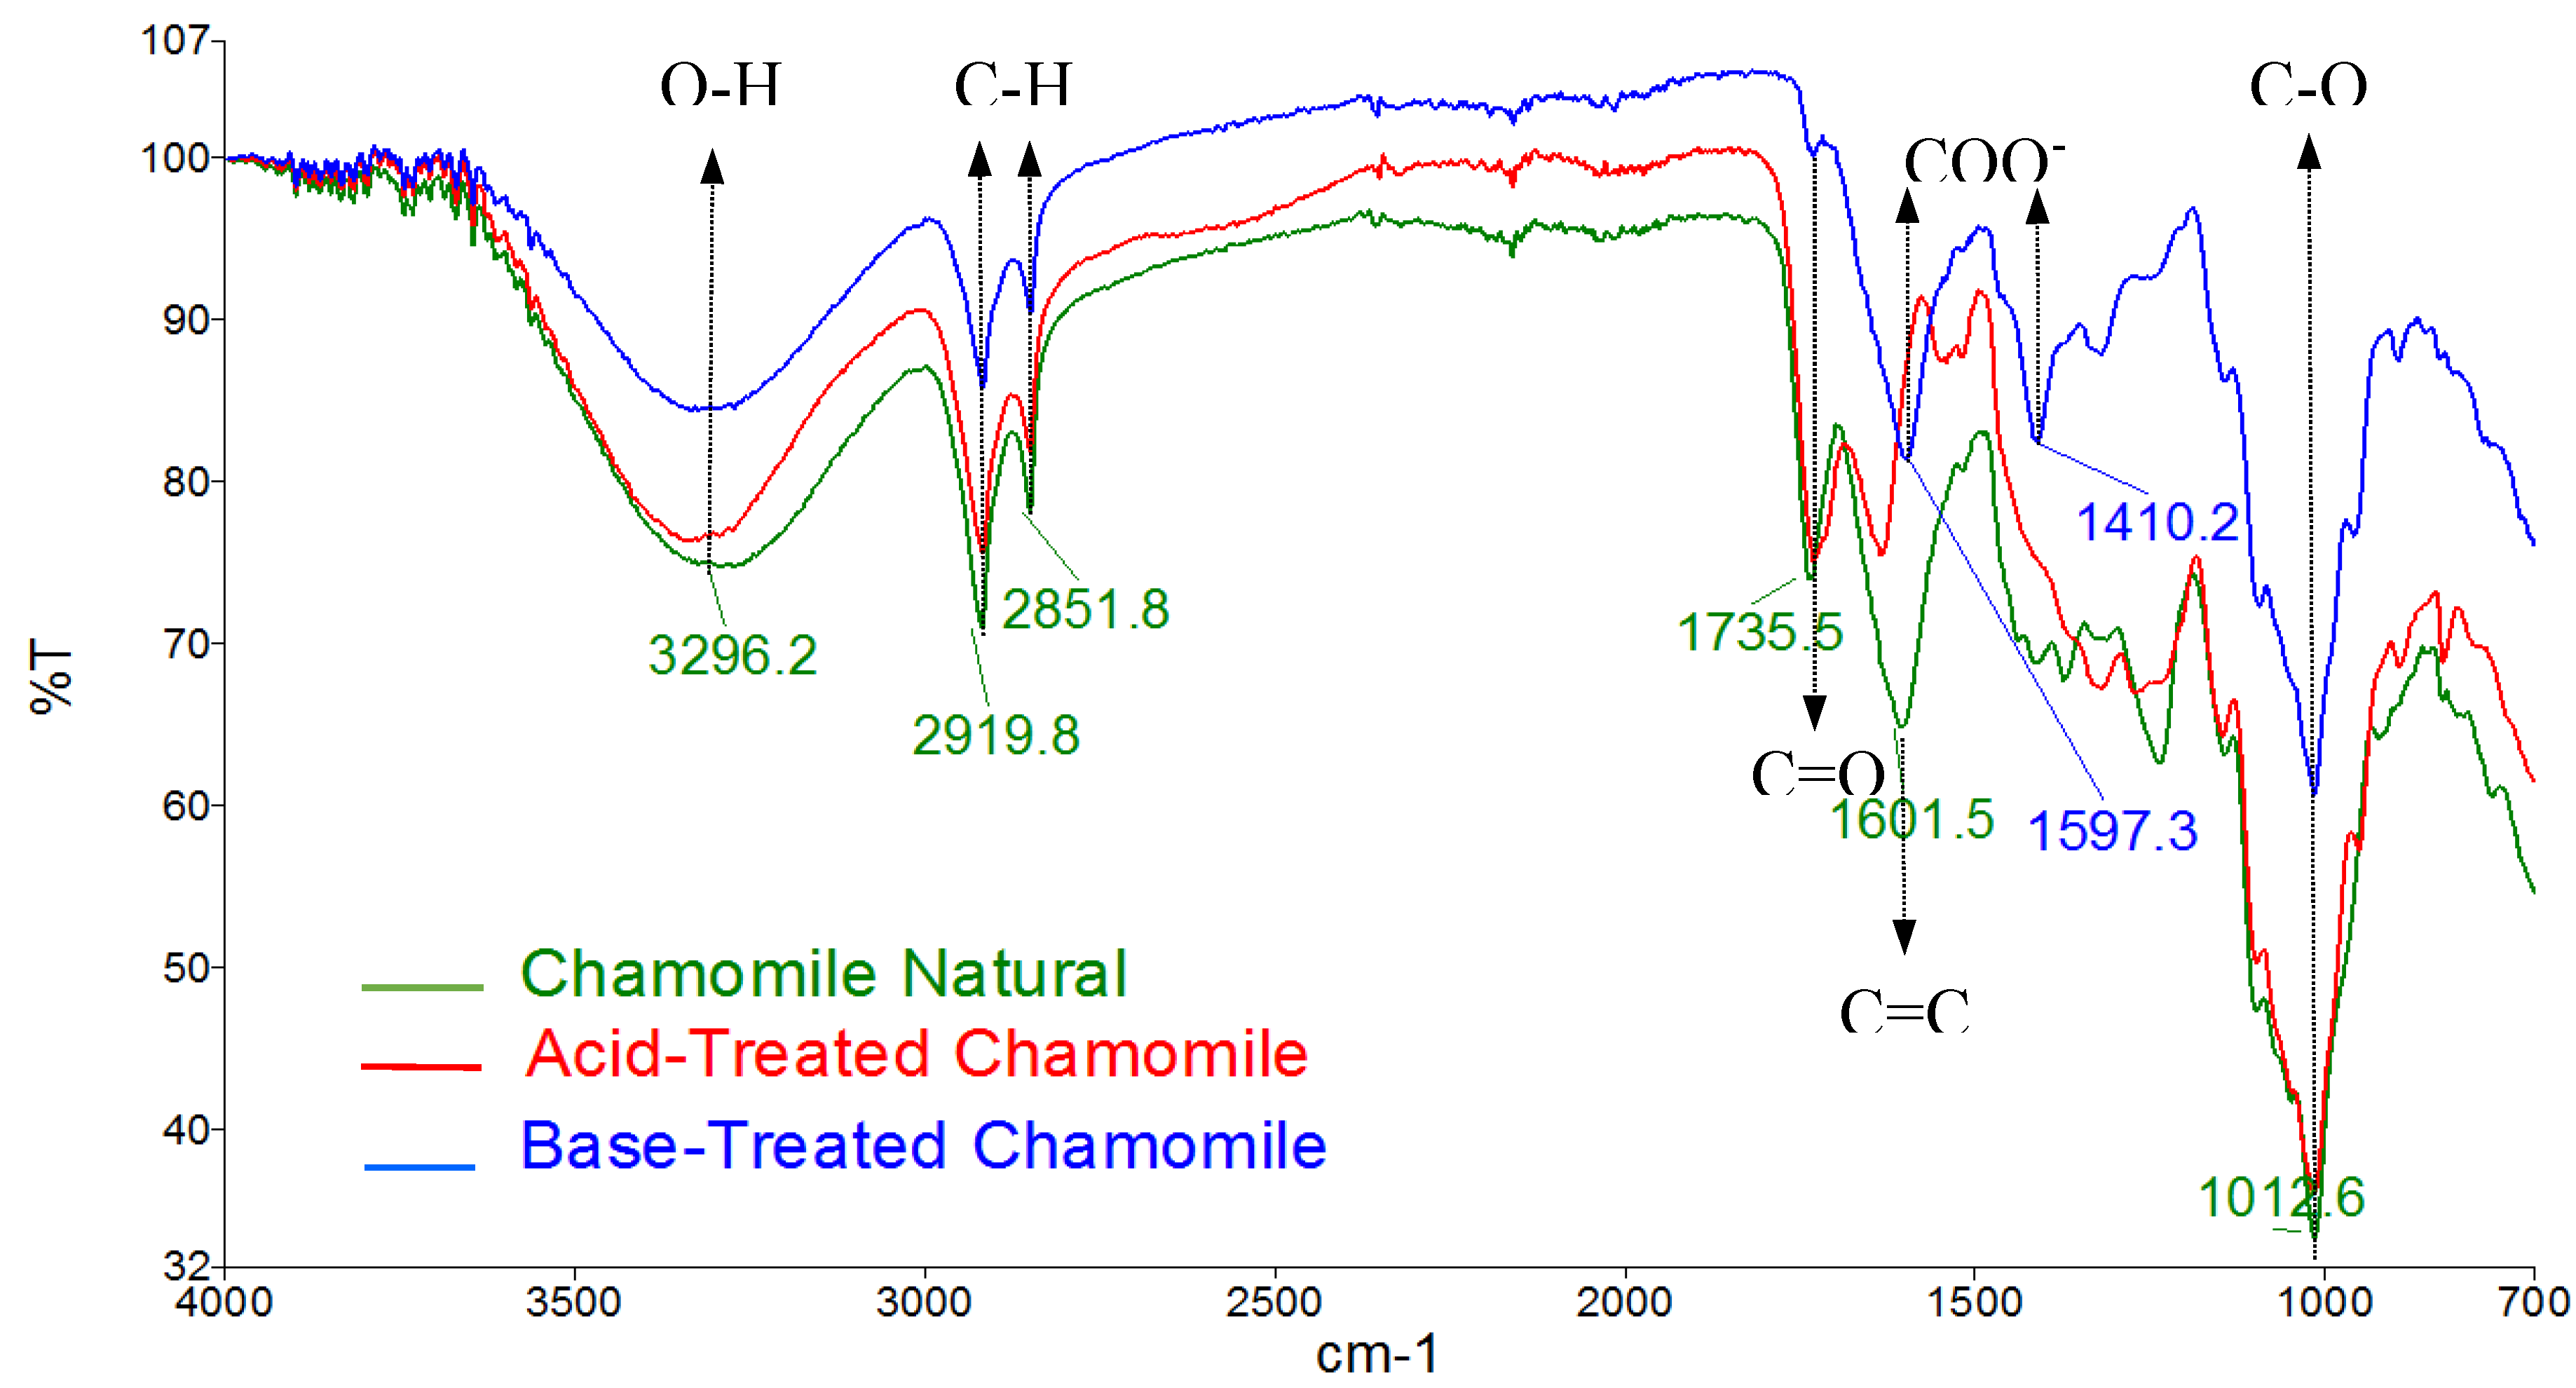
Figure 3.
FTIR spectra of acid-treated chamomile flowers before and after Pb(II) adsorption at pH 2.8.
Figure 3.
FTIR spectra of acid-treated chamomile flowers before and after Pb(II) adsorption at pH 2.8.
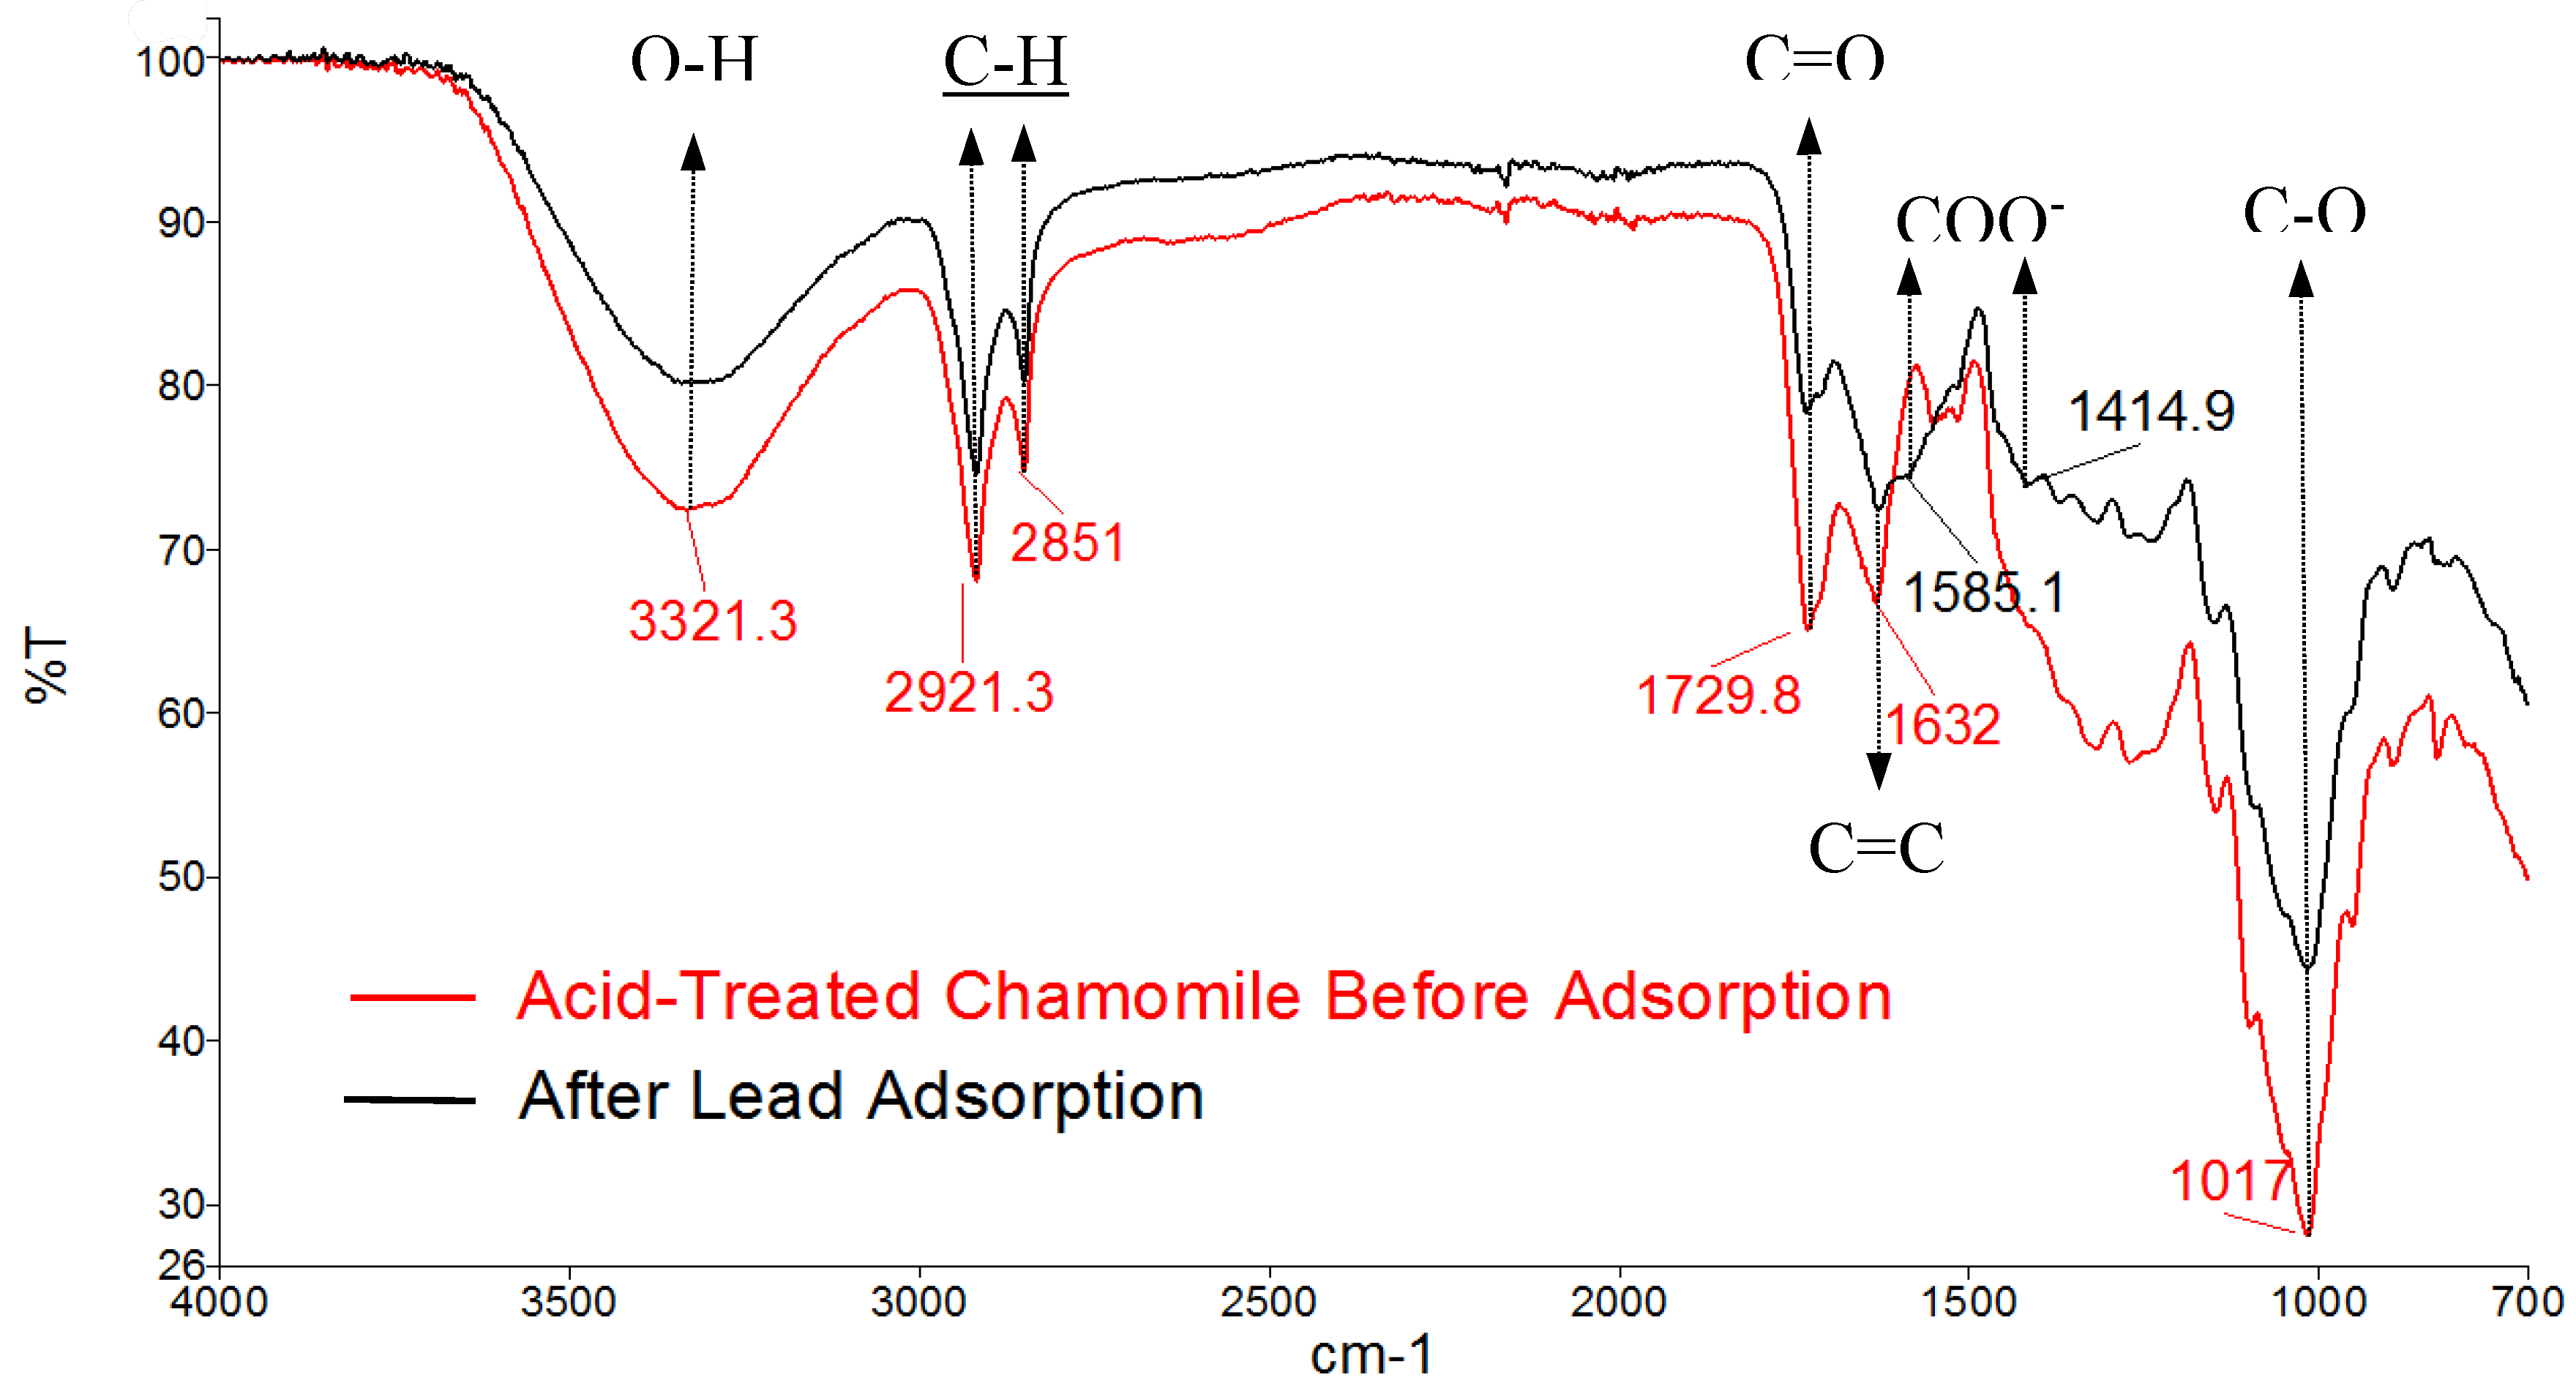
Figure 4.
FTIR spectra of base-treated chamomile flowers before and after Cd(II) adsorption at pH 8.0.
Figure 4.
FTIR spectra of base-treated chamomile flowers before and after Cd(II) adsorption at pH 8.0.
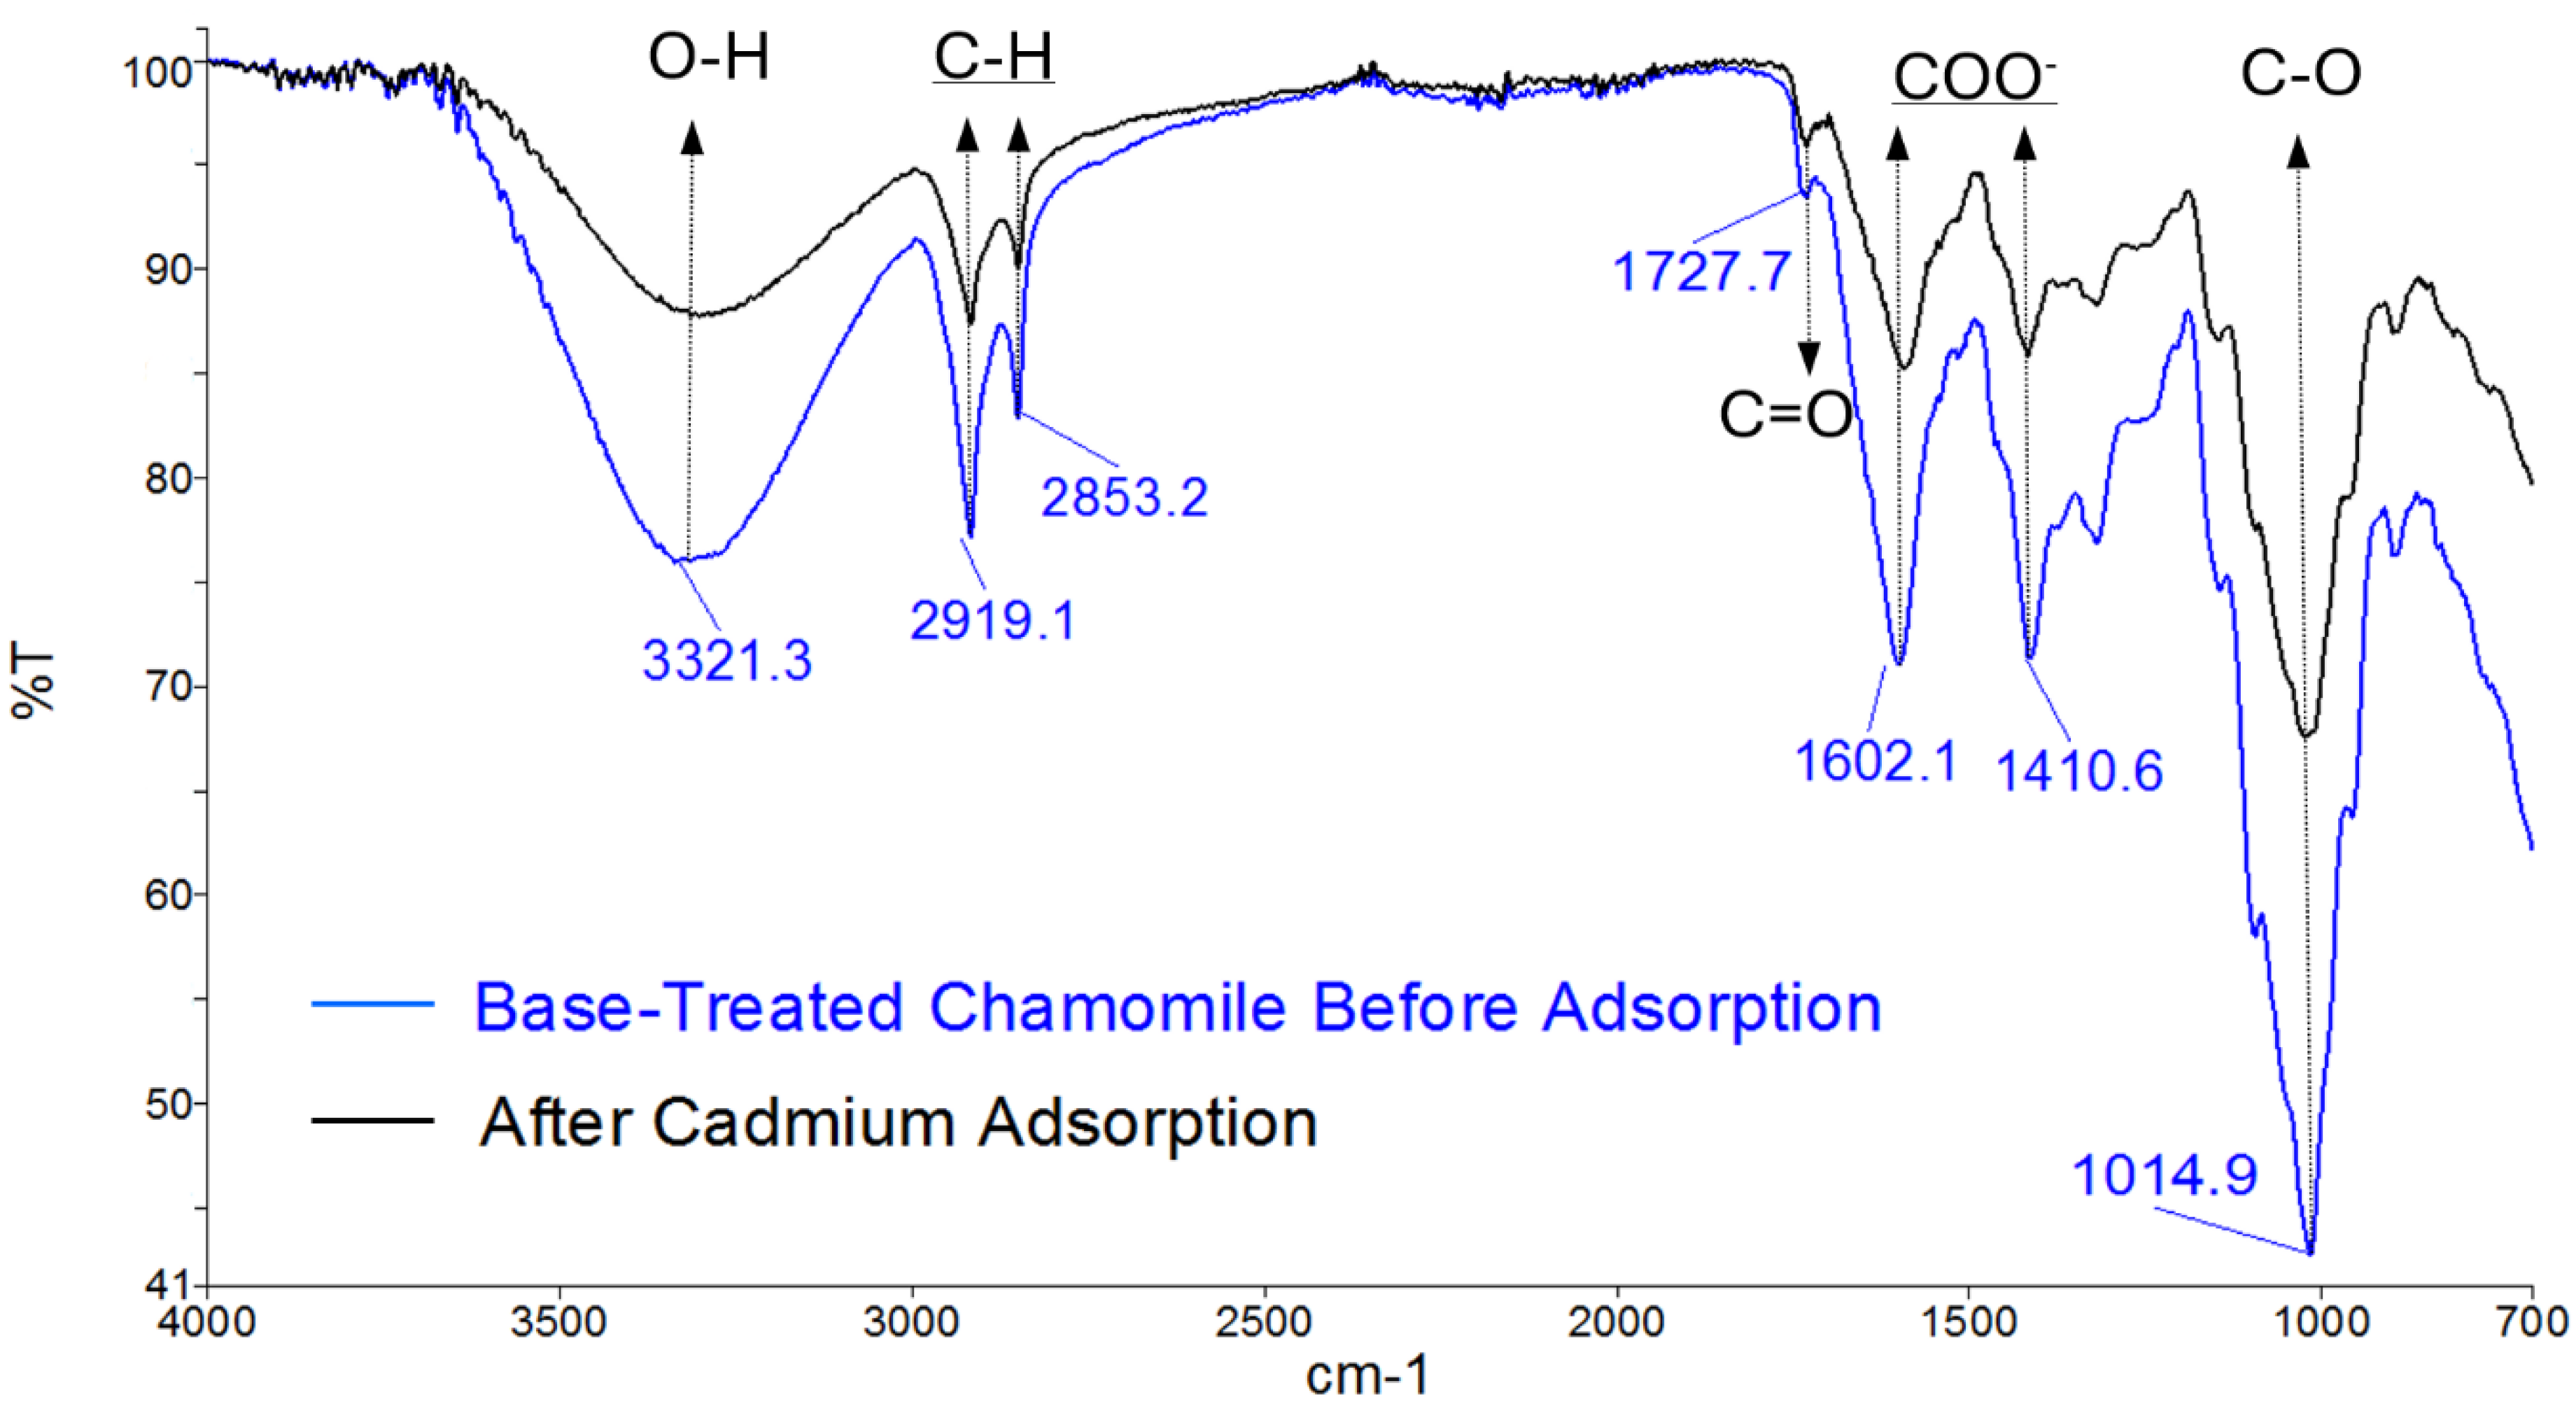
Figure 5.
Mechanism processes of Cd2+ adsorption.
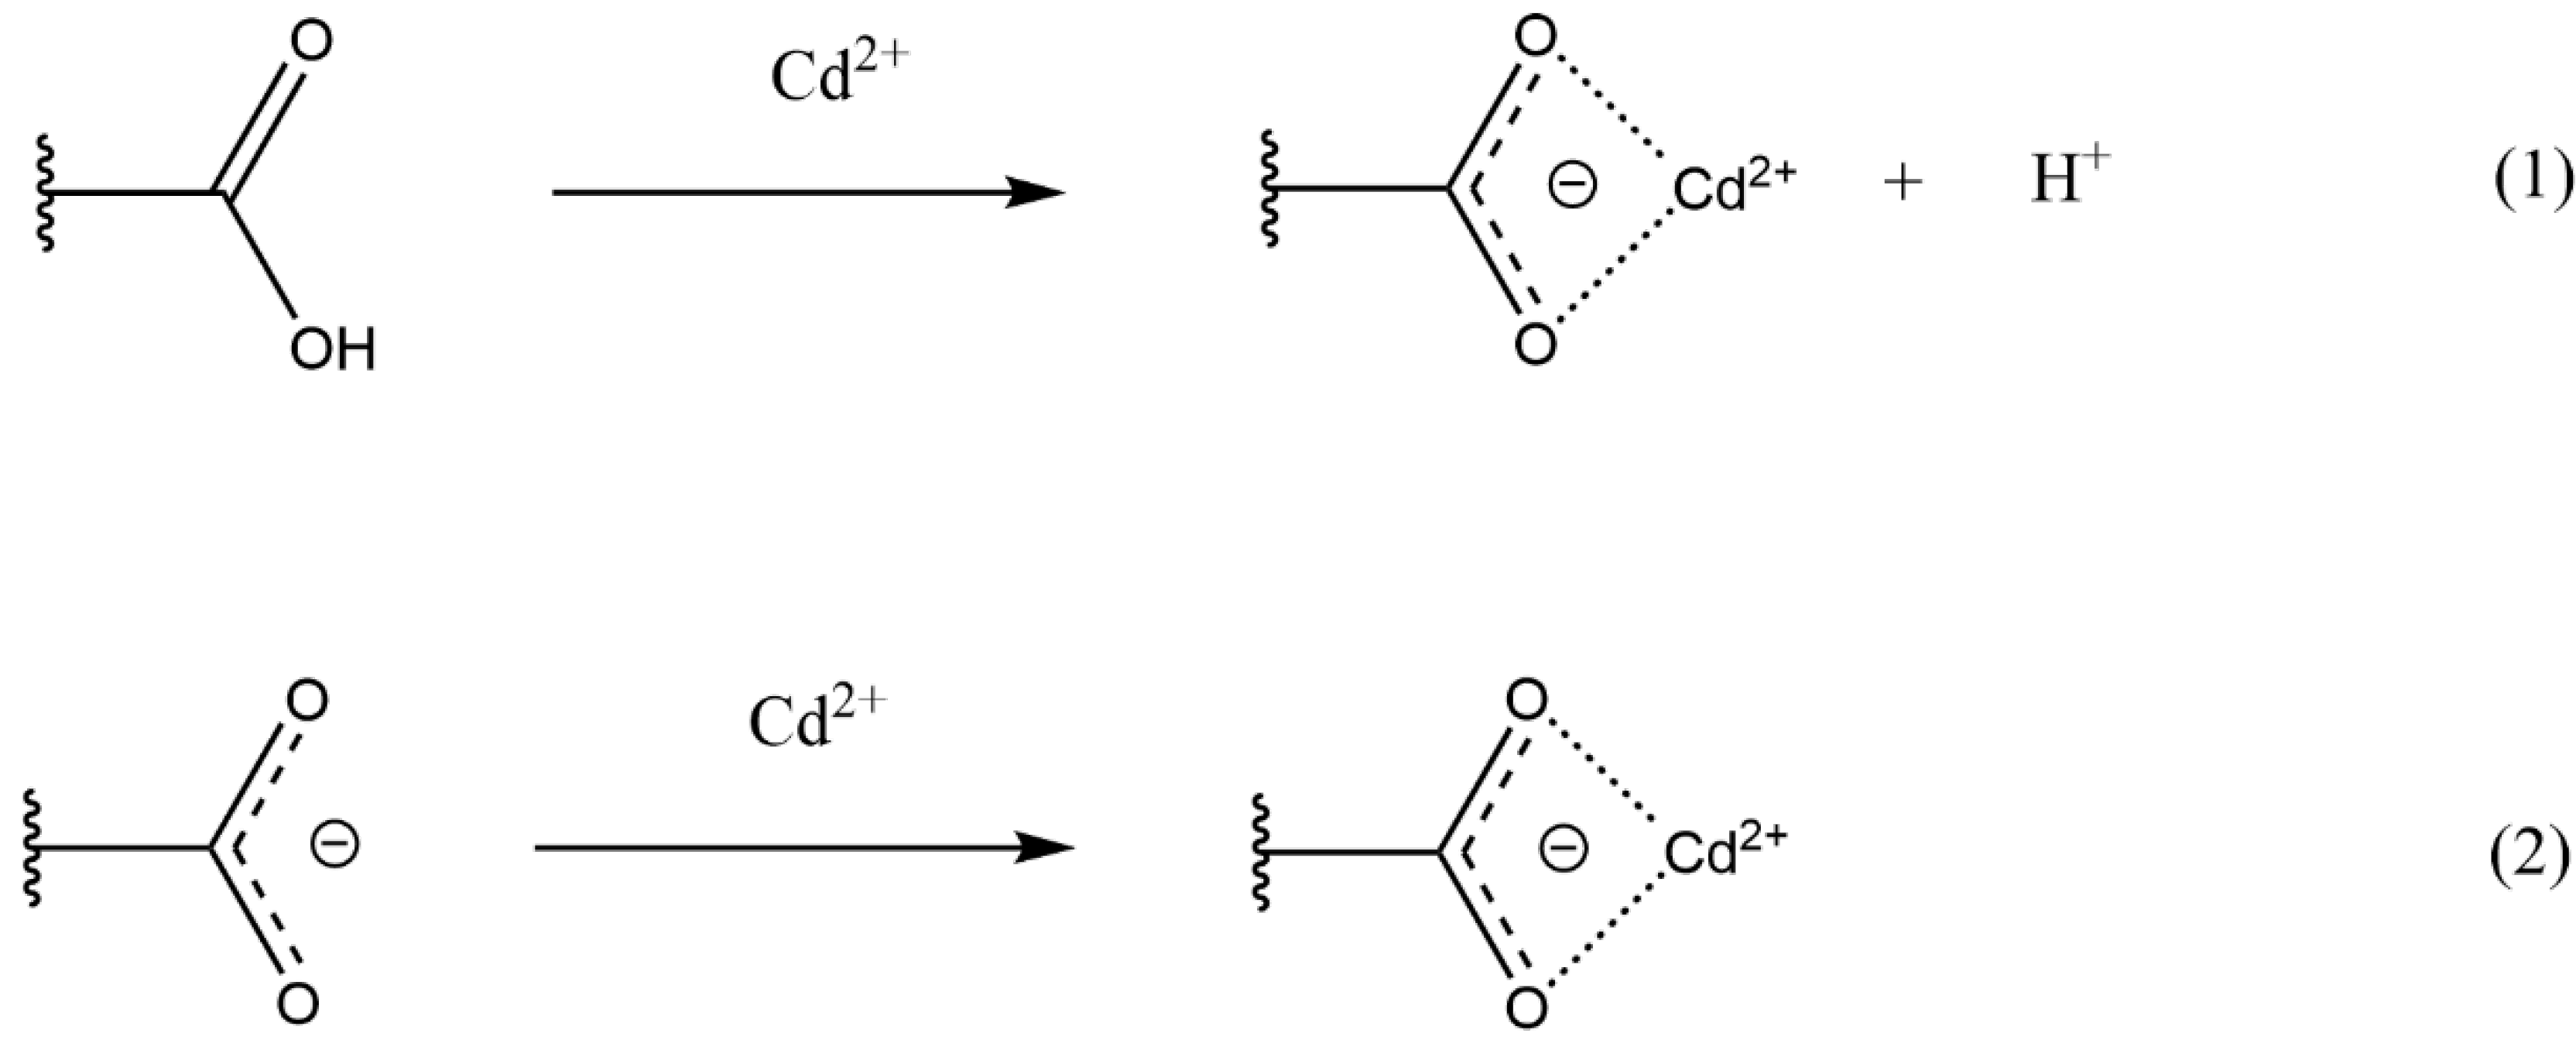
Figure 6.
(a) Qe at various initial concentrations (C0) (b) Freundlich adsorption isotherm linear plots for Pb2+ adsorption on base-treated (●) and acid-treated (■) luffa peels in Pb2+ ion solutions ranging from 5 to 250 ppm at pH 5.6.
Figure 6.
(a) Qe at various initial concentrations (C0) (b) Freundlich adsorption isotherm linear plots for Pb2+ adsorption on base-treated (●) and acid-treated (■) luffa peels in Pb2+ ion solutions ranging from 5 to 250 ppm at pH 5.6.
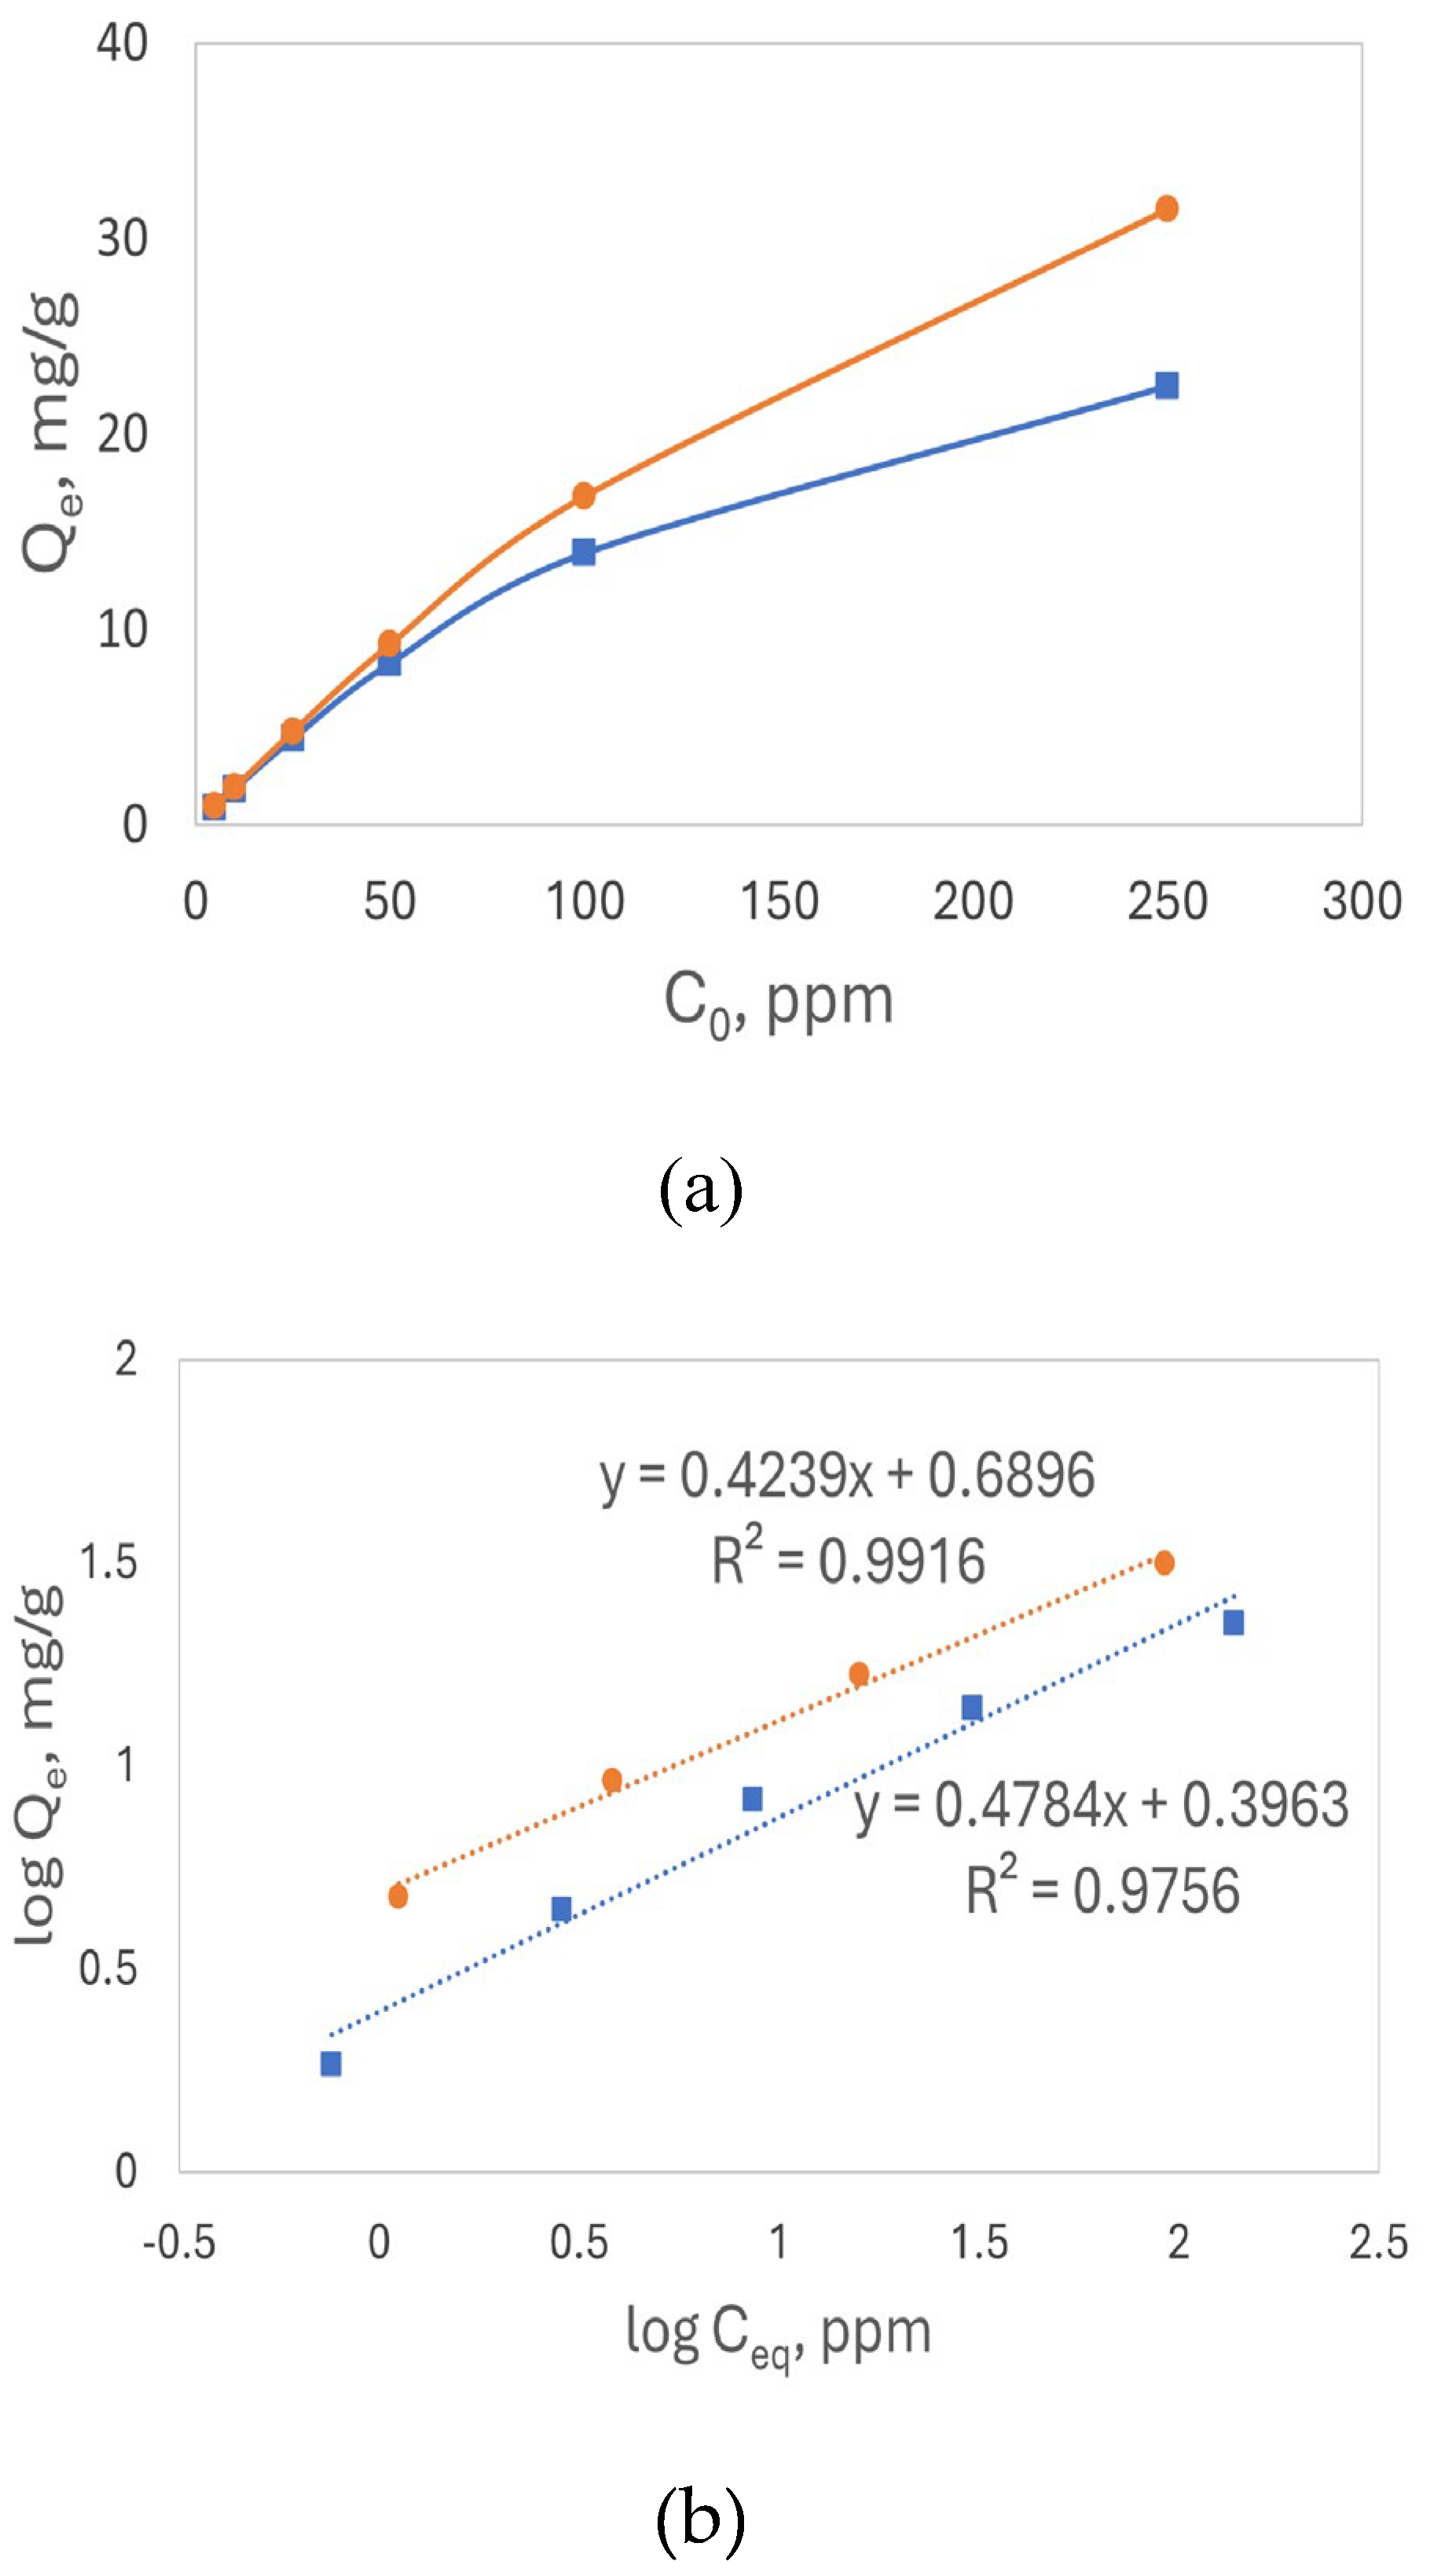
Figure 7.
(a) Qe at various initial concentrations (C0) (b) Freundlich adsorption isotherm linear plots for Cd2+ adsorption on base-treated (●) and acid-treated (■) luffa peels in Cd2+ ion solutions ranging from 5 to 250 ppm at pH 5.6.
Figure 7.
(a) Qe at various initial concentrations (C0) (b) Freundlich adsorption isotherm linear plots for Cd2+ adsorption on base-treated (●) and acid-treated (■) luffa peels in Cd2+ ion solutions ranging from 5 to 250 ppm at pH 5.6.
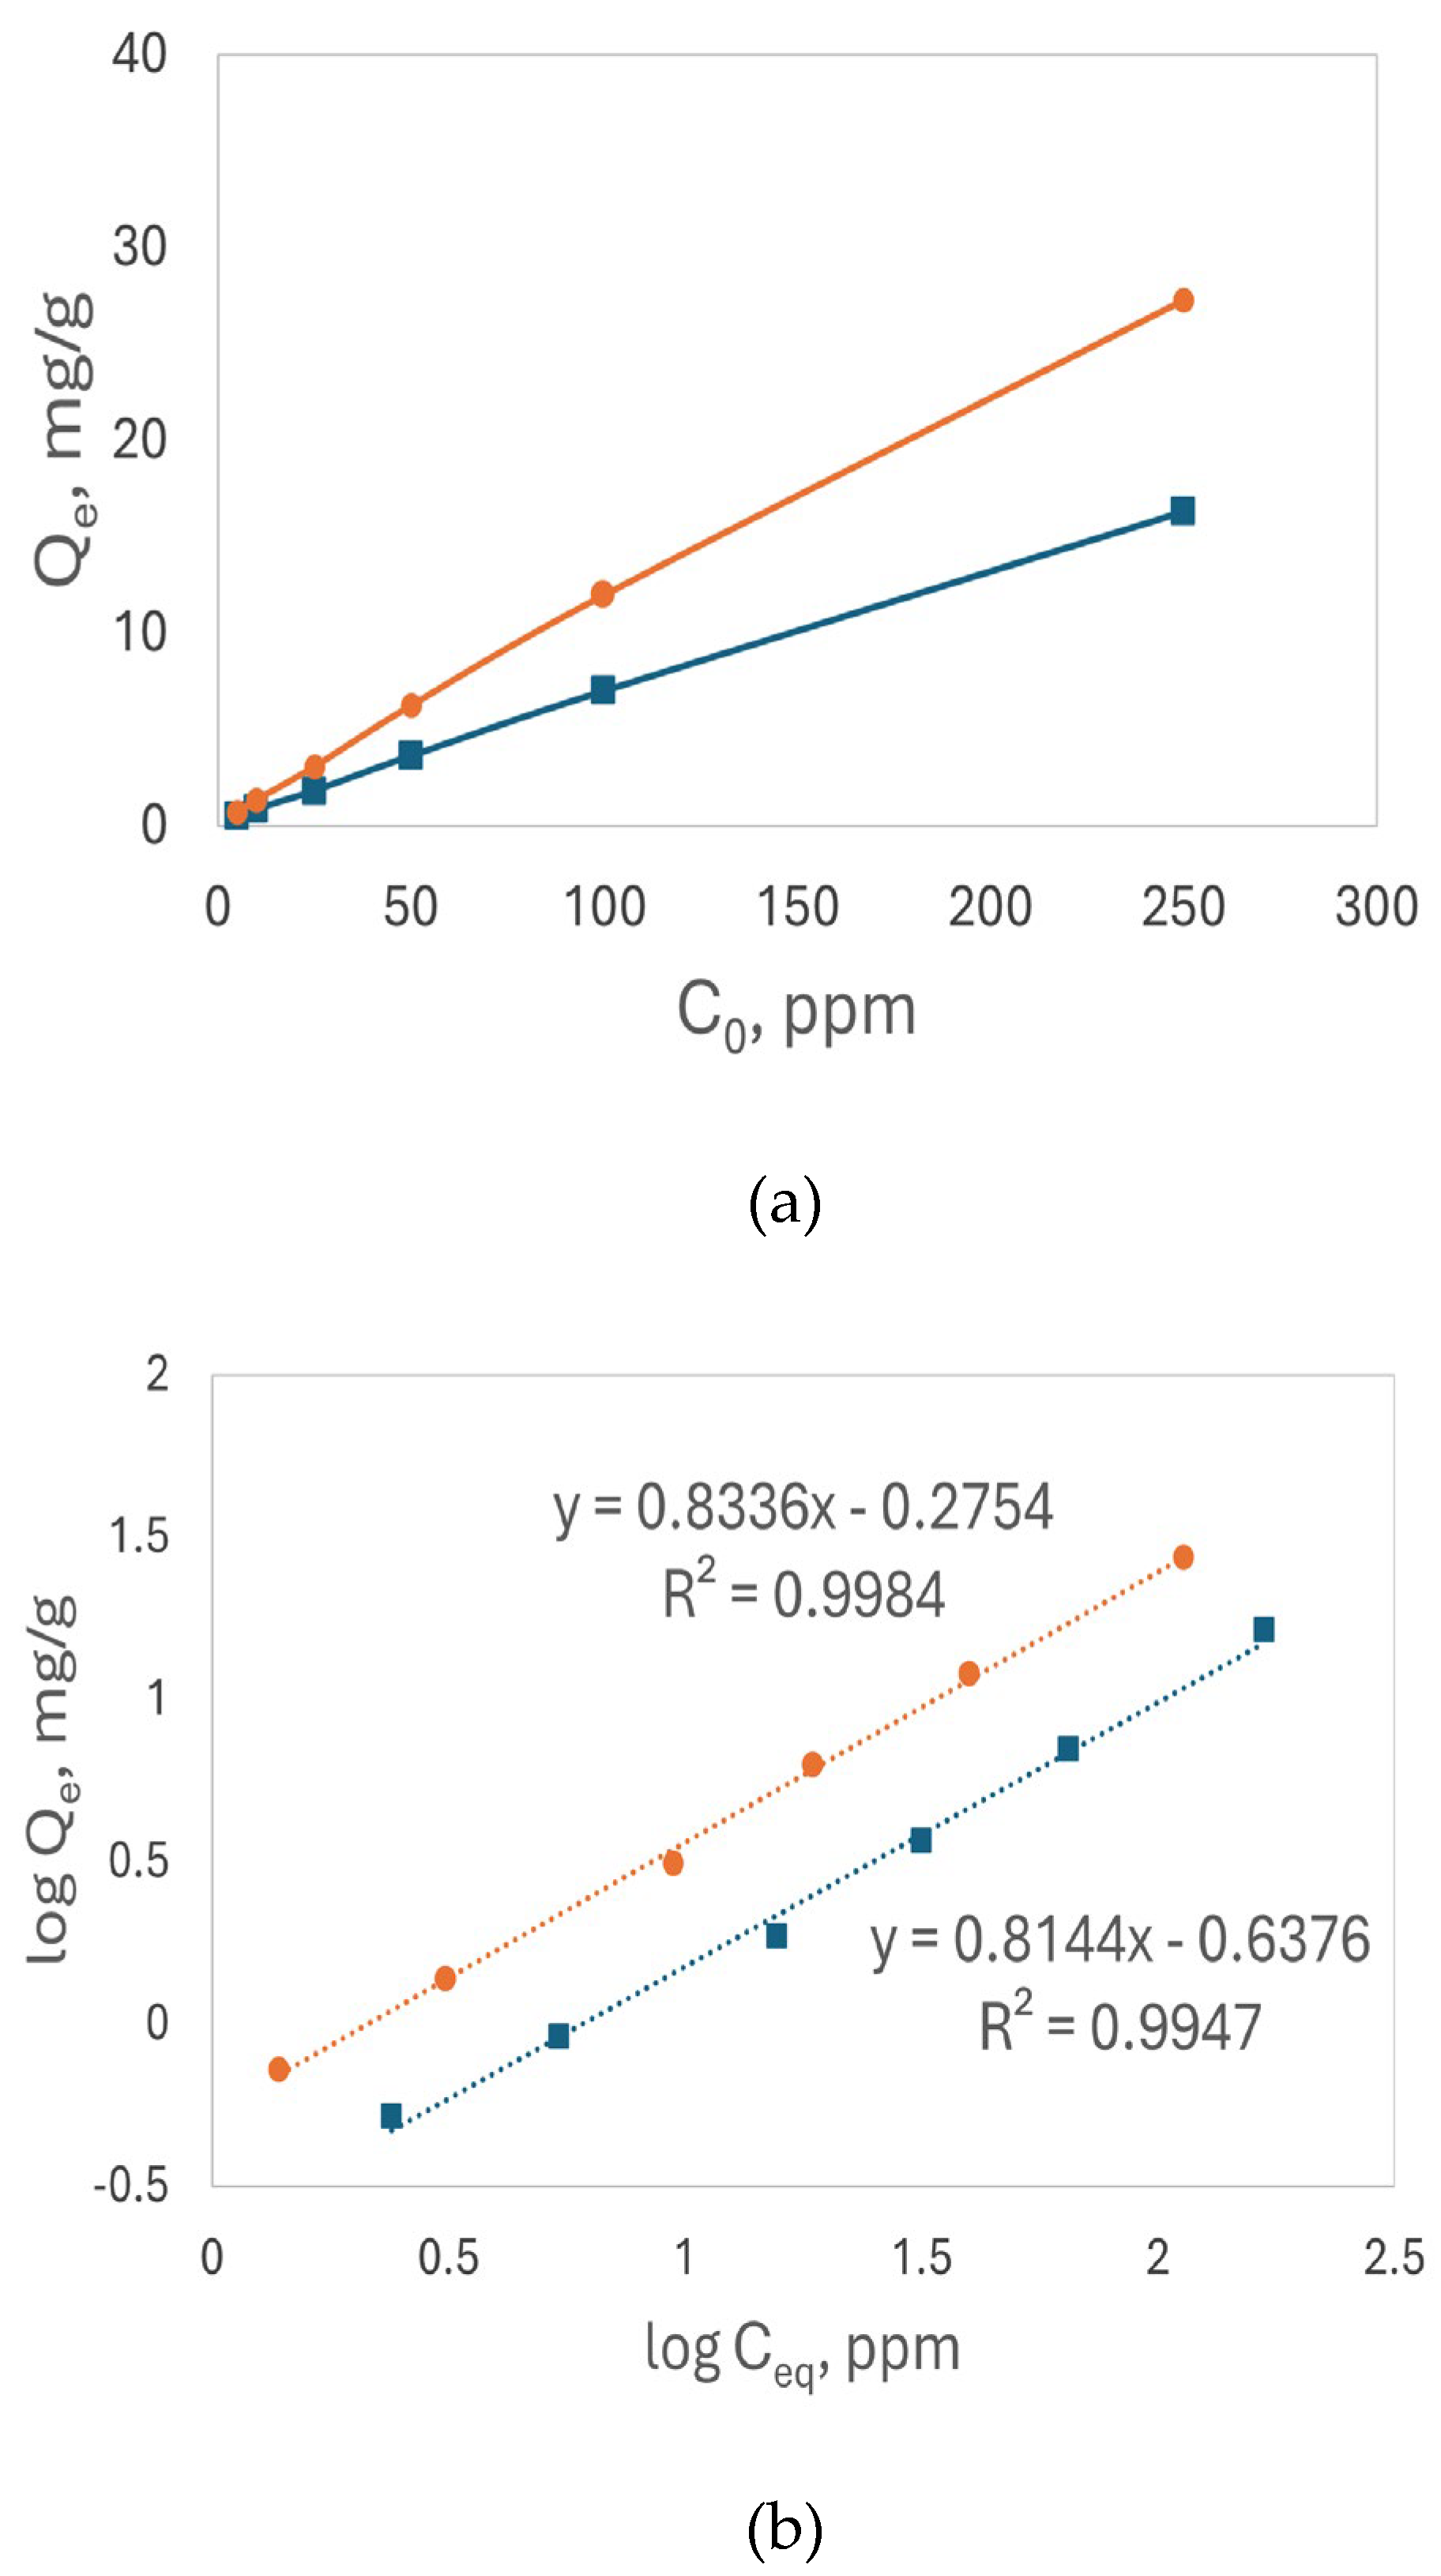
Figure 8.
The Qe of 250 ppm Cd2+ ion solution with base-treated (●) chamomile and (■) luffa peels at pH 5.6 – pH 8.0.
Figure 8.
The Qe of 250 ppm Cd2+ ion solution with base-treated (●) chamomile and (■) luffa peels at pH 5.6 – pH 8.0.
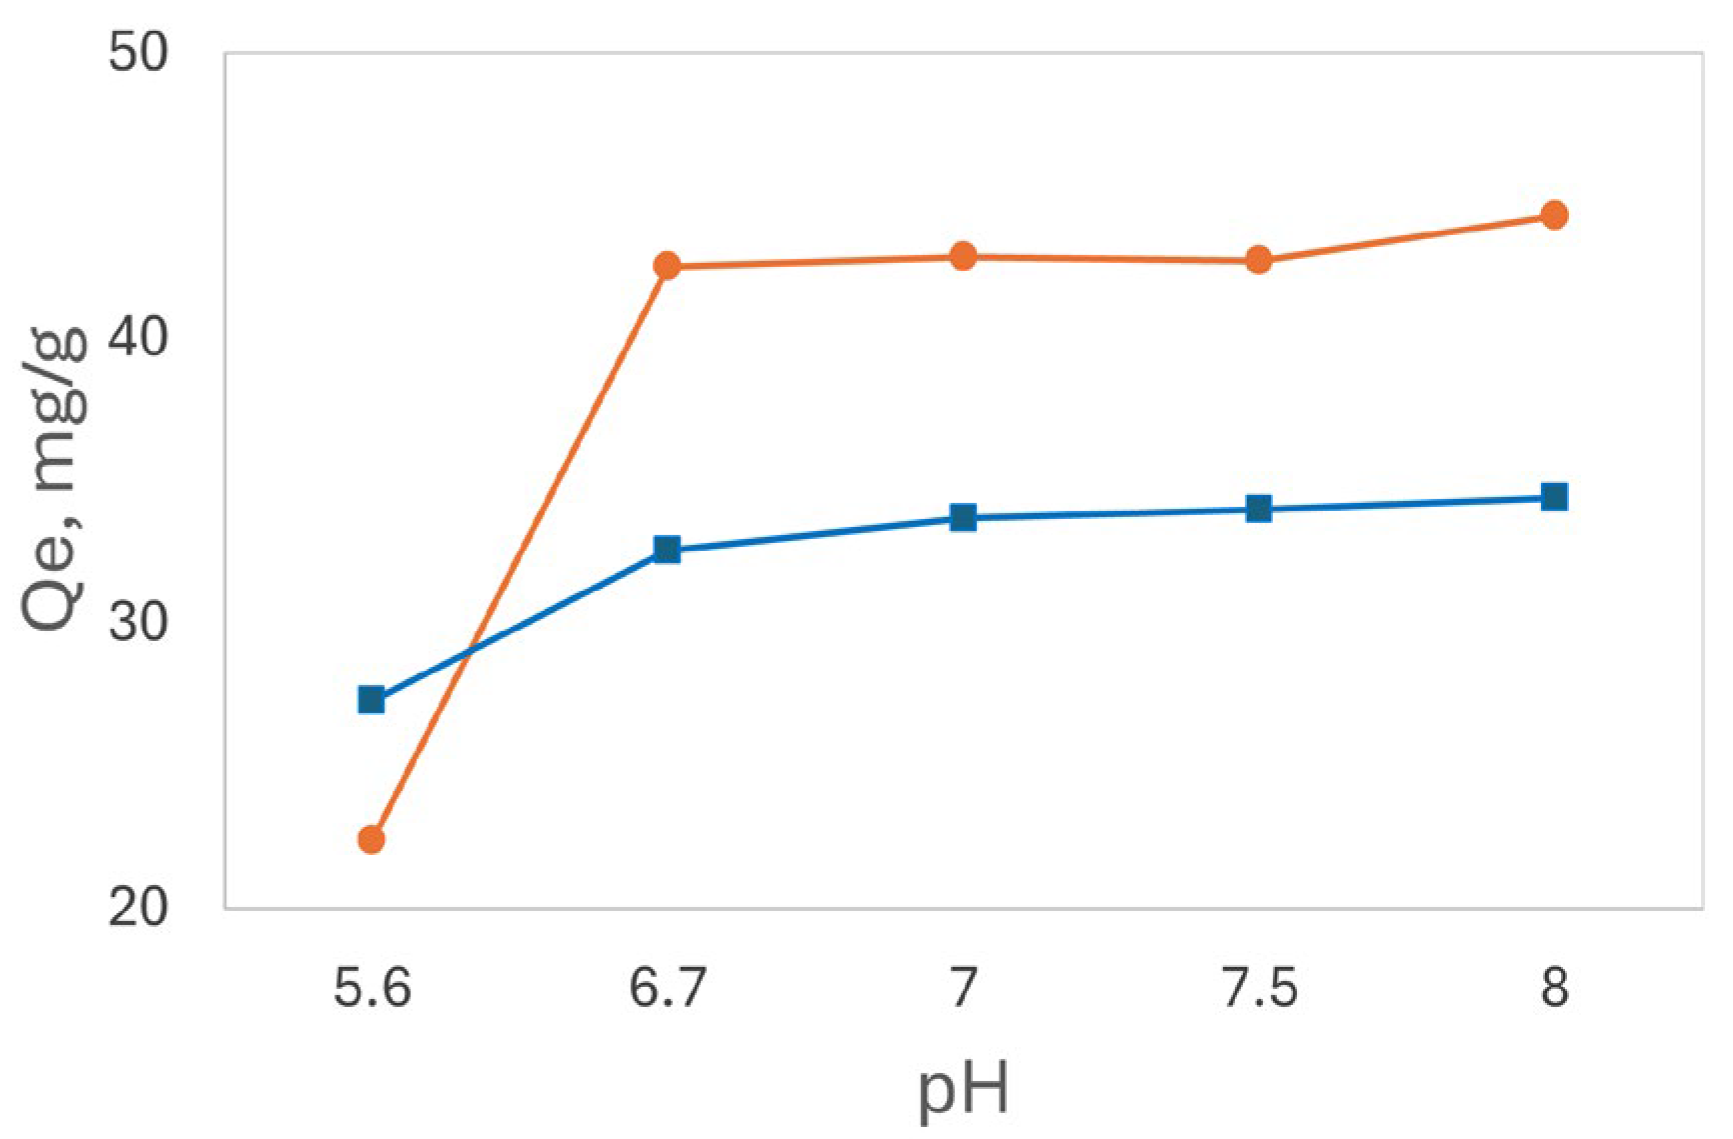
Figure 9.
(a) Langmuir isotherm models and (b) linear plots for Pb2+ adsorption on base-treated (●) and acid-treated (■) luffa peels.
Figure 9.
(a) Langmuir isotherm models and (b) linear plots for Pb2+ adsorption on base-treated (●) and acid-treated (■) luffa peels.
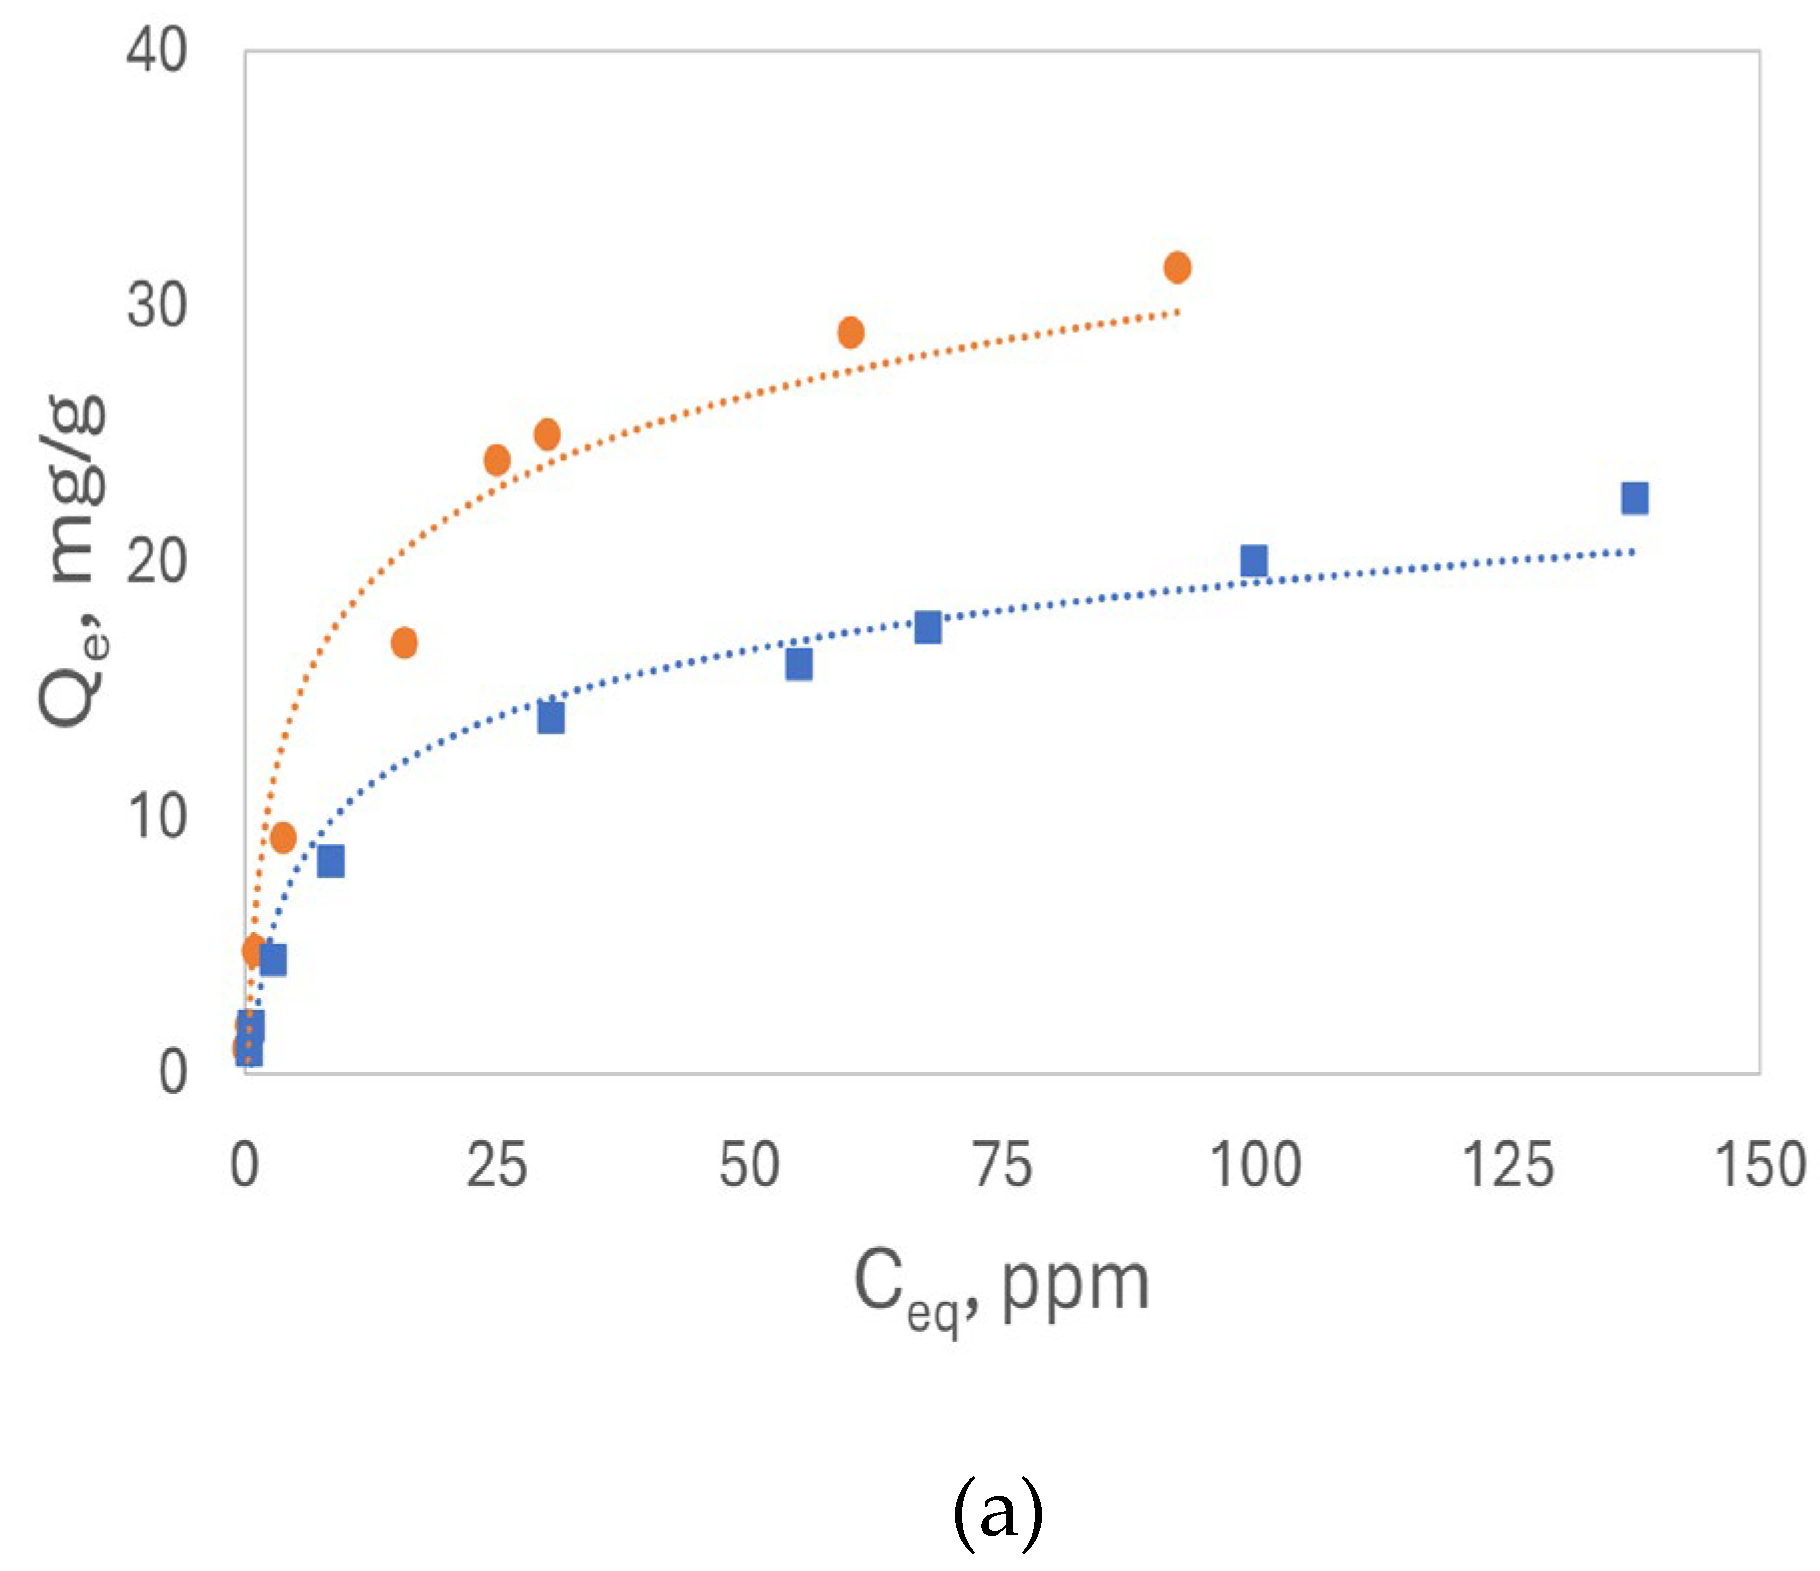
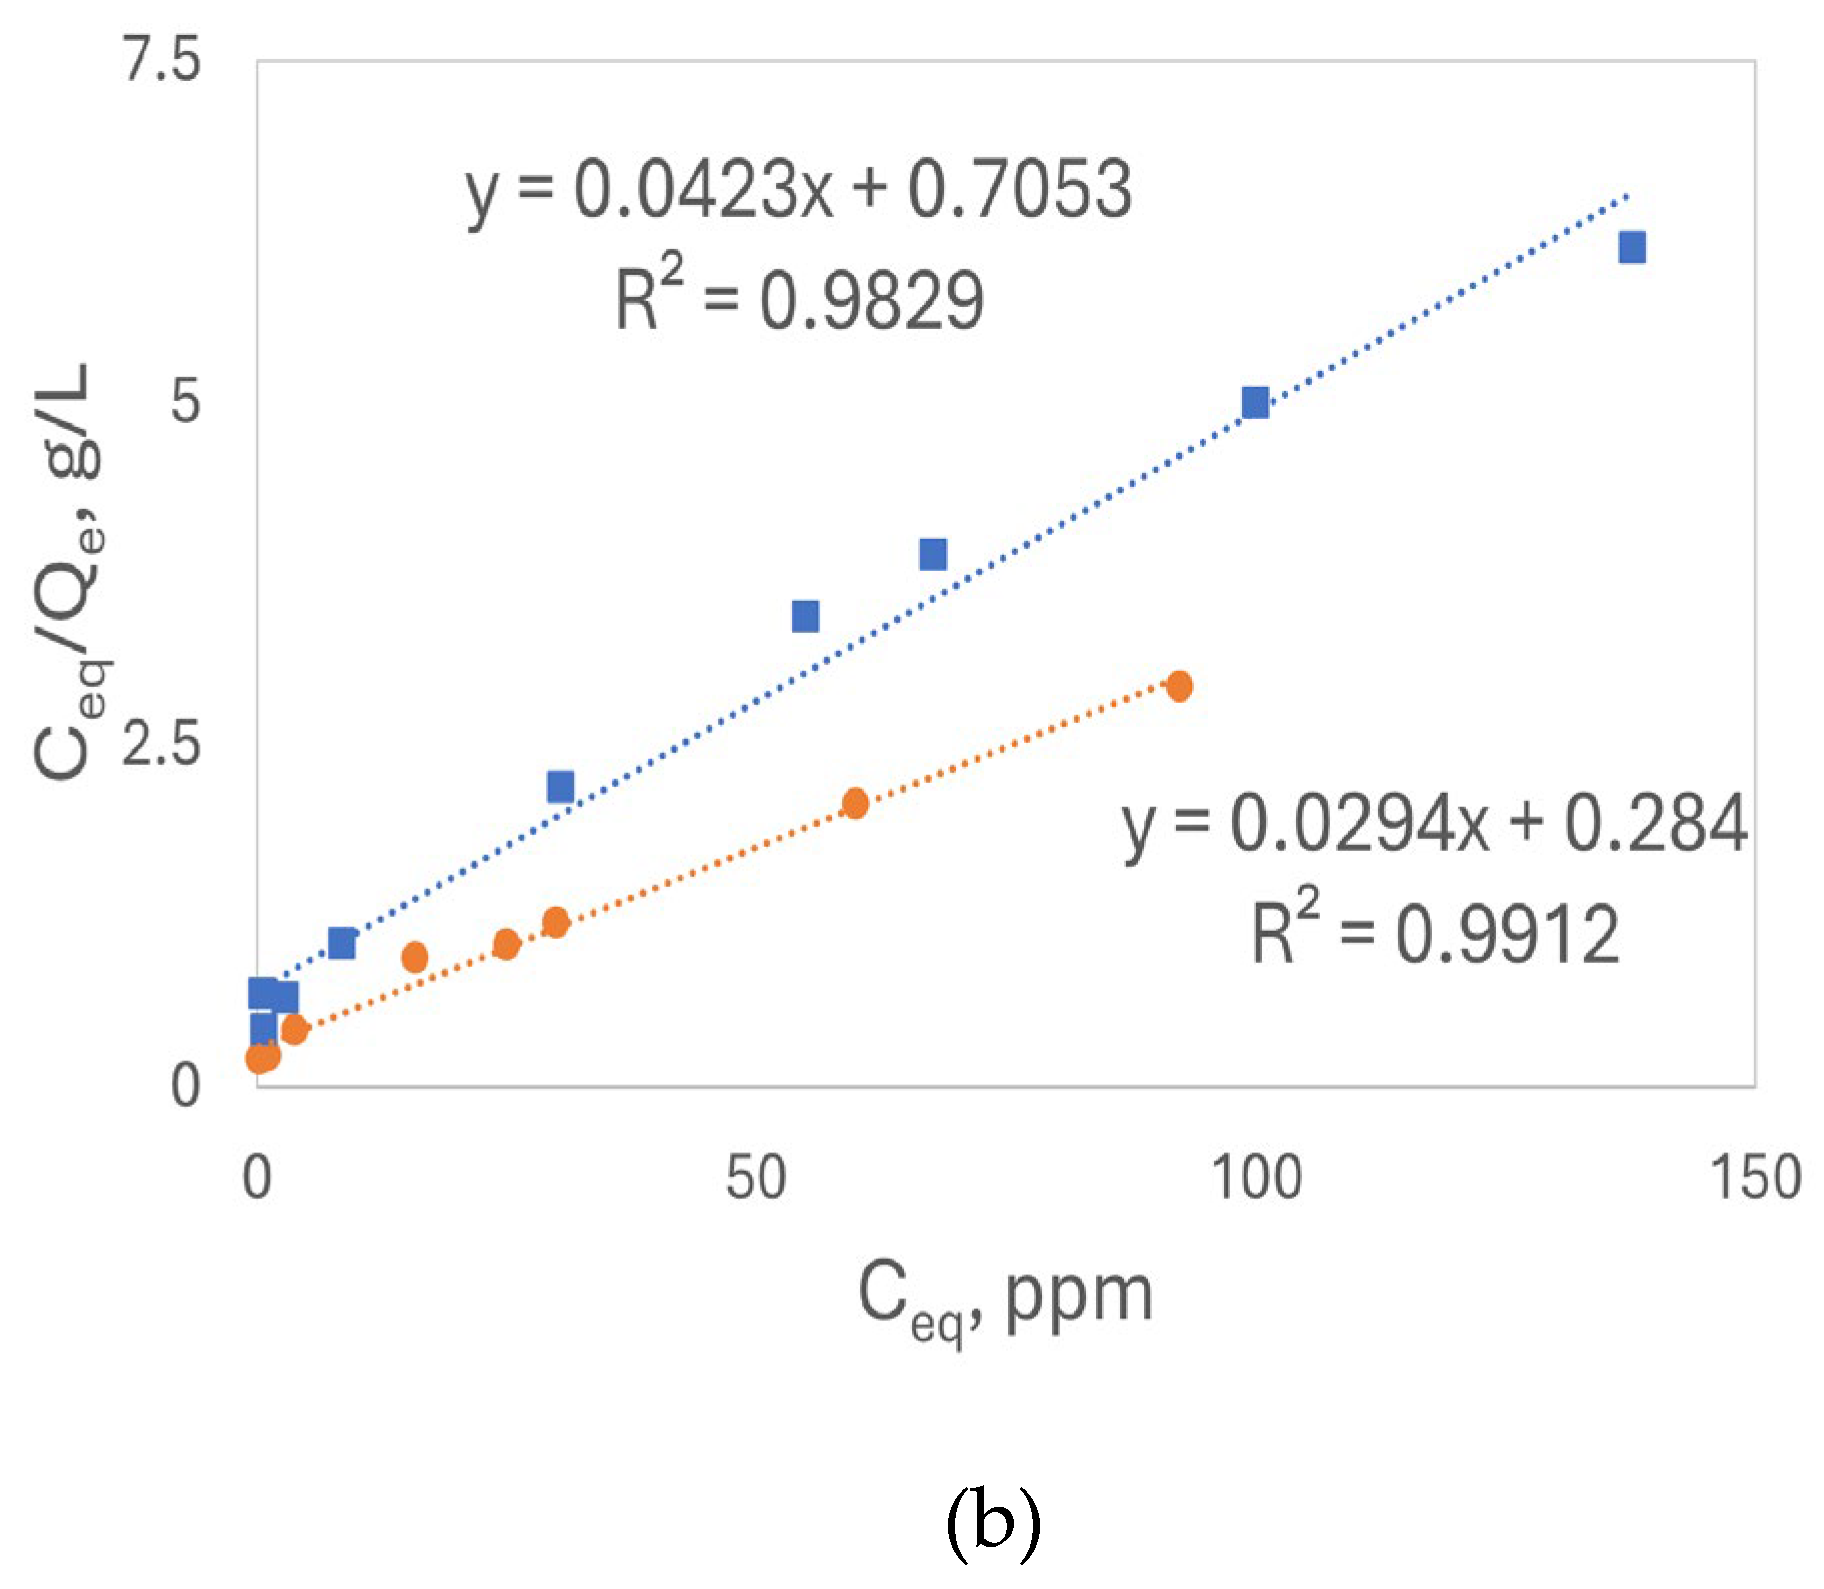
Figure 10.
Pseudo-second order model linear plots for (a) Pb2+ with 250 ppm initial concentration at pH 5.6 (b) Cd2+ with 250 ppm initial concentration at pH 8.0 on base-treated (●) and acid-treated (■) luffa peels.
Figure 10.
Pseudo-second order model linear plots for (a) Pb2+ with 250 ppm initial concentration at pH 5.6 (b) Cd2+ with 250 ppm initial concentration at pH 8.0 on base-treated (●) and acid-treated (■) luffa peels.
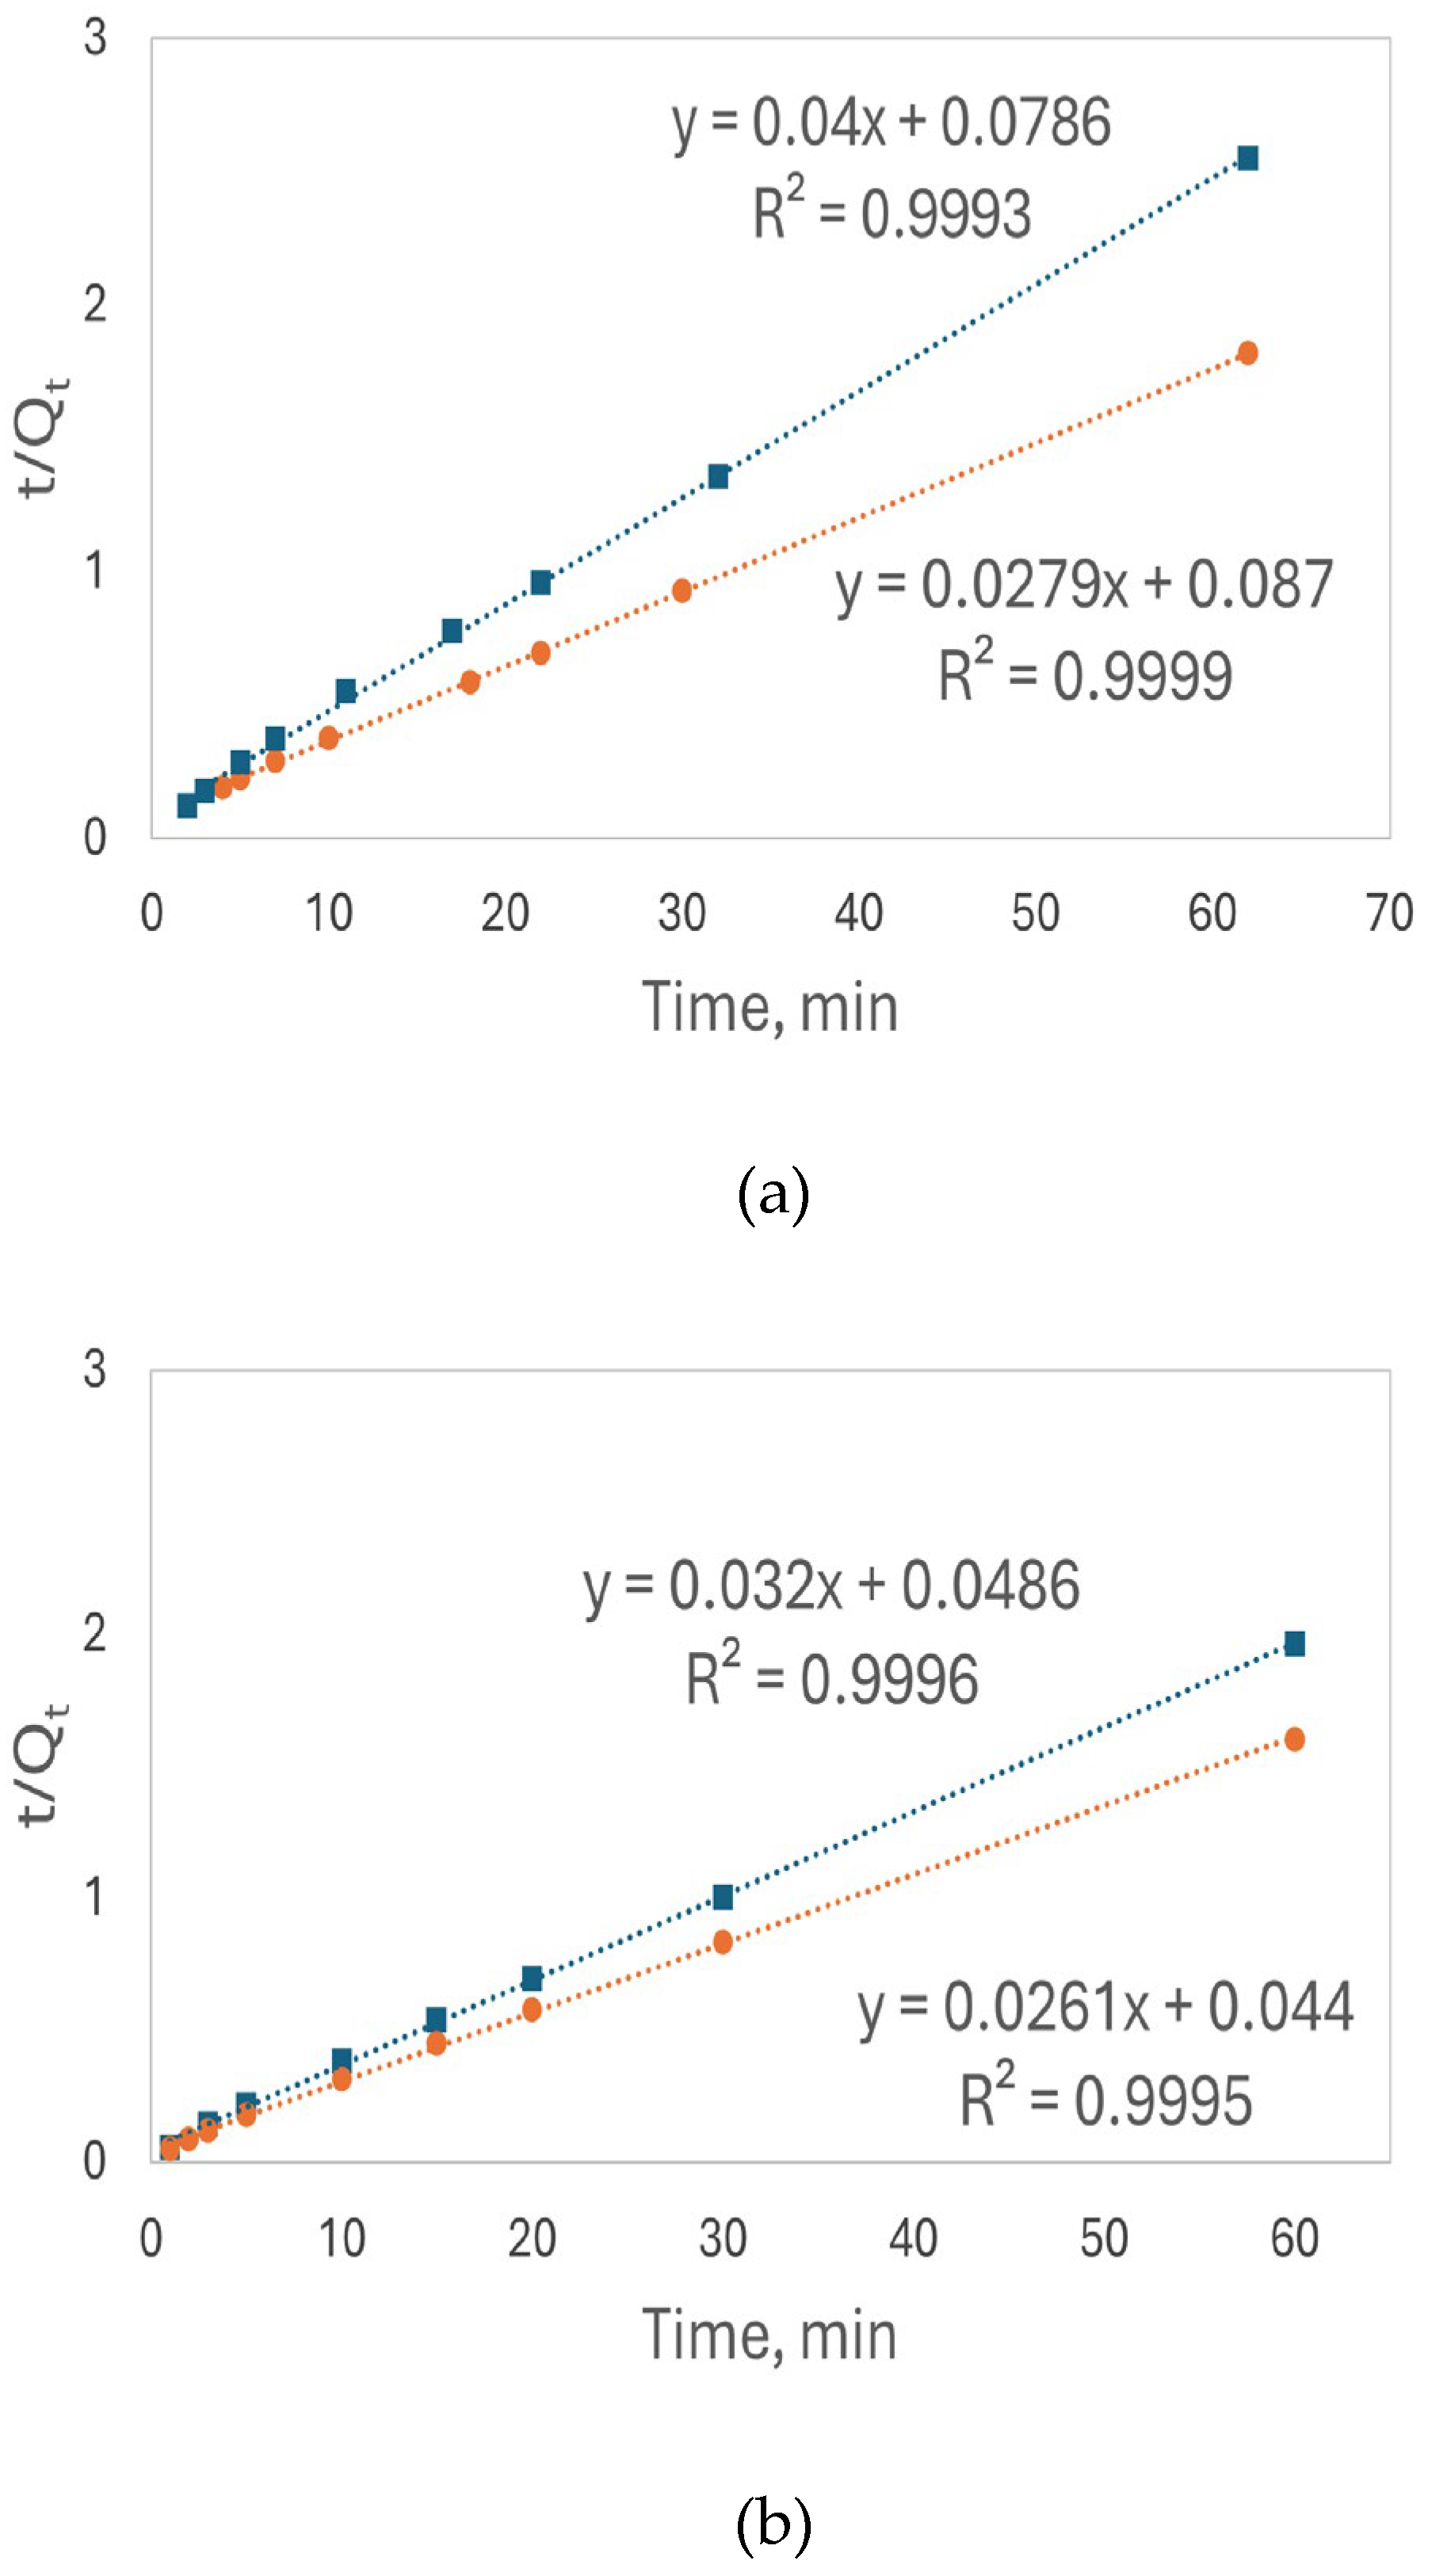
Figure 11.
Breakthrough curves for (a) Cd(II) (b) Pb(II) adsorption at different adsorption-regeneration cycles.
Figure 11.
Breakthrough curves for (a) Cd(II) (b) Pb(II) adsorption at different adsorption-regeneration cycles.
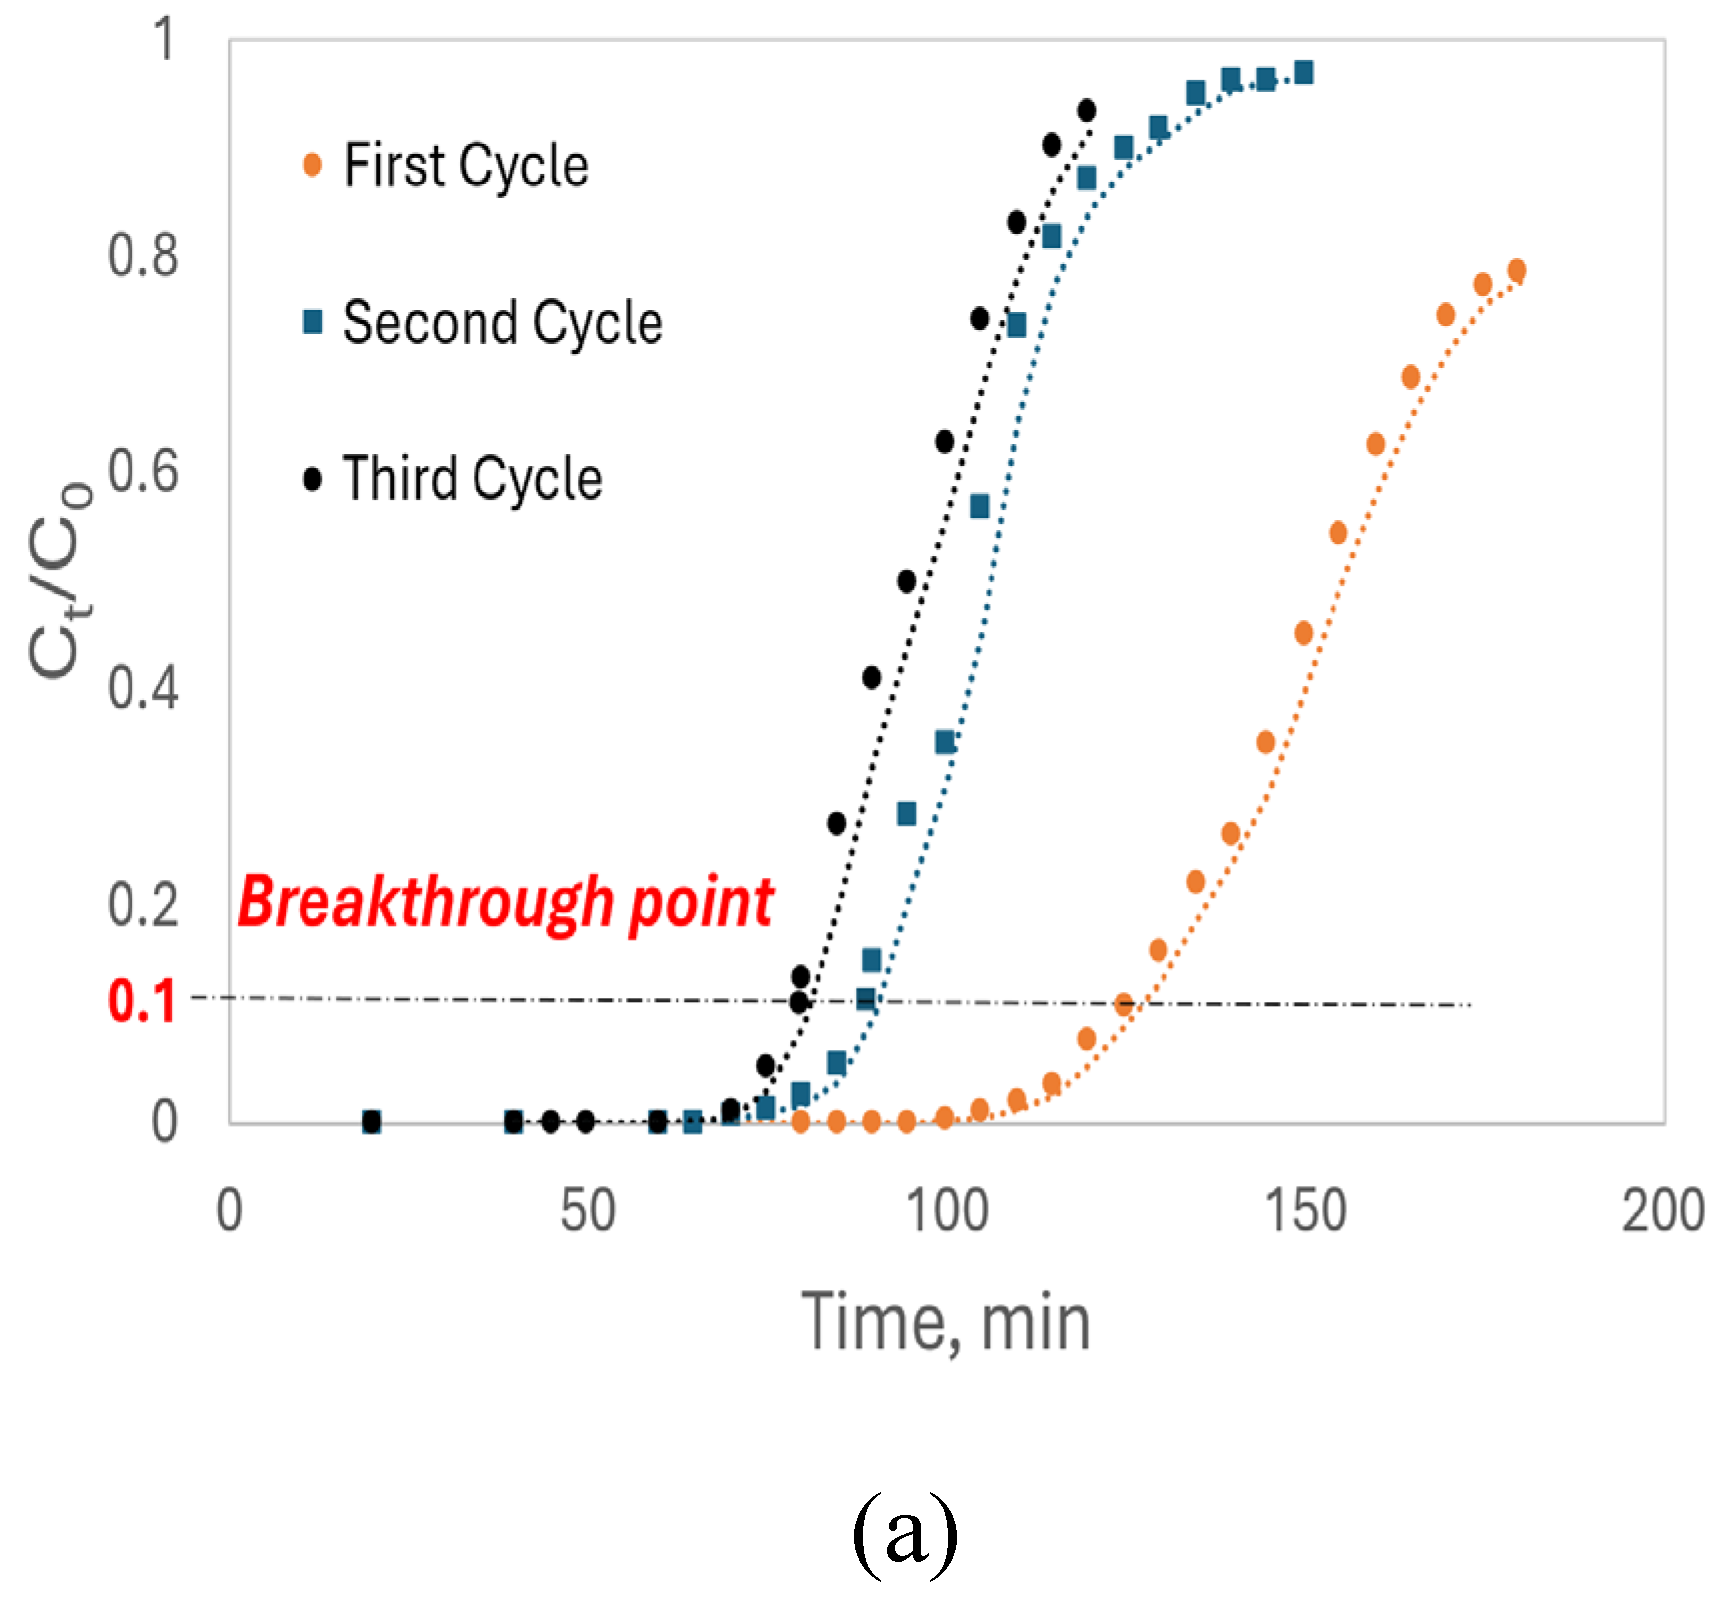
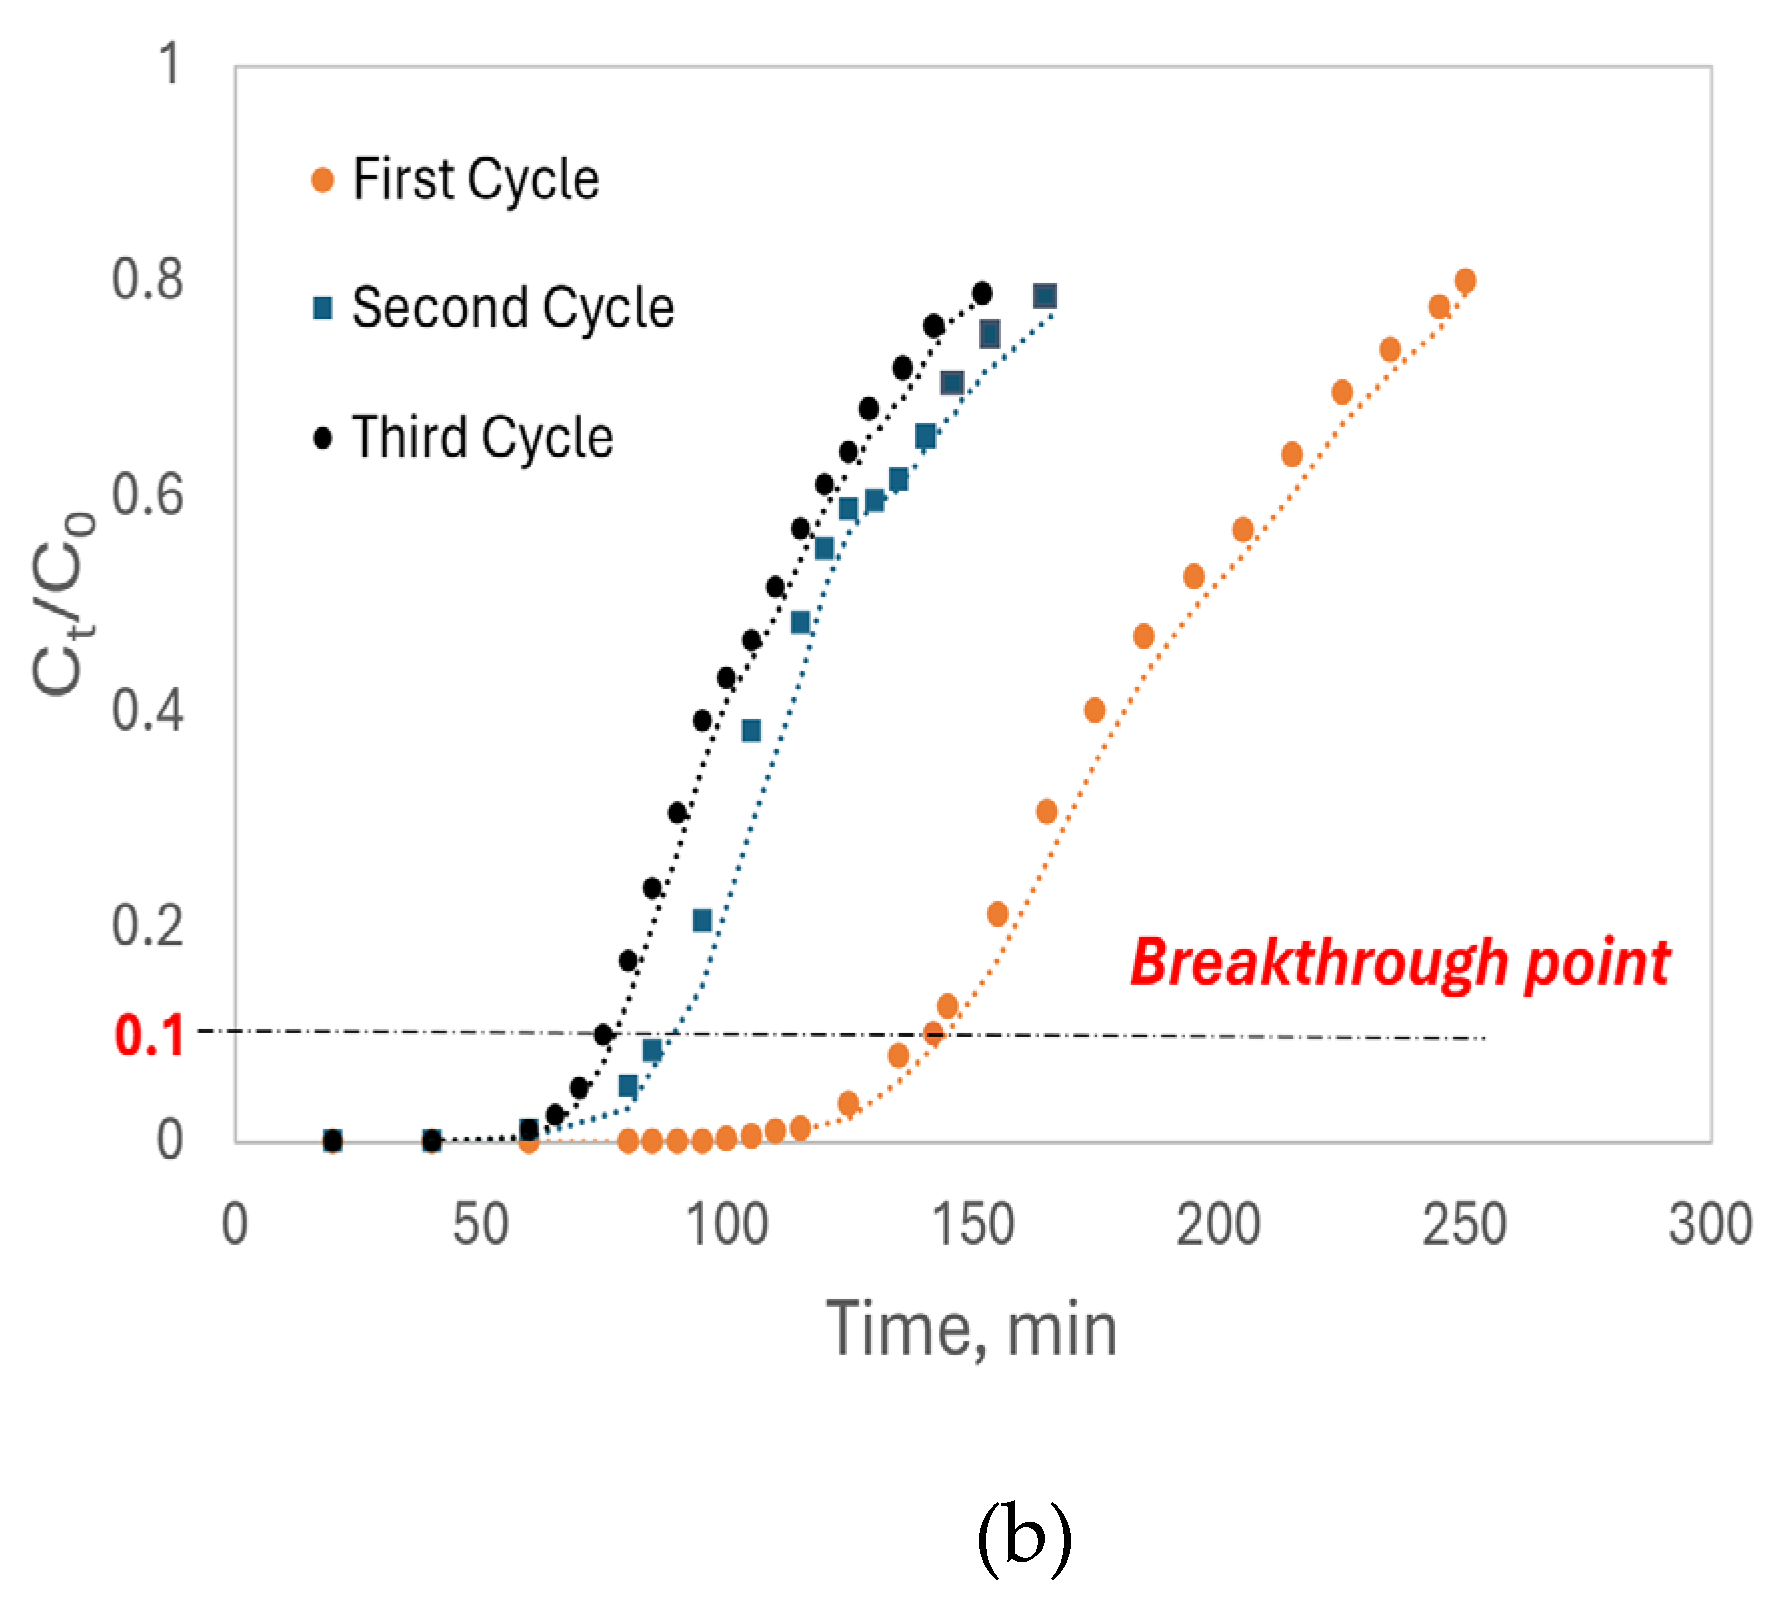
Figure 12.
Recovery curve of (a) Cd(II) (b) Pb(II) at first adsorption-regeneration cycle.
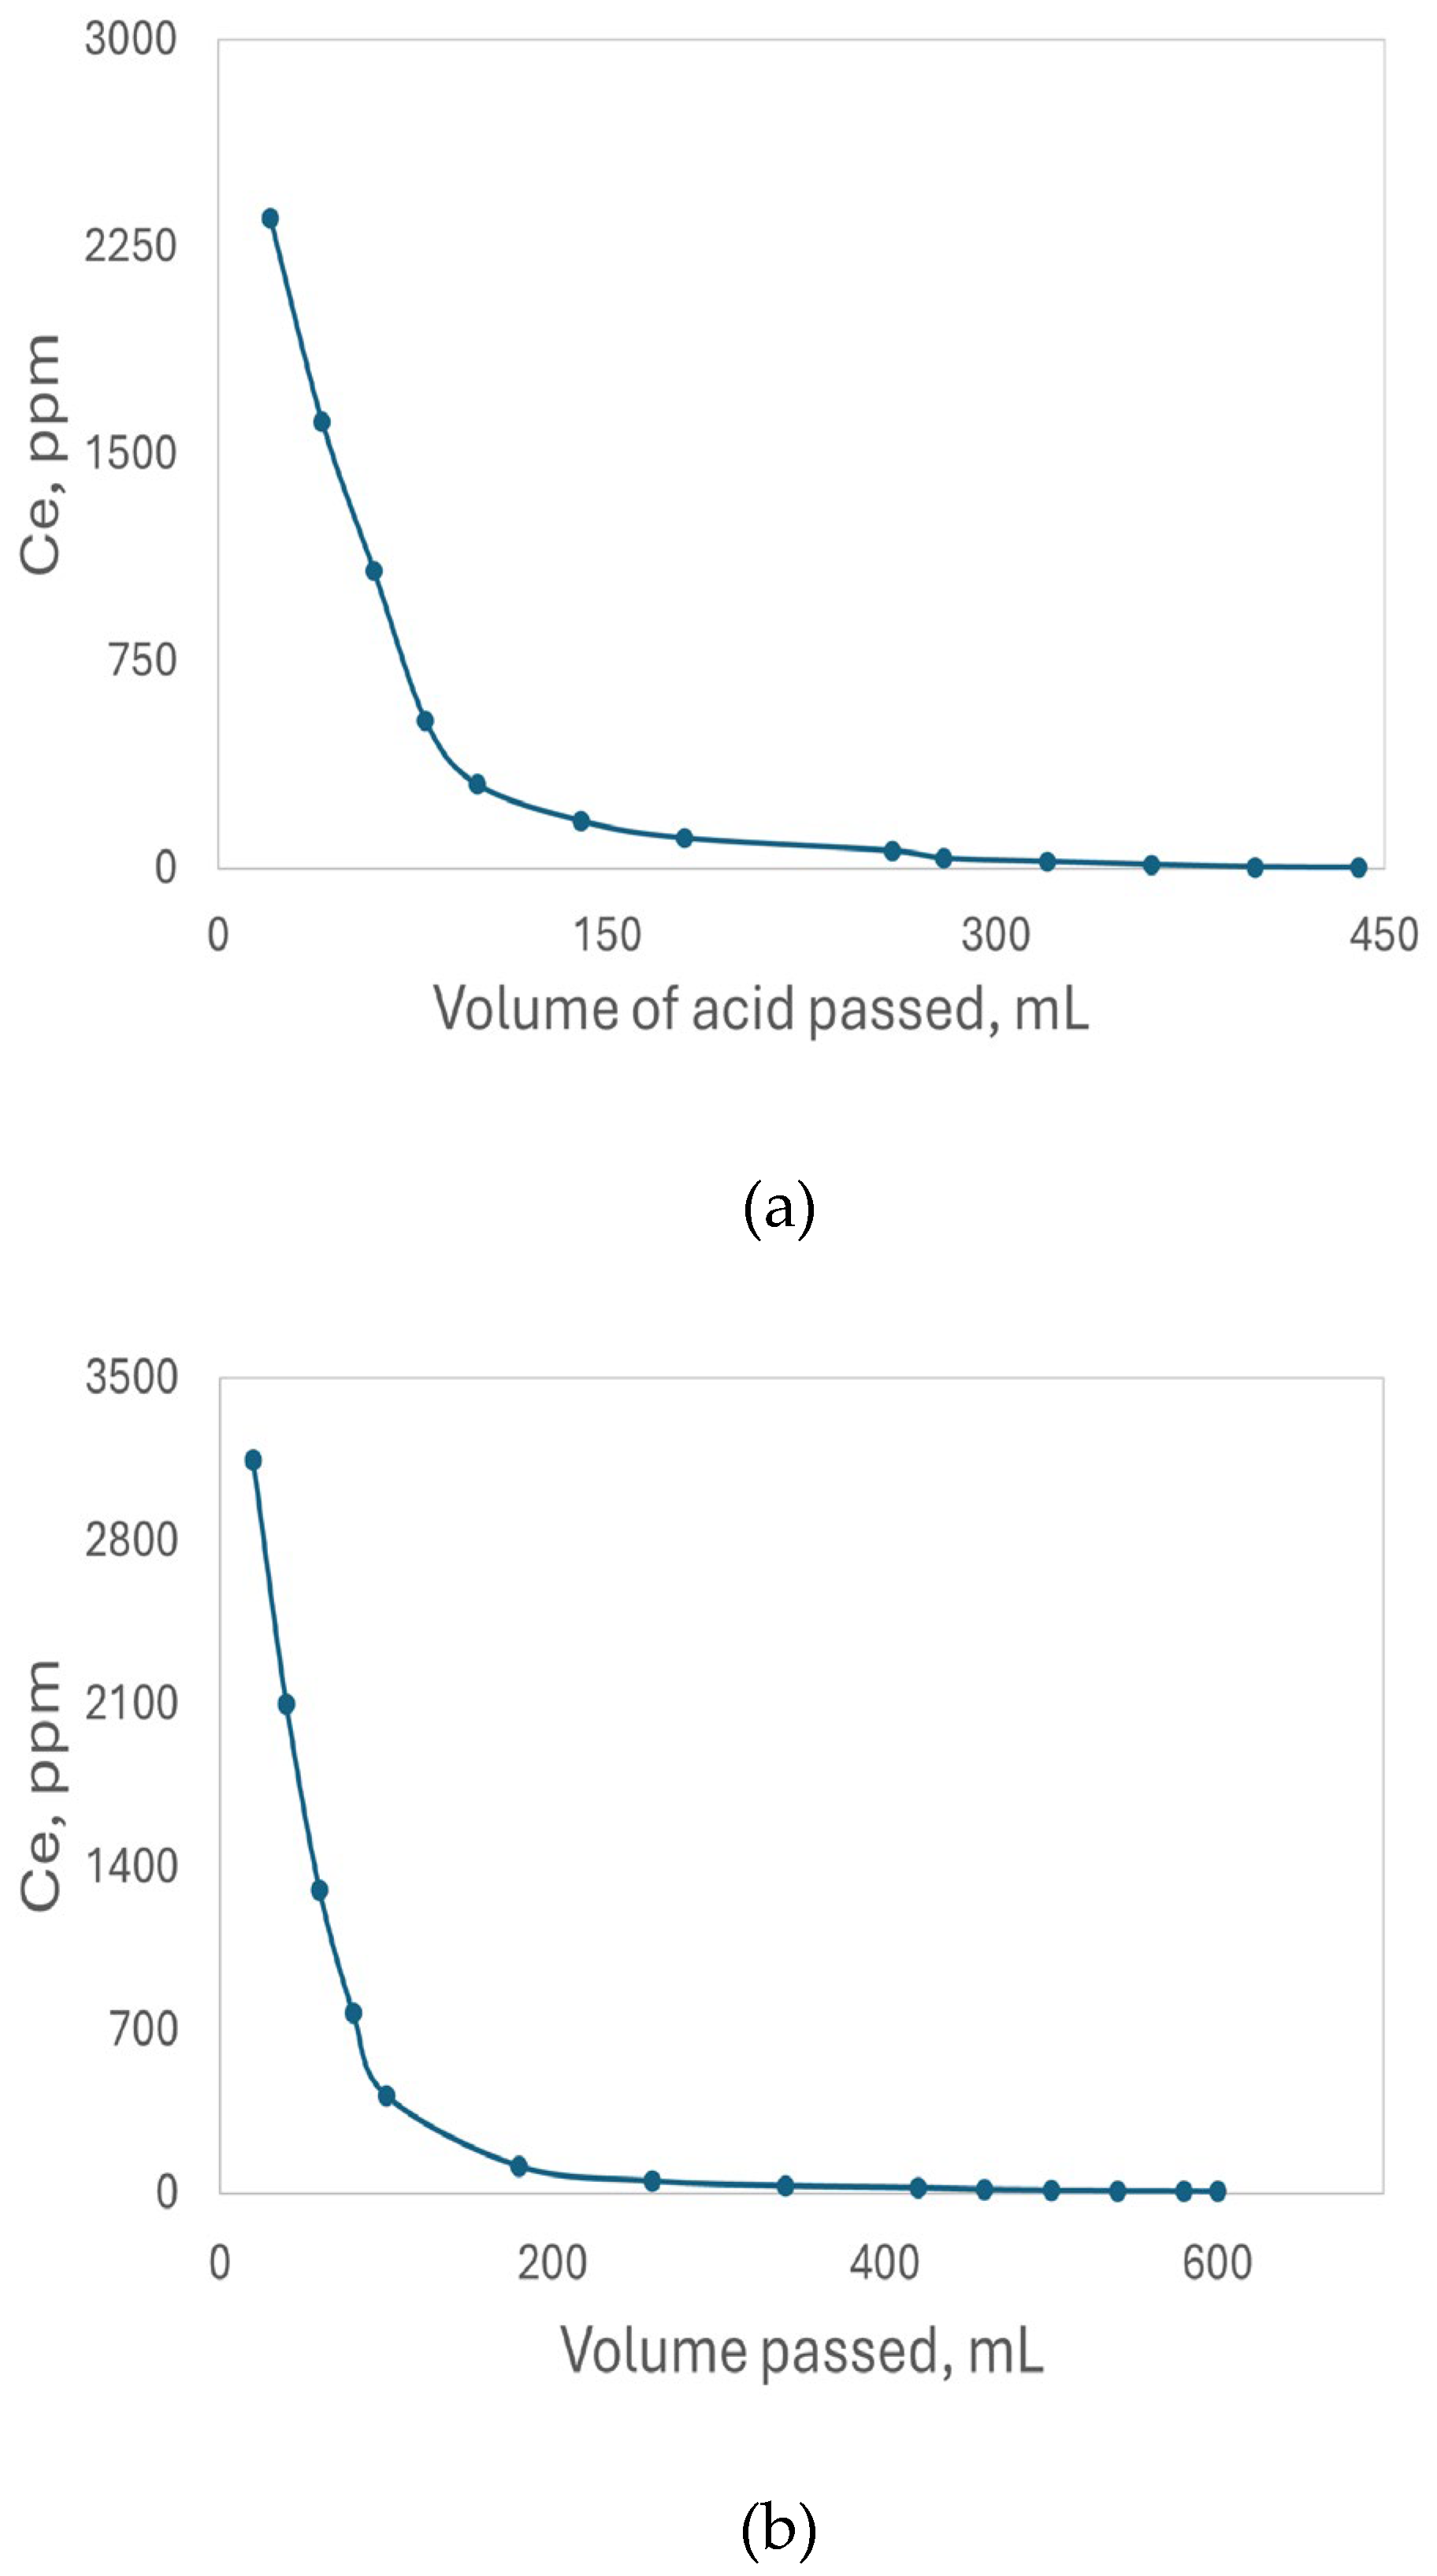
Figure 13.
FTIR spectra of base-treated luffa peels before and after 3 column adsorption-desorption cycles.
Figure 13.
FTIR spectra of base-treated luffa peels before and after 3 column adsorption-desorption cycles.
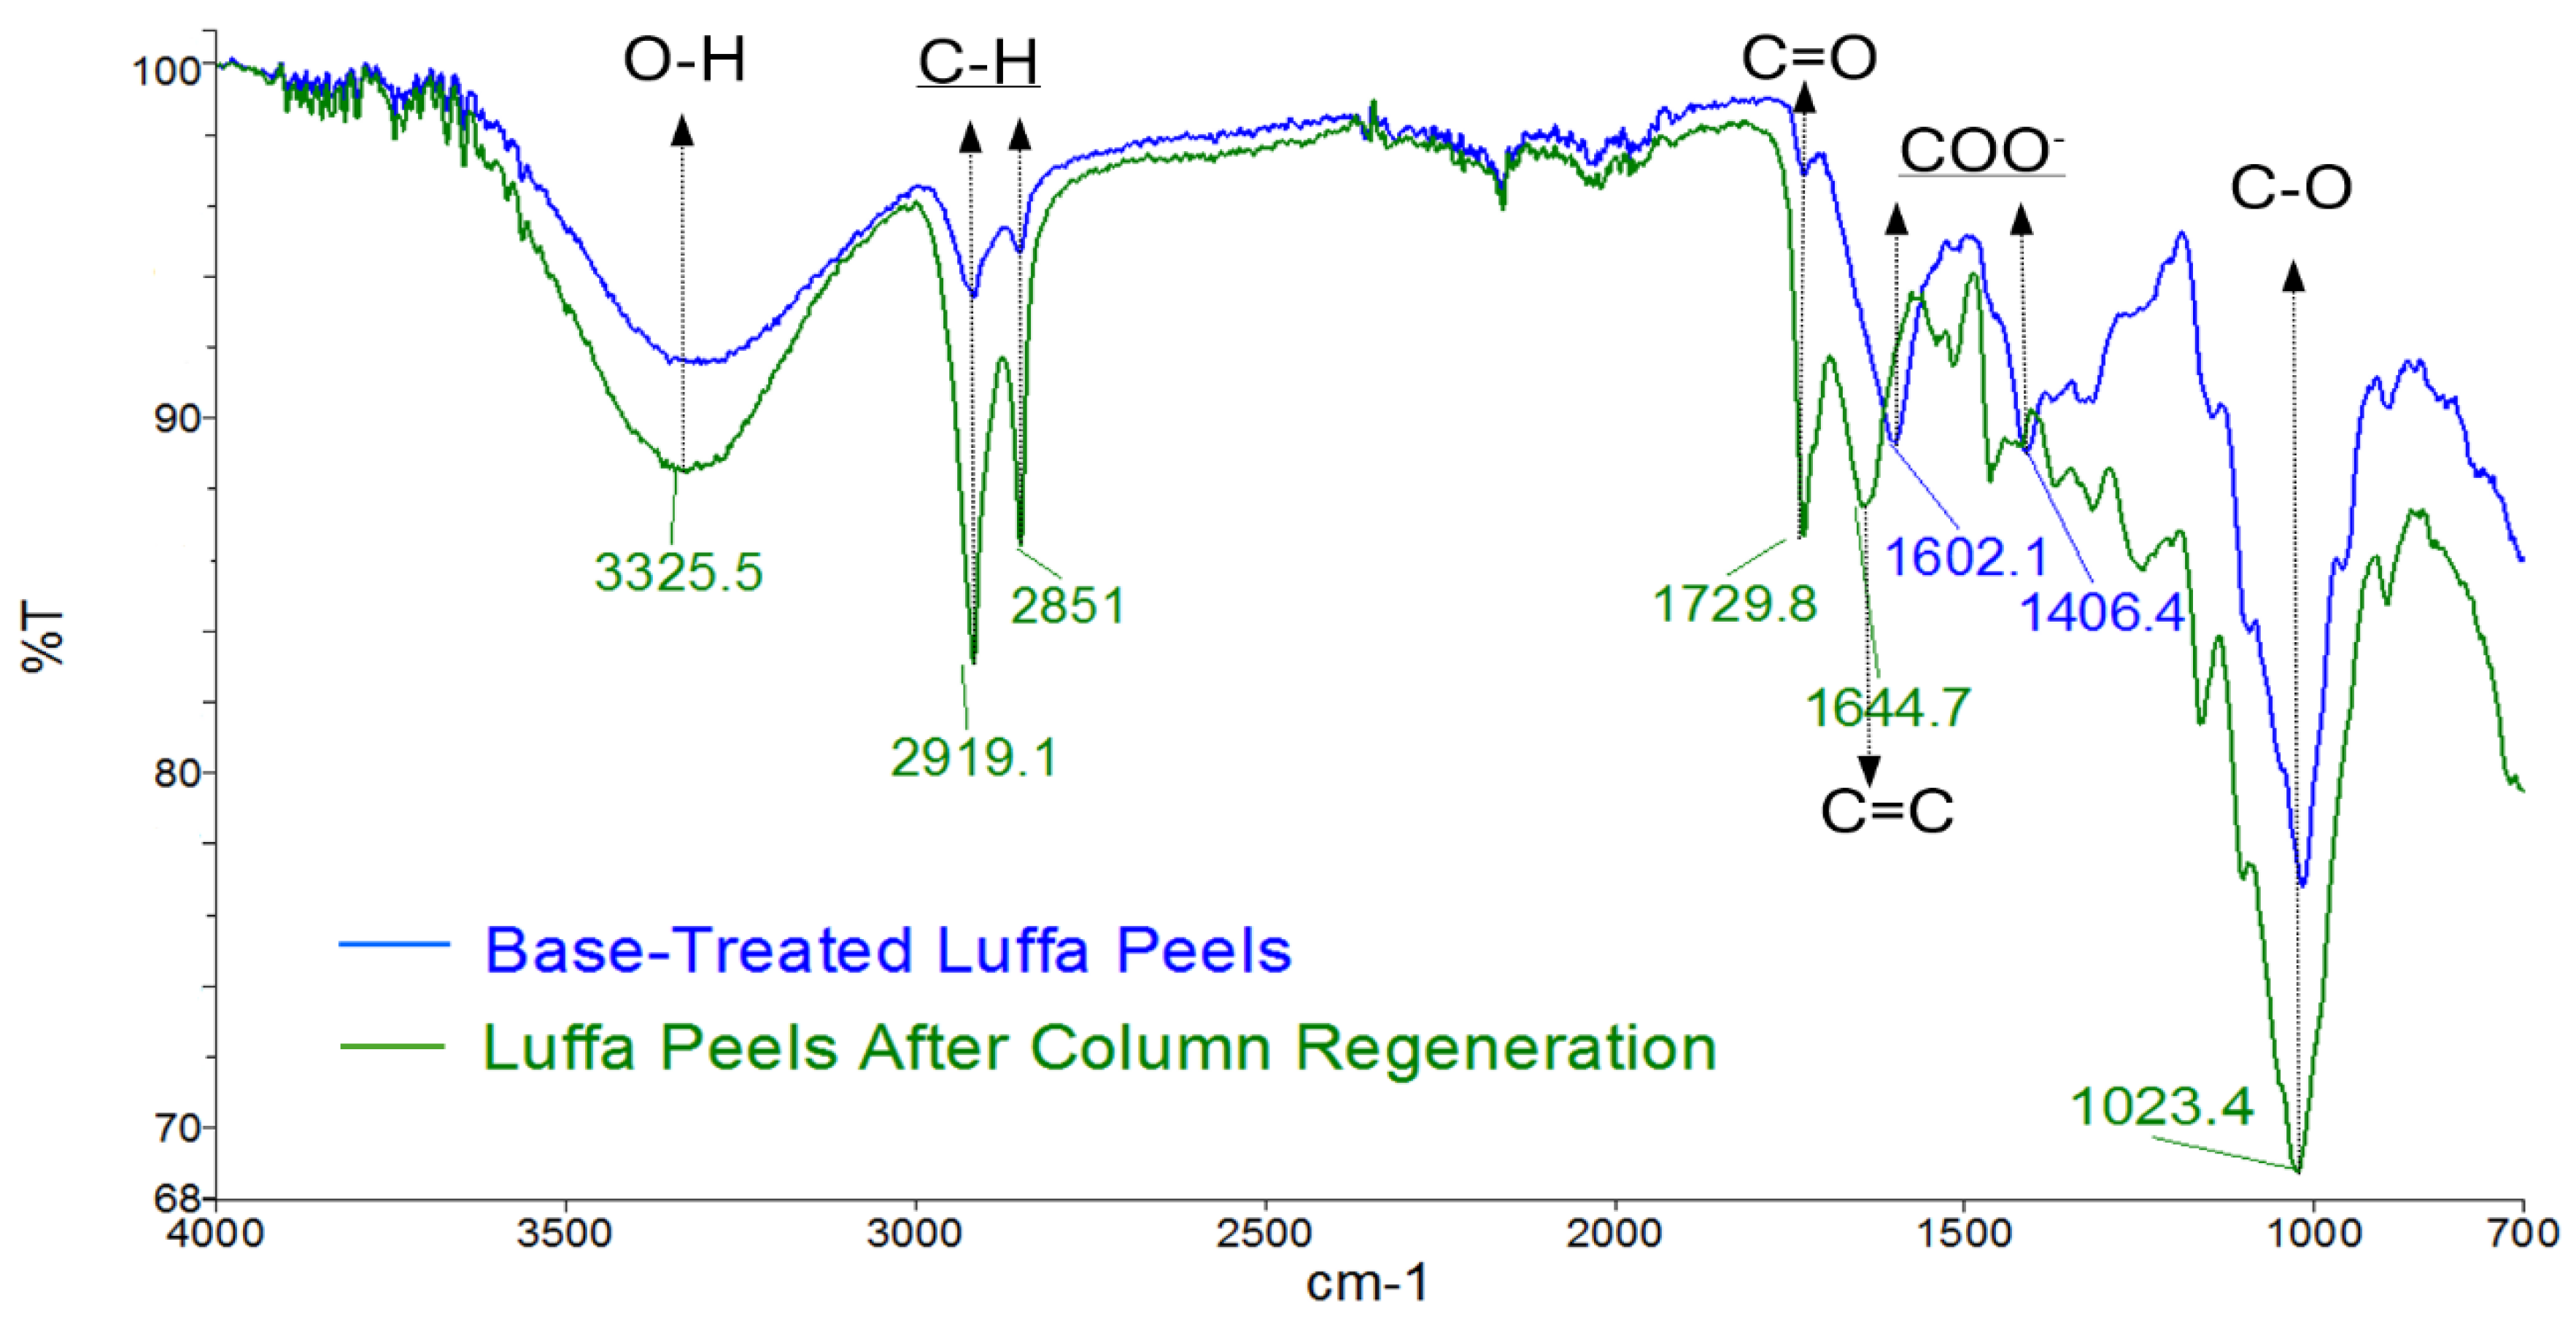

Table 1.
Density of sorbent types.
| Sorbents | Density (g/cm3) |
|---|---|
| Luffa peels-untreated | 0.42 |
| Luffa-Acid | 0.45 |
| Luffa-Base | 0.49 |
| Chamomile flowers-untreated | 0.29 |
| Chamomile-Acid | 0.16 |
| Chamomile-Base | 0.25 |
-Acid/Base indicates the treatment condition of adsorbents.
Table 2.
Adsorption quantity (Qe m) of 250 ppm heavy metal ion solutions and Freundlich isotherm model constants.
Table 2.
Adsorption quantity (Qe m) of 250 ppm heavy metal ion solutions and Freundlich isotherm model constants.
| Sorbent | Pb2+, pH 5.6 | Cd2+, pH 5.6 | Cd2+, pH 8.0 | ||||||
|---|---|---|---|---|---|---|---|---|---|
| Qe m | Kf | R2 | Qe m | Kf | R2 | Qe m | Kf | R2 | |
| Chamomile-acid | 32.3 | 2.17 | 0.9798 | 16.4 | 0.378 | 0.9955 | 34.0 | 2.45 | 0.9891 |
| Chamomile-base | 39.7 | 4.06 | 0.9768 | 22.4 | 0.467 | 0.9856 | 42.8 | 2.76 | 0.9748 |
| Luffa-acid | 22.5 | 2.49 | 0.9916 | 16.3 | 0.230 | 0.9947 | 30.9 | 1.42 | 0.9840 |
| Luffa-base | 31.5 | 4.89 | 0.9756 | 27.3 | 0.530 | 0.9984 | 36.9 | 1.69 | 0.9918 |
All parameters reported are the averages of three duplicate experimental sets.
Table 3.
Parameters of Langmuir isotherm model for Pb2+ at pH 5.6.
| Sorbent | Qomax | KL | R2 |
|---|---|---|---|
| Chamomile-acid | 38.8 | 0.053 | 0.9922 |
| Chamomile-base | 49.5 | 0.077 | 0.9844 |
| Luffa-acid | 23.6 | 0.060 | 0.9829 |
| Luffa-base | 34.0 | 0.104 | 0.9912 |
All parameters reported are the averages of three duplicate experimental sets.
Table 4.
Parameters of adsorption kinetics and equilibrium adsorption.
| Sorbent | Pb2+, pH 5.6 | Cd2+, pH 8.0 | |||||
|---|---|---|---|---|---|---|---|
| K2 | Qe cal | Qe m | K2 | Qe cal | Qe m | ||
| Chamomile-acid | 0.020 | 30.2 | 32.3 | 0.024 | 36.6 | 34.0 | |
| Chamomile-base | 0.009 | 39.4 | 39.7 | 0.012 | 45.0 | 42.8 | |
| Luffa-acid | 0.017 | 23.7 | 22.5 | 0.020 | 30.4 | 30.9 | |
| Luffa-base | 0.010 | 32.5 | 31.5 | 0.018 | 42.0 | 36.9 | |
All parameters reported are the averages of three duplicate experimental sets.
Table 5.
Parameters of fixed-bed column adsorption and Thomas model.
| Cycle | Pb (II), pH 5.6 | Cd (II), pH 8.0 | |||||||
|---|---|---|---|---|---|---|---|---|---|
| Qb | Q0 | KT | R2 | Qb | Q0 | KT | R2 | ||
| 1 | 22.6 | 32.9 | 0.12 | 0.9969 | 19.7 | 25.8 | 0.26 | 0.9831 | |
| 2 | 14.4 | 20.0 | 0.21 | 0.9406 | 13.9 | 17.2 | 0.34 | 0.9497 | |
| 3 | 12.5 | 18.2 | 0.22 | 0.9457 | 12.5 | 15.9 | 0.43 | 0.9934 | |
Q = 4mL/min, C0 = 250 ppm, M = 6000mg.
Table 6.
Parameters for the recovery of Pb(II) and Cd(II).
| Cycle | Pb (II), pH 5.6 | Cd (II), pH 8.0 | |||||
|---|---|---|---|---|---|---|---|
| MT | MR, | R% | MT | MR | R% | ||
| 1 | 189.5 | 170.7 | 89.8 | 150.8 | 136.9 | 90.7 | |
| 2 | 110.1 | 98.4 | 89.3 | 102.4 | 92.2 | 90.1 | |
| 3 | 102.2 | 89.1 | 87.2 | 93.0 | 84.0 | 90.3 | |
Table 7.
Comparison of maximum adsorption capacity (Qomax) in this study and other literatures.
| Adsorbent | Ion | Portion of adsorbent | pH | Qomax | Reference |
|---|---|---|---|---|---|
| Luffa peels | Pb2+ | 5g/L | 5.6 | 34.0 | This study |
| Chamomile flowers | Pb2+ | 5g/L | 5.6 | 49.5 | This study |
| Pine cone | Pb2+ | 5g/L | 5.0 | 49.1 | [27] |
| Litchi fruit peels | Pb2+ | 5g/L | 5.0 | 34.5 | [27] |
| Cashew nut shell | Pb2+ | 5g/L | 5.0 | 27.1 | [28] |
| Green tea leaves | Pb2+ | 5g/L | 5.5 | 90.1 | [29] |
Table 8.
Comparison of dynamic adsorption capacity (Q0) in this study and other literatures.
| Adsorbent | Ion | Q | C0 | Column Height | Q0 | Reference |
|---|---|---|---|---|---|---|
| Luffa peels | Pb2+, Cd2+ | 4 | 250 | 15cm | 32.9, 25.8 | This study |
| Mussel shell | Cd2+ | 9 | 10 | 5cm | 7.86 | [22] |
| Passion fruit shell | Cd2+ | 2 | 300 | 3cm | 48.6 | [30] |
| Watermelon rind | Pb2+ | 1 | 50 | 19cm | 72.0 | [31] |
| Caulerpa lentillifera | Pb2+, Cd2+ | 6 | 100 | 4cm | 25.1,10.5 | [32] |
Disclaimer/Publisher’s Note: The statements, opinions and data contained in all publications are solely those of the individual author(s) and contributor(s) and not of MDPI and/or the editor(s). MDPI and/or the editor(s) disclaim responsibility for any injury to people or property resulting from any ideas, methods, instructions or products referred to in the content. |
© 2024 by the authors. Licensee MDPI, Basel, Switzerland. This article is an open access article distributed under the terms and conditions of the Creative Commons Attribution (CC BY) license (http://creativecommons.org/licenses/by/4.0/).
Copyright: This open access article is published under a Creative Commons CC BY 4.0 license, which permit the free download, distribution, and reuse, provided that the author and preprint are cited in any reuse.


