1. Background
Concept mapping is a participatory mixed-methods research design to elaborate the understanding of a particular issue or topic [
1]. Two approaches to concept mapping are widely used in research [
1,
2]. In Trochim’s approach ideas and concepts on a particular topic are generated using brainstorming, prioritising and clustering and presented as a two-dimensional cluster map [
3]. The relationship between participants’ generated ideas is shown as a hierarchical flow diagram (using arrows and directions) in concept mapping described by Novak [
2]. Novak [
4] and Trochim [
5] acknowledge that these methodologies are essentially different but mistaken for each other by researchers.
There are typically six discrete, connected phases in Trochim’s concept mapping: 1. Preparation, 2. Idea generation, 3. Idea structuring, 4. Concept mapping analysis, 5. Interpretation, and 6. Utilization [
5]. Stakeholders actively participate in all phases of the research process [
6]. Trochim’s concept mapping has been extensively used in health research to develop a deep understanding of complex phenomena [
7,
8]. For example, Kikkert et al. (2006) used concept mapping to understand factors influencing treatment adherence in people with schizophrenia. Eighty-one patients, carers, and health professionals identified ten factors affecting medication adherence, including professional and non-professional support, side effect self-management, and patients' insight into their illness [
9]. Bennett et al. (2020) reported a concept mapping study to understand the role of general practitioners working in Australia in the management of age-related hearing loss [
10]. General practitioners, allied health workers and patients participated in the research. A six-cluster concept map including stakeholder partnership and patient empowerment was identified as a successful approach to the management of hearing loss [
10].
Over the recent years, there has been an increase in research publications using Trochim concept mapping. In 2017,
Planning and Evaluation published a special issue on Trochim concept mapping methodology. Three papers published in this special issue showed an exponential increase in the use of concept mapping research since the beginning of this Millennium [
7,
11,
12,
13]. Trochim (2017), who developed the concept mapping methodology, noted that the original methodology paper was cited by nearly 500 publications in Scopus between 1989 and 2015 [
7]. Trochim (2017) further reported 6,000 citations of these concept mapping publications. By 2015, 90 authors from the Netherlands, used concept mapping publications to evaluate different issues in mental health [
13]. More than half of these studies were published between 2000-2014 [
13]. Donnelly (2017) reported a fivefold increment in the number of doctoral theses (from 22 before 2000 to 106 in 2014) using concept mapping between 2001-2014 [
12].
Complete, transparent reporting of research enables the reader to make an accurate determination of the quality and significance of the work [
14]. There is evidence to suggest that the quality of reporting of Trochim’s concept mapping is sub-optimal [
8,
12]. For example, Donnelly (2017) conducted a systematic review of 104 doctoral dissertations that used Trochim’s concept mapping, noting important omissions in the quality of reporting of many included studies. For example, few study authors described the process that was followed in developing the focus prompt for the research and tended not to report the number of participants involved in each phase of concept mapping [
12]. A pooled analysis of concept mapping studies using the Concept Systems software was reported by Scott and Rosas (2012). The authors note that the validity indicators were often not reported in published manuscripts [
8]. However, the authors did not report the number of studies providing information on different parameters evaluated in the review [
8]. The authors of both reviews suggest that having a reporting guideline may potentially enhance the quality of reporting concept mapping studies [
8,
12].
Typically, reporting guidelines take the form of a checklist of required information to comprehensively describe the conduct, findings and implications of the research [
15]. There is some evidence indicating that reporting guidelines do positively impact the quality of research reporting [
16]. For example, Tunis et al. (2013) reviewed 130 systematic reviews and reported an improvement in the quality of reporting of systematic reviews following the publication of the PRISMA (Preferred Reporting Items for Systematic review and Meta-Analysis) guideline [
16].
Journals mandating authors follow reporting guidelines when submitting work has also seemingly enhanced the quality of research reporting [
16,
17,
18,
19]. An umbrella review of 53 systematic reviews evaluating the quality of reporting of clinical trials before and after journal endorsement of the CONSORT (CONsolidated Standards Of Reporting Trials) checklist was reported by Turner et al. (2012). CONSORT endorsement was associated with more comprehensive reporting in 69 of 81 (86%) meta-analyses (Turner et al 2012). Similar enhancements in the quality of reporting have been observed by authors evaluating journal endorsement of guidelines for observational research [
17] qualitative studies [
20], and systematic reviews [
16].
In 2006, a group of methodologists established the EQUATOR (Enhancing the QUAlity and Transparency Of health Research) network - a publicly accessible repository of reporting guidelines - to enhance the quality of the reporting of health research [
21]. The EQUATOR repository includes a list of 617 reporting guidelines across different methodologies including observational, qualitative and interventional studies and literature reviews [
22]. A standard process for the development of reporting guidelines has been developed and published by the EQUATOR consortium [
23,
24].
The EQUATOR network does not currently (as of 28 November 2024) list a reporting guideline for Trochim’s concept mapping [
25]. We have identified a 10-point checklist on the website of the Group Wisdom software (formally Concept Systems), a package used to generate concept maps. The checklist provides recommendations on the conduct and reporting of the concept mapping research [
26]. No detail is provided as to how the checklist was developed.
The authors of two concept mapping studies have attempted to adapt reporting guidelines for other study designs [
27,
28]. For example, Cardwell et al. (2021) applied the STROBE (Strengthening The Reporting of OBservational studies in Epidemiology) guideline developed for observational studies. The GRAMMS (Good Reporting of A Mixed-Methods Study) checklist developed for mixed-methods research was used by Dopp et al. (2020). Neither STROBE nor GRAMMS addresses the specific methodological requirements of concept mapping such as idea generation (brainstorming) and structuring statements (sorting and rating).
There is justification for developing a specific reporting guideline for Trochim’s concept mapping following the EQUATOR methodology.
1.1. Guideline development process
We followed the three-staged approach to guideline development described by the EQUATOR network consortium [
23,
24]:
Stage 1: A Systematic review of concept mapping studies to examine the quality of reporting and identify candidate items for inclusion in the guideline. Stage 2: A concept mapping study to identify candidate items to include in the reporting guideline. The EQUATOR network (Moher et al, 2010) suggests using a Delphi methodology to identify potential items for inclusion in the reporting guideline [
24]. Concept mapping is often used as an alternative to Delphi and may therefore be well-suited to support the development of reporting guidelines [
27]. It also seemed to make sense to use concept mapping to inform the development of a reporting guideline about concept mapping.
Stage 3: Drafting, consolidation, stakeholder review and pilot testing of a draft reporting guideline.
This paper reports stages 2 (concept mapping) and 3 (consolidation) of the guideline development process. We have previously reported the systematic review (stage 1) [
29]
. In the review, we extracted data on the quality of reporting of 75 concept mapping studies, published between 2019 and 2021. Included studies consistently reported the rationale for the study, the focus prompt, a description of the stakeholder groups, procedures for brainstorming and structuring statements and the process of involving stakeholders in data interpretation [
29]
. We also identified important consistent omissions in the reporting of concept mapping studies. For example, authors omitted to report the process they followed in developing the focus prompt, did not give a rationale for deciding on the stakeholder groups, or reported the number of cluster solutions considered for interpretation [
29]
. Almost all studies (72/75, 96%) did not have a publicly available study protocol.
1.2. Registration
Before recruiting participants, we (prospectively) registered our study protocol with the Open Science Framework (OSF) on 17 July 2021 (
https://osf.io/h54k6/). The study was also registered with the EQUATOR network as a guideline under development (
https://www.equator-network.org).
2. Methods
Our protocol describing the methodology for guideline development was previously reported in
Methods and Protocols [
30].
We strictly followed the six phases of concept mapping proposed by Trochim: 1. Preparation, 2. Idea generation, 3. Idea structuring, 4. Data analysis, 5. Interpretation, and 6. Utilization [
1]. We used the ARIADNE concept mapping software package for phases 3 through 5 [
31].
2.1. Phase 1: Preparation
The preparation phase involved determining the focus question, stakeholder identification, and participant recruitment.
2.1.1. Focus Prompt
The focus prompt for the study was “What are the items that need to be included in the report of a concept mapping study?” The focus prompt was drafted by the research team and reviewed with two additional researchers with recent experience in using Trochim concept mapping.
2.1.2. Identification of Stakeholder Groups
Based on the recommendations made by Moher et al (2010), we identified six stakeholder groups with experience in Trochim’s concept mapping: 1. Researchers, 2. Experts in concept mapping, 3. Statisticians, 4. People who have participated in concept mapping research, 5. Peer reviewers, and 6. Journal editors [
24].
2.1.3. Stakeholder Recruitment
To identify concept mapping researchers and experts, we extracted details of the corresponding authors from the 258 concept mapping studies included in our systematic review [
29]. We also checked if the corresponding authors had been involved in other concept mapping studies. We pragmatically defined methodological experts (in Trochim’s concept mapping) as researchers who authored five or more concept mapping studies.
Peer reviewers (of a concept mapping study) were identified by checking the peer reviewer report (or similar) section - if available - of manuscripts included in our review. Name, email and institutional affiliation were extracted. We checked relevant institutional researcher profiles for additional information (e.g. email addresses).
Contact information for journal editors, that we identified as handling editors for a concept mapping paper was extracted from the relevant journal website.
To identify statisticians, we reviewed the author contribution section of the included manuscripts, to find which researchers undertook statistical procedures. The contact information was extracted from the paper or by checking institutional researcher profiles.
Potential participants across these five stakeholder groups were contacted by email explaining the nature and purpose of the study and asked if they were interested in participating in the research. We attached a copy of the information sheet and consent form to the email (supplementary document 1). Participants were asked to send a scanned copy of the consent form. We sent a follow-up email to potential participants after two weeks if we did not have a response from them.
Recruitment of people who had participated in concept mapping research was done via social media (the post we used to recruit can be accessed as supplementary document 2). People interested in participating in the research, directly contacted a study researcher (SP) to express their interest. They were then sent a copy of the information and consent form and asked to return it to us.
2.1.4. Ethical Considerations
Several ethical issues need consideration in our study. We extracted contact information from publicly available sources (published manuscripts, and institutional websites) and directly contacted researchers, statisticians, editors, and peer reviewers. It is possible that receiving these emails may have caused some worry or anxiety or confused potential participants. Participants were not paid for taking part in the research. On balance, we considered that because participants were employed in public sector organisations (universities, hospitals), they might be willing to contribute to our study because they would perceive that there is the potential to enhance the quality of reporting of concept mapping research. The Human Research Ethics Committee (HREC) of La Trobe University reviewed and approved this study (Ethics approval number – HEC21286).
2.2. Phase 2: Idea Generation
2.2.1. Brainstorming
Individual brainstorming interviews were conducted via video conferencing. The audio part of the interviews, only, was retained. Participants were asked to respond to the focus prompt (‘What are the items that need to be included in the report of concept mapping research?’). Participants were reminded that the focus of the research was on Trochim’s concept mapping. Further elaboration questions were asked to elicit additional details from participants (e.g., what information needs to be included when reporting the different phases of concept mapping).
2.2.2. Statement Reduction (Idea Synthesis)
We listened to the audio interviews between two and four times to identify and extract verbatim statements. A statement was considered a phrase or sentence that was singular, specific, and not overlapping [
5]. Any similar statements were combined to produce a final list of no more than 98 statements (the maximum number of statements “Ariadne” can handle) [
31].
2.3. Phase 3, Ideas Structuring
Participants completed two structuring tasks (prioritising and clustering) using the web link of the Ariadne software package. For the sorting task (often described by researchers as clustering or grouping), participants were asked to organise statements that seemed to belong together into clusters. Participants were asked to propose labels for each cluster (this was not a mandatory requirement). The rating (sometimes referred to as prioritisation or ranking) task required participants to rank statements on their perceived importance on a five-point scale ranging from “not important” to “extremely important.” Participants were asked to make sure that as far as possible, an equal number of statements should be placed at each point on the scale (Supplementary document 3 is the instruction sent to the participants explaining how to complete the structuring tasks). Participants were sent two reminder emails (two and three weeks after the first email was sent) if they had not completed the structuring tasks.
2.4. Phase 4, Data Analysis
Data from the participants who completed either of the structuring tasks were included in the analysis. The analysis of sorting data involved three steps: Group Similarity Matrix (GSM), Principal Component Analysis (PCA) and Hierarchical Cluster Analysis (HCA) [
31]. Ariadne generates a group similarity matrix to determine how frequently pairs of statements were clustered together by participants which is then used to undertake a principal component analysis to transform and locate individual statements onto a two-dimensional “point map.” Each statement is represented on the point map as a dot. Statements that are frequently grouped appear closer on the map. Ariadne then undertakes a hierarchical cluster analysis to produce 17 candidate concept maps with between 2 and 18 discreet clusters [
31].
Rating data were used to calculate the mean (95% confidence interval) importance rating for individual statements and clusters.
2.5. Phase 5, Data Interpretation
The final cluster solution was determined following a two-step process. First, the research team reviewed all 17 candidate concept maps to exclude cluster solutions that did not seem to represent the data; for example, where a cluster seemed to capture multiple concepts or where a cluster included a single statement. Next, we invited participants to take part in a data interpretation workshop to review the shortlisted candidate cluster solutions. The workshop aimed to agree on a final concept map that best represented the data. Axis labels were determined by the research team following a review of the point map.
2.6. Phase 6, Utilization
The results of the study were used to inform the development of a candidate reporting guideline for Trochim concept mapping research (in combination with the results of the systematic review that we had undertaken [
29]).
2.7. Results of the Concept Mapping Study
2.7.1. Participants
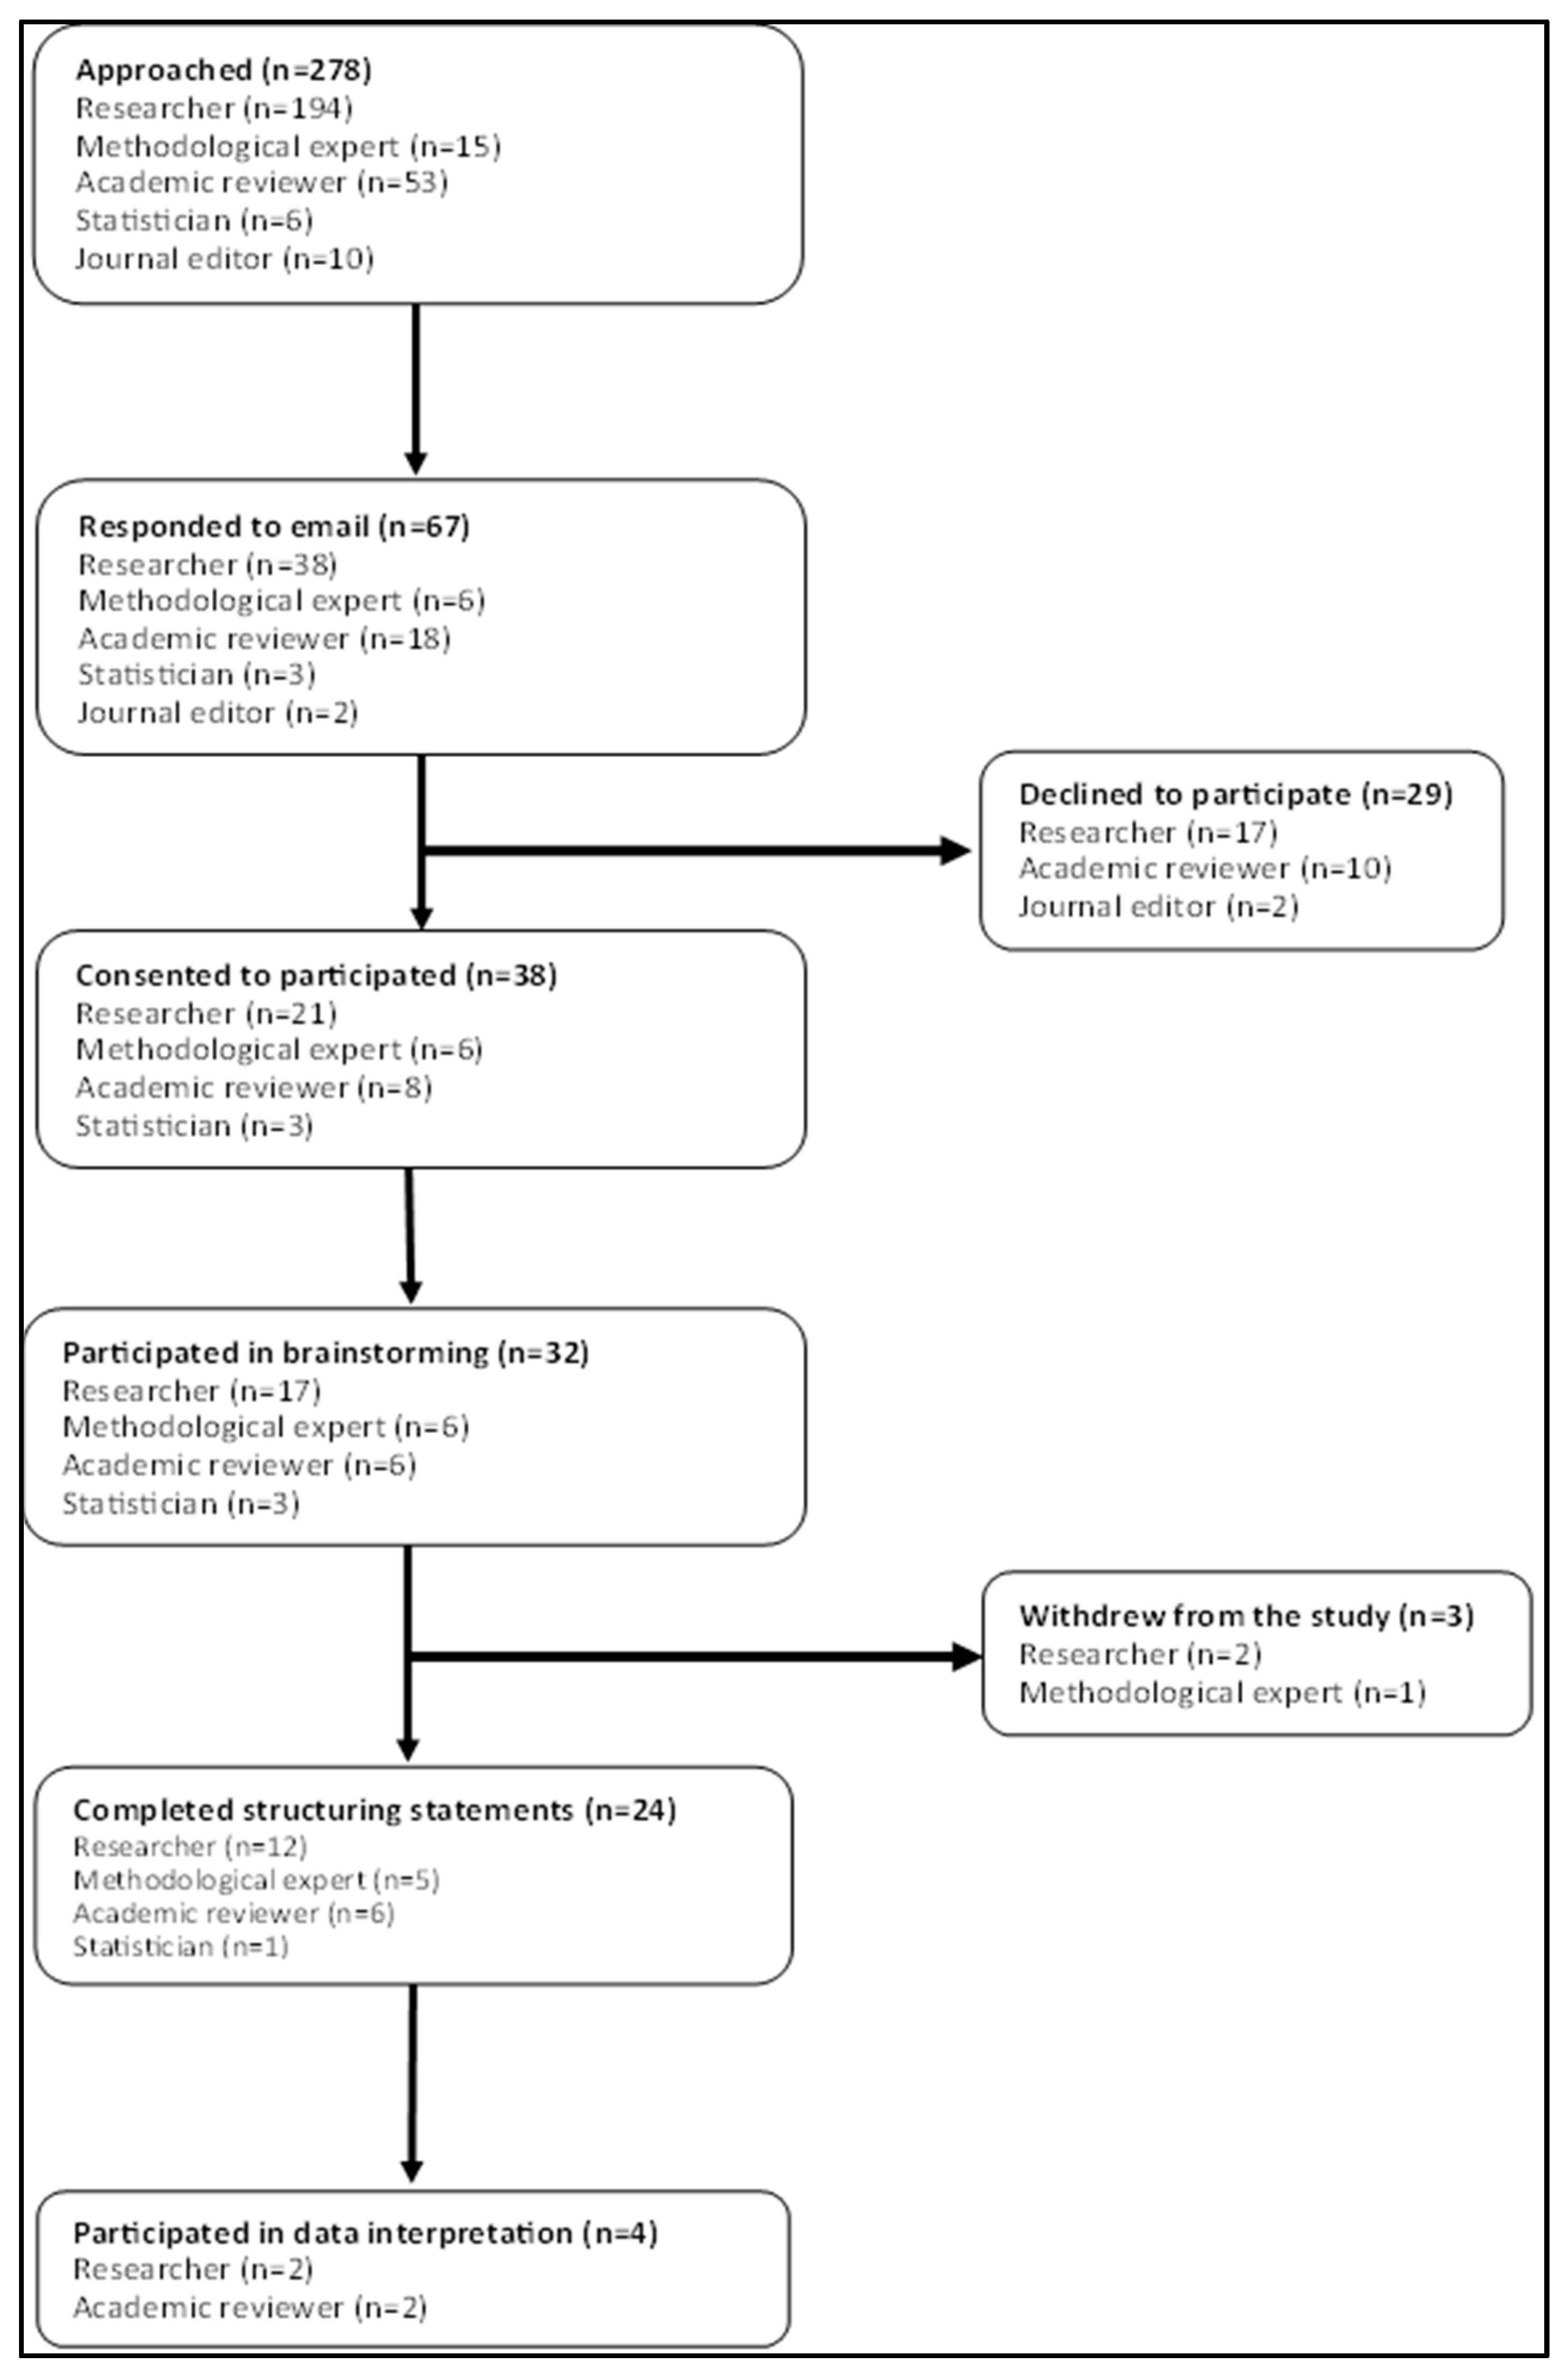
From our systematic review, we identified 258 concept mapping studies (a complete list is available as a supplementary document 4). We were able to extract author contact information from 240 studies (204 discreet authors, 36 were corresponding authors on more than one manuscript). From our author list fourteen met our criteria for methodological experts (had published five or more concept mapping papers). One hundred and eighty-seven authors were coded as concept mapping researchers and three as statisticians. Peer-review reports were available for 29 studies from which we identified 63 peer-reviewers. Contact information for 10 handling editors was extracted.
Figure 1 shows the flow of participants through the study. Six concept mapping experts, 17 researchers, six peer reviewers, and three statisticians participated in the research. No journal editors and people who had previously been involved in concept mapping responded to our invitations to participate.
The demographic characteristics of the study participants at different phases of the study are shown in
Table 1. Participants were working across three geographical regions, North America, Europe, and Australasia. They mostly identified as female, were in their late forties (age) and held a doctoral-level qualification. There was no apparent systematic difference in the demographic profile of participants in the brainstorming, structuring, and interpretation phases of concept mapping.
2.7.2. Ideas Generation (Brainstorming and Statement Reduction)
Thirty-two participants were involved in brainstorming interviews that lasted an average of 23 (SD ± 7.7) minutes. Participants generated between 5 and 64 statements (mean 28, SD ± 15). In total, 895 discreet statements were generated (supplementary document 5). From the full list of statements, duplicates were removed, and similar statements were combined to produce a final list of 96 statements (supplementary document 6).
2.7.3. Structuring (Sorting and Rating) of Statements
Structuring tasks – sorting and rating – were completed by 22 (69%) and 23 (72%) participants respectively. Participants arranged statements into between 4 to 10 clusters (mean 7.3, SD ±2). Supplementary document 6 also includes the rating score for all included statements.
2.7.4. Data Analysis
Supplementary document 7 is a point map generated using the Principal Component Analysis (PCA) function in Ariadne. Seventeen candidate concept maps were generated and are available as supplementary document 8.
2.7.5. Interpretation
Following initial screening, we decided to retain five (cluster solution 8 through 12, supplementary document 8) concept maps to review with participants at the data interpretation workshop. Concept maps with fewer than eight clusters were rejected as clusters did not seem to capture a single discreet concept. Maps with 13 or more clusters were also rejected as they contained clusters formed of single statements.
Four research participants (demographic characteristics of participants are shown in
Table 1) attended the data interpretation workshop on the 22 June 2022. During the discussion, participants proposed rerunning the analysis, removing one – outlying – statement (‘Provide information on the use of concept mapping software at different phases of the study’) from the dataset as it formed an individual cluster from the concept map (cluster solution) four onwards. This meant that a final cluster solution was not determined at the data interpretation workshop.
We removed this statement to undertake a further analysis. Supplementary document 9 shows the 17 candidate concept maps produced after the removal of the statement. We then reviewed all candidate concept maps and retained three (cluster solution 9 through 11) for further review with the participants. We made a post hoc decision not to organize a second data interpretation workshop. Instead, we emailed the study participants asking which concept map they preferred as the best way to interpret the data. We did not receive communication from any of our study participants. The research team then decided the 11-cluster solution as the final concept map.
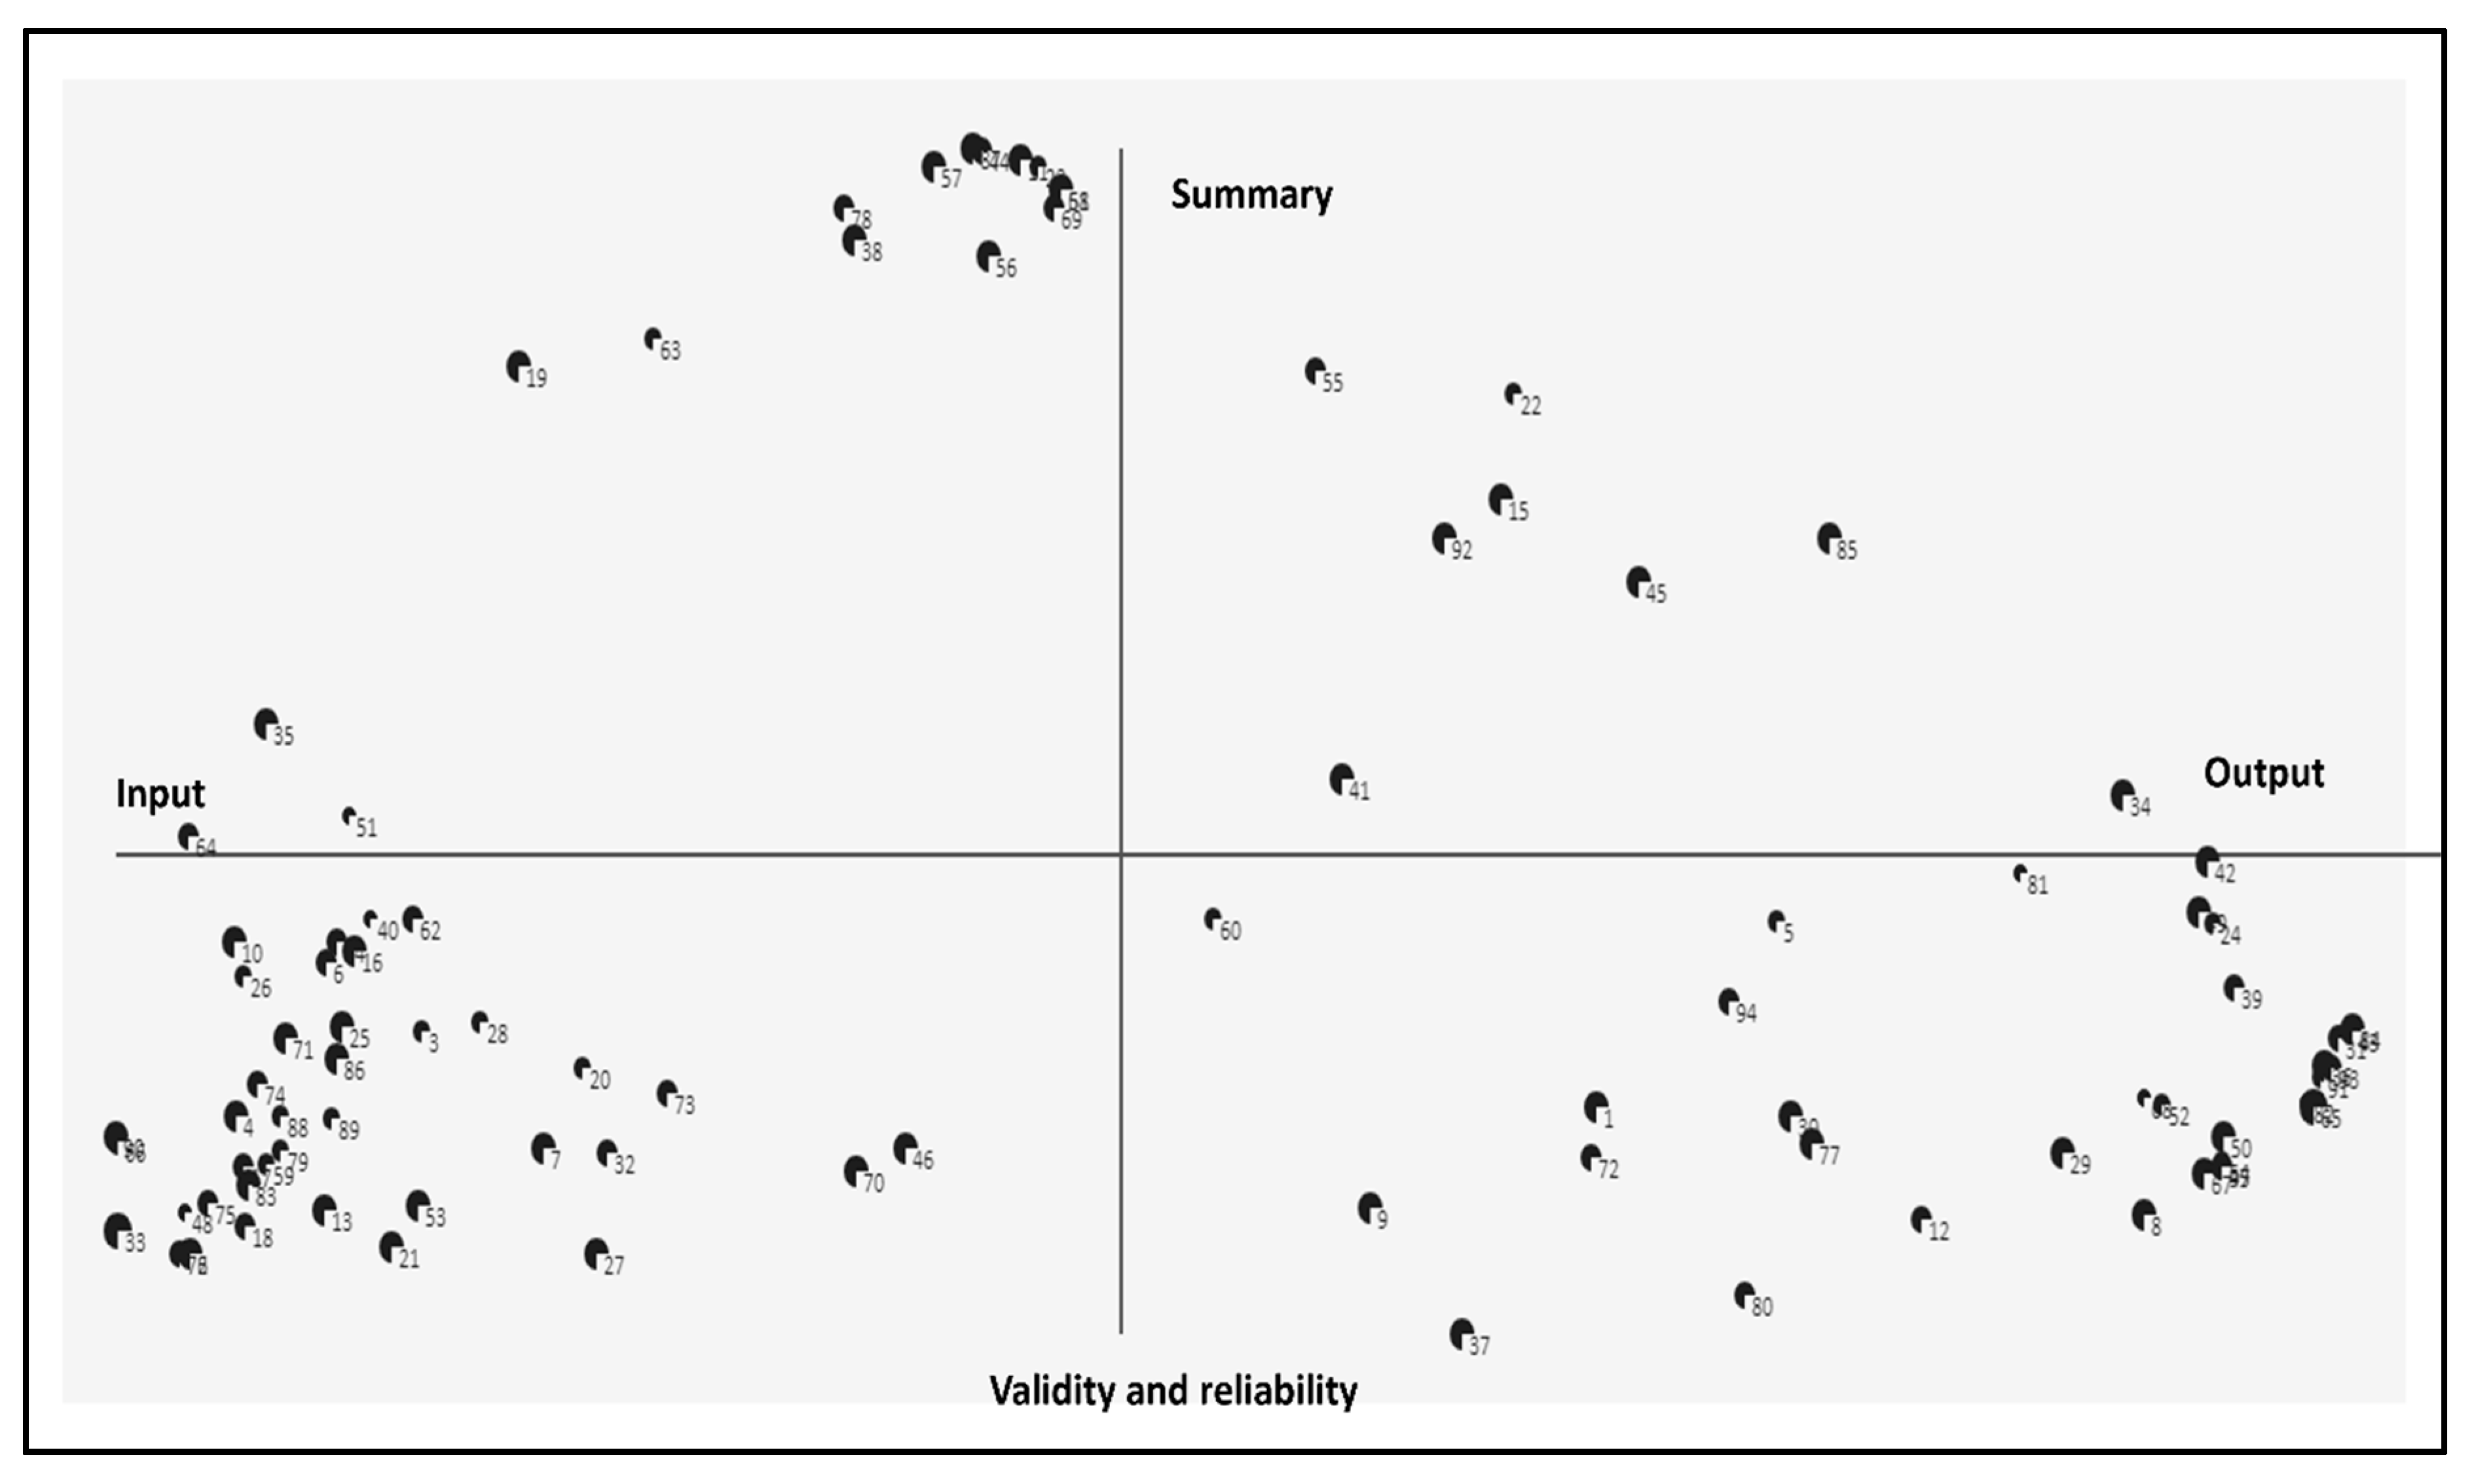
Description of the Axis of the Concept Map
Figure 2 shows the point map after removing the outlying statement. The location of the remaining statements on the map was unaffected (the original point map with 96 statements is available for comparison as supplementary document 7). The right of the x-axis includes statements that closely represent results or findings from the study ‘output’ whereas the left side represents statements describing the research process or ‘input’. The top of the y-axis contained statements representing background information, the title and abstract was named ‘summary’, and we determined the lower end as ‘validity and reliability’ as statements represented research quality.
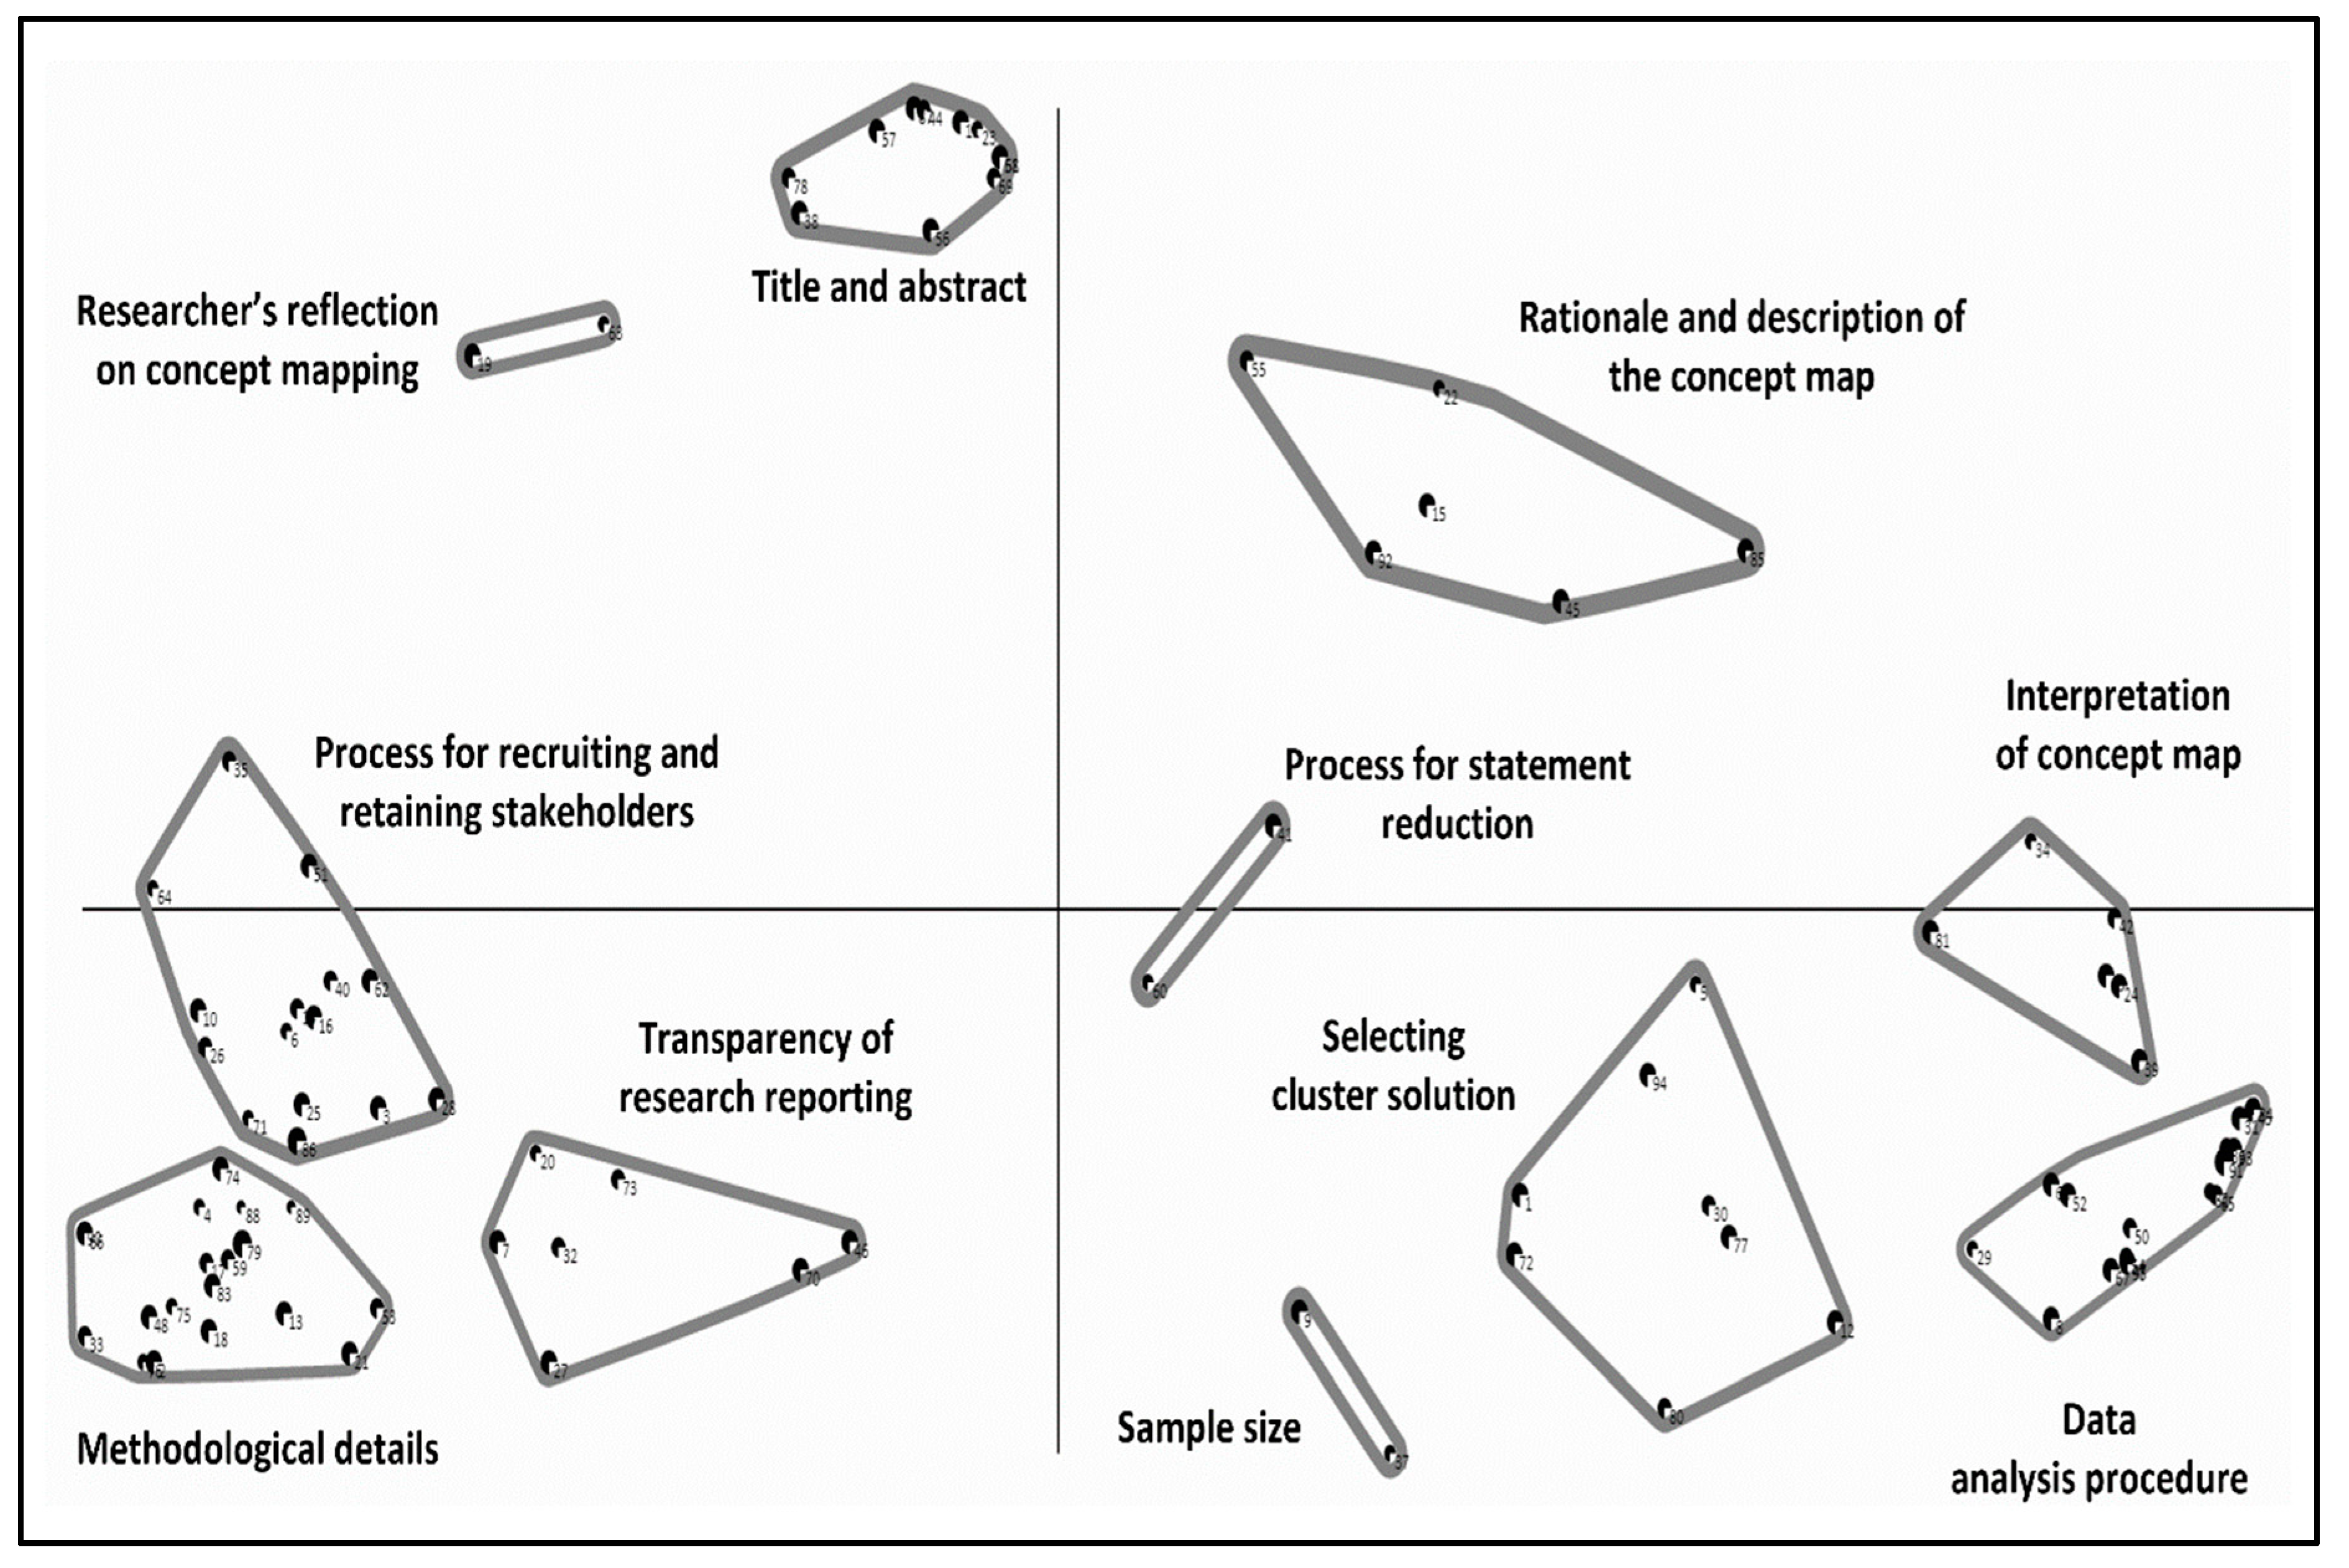
Description of the Final Concept Map
Figure 3 is the final 11-cluster concept map. These clusters include - 1. Title and abstract, 2. Description of the statements included in the cluster and rationale for the map, 3. Statement reduction process, 4. Interpretation, 5. Description of data analysis procedure and reporting, 6. Determining optimal cluster solution, 7. Sample size determination, 8. Transparency, 9. Details of concept mapping methodology, 10. Procedures of engaging stakeholders in the concept mapping process, 11. Authors’ reflection on concept mapping. Supplementary document 6 provides information on the statements contained in each cluster of the 11-cluster solution.
There were several notable features of the final concept map. First, most of the clusters formed a circle around the middle of the map. This suggests that each of the clusters is of equal importance. Second, several
clusters were constellated in specific regions of the map. For example, the process for recruiting and retaining stakeholders, transparency of research reporting, and methodological details are all located in the bottom, left-hand quadrant of the map.
Three clusters (Interpretation of concept map, Process for statement reduction, and Process for recruiting and retaining stakeholders) intercepted the x-axis, suggesting they may be thematically related to the nearby clusters.
Six clusters (rationale and description of the concept map, selecting cluster solution, data analysis procedures, methodological details, transparency of research reporting, and process for recruiting and retaining stakeholders were somewhat larger suggesting a lack of clear conceptual focus.
Three clusters (sample size, process for statement reduction, and researcher’s reflection on concept mapping) only contained two statements potentially reflecting that these clusters represent specific constructs.
3. Stage 3, Development of the Draft Reporting Guideline
Based on the results of the concept mapping and the literature review [
29] we compiled a list of 167 candidate items that were initially organised under the six phases of concept mapping (supplementary document 10). We then combined the similar candidate items to produce a candidate list of 60 items. The draft checklist (supplementary document 11) was then sent to colleagues (who participated in the structuring phase of the concept mapping, (n=24)) inviting them to give comments on the draft. Eight participants returned feedback – for example, the need to describe the item more clearly and candidate items that should be removed. Feedback from the participants was used to refine the draft guideline.
3.1. Reporting Guideline
The final version of the reporting guideline (supplementary document 12) comprises a 27-item checklist (the ConMapT) organised under 14 headings: title (item 1), abstract (item 2), background (items 3-5), phase 1, preparation (items 6-10), phase 2, generating the ideas (items 11-13), phase 3, structuring the statements (item 14-16), phase 4, concept mapping analysis (item 17-18), phase 5, interpreting the map (item 19-21), phase 6, utilization (item 22), discussion (item 23), study limitations (item 24), ethics (item 25), conclusion (item 26), and registration and protocol (item 27).
The 11-cluster solution guided us in arranging the checklist items. For example, one of the clusters included ‘title and abstract’. For clarity and in line with the existing reporting guidelines (for example, PRISMA, STROBE), ‘title and abstract’ were organised as 1. Title and 2. Abstract. In addition, two clusters, ‘Details of concept mapping methodology’ and ‘Description of data analysis procedures and reporting’ had 18 and 17 statements respectively. We arranged these clusters to refine the checklist based on the six phases of the concept mapping process.
3.2. Pilot Testing of the Reporting Guideline
The draft guideline was pilot-tested on ten concept mapping studies from our systematic review (phase 1) that we selected at random. Supplementary document 13 shows the results of the pilot study against each reporting guideline checklist item. No specific issues were identified during the pilot testing.
Discussion
The aim of this study was to develop a reporting guideline for concept mapping research following the process described by the EQUATOR network [
24]. To identify candidate items for inclusion in the reporting guideline, we conducted a systematic review of the quality of reporting concept mapping studies and completed our concept mapping research. The process of developing the guideline was participatory and involved a range of key stakeholders including concept mapping researchers and methodological experts. The selection of study participants was transparent (identified from a systematic review).
The final version of our reporting guideline contains 27 items under 14 sub-headings. There is only one alternative to our reporting guideline which is a 10-point checklist described by Group Wisdom [
26]. The checklist provides limited guidance as to what to include in a report of Trochim’s concept mapping research [
26]. The process of developing the guide has not been reported. We are therefore describing the first reporting guideline for Trochim’s concept mapping research. We intend to make the guideline freely available through the EQUATOR network.
Moher et al. (2011) has been critical of how researchers have developed reporting guidelines. In a systematic review of 81 reporting guidelines in health research, the authors noted that important aspects of guideline development are often not described [
32]. For example, the process for developing the STROBE [
33] reporting guidelines – an extensively used reporting guideline for observational research – do not provide details on how checklist items were derived. The process that we followed in developing our reporting guideline adhered strictly to the methods described by Moher et al. (2010) and endorsed by the Equator network [
23]. Our protocol for developing the guideline was pre-registered (weblink), deviations against the protocol have been fully described and justified. All data from our research – including candidate concept maps – are available for checking (and reuse). Consequently, we consider that the ConMapT (Concept Mapping Trochim) guideline has been developed in a manner that is consistent with the best current practice.
The EQUATOR network does recommend using Delphi methodology to inform guideline development [
24]. We did not do this, opting instead to use Trochim’s concept mapping. We made this decision, primarily because the methodology is well suited to the task and confers advantages over Delphi methodology. Trochim’s concept mapping is more participatory as the participants themselves generate ideas on the reporting items. It is a valid critique of Delphi methodology that there is a possibility that important information could be lost during the process of acquiring consensus among study participants [
34,
35,
36]. We propose that concept mapping should be considered a candidate methodology for guideline development in the future.
Using a concept mapping approach for guideline development may overcome the need for a systematic review in the guideline development process. In a typical guideline development process recommended by the EQUATOR network, a systematic review (of the quality of the reporting study design for which the guideline is intended) informs the Delphi process for guideline development. Following the EQUATOR network recommendations, we undertook a systematic review and identified 69 potential items to include in the reporting of concept mapping research. Participants in our concept mapping process generated all potential candidate reporting items identified from the systematic review.
Limitations
There are important limitations to our research that should be considered. There were two stakeholder groups – journal editors, and research participants – that despite our best efforts we were unable to recruit. We were not able to actively engage our expert group in drafting the reporting guideline, instead, they chose to provide feedback on the draft we sent to them.
We defined a concept mapping expert, somewhat arbitrarily, as a researcher who had published at least five concept mapping papers. It may have been preferable to have recruited researchers who had published concept mapping methodological papers as they would likely have had a deeper knowledge of the approach.
The cluster solutions identified were based on the Principal Component Analysis (PCA) and Hierarchical Cluster Analysis (HCA). Trochim, however, suggests using Multidimensional Scaling (MDS) and Cluster Analysis (CA) for the analysis of concept mapping data [
37]. Both PCA and MDS are well established for the analysis of multi-dimensional data and locate statements based on how frequently they are paired together [
38]. However, there is an argument that the final concept map produced from these statistical procedures may be different [
5]. We were unable to undertake data analysis using MDS as the software we used for concept mapping (Ariadne) incorporates PCA for data analysis [
31].