Submitted:
20 December 2024
Posted:
23 December 2024
You are already at the latest version
Abstract
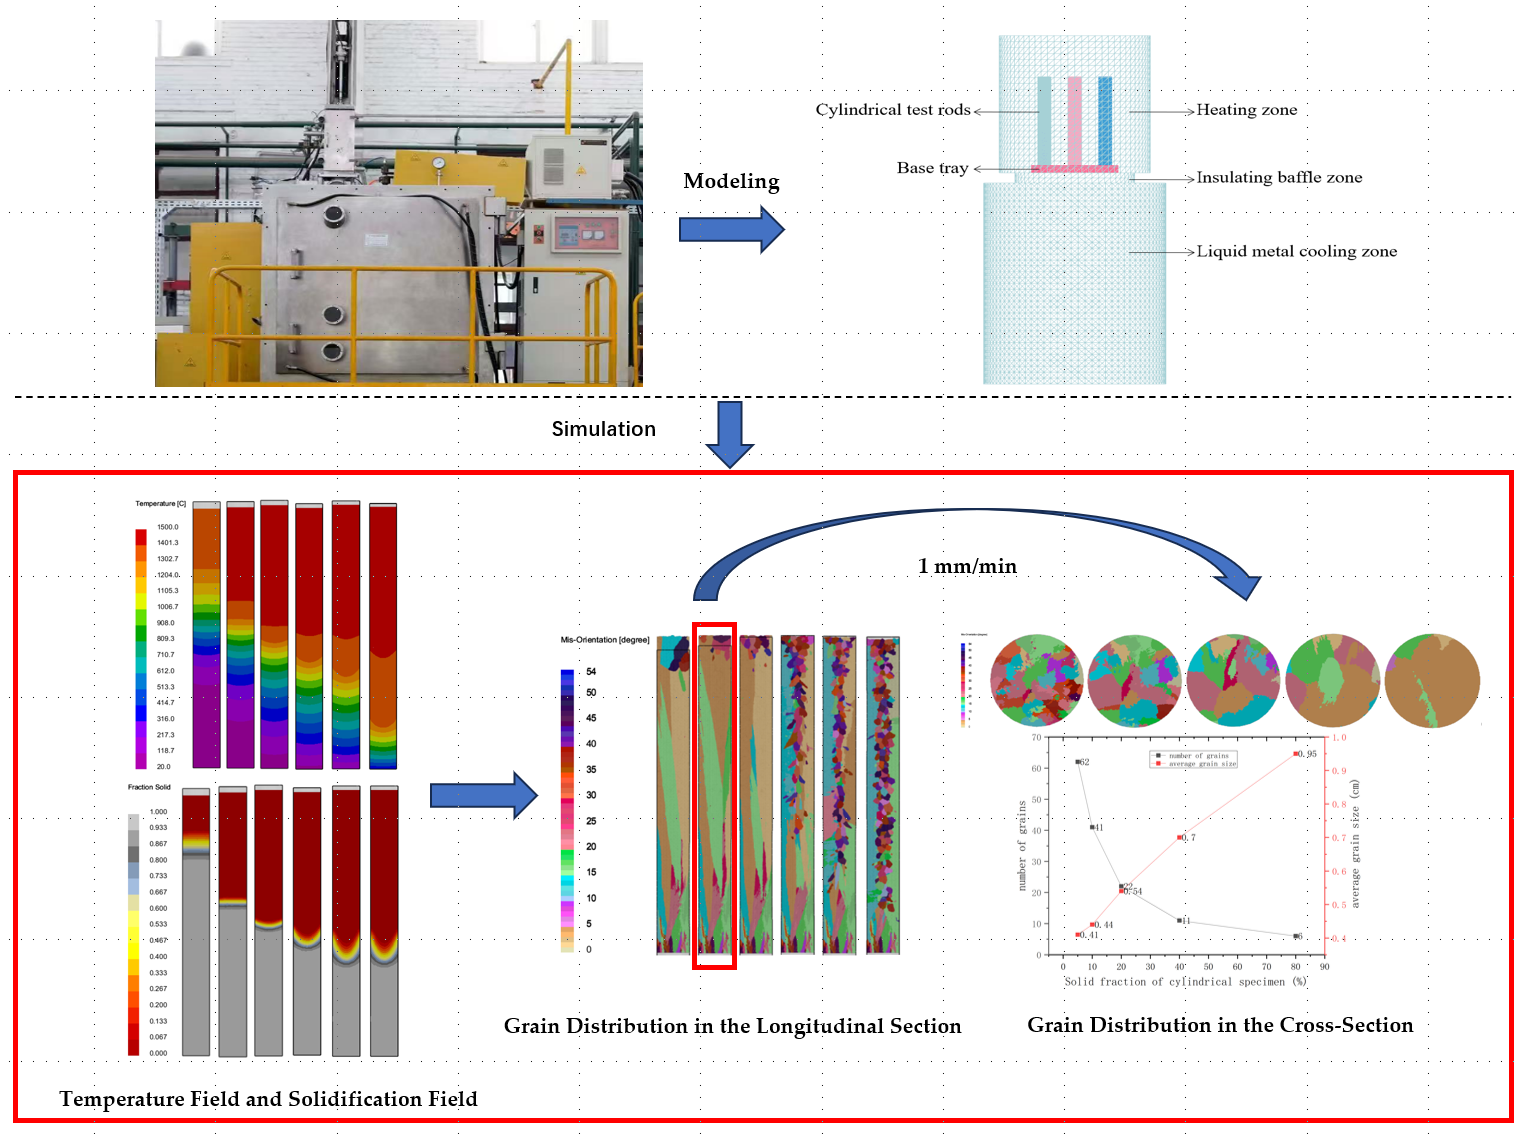
In this study, the ProCast software incorporating the CAFE model is applied to conduct numerical simulation analysis on the directional solidification process of titanium-aluminum alloy cylindrical rods at varying withdraw rates. According to the analytical results, the withdraw rate is a critical parameter that affects the morphology of the solid-liquid interface and the grain growth behavior during the directional solidification process. An increase in the drawing rate facilitates nucleation undercooling within the rod, inducing a shift in grain morphology from columnar to equiaxed. At a drawing rate of 1 mm/min, the solid-liquid interface exhibits the most stable morphology, as characterized by a flat interface. As indicated by further analysis, at this drawing rate, specific grain orientations are eliminated during competitive growth with an increase in solid fraction, culminating in the formation of columnar grain structures. Additionally, the impact of drawing rate on grain size and number is investigated, with an increase observed in grain number with drawing rate and a decrease found in grain size. The findings of this study contribute to a deeper understanding of mechanisms behind the grain morphology evolution of titanium aluminide, providing crucial support in theory for optimizing directional solidification processes.
Keywords:
titanium-aluminum alloy
; directional solidification
; withdraw rate
; numerical simulation
; microstructure
; grain growth
1. Introduction
As a class of compounds combining titanium and aluminum, titanium-aluminum (Ti-Al) intermetallics exhibit a density that is approximately 50% less compared to nickel-based superalloys. These alloys are characterized by excellent high-temperature creep resistance, superior oxidation resistance, and elevated melting points. When the temperature ranges from 600°C to 800°C, Ti-Al alloys exhibit a higher specific strength than both titanium and nickel-based alloys [1]. In 2006, General Electric (GE) pioneered the application of the Ti-48Al-2Nb-2Cr alloy in the low-pressure turbine blades of commercial aircraft engines[2]. Despite these advantages, Ti-Al alloys still perform poorly in ductility, which causes difficulty in processing and shaping. For this reason, casting and powder metallurgy are the mainstream forming methods[3]. Among various casting techniques, directional solidification is preferred. Promoting the growth of molten metal in a direction opposite to the heat flow, this process results in the columnar or single crystalline structures oriented in a specific crystallographic manner. Due to this orientation, the material possesses exceptional mechanical properties along a defined axis[4]. Depending on the exact cooling method used, directional solidification techniques can be divided into different categories, of which the Power Reduction Method (PD), High-Speed Solidification Method (HRS), and Liquid Metal Cooling Method (LMC) are the primary ones[5]. Notably, the LMC method has attracted widespread attention for its industrial potential. Its defining feature lies in the use of a liquid metal as a cooling medium for the mold shell, as achieved by submerging the shell in a liquid metal bath. This method is applicable to generate a steep temperature gradient[6].
With the emergence of computer numerical simulation technology, the casting industry has been revolutionized, with numerical simulation transformed into a powerful research tool. When this technology is applied, the directional solidification process in titanium-aluminum alloys can be visualized, which not only facilitates the study of defect formation mechanisms, but also supports the optimization of process parameters. This is conducive to significantly reducing production costs, expediting the manufacturing time, and enhancing the overall efficiency of the manufacturing process[7,8]. Such advancements play a pivotal role in advancing materials science and engineering, particularly under the context of alloy development and processing techniques. As a critical parameter, the drawing rate exerts a significant influence on the directional solidification process, which determines the patterns of temperature distribution and crystallographic growth within the solidifying material. Traditionally, empirical engineering knowledge provides guidance on the selection of an optimal drawing rate[9].
In this study, ProCast software, which incorporates the Cellular Automata-Finite Element (CAFE) model, is applied to investigate the macroscopic temperature fields, solidification behavior, and microstructural evolution in titanium-aluminum alloy cylindrical test rods. At six different drawing rates, an analysis is conducted to thoroughly assess their impact on the solidification dynamics.
2. Materials and Methods
2.1. Three-Dimensional Model
A three-dimensional computational model was constructed using UG software, featuring a cylindrical test rod with a diameter of 15 mm and a length of 300 mm. The Bridgman method was used to design the directional solidification apparatus[10]. By facilitating the controlled descent of molten metal from the top to the bottom of the cooling zone through a drawing mechanism, this method is applicable to establish a pronounced temperature gradient along the vertical axis. This gradient is beneficial for promoting the directional growth of crystals from the base of the rod upwards, which continues until the entire volume of molten metal has transitioned into a solidified state. Ensuring a precise control over the solidification dynamics, this approach plays an essential role in manipulating the microstructural attributes of the final product.
For higher computational efficiency, the model was simplified to encompass three primary regions: a heating zone, an intermediate insulating baffle zone, and a liquid metal cooling zone. The cylindrical test rods were positioned on a base tray made of molybdenum alloy. For the purposes of this study, the influence of the drawing device was treated as negligible and thus excluded from the model, as shown in Figure 1. Through this streamlined approach, a focused analysis was conducted on the thermal dynamics within the critical zones of the directional solidification process.
2.2. Microstructure Mathematical Model
The solidification of titanium-aluminum alloys is highly complex. The numerical simulation methodologies applied to capture this process include various stochastic approaches such as the Monte Carlo and cellular automaton methods, the phase-field method, and a series of deterministic methods like the Cellular Automata-Finite Element (CAFE) model[11]. The solidification of metals is characterized by the nucleation and growth phases of crystals. As revealed by prior research, the nucleation rate is determined by the degree of undercooling and the elapsed time, whereas the growth rate is affected by the extent of undercooling. The temperature gradient at the solid-liquid interface acts as a major driving force for crystal growth.
In line with statistical methodologies, Rappaz and Thevoz et al. conducted an in-depth analysis of the nucleation process, with a continuous nucleation model proposed. Based on the Gaussian distribution, this model represents a robust framework used to predict nucleation events within the alloy[12]. Crucial to the accurate simulation of microstructural evolution during the solidification phase, this model provides insights into the formation and growth of crystalline structures within the titanium-aluminum alloy.
The grain generation model is expressed as follows:
where represents the nucleation undercooling; denotes the rate of change in nucleation number; indicates the maximum nucleation density for heterogeneous nucleation; means the maximum undercooling for heterogeneous nucleation; refers to the standard deviation undercooling in statistics.
The grain growth model based on the KGT model is expressed as follows[13]:
where represents the growth rate; and refer to the growth coefficients; represents nucleation undercooling.
2.3. Material Parameters and Thermal Properties

Table 1.
Composition of Ti-48Al-2Cr-2Nb alloy (at.%).
| Ti | Al | Cr | Nb |
|---|---|---|---|
| 48 | 48 | 2 | 2 |
ProCast software was applied to computationally determine the thermodynamic properties of the titanium-aluminum alloy, as detailed in the composition presented earlier. Figure 2 shows these calculation results. Considering its favorable inert characteristics, the mold shell material was selected as zirconia sand, which minimizes reactivity with the titanium-aluminum alloy. Made of molybdenum alloy, the base tray was selected for its high-temperature strength and thermal conductivity. As the liquid metal coolant used in the directional solidification process, a gallium-indium-tin alloy was chosen for its low melting point and high thermal conductivity, both of which are essential for achieving the expected cooling rates and temperature gradients. These material selections play a critical role in controlling the solidification kinetics, which leads to the desirable microstructure of titanium-aluminum alloy.
2.4. Boundary Conditions
During directional solidification, heat transfer is largely affected by two mechanisms: thermal conduction and thermal radiation. Thermal conduction occurs not only at the interfaces between the mold shell and the casting, but also between the casting and the chill plate. This process is significant to the controlled transfer of heat away from the casting. Conversely, thermal radiation is the primary mode of heat exchange between the mold shell and the external furnace environment.
For accurate simulation of these conditions, the heating process was modeled, with radiation heat transfer as the focus. The radiation coefficient for the heating zone was calibrated to 0.8, corresponding to an external heating temperature of 1600°C. Under this setting, it can be ensured that the mold shell and the casting are subjected to a uniform and intense heat flux, which is essential for initiating and maintaining the directional solidification process. For the intermediate baffle zone and the cooling zone, the radiation coefficients were adjusted to 0.6. Through this nuanced approach to radiation coefficients, a more precise control can be imposed on the thermal environment, which has effect on the solidification kinetics and the resultant microstructure of the titanium-aluminum alloy. These boundary conditions were carefully defined to replicate the actual foundry conditions, thus providing a robust framework for the numerical simulation of the directional solidification process.
With variations in the drawing position, the external heat exchange characteristics of the mold shell were modulated in real time. To account for this, its application programming interface (API) was used to develop a custom program as an extension to the ProCast software. This secondary development was conducted in the C programming language to record the dynamic changes in external heat transfer coefficient of the mold shell, which are essential for reflecting the thermal behavior accurately during the directional solidification process. The implementation process is detailed as follows:
During the drawing process, the heat transfer coefficient is maintained at a low value of 10 W/(m^2·K) in the heating zone. Immediately after entry of the casting into the liquid metal cooling zone, the heat transfer coefficient increases sharply to 2000 W/(m^2·K). This is purposed to simulate the intense heat extraction occurring when the casting comes into contact with the liquid metal, which is conducive to directing the solidification path and manipulating the final microstructure of the titanium-aluminum alloy. Adapted to heat transfer coefficient modulation, this tailored approach is critical for a high-fidelity simulation of the directional solidification process.
The relevant experimental parameters to drawing speed were carefully selected, encompassing a range of different values: 0.5 mm/min, 1 mm/min, 2 mm/min, 3 mm/min, and 4 mm/min. These velocities provide a comprehensive spectrum required to evaluate their impact on the directional solidification process.
The nucleation parameters were determined using empirical data, including an average undercooling Dtm of 20 K, a standard deviation Dts of 5 K, and a maximum nucleation density of 2 nuclei per cubic millimeter. These parameters are indispensable for determining the initial stages of solidification and the subsequent microstructural development. According to previous experimental observations, the grain growth coefficient was assigned a value of 5.85e-06. This coefficient is crucial for modeling the growth of grains during the solidification process.
3. Results
3.1. The Influence of Drawing Speed on the Temperature Field and Solidification Field of the Test Rods
Figure 3 illustrates the temperature distribution within the test rods as they reach an equivalent position within the liquid metal cooling zone at different drawing speeds. Notably, there is a significant thermal gradient observed in the intermediate baffle area, which represents a critical region for heat exchange during the solidification process.
As the drawing speed increases, there is a progressive downward shift observed in the solid-liquid interface. Indicative of the dynamic thermal conditions within the system, this migration has a significant effect on the solidification kinetics. Meanwhile, the isothermal lines, which represent the lines of constant temperature, undergo morphological transformation. First aligned in a straight configuration, they are transformed into a concave shape as the drawing speed increases incrementally. As a direct response to the change in thermal landscape, this shift in isothermal line configuration highlights the important role of drawing speed in the thermal profile within the solidifying alloy. These observations are beneficial for understanding the interplay between processing parameters and the thermal behavior of the material during directional solidification.
Figure 4 illustrates the evolution of the solidification interface at varying drawing speeds. Obviously, an increase in drawing speed causes the shift in interface morphology from a planar to a concave configuration.
At an optimal drawing speed of 1 mm/min, the solid-liquid interface remains planar, exhibiting the highest stability in configuration. This is attributed to a balanced heat transfer rate that promotes uniform solidification across the interface. However, the interface characteristics vary significantly given the deviations from this optimal speed.
When the drawing speed exceeds the recommended threshold, the rapid immersion of the test rod into the liquid metal renders the transmission of internal heat downwards inadequate. Concurrently, the mold shell surface’s accelerated heat dissipation rate precipitates the premature formation of a solidification layer along the mold wall. Because of this uneven heat distribution, a concave solidification interface results.
Conversely, the mushy zone, as the intermediate region between solid and liquid phases, expands excessively at extremely low drawing speeds. In an overextended mushy zone, the solidification process can be complicated, as it may accommodate inhomogeneities and increase the likelihood that such defects as porosity or segregation arise.
Figure 5 illustrates the solid-liquid interface position within the test rod under different drawing speeds. At the relatively low drawing speed of 0.5 mm/min, the rate is deemed insufficient. Consequently, the base’s cooling effect is more significant compared to the liquid metal coolant. Due to this imbalance, the solid-liquid interface is positioned far away from the intermediate baffle separation area, which indicates a slower rate of heat extraction from the system.
At a drawing speed of 1 mm/min, the solid-liquid interface is observed to be slightly above the intermediate baffle zone, which results from the cooling effect exerted by the base on the liquid metal. As the increase in drawing speed continues, the solid-liquid interface progressively descends, moving closer to the liquid metal cooling area. This downward migration demonstrates the intensified cooling effect as the test rod stays in the liquid metal for longer. Accordingly, heat transfer occurs more rapidly from the rod to the coolant.
3.2. Influence of Drawing Speed on Grain Formation
The drawing rate is a critical parameter that significantly affects the nucleation undercooling during the solidification process. As the drawing speed rises sharply, the degree of undercooling increases, which augments the driving force for nucleation. Typically, this causes columnar crystals to develop in the regions aligned with the direction of heat flow, with equiaxed crystals observed in the peripheral areas of the casting.
Figure 6 presents a microstructural simulation of the test rod, with various grain orientations indicated by distinct colors. At the onset of solidification, a rapid cooling rate is achieved at the bottom of the test rod, which is in contact with the chill plate. This rapid cooling facilitates a prolific nucleation event at the base of the rod. As the drawing speed rises incrementally to 3 mm/min, equiaxed crystals emerge at the core of the test rod, suggesting the change in nucleation behavior.
Table 2 depicts the relationship between the drawing speed and the grain characteristics within the cross-section of the test rod. As the drawing speed rises, there is a progressive increase in the grain count across the cross-section. Meanwhile, the average grain size decreases. This is a trend underscoring the impact of drawing speed on nucleation and growth dynamics.
For the most stable solid-liquid interface, an in-depth analysis was conducted on the grain distribution across the cross-section of the test rod at a drawing speed of 1 mm/min and varying solid fractions of 5%, 10%, 20%, 40%, and 80%, as shown in Figure 7, Figure 8 and Figure 9. As can be seen in Figure 7 and Figure 8, certain oriented grains are outcompeted and eliminated during the competitive growth phase as drawing proceeds. As shown in Figure 9, the number of grains in the cross-section of the test rod gradually decreases with the advancement of drawing, from an initial count of 62 to just 6. In the meantime, the average grain size increases significantly, from 0.41 cm to 0.95 cm, which implies a transition from an initial equiaxed crystal structure to a columnar crystal structure. This highlights the substantial effect of drawing speed on microstructural evolution of the material.
4. Conclusions
In the present study, ProCast software, which incorporates the Cellular Automata-Finite Element (CAFE) model, was adopted to investigate the macroscopic temperature and solidification fields, along with the microstructural development in titanium-aluminum alloy cylindrical test rods at six different drawing speeds. The key findings of this study are summarized as follows:
1. The temperature and solidification fields at varying drawing speeds were analyzed to reveal a progressive transformation in morphology of the solid-liquid interface. As the drawing speed increased, the interface changed from a planar to a concave configuration, with stability reaching the optimal level at a drawing speed of 1 mm/min. This stabilization plays a crucial role in maintaining uniform solidification and preventing the formation of defects.
2. Microstructural simulation was performed to indicate that the grain growth predominantly exhibited a columnar structure at the lower drawing speeds of 0.5 mm/min and 1 mm/min. However, at higher drawing speeds, specifically from 3 mm/min, equiaxed crystals developed obviously in the test rod’s core. Concurrently, a rise in drawing speed led to an increase in the grain count and a decrease in grain size, highlighting the sensitivity of grain nucleation and growth to the changes in drawing speed.
3. By analyzing the cross-sectional grain distribution within the test bar at a controlled pulling speed of 1mm/min and varying critical solid fractions of 5%, 10%, 20%, 40%, and 80%, it was deduced that the grain growth trajectory is selective. Specifically, the grains with certain crystallographic orientations were preferentially retained, with others systematically outcompeted and eliminated. This selective growth mechanism culminated with the development of those columnar crystals composed mainly of grains aligned with the most favorable orientations for growth under the given solidification conditions. This finding demonstrates the significance of orientation-dependent growth kinetics to the evolution of microstructures during solidification processes.
4. The findings of this study underscore the significant impact of drawing speed on nucleation undercooling and grain growth. It was determined that a drawing speed of 1 mm/min is optimal for the development of a stable columnar grain structure, which is conducive to enhancing the mechanical properties of the titanium-aluminum alloy. By ensuring a balance between heat extraction and solidification kinetics, this optimal speed promotes the development of a uniform and structurally sound microstructure.
In conclusion, drawing speed is a critical parameter that affects the process of thermal and microstructural evolution during the directional solidification of titanium-aluminum alloys. The insights gained through this study provide scientific reference for the optimization of processing parameters in the production of these advanced materials, which is beneficial for improving the efficiency and quality of industrial casting processes.
References
- Yang, R. Progress and challenges of titanium and aluminum intermetallics. J Metals, 2015, 51, 129–147. [Google Scholar]
- Bewlay, B.P.; Nag, S.; Suzuki, A.; et al. TiAl alloys in commercial aircraft engines. Materials at High Temperatures, 2016, 33, 549–559. [Google Scholar] [CrossRef]
- Zhang, L.Q.; Ge, G.W.; Lin, J.P. Progress in hot working of TiAl alloys. Precision Forging, 2022, 14, 1–9. [Google Scholar]
- Wang, Y.; Cui, C.J.; Zhang, K.; et al. Research progress on directional solidification of intermetallic compounds. Materials Guide, 2022, 36, 135–142. [Google Scholar]
- Zhou, Y.H.; Hu, Z.Q.; Jie, W.Q. Solidification Technology; Mechanical Industry Press: Beijing, 1998. [Google Scholar]
- Xiong, W. Numerical simulation of directional solidification deformation of nickel-based single crystal superalloys and experimental study of recrystallization. Central South University, 2022. [Google Scholar]
- Ren, N.; Yang, L.W.; Li, J.; et al. Research progress on numerical simulation of directional solidification of high-temperature alloys. Special Casting and Nonferrous Alloys, 2023, 43, 1336–1350. [Google Scholar] [CrossRef]
- Zhou, Y.H.; Huang, Q.M.; Lin, R.C. Numerical simulation of directional solidification process of single crystal superalloy blades. Special Casting and Nonferrous Alloys, 2021, 41, 1361–1365. [Google Scholar] [CrossRef]
- Zhang, H.H.; Zhang, H.; Zhang, L.; et al. Influence of drawing speed on directional solidification process of single crystal blades. Foundry, 2023, 72, 130–134. [Google Scholar]
- Kurz, W.; Giovanola, B.; Trivedi, R. Theory of microstructural development during rapid solidification. Acta metallurgica, 1986, 34, 823–830. [Google Scholar] [CrossRef]
- Yan, X.; Xu, Q.; Tian, G.; et al. Multi-scale modeling of liquid-metal cooling directional solidification and solidification behavior of nickel-based superalloy casting. Journal of Materials Sciences and Technology 2021, 67, 36. [Google Scholar] [CrossRef]
- Thevoz, P.; Desbiolles, J.L.; Rappaz, M. Modeling of equiaxed microstructure formation in casting. Metallurgical Transactions A. 36 1989, 20, 311–322. [Google Scholar]
- Liu, Z.; Sun, H.; Xu, F.; et al. Parameters determination of grain microstructure prediction for a single crystal casting simulation and its experimental validation. International Journal of Metalcasting, 2018, 12, 861–869. [Google Scholar] [CrossRef]
Figure 1.
LMC Directional Solidification Computational Model.
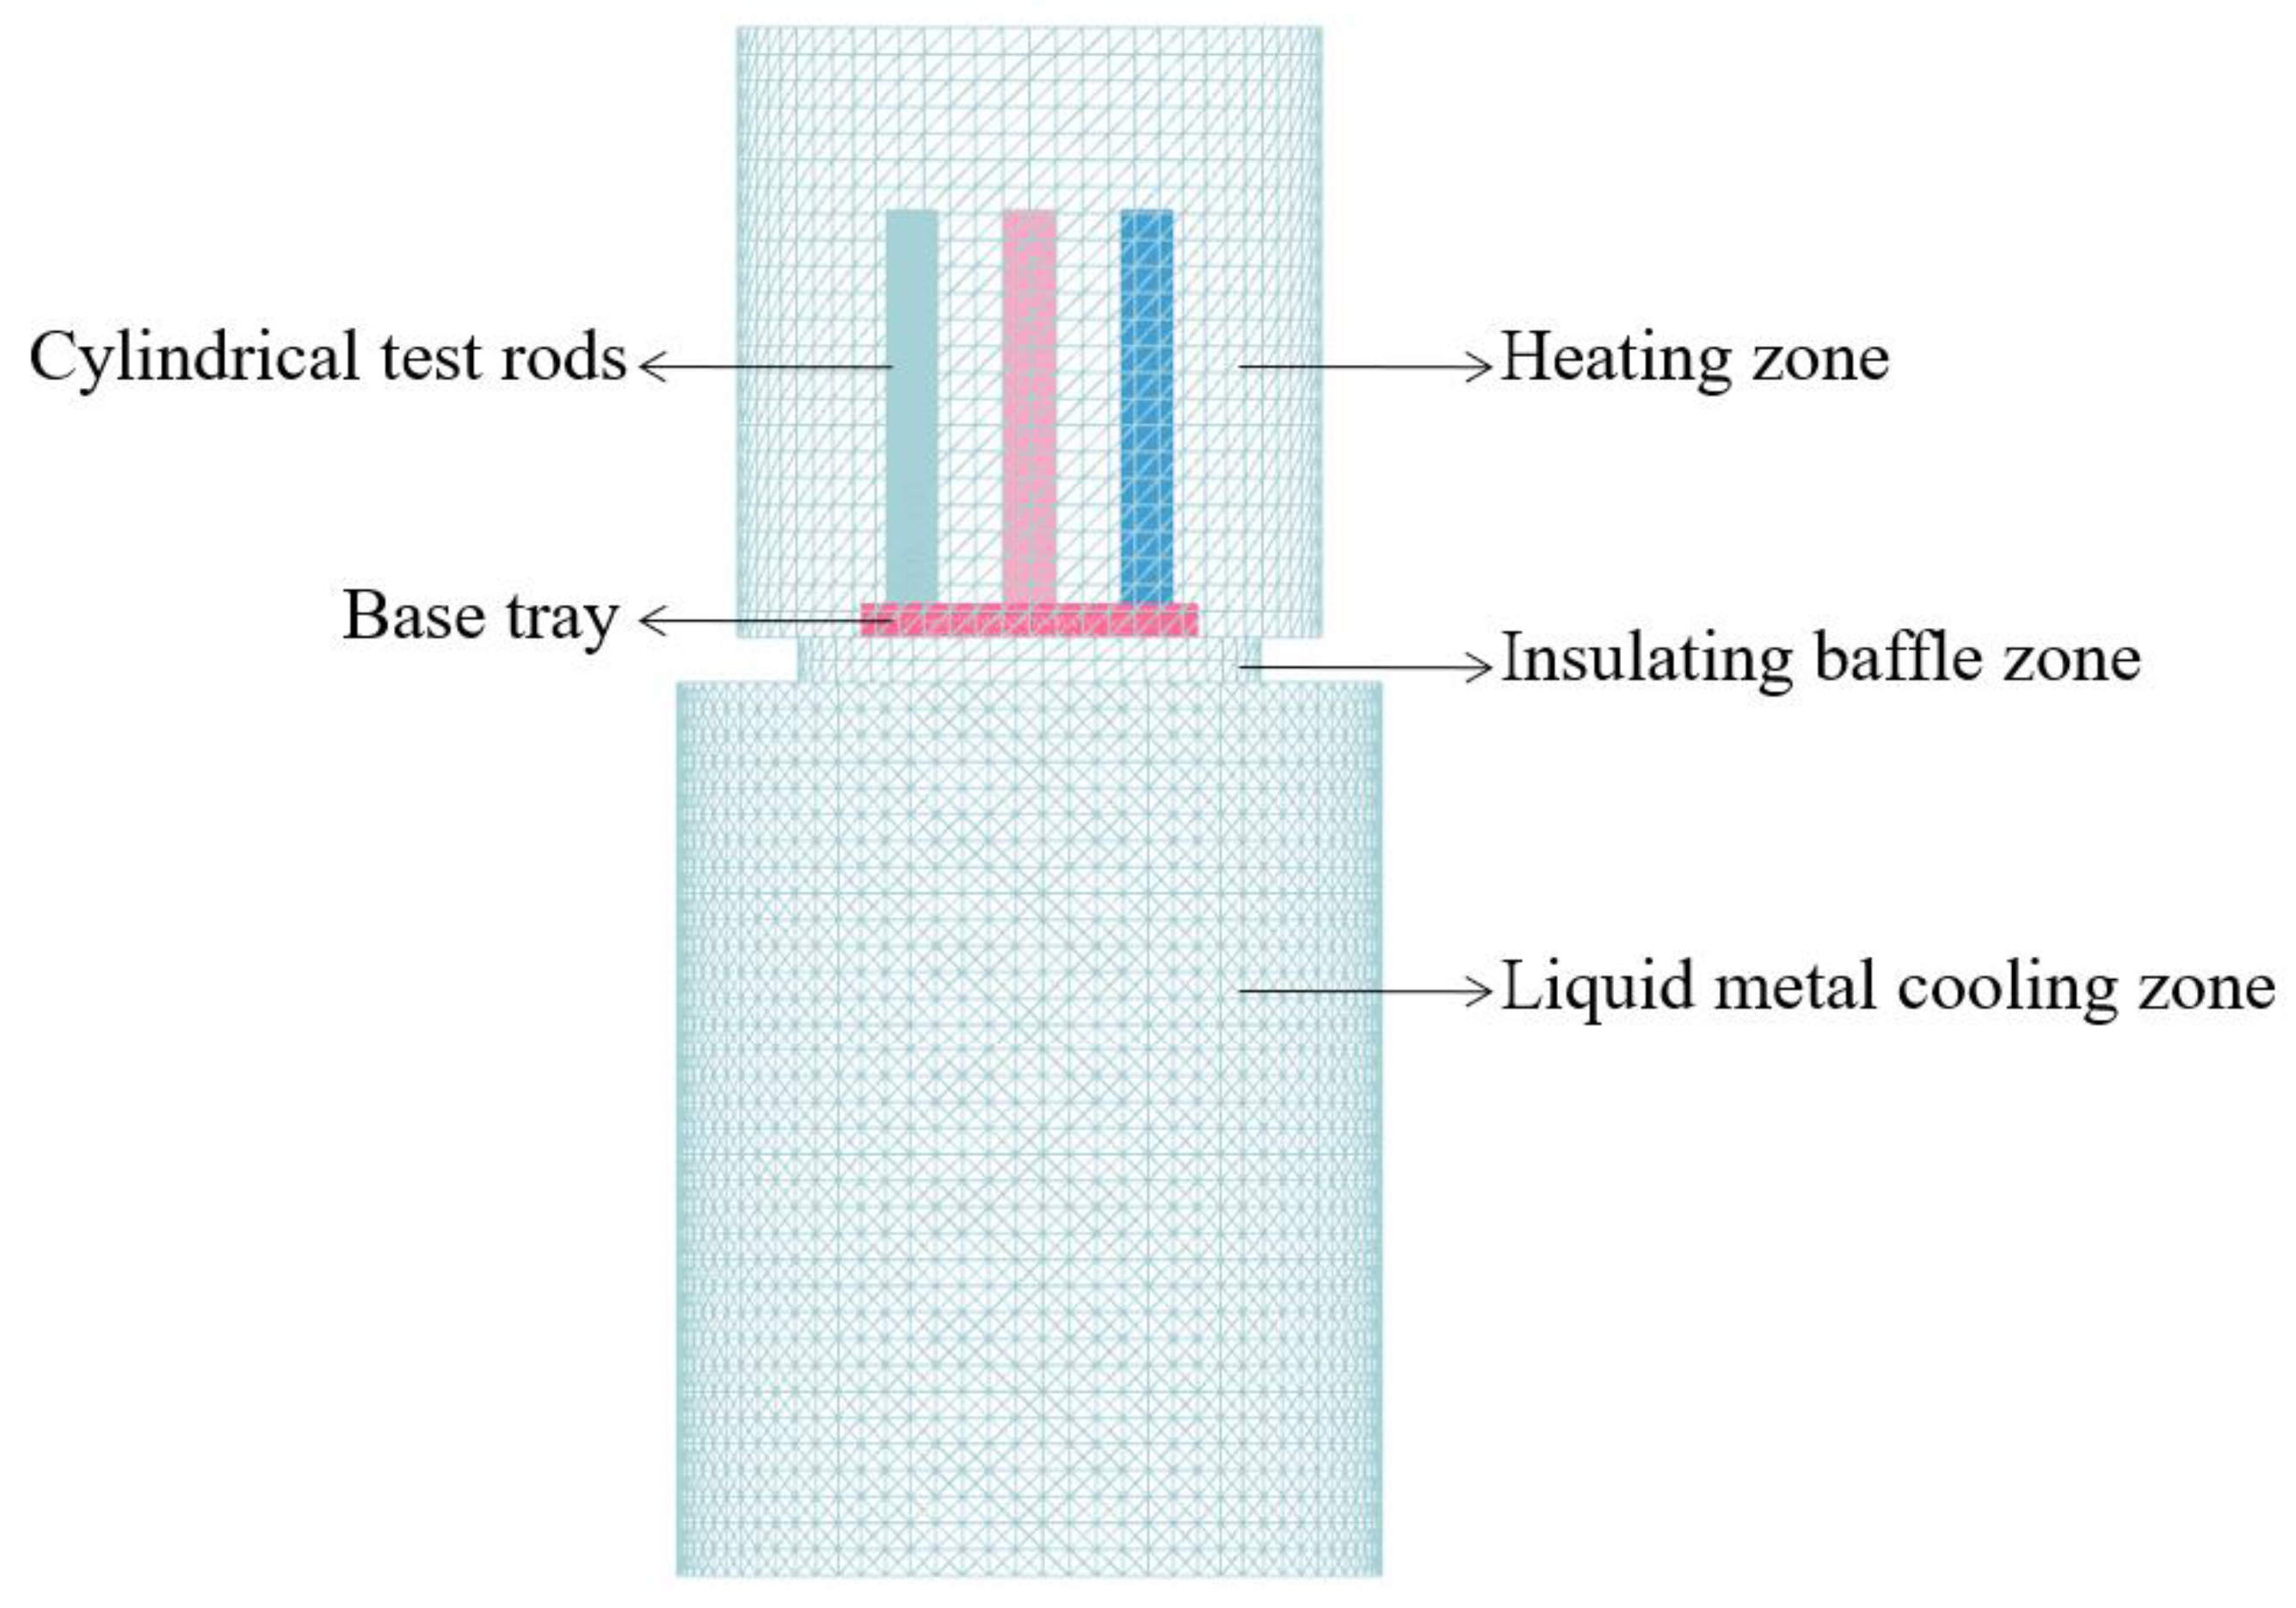
Figure 2.
Thermal Properties of Ti-48Al-2Cr-2Nb Material.
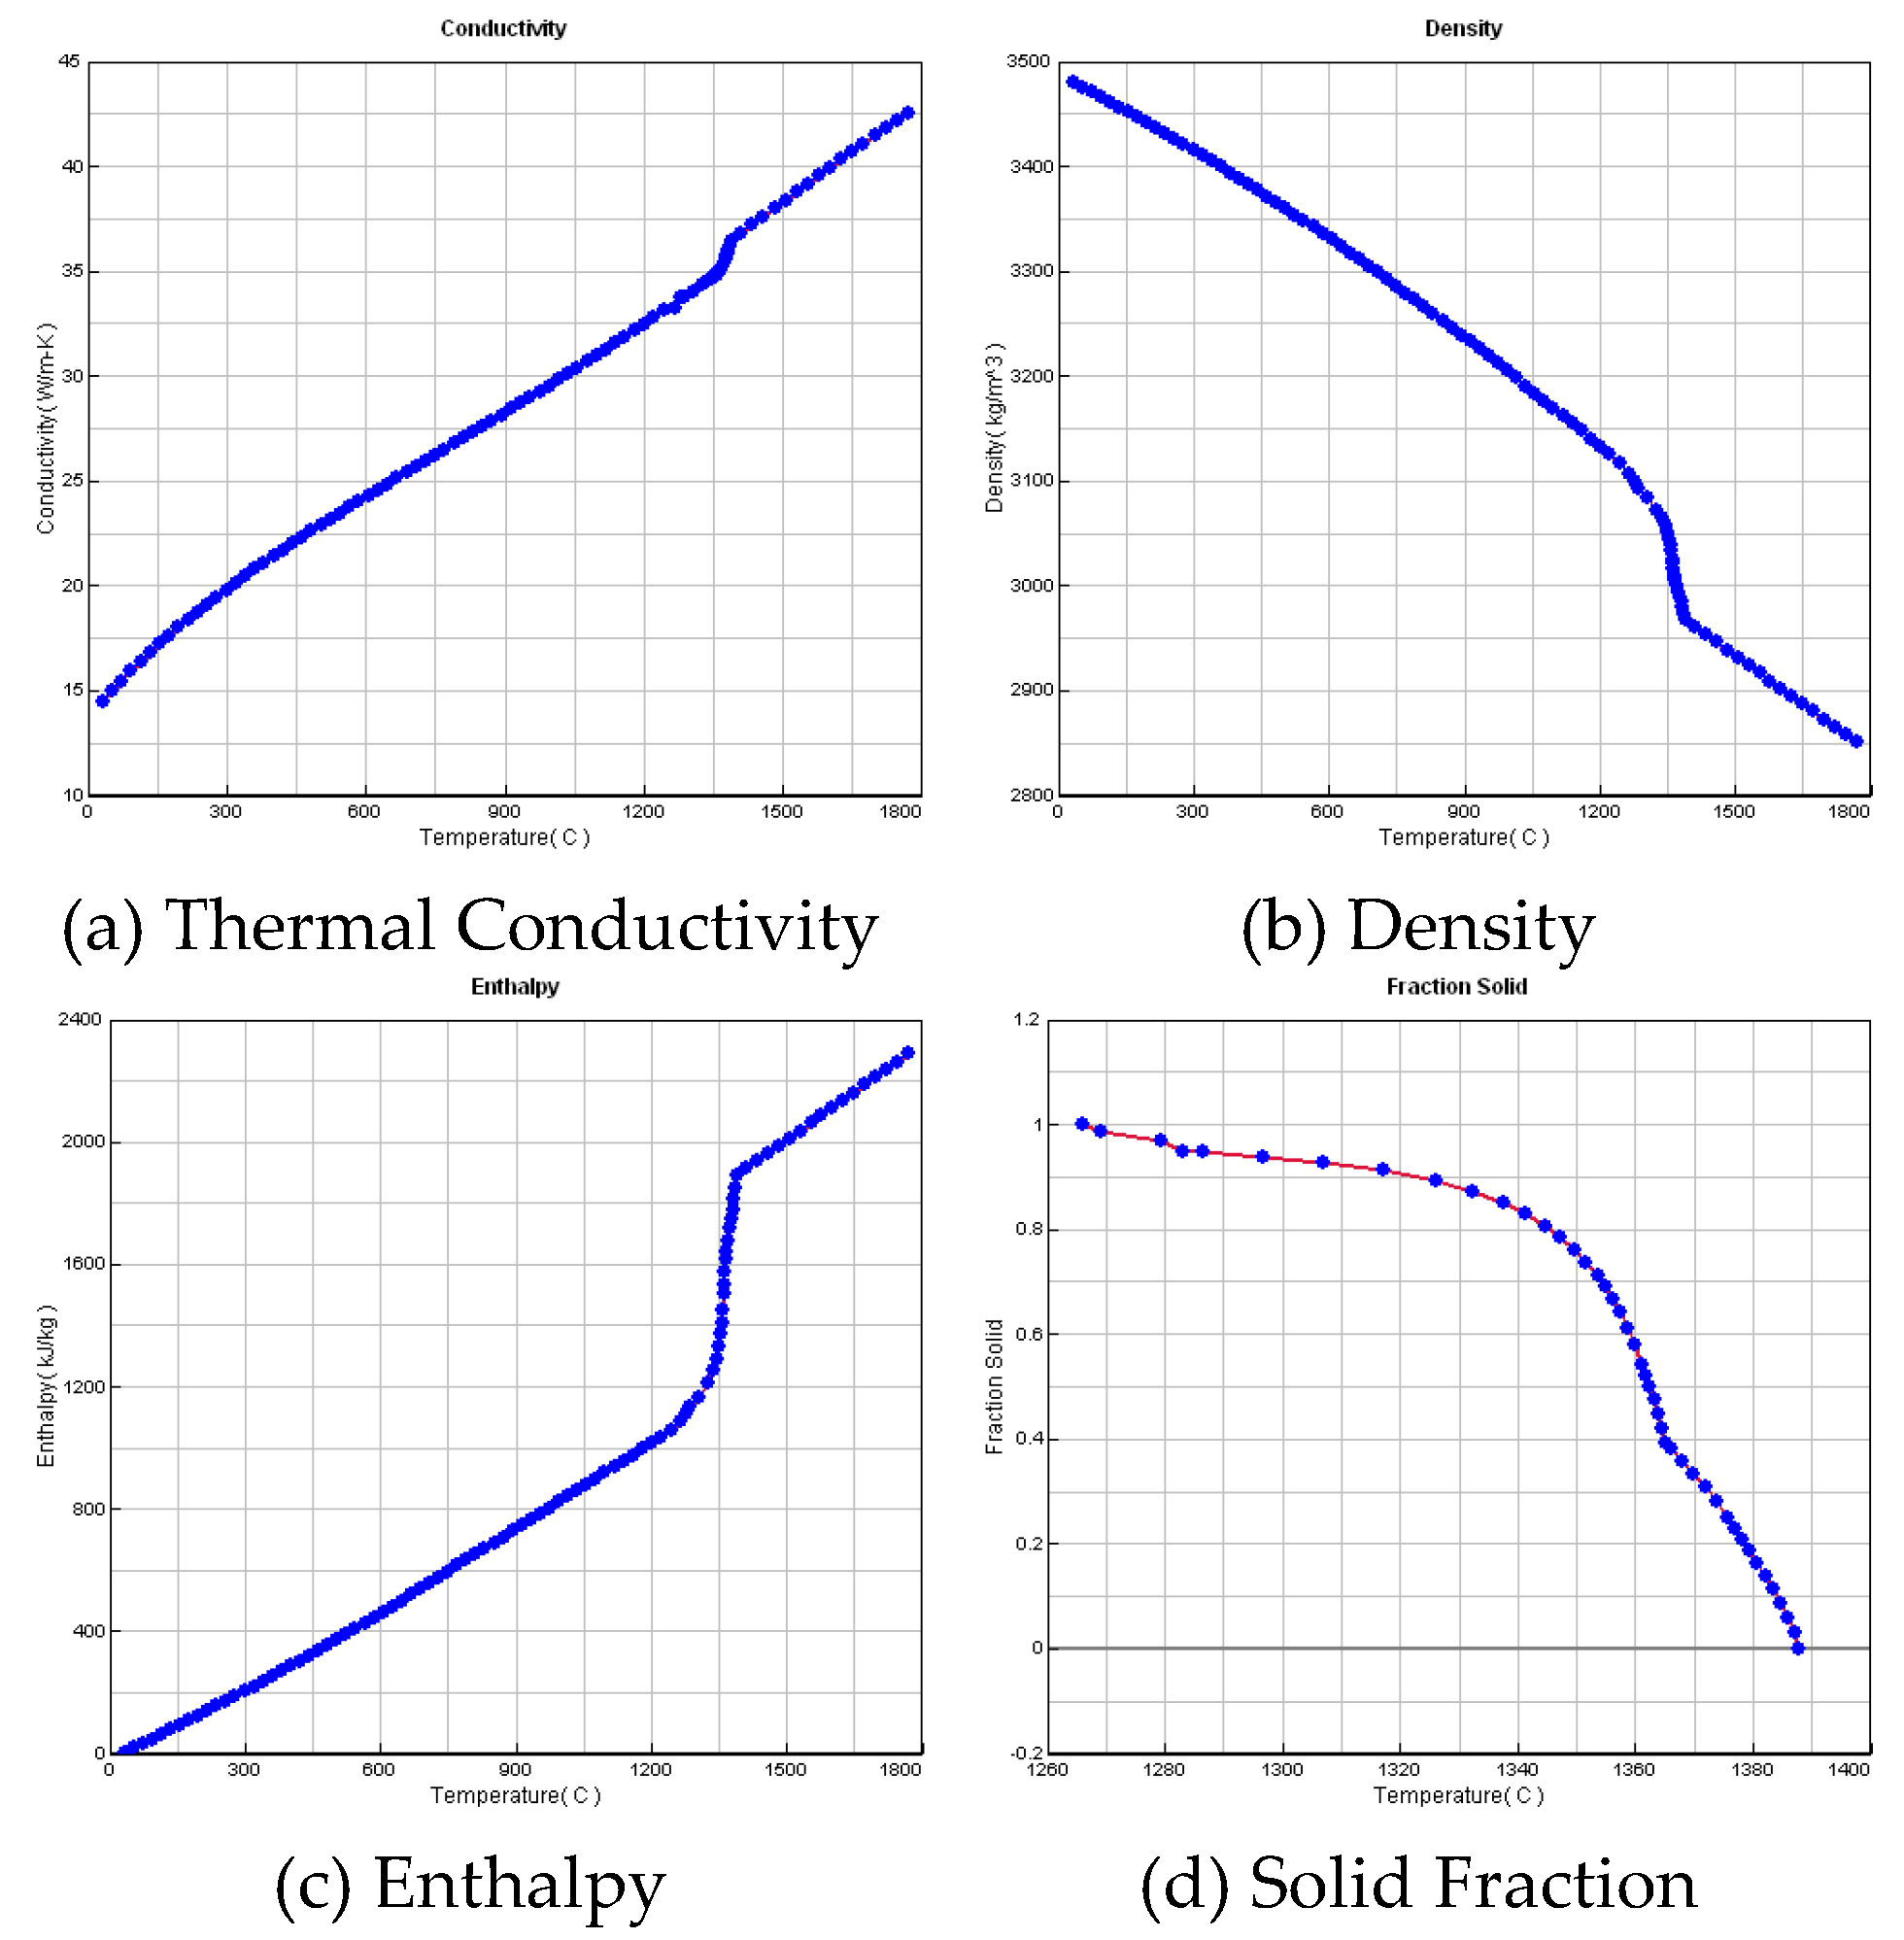
Figure 3.
Temperature Field.
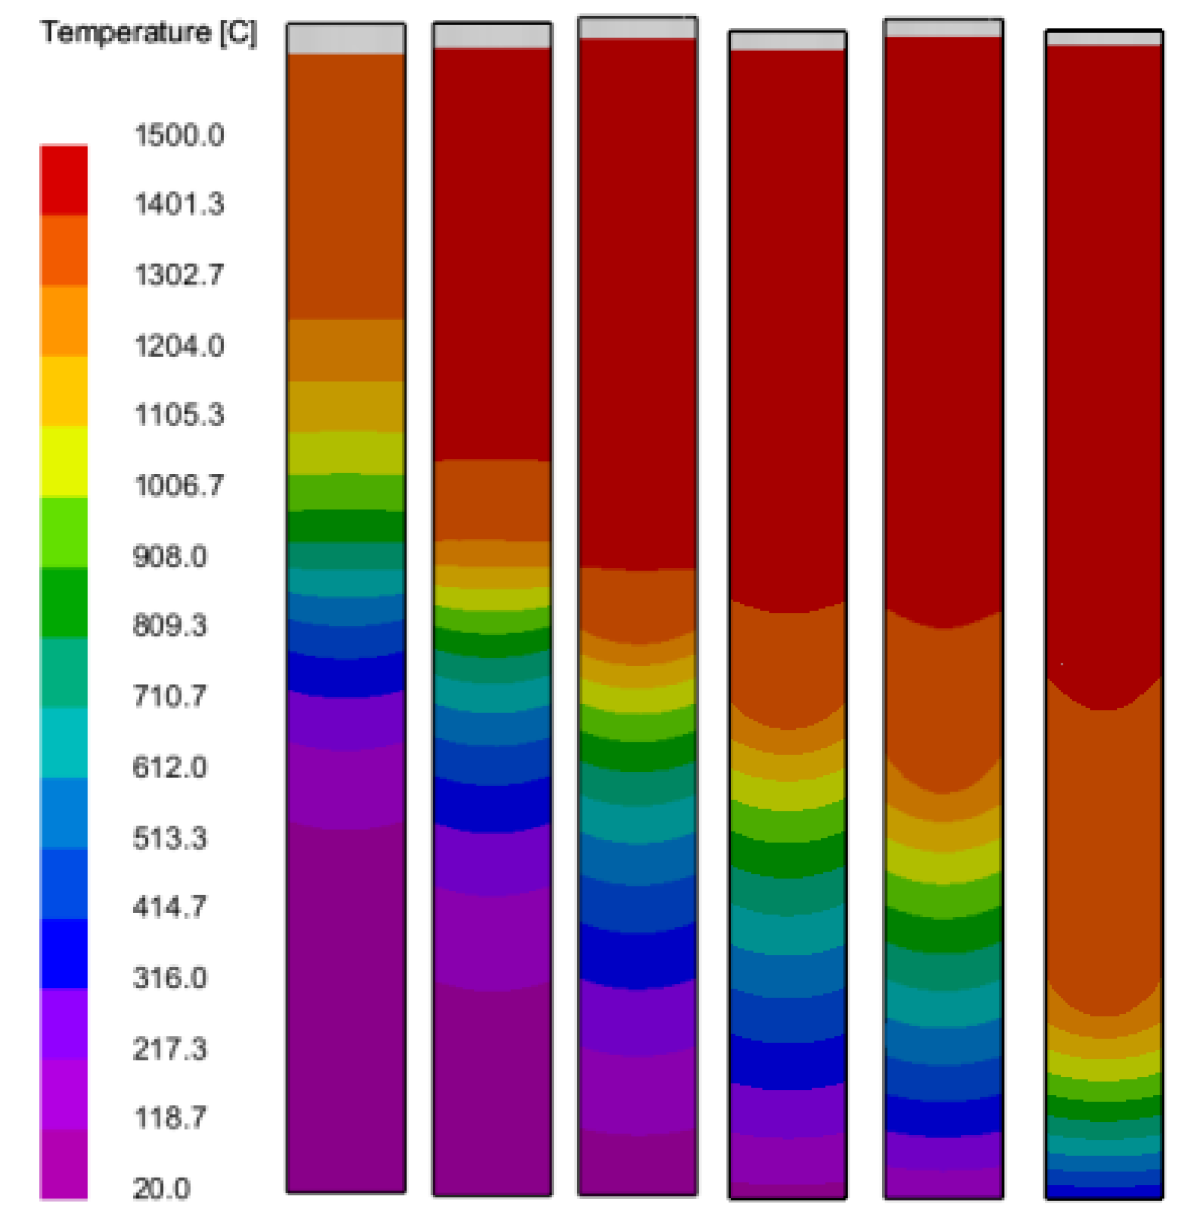
Figure 4.
Solidification Field.
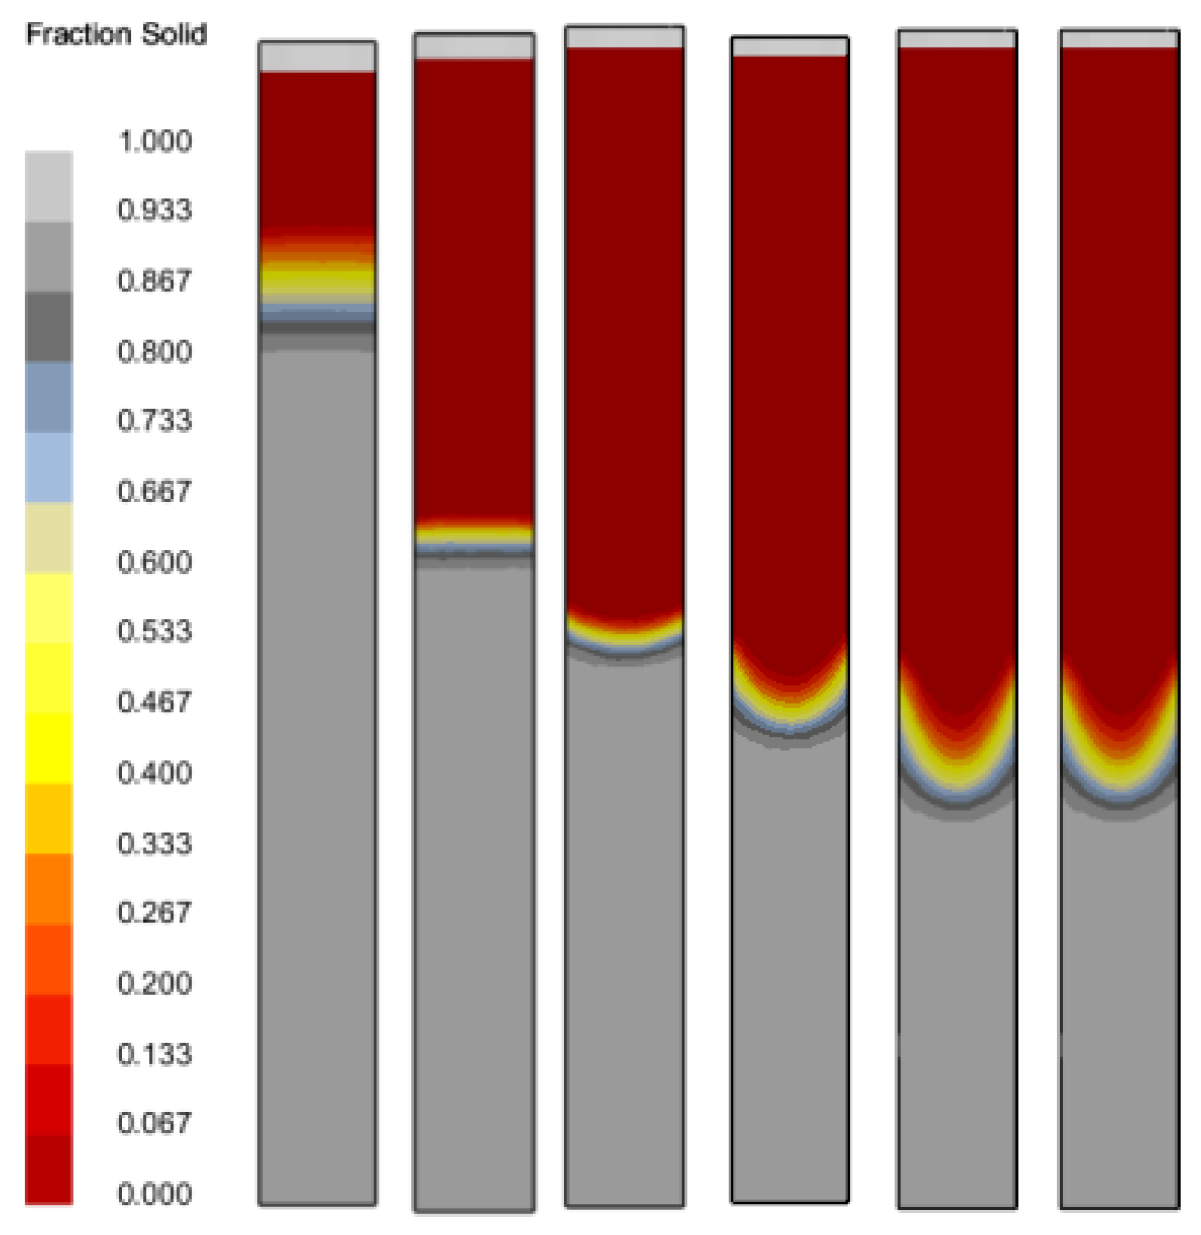
Figure 5.
Test Rod Position.
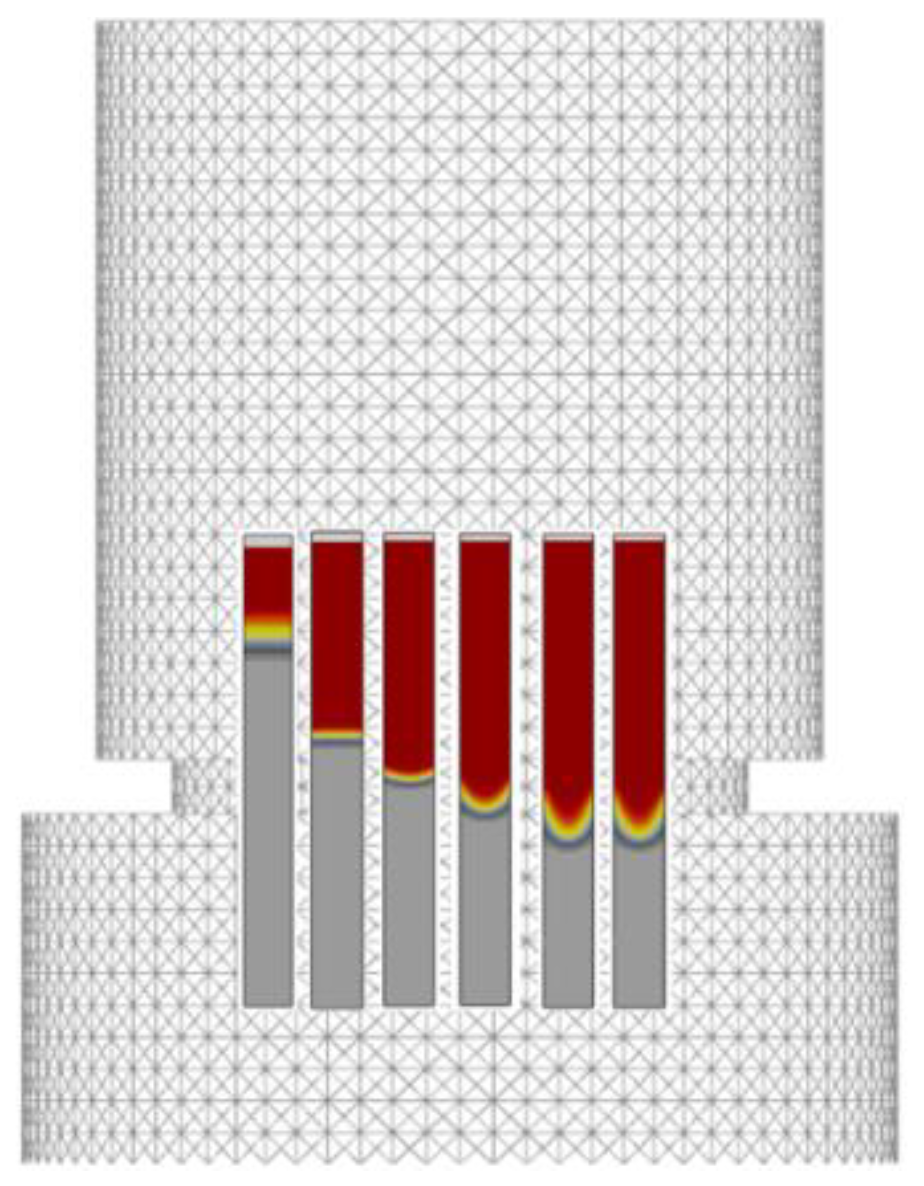
Figure 6.
Grain Distribution in the Longitudinal Section of the Test Rod at Different Drawing Speeds.
Figure 6.
Grain Distribution in the Longitudinal Section of the Test Rod at Different Drawing Speeds.
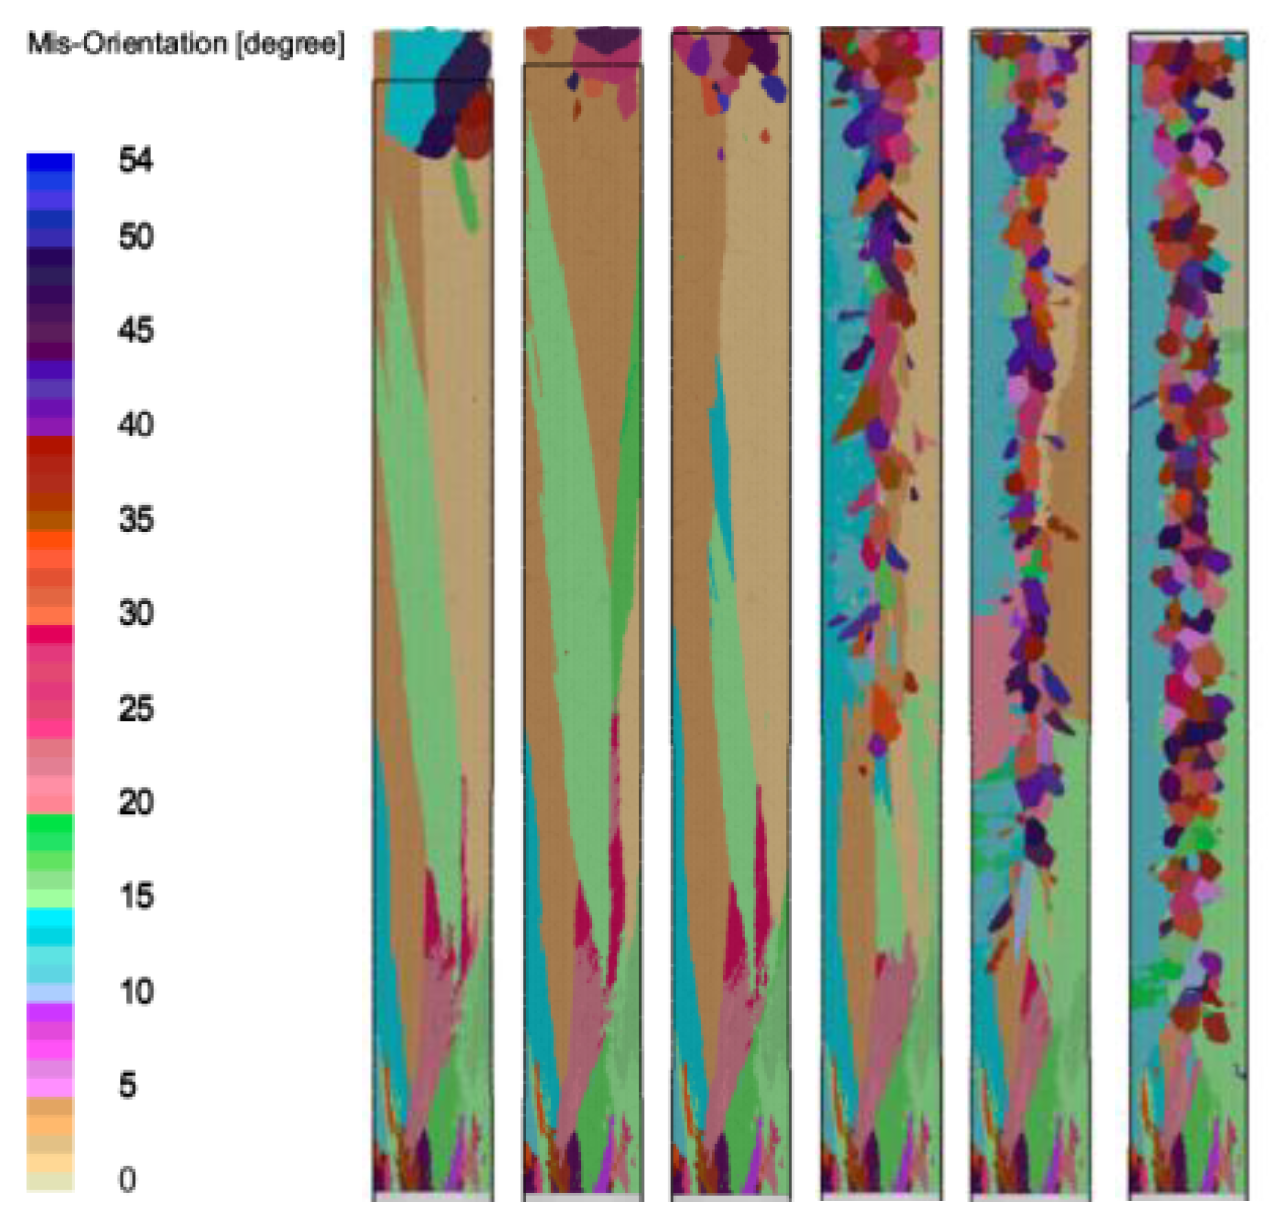
Figure 7.
Grain Distribution of the Test Rod at Different Drawing Speeds.
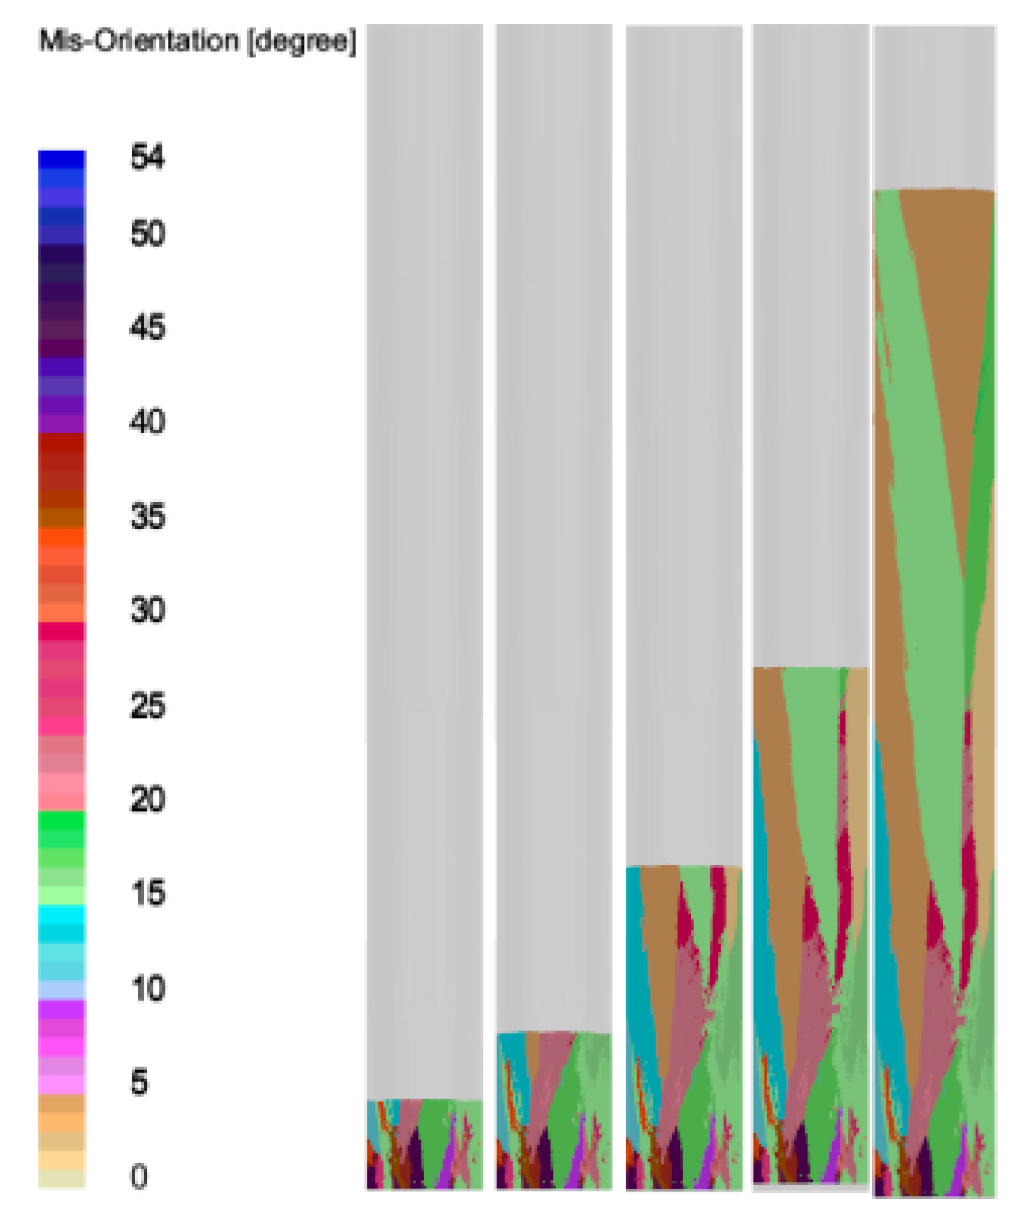
Figure 8.
Grain Distribution of the Test Rod at Different Times.
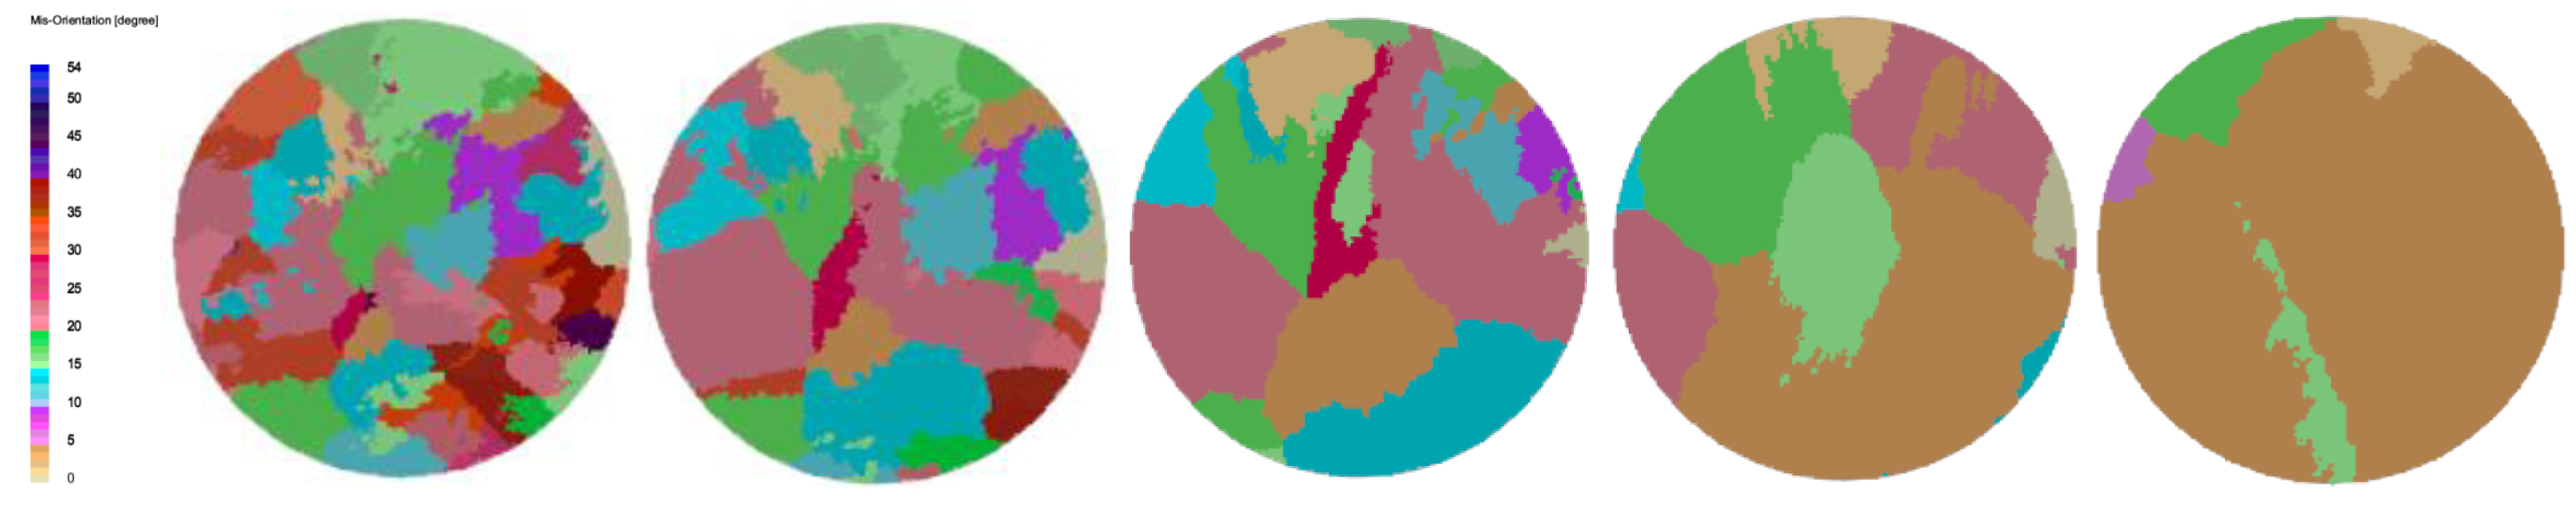
Figure 9.
Grain Distribution on the Cross-Section of the Test Rod.
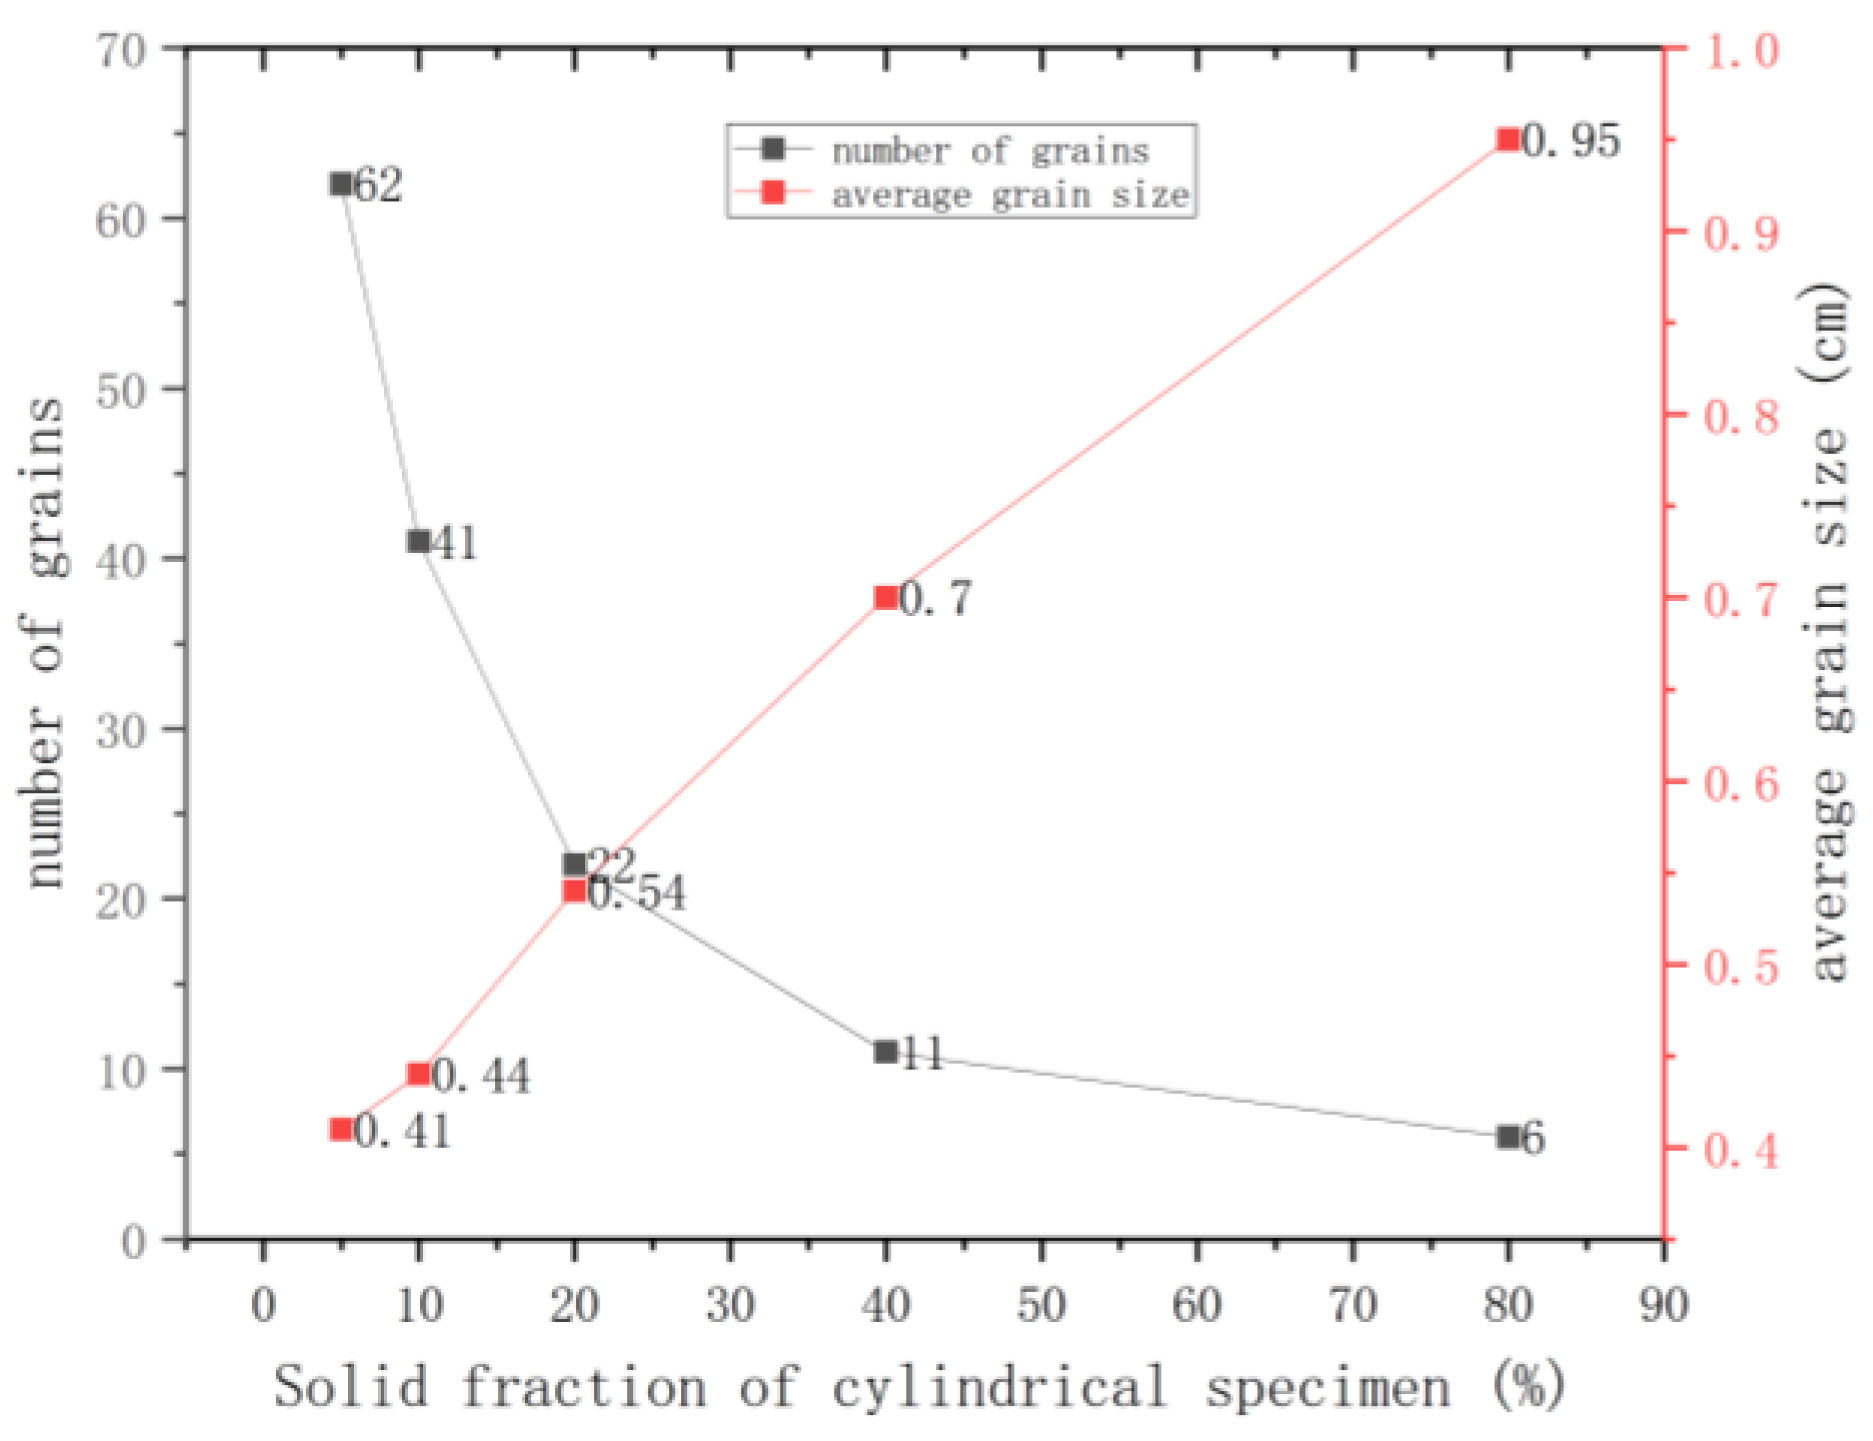
Table 2.
Grain Distribution in the Longitudinal Section of the Test Rod at Different Drawing Speeds.
Table 2.
Grain Distribution in the Longitudinal Section of the Test Rod at Different Drawing Speeds.
| Drawing rate (mm/min) | Number of grains | Average grain size (mm) | Max surface of grain (cm2) |
|---|---|---|---|
| 0.5 | 56 | 16 | 24 |
| 1 | 58 | 15.9 | 31.6 |
| 2 | 70 | 11.8 | 27.9 |
| 3 | 142 | 10 | 17.8 |
| 4 | 187 | 7 | 16.8 |
| 8 | 262 | 5 | 20 |
Disclaimer/Publisher’s Note: The statements, opinions and data contained in all publications are solely those of the individual author(s) and contributor(s) and not of MDPI and/or the editor(s). MDPI and/or the editor(s) disclaim responsibility for any injury to people or property resulting from any ideas, methods, instructions or products referred to in the content. |
© 2024 by the authors. Licensee MDPI, Basel, Switzerland. This article is an open access article distributed under the terms and conditions of the Creative Commons Attribution (CC BY) license (http://creativecommons.org/licenses/by/4.0/).
Copyright: This open access article is published under a Creative Commons CC BY 4.0 license, which permit the free download, distribution, and reuse, provided that the author and preprint are cited in any reuse.


