
Submitted:
24 March 2025
Posted:
25 March 2025
You are already at the latest version
Abstract
Advanced manufacturing focuses on intelligence, networking, and digitalization within the global decarbonization and sustainable production agreement. Additive Manufacturing (AM) has become a revolutionary technology in manufacturing, attracting considerable attention in industrial applications recently. It allows for intricate fabrication, reduces material waste, offers design flexibility, and has economic implications. Nonetheless, the residual stresses generated during the AM process and their effects on microstructural evolution and material properties continue to pose significant challenges hindering its advancement. This paper investigates the evolution of microstructures, focusing on texture and grain size as influenced by processing parameters. It examines how these factors affect the performance of multi-phase materials, specifically in terms of elastic modulus, Poisson’s ratio, and yield strength, leading to variations in residual stress through analytical simulation. The authors developed a thermal model that considers heat transfer boundaries and the geometry of the molten pool. They simulated grain size by considering the heating and cooling processes, including thermal stress, the Johnson-Mehl-Avrami-Kolmogorov (JMAK) model, and grain refinement. The texture was simulated using the Columnar-to-Equiaxed Transition (CET) model, thermal dynamics, and Bunge calculations. The self-consistency model determines the properties based on the established texture distribution. Finally, both microstructure-affected and non-affected residual stresses were modeled and compared. The results indicate that controlling process parameters and optimizing microstructures can effectively reduce residual stresses, significantly enhancing the overall performance of AM components.
Keywords:
Additive Manufacturing
; Computational Materials Science
; Analytical Simulation
; Microstructure Evolution
; Residual Stress
1. Introduction
Residual stress is the internal stress within a material without external forces, often resulting from non-uniform plastic deformation, phase transformations, or thermal gradients. It is a crucial topic in materials science and engineering, especially in manufacturing processes like welding, casting, and AM. Excessive residual stresses can cause part distortion, cracking, or premature failure, jeopardizing component reliability and service life. Therefore, understanding and managing residual stresses is vital for optimizing manufacturing processes and improving material performance. In recent years, the rise of AM has led to unprecedented attention on the study of residual stresses. AM constructs intricate components layer by layer, and the inherent intense thermal gradients and rapid cooling rates of this process result in residual stresses, which significantly affect material performance. Jamison L. et al. [1] and M. Megahed et al. [2] provided an overview of residual stresses in metal AM.
Various methods have been developed to tackle the challenges. Experimental measurement techniques such as X-ray diffraction, neutron diffraction, and ultrasonic methods have significantly improved. These techniques provide powerful tools for the precise quantification of residual stresses. Additionally, numerical simulation methods, including finite element analysis (FEA), are essential for predicting residual stress distributions and optimizing process parameters. The integration of data-driven approaches and machine learning techniques has recently created new opportunities for analytical modeling and predicting residual stresses, further enhancing the field.
There are two main types of experimental procedures used to measure residual stress in components: destructive methods and nondestructive methods. Nondestructive methods for analyzing materials include X-ray diffraction (XRD) [3], neutron diffraction, ultrasonics [4], and electrical resistivity [5]. Additionally, techniques such as magnetic behavior analysis [6] and piezo-spectroscopy [7] are considered nondestructive, though they are specific to certain materials and geometries. On the other hand, destructive methods consist of techniques such as hole drilling, sectioning, crack compliance, digital image correlation [8], and electronic speckle pattern interferometry. These methods create a free surface in part and relate the resulting deformation to residual stress [9][10].
In addition to experimental investigations, researchers frequently rely on numerical modeling to predict the buildup of residual stress during the AM process [11][12]. While experimental measurements of stress within the part are essential for understanding this phenomenon, measuring the entire part experimentally can be both challenging and costly. Many researchers utilize the finite element method (FEM) for their simulations; however, simulating the entire process in a reasonable timeframe is often not feasible. As a result, several simplifications must be made in the modeling process. Furthermore, using inverse analysis to optimize the process parameters for desired part performance is typically not achievable with FEM within a practical time frame.
Analytical models validated through physical experiments offer a valuable way to understand, control, and optimize process parameters through in-situ analysis. This approach is time-efficient, conserves computational resources, and lowers facility costs compared to other methods. Additionally, it aligns with the Industrial 4.0 movement. Currently, the analytical modeling in AM field mainly focuses on the processing-microstructure-property relationship. Some fundamental models have been established, such as the single-phase texture [13], multi-phase texture [14][15], grain size [16], defects [17]. As residual stress is a critical research topic, the impact of microstructure evolution on the analytical modeling of residual stress in additive manufacturing still requires further investigation.
The first step of this study involved creating a thermal profile based on a moving point heat source, considering the boundary conditions during laser powder bed fusion (LPBF). Using the thermal distribution, we simulated microstructure characteristics, such as texture and grain size. The elastic modulus and Poisson’s ratio were calculated using a self-consistency model derived from the computed texture. The yield strength was determined using the Hall-Petch equation, which incorporates the modeled grain size. Finally, we compared the modified and non-modified residual stresses under various processing parameters by calculating residual stress based on the modeled material properties.
The Johnson-Cook flow stress model [18] predicts the yield surface by adjusting the yield strength parameter using the Hall-Petch equation, which considers grain size. It also considers the effects of cyclic heating, cooling, and yielding, which contribute to residual stress buildup due to the metal’s incremental plasticity and kinematic hardening behavior. This involves the principle of volume invariance in plastic deformation and the conditions of equilibrium and compatibility. Several modifications have been proposed for the Johnson-Cook model to address temperature-dependent flow softening and the influence of grain growth on yield strength. These modifications utilize the Hall-Petch equation [19][20], with parameters obtained from the literature [21]. In this study, results from the consideration of microstructure evolution during the process proved that this change does affect the modeling of residual stress via varying material properties. At some point in the parts modeled, it could be significant. This phenomenon, in turn, supports the necessity of the microstructure-affected analytical model.
2. Methodology
2.1. Thermal profile
The multi-phase texture analytical model, developed by W. Huang et al. [14], should be used to establish the thermal profile. This model accounts for heat losses due to conduction, convection, and radiation within a three-dimensional heat transfer boundary condition.
In this context, the following parameters are defined:
- V: laser scanning velocity - P: laser power - K: thermal conductivity - c: heat capacity - : laser absorption coefficient - : thermal diffusivity - : density - R: distance between the heat source and the analysis location - : thermal conductivity of the powder - h: heat convection coefficient - : emissivity - : Stefan-Boltzmann constant
Additionally, T represents the simulated thermal profile, and A denotes the area of each heat sink on the surface of the melt pool.s the area of each heat sink on the surface of the melt pool.
2.2. Texture
The Bunge Convention defines the three Euler angles for the single-phase body-centered cubic (BCC) structure of Ti-6Al-4V, indicating the crystallographic orientation of each grain and facilitating transformations from the laboratory reference frame to the crystallographic lattice frame. The crystallographic orientation transformation (CET) model, characterized by a specific ratio in the space [22], was used to analyze the multi-phase texture. Columnar grains emerged from the seed crystal during solidification, while the substrate consisted of polycrystalline powder with random orientations. We maximize the cosine value of the angle between two vectors to assess the direction of dendrite growth at a location.
2.3. Grain size
Grain size can be analytically modeled alongside the thermal stress obtained and dynamic recrystallization grain growth during heating and grain refinement during cooling, as demonstrated in previous work [16].
2.4. Microstructure-affected materials properties
Anisotropy has been a significant problem for additively manufactured parts when modeling their material properties. The self-consistent crystal plasticity model effectively determines the effective elastic modulus of a two-phase composite, yielding more precise intermediate results compared to traditional upper and lower-bound models. When expressed in matrix form, the generalized Hooke’s law relates strains to stresses, establishing a connection between strain and stress for linear elastic materials.
where the stiffness constants, denoted by the 36 s, form the stiffness matrix.
The elastic constants for the beta-Ti-6Al-4V [23] and alpha-Ti-6Al-4V [24][25] unit cells are given by the following equations, respectively, in terms of stiffness (C).
The following equations calculate the elastic modulus and Poisson’s ratio along the three directions.
The notation represents the elastic modulus in the x, y, and z directions. The term refers to the effective elastic modulus in each respective direction. Additionally, Poisson’s ratio, denoted as , describes the relationship between the applied strain and the transverse strain that occurs during uniaxial tension.
Regarding the properties affected by grain size, the primary equation that describes the relationship between grain size and yield strength is the Hall-Petch equation, as it requires the fewest parameters.
The Hall-Petch equation is expressed as follows:
In this equation, denotes the yield strength, while and k are constants influenced by the material’s chemistry and microstructure.
2.5. Residual Stress
The fundamental residual stress analytical model derived from the thermal profile was established and could be referred to in the past work [26] though without much exploration of the influence of properties on its variation and more investigation. Due to the process of LPBF, high strain, and strain rates are generated in the alloy parts manufactured, so the Johnson-Cook flow stress model is used to address the yield strength threshold. Cases of elastic and elastic-plastic regions are all regarded in the algorithms. Previously, the properties were empirical temperature-dependent; however, in this work, they are updated with the new materials properties models to make them more accurate for further investigation.
3. Results and discussion
The first step is to establish the thermal profile, which serves as the foundation for the process. The model’s input, which includes the material properties of Ti-6Al-4V, processing parameters, and part geometry, is detailed and presented in Table 1. The prior work has validated the thermal model, texture model [15], and grain size model [16].

Table 1.
Materials Properties and Values of Ti-6Al-4V [15] and Part Geometry Settings
Table 1.
Materials Properties and Values of Ti-6Al-4V [15] and Part Geometry Settings
| Model Inputs | Value | Unit |
|---|---|---|
| Surrounding Temperature () | 20 | ∘ C |
| Melting Temperature () | 1655 | ∘ C |
| Density () | 4428 | |
| Modulus of Elasticity (E) | 60.78 | |
| Poission’s Ratio () | 0.34 | 1 |
| Bulk Thermal Conductivity () | 5-35 | |
| Powder Thermal Conductivity () | 0.21 | |
| Heat Capacity (C) | 500-800 | |
| Heat Convection Coefficient (h) | 24 | |
| Radiation Emissivity () | 0.9 | 1 |
| Stefan-Boltzmann Constant () | ||
| Columnar/Equiaxed Transition Coefficient (nn) | 3.2 | 1 |
| Columnar/Equiaxed Transition Coefficient (kk) | 1 | |
| Laser Absorption Value | 0.818 | 1 |
| Part Length (L) | 4 | |
| Part Width (W) | 1 | |
| Part Height (H) | 0.5 | |
| Number of Heat Sinks (S) | 9 | 1 |
| Layer Thickness | 50 | m |
| Hatching Space | 50 | m |
| Hall-Petch Material Constant (k) | 230 | |
| Hall-Petch Material Constant () | 737 |
Then, the processing settings are modified to align with the values used in the earlier study by Cho et al. [27]. The laser power is set at 375 W, the layer thickness is 60 µm, the hatch spacing is 120 µm, and the scan speed is 1020 mm/s. The experimental setup includes five IDs that represent different layers and rows, as detailed in Table 2.
Table 2.
Number of Layers and Rows in Each Experimental Settings
| ID | Layers | Rows |
|---|---|---|
| 1 | 1 | 1 |
| 2 | 2 | 2 |
| 3 | 3 | 3 |
| 4 | 4 | 4 |
| 5 | 5 | 5 |
The elastic modulus and Poisson’s ratio have been calculated and are presented in Table 3 and Fig. 1. As is shown in Table 3 and Fig. 1, the values of elastic modulus and Poission’s ratio indeed vary during processing, so in this sense, it is necessary to update the values for residual stress analytical models.
The residual stresses impacted by microstructure are compared and displayed in Fig. 2 to Fig. 6 by updating the yield strength, elastic modulus, and Poisson’s ratio for every processing setting.
Table 3.
Simulated Results of Elastic Modulus and Poission’s Ratio
| (GPa) | (GPa) | (GPa) | (GPa) | |||||||
|---|---|---|---|---|---|---|---|---|---|---|
| 1 | 106.580 | 114.330 | 108.660 | 109.857 | 0.464 | 0.497 | 0.195 | 0.199 | 0.209 | 0.199 |
| 2 | 106.380 | 106.700 | 119.300 | 110.793 | 0.463 | 0.464 | 0.195 | 0.218 | 0.195 | 0.218 |
| 3 | 105.020 | 106.050 | 129.340 | 113.470 | 0.457 | 0.461 | 0.192 | 0.237 | 0.194 | 0.237 |
| 4 | 104.880 | 104.890 | 141.160 | 116.977 | 0.456 | 0.456 | 0.192 | 0.258 | 0.192 | 0.258 |
| 5 | 104.870 | 106.210 | 130.030 | 113.703 | 0.456 | 0.462 | 0.192 | 0.238 | 0.194 | 0.238 |
Figure 1.
Calculated Elastic Modulus and Poission’s Ratio values. Blue bars represent the values of effective elastic modulus, and orange lines represent effective Poission’s ratios.
Figure 1.
Calculated Elastic Modulus and Poission’s Ratio values. Blue bars represent the values of effective elastic modulus, and orange lines represent effective Poission’s ratios.
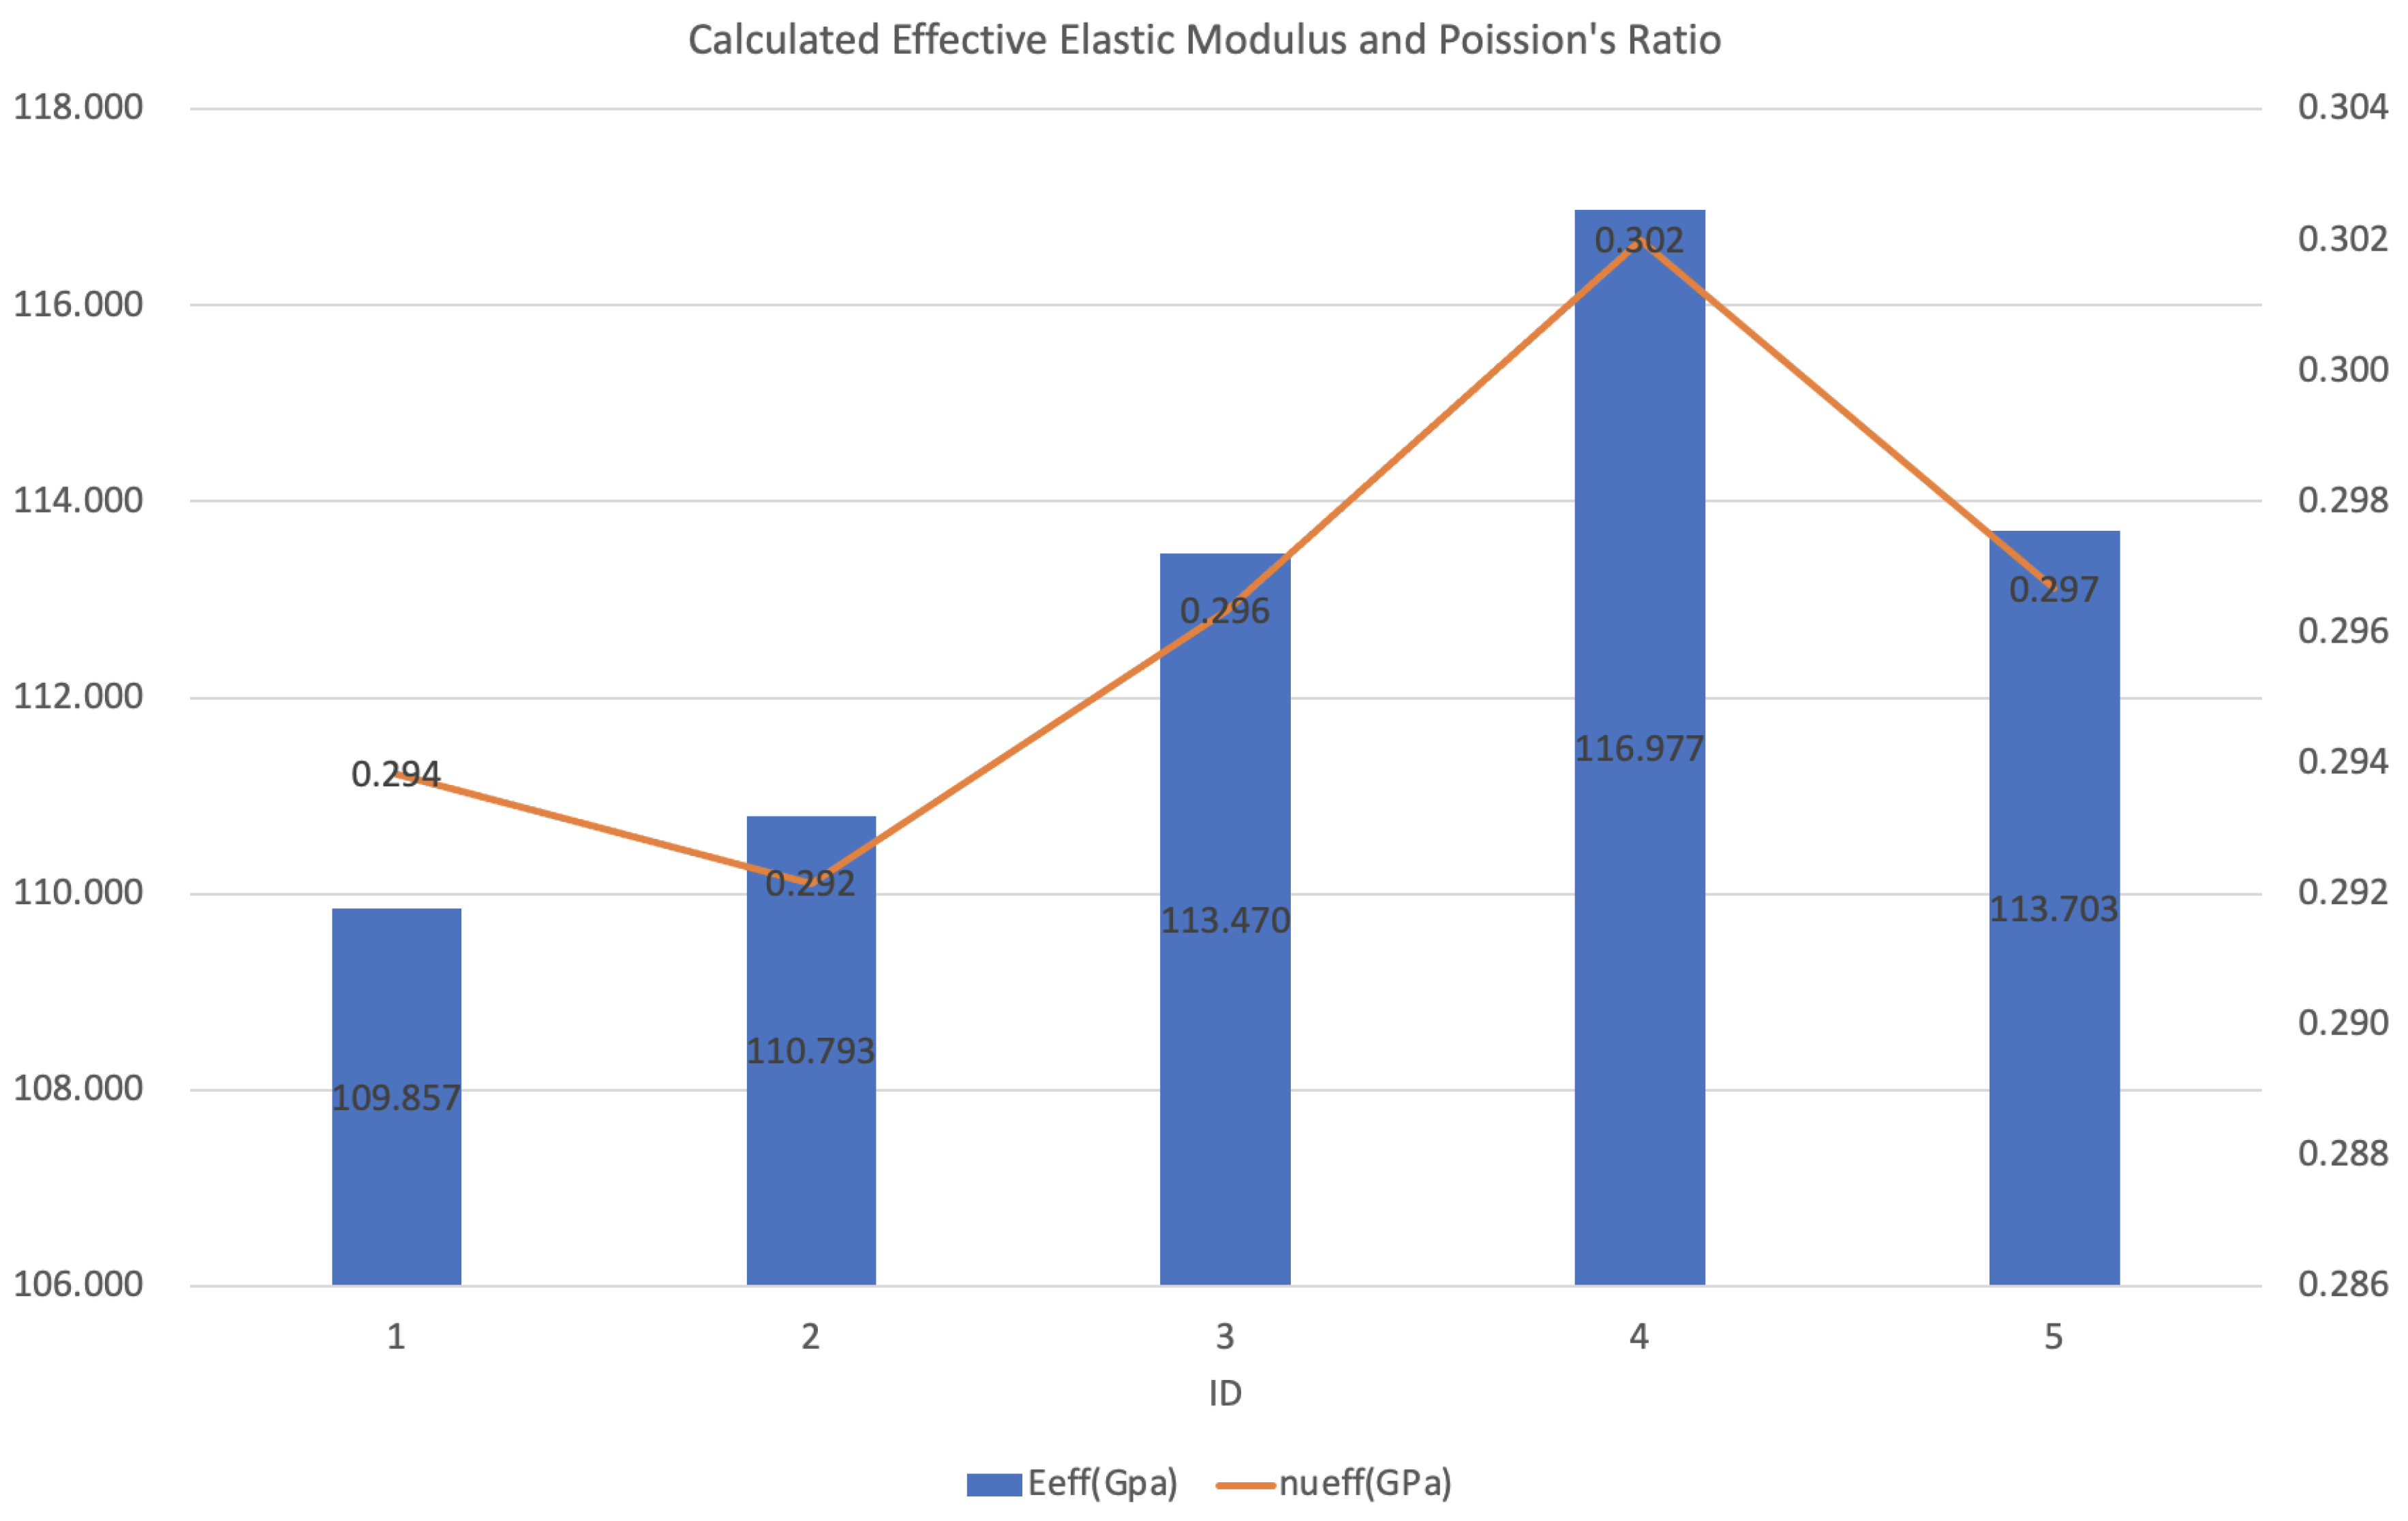
Residual stress varies significantly across different scenarios due to changes in microstructure-affected properties, especially compared to typical models that do not account for microstructural changes. This indicates that the evolving microstructure during the AM process influences material properties such as elastic modulus and yield strength. These changes in material properties will also affect the modeling of residual stress and other performance characteristics.
Figure 2.
Calculated Residual Stress Profile at y = 0.5mm in a Single-track Scan: normal vs. microstructure-affected. (ID: 1)
Figure 2.
Calculated Residual Stress Profile at y = 0.5mm in a Single-track Scan: normal vs. microstructure-affected. (ID: 1)
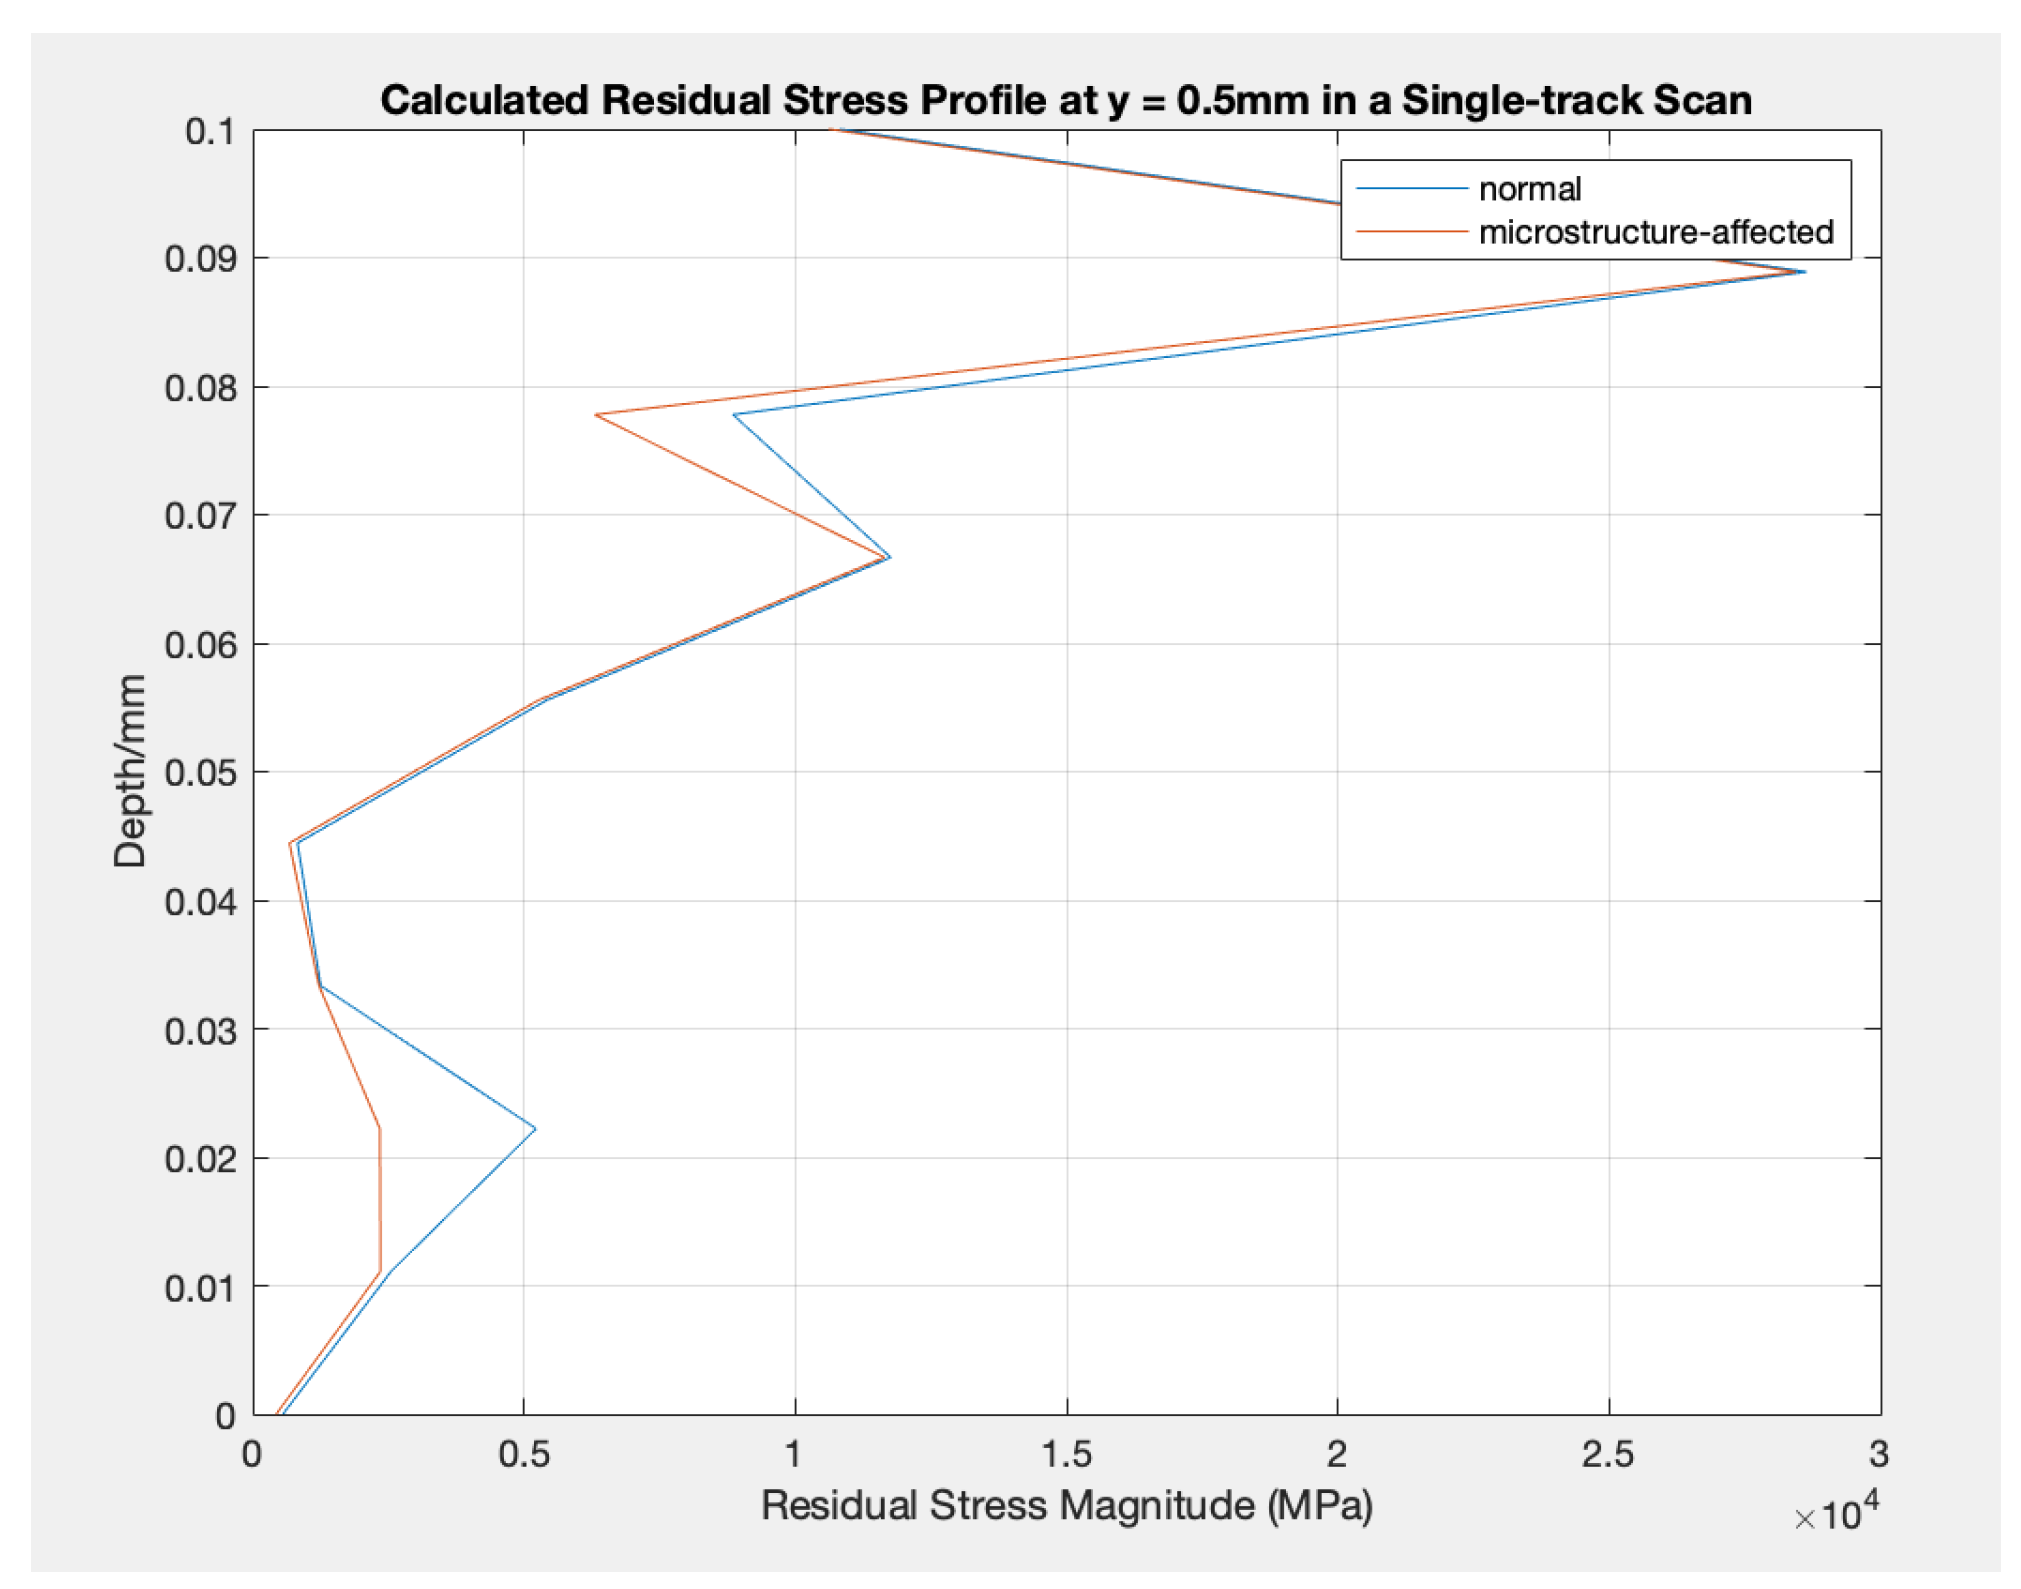
Figure 3.
Calculated Residual Stress Profile at y = 0.5mm in a Single-track Scan: normal vs. microstructure-affected. (ID: 2)
Figure 3.
Calculated Residual Stress Profile at y = 0.5mm in a Single-track Scan: normal vs. microstructure-affected. (ID: 2)
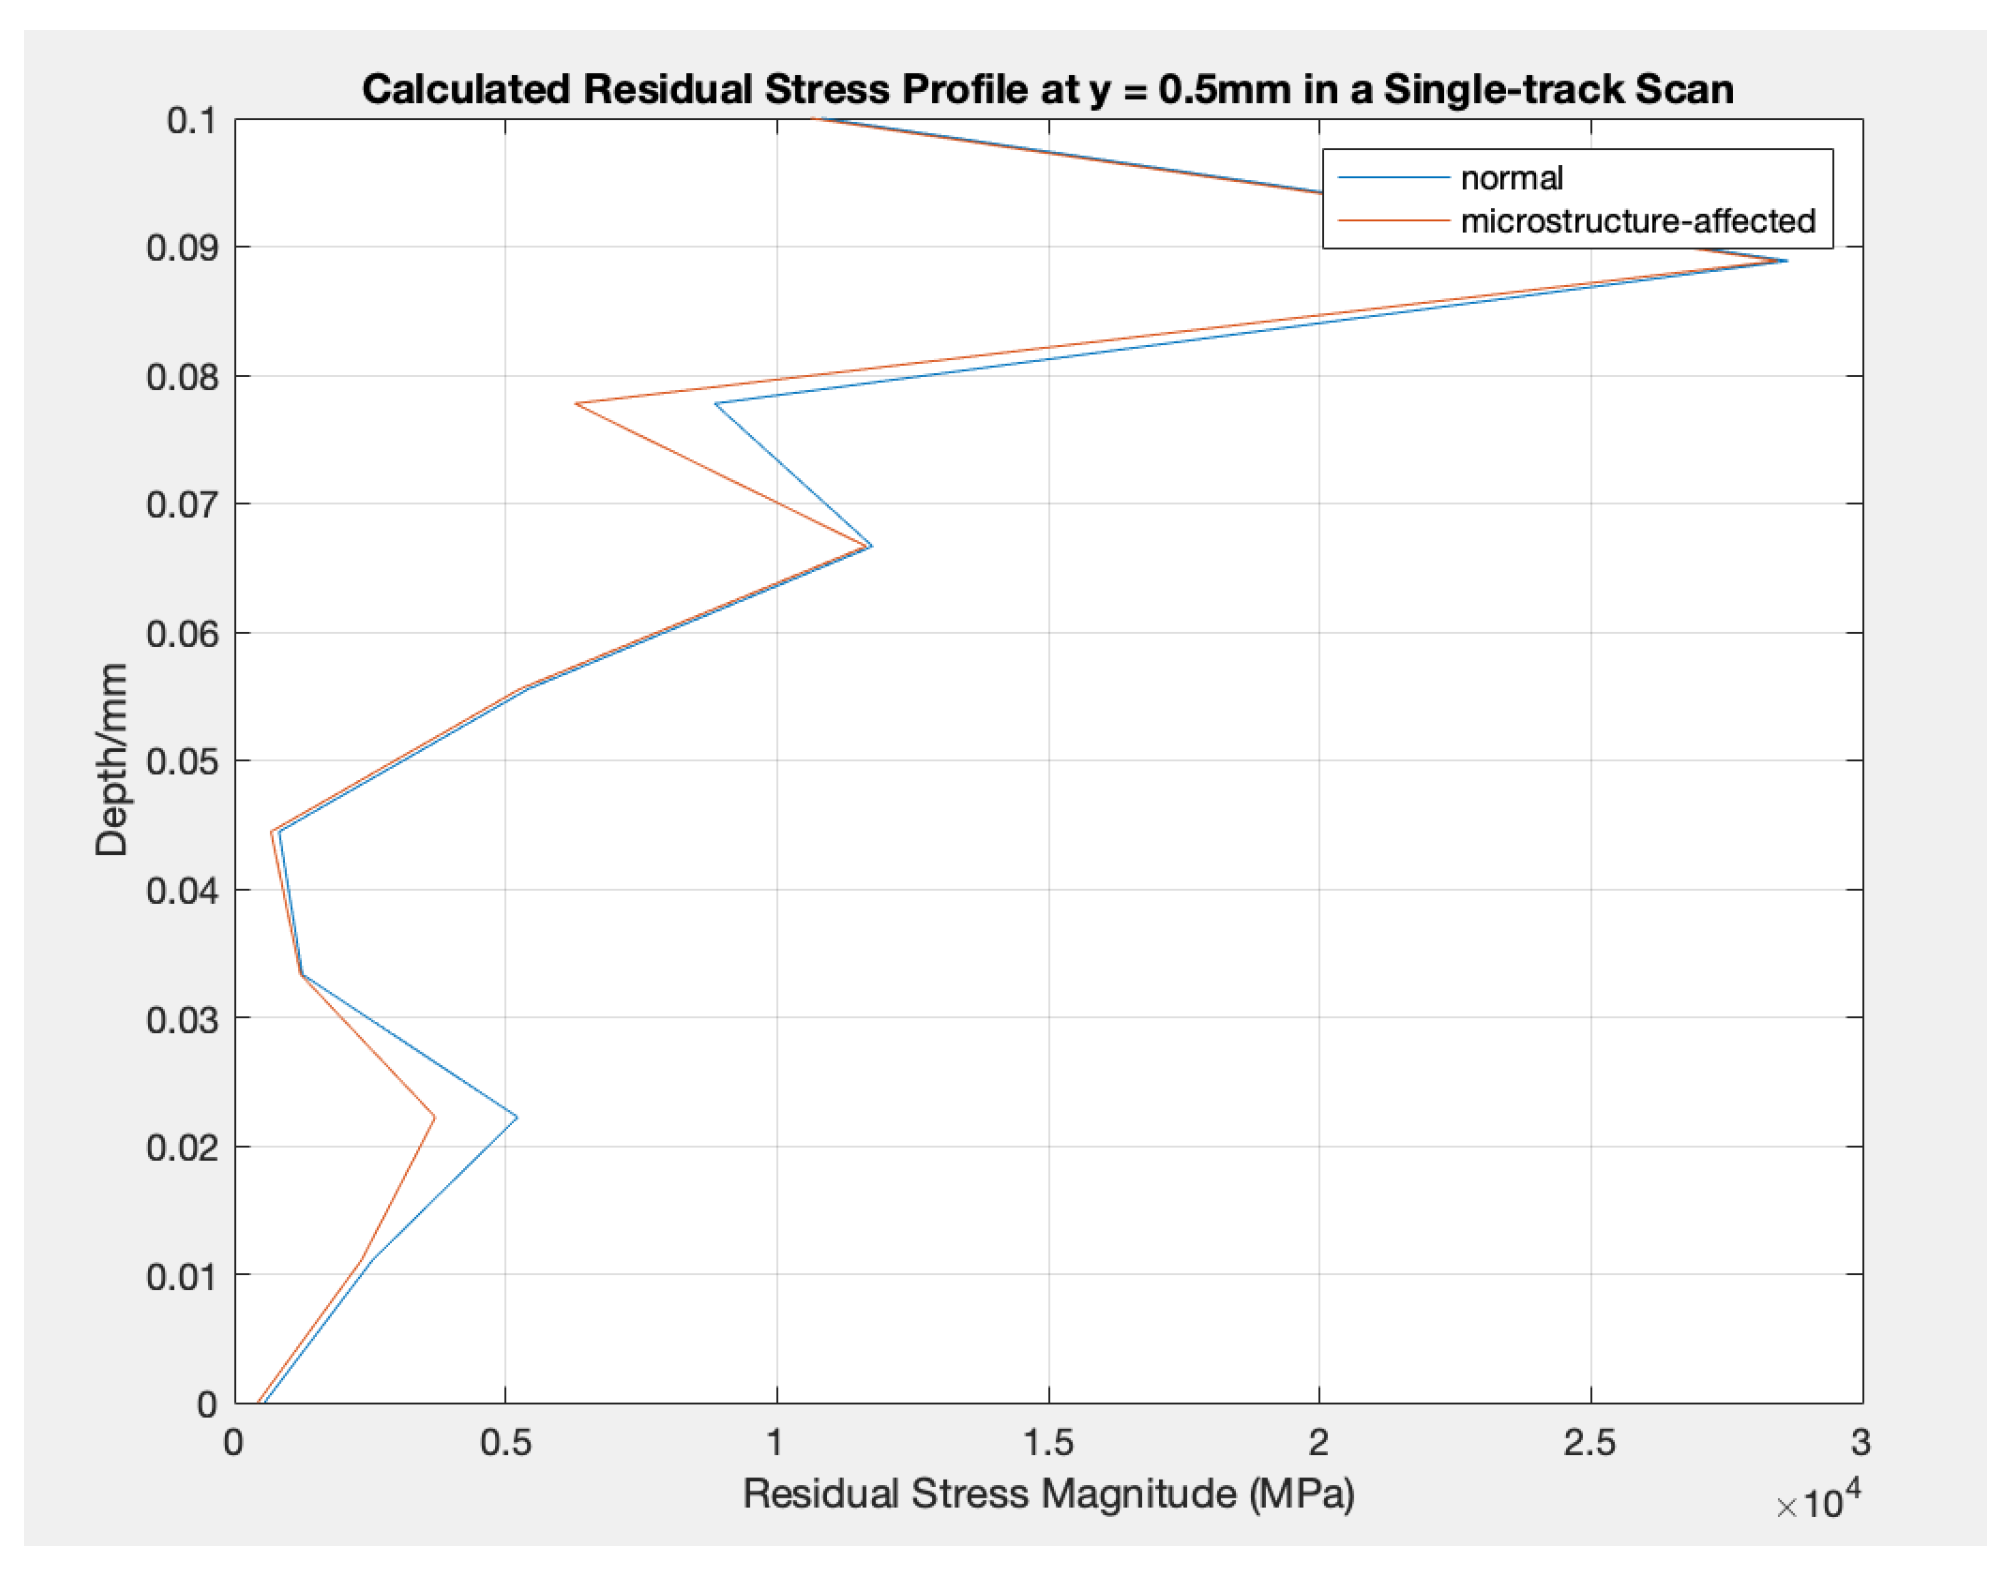
Figure 4.
Calculated Residual Stress Profile at y = 0.5mm in a Single-track Scan: normal vs. microstructure-affected. (ID: 3)
Figure 4.
Calculated Residual Stress Profile at y = 0.5mm in a Single-track Scan: normal vs. microstructure-affected. (ID: 3)
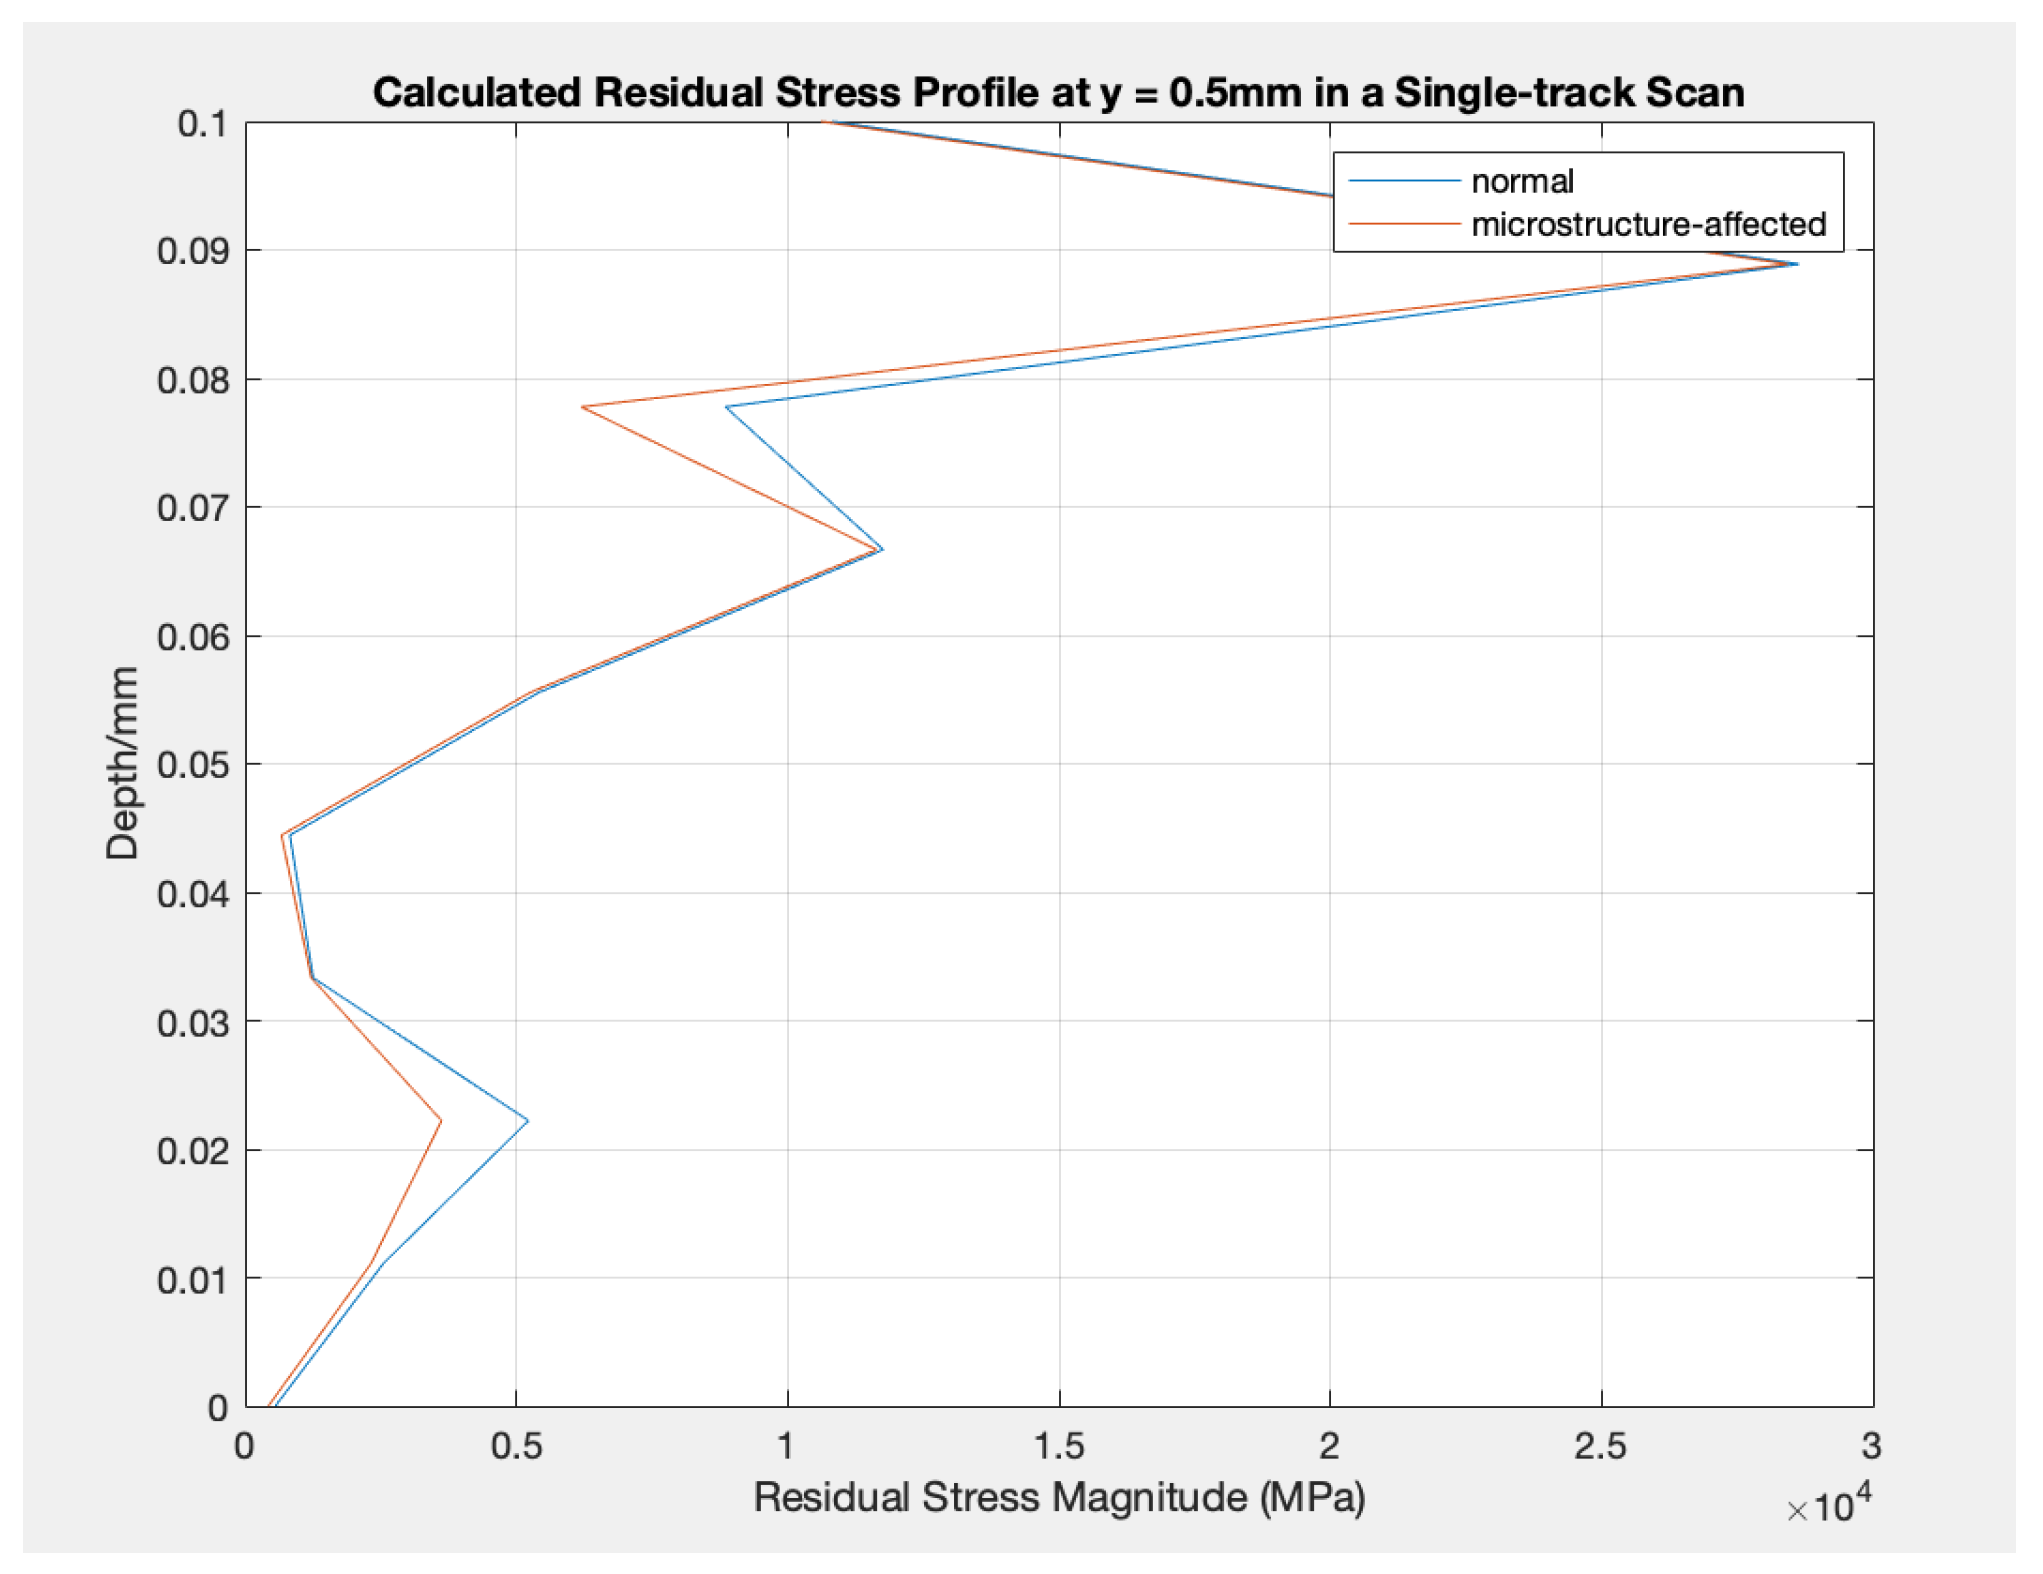
Figure 5.
Calculated Residual Stress Profile at y = 0.5mm in a Single-track Scan: normal vs. microstructure-affected. (ID: 4)
Figure 5.
Calculated Residual Stress Profile at y = 0.5mm in a Single-track Scan: normal vs. microstructure-affected. (ID: 4)
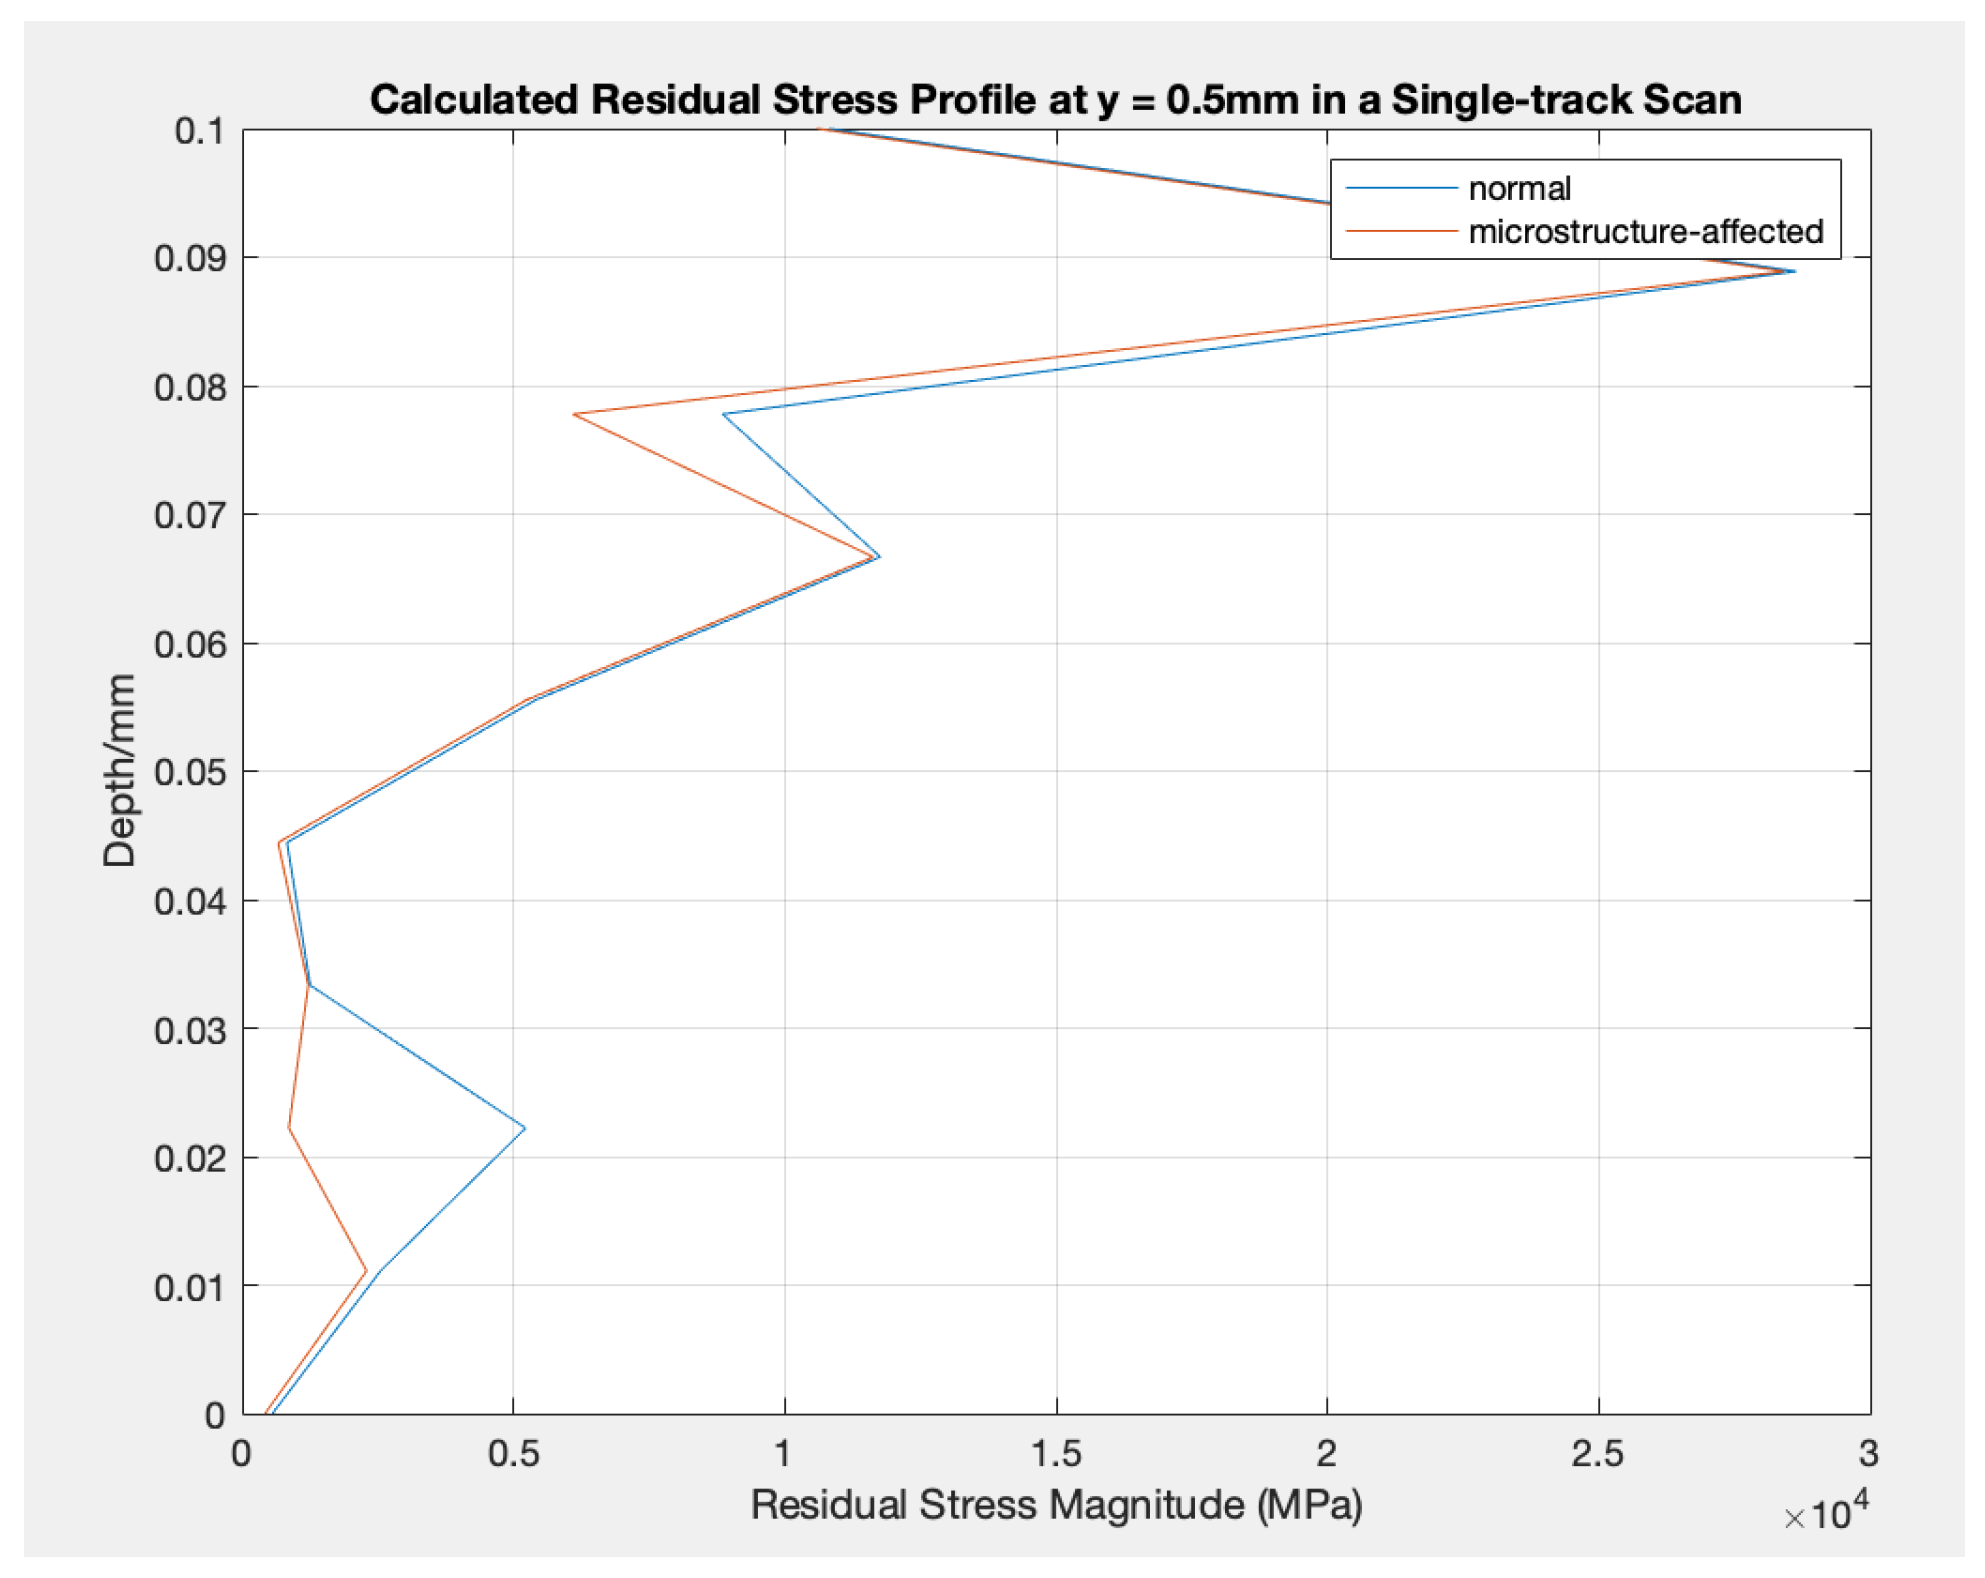
Figure 6.
Calculated Residual Stress Profile at y = 0.5mm in a Single-track Scan: normal vs. microstructure-affected. (ID: 5)
Figure 6.
Calculated Residual Stress Profile at y = 0.5mm in a Single-track Scan: normal vs. microstructure-affected. (ID: 5)
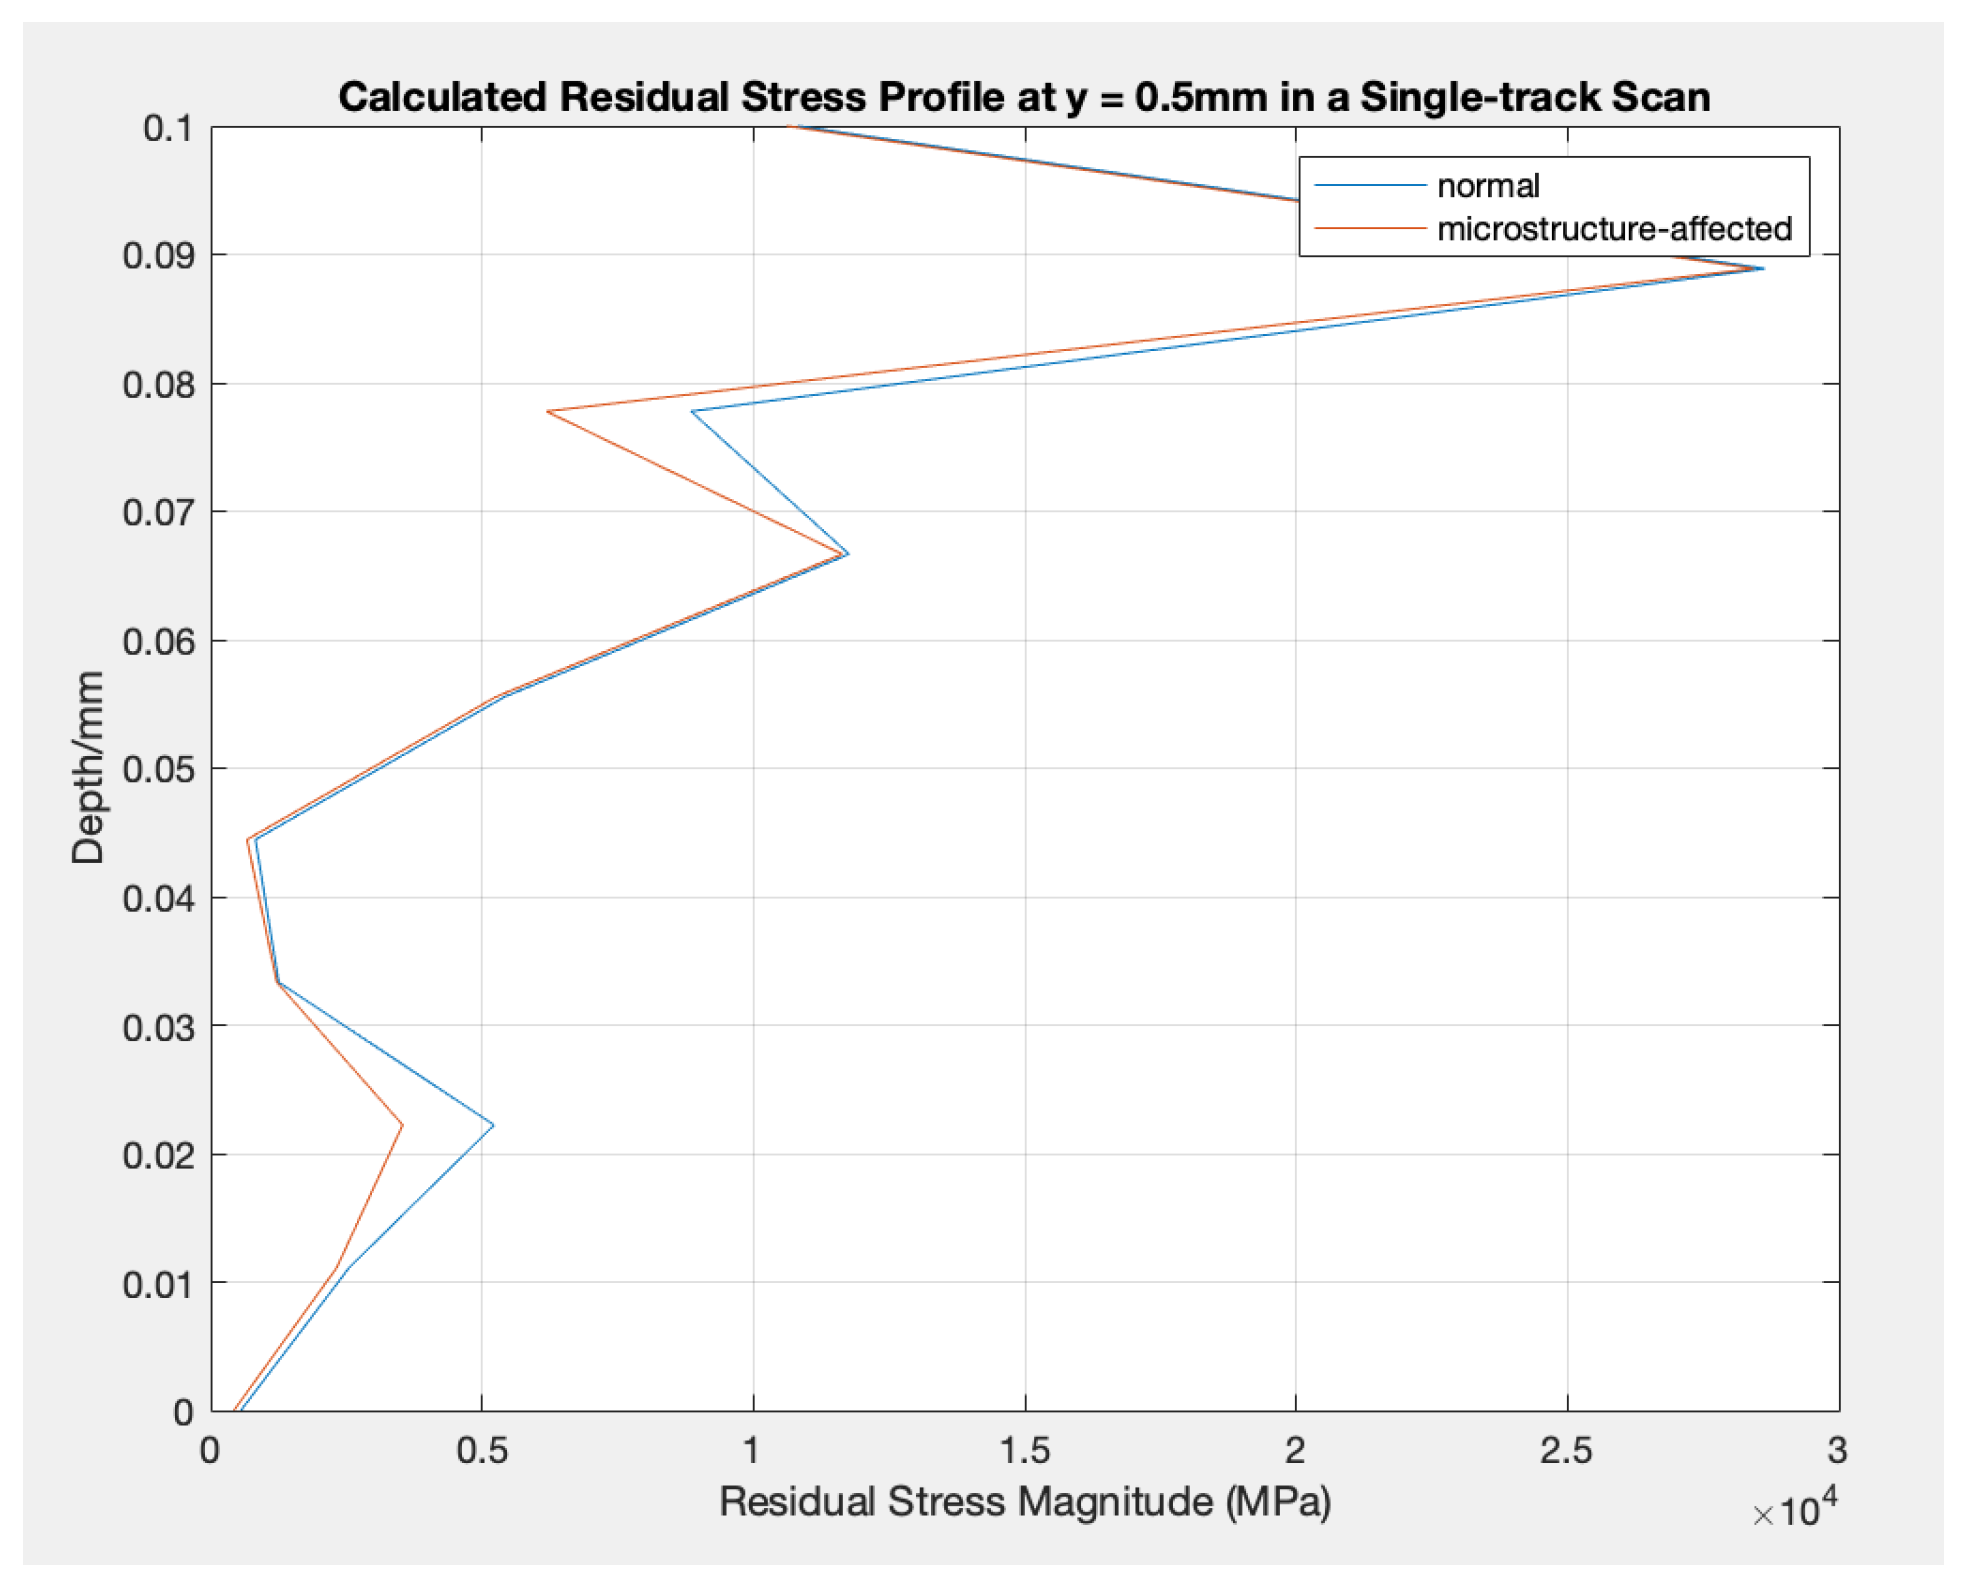
In detail, the residual stress values on the top surface of the parts do not change (stay at about 0.05 MPa) due to various scanning strategies in terms of the number of layers and rows and whether they are affected by varying properties. However, as the depth increases, the residual stress values alter slightly differently, while the tendencies do not change. On the other hand, two relatively apparent peaks appear in each experimental setting between the microstructure-affected residual stress and the commonly analytically modeled residual stress. One appears at a depth of about 0.02 mm and the other at about 0.078 mm. The difference between the two modeled values varies as well. For other depth regions, the values modeled between the two analytical models do not differ much.
4. Conclusions
This work uses an analytical model to investigate the evolution of microstructure and the influence of residual stress on material properties in AM. We have developed analytical thermal models and models for grain size, texture, microstructure-affected properties, and residual stress. Additionally, we compared residual stress models in cases where microstructure was affected and where it was not, analyzing the differences across various scanning strategies based on the number of layers and rows.
It has been observed that the values of residual stress on the top surface, as modeled for different scanning strategies, do not change significantly whether the microstructure is affected. However, there are minor modifications in residual stress when considering changes in depth, regardless of the presence of microstructure, as well as different layer and row settings.
When comparing the two analytical models, it was found that variations in material properties during the process significantly impact the modeled residual stress. Two significant peaks appear in the values from the two analytical models: one occurs at a depth of approximately 0.02 mm, while the other is around 0.078 mm. This suggests that the accuracy of the residual stress modeling can be significantly improved by taking into account fluctuations in material properties during the process.
Acknowledgments
This work was supported by the Boeing Company.
Conflicts of Interest
The authors declare that they have no known competing financial interests or personal relationships that could have appeared to influence the work reported in this paper.
References
- Bartlett, J.L.; Li, X. An overview of residual stresses in metal powder bed fusion. Additive Manufacturing 2019. [Google Scholar] [CrossRef]
- Megahed, M.; Mindt, H.W.; N’Dri, N.A.; Duan, H.; Desmaison, O. Metal additive-manufacturing process and residual stress modeling. Integrating Materials and Manufacturing Innovation 2016, 5, 61–93. [Google Scholar] [CrossRef]
- Staub, A.; Spierings, A.B.; Wegener, K. Correlation of meltpool characteristics and residual stresses at high laser intensity for metal lpbf process. Advances in Materials and Processing Technologies 2018, 5, 153–161. [Google Scholar] [CrossRef]
- Noronha, P.J.; Wert, J.J. An Ultrasonic Technique for the Measurement of Residual Stress. Journal of Testing and Evaluation 1975, 3, 147–152. [Google Scholar] [CrossRef]
- Chung, D.D.L. Thermal analysis of carbon fiber polymer-matrix composites by electrical resistance measurement. Thermochimica Acta 2000, 364, 121–132. [Google Scholar] [CrossRef]
- Krause, T.W.; Clapham, L.; Pattantyus, A.; Atherton, D.L. Investigation of the stress-dependent magnetic easy axis in steel using magnetic Barkhausen noise. Journal of Applied Physics 1996, 79, 4242–4252. [Google Scholar] [CrossRef]
- Ager, J.W.; Drory, M.D. Quantitative measurement of residual biaxial stress by Raman spectroscopy in diamond grown on a Ti alloy by chemical vapor deposition. Physical review. B, Condensed matter, 2601; 4. [Google Scholar]
- Wu, A.S.; Brown, D.W.; Kumar, M.; Gallegos, G.F.; King, W.E. An Experimental Investigation into Additive Manufacturing-Induced Residual Stresses in 316L Stainless Steel. Metallurgical and Materials Transactions A 2014, 45, 6260–6270. [Google Scholar] [CrossRef]
- Wang, Z.; Denlinger, E.R.; Michaleris, P.; Stoica, A.D.; Ma, D.; Beese, A.M. Residual stress mapping in Inconel 625 fabricated through additive manufacturing: Method for neutron diffraction measurements to validate thermomechanical model predictions. Materials & Design 2017, 113, 169–177. [Google Scholar]
- Prime, M.B. Cross-sectional mapping of residual stresses by measuring the surface contour after a cut. Journal of Engineering Materials and Technology-transactions of The Asme 2001, 123, 162–168. [Google Scholar] [CrossRef]
- Mokhtarishirazabad, M.; McMillan, M.; Vijayanand, V.D.; Simpson, C.; Agius, D.; Truman, C.E.; Knowles, D.A.; Mostafavi, M. Predicting residual stress in a 316L electron beam weld joint incorporating plastic properties derived from a crystal plasticity finite element model. International Journal of Pressure Vessels and Piping 2022. [Google Scholar] [CrossRef]
- Kapoor, K.; Yoo, Y.S.J.; Book, T.A.; Kacher, J.; Sangid, M.D. Incorporating grain-level residual stresses and validating a crystal plasticity model of a two-phase Ti-6Al-4 v alloy produced via additive manufacturing. Journal of the Mechanics and Physics of Solids 2018. [Google Scholar]
- Huang, W.; Wang, W.; Ning, J.; Garmestani, H.; Liang, S.Y. Analytical Model of Quantitative Texture Prediction Considering Heat Transfer Based on Single-Phase Material in Laser Powder Bed Fusion. Journal of Manufacturing and Materials Processing 2024. [Google Scholar]
- Huang, W.; Wang, W.; Ning, J.; Garmestani, H.; Liang, S.Y. Analytical Model of Quantitative Texture Prediction Considering Heat Transfer Based on Single-Phase Material in Laser Powder Bed Fusion. Journal of Manufacturing and Materials Processing 2024, 8, 70. [Google Scholar]
- Huang, W.; Garmestani, H.; Liang, S.Y. Analytical prediction of texture of multi-phase materials in laser powder bed fusion 2024.
- Ji, X.; Mirkoohi, E.; Ning, J.; Liang, S.Y. Analytical modeling of post-printing grain size in metal additive manufacturing. Optics and Lasers in Engineering 2020, 124, 105805. [Google Scholar]
- Wang, W.; Ning, J.; Liang, S.Y. Prediction of lack-of-fusion porosity in laser powder-bed fusion considering boundary conditions and sensitivity to laser power absorption. The International Journal of Advanced Manufacturing Technology 2021, 112, 61–70. [Google Scholar]
- Johnson, G.R.; Cook, W.H. A CONSTITUTIVE MODEL AND DATA FOR METALS SUBJECTED TO LARGE STRAINS, HIGH STRAIN RATES AND HIGH TEMPERATURES. 2018.
- Lee, H.J.; Ni, H.; Wu, D.T.; Ramirez, A.G. Grain size estimations from the direct measurement of nucleation and growth. Applied Physics Letters 2005, 87, 124102. [Google Scholar]
- Özel, T.; Llanos, I.; Soriano, J.; Arrazola, P.J. 3D FINITE ELEMENT MODELLING OF CHIP FORMATION PROCESS FOR MACHINING INCONEL 718: COMPARISON OF FE SOFTWARE PREDICTIONS. Machining Science and Technology 2011, 15, 21–46. [Google Scholar]
- Kobayashi, T.; Simons, J.; Brown, C.; Shockey, D. Plastic flow behavior of Inconel 718 under dynamic shear loads. International Journal of Impact Engineering 2008, 35, 389–396. [Google Scholar]
- Kobryn, P.A.; Semiatin, S.L. Microstructure and texture evolution during solidification processing of Ti–6Al–4V. Journal of Materials Processing Technology 2003, 135, 330–339. [Google Scholar]
- Ikehata, H.; Nagasako, N.; Furuta, T.; Fukumoto, A.; Miwa, K.; Saito, T. First-principles calculations for development of low elastic modulus Ti alloys. Physical Review B 2004, 70, 174113. [Google Scholar]
- Howard, C.J.; Kisi, E.H. Measurement of single-crystal elastic constants by neutron diffraction from polycrystals. Journal of Applied Crystallography 1999, 32, 624–633. [Google Scholar]
- Heldmann, A.; Hoelzel, M.; Hofmann, M.; Gan, W.; Schmahl, W.W.; Griesshaber, E.; Hansen, T.W.; Schell, N.; Petry, W. Diffraction-based determination of single-crystal elastic constants of polycrystalline titanium alloys. Journal of Applied Crystallography 2019, 52, 1144–1156. [Google Scholar] [PubMed]
- Mirkoohi, E.; Tran, H.C.; Lo, Y.L.; Chang, Y.C.; Lin, H.; Liang, S.Y. Analytical mechanics modeling of residual stress in laser powder bed considering flow hardening and softening. The International Journal of Advanced Manufacturing Technology 2020, 107, 4159–4172. [Google Scholar]
- Cho, J.Y.; Xu, W.; Brandt, M.; Qian, M. Selective laser melting-fabricated Ti-6Al-4V alloy: Microstructural inhomogeneity, consequent variations in elastic modulus and implications. Optics & Laser Technology.
Disclaimer/Publisher’s Note: The statements, opinions and data contained in all publications are solely those of the individual author(s) and contributor(s) and not of MDPI and/or the editor(s). MDPI and/or the editor(s) disclaim responsibility for any injury to people or property resulting from any ideas, methods, instructions or products referred to in the content. |
© 2025 by the authors. Licensee MDPI, Basel, Switzerland. This article is an open access article distributed under the terms and conditions of the Creative Commons Attribution (CC BY) license (http://creativecommons.org/licenses/by/4.0/).
Copyright: This open access article is published under a Creative Commons CC BY 4.0 license, which permit the free download, distribution, and reuse, provided that the author and preprint are cited in any reuse.


