Submitted:
22 December 2024
Posted:
23 December 2024
You are already at the latest version
Abstract
Background: Perforin is a protein expressed in cytotoxic lymphocytes, and it plays a key role in the cytolytic effect on target cells. Mutation of the perforin gene is one of the most important pathogenic steps in primary hemophagocytic lymphohistiocytosis (pHLH). The aims of this study were to investigate the expression of perforin protein on cytotoxic lymphocytes and to determine the proportions of cytotoxic lymphocyte subsets in patients with secondary hemophagocytic lymphohistiocytosis (sHLH). Moreover, the clinical significance of these findings was explored; Methods: A total of 19 patients with sHLH and 10 healthy controls were enrolled in this study. Six of the patients achieved complete remission. Peripheral blood was collected. The protein expression of perforin on cytotoxic lymphocytes and the proportions of cytotoxic lymphocyte subsets were assessed via flow cytometry. Furthermore, clinical parameters were collected to explore correlations; Results: (1) The proportion of NK cells in the newly diagnosed sHLH was significantly lower than that in the healthy control group (p = 0.006). However, no significant difference in the proportion of CD8+ T cells or CD56+ T cells was found between the newly diagnosed sHLH group and the healthy control group (p > 0.05). (2) The expression of perforin by CD56+ T cells in the newly diagnosed sHLH group was significantly greater than that of the healthy control group (p = 0.035). However, no significant difference in the expression of perforin by CD8+ T cells or NK cells was found between the newly diagnosed sHLH group and the healthy control group (p > 0.05). (3) The proportion of CD8+ T cells in the sHLH group in complete remission was significantly lower than that in the newly diagnosed sHLH group (p = 0.023). However, no significant differences in the proportions of NK cells, CD56+ T cells, or perforin expression were found between the complete remission sHLH group and the newly diagnosed sHLH group (p > 0.05). (4) In patients with sHLH, the CD56+ T-cell proportion was positively correlated with HB (r = 0.464, p = 0.045) and negatively correlated with age (r = -0.456, p = 0.049). The proportion of NK cells was positively correlated with FIB (r = 0.531, p = 0.023). Perforin expression in CD8+ T cells was positively correlated with sCD25 (r = 0.498, p = 0.035), whereas in CD56+ T cells, it was negatively correlated with ALT (r = -0.516, p = 0.028); Conclusions: The proportion of NK cells was significantly reduced in newly diagnosed sHLH patients, whereas perforin expression in CD56+ T cells was increased. After remission, the proportion of CD8+ T cells decreased significantly. These findings suggest that monitoring cytotoxic lymphocyte subsets and perforin expression is crucial for understanding sHLH pathogenesis. The decrease in the NK cell proportion and increase in perforin expression in CD56+ T cells may reflect NK cell dysfunction and immune hyperactivation in sHLH. Additionally, CD8+ T-cell reduction after remission could contribute to clinical efficacy. Dynamic monitoring of these markers is important for evaluating treatment response.
Keywords:
hemophagocytic lymphohistiocytosis
; secondary
; perforin
; cytotoxic lymphocytes subsets
1. Introduction
Hemophagocytic lymphohistiocytosis (HLH) is a group of clinical syndromes characterized by excessive proliferation of CD8+ T lymphocytes and monocyte‒macrophage systems and the production of many inflammatory factors, which are associated with complex clinical manifestations and very high mortality [1]. The etiology of this disease can be divided into primary HLH (pHLH) and secondary HLH (sHLH). Primary HLH has corresponding gene mutations, usually develops in infancy and is characterized by persistent high fever, hepatosplenic lymphadenopathy, cytopenias, hypertriglyceridemia, and hypofibrinogenemia. sHLH occurs mostly in adults older than 18 years and is secondary to unique immune states such as infections, malignancies, and autoimmune diseases [2].
Cytotoxic lymphocytes, including natural killer (NK) cells and CD8+ T cells, are critical in the immune system’s response to infected or transformed cells. The functional impairment or dysregulation of these cells is a hallmark of HLH pathogenesis [3]. Perforin, also known as perforin-forming protein (PFP), is expressed and secreted by cytotoxic lymphocytes and leads to lytic damage to target cells through the formation of pores on target cell membranes [4]. However, PRF1, a gene encoding the perforin protein, is one of the most important mutated genes in the pathogenesis of pHLH, accounting for approximately 1/2 of all pHLH genes [5], resulting in a significant decrease in the expression of the perforin protein and a decrease in the killing activity of NK and CTL cells. Patients with pHLH lack expression of the intracellular perforin protein in cytotoxic lymphocytes, whereas their heterozygous parents also have abnormal expression of the intracellular perforin protein [6]. However, its importance in sHLH, along with the dynamic changes to perforin in cytotoxic lymphocyte subsets, is less clear.
In this study, we detected the proportions of CD8+ T, NK, and CD56+ T cells and intracellular perforin protein expression in patients with sHLH via flow cytometry and investigated whether there was a correlation between the proportions of CD8+ T, NK, and CD56+ T cells and intracellular perforin protein expression and clinical parameters in patients with sHLH.
2. Methods and Material
2.1. Study Population
Nineteen patients with newly diagnosed HLH registered at the Department of Hematology and Department of Geriatric Hematology, Jiangsu Province Hospital, Nanjing, were included. The diagnostic criteria were based on the ASH-2009 diagnostic guidelines proposed by the 2009 American Society of Hematology [7].
The determination of the specific secondary causes of sHLH is mainly based on bone marrow smears and biopsies; pathological lymph node biopsy; imaging (CT, positron emission tomography (PET-CT, and B ultrasound) examinations; examination of tumor and rheumatic immunological indicators; EBV, CMV and other viral DNA copy number quantitative PCR detection; blood, sputum, and other bone marrow culture; and other etiological tests. Among these patients, 12 (63.2%) had lymphoma-associated HLH (LHLH), 5 (26.3%) had infection-associated HLH (IHLH), and 2 (10.5%) had rheumatic immune-associated HLH (AHLH). After active treatment, the efficacy evaluation was based on the efficacy evaluation criteria established by the Midwestern Cooperative Group of the United States [8]. Six indicators were used as the reference basis for clinical efficacy evaluation: (1) blood cell count; (2) soluble interleukin-2 receptor; (3) serum ferritin; (4) hemophagocytosis; (5) triglyceride; and (6) level of consciousness (HLH patients with central nervous system symptoms). All the above indicators returned to normal, which can be defined as a complete response (CR); if ≥ 2 laboratory results/symptoms improved but did not reach the above 6 indicators and the improvement level was at least 25%, it was defined as a partial response (PR), whereby various indicators needed to meet the following criteria: (1) sCD25 decreased by more than 1.5-fold; (2) ferritin and triglyceride levels decreased by more than 25%; (3) a neutrophil count < 0.5 × 10⁹/L without transfusion needed to increase by more than 2-fold and > 0.5 × 10⁹/L; a neutrophil count in the range of (0.5-2.0) × 109/L needed to increase by more than 2-fold and return to the normal range; and (4) alanine aminotransferase > 400 U/L needed to decrease by more than 50%. According to these criteria, perforin protein expression in various types of cytotoxic lymphocytes was detected in 6 patients who achieved clinical remission. Ten normal controls were healthy subjects in our hospital, including 5 males and 5 females, with a median age of 34.5 (22-61) years, with the exception of other rheumatic, infectious, and neoplastic diseases.
Relevant clinical data related to the study subjects, including white blood cell (WBC) counts, hemoglobin (HB) levels, platelet (PLT) counts, alanine aminotransferase (ALT) levels, aspartate aminotransferase (AST) levels, triglyceride (TG) levels, lactate dehydrogenase (LDH) levels, albumin (ALB) levels, the erythrocyte sedimentation rate (ESR), C-reactive protein (CRP) levels, fibrinogen (FIB) levels, soluble interleukin-2 receptor (sCD25) levels, serum ferritin (SF) levels, and overall survival (OS) rates, were collected. OS was defined as the time from the date of diagnosis until patient death or the follow-up endpoint, which ended on 30 June 2024.
2.2. Perforin Staining and Flow Cytometry Analysis
Whole blood was first surface stained with the following antibodies: T-cell receptor αβ (TCRαβ)–fluorescein isothiocyanate, CD8-PerCP (BD Immuno-cytometry Systems, San Jose, CA), and CD56-APC (Immunotech, Brea, CA) for 20 minutes at room temperature. Red cells were then lysed for 15 minutes with 2 mL of FACS lysis buffer (BD Immuno-cytometry Systems) and washed. The resulting white cell pellet was then permeabilized via Cytofix/Cytoperm (BD Pharmingen, San Diego, CA) and stained with either phycoerythrin (PE)-conjugated anti-perforin or PE-conjugated mouse IgG2b (BD Pharmingen) for 30 minutes at room temperature. After being washed, the cells were resuspended in 1% paraformaldehyde and stored at 4 °C prior to analysis by flow cytometry.
The samples were analyzed via a FACSCalibur flow cytometer (Becton Dickinson, San Jose, CA). The following gates were used to distinguish the 3 populations of interest: CD8+ T cells were defined as TCRαβ+, CD8+, and CD56-; NK cells were defined as TCRαβ- and CD56+; and CD56+ T cells were defined as TCRαβ+ and CD56+. All populations were also restricted to a lymphocyte gate on the basis of forward versus side scatter. The perforin-positive region was set as an isotype-matched negative control, and the percentage of positive cells in each region was reported.
3. Statistical Analysis
SPSS (version 23.0; Armonk, New York, USA) was used for the statistical assessment. The quantitative data were tested for homogeneity of variance and normality before comparison. Quantitative data are presented as the median (interquartile range) (P25-P75) and were compared between groups via the Mann‒Whitney U test with a nonparametric test. Correlations between variables were analyzed via Spearman correlation analysis. P < 0.05 was considered statistically significant.
4. Results
4.1. Patient Characteristics
A total of 19 patients with secondary HLH (sHLH) were enrolled in this study. Fresh peripheral blood samples were collected. The proportions of cytotoxic lymphocyte subsets and the protein expression of perforin on cytotoxic lymphocytes were tested via flow cytometry. Moreover, peripheral blood samples from 10 normal controls and 6 clinical response (CR) sHLH patients were tested and compared. The results are shown in Table 1.
4.2. Comparison of the Proportions of Cytotoxic Lymphocytes and Perforin Expression Between Newly Diagnosed sHLH and Healthy
The proportion of NK cells was 9.54 (5.84-12.79) % in 19 newly diagnosed sHLH and 17.62 (10.24-24.66) % in 10 normal controls (p = 0.006). The proportion of CD8+ T cells was 5.39 (1.35-21.73) % among the 19 newly diagnosed sHLH patients and 1.21 (0.46-16.44) % among the 10 normal controls. The proportion of CD56+ T cells was 23.28 (15.12-27.67) % among the newly diagnosed sHLH patients and 19.10 (16.60-22.68) % among the normal controls. No statistically significant difference was detected between the sHLH patients and controls (Figure 1A). We further analyzed and found that the percentage of perforin-positive CD56+ T cells in the newly diagnosed sHLH was significantly greater than that in the normal control [31.60 (19.14 to 66.64) % vs. 8.39 (3.52 to 25.01) %, p = 0.035]. However, the positive expression rates of perforin protein in CD8+ T and NK cells were 30.99 (17.09-55.23) % and 66.79 (45.89 to 74.92) %, respectively, in 19 newly diagnosed sHLH and 17.40 (6.88-34.76) % and 56.20 (47.58 to 73.34) %, respectively, in 10 normal controls (p > 0.05, Figure 1B).
Figure 2 shows the comparison of the results of flow cytometry of cytotoxic lymphocytes between a newly diagnosed LHLH patient and a control. The proportion of NK cells (TCRαβ-/CD56+ cells) in a newly diagnosed sHLH (No. 3) significantly decreased to 7.74%. The proportion of CD8+ T cells (TCRαβ+/CD8+/CD56-) was 0.97%, and that of CD56+ T cells (TCRαβ+/CD56+) was 17.94% (Figure 2A). The proportions of NK cells, CD8+ T cells and CD56+ T cells in the control were 28.69%, 2.3% and 23.07%, respectively (Figure 2B).
Flow cytometry was used to compare the expression of perforin in cytotoxic lymphocytes between a newly diagnosed lymphoma-associated sHLH patient and a normal control. The percentage of perforin-positive CD56+ T cells in newly diagnosed sHLH patients (No. 3) was significantly greater, at 23.79%. The positive expression rate of CD8+ T cells was 20.46%, and that of NK cells was 69.5% (Figure 2C). The percentages of perforin-positive CD56+ T cells, CD8+ T cells and NK cells in the control were 9.30%, 11.47% and 80.07%, respectively (Figure 2D).
4.3. Comparison of the Cytotoxic Lymphocyte Proportion and Perforin Protein Expression Between Patients in Clinical Remission from sHLH and Newly Diagnosed sHLH
The proportion of CD8+ T cells in sHLH patients in remission (n=6) was significantly lower than that in newly diagnosed sHLH patients (n=19) [1.43 (0.83-2.07) % vs. 5.39 (1.35-21.73) %, p = 0.023; Table 2, Figure 3A)]. However, no significant difference in the proportion of NK cells or CD56+ T cells was found between the remission and the newly diagnosed (p > 0.05). The positive expression rate of perforin protein in CD8+ T cells was 37.76% (32.89-53.19) in patients in remission from sHLH and 30.99% (17.09-55.23) in patients with newly diagnosed sHLH. The positive expression rate of perforin protein in NK cells was 48.97% (27.58-76.64) in remission sHLH patients and 66.79% (45.89-74.92) in newly diagnosed sHLH patients. The positive expression rate of perforin protein in CD56+ T cells was 20.54% (12.96-31.19) in patients in clinical remission from sHLH and 31.60% (19.14-66.64) in patients with newly diagnosed sHLH (all p > 0.05, Figure 3B). Moreover, flow cytometry was used to determine the proportion of CD8+ T cells in a newly diagnosed IHLH patient (No. 16) before treatment and after remission (Figure 4).
4.4. Correlation Analysis Between the Proportion of Cytotoxic Lymphocytes and Clinical Parameters in Newly Diagnosed sHLH Patients
Clinical parameters, including age, WBC, HB, PLT, SF, ALB, ALT, AST, LDH, FIB, TG, ESR, sCD25, and CRP levels, were collected from newly diagnosed sHLH patients. The results revealed that the proportion of CD56+ T cells in newly diagnosed sHLH patients was positively associated with HB (p < 0.05) and negatively associated with age (p < 0.05). No significant correlation was found with other clinical parameters (p > 0.05) (Figure 5A). Additionally, perforin expression in CD56+ T cells was positively associated with ALT, whereas perforin expression in CD8+ T cells was negatively associated with sCD25 (p = 0.028; p = 0.035; Figure 5B).
5. Discussion
HLH is a syndrome that is clinically characterized by excessive proliferation and activation of lymphocytes and antigen-presenting cells and excessive immune activation and is associated with complex clinical manifestations, a difficult diagnosis, and extremely high mortality [7]. PHLH and sHLH can be classified according to the presence or absence of relevant genetic mutations. sHLH is associated mainly with strong immune activation states, such as severe infections, malignancies, and autoimmune diseases [9]. Children with pHLH generally develop the disease under 2 years of age, whereas sHLH mostly develops in adulthood; specifically, in a multicenter study of 755 cases, the median age of HLH onset in adults was 49 years [10]. The PRF1 gene is the most important gene mutation in the pathogenesis of pHLH, accounting for approximately 15%-50% of all pHLH, resulting in abnormal perforin protein expression and the inability to kill target cells during cytotoxic activity by cytotoxic lymphocytes [5].
Cytotoxic lymphocytes kill target cells mainly through the perforin protein and granzyme released by themselves. Perforin, also known as perforation-forming protein (PFP), is able to form pores on the target cell membrane and disrupt the integrity of the target cell membrane [4]. Kummer et al. [11]. ffound that granzyme and perforin were expressed mainly on CD3+/CD16+/CD56+ cell subsets in peripheral blood. After cytotoxic lymphocytes contact target cells, the perforin protein is released into the intercellular space and rapidly attaches to the target cell membrane. Then, it is embedded in the phospholipid bilayer and continuously forms transmembrane pores so that granzymes can enter the cytoplasm and nucleus. Granzyme in the cytoplasm and nucleus can eventually lead to DNA cleavage and apoptosis. However, the formation of transmembrane pores changes the intracellular and extracellular osmotic pressures, and water enters the intracellular space, eventually causing target cell lysis [4].
Perforin is mainly expressed in NK cells [12], CD8 + T cells [13], CD56 + T cells [14], γδ T cells [15], and CD4 cells [16,17]. In this study, perforin expression was detected mainly in NK cells, CD8+ T cells, and CD56+ T cells. CD56+ T cells are extrathymically differentiated lymphocytes that express both NK receptors and T-cell receptors. They are distributed mainly throughout the bone marrow and liver and regulate cytotoxic activity that is not restricted by the major histocompatibility complex [18]. Therefore, this finding is consistent with the pathophysiology of HLH patients. However, γδ T cells are distributed mainly throughout the small intestine and are not highly correlated with the main pathological changes in HLH, such as hepatosplenomegaly and bone marrow hemophagocytosis. To eliminate the effects of γδ T cells on CD8+ T and CD56+ T cells, TCRαβ was selected instead of CD3 when costaining.
Several studies have examined the expression of perforin in adult peripheral blood. Rutella et al. reported that the positive expression rate of perforin in NK cells (CD3 −/CD56+ or CD16+) is 95% [17]. Berthou et al. reported that perforin was positively expressed in 92% of NK cells (CD3−/CD56+) [19]. Rukavina et al. reported that the positive rate of perforin expression in NK cells (CD56+) was 91.2% in adult males and 77.7% in adult females [20]. Kogawa et al. reported that the positive rate of perforin expression in normal adult NK cells was 86-98%, the positive rate of perforin expression in CD8+ T cells was 8-28%, and the positive rate of perforin expression in CD56+ T cells was 30-77% [6]. In our study, the positive rate of perforin expression in CD8+ T cells from normal controls was 17.38% (6.88-34.76), which was consistent with the above data. However, the percentages of perforin-positive NK cells and CD56+ T cells were 56.20 (47.58-73.34) % and 8.39 (3.52-25.01) %, respectively. This difference may be due to the small sample size of this study or differences in the gating strategy. In addition, the CD56+ cells included CD56+ T and NK cells. If this difference is considered, the proportion of perforin-positive cells should be slightly reduced.
Currently, studies have investigated the expression of intracellular functional proteins, such as SH2D1A, XIAP, and perforin [6,21,22], in the cytotoxic lymphocytes of HLH patients. Marsh et al. [23]. concluded that flow cytometry detection of perforin protein in NK cells and CD8+ T cells from the peripheral blood of HLH patients can rapidly and sensitively detect defects in perforin expression. Manar Abdalgani et al. screened the PRF1 gene while detecting the perforin protein. They concluded that PRF1 gene mutation can be excluded if perforin protein expression is not deficient or is reduced, as determined by flow cytometry. In a study published in the journal Blood, Tamar et al. retrospectively analyzed 1614 HLH patients and reported that flow cytometry for perforin protein and CD107a detection had higher sensitivity and specificity than NK cell activity detection; thus, it was superior in differentiating HLH [24].
Kogawa et al. reported the expression of perforin in HLH patients. They reported that the intracellular expression of perforin was completely deficient in NK, CD8+ T, and CD56+ T cells in 4 pHLH patients with PRF1 mutations. However, in EBV-associated sHLH patients, although the proportion of NK cells is decreased, there is a significant increase in the expression rate of perforin in CD8+ T and CD56+ T cells [6]. In our study, conclusions regarding the proportion of NK cells and perforin expression rate in CD56+ T cells in sHLH patients are consistent with the EBV-associated HLH described above. Specifically, the proportion of NK cells was significantly decreased in sHLH patients, whereas the expression rate of perforin in CD56+ T cells was significantly increased. This result suggests that the pathogenesis of sHLH may not be the same as that of pHLH. The pathogenesis of pHLH with PRF1 gene mutation is mainly the loss of perforin expression in various types of cytotoxic lymphocytes, which results in the inability to complete cytotoxic killing. However, the pathogenesis of sHLH involves a decrease in the proportion of NK cells. The overexpression of perforin protein in cytotoxic lymphocytes, such as CD56+ T cells, in patients with sHLH may be responsible for excessive immune activation, inflammatory factor storm formation and excessive damage to various organ systems in sHLH. In summary, the detection of perforin in cytotoxic lymphocytes may reveal sHLH pathogenesis and may play a role in the differentiation between sHLH and pHLH.
In sHLH, overly activated CD8+ T lymphocytes and monocyte-macrophages constitute the primary source of the cytokine storm. In our research, the proportion of CD8+ T cells in sHLH patients who achieved clinical remission was significantly lower than that in patients initially diagnosed with sHLH. These findings indicate that reducing the proliferation of activated CD8+ T cells may be an effective treatment for sHLH. Hence, monitoring the proportion of cytotoxic lymphocytes before and after treatment can facilitate the evaluation of the therapeutic efficacy of sHLH and the monitoring of disease progression. Owing to the low incidence of sHLH and its poor prognosis, the number of patients included in this study was limited, and the number of clinically remitting patients was also small, which may have resulted in bias. Therefore, further expansion of the sample size is necessary.
We further carried out a correlation analysis between the proportion of cytotoxic lymphocytes and the protein expression of perforin in CD56+ T cells and relevant clinical indicators in sHLH patients. The proportion of CD56+ T cells in sHLH patients was negatively correlated with age (r = -0.456, p = 0.049). CD56+ T cells are a unique type of lymphocyte that possess both T-cell receptors and NK cell receptors. They can not only secrete Th1 and Th2 cytokines but also exert cytotoxic effects similar to those of CD8+ CTLs. Therefore, CD56+ T cells play a role in antiviral and antitumor responses. As age increases, the quantity of CD56+ T cells decreases. Among our 19 sHLH patients, 12 (63.2%) had lymphoma. This mechanism may be one of the causes of increased susceptibility to tumors in elderly individuals. Additionally, in sHLH patients, the proportion of CD56+ T cells was positively correlated with HB (r = 0.464, p = 0.045), the proportion of NK cells was positively correlated with FIB (r = 0.531, p = 0.023), and the expression level of perforin protein in CD56+ T cells was negatively correlated with ALT (r = -0.516, p = 0.028), which may imply that the proportion of cytotoxic lymphocytes and the expression of perforin protein in CD56+ T cells are related to the course and prognosis of sHLH.
6. Conclusions
In summary, our findings indicate that the proportion of NK cells is significantly lower in newly diagnosed sHLH patients, whereas the positive expression rate of perforin protein in CD56+ T cells is significantly greater. After patients achieve clinical remission, the proportion of CD8+ T cells is significantly lower in sHLH patients than at initial diagnosis. Therefore, the detection of the proportion of cytotoxic lymphocytes and the level of intracellular perforin protein expression in sHLH patients is of great importance. Dynamic monitoring of the degree of cellular toxicity, lymphocyte proportion and perforin protein expression can help determine changes in sHLH conditions and patient prognosis.
Author Contributions
Conceptualization, Xin Gao; Data curation, Tian Tian and Limin Duan; Formal analysis, Limin Duan; Funding acquisition, Guangli Yin; Investigation, Ji Xu; Methodology, Tian Tian; Project administration, Hongxia Qiu; Resources, Jujuan Wang; Software, Tian Tian, Limin Duan and Guangli Yin; Supervision, Ji Xu and Jujuan Wang; Validation, Hongxia Qiu; Writing—original draft, Guangli Yin and Jujuan Wang; Writing—review & editing, Hongxia Qiu. All authors have read and agreed to the published version of the manuscript.
Funding
This study was supported by the National Natural Science Foundation of China (No. 82200209).
Institutional Review Board Statement
All procedures in studies were performed in accordance with the 1964 Helsinki Declaration and this study was approved by the Ethics Committee of the First Affiliated Hospital of Nanjing Medical University (ChiCTR2000032421).
Informed Consent Statement
Informed consent was obtained from all individual participants included in this study. Data Availability Statement: The data presented in this study are available upon request from the corresponding author. To protect privacy, the data are not publicly available.
Conflicts of Interest
The authors declare no conflicts of interest.
References
- Zhang L; Zhou J; Sokol L. Hereditary and acquired hemophagocytic lymphohistiocytosis. Cancer Control. 2014, 21, 4, 301-312.
- Janka GE; Lehmberg K. Hemophagocytic syndromes--an update. Blood Rev. 2014, 28, 4, 135-142.
- Murohashi I; Yoshida K; Ihara N; Wakao D; Yagasaki F; Nakamura Y; Kawai N; Matsuda A; Jinnai I; Bessho M. Serum levels of Thl/Th2 cytokines, angiogenic growth factors, and other prognostic factors in young adult patients with hemophagocytic syndrome. Lab Hematol. 2006, 12, 2, 71-74.
- Voskoboinik I; Trapani JA. Addressing the mysteries of perforin function. Immunol Cell Biol. 2006, 1, 66–71. [Google Scholar]
- Zur Stadt U; Beutel K; Kolberg S; Schneppenheim R; Kabisch H; Janka G; Hennies HC. Mutation spectrum in children with primary hemophagocytic lymphohistiocytosis: molecular and functional analyses of PRF1, UNC13D, STX11, and RAB27A. Hum Mutat. 2006, 27, 1, 62-68.
- Kogawa K; Lee SM; Villanueva J; Marmer D; Sumegi J; Filipovich AH. Perforin expression in cytotoxic lymphocytes from patients with hemophagocytic lymphohistiocytosis and their family members. Blood. 2002, 99, 61–66. [Google Scholar] [CrossRef] [PubMed]
- Filipovich, AH. Hemophagocytic lymphohistiocytosis (HLH) and related disorders. Hematology Am Soc Hematol Educ Program. 2009, 127–131. [Google Scholar] [CrossRef]
- Azzawi M; Bradley B; Jeffery PK; Frew AJ; Wardlaw AJ; Knowles G; Assoufi B; Collins JV; Durham S; Kay AB. Identification of activated T lymphocytes and eosinophils in bronchial biopsies in stable atopic asthma. Am Rev Respir Dis. 1990, 142 6 Pt 1, 1407–1413. [Google Scholar] [CrossRef]
- Janka G; Imashuku S; Elinder G; Schneider M; Henter JI. Infection- and malignancy-associated hemophagocytic syndromes. Secondary hemophagocytic lymphohistiocytosis. Hematol Oncol Clin North Am. 1998, 12, 2, 435-444.
- Girardi AJ; Weinstein D; Moorhead PS. SV40 transformation of human diploid cells. A parallel study of viral and karyologic parameters. Ann Med Exp Biol Fenn. 1966, 44, 242–254. [Google Scholar]
- Kummer JA; Kamp AM; Tadema TM; Vos W; Meijer CJ; Hack CE. Localization and identification of granzymes A and B-expressing cells in normal human lymphoid tissue and peripheral blood. Clin Exp Immunol. 1995, 100, 1, 164-172.
- Helenius A; Morein B; Fries E; Simons K; Robinson P; Schirrmacher V; Terhorst C; Strominger JL. Human (HLA-A and HLA-B) and murine (H-2K and H-2D) histocompatibility antigens are cell surface receptors for Semliki Forest virus. Proc Natl Acad Sci U S A. 1978, 75, 8, 3846-3850.
- Garcia-Sanz JA; Plaetinck G; Velotti F; Masson D; Tschopp J; MacDonald HR; Nabholz M. Perforin is present only in normal activated Lyt2+ T lymphocytes and not in L3T4+ cells, but the serine protease granzyme A is made by both subsets. EMBO J. 1987, 6, 4, 933-938.
- Musha N; Yoshida Y; Sugahara S; Yamagiwa S; Koya T; Watanabe H; Hatakeyama K; Abo T. Expansion of CD56+ NK T and gamma delta T cells from cord blood of human neonates. Clin Exp Immunol. 1998, 113, 2, 220-228.
- Mathews, CK. Effects of thymidine analogs upon growth control in cultured hormone-dependent ray ovary cells. Exp Cell Res. 1975, 92, 39–46. [Google Scholar] [CrossRef] [PubMed]
- Nakata M; Smyth MJ; Norihisa Y; Kawasaki A; Shinkai Y; Okumura K; Yagita H. Constitutive expression of pore-forming protein in peripheral blood gamma/delta T cells: implication for their cytotoxic role in vivo. J Exp Med. 1990, 172, 6, 1877-1880.
- Rutella S; Rumi C; Lucia MB; Etuk B; Cauda R; Leone G. Flow cytometric detection of perforin in normal human lymphocyte subpopulations defined by expression of activation/differentiation antigens. Immunol Lett. 1998, 60, 1, 51-55.
- Kawamura T; Kawachi Y; Moroda T; Weerasinghe A; Iiai T; Seki S; Tazawa Y; Takada G; Abo T. Cytotoxic activity against tumour cells mediated by intermediate TCR cells in the liver and spleen. Immunology. 1996, 1, 68–75. [Google Scholar]
- Berthou C; Legros-Maida S; Soulie A; Wargnier A; Guillet J; Rabian C; Gluckman E; Sasportes M. Cord blood T lymphocytes lack constitutive perforin expression in contrast to adult peripheral blood T lymphocytes. Blood. 1995, 85, 1540–1546. [Google Scholar]
- Rukavina D; Laskarin G; Rubesa G; Strbo N; Bedenicki I; Manestar D; Glavas M; Christmas SE; Podack ER. Age-related decline of perforin expression in human cytotoxic T lymphocytes and natural killer cells. Blood. 1998, 92, 7, 2410-2420.
- Tabata Y; Villanueva J; Lee SM; Zhang K; Kanegane H; Miyawaki T; Sumegi J; Filipovich AH. Rapid detection of intracellular SH2D1A protein in cytotoxic lymphocytes from patients with X-linked lymphoproliferative disease and their family members. Blood. 2005, 105, 8, 3066-3071.
- Marsh RA; Madden L; Kitchen BJ; Mody R; McClimon B; Jordan MB; Bleesing JJ; Zhang K; Filipovich AH. XIAP deficiency: a unique primary immunodeficiency best classified as X-linked familial hemophagocytic lymphohistiocytosis and not as X-linked lymphoproliferative disease. Blood. 2010, 116, 7, 1079-1082.
- Abdalgani M; Filipovich AH; Choo S; Zhang K; Gifford C; Villanueva J; Bleesing JJ; Marsh RA. Accuracy of flow cytometric perforin screening for detecting patients with FHL due to PRF1 mutations. Blood. 2015, 15, 1858–1860. [Google Scholar]
- Rubin TS; Zhang K; Gifford C; Lane A; Choo S; Bleesing JJ; Marsh RA. Perforin and CD107a testing is superior to NK cell function testing for screening patients for genetic HLH. Blood. 2017, 129, 2993–2999. [Google Scholar]
Figure 1.
Comparison of the proportion of cytotoxic lymphocytes and perforin expression.
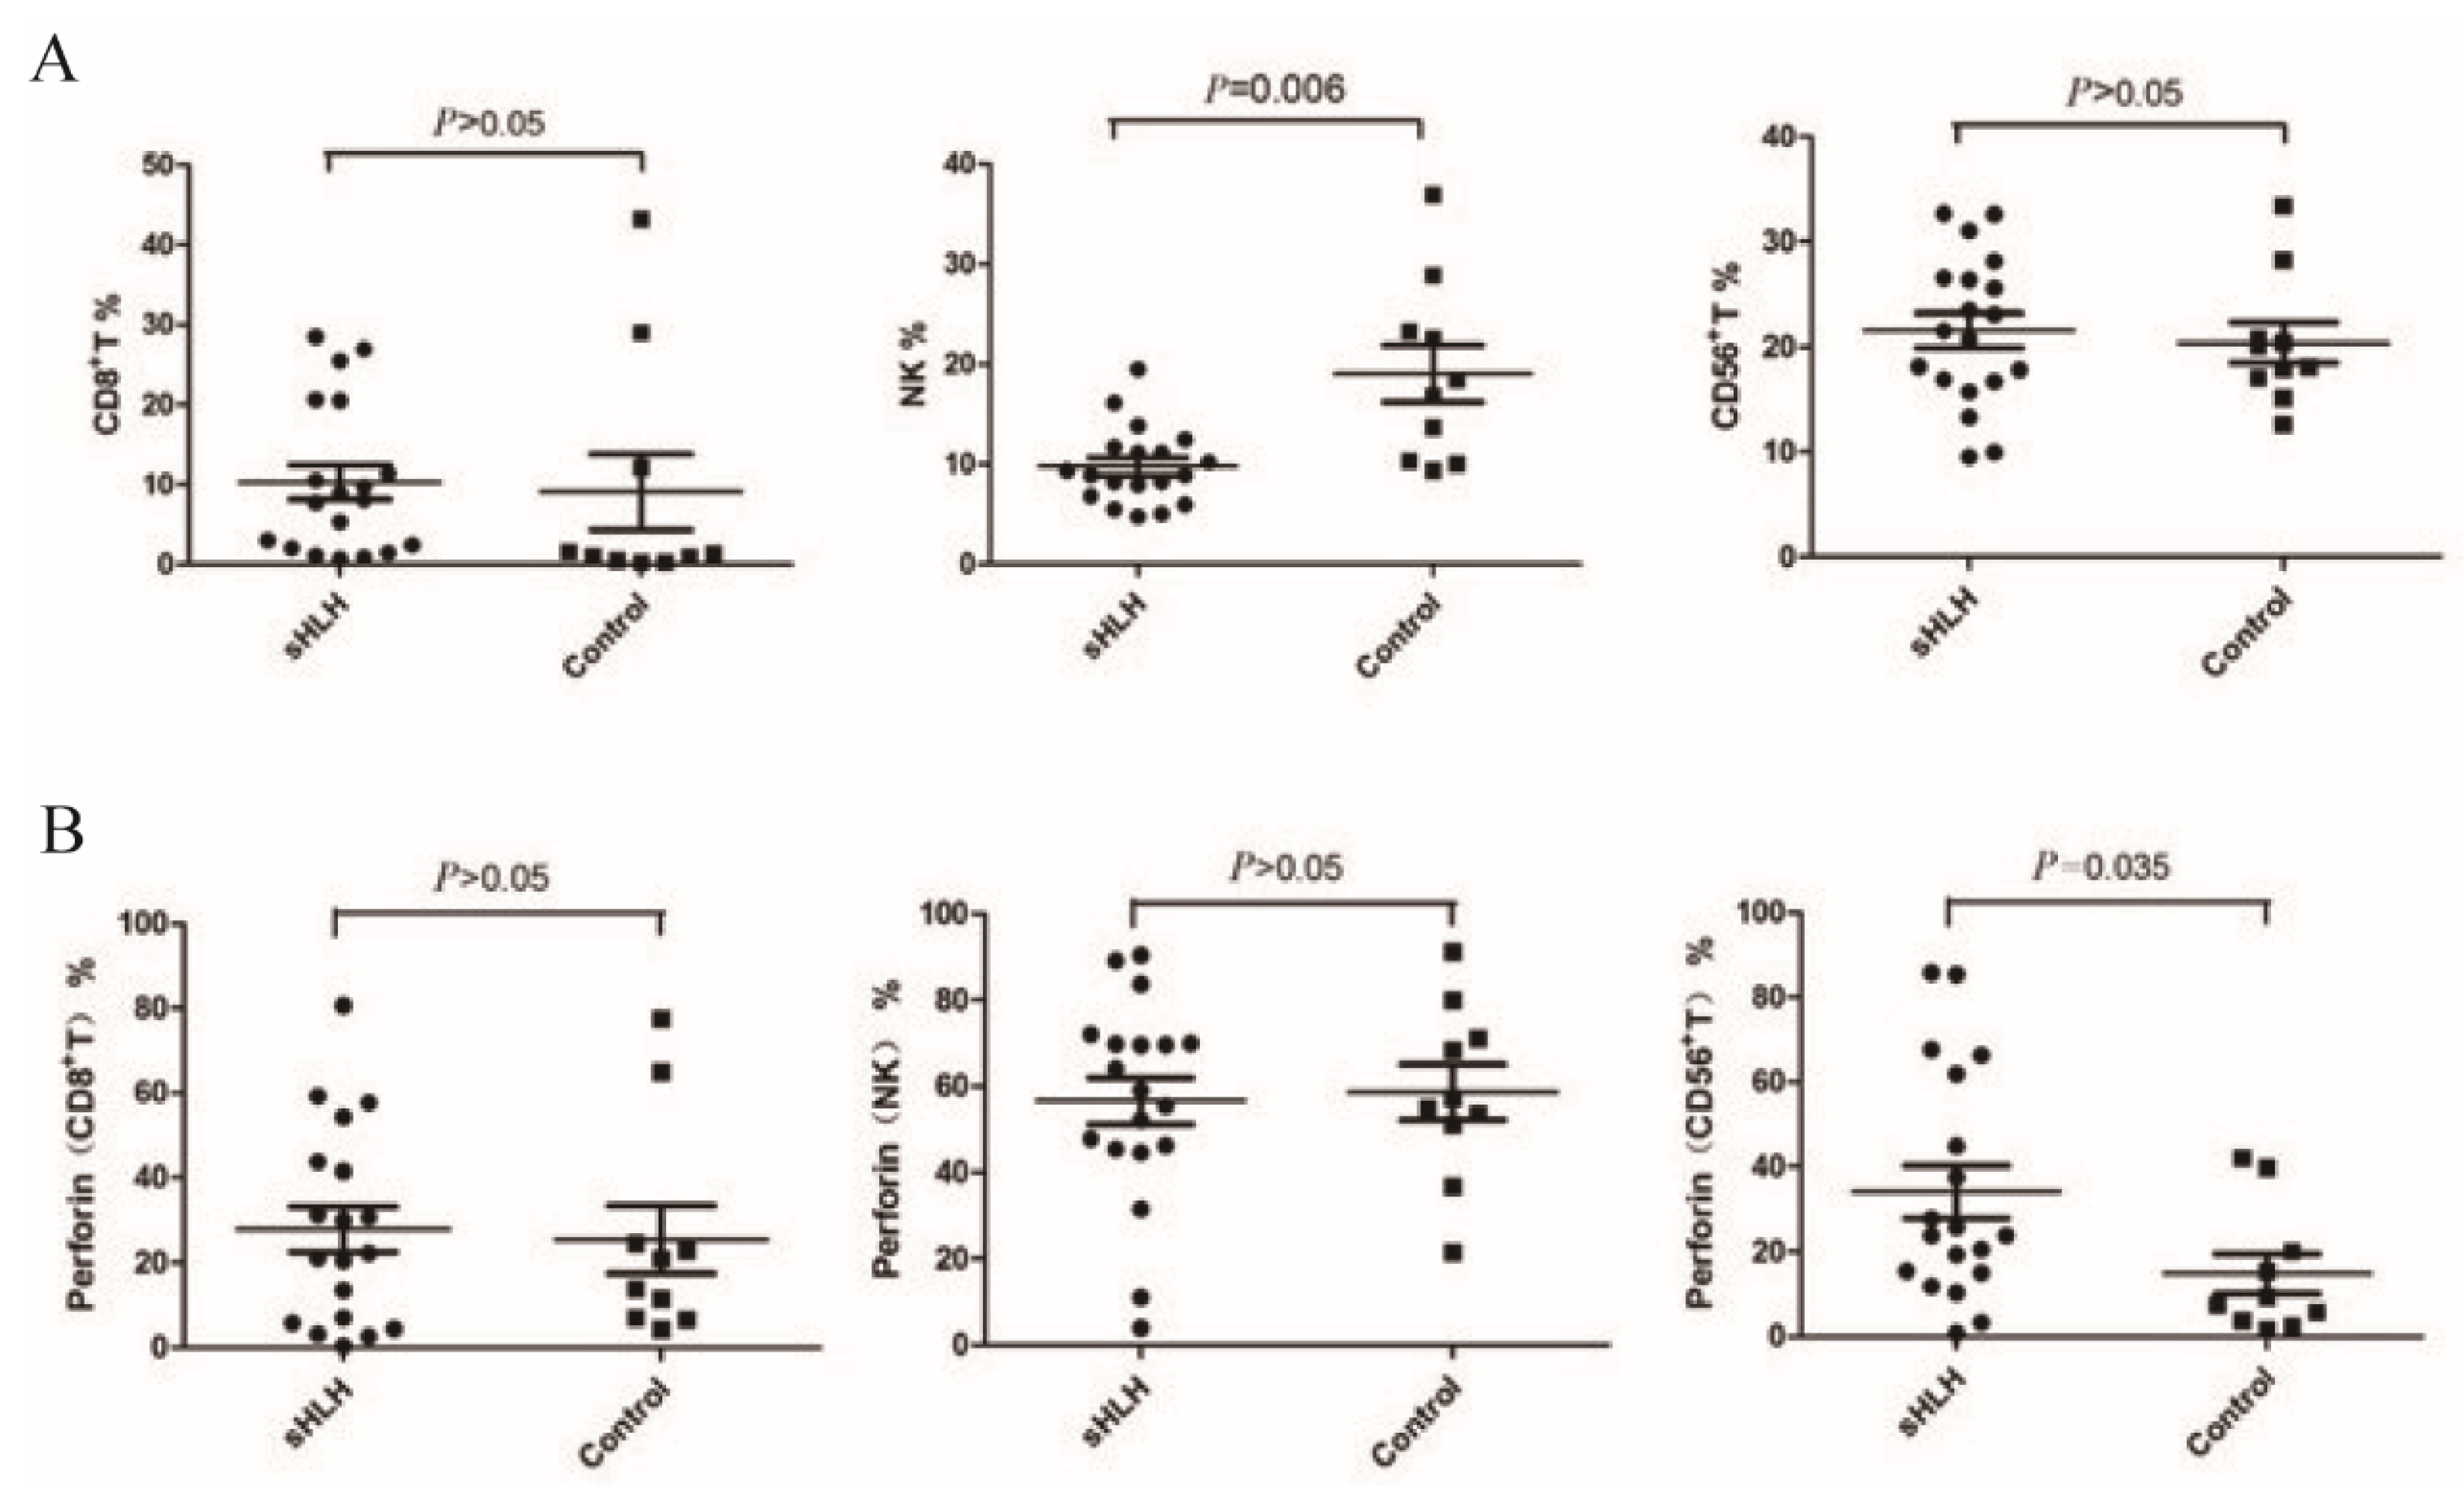
Figure 2.
Comparison of CD56+ T cells, CD8+ T cells and NK cells before and after treatment.
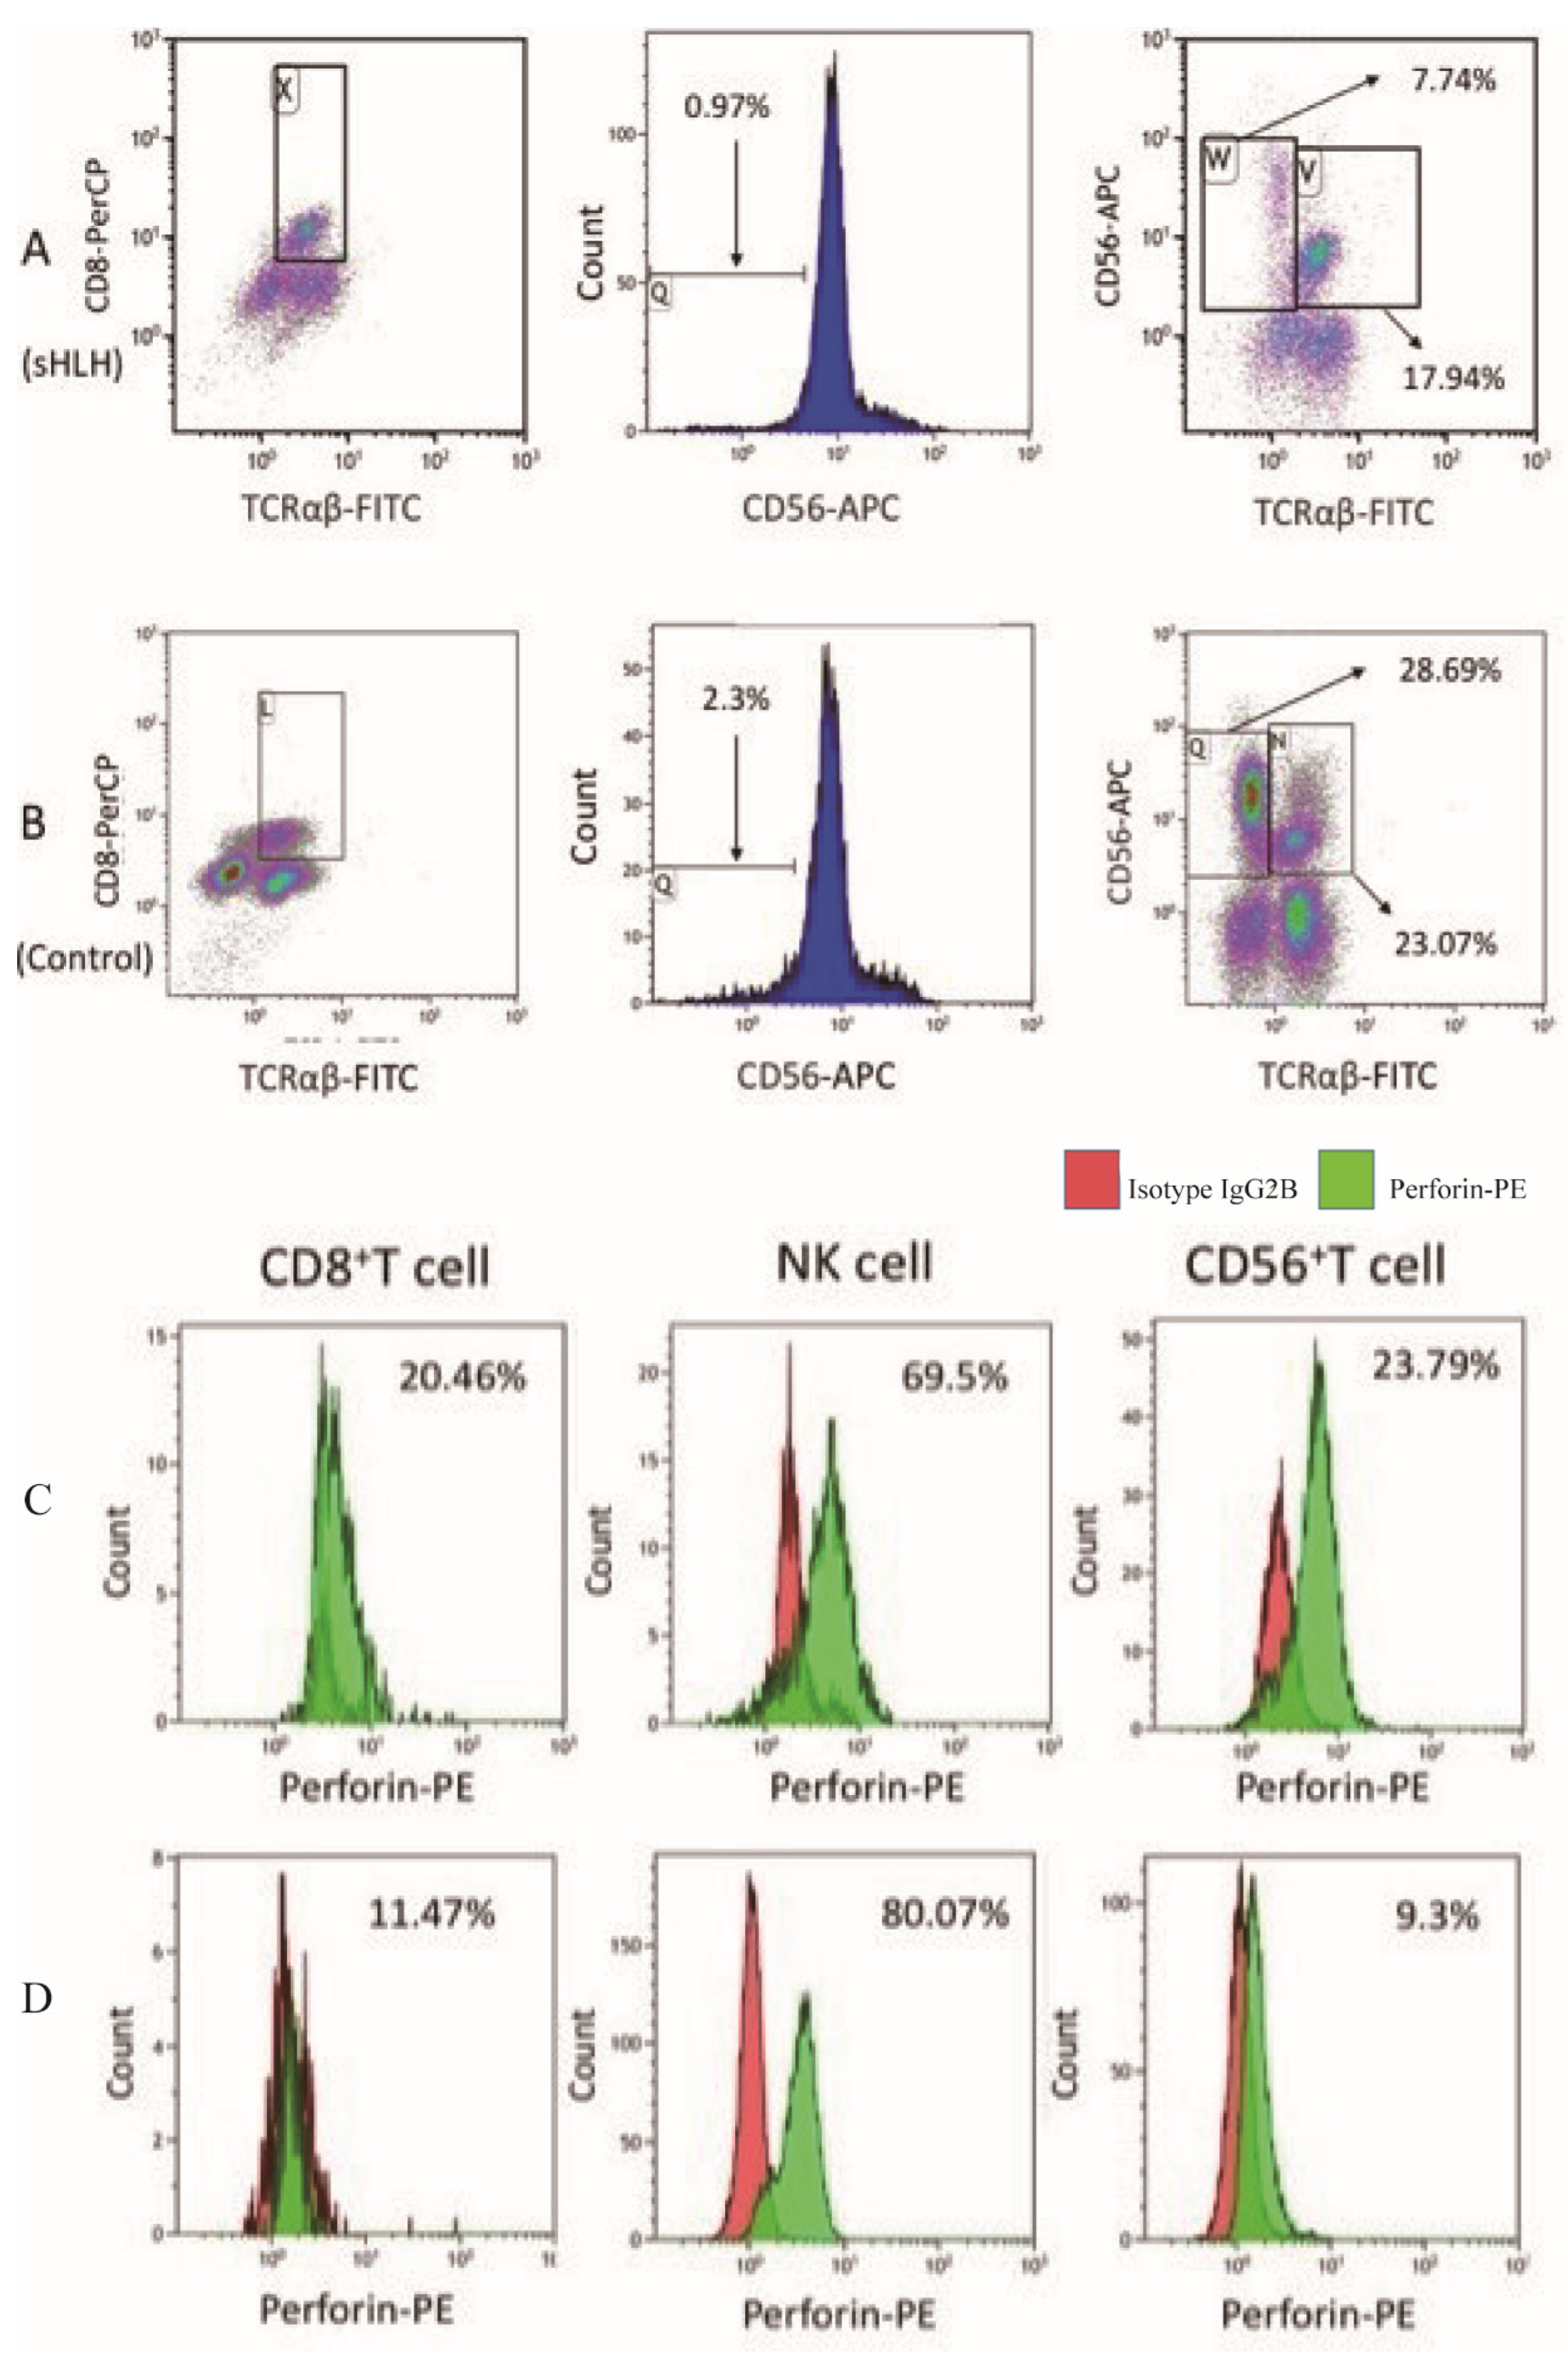
Figure 3.
Comparison of the proportion of cytotoxic lymphocytes and perforin protein expression between patients in remission and newly diagnosed patients with sHLH.
Figure 3.
Comparison of the proportion of cytotoxic lymphocytes and perforin protein expression between patients in remission and newly diagnosed patients with sHLH.
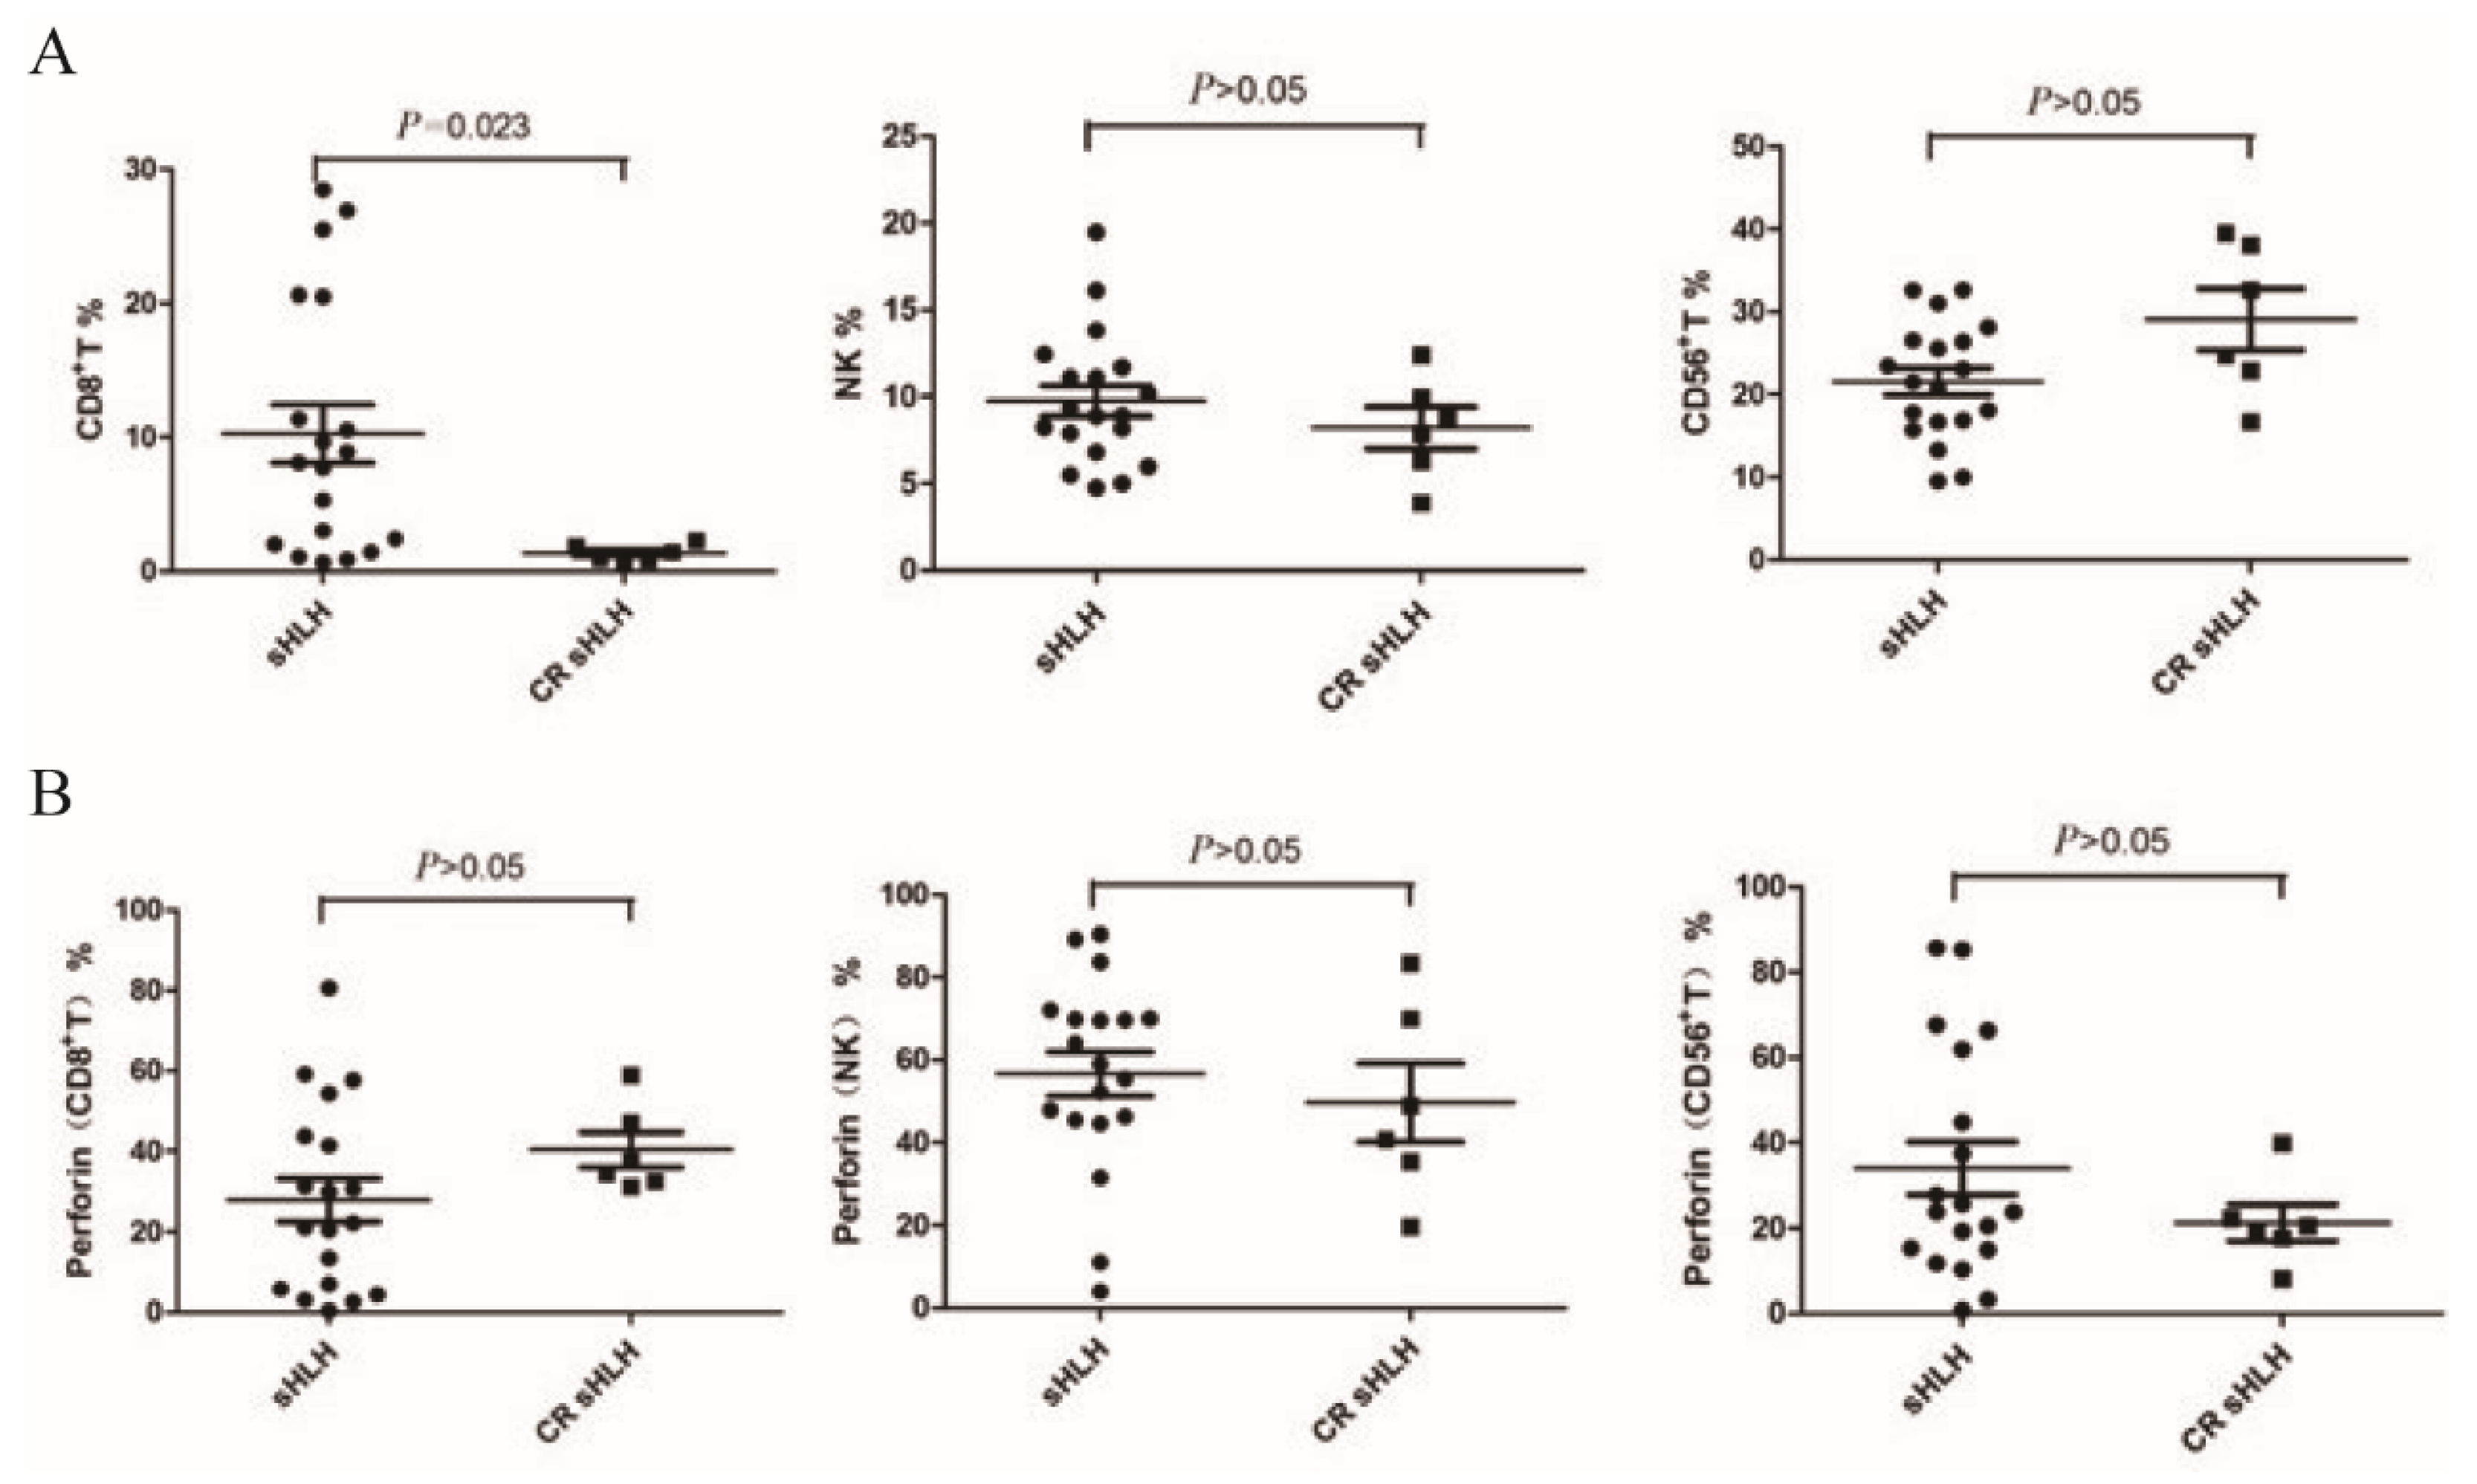
Figure 4.
Flow cytometry was used to determine the proportion of CD8+ T cells in a newly diagnosed IHLH patient (No. 16) before treatment and after remission. (A) The percentage of CD8+ T cells (TCRαβ+/CD8+/CD56-) was 26.92% before treatment; (B) The percentage of CD8+ T cells (TCRαβ+/CD8+/CD56-) after clinical remission was significantly lower than that before treatment (2.30%).
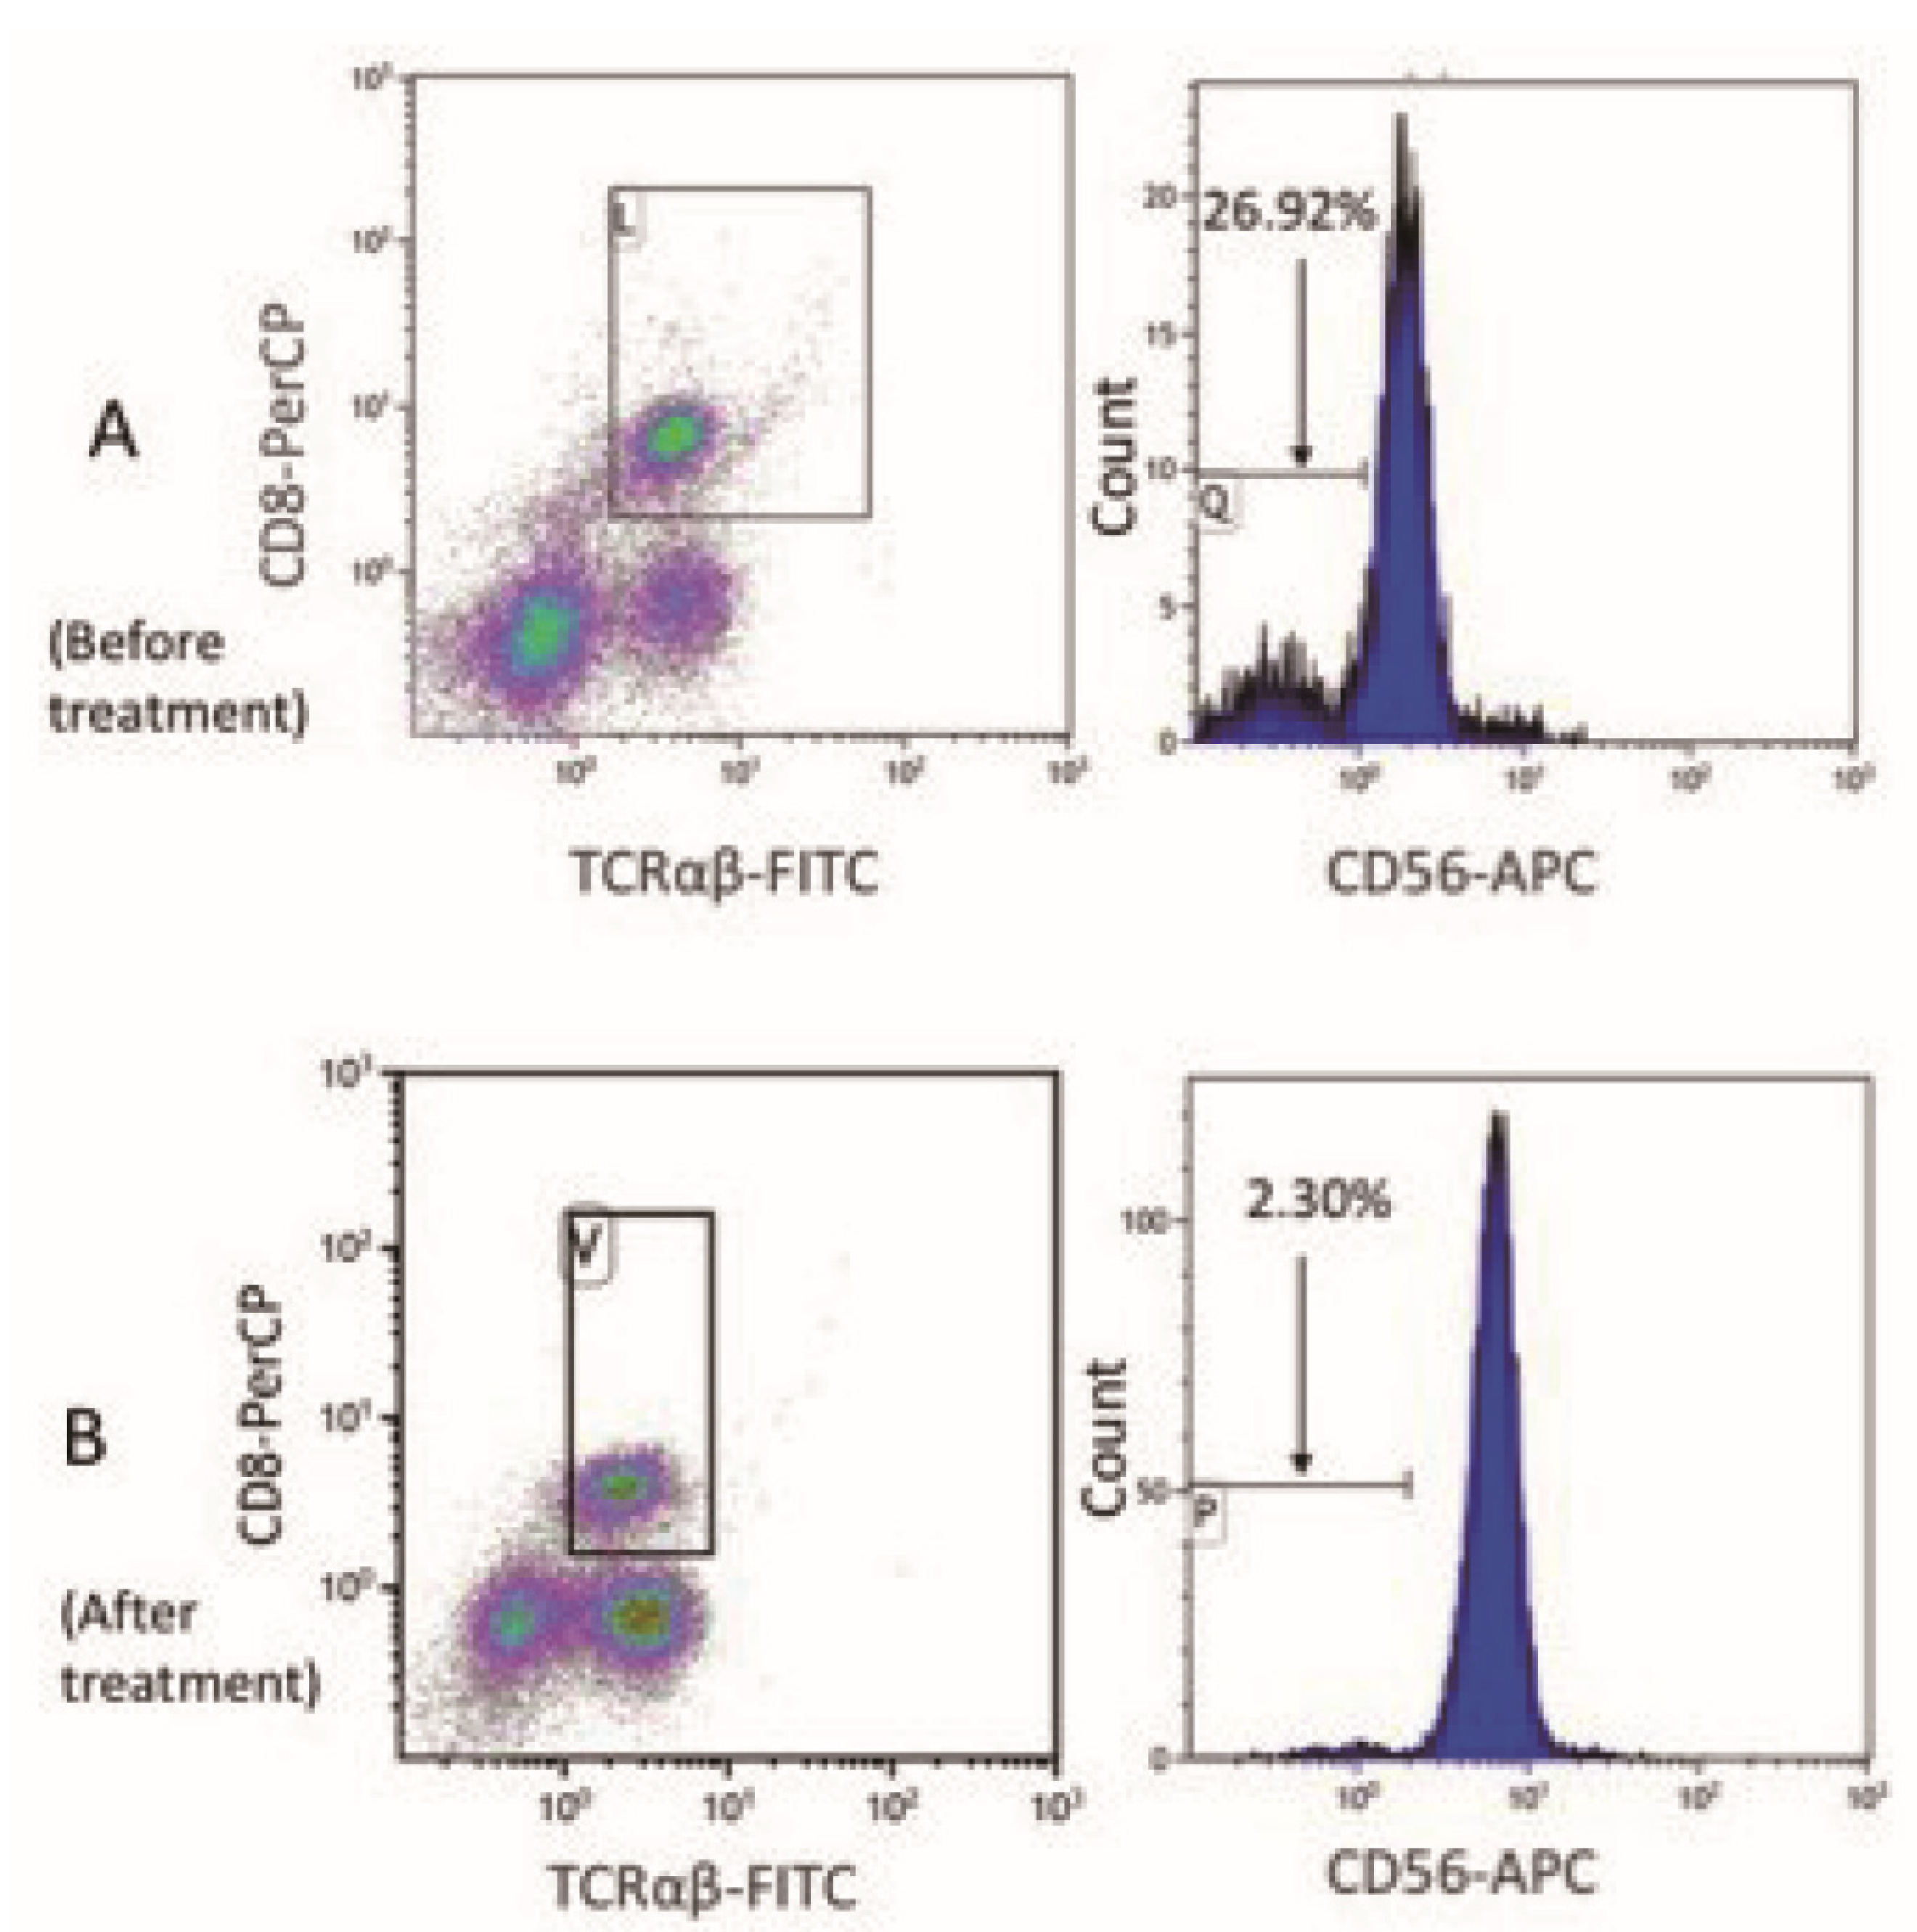
Figure 5.
Correlation analysis was performed between the proportion of cytotoxic lymphocytes and the clinical parameters of 19 patients.
Figure 5.
Correlation analysis was performed between the proportion of cytotoxic lymphocytes and the clinical parameters of 19 patients.
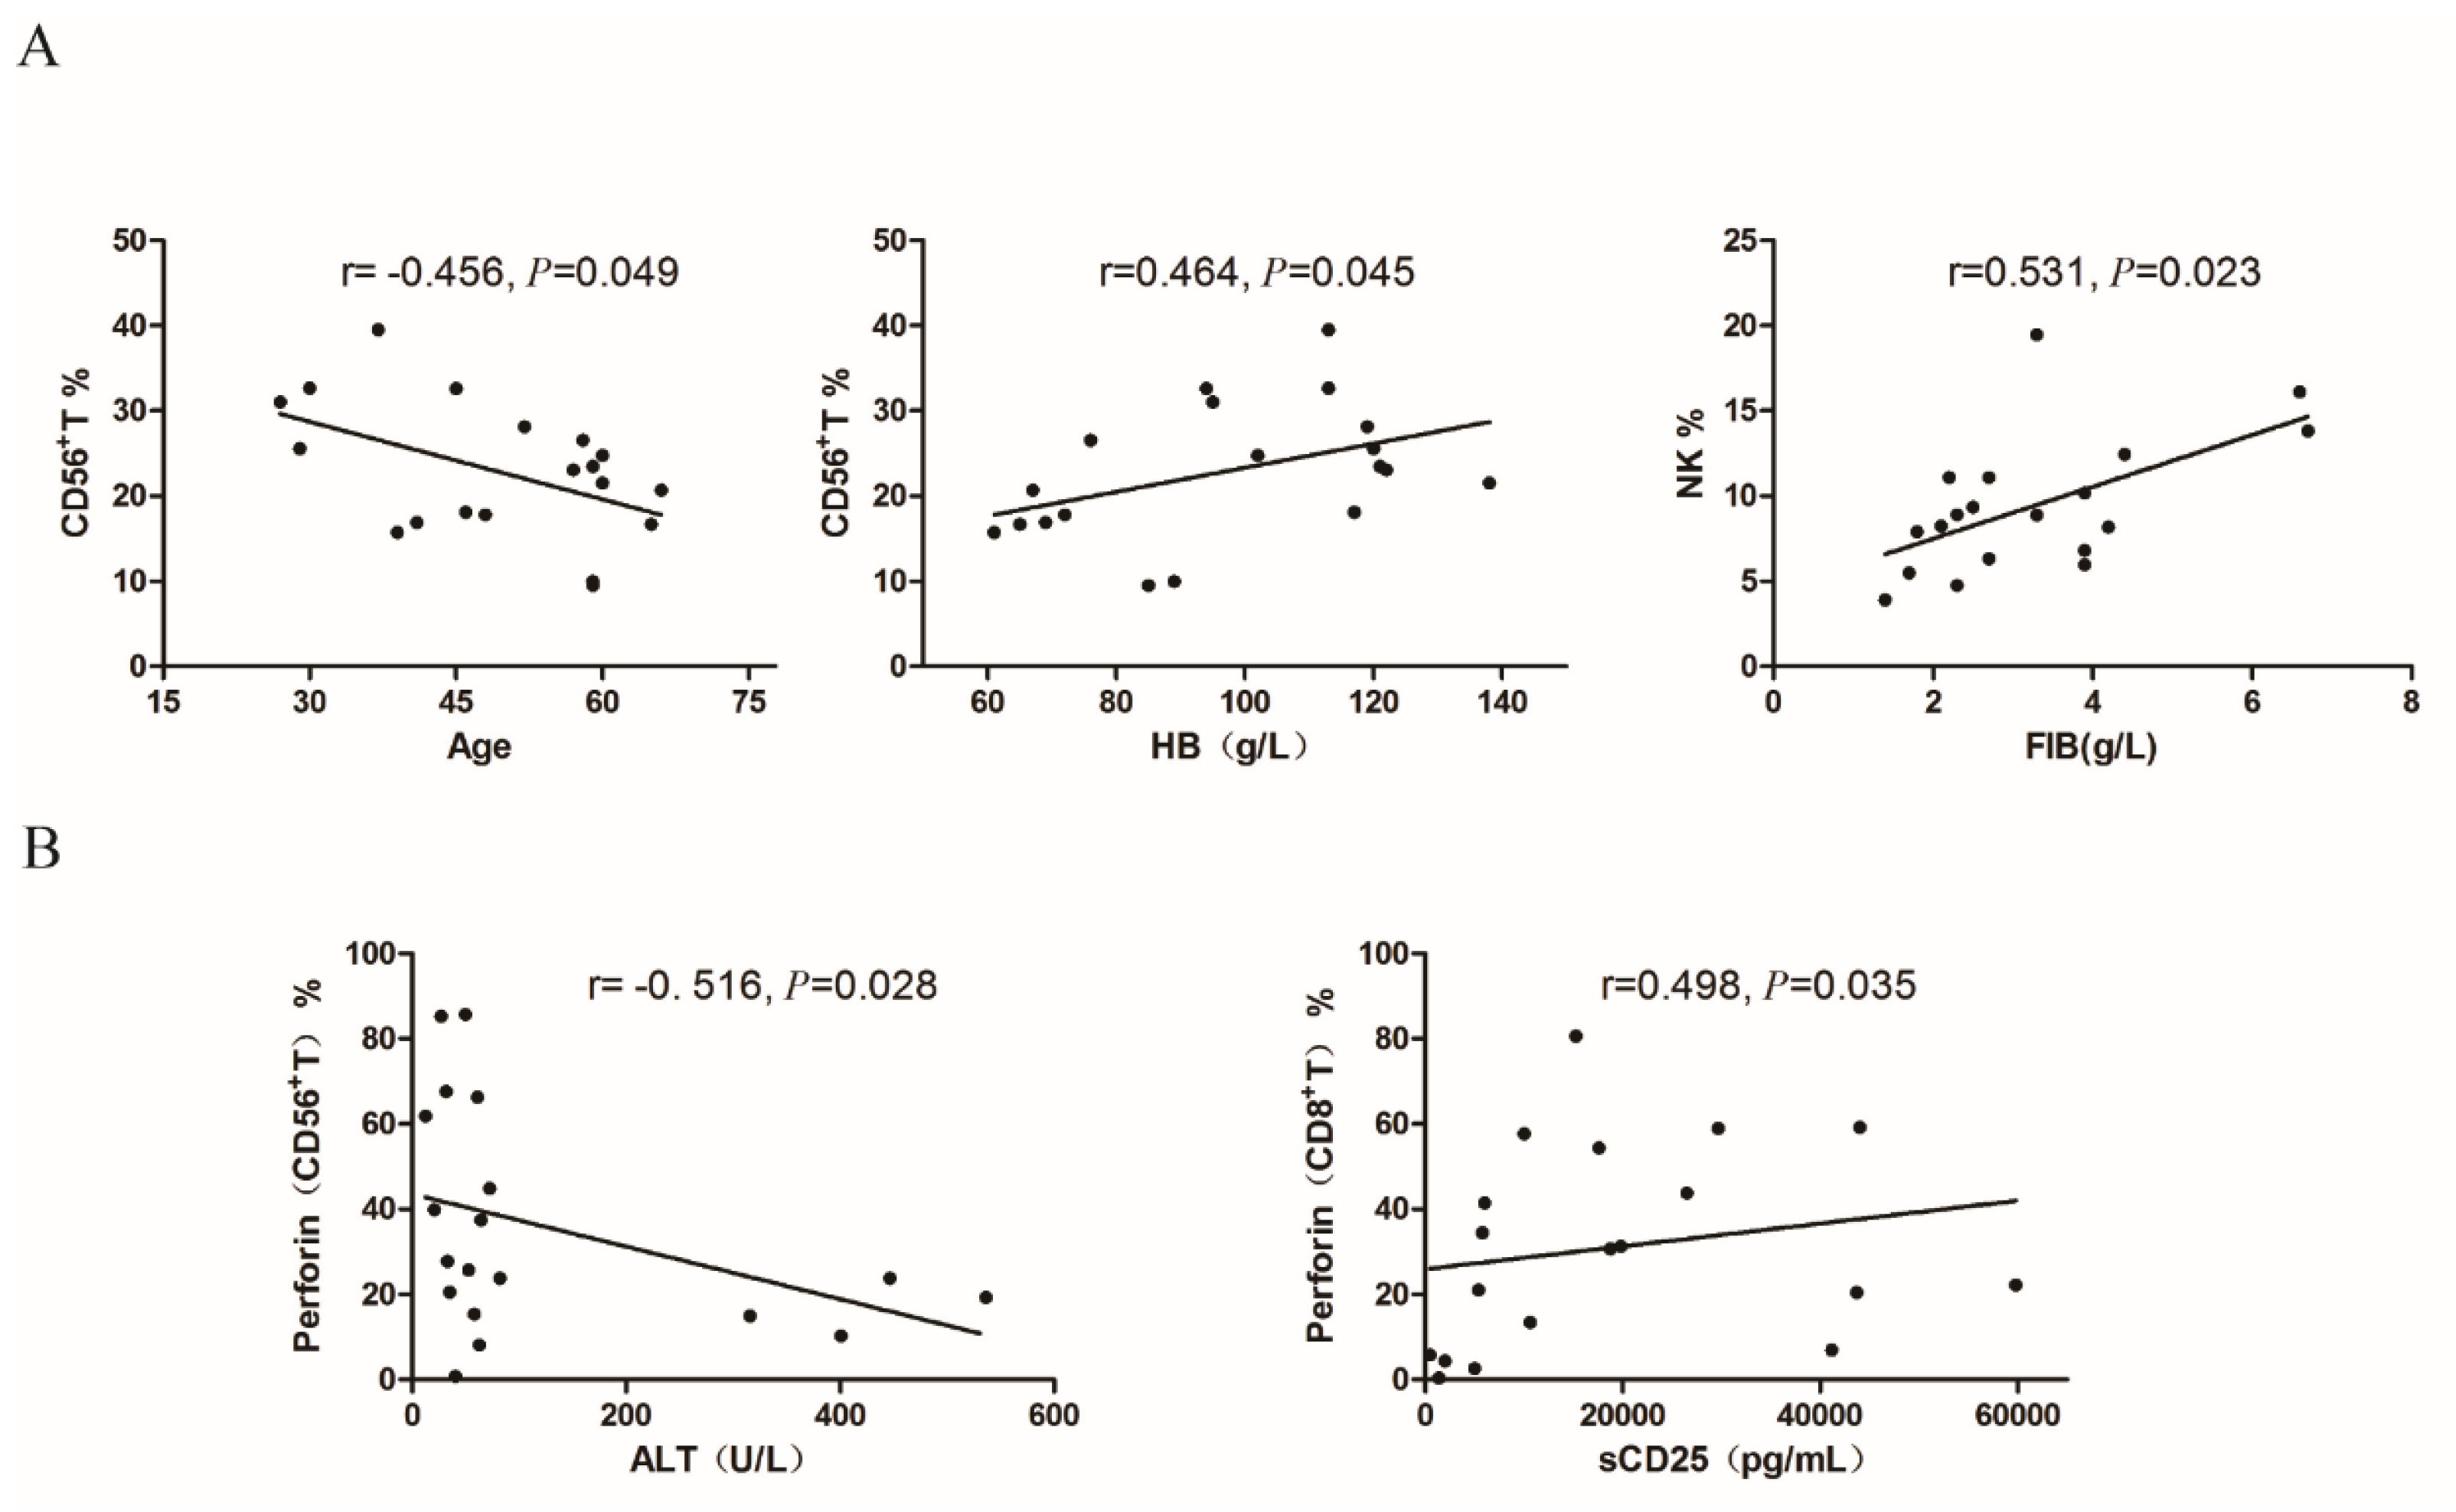

Table 1.
Clinical Data of 19 initially diagnosed sHLH patients.
| No. | Age/ sex |
Diagnose | Treatment | OS (months) | Prognosis |
| 1 | 66/M | LHLH | CHOP | 2.3 | Died |
| 2 | 65/M | LHLH |
High-dose corticosteroid & IVIG +antiviral therapy +3 cycle MINE |
39.7 | Died |
| 3 | 27/M | LHLH | HLH-2004 + 3 cycle MINE + 3 cycle CHOPE |
93.0 | Survival |
| 4 | 59/M | LHLH | 3 cycle MINE + splenic radiotherapy + 3cycle DHAP | 39.9 | Died |
| 5 | 45/M | LHLH | HLH-2004 + 2 cycle MINE + 1 cycle GDP + 1 cycle HyperCVAD-A + 1 cycle CHOP | 6.0 | Died |
| 6 | 30/F | LHLH | HLH-2004+3 cycle MINE + 1 cycle DHAP+ 1 cycle HyperCVAD-A | 17.1 | Died |
| 7 | 60/M | LHLH | SMILE | 0.9 | Died |
| 8 | 41/F | LHLH | High-dose corticosteroid & IVIG +HLH-2004+12 cycle L-GemOx | 92.3 | Survival |
| 9 | 60/M | LHLH | 4 cycle CHOP+ 4 cycle GDP | 7.8 | Died |
| 10 | 59/M | LHLH | High-dose corticosteroid & IVIG +HLH-2004+ 8 cycle MINE |
98.0 | Survival |
| 11 | 37/M | LHLH | High-dose corticosteroid & IVIG +2 cycle MINE+ L-GemOx+ 3 cycle GemOx |
7.3 | Died |
| 12 | 39/M | IHLH (EBV, Fungus) |
High-dose corticosteroid & IVIG + HLH-2004+ Anti-fungal theraphy |
96.0 | Survival |
| 13 | 57/M | IHLH (Fungus) | Anti-fungal therapy+ anti-infectious therapy+ corticosteroid | 93.0 | Survival |
| 14 | 59/M | IHLH (pneumonia) | Supportive treatment | NA | Lost to follow-up |
| 15 | 29/F | IHLH (EBV) |
Corticosteroid +antiviral therapy + supportive treatment |
2.9 | Died |
| 16 | 52/F | IHLH (sepsis) |
Anti-infectious therapy+ supportive treatment | 94.1 | Survival |
| 17 | 48/M | IHLH | High-dose corticosteroid & IVIG+ anti-infectious therapy | 104.0 | Survival |
| 18 | 58/F | AHLH | COP+ High-dose corticosteroid & IVIG&CTX | 3.1 | Died |
| 19 | 46/M | AHLH | COP+ supportive treatment | 12.0 | Died |
Abbreviation: F, female; M, male; OS, overall survival; CHOP, cyclophosphamide, doxorubicin, vincristine, predniso-lone; IVIG, intravenous immunoglobulin; MINE, mitoxantrone, ifosfamide, mesna, etoposide; HLH-2004, dexamethasone, etoposide, cyclosporine A; DHAP, dexamethasone, cisplatin, cytosine arabinoside; GDP, gemcitabine, dexame- thasone, cisplatin; Hyper-CVAD-A, cyclophosphamide, mesna, vincristine, doxoru -bicin, dexamethasone; SMILE, dexamethasone,methotrexate, ifosfamide, L-aspara-ginase, etoposide; GemOx, gemcitabine, oxaliplatin; L-GemOx, L-asparaginase, gemcitabine, oxaliplatin; COP, cyclophosphamide, vincristine, prednisolone.
Table 2.
The proportion of cytotoxic lymphocytes and the positive expression rate of perforin molecules on cytotoxic lymphocytes in normal controls, newly diagnosed sHLH patients, and sHLH patients in complete remission.
Table 2.
The proportion of cytotoxic lymphocytes and the positive expression rate of perforin molecules on cytotoxic lymphocytes in normal controls, newly diagnosed sHLH patients, and sHLH patients in complete remission.
| Flow cytometric parameters | Normal (N=10) |
ND-sHLH (N=19) |
Remission-sHLH (N=6) |
| CD8+ T% | 1.21(0.46~16.44) | 5.39(1.35~21.73) | 1.43(0.83~2.07) |
| NK% | 17.62(10.24~24.66) | 9.54(5.84~12.79) | 7.88(5.11~9.40) |
| CD56+T% | 19.10(16.60~22.68) | 23.28(15.12~27.67) | 32.64(20.73~38.81) |
| Perforin (CD8+T) % | 17.38(6.88~34.76) | 30.99(17.09~55.23) | 37.76(32.89~53.19) |
| Perforin (NK) % | 56.20(47.58~73.34) | 66.79(45.89~74.92) | 48.97(27.58~76.64) |
| Perforin (CD56+T) % | 8.39(3.52~25.01) | 31.60(19.14~66.64) | 20.54(12.96~31.19) |
Abbreviation: ND-sHLH, newly diagnosed sHLH.
Disclaimer/Publisher’s Note: The statements, opinions and data contained in all publications are solely those of the individual author(s) and contributor(s) and not of MDPI and/or the editor(s). MDPI and/or the editor(s) disclaim responsibility for any injury to people or property resulting from any ideas, methods, instructions or products referred to in the content. |
© 2024 by the authors. Licensee MDPI, Basel, Switzerland. This article is an open access article distributed under the terms and conditions of the Creative Commons Attribution (CC BY) license (http://creativecommons.org/licenses/by/4.0/).
Copyright: This open access article is published under a Creative Commons CC BY 4.0 license, which permit the free download, distribution, and reuse, provided that the author and preprint are cited in any reuse.


