
Submitted:
21 December 2024
Posted:
23 December 2024
You are already at the latest version
Abstract
Apparent kinetics are often used to describe a variety of reactions in the field of chemical looping and solar thermochemical processes, yet a rigorous analytical methodology for utilizing such kinetics has been lacking. The implementation of a novel approach was exemplified in the ceria thermochemical cycle for producing solar thermochemical hydrogen, specifically in the H2O-driven oxidation step. The H2 production rate equation was derived by rearranging apparent kinetics from experimental literature into a more suitable analytical form. The 1D model integrates heat transfer, fluid dynamics, and redox chemistry, describing a directly irradiated solar receiver reactor. Model robustness is ensured through the oxygen mass balance across the cycle, and comparison against experimental data shows high agreement. The methodology can be useful for simulating chemical looping cycles using any nonstoichiometric oxide, such as ceria-based oxides and, most importantly, oxidation-limited perovskites, for which optimizing the oxidation step in terms of fluid flow, kinetics, and reaction times is crucial. The proposed analytical model can be applied to arbitrarily complex reactor geometries. The inherently local nature of the model also allows to obtain spatial distributions of the redox material conversion and utilization, paving the way for optimization strategies of reactor’s design and operation.
Keywords:
Solar thermochemical hydrogen
; Solar reactor
; Numerical modeling
; Apparent kinetics
; Nonstoichiometric oxygen carrier
1. Introduction
Solar-driven thermochemical cycles can be considered valuable systems for clean energy production contributing to the green energy transition [1], [2]. In a recent review, Tran et al. [3] reported how the thermochemical option to produce solar green hydrogen (or equivalently, solar syngas) is more promising than other routes such as photovoltaic-driven or biomass-based alternatives, that suffer, respectively, a restricted usable wavelength range for solar energy conversion, and several logistical challenges. In this perspective, thermochemical cycles aimed at synthetic fuel generation via H2O and/or CO2 splitting are currently being intensively investigated [4], [5], [6], [7], [8], [9]. Splitting reactions are facilitated by making use of reactive solid intermediates while being energetically optimized based on the respective thermodynamic constraints [10]. Solid intermediates used for oxygen transfer reactions are referred to as Oxygen Carriers (OCs), typically metal oxides or perovskites [11], [12]. Currently, there is strong interest within the scientific community in nonstoichiometric OCs, such as ceria and perovskites, because these materials can maintain the lattice structure without undergoing phase changes upon redox cycling, resulting in improved stability [3], [13].
Nonstoichiometric ceria () is considered the state of the art OC for thermochemical splitting, due to fast oxidation kinetics and good cyclic durability [7]. In nonstoichiometric thermochemical splitting, the H2O/CO2 splitting reaction is decomposed into two cyclic reaction steps, that equal the overall splitting reaction when summed up. In the cycle, the OC is first thermally reduced at high temperature (up to 1673-1873 K [14]) and low O2 partial pressure, thereby releasing O2 from the lattice up to the equilibrium of the reaction (Equation (1)). In the following oxidation step (Equations (2)–(3)), the OC is oxidized back when subjected to a high H2O/CO2 partial pressure, resulting in H2/CO production at a typically lower oxidation temperature (below 1273 K). Nonstoichiometry variation (), referred to as oxygen exchange capacity [15] or oxygen storage capacity [16], gives a measure of the exchanged O2 across the redox cycle and correlates to the fuel produced in the oxidation step. The intensive research effort is being directed towards solar-assisted thermochemical splitting [3], [17] in which concentrated solar thermal energy is used to thermally feed the process, due to high theoretical solar-to-fuel efficiencies coming from the full utilization of the solar spectrum, as well as from the direct solar radiation conversion into process heat [3], [18].
Numerous concepts of solar reactors for efficiently running solar-driven thermochemical splitting were proposed in the literature, mostly with ceria-based OCs. Consequently, also several attempts to rationally classify such numerous systems were proposed. According to Lu et al. [19], the classification can be made by differentiating in: (i) systems that involve the movement of the redox material in space (either self-supporting structures – including monoliths, Reticulated Porous Ceramics (RPC), and 3D-printed hierarchically channelled structures [3] –, or particles), with the gas streams and the operating temperatures kept constant in each different reaction chamber; and (ii) systems in which the redox material is fixed in space (either self-supporting structures or fixed beds of particles), with the gas streams and the operating temperatures adjusted cyclically in time according to the reaction step ongoing. The same differentiation criteria are mentioned by Weber et al. [20]. The recent review by Tran et al. [3] alternatively classifies solar thermochemical reactors in the following two broad categories: self-supporting reactors and particle-based reactors. Whereas monolithic and RPC-based reactors would fall into the former category, all the moving/not-moving particles-containing reactors would fall into the latter. The reader is redirected to the cited comprehensive reviews [3], [19] for further details on solar thermochemical devices classification and description, that are beyond the scope of this work. Recent novel concepts include both particle-based systems and self-supporting monolithic/RPC-based systems. In the former category, Weber et al. [20] proposed a process concept referred to as SOMPIHR (Swept, Open Moving Particle reactor Including Heat Recovery), consisting of a particle receiver followed by a moving bed heat exchanger performing the particles’ thermal reduction while subjected to inert (N2) sweeping, and subsequently by a counter-current oxidation reactor chamber. In the latter category, a new monolithic receiver-reactor concept was reported by Brendelberger et al. [21], referred to as a receiver-reactor cavity system with multiple mobile redox units (R2Mx). The R2Mx concept implements moving reactive material in the form of monoliths instead of particles between different reaction zones, allowing for continuous operation and solid–solid heat recovery. Modelling results were reported recently [22]. Following a similar philosophy, a new multi-reactor concept in the form of a reactor train system was proposed at the Massachusetts Institute of Technology [23], consisting of a series of indirectly irradiated, ceria RPC moving reactors operating dynamically, and capable of implementing solid–solid heat recovery in a counterflow radiative heat exchanger configuration. It should be also mentioned for completeness that attempts to perform thermochemical splitting reactions in a fluidized bed configuration were considered [24], [25].
Regardless of the working principle and design of the specific reactor concept, full development of the solar thermochemical technology would require – among other features – an easy scale-up of the system [3]. In [19], the authors highlight the technical difficulties in scaling up receiver-reactors with moving redox-active parts, due to the need to manage a thorough control of the moving parts together with the reduction/oxidation atmospheres to which they are subjected, while the system is at high temperature and with the necessity of avoiding gas leakages between the different chambers. Similar concerns were also raised by Tran et al. [3], who reported how the moving parts in solar thermochemical reactors should be minimized because of the likely failures upon high-temperature operation, generating reliability challenges. On the other hand, Lidor and Bulfin [17] recently reported a critical analysis of the two-step thermochemical fuel production technology, defining the key performance indicators that should be considered when evaluating its further development – namely: reactor efficiency, power output, power density, and oxidant feedstock conversion. Specifically, the power density of volumetric directly irradiated receiver-reactors as the one tested by Zoller et al. [26] was reported to be sufficiently low to raise questions about the practical feasibility of further scale-up for this specific reactor concept [17]. Nonetheless, this directly-irradiated, volumetric reactor design allowed to reach the highest solar-to-fuel efficiencies to date, around 5.25% and 5.6% for 4 kW and 50 kW scales, respectively [3], [26], [27].
It is thus clear how the preliminary design of such systems is of the utmost importance to predict the reactor behaviour and performance, and specifically, detailed heat and mass transfer modelling at the receiver-reactor level is required to guide the engineering process.
An excellent review on solar thermochemical reaction systems modelling was recently reported by Wheeler et al. [28]. Many modelling works appeared in the literature in recent years, trying to capture the complex multiphysics featured by such systems, and at different levels of detail. A representative overview of modelling works from the literature is summarized Table 1, with details on the reactor typology and governing equations implemented for mass and momentum conservation, as well as for heat transfer and chemistry. Most of the works reported so far focused on the reduction step of the cycle [29], [30], [31], [32], [33], [34], [35], [36], [37], [38], [39], mainly assuming thermodynamic equilibrium (e.g., in [32], [39]), with few pioneering works addressing the detailed surface solid-gas interface kinetics [29], [30] and rarely applying apparent kinetic laws [35], [40]. Li et al. [36] modelled an isothermal flow reactor featuring a downward flow of ceria particles undergoing thermal reduction counter to an upward gas flow. The authors explored the effects of reaction kinetics as well as of design and operational parameters (i.e., reactor length and particle diameter) on the reduction extent observed. For reduction kinetics, results were reported using both the models developed by Keene et al. [29], [30] and Bulfin et al. [41], interestingly showing how the rate parameters can be calibrated to take into account the transition from the kinetics-limited regime to the thermodynamics and gas advection-limited regime when dealing with different reactor designs and material morphologies. Zhang and Smith [37] proposed a 3D transient model of a directly irradiated, inert-swept partition-cavity solar thermochemical reactor, with a packed bed of CeO2 particles as the reactive material. The authors investigated the fluid flow and heat transfer behaviour as a function of several geometric factors, such as the partition gap size, the catalyst thickness, and the inlet/outlet position, giving insight on the optimal configurations based on the resulting flow and temperature fields. The reduction kinetics for each CeO2 particle was modelled following Ishida et al. [42]. Some other works were focused on the thermal and/or thermomechanical behaviour of the reactor [43], [44], [45] without implementing reaction kinetics. Interestingly, relatively limited efforts in simulating also the oxidation step were found, in which either the oxidation is supposed to be sufficiently fast to impose thermodynamic equilibrium [46], or trends are assumed for the nonstoichiometry upon oxidation in the absence of kinetic rate expressions for this latter cycle step [47]. Venstrom et al. [48] developed an equilibrium model for both the reduction and oxidation steps of the ceria redox cycle considering a fixed bed reactor. However, while the model well predicts the release rate of O2 upon reduction in a wide temperature range of 740 – 1500 °C, it is not applicable for estimating the production rates of CO during oxidation at temperatures below 930 °C, as the oxidation becomes limited by surface kinetics. The same authors [49] then developed a three-dimensional, transient model of a solar reactor for splitting CO2 in the isothermal ceria cycle at high temperature (1500 °C), at which global reaction rates are driven by advective mass transport rates and intrinsic material thermodynamics. The model implemented the rate expression developed by Bulfin et al. [41], which was properly modified by imposing the thermodynamic equilibrium constraint, coupled to the direct thermal CO2 dissociation to determine the resulting CO produced at high temperature. Pan et al. [50] proposed a steady-state model for heat and mass transfer coupled to chemical kinetics in an oxygen-permeable membrane reactor. The model developed by Bulfin et al. [41] was implemented for describing the reduction kinetics. On the oxidation side, the apparent kinetic law presented by Le Gal et al. [51] was rearranged and used, taking into account the dependence of the rate on temperature and solid conversion. However, this kinetic law did not take into account the dependence of the reaction rate on the CO2 partial pressure in the reacting gas stream, which can have an impact on the resulting kinetics as widely stated elsewhere [40], [52]. Wang et al. [53] recently proposed a dual-scale one-dimensional model for the ceria redox cycle. The model integrates the transport of species in the porous bed (macroscopic scale) and the transport of lattice oxygen within the particles (mesoscopic scale), and implements the detailed surface and bulk kinetics developed by Zhao et al. [54] for the ceria system. The redox cycle consists of an H2-assisted reduction and a H2O dissociation step. The authors found that the oxidation process is faster than the reduction, but that the transport at the macroscopic and mesoscopic scales is of the same order of magnitude. In a recent work, Dai et al. [55] modelled the ceria water splitting cycle taking into account the kinetics of both thermal reduction and H2O-driven oxidation, with a similar approach as proposed by Bala Chandran et al. [49] and expressing the rate parameter as a function of temperature and reacting surface area. No further works were found implementing a complete splitting kinetics, neither for CO2, nor for H2O dissociation, considering a thermal-driven reduction step. It is also worth stressing that, although studying the oxidation step imposing chemical equilibrium results in enlightening considerations concerning the highest efficiency achievable by a thermochemical cycle, this only represents the ideal boundaries of the process operation. As a matter of fact, also reaction kinetics has a significant role in determining the overall productivity and feasibility as reported very recently by de la Calle et al. [56], thereby suggesting that reactor design should take these considerations into account.
In the present work, a multiphysical model of a ceria-based, inert-swept, directly irradiated structured receiver-reactor is developed for a simplified geometry, implementing the reaction kinetics for both thermal reduction and H2O-driven oxidation steps and simulating the entire cycle making use of apparent kinetics extracted from literature experimental data. The model implementation was validated through accurate comparison with experimental data for both reduction and oxidation steps, revealing excellent agreement. A simple approach is proposed to implement apparent kinetics in solar thermochemical nonstoichiometric reaction systems – such as ceria-based or perovskite materials – when the reactants’ partial pressure plays an active role in determining the material kinetics. The analytical model presented, specifically applied here to the H2O-driven oxidation step, allows to convert a global kinetic law into a local kinetic law, that can be coupled to other physics in reactor-level models, meeting a gap in the current literature. The proposed novel analytical methodology is thought to be useful when modelling any solid-gas reaction for which apparent kinetics can be retrieved from experiments [40], and being a local approach, can be extended to arbitrarily complex solar reactor geometries. The inherently local nature of the model also allows at the same time for optimization strategies of reactor’s design and operation, in terms of spatial distributions of the OC reactivity and efficient utilization.
For a more extensive discussion on the model applications, the reader is redirected to Section 4. The model implementation is presented in detail in Section 2, with the novel analytical methodology specifically described in Section 2.4.2, and the validation against experiments shown in Section 2.10. Section 3 shows the key results from the model, while the conclusions of the work are summarized in Section 5.

Table 1.
Selected works on thermochemical splitting reactor modelling from the literature, compared with the present work.
Table 1.
Selected works on thermochemical splitting reactor modelling from the literature, compared with the present work.
| Reference | Dimensions, numerical method, and software | OC and reactor | Mass and momentum conservation | Energy conservation | Radiative heat transfer | Chemistry and kinetics |
|---|---|---|---|---|---|---|
| Lapp et al. [43], 2013 | 2D model. | No OC reactions implemented. Counter-rotating cylinders reactor with solid-solid heat recovery. |
n.a. | LTE is assumed between the solid and gas phases. | RDA and Monte Carlo ray tracing. | No kinetics implemented (only thermal model). |
| Lapp et al. [47], 2014 | Transient 3D model. | Isotropic porous ceria (ε=0.75). Counter-rotating cylinders reactor with solid-solid heat recovery. |
n.a. | LTE is assumed between the solid and gas phases. | RDA. The surface is assumed to be opaque. | Equilibrium is implemented. Reduction is supposed to be “fast”; oxidation is supposed to reach near-completion at the temperatures predicted in the oxidation zone. Nonstoichiometry is supposed to decrease linearly to zero across the oxidation zone, in the absence of kinetic rate expressions. |
| Keene et al. [29], 2013 | Axisymmetric cylindrical domain. Finite volume method with in-house developed Fortran code. |
Porous ceria (ε=0.75), supposed homogeneous, isotropic, dimensionally stable. Directly irradiated. |
Mass conservation is formulated for solid and gas phases, and individual components of the fluid phase (i.e., argon and oxygen). Darcy’s law is used for momentum conservation. | LTNE - each phase (solid and gas) is described with its energy equation. | Radiatively participating solid, radiatively nonparticipating gas. RDA for the optically thick medium is implemented. Irradiated boundary treated as a black surface. | Solid-gas interface kinetics is implemented. A model is developed for the adsorption/desorption of oxygen across the solid-gas interface to accurately describe the kinetics in terms of the local T, pO2 and δ. Only reduction is simulated. |
| Keene et al. [30], 2014 | 1D model. Finite volume method with in-house developed Fortran code. | Porous ceria monolith. Cavity-type, directly irradiated. | Mass conservation is formulated for solid and gas phases, and individual components of the fluid phase (i.e., argon and oxygen). Darcy’s law is used for momentum conservation. | LTNE - each phase (solid and gas) is described with its energy equation. | Radiatively participating solid, radiatively nonparticipating gas. Internal radiative heat transport modelled with RDA. | Solid-gas interface kinetics is implemented. Kinetics is implemented through the model developed by Keene et al.[29]. Kinetic rate constant is enforced to be sufficiently high to simulate equilibrium chemistry (i.e., transport-limited regime). Only reduction is simulated. |
| Bala Chandran et al. [31], 2015 | 3D model of a single reactive element. Transport equations are solved in ANSYS Fluent 14.0.1. | Porous ceria supposed homogeneous, isotropic, and with constant porosity (ε=0.65) and specific surface area. Cylindrical cavities, directly irradiated. | Mass conservation is formulated for solid and gas phases, considering interfacial mass transfer due to oxygen release upon reduction. Momentum transport is formulated using the Darcy-Brinkman-Forchheimer model. | LTE is assumed between the solid and gas phases. | Radiatively participating solid, radiatively nonparticipating gas. Internal radiative heat transport modelled with RDA. | Solid-gas interface kinetics is implemented. Kinetics is implemented through the model developed by Keene et al.[29]. Only reduction is simulated. |
| Bala Chandran et al. [49], 2016 | Transient 3D model developed in ANSYS Fluent 15.0. | Isothermal, pressure-swing ceria redox cycle. Packed bed (εbed=0.45) of ceria porous particles (εp=0.75). | Volume-averaged mass and momentum conservation. Brinkman-Forchheimer law is used for momentum conservation. Binary mass diffusivities obtained from the Chapman-Enskog theory. | LTE is assumed between the solid and gas phases. | Combination of Monte Carlo ray tracing and a discrete ordinates model. | Reduction and CO2-driven oxidation are simulated. The kinetics from Bulfin et al. [41] is used to impose the thermodynamic equilibrium constraint, coupled with the CO2 thermal dissociation at high temperature. |
| Bader et al. [44], 2015 | 3D finite element model. | Isothermal, pressure-swing ceria redox cycle. Porous ceria particles, mm-scale porosity. Packed-bed cavity, indirectly irradiated (alumina tubes for the single reactive elements). Pressure drop and effective thermal conductivity are compared for a 65% porous monolith, packed bed of 5 mm 70% porous particles, 5 μm solid particles, and 92% porous RPC. | Extended Darcy’s law is used for the pressure drop estimation. | LTE is assumed between the solid and gas phases. | Monte Carlo ray tracing and RDA. | Thermal and linear elastic thermo-mechanical model of the isothermal redox cycle. No kinetics implemented. |
| Wang et al. [57], 2021 | 3D heat and mass transfer model. | Iron-manganese oxides. Packed-bed reactor. |
Mass and species conservation equations are solved separately for each phase. Momentum equation is solved only for the gas phase (solid phase is immobile). | LTNE - each phase (solid and gas) is described with its energy equation. | Radiative transport equation. | Global kinetics is implemented. |
| Lidor et al. [32], 2020 | 1D model. MONROE code (developed at DLR). | Macroporous ceria. ASTOR reactor. |
Darcy-Dupuit-Forchheimer law is used. | LTNE - each phase (solid and gas) is described with its energy equation. | RDA combined with Beer-Lambert law. | Equilibrium is implemented for ceria reduction (deduced/supposed). |
| Lidor et al. [46], 2021 | 1D model. MONROE code (developed at DLR). | Macroporous ceria. ASTOR reactor. |
Darcy-Dupuit-Forchheimer law is used. Oxygen exchange upon cooldown sweeping seems to be neglected. | LTNE - each phase (solid and gas) is described with its energy equation. | RDA combined with Beer-Lambert law. | Equilibrium is implemented for ceria reduction (as in Lidor et al.[32]) and oxidation (this latter is “supposed to be fast at every point in the reactor at each time step”). |
| Furler et al. [33], 2015 | In-house code, ANSYS CFX 14.0. | Single-scale porosity RPC ceria. Cavity receiver-reactor. | Mass, momentum, and species conservation equations expressed for the free-flow domains and the porous RPC domain. Momentum source according to Dupuit-Forchheimer law. | An interphaseal heat transfer coefficient is used, but LTE is imposed in practice through setting it artificially high (since diffusion is dominant over advection). | Radiative transfer equation. Radiatively participating RPC. | Only reduction is simulated, assuming equilibrium. “The reduction was modelled based on thermodynamic equilibrium, as previous work has shown that the overall kinetics were controlled by heat transfer”. |
| Zoller et al. [34], 2019 | 2D axysimmetric model. ANSYS CFX 17.0. | Dual-scale porosity RPC ceria. Cavity receiver-reactor. | n.a. | An interphaseal heat transfer coefficient is used, but LTE is imposed in practice through setting it artificially high. | Radiative transfer equation. Radiatively participating RPC. | Only reduction is simulated, assuming equilibrium. Heat transfer model. |
| Wang et al. [53], 2022 | 1D model. Axial macroscopic combined with radial mesoscopic model. | Porous ceria fixed bed. Directly irradiated. | Permeability tensor and flow resistance coefficient modelled by the Ergun equation. | LTNE. A radial mesoscopic heat transfer equation is also added to the solid phase. | P-1 model. | Reaction kinetics from Zhao et al. [54] is implemented for the H2-driven reduction and the H2O dissociation. |
| Dai et al. [55], 2022 | 1D model developed in COMSOL Multiphysics® 5.3. | Macroporous ceria. Directly irradiated. | Darcy-Brinkman-Forchheimer model is used for momentum conservation. | LTNE. | P-1 model. | The kinetics of both thermal reduction and H2O-driven oxidation is simulated with a similar approach as proposed by Bala Chandran et al. [49] and expressing the rate parameter as a function of temperature and reacting surface area. |
| Pan et al. [50], 2021 | 2D axisymmetric steady-state model. COMSOL Multiphysics®. | Oxygen-permeable ceria membrane reactor. | Navier-Stokes equations in the gas phase, no porous media (ceria dense membrane). Binary mass diffusion coefficients obtained from the Fuller-Schettler-Giliding equation. Oxygen ions migration in the membrane described by Fick's law. | No porous media. Convective heat transfer in the gas phase, and conductive heat transfer in the membrane. Simplified isothermal wall assumption. | Radiation is not modeled. | Reduction kinetics according to Bulfin et al. [41]. Oxidation kinetics according to Le Gal et al. [51]. A rate modification constant was included to consider the surface reaction on the ceria membrane. |
| Li et al. [36], 2020 | 3D model. ANSYS Fluent 17.1. | Single tube reactor featuring a downward ceria particle flow counter to an upward inert gas flow for ceria reduction. | Discrete particle phase studied with a Lagrangian-tracking approach. Gas phase resolved as a continuum with an Eulerian volume-averaged approach. Ambipolar diffusion is modelled within the ceria particles. | Isothermal conditions: . |
Radiation is not modeled. | Reduction kinetics is modelled according to Keene et al. [29], [30] and Bulfin et al. [41]. |
| Zhang and Smith [37], 2019 | 3D transient model. Soltrace software and STAR-CCM. | Directly irradiated, inert-swept partition-cavity solar thermochemical reactor, with a packed bed of CeO2 particles as the reactive material. | Mass conservation in the fluid and particle phases are coupled defining a CeO2 particle mass transfer rate from the rate equation as the O2 source. | The energy transfer between the fluid phase and the discrete particles is modelled through a convective heat transfer coefficient between the two phases. | Radiative transfer equation in the packed bed of particles. | Reduction kinetics is modelled according to Ishida et al. [42]. |
| Huang and Lin [45], 2021 | 3D steady-state non-isothermal model. COMSOL Multiphysics®. | Windowed (directly irradiated) and window-less (indirectly irradiated) designs. | Brinkman equations are implemented for mass and momentum conservation. | LTNE. | P1 approximation in the porous medium coupled to Surface-to-Surface radiation within the cavity and window. | Chemistry is not modelled. |
| Ma et al. [38], 2024 | 3D transient model. | Directly irradiated receiver-reactor containing a porous structure made of CeO2-ZrO2. Details on the morphology are not given explicitly. | Brinkman equations are implemented for mass and momentum conservation. | Heat transfer assumption in the porous medium not explicitly reported. | Approximation used not clearly stated. | Reduction kinetics is modelled according to Bulfin et al. [41]. |
| Wei et al. [58], 2024 | ANSYS Fluent 16.0 coupled with the Monte Carlo method. | Dense ceria tubular membrane reactor integrated with heat recovery for continuous fuel production. | Darcy-Brinkman-Forchheimer model is used for the momentum conservation. | LTNE in the alumina RPC. | Radiative transfer equation. | Kinetics is not implemented. |
| Lougou et al. [59], 2018 | Model developed in COMSOL Multiphysics® 5.3. | Porous NiFe2O4. | Brinkman equations are implemented for mass and momentum conservation in the porous medium. | Heat transfer assumption in the porous medium not explicitly reported. | RDA in the porous medium coupled to Surface-to-Surface radiation. | Chemistry is not modelled. |
| Li et al. [39], 2016 | 3D transient heat transient model. | Indirectly irradiated cavity receiver-reactor; an array of tubular absorbers with ceria particles packed bed loading. | Fluid flow governing equations are not reported (only heat transfer and thermal reduction model). | LTE. | Collision-based Monte Carlo ray tracing model inside the cavity. RDA in the porous bed. | Only reduction is simulated. Ceria is supposed to be at thermodynamic equilibrium (i.e., no kinetics is modelled) according to Bulfin et al. [41]. |
| This work | 1D model developed in COMSOL Multiphysics® 6.2. | Macroporous ceria. Directly irradiated. | Darcy-Forchheimer law is used. Binary mass diffusivities obtained from the Chapman-Enskog theory. | LTNE. | RDA. | Reduction kinetics is modelled according to Bulfin et al. [41]. Oxidation kinetics is modelled according to Arifin et al. [60], rearranging the apparent kinetic law into a local kinetic law. |
2. Model
The model, run in a commercial finite element analysis software (COMSOL Multiphysics®, release 6.2), solves the complete ceria redox cycle, composed of a thermal reduction under an inert swept gas flow (N2) and H2O-driven oxidation for hydrogen production (see Table 4 for the redox cycle conditions). The inert-swept reduction option was investigated in the literature as one of the possible oxygen removal strategies, with predictions of viable efficiencies when suitable reactor configurations and heat recovery strategies are implemented [61]. Also, previous modelling works assumed inert sweep during reduction, both for volumetric receiver-reactor [32] or counter-current, direct-contact particle-based reactor [20] concepts. Reaction kinetics are solved together with heat and mass transport across the porous OC. A 1D geometry is considered, with the domain corresponding to the porous structure irradiated from one end. Figure 1 gives a visualization of the 1D geometry represented as a cylinder, although no radial coordinates were considered in the model. The OC’s diameter and irradiated area (Table 2) are used in the model to define the pointwise mass flux in fluid flow physics and to define the cross-sectional area of the domain in heat transfer physics. Similar models were developed in literature [32], [46], [53], [55], but either thermodynamic equilibrium was assumed for both steps of the cycle [46] instead of detailed redox kinetics, or H2-assisted reduction was considered [53], or different approaches for the kinetics treatment were followed, such as by applying the law of mass action and introducing an oxidation rate parameter to be related to the kinetics of the reaction [55]. Below 1000 °C, the H2O-driven ceria oxidation is reported to be controlled by surface kinetics rather than by thermodynamics [55], [62], calling for the modelling investigation of the oxidation kinetics when dealing with temperature swing redox cycles. Thus, to the best of our knowledge, there is a lack of heat and mass transport models that readily and easily implement the redox kinetics of the entire thermally driven cycle, utilizing apparent kinetic laws derived from experimental data. Although the research effort to model the ceria thermochemical cycle with this solid-state apparent kinetics approach [52], [60], only sparse examples can be found in the literature making use of this form of the rate equation at the reactor level, and without clear details on their implementation. This kind of kinetic law can be extracted from any material intended to be modelled for this application, and the rate equation takes the same analytical form. This gives our approach a wide applicability, as highlighted in Section 4. The governing physics implemented in the model are reported below.
2.1. Geometry
Geometric parameters adopted in the model are reported in Table 2.
2.2. Mass and Species Conservation
The species balance considers the N2/O2 mixture upon thermal reduction (i.e., O2 released by ceria), and the N2/H2O/H2 mixture upon H2O-driven oxidation. Nitrogen has been used as inert gas in both reduction and oxidation steps of the model to adjust the partial pressure of reactants to the levels of the references adopted for the kinetics. A background O2 molar fraction of 10-6 is maintained during oxidation as well. The latter choice is made to ensure the validity of the kinetic law selected during the reduction step [41], obtained in the oxygen partial pressure range of 10-2 – 10-8 bar. This is also coherent with real systems, in which achieving ideal gas tightness from the external ambient air is not practically feasible. Notice that previous works implemented the H2O splitting equilibrium and used the equilibrium O2 partial pressure as the parameter driving the thermodynamics, without including O2 in the mass balance and the chemical species transport [64]. Although this could be readily done in the model presented herein, this would imply using the equilibrium nonstoichiometry function outside of the validity range. Thus, as a first choice, a fixed O2 partial pressure was imposed. This aspect will be detailed in follow-up models, considering the full oxygen partial pressure dependence, and considering suitable equilibrium nonstoichiometry functions and/or experimental data. A concentrated species model has been employed, in which the chemical species are assumed to be present in the mixture in comparable amounts, rather than having a predominant component with the other being present in minor amounts, and the mixture’s properties are then evaluated as a function of the mixture’s composition. The equation that solves for the mass fraction of the ith species in the fluid phase is the following:
is the rate of species source or sink coming from the solid-gas reactions, as detailed in Section 2.4, is the molar fraction of the kth species in the ideal gas mixture, is the molar mass of the ith species, and is the diffusion coefficient of the ith gas in the mixture, following Equations (7)-(9) according to Chapman-Enskog theory [65].
is a characteristic length, and is the diffusion collision integral, a function of gas species and temperature [65].
2.3. Momentum Conservation
Since the problem deals with low flow rates and thus low Reynolds numbers (< 100), the flow regime is assumed to be laminar. The flow analysis is performed using the Darcy-Forchheimer law:
The fluid viscosity is denoted by , the permeability by , the Forchheimer coefficient by , and the fluid density by . Details on the effective transport properties can be found in Section 2.8, whereas the physical properties of the fluid and solid phases are summarized in Section 2.7.
2.4. Reaction Kinetics
2.4.1. Thermal Reduction
During thermal reduction, the redox kinetics proposed by Bulfin et al. [41] are implemented via Equation (11), with being the nonstoichiometry as defined in Equations (1)-(3). resulted in the maximum value that can reach to retain the ceria fluorite phase and keep the kinetic equation valid [41].
Then, the oxygen source , expressed in , for the oxygen transport equation is derived as follows, with being the ceria porosity:
The proportionality constant between the nonstoichiometry variation and the mass source was defined as for simplicity. In the model, the reverse partial differential equation (PDE), Equation (13), is then solved to find the nonstoichiometry field, , across the porous medium.
Kinetic parameters are summarized in Table 3.
2.4.2. H2O-Driven Oxidation
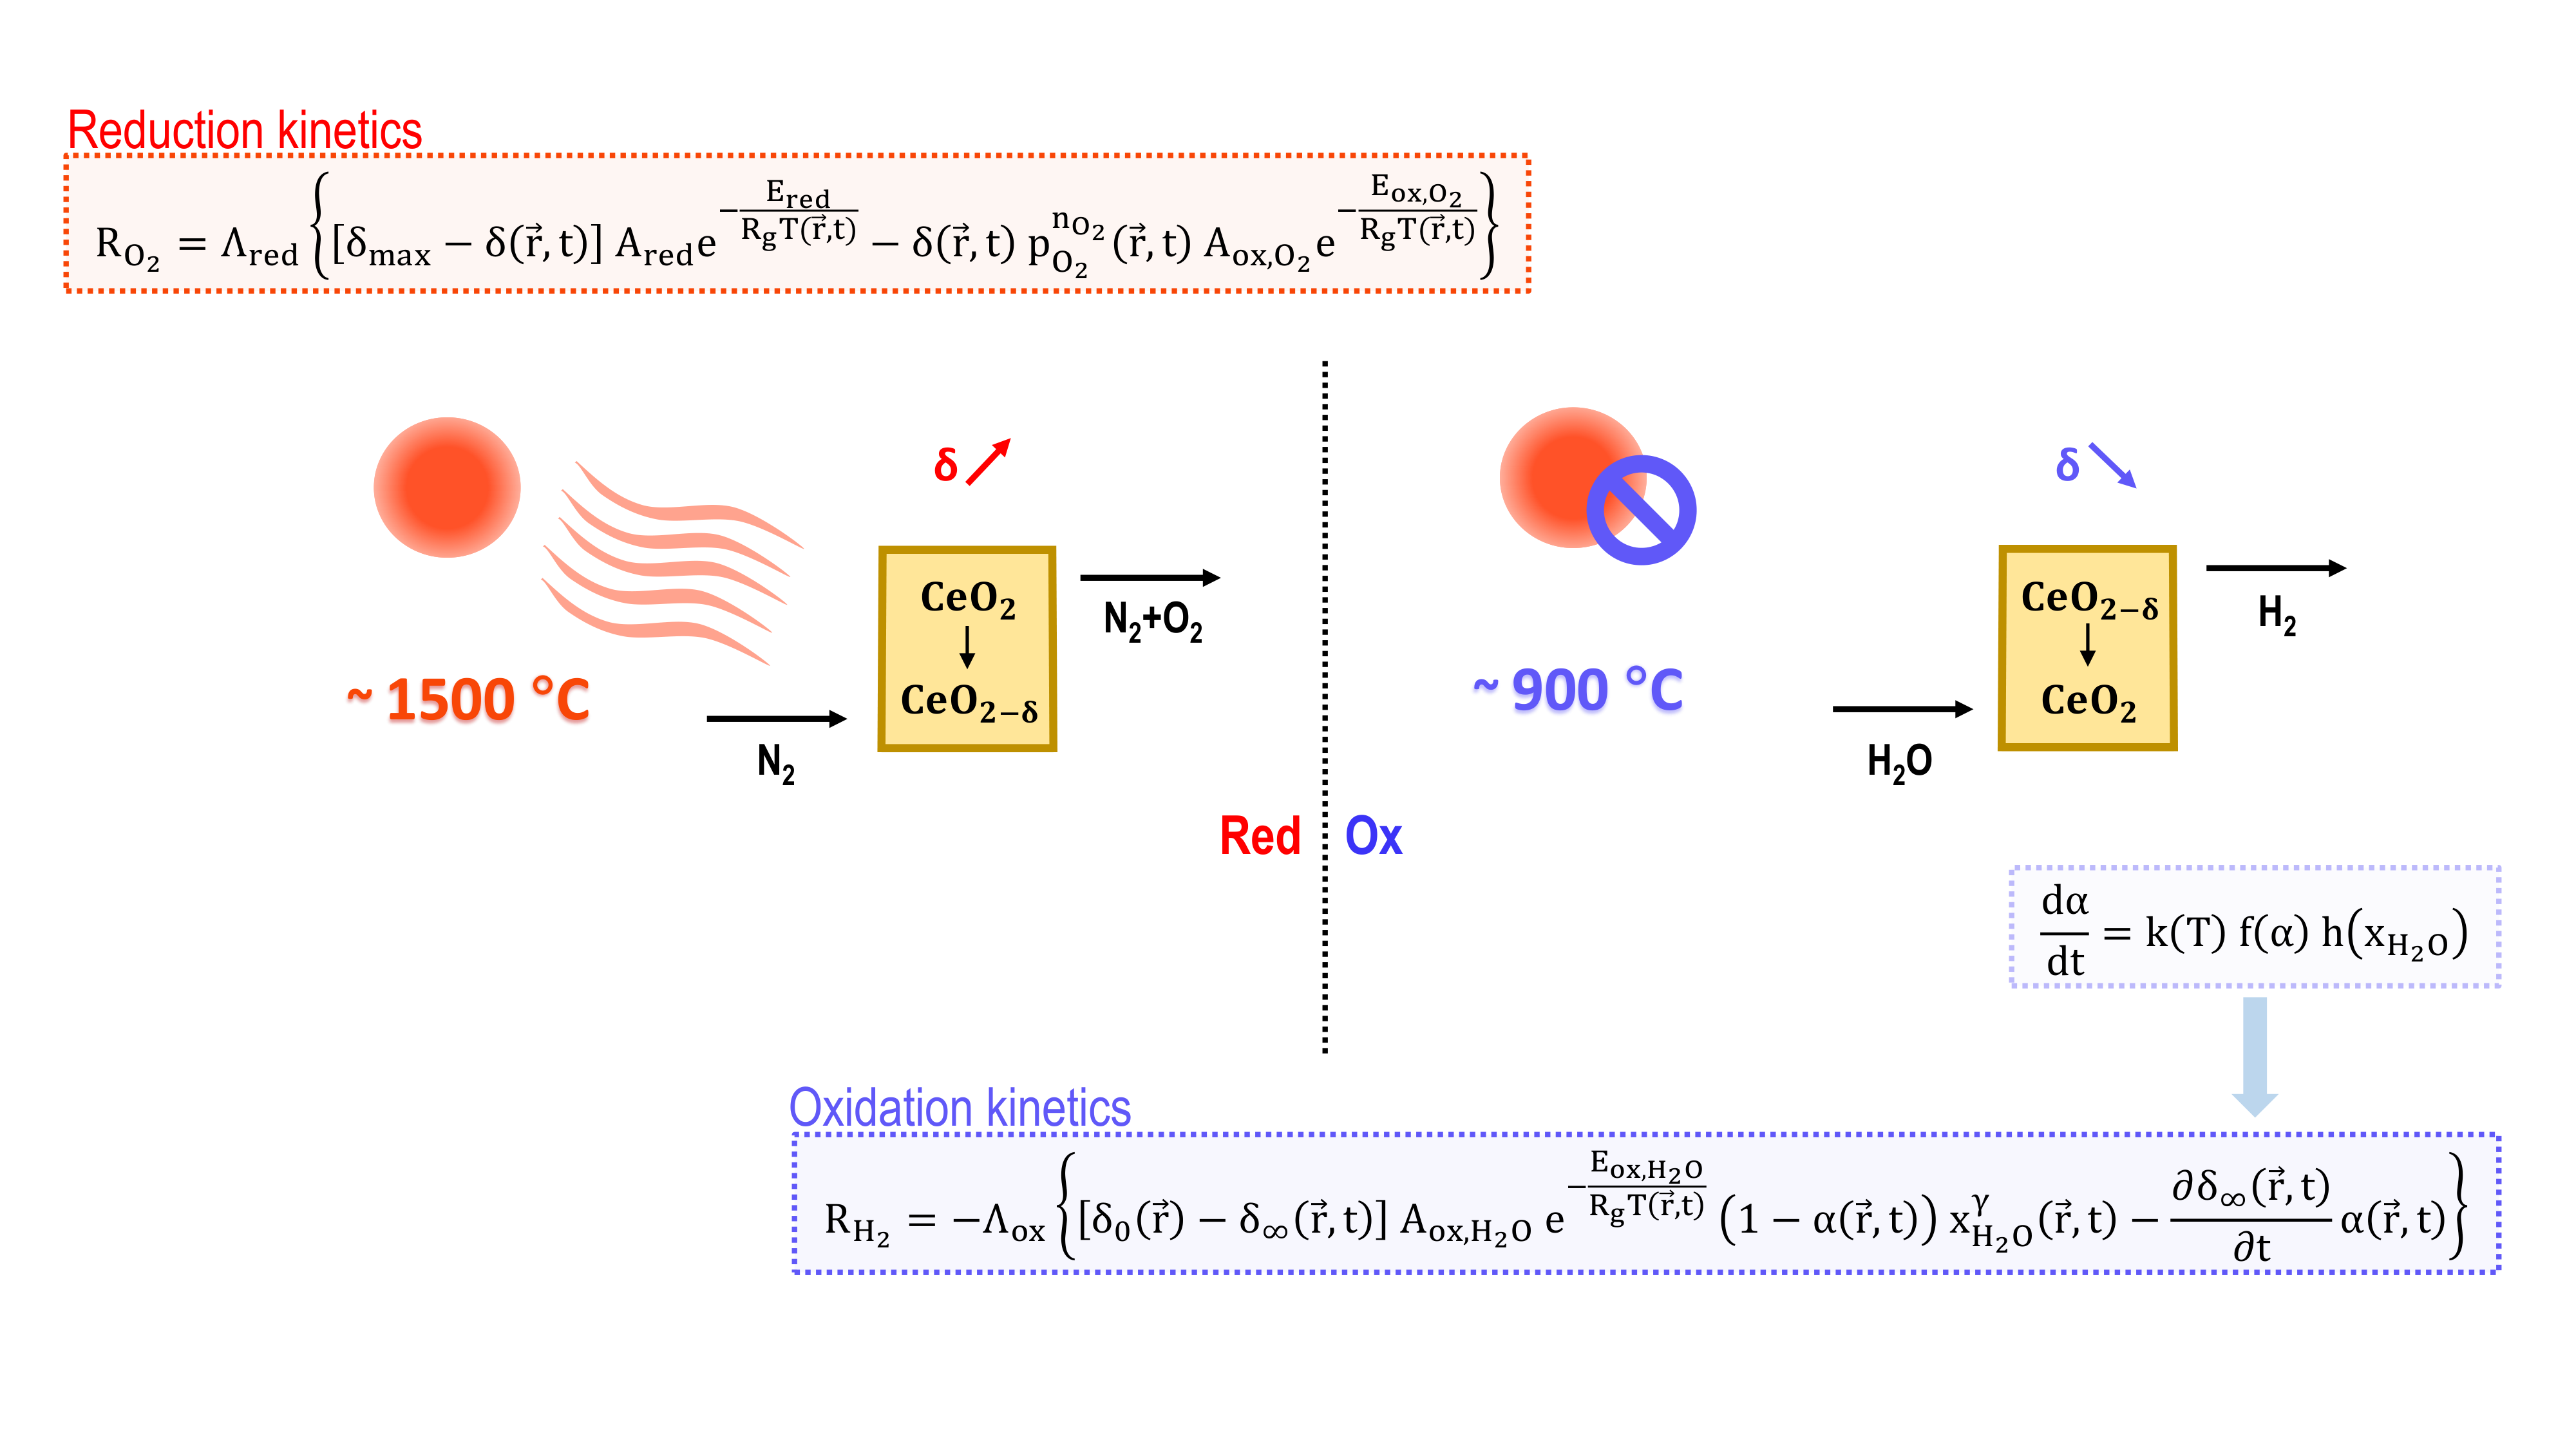
For the oxidation step, apparent kinetics from solid-state reaction theory [40] is adapted, starting from the kinetic law experimentally found by Arifin et al. [60] as given by Equation (14):
The solid conversion , spanning from 0 (start of the reaction) to 1 (reaction completed), expresses the reaction progress. The temperature dependence is separately embedded in the rate constant, expressed through Equation (15) when written in the Arrhenius formulation, with being the preexponential factor and being the apparent activation energy for the oxidation reaction. Equation (16) models the dependence on the reaction progress. The dependence from the ith gas reactant concentration – here expressed in terms of molar fraction, – is included through the function. The power law functional form shown in Equation (17), in which is the reaction order [52], assumes that gaseous products are efficiently removed from the reaction zone such that the backward reduction reaction is prevented [40]. Kinetic parameters are collected in Table 3. This kinetic analysis reported by Arifin et al., in agreement with thermodynamic data published by Panlener et al. [66], ensures that the ceria oxidation can proceed up to completion (zero nonstoichiometry) in the operating conditions investigated, apart from kinetic limitations. According to this kinetic law, the H2O-driven ceria oxidation can be expressed through a first-order model (F1). In the reference work [60], the apparent kinetic parameters were extracted after having stripped all the experimental artefacts coming from the setup – such as gas-phase dispersion, oxidant mixing, and detector time lag – from the mass spectrometry signals, to correctly get the intrinsic kinetic behaviour of the process. We should also mention that to be reliable, this type of rate equation requires a thorough control of the experimental conditions in which they are obtained; in particular, the experimental procedure should ensure that the set-point temperature, that is, the temperature value used in the kinetic fitting, equals the sample’s temperature [40]. This also means that heat and mass transfer limitations during the experimental kinetic tests should be minimized via accurate verification against the sample mass [67]. These precautions lead to a uniform reactivity throughout, and thus to an accurate correlation between experimental conditions imposed (temperature, gas atmosphere) and observed reaction rate.
The used kinetic law describes the water-splitting reaction over ceria making use of a single-step rate equation [40], that is, the reaction can be fully described by using one single kinetic mechanistic model [60]. However, as a further necessary consideration, it is worth mentioning that, even if the apparent kinetic law can be expressed using one single mechanism, this does not necessarily mean that the reaction under investigation proceeds in one single step [40]. It is rather the case that the slowest step in the reaction mechanism controls the overall reaction rate, resulting in the observed apparent kinetics [40]. In the specific case, the water-splitting reaction over nonstoichiometric ceria was reported to feature a multi-step mechanism involving surface and bulk diffusion steps, as described by Zhao et al. [54]. Thus, using this kind of rate equation features an inherent reliability in simulating the overall reaction dynamics; nonetheless, a relatively low computational complexity can be pursued, since the detailed single reaction steps do not need to be implemented one-by-one.
Apparent kinetic laws of this type are usually obtained experimentally as global, bulk correlations. However, the global kinetic information needs to be converted into local terms, to be implemented in reactor modeling. We thus assume that the apparent kinetic law was obtained in sufficiently controlled experimental conditions that the sample reacted uniformly without heat or mass transfer limitations, and that the extracted kinetic parameters are representative of a point-like, uniform reaction. At this aim, the solid conversion is here expressed as follows:
This allows to express the solid conversion as a function of the nonstoichiometry of the OC instead of as a function of the sample mass, thereby addressing a local dependence instead of a global, bulk dependence. is the nonstoichiometry field at the initial time (i.e., just after the reduction step), while is the nonstoichiometry towards which the ceria system converges in the thermodynamic equilibrium limit, and it is expressed according to Bulfin et al. [41] as a function of the local temperature and oxygen partial pressure:
has the same meaning as in Equation (11). Equation (18) can be rearranged as follows:
Thus, differentiating both sides of the equation and taking into account the stoichiometry of the oxidation reaction (Equation (2)), the H2 mass source term expressed in is derived and implemented in the respective transport equation:
Notice that a term depending on the thermodynamic equilibrium state of the system appears explicitly (i.e., last term on the right-hand side: ), with a boosting effect on the oxidation kinetics when the equilibrium nonstoichiometry rapidly decreases due to the switching operating conditions passing from the reduction to the oxidation step (i.e., this term becomes positive when is negative). Moreover, notice that we simplified the dependence notation for the equilibrium nonstoichiometry, since . The H2O mass sink (expressed as a negative source) follows directly:
Thus, the final form of the PDE as solved by the model during the oxidation phase is:
having defined . Notice that the oxidation kinetics depends only on the reactant (H2O) concentration, and not on the chemically reducing product of the oxidation reaction, consistently with the kinetic law.
For the sake of completeness, we should also mention that in case of mass transfer or diffusion limits the reaction at the reactor level, the rate equation could require some calibration to well fit the up-scaled system concerning the reference lab-scale setup, similarly to Li et al. [36]. Although this point was not directly addressed in the present work because of the simple 1D configuration, the authors are considering these aspects of detail in advanced 2D+ model simulations that include more complex OC morphologies, and results will be reported in upcoming publications. To further accentuate this point, we stress that the oxidation model validation (see Section 2.10) was performed using the same kinetic parameters used in the reference work [60], leading to excellent agreement with our model results.
2.5. Energy Conservation
For energy conservation, the Local Thermal Non-Equilibrium (LTNE) assumption between the solid and fluid phases is adopted. Thus, a single energy equation for each phase is implemented. The solid phase is considered as radiatively participating, while the gas phase is modelled as radiatively nonparticipating, as commonly assumed throughout the literature (see Table 1).
The energy conservation for the solid phase is given by Equation (24), with the equivalent radiative flux expressed in the conductive form (see Section 2.8) following Equation (25), the reaction heat following Equations (26)-(27), and the oxygen vacancy formation enthalpy for ceria obeying to Equation (28), this latter following Bulfin et al. [68]. The specific surface area and the interfacial heat transfer coefficient are calculated from literature correlations (see Section 2.8).
Notice that the exothermic heat from the oxidation phase was neglected in previous works [46]. Moreover, notice that the global oxidation kinetics that is being used in this work was obtained in the temperature range of 750–950 °C [60]. Exothermic heat increases the temperature in the domain, leading to operate in a temperature range slightly out of the validity range of the kinetic law. However, this approximation is considered valid for this work, and this kinetic law was implemented here in the absence of alternative correlations.
The fluid phase consists of a mixture of N2/O2 during reduction, and of N2/H2/H2O during oxidation, with all the thermophysical properties summarized in Section 2.7. The corresponding energy conservation is given by:
Thus, the reaction heat is assumed to develop in the solid phase and to be transferred to the fluid phase by interfacial convection.
2.6. Initial and Boundary Conditions
2.6.1. Initial Conditions
The initial conditions adopted in the model are reported in Table 4. In the simulations, the first cycle starts from a steady system at ambient temperature. Ceria is supposed to be fully oxidized (i.e., ) at the beginning of the first redox cycle, which starts with the reduction step. All the following cycles use the previous solution as the new initial values for all the relevant solution fields (i.e., nonstoichiometry, nonstoichiometry time derivative, absolute pressure, solid and fluid temperature). This is valid for both reduction and oxidation steps. At the beginning of the oxidation step, the H2O concentration is supposed to switch linearly from zero up to the nominal considering an imposed switching time of 1 min. This is consistent with real systems, in which an ideally instantaneous switching front cannot be established and facilitates the transition from reduction to oxidation by reducing computational instabilities.
Table 4.
Initial and boundary conditions adopted in the model.
| Initial or boundary condition | Value | Units |
|---|---|---|
| Mass and species conservation | ||
| Initial O2 molar fraction (first reduction) | 10-6 (balance N2) | |
| Initial H2 molar fraction (oxidation) | 0 | |
| Initial H2O molar fraction (oxidation) | 0 | |
| Inlet O2 molar fraction (reduction and oxidation) | 10-6 (balance N2) | |
| Inlet H2 molar fraction (oxidation) | 0 | |
| Inlet H2O molar fraction (oxidation) (base case | parametric range) |
0.2 | 0.2 – 0.4 (balance N2) | |
| Momentum conservation | ||
| Initial pressure (first reduction) | 1 | |
| Inlet volume flow rate during reduction (base case | parametric range) |
1 | 0.5 – 2 | |
| Inlet volume flow rate during oxidation | 1 | |
| Outlet pressure | 1 | |
| Reaction kinetics | ||
| Initial nonstoichiometry (first reduction) | 0 | |
| Initial nonstoichiometry time derivative (first reduction) | 0 | |
| Heat transfer | ||
| Initial temperature (first reduction) | 25 | |
| Inlet fluid temperature (reduction | oxidation) | 25 | 300 | |
| Incident radiative power (reduction | oxidation) | 1.5 | 0.5 | |
| Inlet boundary | Re-radiation towards | - |
| Outlet boundary | Thermal insulation | - |
| Other | ||
| Oxidation switching time | 60 | |
| Step duration (reduction | oxidation) (first cycle) | 5000 | 600 |
2.6.2. Boundary Conditions
Together with the initial conditions, the boundary conditions implemented in the model are reported in Table 4. The inlet volume flow rate was chosen in the order of 1 L/min to be coherent with the gas analysis equipment of our laboratory [69], which will be used in future prototype experimental campaigns to validate the model. Also, the radiative power was chosen coherently with our solar dish receiver [70] (nominal concentrated power of 2.8 kW in optimal conditions, with temperatures in the focus up to 1800 °C), which will be used in future experimental testing. The cycle steps duration matches the values assumed in Lidor et al. [32] and Arifin et al. [60] for reduction and oxidation, respectively.
2.7. Physical properties
2.8. Morphological and Effective Transport Properties
The porous ceria structure is considered as a statistically homogeneous and isotropic macroporous medium, coherently with the morphology correlations used in [73]. It should be noted that alternative and more efficient structures were engineered recently for thermochemical fuel processing, such as RPC monoliths featuring dual-scale porosity [27] or even hierarchically channelled structures [74]. Thus, the analysis conducted in this work is being detailed and extended to more sophisticated and efficient porous structures in follow-up studies. It is noted how some previous works also considered dual-scale porosity RPC structures with a surface absorption-emission model coupled with a lumped capacity model, thus neglecting the volumetric radiative heat transfer to reduce the computational cost [23]. Herein, the porosity ε was fixed at 0.7, a value already used in previous modelling works for similar morphologies [32], [46]. The specific surface area and the mean pore diameter were considered to be a function of ε following Equations (30)–(31), according to Suter et al. [73].
Permeability and Dupuit-Forchheimer coefficient appearing in the momentum conservation equation are described by Equations (32)–(33), following the corrected Carman-Kozeny model and the Cooke’s correlation, respectively [73].
The Nusselt number () for computing the interfacial heat transfer coefficient, , that models the LTNE is described by Equation (34) [73], with and [75].
The internal radiative heat transfer is modelled with the Rosseland Diffusion Approximation (RDA) for optically thick media [76], widely used in the literature for simulating solar reactor systems [29], [30], [31], [32], [44], [46], [47]. Thus, the effective radiation conductivity is computed as per Equation (35), in which is the Rosseland mean extinction coefficient following Equation (36) [73], [77], is the Stefan-Boltzmann constant, and is the refractive index of the medium, assumed to be unity in this study [30], [31]. Although RDA represents the simplest way to model the internal radiative heat transfer in this type of system [28], it is assumed to be valid for this work, which focuses on the implementation of the redox kinetics by using a simple analytical approach that can fit a large number of solar thermochemical nonstoichiometric reaction systems and can be coupled also to more complex radiation modelling methodologies. More detailed radiation modelling will be addressed in follow-up works.
2.9. Numerical Methods and Computational Optimization
The mesh of the 1D domain was refined until the grid independence was achieved. Both a uniform mesh and an increasing-size cell mesh were compared, with the latter resulted to be more suitable to capture the fast radiative heating at the boundary during reduction. Thus, the cell size is finer at the irradiated inlet boundary and gets coarser towards the outlet boundary. The grid independence was checked by taking the O2 production rate at 2000 s during the reduction step of the first cycle, when the time derivative is large. Spanning from 50 to 104 cells, a final value of 1500 increasing-size cells was selected (with a maximum-to-minimum cell size ratio of 3), as this value ensures that grid independence is achieved while balancing computational cost. An in-software adaptive time-stepping scheme was adopted, with the initial time step maintained sufficiently low (< 10-6 s) in all the simulations, to better catch the fast initial dynamics of the process in both cycle steps – fast radiative heating upon reduction and fast H2 generation upon oxidation. The model solves the time dependency using the second-order Backward Difference Formula (BDF) and a direct, fully coupled solver.
2.10. Validation
The model was validated through comparison with experimental data from the literature, for both reduction and oxidation steps, extending the simulation to a more accurate 2D axisymmetric geometry. The reduction model was compared against data from Davenport et al. [62], with the reference experimental conditions summarized in Table 6. As shown in Figure 2a-b, reporting the comparison at 50 °C/min and 150 °C/min heating ramps, respectively, the O2 production rate and the cumulative O2 yield from the model simulation match the experimental profiles with high agreement. Slight differences are attributed to experimental uncertainty, such as in the rate measurement and the instantaneous temperature of the sample as well as of the inlet gas.
Table 6.
Experimental conditions were implemented in the simulation for reduction model validation [62].
Table 6.
Experimental conditions were implemented in the simulation for reduction model validation [62].
| Parameter | Experimental value [62] |
|---|---|
| Ceria mass (g) | 0.46 |
| Ceria bulk porosity (-) | 0.86 |
| Inner diameter (cm) | 0.635 |
| Temperature ramp (°C/min) | 50 or 150 |
| Initial temperature (°C) | 805 |
| Final temperature (°C) | 1488 |
| Inlet flow rate (sccm) | 463 |
| O2 inflow (ppm) | 10.8 |
| Reference conditions | 0 °C, 1 atm |
The oxidation model results in terms of hydrogen production rate profile were validated against data from Arifin et al. [60], with reference experimental conditions summarized in Table 7. As depicted in Figure 3, the H2 production rate curve in time agrees well with the experimental profile. As clearly stated in the reference work [60], the delay in the onset of H2 signal is due to dispersion, mixing, and detector time lag inherent to the experimental apparatus, and not to the water-splitting chemistry. After the initial lag of around 100 s, the simulated profile follows the experimental rate profile with excellent agreement.
3. Results and Discussion
First, results on the first redox cycle are reported to demonstrate the robustness of the model. Concerning reduction (Section 3.1), results are reported in terms of temperature and oxygen partial pressure fields in the porous medium, as well as in terms of nonstoichiometry distribution achieved. Concerning oxidation (Section 3.2), results are reported, most notably, in terms of nonstoichiometry and solid conversion distribution in the porous medium. As mentioned, this capability of the model discloses the possibility to extend the spatial distribution analysis even in complex geometries, and to optimize the redox material utilization and reactivity with fluid flow and heat transfer synergically. Then, the results in terms of nonstoichiometry field and hydrogen production rates are observed upon tuning some design and operational parameters, such as the inert mass flow rate and the H2O concentration in the feed (Section 3.3.1 and 3.3.2). It must be highlighted that parametric studies on similar systems are already available in the literature, with a close look to the effect of the inert gas inlet temperature and mass flow, radiation flux on the exposed boundary, and porosity [32], as well as porosity distributions [55]. However, this detailed and extensive parametric investigation fully makes sense when dealing with more specific reactor geometries, for which operational parameters are already well-defined [46]. This calls for the model extension to higher dimensionality beyond 1D simulations, and ongoing investigations of the authors are addressing these upgrades. Thus, although the model is not geometry-specific (apart from considering consistent geometrical features from the literature – see Table 2), qualitative information on the system operation is extracted from the kinetic simulations and from narrowed parametrization, to assist future studies involving higher dimensionality. Most importantly, besides experimental validation, the validity of the redox model is further demonstrated by looking at the oxygen balance in the redox cycle. Then, optimal conditions are implemented in a multiple-cycling simulation to directly observe the stabilization of the numerical solutions.
3.1. Reduction: 1st Cycle (Base Case)
Figure 4 shows the system behaviour during the first reduction step, considering an initial heating of the system at a constant incident radiative power of 1.5 kW and lasting 5000 s. This amount of time is sufficient to reach typical ceria reduction temperatures around 1500 °C, with steady-state heating compensated by re-radiation losses at the inlet boundary in the present simulation. Temperature and oxygen partial pressure in the system, that govern the redox thermodynamics, are reported in Figure 4a-b against the spatial coordinate. Results are coherent with previous modelling works in terms of similar temperature, oxygen partial pressure, and nonstoichiometry trends [29], [32], corroborating the validity of the physics implementation. Figure 4a reports the solid and fluid temperature in space, showing that interfacial convection is large enough to ensure thermal equilibrium between the two phases from just a few millimetres behind the irradiated boundary. A temperature gradient develops, with steady-state temperatures at the outlet section around 1450 °C. The oxygen partial pressure in the porous medium tends first to increase in the first half of the porous bed (curve after 1000 s, Figure 4b) and to stabilize to an equilibrium value, with oxygen being advected downstream [29]. With temperature gradually increasing at deeper lengths in the porous medium, the oxygen starts to be released accordingly, until the reactivity starts to decrease because of approaching the equilibrium state. Figure 4c-d shows the nonstoichiometry field across the porous medium against the spatial coordinate and in time, with a nonstoichiometry gradient developing along the porous structure as a consequence of its optical thickness and leading to a larger extent of reduction near the irradiated boundary under the assumptions of this work. Also, it results in that thermodynamic equilibrium is practically achieved along the whole length (Figure 4d), since the and curves appear overlapped along the entire reduction duration. Local equilibrium was already experimentally observed for ceria-based compositions during thermal reduction in previous reports [41], [78], in which the reduction reaction resulted to be limited by heat transfer (i.e., experimental heating ramps). The molecular oxygen released upon the first reduction amounts to around 6.5 mmol in the reactive bed, against 62.7 mmol that would be obtained with a uniform nonstoichiometry of 0.1 in the entire domain.
It is worth mentioning that a highly non-uniform nonstoichiometry distribution across the porous active material, as the one observed in our simplified 1D geometry (Figure 4c), represents a bad utilization of the redox active material, and as such, a source of inefficiency in the process. In the specific case, the low nonstoichiometry in the downstream part of the 1D reactor mainly comes from the increasing pO2 along the flow direction, which hinders further reduction in the investigated conditions. Alternatively, the same undesired behaviour can be observed if the volumetric radiative absorption is not sufficiently effective to ensure a uniform temperature distribution – remember that we are implementing here simplifying assumptions for the internal radiative heat transfer. Overall, the design of efficient solar receiver-reactors should pursue a reduction extent across the active material as uniformly as possible [74], to efficiently utilize the available OC, and maximize the fuel production yield. Thus, it appears clear how detailed multiphysics modelling, such as the geometrically simplified case proposed herein, is of paramount importance for an efficient reactor design, allowing to predict possible sources of inefficiencies needing optimization and refinement.
3.2. Oxidation: 1st Cycle (Base Case)
After the first reduction, the solution fields at 5000 s were taken as the initial conditions for running the oxidation step. The water inflow was not set up as a step-function plug flow, but a switching time of 1 min was imposed, such that to reach the nominal water concentration linearly in time. As mentioned, this is consistent with real systems, in which a perfect plug flow front cannot be realized, and reduces computational instabilities during transition. Figure 5a-b depicts the nonstoichiometry field evolution in the porous domain, in space and in time, respectively. The left part of the domain oxidizes faster, due to the higher water content of the entering flow. As shown, 10 min is a far sufficient time to oxidize the entire domain, with a nonstoichiometry almost uniformly approaching zero already after 5 min. Similar information can be gathered from Figure 5c-d, showing the evolution of the solid conversion field in a specular way, and approaching the unity value after 300 s. Figure 5e shows the H2 source in the ceria domain at different time instants, with fast reactivity in the exposed boundary, and a production peak shifting in the flow direction as the reaction goes to completion. Finally, Figure 5f reports the hydrogen volumetric flow rate at the outlet along the entire oxidation step. A sharp peak appears at the beginning, with the maximum located just after the water has reached the nominal inflow concentration in the imposed switching time of 60 s, and then decreasing to near zero values in less than 500 s. The total hydrogen produced in the first oxidation step gives a reoxidation extent around unity in terms of oxygen mass balance, confirming the consistency of the redox model. Also, a radiative input of 0.5 kW was imposed to thermally sustain the reaction. However, in principle, this feature could be modulated and controlled dynamically or even turned off during the oxidation phase of the cycle. Here, this external power was maintained to ensure a steady state temperature in the range of 900 – 1000 °C upon oxidation, and it is within the operating range of our concentrating solar dish [70] that will be used in future experimental campaigns.
3.3. Parametric Study
The thermochemical performance of volumetric, directly irradiated solar receiver-reactors is highly dependent on the morphological features of the reactive porous absorber [73]. Porosity and specific surface are considered the most relevant factors impacting the effective transport properties of the porous medium. Bulk porosity was previously investigated as one of the parameters that can be tuned for controlling the reactor behaviour. Lidor et al. [32] report how an increase in this feature leads to a lower average temperature throughout the porous bed, thus to a lower nonstoichiometry, and eventually to a lower overall reduction extent. A promising direction is to consider non-uniform porosities across the active bed, allowing the radiation to penetrate deeper into the porous structure thereby allowing a more uniform temperature field [74]. A higher porosity at the irradiated boundary would allow for a deeper penetration of the incoming radiation, an effect that was addressed in similar previous studies through the Beer-Lambert exponential law coupled to RDA [32], [46]. Interestingly, Dai et al. [55] investigated continuous porosity distribution functions in the porous medium. The authors revealed that a higher porosity on both the boundaries can be beneficial for the system performance, since this configuration reduces the radiation losses from the front boundary, and the conduction losses from the solid phase from both boundaries, insulating the reactor core. However, in the absence of radiative attenuation effects as supposed in the present work, a change in the porosity would have a direct effect only on the equivalent radiative thermal conductivity, through the porosity-dependent extinction coefficient. Thus, this effect is not addressed here and will be described in future works where the redox kinetics will be coupled to a more detailed radiative heat transfer modelling. Moreover, when dealing with porosity, the overall ceria load in the reactor, i.e., the effective density of the structure – defined as the ceria mass per total volume –, is considered one of the most important performance metrics in this kind of solar reactor, since a trade-off between a sufficiently high effective density and a sufficiently uniform heating in the structure should be addressed [74]. A parametric study addressing the porosity in such a way as to not impact this indicator would thus be reasonable in principle.
Maintaining the porosity as uniform in space and fixed for all the simulations, the parameters studied herein as impacting the redox kinetics are the inert flow rate during the reduction step and the water concentration during the oxidation step.
3.3.1. Sweeping Gas Flow Rate During Reduction
Figure 6 shows the impact on the system behaviour of a variation of the sweeping N2 flow rate during the first reduction, considering both a halved value and a doubled value compared to the base case (1 L/min). Figure 6a-b reports the ceria temperature and the O2 partial pressure in the system against the spatial coordinate, respectively, that govern the reduction thermodynamics, and which directly impact the nonstoichiometry. After 1000 s, an increased sweeping flow rate (2 L/min) leads to higher temperatures in the solid phase, reaching 640 °C at the outlet against 180 °C achieved at the halved flow rate (0.5 L/min) and around 300 °C with 1 L/min. The highest flow rate leads also to the lowest temperature gradients along the solid domain, which is beneficial for the system. This trend is explained by looking at the interfacial heat transfer contribution. For a higher flow rate, the interfacial solid-to-fluid heat transfer at the entrance is higher, and the fluid reaches higher temperatures near the inlet. Then, the fluid reaches faster the colder region of the domain, where the fluid-to-solid heat transfer increases as well for higher sweeping flow rates. This induces higher and more uniform temperatures in the solid phase, as observed. The opposite applies at lower flow rates. After 5000 s, the solid temperature profiles appear closer, with the highest flow rate profile appearing again more uniform, and with lower temperature values in the first half of the domain. This effect is shown also in Figure 6c, depicting the ceria temperature in time. Because of the interfacial heat transfer, the ceria temperature at the outlet (and in the whole domain) increases much more rapidly, with 1000 °C achieved at the outlet in 40% less time at 2 L/min than at 0.5 L/min (Figure 6c). Thus, in the range of flow rates investigated, a higher sweeping gas flow rate induces faster heating and more uniform temperature profiles in the reactive solid phase, which is beneficial for the process performance and thermal stability. The flow rate impact on the O2 partial pressure in the system is shown in Figure 6b. As expected, the higher the sweeping gas flow rate, the lower the pO2. After 1000 s, the plateau effect shows a delay at higher flow rates. The higher temperature and lower O2 partial pressure distributions coming from a higher sweeping flow rate induce a response in terms of higher reduction extent, as depicted in Figure 6d. The nonstoichiometry at the outlet (least exposed) section reaches a 0.01 value in two-thirds of the time with 2 L/min against 0.5 L/min. It should be noted that at higher and higher sweeping gas flow rates, beyond the range investigated herein, a reversed effect is expected to arise, as pointed out by Lidor et al. [32]. Indeed, a very high sweeping gas flow rate entering at a relatively low temperature would generate a faster cooling near the inlet and an overall lower temperature along the entire domain. However, an extensive and comprehensive parametric analysis goes beyond the scope of this work, that is more focused on the redox physics implementation.
3.3.2. Steam Concentration During Oxidation
The impact of the variation of the molar concentration of steam in the oxidation feed is verified in the range of 0.2–0.4, that was the experimental range in which the kinetic law was derived [60]. The outcomes from the reduction of 1 L/min of sweeping gas are taken as the initial values. Results are coherent with the expectations, and further confirm the robustness of the approach for the kinetics implementation. Figure 7a shows the solid conversion in space, with a consistent improvement at increasing H2O content in the feed, especially highlighted after 90 s (after the production peak). The hydrogen production peak in time is depicted in Figure 7b, with a faster hydrogen production and reaction completion for higher oxidant concentration. The production peak value falls at earlier times as the kinetics get faster, anticipating the time of maximum H2O feeding (60 s) when looking at the 40% concentration profile. However, pure steam would be typically fed in a real system, leading in principle to faster kinetics and thus to a more efficient operation [46].
3.4. Verification of the Redox Model
The robustness of the redox kinetic model is verified by looking at the oxygen mass balance during the reduction step (oxygen release) and the following oxidation step (oxygen uptake) of the first redox cycle. This is accomplished directly by computing the net oxygen and hydrogen sources across the entire computational domain, through integration in time and space (Equations (37)-(38)).
Figure 8a shows the redox mass balance in all the parametric conditions investigated, confirming that the hydrogen produced during the oxidation step nearly matches a full replenishment of the oxygen released during the previous reduction, with a reoxidation extent higher than 0.985 in all the operating conditions (Figure 8b). The very little difference would asymptotically disappear running the oxidation step for arbitrarily longer times. The hydrogen produced increases at higher steam concentration with a fixed sweeping flow rate during reduction, but this dependence is relatively less relevant here since 600 s are sufficient to fully reoxidize the ceria in all the flow conditions studied. On the other hand, the hydrogen production dependence is stronger with the increasing sweeping flow rate, coherently with the higher oxygen vacancies that are produced during the previous reduction.
3.5. Multiple Cycling
Three consecutive cycles were simulated in the flow conditions that ensure the highest gas evolution volumes – i.e., reduction with 2 L/min sweeping flow rate, and oxidation at 40% of H2O molar concentration. The first cycle duration was kept at 5000 s long reduction, and a 600 s long oxidation, whereas the following cycles were simulated with shorter durations (1800 s long reduction, and 300 s long oxidation). Figure 9 depicts the monoatomic oxygen and hydrogen reaction rates, as integral quantities in the entire domain, along with the nonstoichiometry in two different points of the domain – at the inlet and 1 cm from the inlet. The system reaches a steady state already from the second cycle on. Overall, the redox analytical model can thus be used for modelling long cyclic operation, to foresee the long-duration performance of the simulated system under investigation.
4. Model Applications
The simple analytical approach developed in this work should be helpful in reactor-level modelling, where the redox kinetics must be coupled with heat transfer and fluid flow. The usefulness of the methodology is summarized below.
- i.
-
The analytical model makes use of global (or apparent) kinetic laws, that can be obtained experimentally from thermogravimetry or online gas analysis. Typically, a solid-state rate equation of this type is expressed in the following form [40], [60], as also described in more detail in Section 2.4.2:The solid conversion variation in time thus results from the factorized contributions of the reaction temperature, , of the solid conversion itself, , and of the gas atmosphere through the reactants’ partial pressure or molar fraction, . Extensive literature is available on this type of kinetic studies [40], and a considerable number of previous works addressed the definition of this kind of kinetic laws in chemical looping redox cycles and with different Oxygen Carriers (OCs), such as H2-assisted Fe3O4 reduction to FeO/Fe [79], isothermal reverse water-gas shift chemical looping of Fe2O3-Ce0.5Zr0.5O2 [80], H2-assisted reduction of Fe3O4/ZrO2 composite [81], CH4-assisted reduction of Fe3O4 [82], and CH4-assisted reduction of nonstoichiometric LaFeO3 [83]. Most interestingly, the ceria redox cycle was studied with this approach [13], with relevant examples for the CO2 [52] and H2O splitting step [60]. The usefulness of extracting a complete kinetic law lies in its potential use in modelling reactor systems and simulating the process behaviour. However, apparent kinetic laws are obtained from experiments as a bulk measurement on the tested sample. This aspect is well highlighted in a recent review on solar thermochemical reaction systems modelling [28]: “The use of this experimental data directly in a continuum model […] requires some care since this is a bulk solid measurement that must be related to local gas/solid concentrations”. Our analytical model meets this gap, allowing to convert a global kinetic law into a local kinetic law, that can be readily coupled to other physics in reactor-level numerical modelling. The simple method consists of expressing the solid conversion as a function of the nonstoichiometry of the OC instead of as a function of the sample mass, thereby addressing a local dependence instead of a global, bulk dependence. This allows to correlate with via differentiation, and to eventually express the chemical species mass source/sink, , in terms of the local fields (e.g., temperature and species concentrations).
- ii.
- The approach developed well fits to any nonstoichiometric oxide, that is used as the OC in any chemical looping redox cycle for synthetic fuels production. Indeed, the equations derived herein for the H2O-driven oxidation of ceria can be adapted to CO2-driven oxidation and to fuel-assisted reduction reactions (such as in the reverse water-gas shift H2-assisted process [123], or in the methane reforming process [85]), through the reactant concentration dependent term, as well as to thermal reduction reactions. Although sparse examples in the literature [57], to the best of our knowledge, this is the first time that an analytical approach is rigorously derived for using apparent kinetics in (solar) reactor continuum-level modeling, and is applied to thermochemical fuel production. Robust validation against experimental data secures the validity of our methodology.
- iii.
- In this work, a kinetic law taking into account only the forward reaction was considered, according to Arifin et al. [60]. Details are given in Section 2.4.2. As mentioned, this form of the rate equation is valid given that the reaction products can be removed in a sufficiently fast way, such as to prevent the backward reaction. Equivalently, this happens when a large excess of gaseous reactant is supplied to the reaction site [40]. When dealing with thermochemical splitting, this condition should be typically met when using perovskite OCs, which have shown higher reduction extent and lower reduction temperatures than ceria but a lower re-oxidation extent at the same time, unless oxidant in excess is used to boost the thermodynamic driving force [7], [15]. Thus, the form of the model presented in this work perfectly matches the kinetic rate equation form that is usually suitable for perovskite OCs. Besides, the large steam excess needed by perovskite OCs calls for the necessity to optimize the oxidation step in terms of fluid flow, kinetics, and reaction times. This can be addressed by using our methodology and suitable rate expressions for the OC under investigation.
- iv.
- Being based on a local approach, our analytical model is dimensionality independent. Thus, it can be applied to any (solar) reactor geometry and can be useful in modelling much more complex systems than the one simulated herein, up to complete 2D/3D models. The inherently local nature of the model also allows to obtain spatial distributions of the redox material conversion/utilization and reactivity in time, paving the way for optimization strategies of reactor’s design and operation.
5. Conclusions
In this work, we develop a novel simple analytical approach for converting global (or apparent) kinetic laws into local kinetic laws, thereby allowing their ready implementation into numerical modelling at the continuum reactor level. This type of kinetics treatment is often addressed to describe a large variety of reactions in the field of chemical looping and solar thermochemical processes, but a rigorous analytical methodology for the use of such kinetics is missing. The implementation of the approach developed was exemplified in the ceria-based thermochemical redox cycle, specifically in the H2O-driven oxidation step, during which solar thermochemical hydrogen is produced. Whereas the thermal reduction kinetics were implemented according to well-established rate models, the H2 production rate equation was derived by rearranging apparent kinetics from the literature into a more suitable analytical form that can be readily implemented into multiphysics reactor models by using our proposed methodology, against previous models simulating the oxidation either at thermodynamic equilibrium, or with alternative approaches for the kinetics treatment. Simulated O2 production rate profiles during reduction, and H2 production rate profiles during oxidation, were compared with experimental data from the literature showing high agreement, thereby validating the numerical implementation. The multiphysics model simulates the entire redox cycle in a simplified 1D geometry, and includes the coupling among heat transfer, fluid flow, and redox chemistry, describing a directly irradiated solar receiver-reactor making use of simplifying assumptions for the radiation. The robustness of the model is secured via the oxygen mass balance across the redox cycle. The analytical approach is thought to be useful for simulating any nonstoichiometric oxide in chemical looping synthetic fuels production cycles of various nature, such as the ceria system and most notably perovskites, these latter typically requiring large steam excess during oxidation. Recently, Li et al. [7] developed a thermodynamic model for the analysis of both state of the art and hypothetical materials, demonstrating how perovskites are extremely difficult to reoxidize and their high fuel outputs are achieved at the cost of huge water-heating requirements, causing extremely low efficiencies. This latter consideration implies that fluid flow, redox kinetics, and reaction times should be thoroughly modelled and optimized when dealing with oxidation-critical OCs such as perovskites. The importance of modelling the oxidation kinetics was also underlined by de la Calle et al. [56], since thermodynamic modelling of the process – although being relevant for fixing the upper limits in the efficiency – only represents the ideal boundaries of the process operation. It is, thus, of utmost relevance to develop efficient methods to readily simulate the redox kinetics of any nonstoichiometric redox material together with the complex process multiphysics. Nonstoichiometric OCs are indeed reported as the most explored class of OCs at present [3]. Moreover, based on a local approach, our analytical model can be readily applied to arbitrarily complex reactor geometries. The inherently local nature of the model also allows to obtain spatial distributions of the redox material conversion/utilization in time, paving the way for optimization strategies of reactor’s design and operation. Finally, a literature overview of selected numerical modelling works on solar reactor systems was provided.
Future developments will include multiphysics modelling at higher dimensionality (2D+ models) by applying our novel methodology. A further comparison against equilibrium models will quantitatively predict the necessity of taking the reaction kinetics into account. Detailed calibration of the rate equation coupled to advanced OC morphologies [36] will be also addressed, together with more accurate assumptions for the pO2 field through the porous medium, as well as for radiative heat transfer. The use of our comprehensive model for optimizing the reactor design and operation, in terms of uniform utilization and conversion of the OC, will be also shown.
Author Contributions
Conceptualization, F.O.; methodology, F.O.; validation, F.O.; formal analysis, F.O.; investigation, F.O.; resources, D.F., M.S.; data curation, F.O.; writing—original draft preparation, F.O.; writing—review and editing, D.F., D.P., M.S.; visualization, F.O.; supervision, D.F., D.P., M.S. All authors have read and agreed to the published version of the manuscript.
Funding
This research received no external funding.
Data Availability Statement
No experimental data were used in this work. Model and results can be made available on request.
Conflicts of Interest
The authors declare no conflicts of interest.
Abbreviations
| LTE | Local Thermal Equilibrium |
| LTNE | Local Thermal Non-Equilibrium |
| RDA | Rosseland Diffusion Approximation |
| RPC | Reticulated Porous Ceramics |
| OC | Oxygen Carrier |
| Solid conversion, | |
| Rosseland mean extinction coefficient, | |
| Concentration exponent, | |
| Nonstoichiometry, | |
| Maximum nonstoichiometry, | |
| Macro-scale porosity, | |
| Density, | |
| Stefan-Boltzmann constant, | |
| Characteristic length, | |
| Proportionality constant, | |
| Dynamic viscosity, | |
| Mass fraction, | |
| Diffusion collision integral, | |
| Initial time | |
| Chemical | |
| Fluid | |
| ith chemical species | |
| Oxidation | |
| Radiation | |
| Reduction | |
| Solid | |
| Thermodynamic equilibrium | |
| Exposed (irradiated) area, | |
| Specific surface area, | |
| Preexponential factor, | |
| Heat capacity at constant pressure, | |
| Mean pore diameter, | |
| Diffusion coefficient, | |
| Diameter of the exposed (irradiated) area, | |
| Activation energy, | |
| Differential mechanistic model, | |
| Forchheimer coefficient, | |
| Water dissociation reaction enthalpy, | |
| Oxygen vacancy formation enthalpy, | |
| Heat transfer coefficient, | |
| Concentration dependent function, | |
| Diffusive flux, | |
| Rate constant, | |
| Thermal conductivity of the fluid phase, | |
| Thermal conductivity of the solid phase, | |
| Permeability, | |
| Thickness of the porous medium, | |
| Molar mass, | |
| Number of moles, | |
| O2 partial pressure exponent, | |
| Nusselt number, | |
| Pressure, or | |
| Prandtl number, | |
| Thermal power source or sink, | |
| Gas constant, | |
| Mass source, | |
| Reynolds number, | |
| sccm | Standard cubic centimeter |
| Temperature, | |
| Darcy velocity vector, | |
| Molar fraction, , or spatial coordinate, |
References
- L. Wei et al., “Solar-driven thermochemical conversion of H2O and CO2 into sustainable fuels,” iScience, vol. 26, no. 11, p. 108127, Nov. 2023. [CrossRef]
- S. O. Jeje, T. Marazani, J. O. Obiko, and M. B. Shongwe, “Advancing the hydrogen production economy: A comprehensive review of technologies, sustainability, and future prospects,” International Journal of Hydrogen Energy, vol. 78, pp. 642–661, Aug. 2024. [CrossRef]
- J. T. Tran, K. J. Warren, S. A. Wilson, C. L. Muhich, C. B. Musgrave, and A. W. Weimer, “An updated review and perspective on efficient hydrogen generation via solar thermal water splitting,” WIREs Energy and Environment, vol. 13, no. 4, p. e528, 2024. [CrossRef]
- R. Schäppi, V. Hüsler, and A. Steinfeld, “Solar Thermochemical Production of Syngas from H2O and CO2─Experimental Parametric Study, Control, and Automation,” Ind. Eng. Chem. Res., vol. 63, no. 8, pp. 3563–3575, Feb. 2024. [CrossRef]
- R. Schäppi et al., “Drop-in fuels from sunlight and air,” Nature, vol. 601, no. 7891, pp. 63–68, Jan. 2022. [CrossRef]
- W. Chang et al., “Recent Advances of Oxygen Carriers for Hydrogen Production via Chemical Looping Water-Splitting,” Catalysts, vol. 13, no. 2, p. 279, Jan. 2023. [CrossRef]
- S. Li et al., “Thermodynamic Guiding Principles for Designing Nonstoichiometric Redox Materials for Solar Thermochemical Fuel Production: Ceria, Perovskites, and Beyond,” Energy Tech, vol. 10, no. 1, p. 2000925, Jan. 2022. [CrossRef]
- J. M. Coronado and A. Bayón, “Catalytic enhancement of production of solar thermochemical fuels: opportunities and limitations,” Phys. Chem. Chem. Phys., vol. 25, no. 26, pp. 17092–17106, 2023. [CrossRef]
- J. Lou et al., “Thermodynamic assessment of nonstoichiometric oxides for solar thermochemical fuel production,” Solar Energy, vol. 241, pp. 504–514, Jul. 2022. [CrossRef]
- A. Joshi et al., “Chemical looping-A perspective on the next-gen technology for efficient fossil fuel utilization,” Advances in Applied Energy, vol. 3, p. 100044, Aug. 2021. [CrossRef]
- Y. Kim, H. S. Lim, H. S. Kim, M. Lee, J. W. Lee, and D. Kang, “Carbon dioxide splitting and hydrogen production using a chemical looping concept: A review,” Journal of CO2 Utilization, vol. 63, p. 102139, Sep. 2022. [CrossRef]
- A. G. Al-Gamal et al., “Perovskite materials for hydrogen evolution: Processes, challenges and future perspectives,” International Journal of Hydrogen Energy, vol. 79, pp. 1113–1138, Aug. 2024. [CrossRef]
- Y. Lu, “Solar fuels production: Two-step thermochemical cycles with cerium-based oxides,” Progress in Energy and Combustion Science, p. 49, 2019.
- A. Boretti, “Technology Readiness Level of Solar Thermochemical Splitting Cycles,” ACS Energy Lett., pp. 1170–1174, Mar. 2021. [CrossRef]
- R. J. Carrillo and J. R. Scheffe, “Advances and trends in redox materials for solar thermochemical fuel production,” Solar Energy, vol. 156, pp. 3–20, Nov. 2017. [CrossRef]
- J. R. Scheffe and A. Steinfeld, “Oxygen exchange materials for solar thermochemical splitting of H2O and CO2: a review,” Materials Today, vol. 17, no. 7, pp. 341–348, Sep. 2014. [CrossRef]
- A. Lidor and B. Bulfin, “A critical perspective and analysis of two-step thermochemical fuel production cycles,” Solar Compass, vol. 11, p. 100077, Sep. 2024. [CrossRef]
- Y. Mao et al., “Hydrogen production via a two-step water splitting thermochemical cycle based on metal oxide – A review,” Applied Energy, vol. 267, p. 114860, Jun. 2020. [CrossRef]
- Y. Lu, L. Zhu, C. Agrafiotis, J. Vieten, M. Roeb, and C. Sattler, “Solar fuels production: Two-step thermochemical cycles with cerium-based oxides,” Progress in Energy and Combustion Science, vol. 75, p. 100785, Nov. 2019. [CrossRef]
- A. Weber, J. Grobbel, M. Neises-von Puttkamer, and C. Sattler, “Swept open moving particle reactor including heat recovery for solar thermochemical fuel production,” Solar Energy, vol. 266, p. 112178, Dec. 2023. [CrossRef]
- S. Brendelberger, P. Holzemer-Zerhusen, E. Vega Puga, M. Roeb, and C. Sattler, “Study of a new receiver-reactor cavity system with multiple mobile redox units for solar thermochemical water splitting,” Solar Energy, vol. 235, pp. 118–128, Mar. 2022. [CrossRef]
- E. Vega Puga, S. Brendelberger, A. Weber, and C. Sattler, “Modelling Development of a Receiver-Reactor of Type R2Mx for Thermochemical Water Splitting,” presented at the ASME 2023 17th International Conference on Energy Sustainability collocated with the ASME 2023 Heat Transfer Summer Conference, American Society of Mechanical Engineers Digital Collection, Sep. 2023. [CrossRef]
- A. S. Patankar, X.-Y. Wu, W. Choi, H. L. Tuller, and A. F. Ghoniem, “A Reactor Train System for Efficient Solar Thermochemical Fuel Production,” Journal of Solar Energy Engineering, vol. 144, no. 6, p. 061014, Dec. 2022. [CrossRef]
- N. Gokon, S. Takahashi, H. Yamamoto, and T. Kodama, “New Solar Water-Splitting Reactor With Ferrite Particles in an Internally Circulating Fluidized Bed,” Journal of Solar Energy Engineering, vol. 131, no. 011007, Jan. 2009. [CrossRef]
- J. T. Tran et al., “Feasibility of continuous water and carbon dioxide splitting via a pressure-swing, isothermal redox cycle using iron aluminates,” Chemical Engineering Journal, vol. 497, p. 154791, Oct. 2024. [CrossRef]
- S. Zoller et al., “A solar tower fuel plant for the thermochemical production of kerosene from H2O and CO2,” Joule, vol. 6, no. 7, pp. 1606–1616, Jul. 2022. [CrossRef]
- D. Marxer, P. Furler, M. Takacs, and A. Steinfeld, “Solar thermochemical splitting of CO 2 into separate streams of CO and O 2 with high selectivity, stability, conversion, and efficiency,” Energy Environ. Sci., vol. 10, no. 5, pp. 1142–1149, 2017. [CrossRef]
- V. M. Wheeler, R. Bader, P. B. Kreider, M. Hangi, S. Haussener, and W. Lipiński, “Modelling of solar thermochemical reaction systems,” Solar Energy, vol. 156, pp. 149–168, Nov. 2017. [CrossRef]
- D. J. Keene, J. H. Davidson, and W. Lipiński, “A Model of Transient Heat and Mass Transfer in a Heterogeneous Medium of Ceria Undergoing Nonstoichiometric Reduction,” Journal of Heat Transfer, vol. 135, no. 5, p. 052701, May 2013. [CrossRef]
- D. J. Keene, W. Lipiński, and J. H. Davidson, “The effects of morphology on the thermal reduction of nonstoichiometric ceria,” Chemical Engineering Science, vol. 111, pp. 231–243, May 2014. [CrossRef]
- R. Bala Chandran, R. Bader, and W. Lipiński, “Transient heat and mass transfer analysis in a porous ceria structure of a novel solar redox reactor,” International Journal of Thermal Sciences, vol. 92, pp. 138–149, Jun. 2015. [CrossRef]
- A. Lidor, T. Fend, M. Roeb, and C. Sattler, “Parametric investigation of a volumetric solar receiver-reactor,” Solar Energy, vol. 204, pp. 256–269, Jul. 2020. [CrossRef]
- P. Furler and A. Steinfeld, “Heat transfer and fluid flow analysis of a 4kW solar thermochemical reactor for ceria redox cycling,” Chemical Engineering Science, vol. 137, pp. 373–383, Dec. 2015. [CrossRef]
- S. Zoller, E. Koepf, P. Roos, and A. Steinfeld, “Heat Transfer Model of a 50 kW Solar Receiver–Reactor for Thermochemical Redox Cycling Using Cerium Dioxide,” Journal of Solar Energy Engineering, vol. 141, no. 2, p. 021014, Apr. 2019. [CrossRef]
- J. P. Sharma et al., “Chemical and thermal performance analysis of a solar thermochemical reactor for hydrogen production via two-step WS cycle,” Energy Reports, vol. 10, pp. 99–113, Nov. 2023. [CrossRef]
- S. Li, V. M. Wheeler, A. Kumar, and W. Lipiński, “Numerical modelling of ceria undergoing reduction in a particle–gas counter-flow: Effects of chemical kinetics under isothermal conditions,” Chemical Engineering Science, vol. 218, p. 115553, Jun. 2020. [CrossRef]
- H. Zhang and J. D. Smith, “Investigating influences of geometric factors on a solar thermochemical reactor for two-step carbon dioxide splitting via CFD models,” Solar Energy, vol. 188, pp. 935–950, Aug. 2019. [CrossRef]
- T. Ma et al., “Analysis of heat and mass transfer in a porous solar thermochemical reactor,” Energy, vol. 294, p. 130842, May 2024. [CrossRef]
- L. Li et al., “A transient heat transfer model for high temperature solar thermochemical reactors,” International Journal of Hydrogen Energy, vol. 41, no. 4, pp. 2307–2325, Jan. 2016. [CrossRef]
- S. Vyazovkin, A. K. Burnham, J. M. Criado, L. A. Pérez-Maqueda, C. Popescu, and N. Sbirrazzuoli, “ICTAC Kinetics Committee recommendations for performing kinetic computations on thermal analysis data,” Thermochimica Acta, vol. 520, no. 1–2, pp. 1–19, Jun. 2011. [CrossRef]
- B. Bulfin et al., “Analytical Model of CeO 2 Oxidation and Reduction,” J. Phys. Chem. C, vol. 117, no. 46, pp. 24129–24137, Nov. 2013. [CrossRef]
- T. Ishida, N. Gokon, T. Hatamachi, and T. Kodama, “Kinetics of Thermal Reduction Step of Thermochemical Two-step Water Splitting Using CeO2 Particles: MASTER-plot Method for Analyzing Non-isothermal Experiments,” Energy Procedia, vol. 49, pp. 1970–1979, Jan. 2014. [CrossRef]
- J. Lapp, J. H. Davidson, and W. Lipiński, “Heat Transfer Analysis of a Solid-Solid Heat Recuperation System for Solar-Driven Nonstoichiometric Redox Cycles,” Journal of Solar Energy Engineering, vol. 135, no. 3, p. 031004, Aug. 2013. [CrossRef]
- R. Bader et al., “Design of a Solar Reactor to Split CO2 Via Isothermal Redox Cycling of Ceria,” Journal of Solar Energy Engineering, vol. 137, no. 3, p. 031007, Jun. 2015. [CrossRef]
- H. Huang and M. Lin, “Optimization of solar receivers for high-temperature solar conversion processes: Direct vs. Indirect illumination designs,” Applied Energy, vol. 304, p. 117675, Dec. 2021. [CrossRef]
- A. Lidor, T. Fend, M. Roeb, and C. Sattler, “High performance solar receiver–reactor for hydrogen generation,” Renewable Energy, vol. 179, pp. 1217–1232, Dec. 2021. [CrossRef]
- J. Lapp and W. Lipiński, “Transient Three-Dimensional Heat Transfer Model of a Solar Thermochemical Reactor for H2O and CO2 Splitting Via Nonstoichiometric Ceria Redox Cycling,” Journal of Solar Energy Engineering, vol. 136, no. 3, Jan. 2014. [CrossRef]
- L. J. Venstrom, R. M. De Smith, R. Bala Chandran, D. B. Boman, P. T. Krenzke, and J. H. Davidson, “Applicability of an Equilibrium Model To Predict the Conversion of CO 2 to CO via the Reduction and Oxidation of a Fixed Bed of Cerium Dioxide,” Energy Fuels, vol. 29, no. 12, pp. 8168–8177, Dec. 2015. [CrossRef]
- R. Bala Chandran and J. H. Davidson, “Model of transport and chemical kinetics in a solar thermochemical reactor to split carbon dioxide,” Chemical Engineering Science, vol. 146, pp. 302–315, Jun. 2016. [CrossRef]
- H. Pan, Y. Lu, and L. Zhu, “Numerical Modeling of CO2 Splitting in High-Temperature Solar-Driven Oxygen Permeation Membrane Reactors,” Journal of Solar Energy Engineering, vol. 143, no. 2, p. 021001, Apr. 2021. [CrossRef]
- A. Le Gal, S. Abanades, and G. Flamant, “CO 2 and H 2 O Splitting for Thermochemical Production of Solar Fuels Using Nonstoichiometric Ceria and Ceria/Zirconia Solid Solutions,” Energy Fuels, vol. 25, no. 10, pp. 4836–4845, Oct. 2011. [CrossRef]
- A. E. Farooqui et al., “Assessment of kinetic model for ceria oxidation for chemical-looping CO2 dissociation,” Chemical Engineering Journal, vol. 346, pp. 171–181, Aug. 2018. [CrossRef]
- P. Wang, R. K. Wei, and K. Vafai, “A dual-scale transport model of the porous ceria based on solar thermochemical cycle water splitting hydrogen production,” Energy Conversion and Management, vol. 272, p. 116363, Nov. 2022. [CrossRef]
- Z. Zhao, M. Uddi, N. Tsvetkov, B. Yildiz, and A. F. Ghoniem, “Redox Kinetics Study of Fuel Reduced Ceria for Chemical-Looping Water Splitting,” J. Phys. Chem. C, vol. 120, no. 30, pp. 16271–16289, Aug. 2016. [CrossRef]
- X. Dai and S. Haussener, “Non-Uniform Porous Structures and Cycling Control for Optimized Fixed-Bed Solar Thermochemical Water Splitting,” Journal of Solar Energy Engineering, vol. 144, no. 3, p. 030904, Jun. 2022. [CrossRef]
- A. de la Calle, I. Ermanoski, J. E. Miller, and E. B. Stechel, “Towards chemical equilibrium in thermochemical water splitting. Part 2: Re-oxidation,” International Journal of Hydrogen Energy, vol. 72, pp. 1159–1168, Jun. 2024. [CrossRef]
- B. Wang et al., “Thermal reduction of iron–manganese oxide particles in a high-temperature packed-bed solar thermochemical reactor,” Chemical Engineering Journal, vol. 412, p. 128255, May 2021. [CrossRef]
- L. Wei, Z. Li, Z. Pan, Z. Yi, G. Li, and L. An, “A design of solar-driven thermochemical reactor integrated with heat recovery for continuous production of renewable fuels,” Energy Conversion and Management, vol. 310, p. 118484, Jun. 2024. [CrossRef]
- B. Guene Lougou, Y. Shuai, R. Pan, G. Chaffa, and H. Tan, “Heat transfer and fluid flow analysis of porous medium solar thermochemical reactor with quartz glass cover,” International Journal of Heat and Mass Transfer, vol. 127, pp. 61–74, Dec. 2018. [CrossRef]
- D. Arifin and A., W. Weimer, “Kinetics and mechanism of solar-thermochemical H2 and CO production by oxidation of reduced CeO2,” Solar Energy, vol. 160, pp. 178–185, Jan. 2018. [CrossRef]
- P. T. Krenzke and J. H. Davidson, “On the Efficiency of Solar H2 and CO Production via the Thermochemical Cerium Oxide Redox Cycle: The Option of Inert-Swept Reduction,” Energy Fuels, vol. 29, no. 2, pp. 1045–1054, Feb. 2015. [CrossRef]
- T. C. Davenport, M. Kemei, M. J. Ignatowich, and S. M. Haile, “Interplay of material thermodynamics and surface reaction rate on the kinetics of thermochemical hydrogen production,” International Journal of Hydrogen Energy, vol. 42, no. 27, pp. 16932–16945, Jul. 2017. [CrossRef]
- A. Le Gal, M. Drobek, A. Julbe, and S. Abanades, “Improving solar fuel production performance from H2O and CO2 thermochemical dissociation using custom-made reticulated porous ceria,” Materials Today Sustainability, vol. 24, p. 100542, Dec. 2023. [CrossRef]
- B. Bulfin, M. Zuber, O. Gräub, and A. Steinfeld, “Intensification of the reverse water–gas shift process using a countercurrent chemical looping regenerative reactor,” Chemical Engineering Journal, vol. 461, p. 141896, Apr. 2023. [CrossRef]
- B. E. Poling, J. M. Prausnitz, and J. P. O’Connell, The properties of gases and liquids, 5th ed. New York: McGraw-Hill, 2001.
- R. J. Panlener, “A THERMODYNAMIC STUDY OF NONSTOICHIOMETRIC CERIUM DIOXIDE”.
- S. Vyazovkin et al., “ICTAC Kinetics Committee recommendations for collecting experimental thermal analysis data for kinetic computations,” Thermochimica Acta, vol. 590, pp. 1–23, Aug. 2014. [CrossRef]
- B. Bulfin et al., “Thermodynamics of CeO2 Thermochemical Fuel Production,” Energy Fuels, vol. 29, no. 2, pp. 1001–1009, Feb. 2015. [CrossRef]
- F. Orsini et al., “Exsolution-enhanced reverse water-gas shift chemical looping activity of Sr2FeMo0.6Ni0.4O6-δ double perovskite,” Chemical Engineering Journal, p. 146083, Sep. 2023. [CrossRef]
- A. Marra, M. Santarelli, and D. Papurello, “Solar Dish Concentrator: A Case Study at the Energy Center Rooftop,” International Journal of Energy Research, vol. 2023, p. e9658091, Aug. 2023. [CrossRef]
- N. O. of D. and Informatics, “NIST Chemistry WebBook.” Accessed: Apr. 22, 2024. [Online]. Available: https://webbook.nist.gov/chemistry/.
- I. Riess, M. Ricken, and J. No¨lting, “On the specific heat of nonstoichiometric ceria,” Journal of Solid State Chemistry, vol. 57, no. 3, pp. 314–322, May 1985. [CrossRef]
- S. Suter, A. Steinfeld, and S. Haussener, “Pore-level engineering of macroporous media for increased performance of solar-driven thermochemical fuel processing,” International Journal of Heat and Mass Transfer, vol. 78, pp. 688–698, Nov. 2014. [CrossRef]
- S. Sas Brunser et al., “Solar-Driven Redox Splitting of CO2 Using 3D-Printed Hierarchically Channeled Ceria Structures,” Advanced Materials Interfaces, vol. 10, no. 30, p. 2300452, 2023. [CrossRef]
- J. Petrasch, F. Meier, H. Friess, and A. Steinfeld, “Tomography based determination of permeability, Dupuit–Forchheimer coefficient, and interfacial heat transfer coefficient in reticulate porous ceramics,” International Journal of Heat and Fluid Flow, vol. 29, no. 1, pp. 315–326, Feb. 2008. [CrossRef]
- M. A. A. Mendes, P. Talukdar, S. Ray, and D. Trimis, “Detailed and simplified models for evaluation of effective thermal conductivity of open-cell porous foams at high temperatures in presence of thermal radiation,” International Journal of Heat and Mass Transfer, vol. 68, pp. 612–624, Jan. 2014. [CrossRef]
- M. Loretz, E. Maire, and D. Baillis, “Analytical Modelling of the Radiative Properties of Metallic Foams: Contribution of X-Ray Tomography,” Adv Eng Mater, vol. 10, no. 4, pp. 352–360, Apr. 2008. [CrossRef]
- B. Bulfin, F. Call, J. Vieten, M. Roeb, C. Sattler, and I. V. Shvets, “Oxidation and Reduction Reaction Kinetics of Mixed Cerium Zirconium Oxides,” Journal of Physical Chemistry C, vol. 120, no. 4, pp. 2027–2035, 2016. [CrossRef]
- A. A. Barde, J. F. Klausner, and R. Mei, “Solid state reaction kinetics of iron oxide reduction using hydrogen as a reducing agent,” International Journal of Hydrogen Energy, vol. 41, no. 24, pp. 10103–10119, Jun. 2016. [CrossRef]
- M. Wenzel et al., “CO production from CO2 via reverse water–gas shift reaction performed in a chemical looping mode: Kinetics on modified iron oxide,” Journal of CO2 Utilization, vol. 17, pp. 60–68, Jan. 2017. [CrossRef]
- Q. Tang, Y. Ma, and K. Huang, “Fe 3 O 4 /ZrO 2 Composite as a Robust Chemical Looping Oxygen Carrier: A Kinetics Study on the Reduction Process,” ACS Appl. Energy Mater., vol. 4, no. 7, pp. 7091–7100, Jul. 2021. [CrossRef]
- C. Lu et al., “Chemical looping reforming of methane using magnetite as oxygen carrier: Structure evolution and reduction kinetics,” Applied Energy, vol. 211, pp. 1–14, Feb. 2018. [CrossRef]
- X. Dai, J. Cheng, Z. Li, M. Liu, Y. Ma, and X. Zhang, “Reduction kinetics of lanthanum ferrite perovskite for the production of synthesis gas by chemical-looping methane reforming,” Chemical Engineering Science, vol. 153, pp. 236–245, Oct. 2016. [CrossRef]
- M. Wenzel, “Reverse water-gas shift chemical looping for syngas production from CO2,” Doctoral Thesis, 2018. [CrossRef]
- P. T. Krenzke, J. R. Fosheim, and J. H. Davidson, “Solar fuels via chemical-looping reforming,” Solar Energy, vol. 156, pp. 48–72, Nov. 2017. [CrossRef]
Figure 1.
1D geometry simulated in this work is represented as a cylinder for better visualization (i.e., no radial coordinates were considered in the model).
Figure 1.
1D geometry simulated in this work is represented as a cylinder for better visualization (i.e., no radial coordinates were considered in the model).
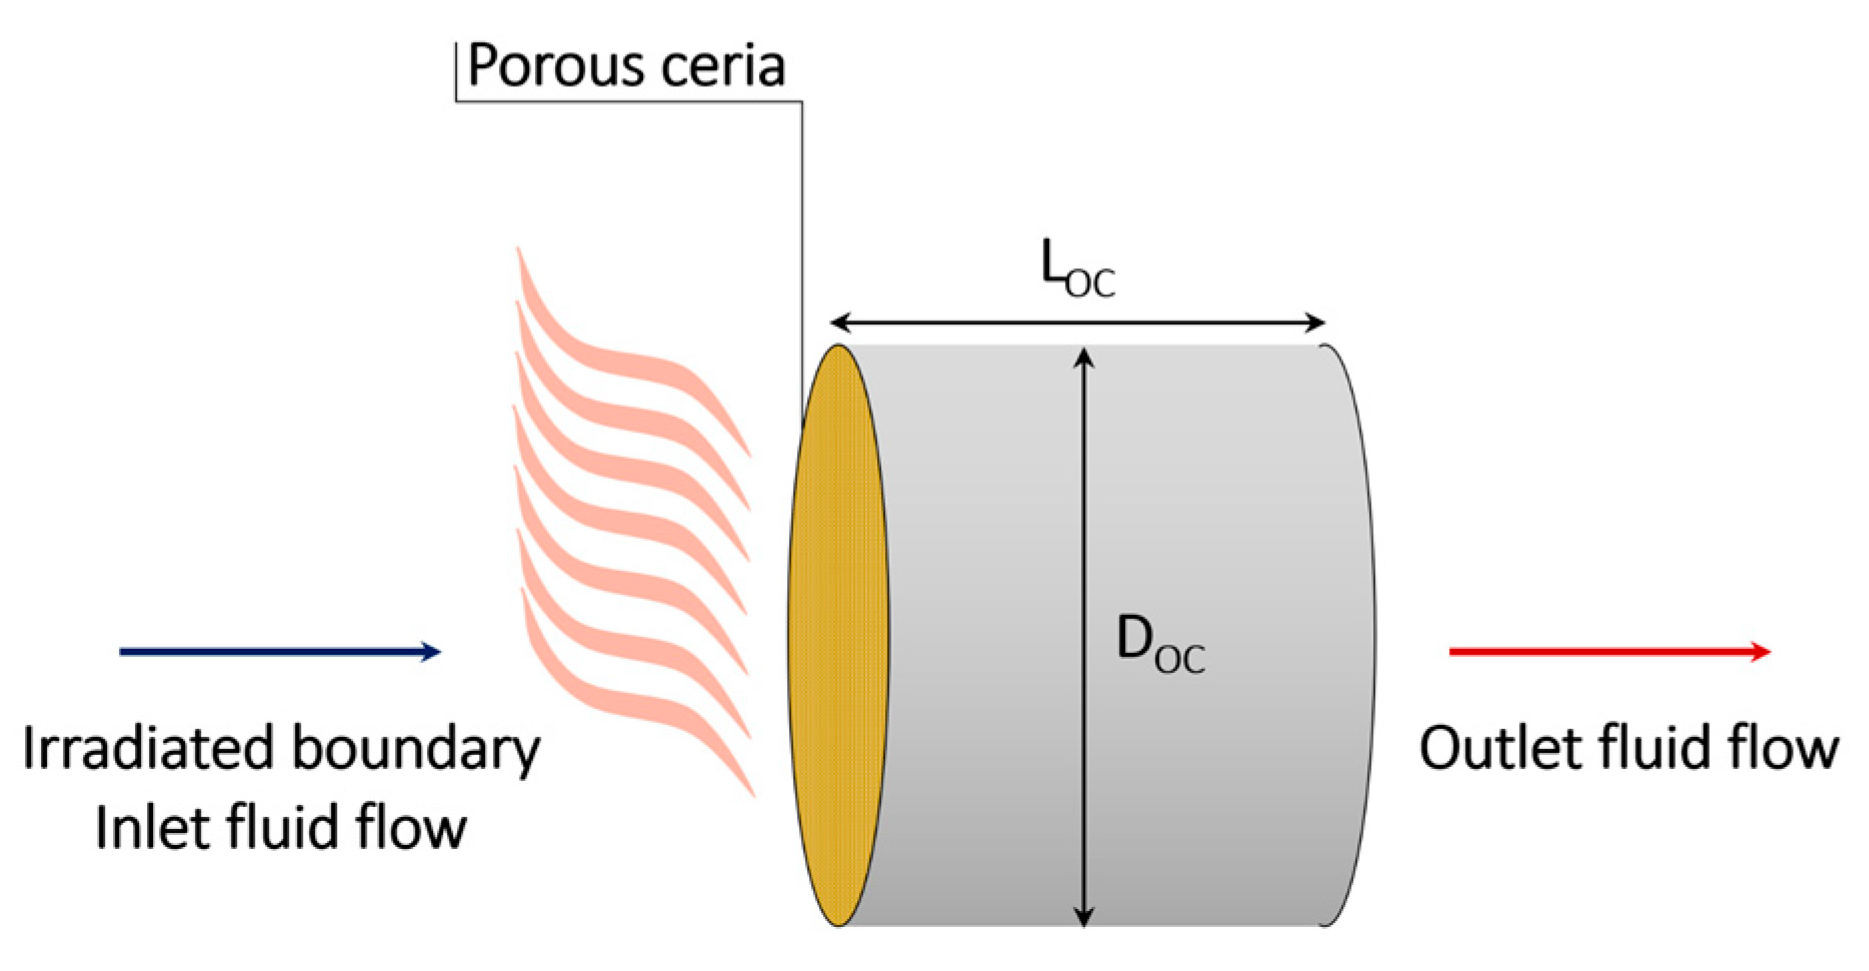
Figure 2.
Validation of the reduction model. Experimental data are taken from [62], with heating ramps of (a) 50 °C/min and (b) 150 °C/min.
Figure 2.
Validation of the reduction model. Experimental data are taken from [62], with heating ramps of (a) 50 °C/min and (b) 150 °C/min.
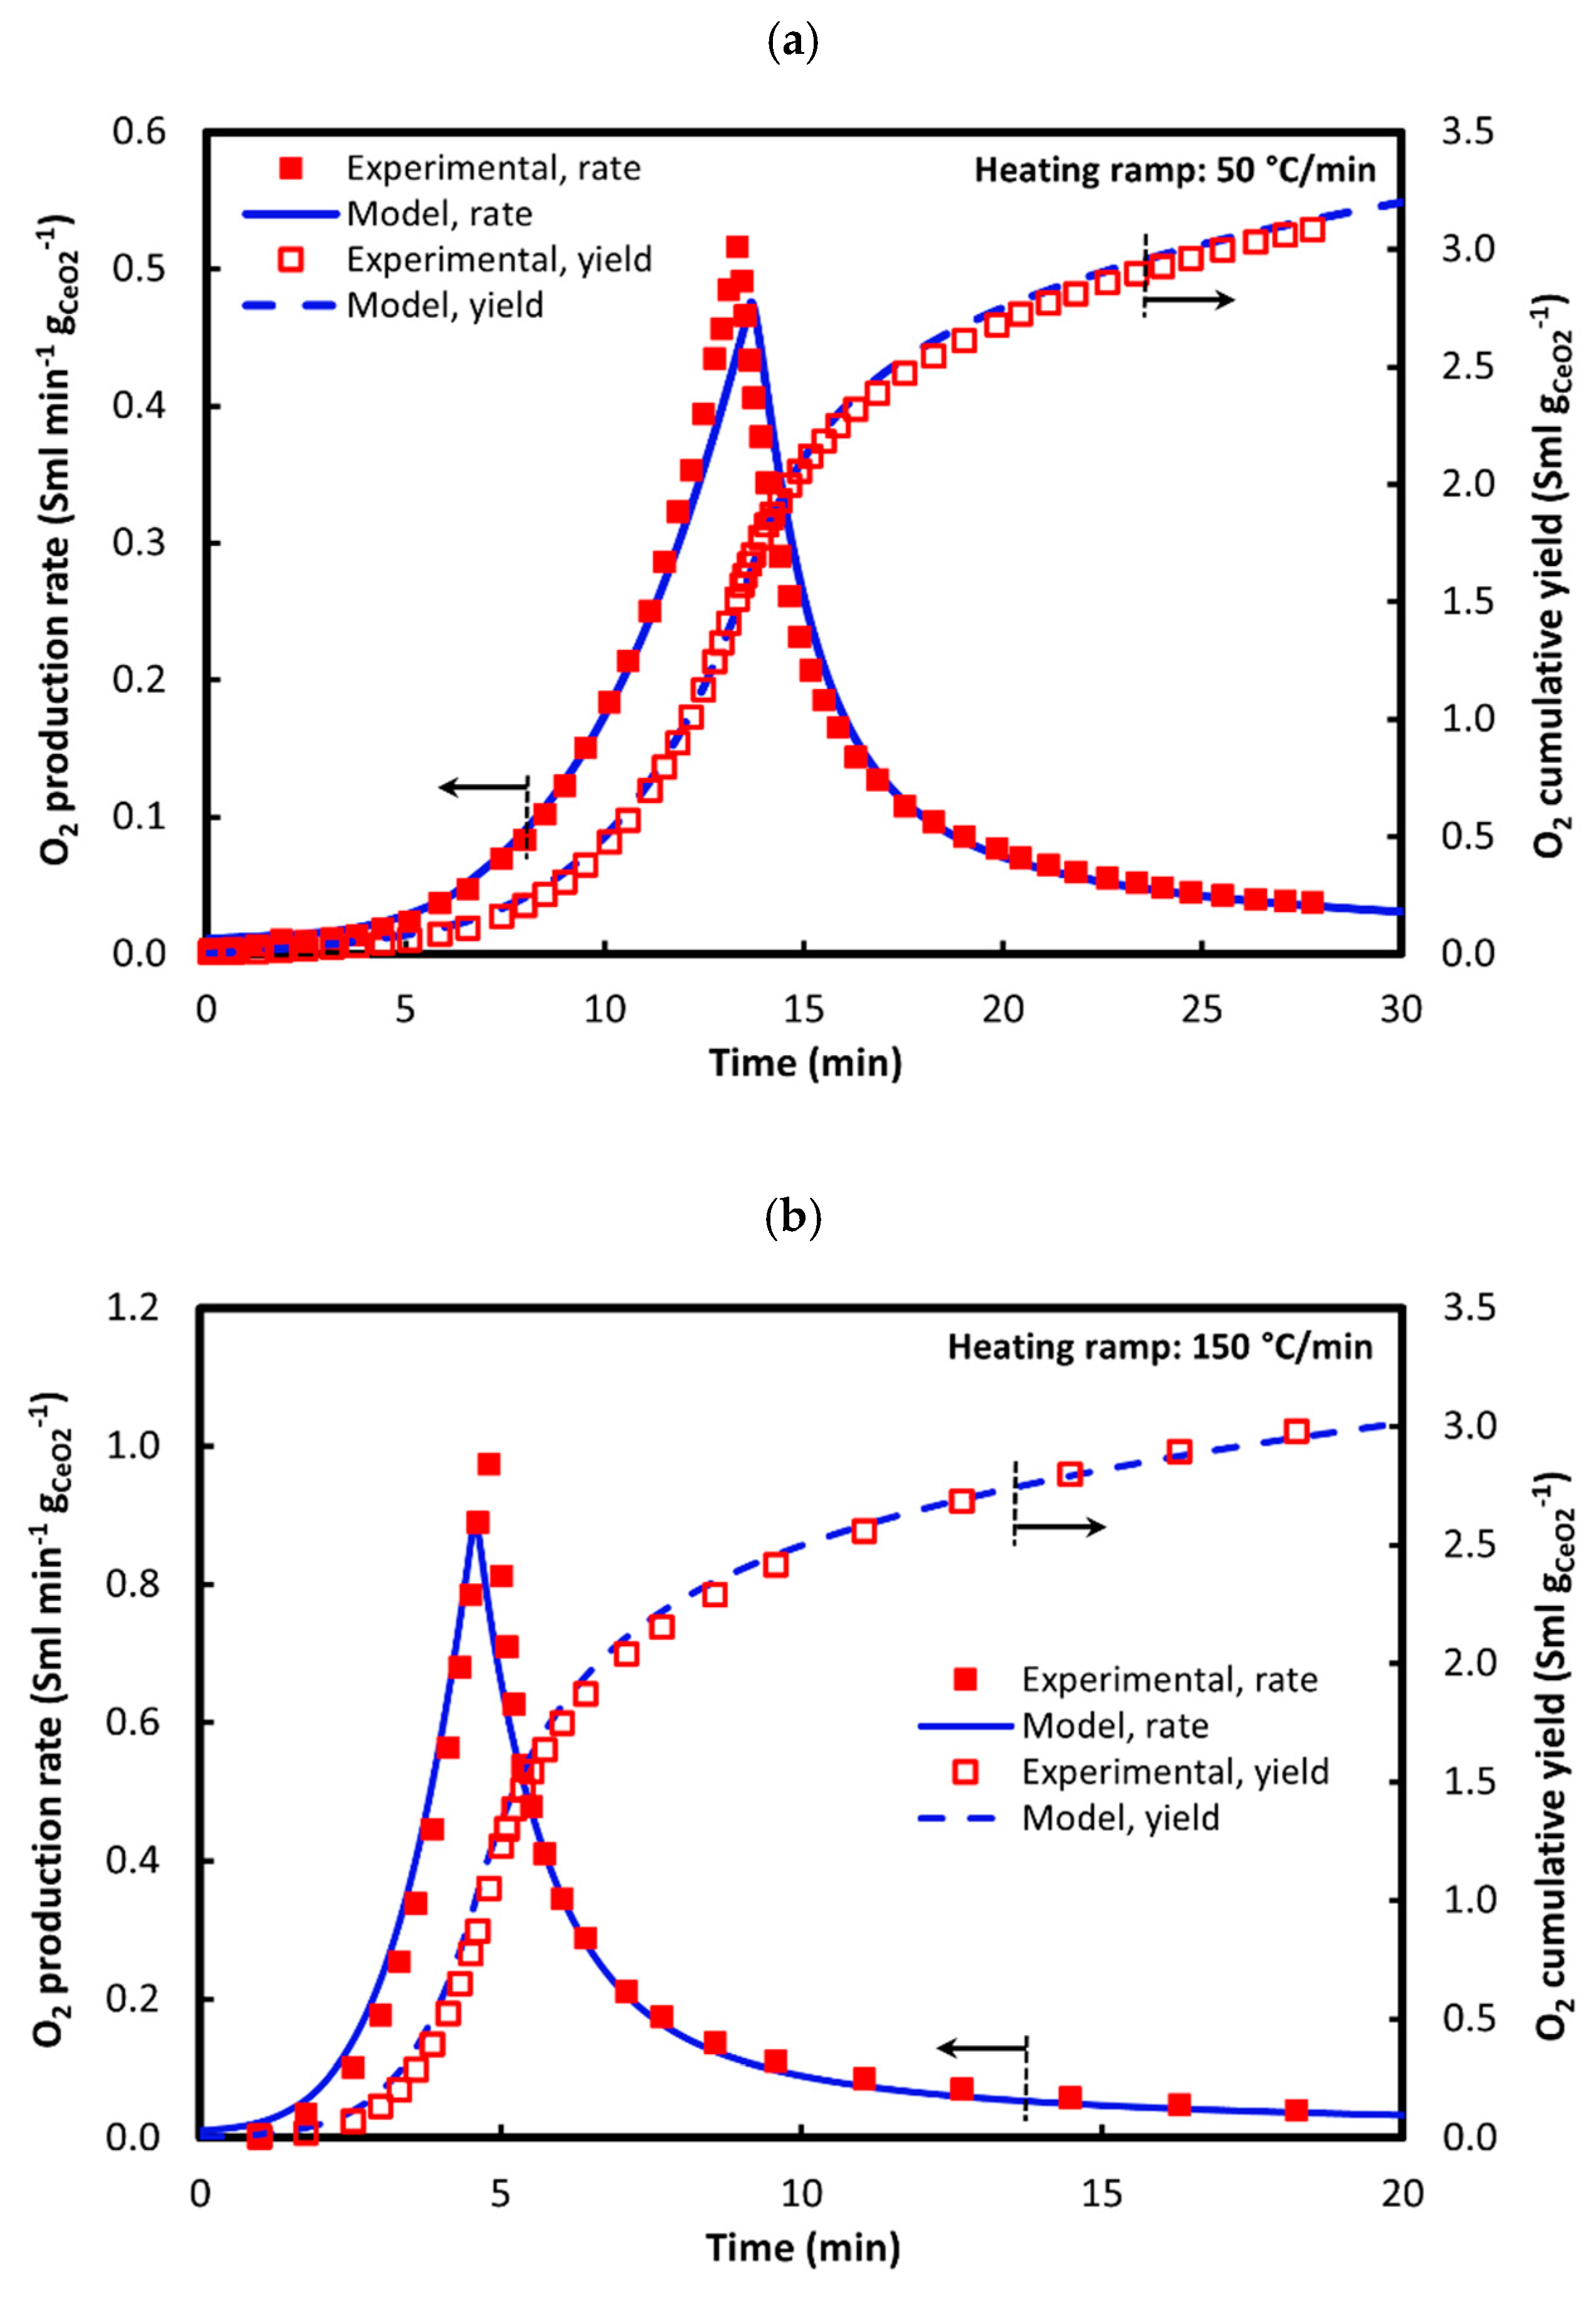
Figure 3.
Validation of the oxidation model. Experimental data are taken from [60].
Figure 3.
Validation of the oxidation model. Experimental data are taken from [60].
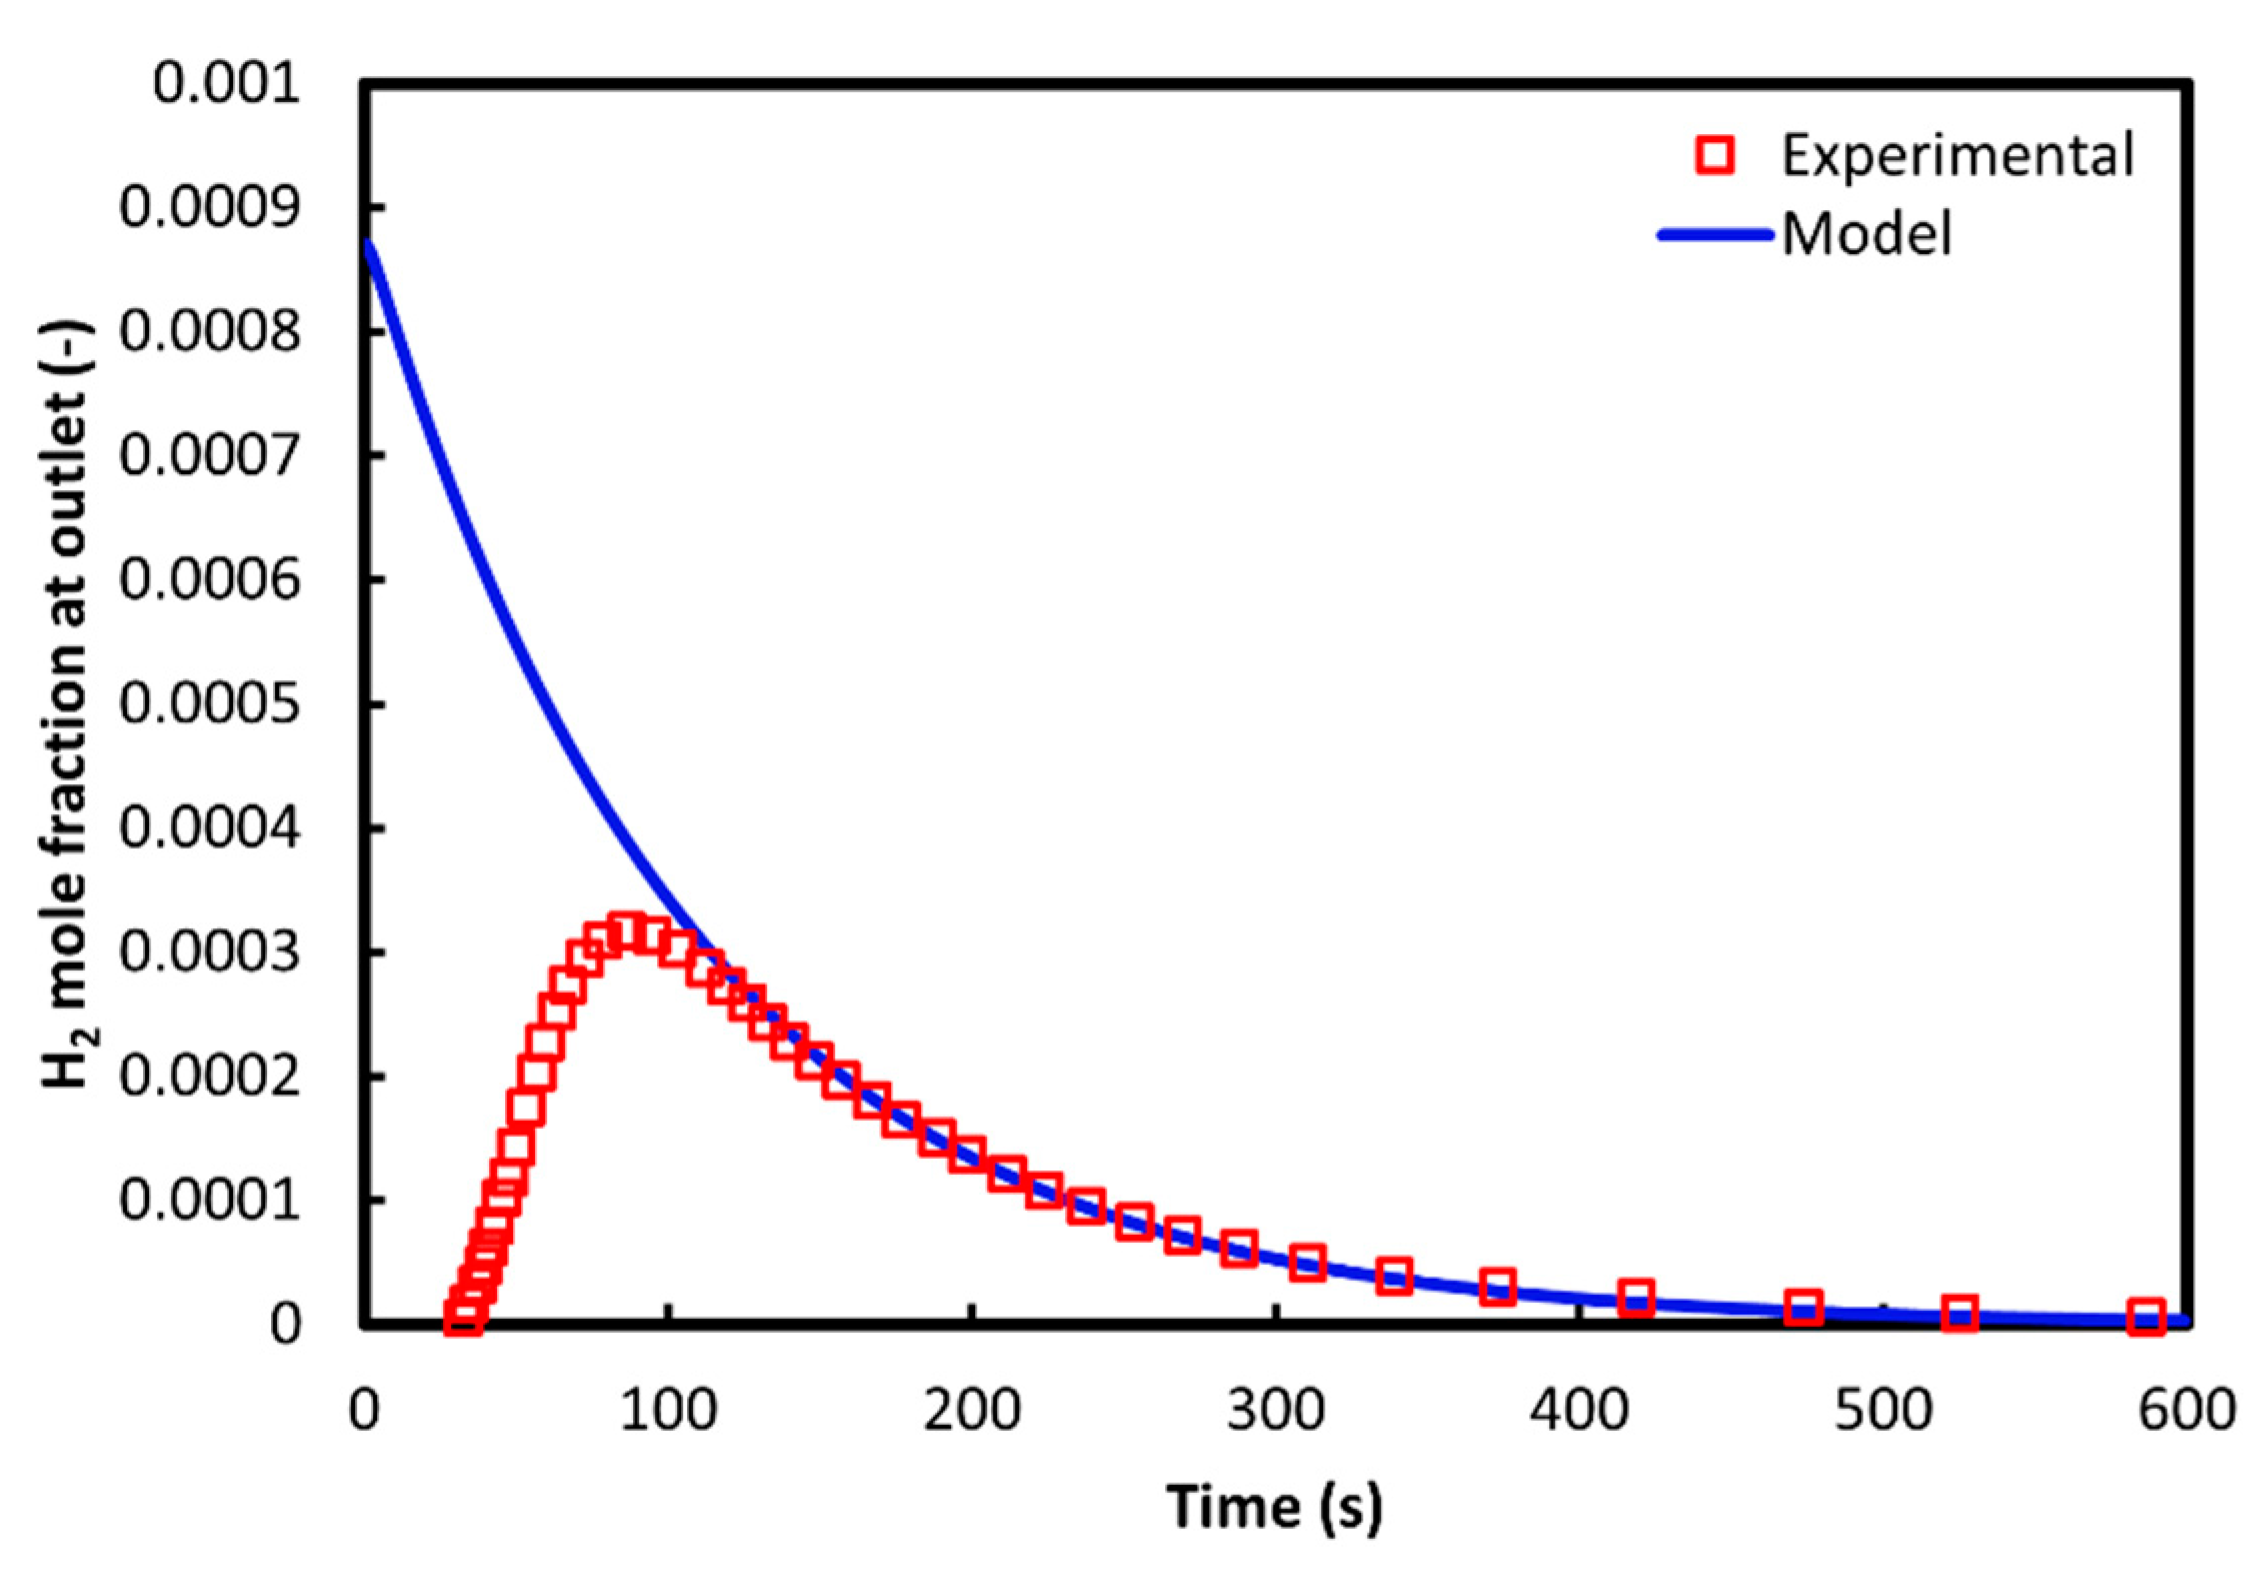
Figure 4.
Results from the reduction step of the first redox cycle. (a) Temperature, (b) oxygen partial pressure, and (c) nonstoichiometry in space at different time instants. (d) Nonstoichiometry in time at different locations in the porous domain. Solid lines: actual nonstoichiometry. Dotted lines: equilibrium nonstoichiometry.
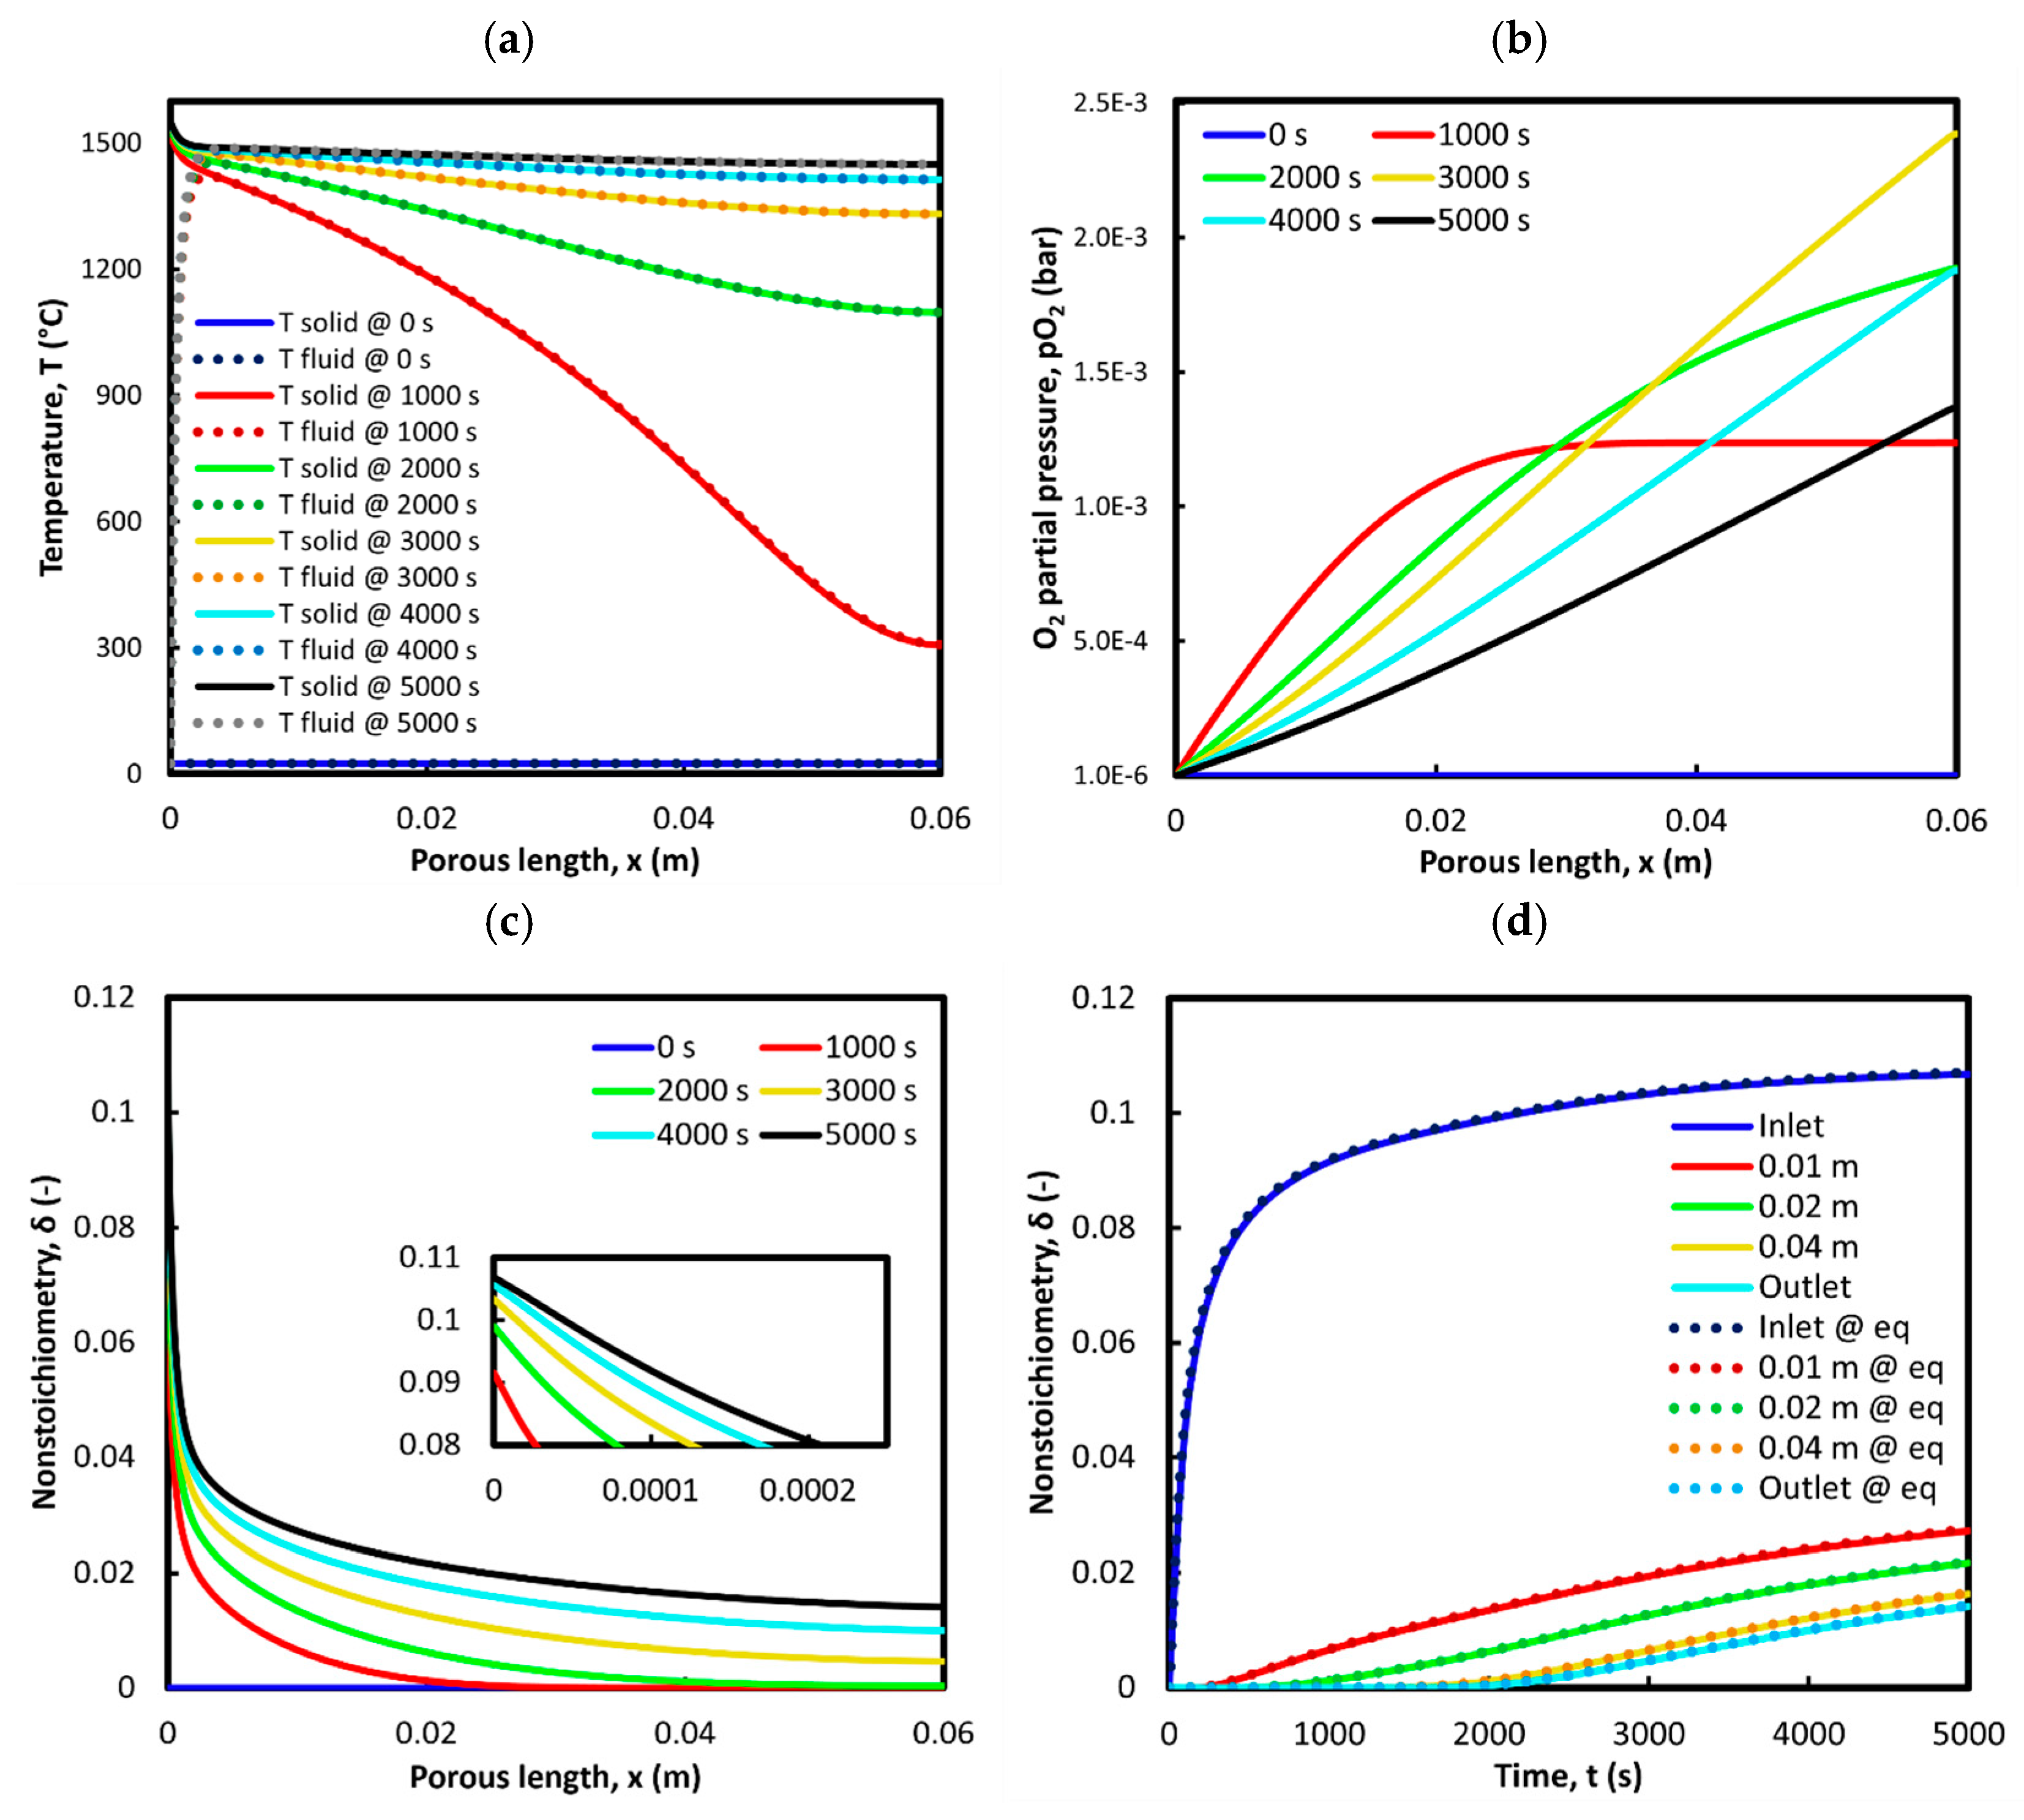
Figure 5.
Results from the oxidation step of the first redox cycle. (a) Nonstoichiometry, (c) solid conversion, and I hydrogen source in space at different time instants. (b) Nonstoichiometry and (d) solid conversion in time at different locations in the porous domain. (f) Outlet hydrogen volumetric flow rate in time.
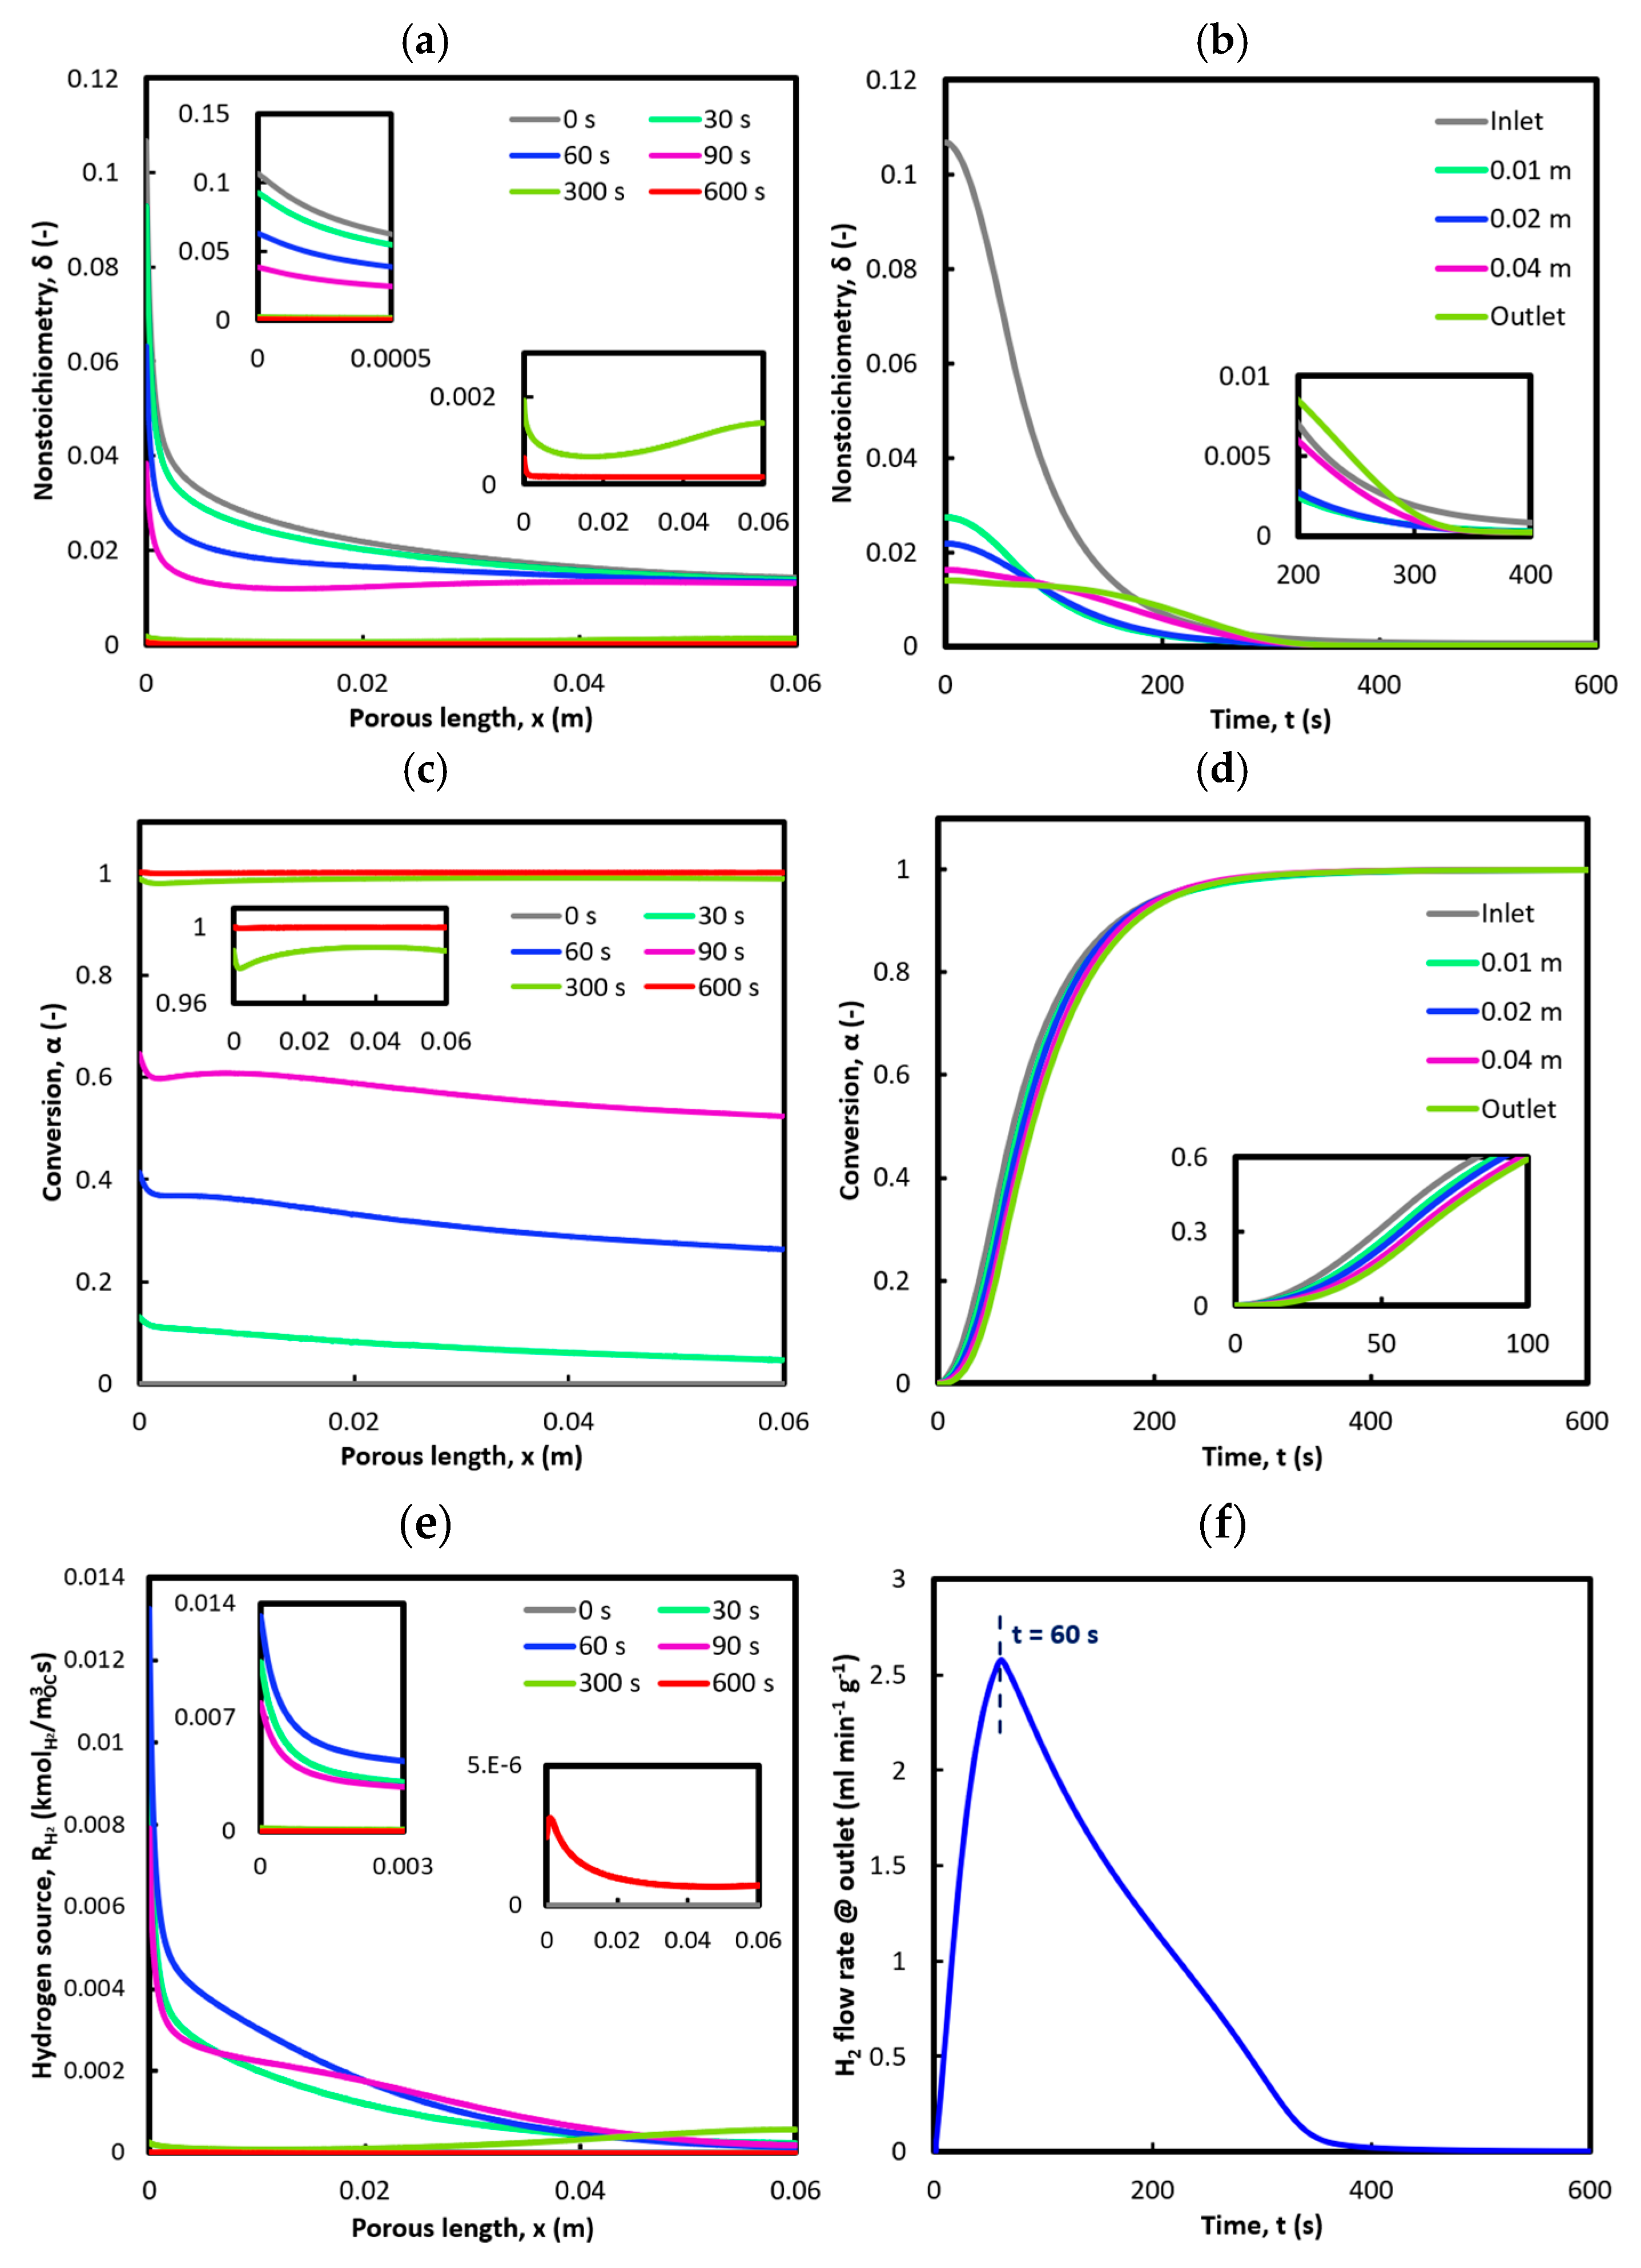
Figure 6.
Effect of the N2 (sweeping gas) volumetric flow rate during the reduction step of the first cycle. (a) Ceria (solid phase) temperature and (b) O2 partial pressure in space at 1000 s and 5000 s. (c) Ceria (solid phase) temperature and (d) nonstoichiometry in time at 0.01 m and 0.06 m (outlet) from the inlet.

Figure 7.
Effect of the H2O concentration during the oxidation step of the first cycle, considering 20%, 30%, and 40% molar fractions. (a) Conversion at 30 s and 90 s from the beginning of the oxidation step. (b) Outlet hydrogen volumetric flow rate in time.
Figure 7.
Effect of the H2O concentration during the oxidation step of the first cycle, considering 20%, 30%, and 40% molar fractions. (a) Conversion at 30 s and 90 s from the beginning of the oxidation step. (b) Outlet hydrogen volumetric flow rate in time.
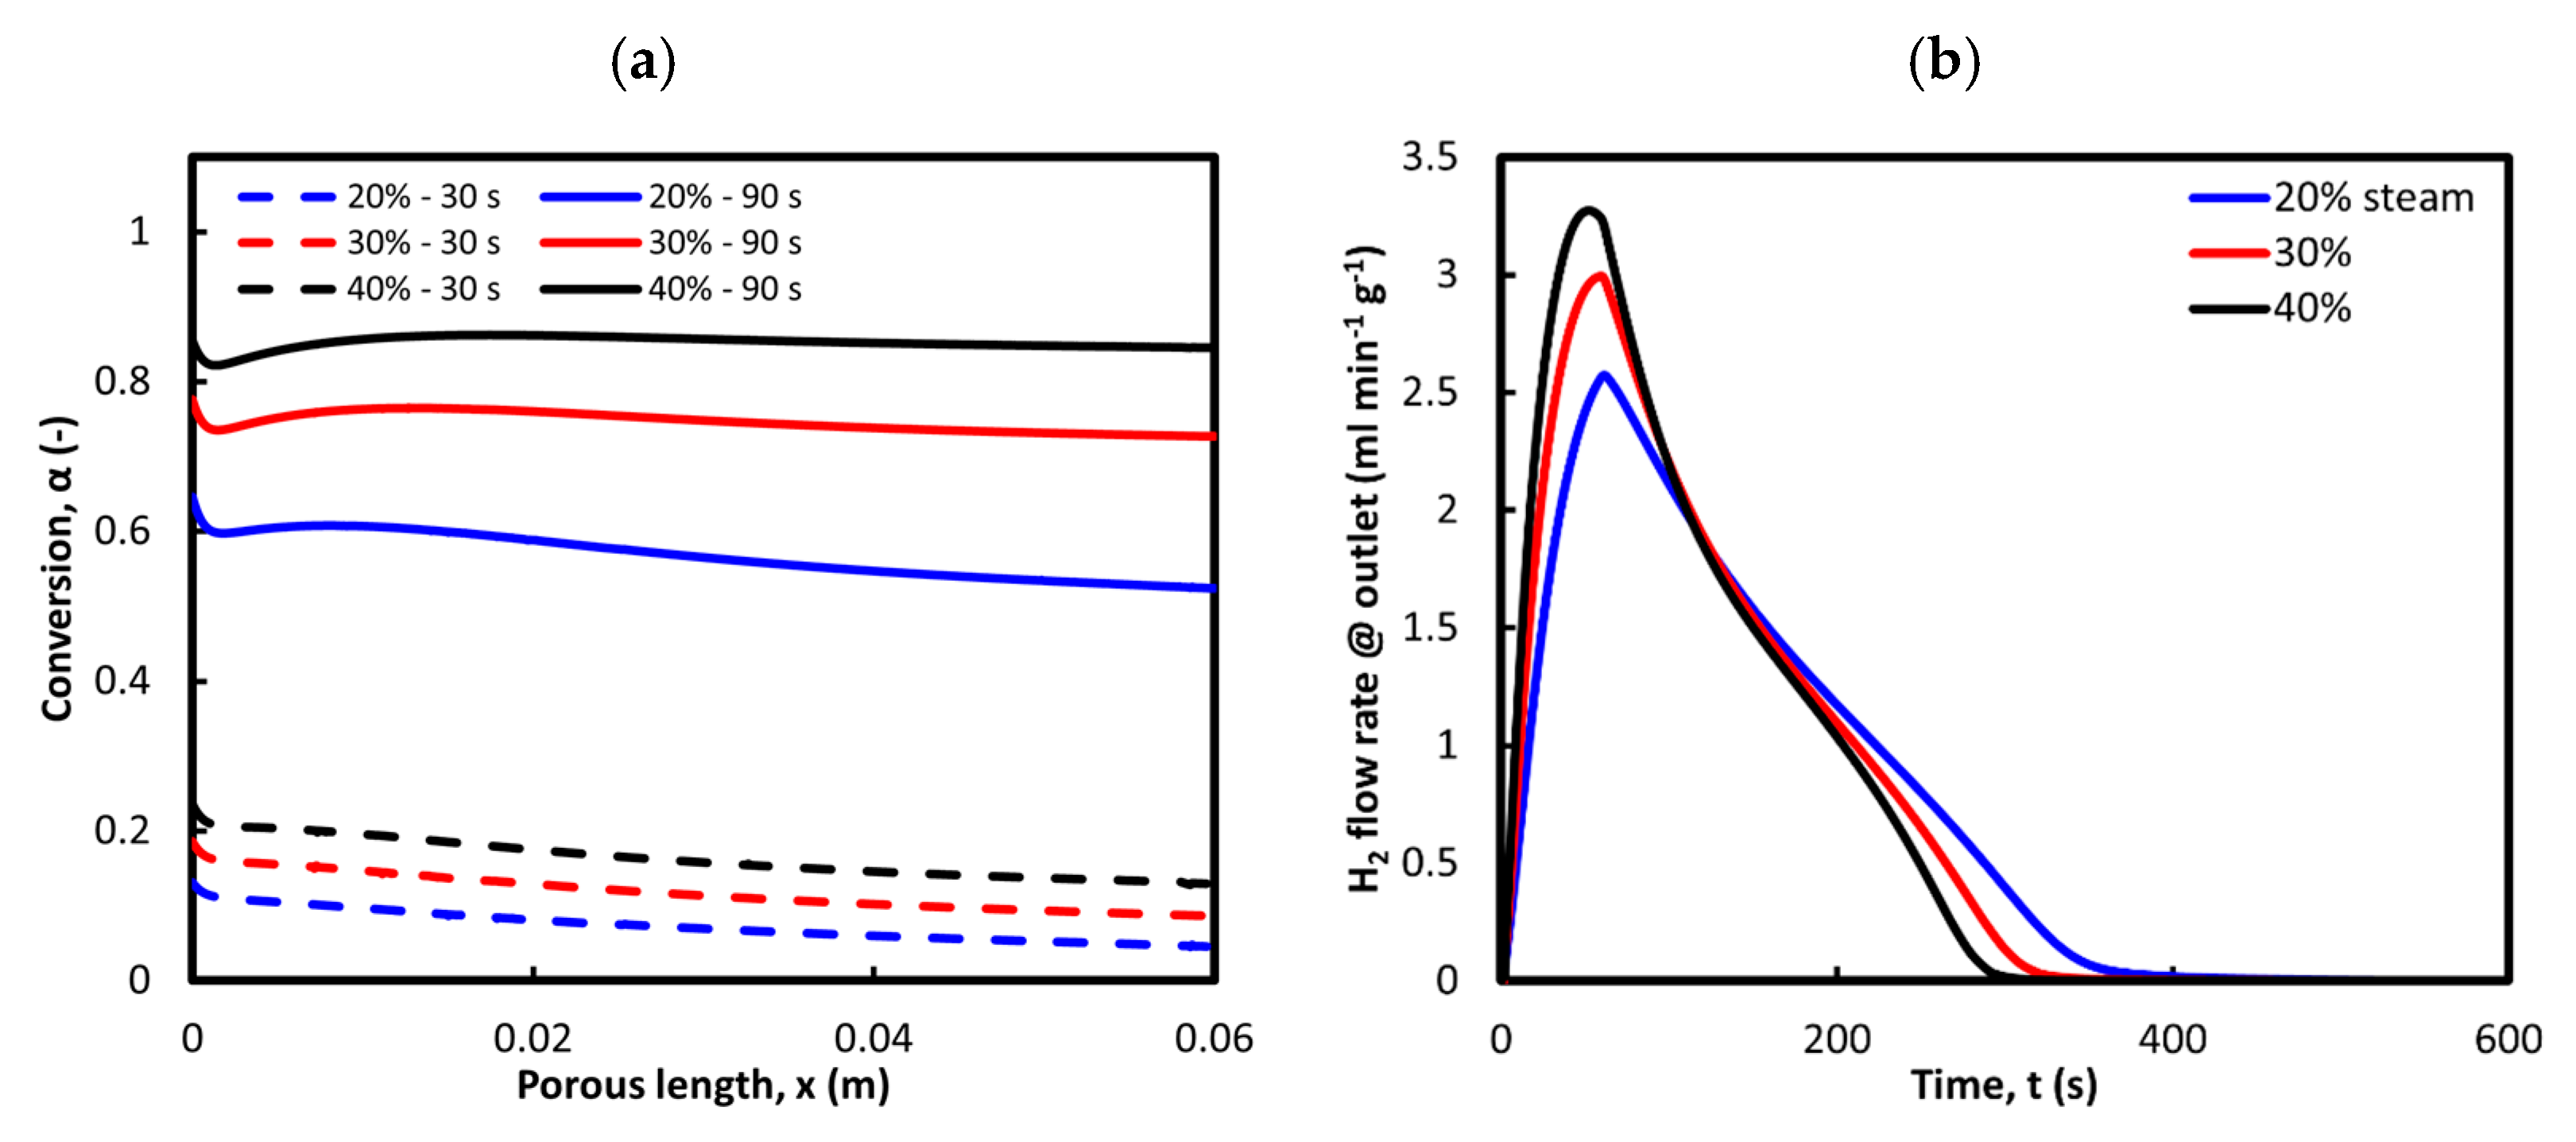
Figure 8.
Oxygen mass balance across the redox cycle as a function of the reduction flow rate and steam content in the oxidation feed. (a) Gas moles (monoatomic oxygen released during reduction, red markers; molecular hydrogen produced during oxidation, other colored markers) exchanged during the redox cycle. The top-left inset shows the zoomed-in points. (b) Reoxidation extent (moles of molecular hydrogen produced per mole of monoatomic oxygen released).
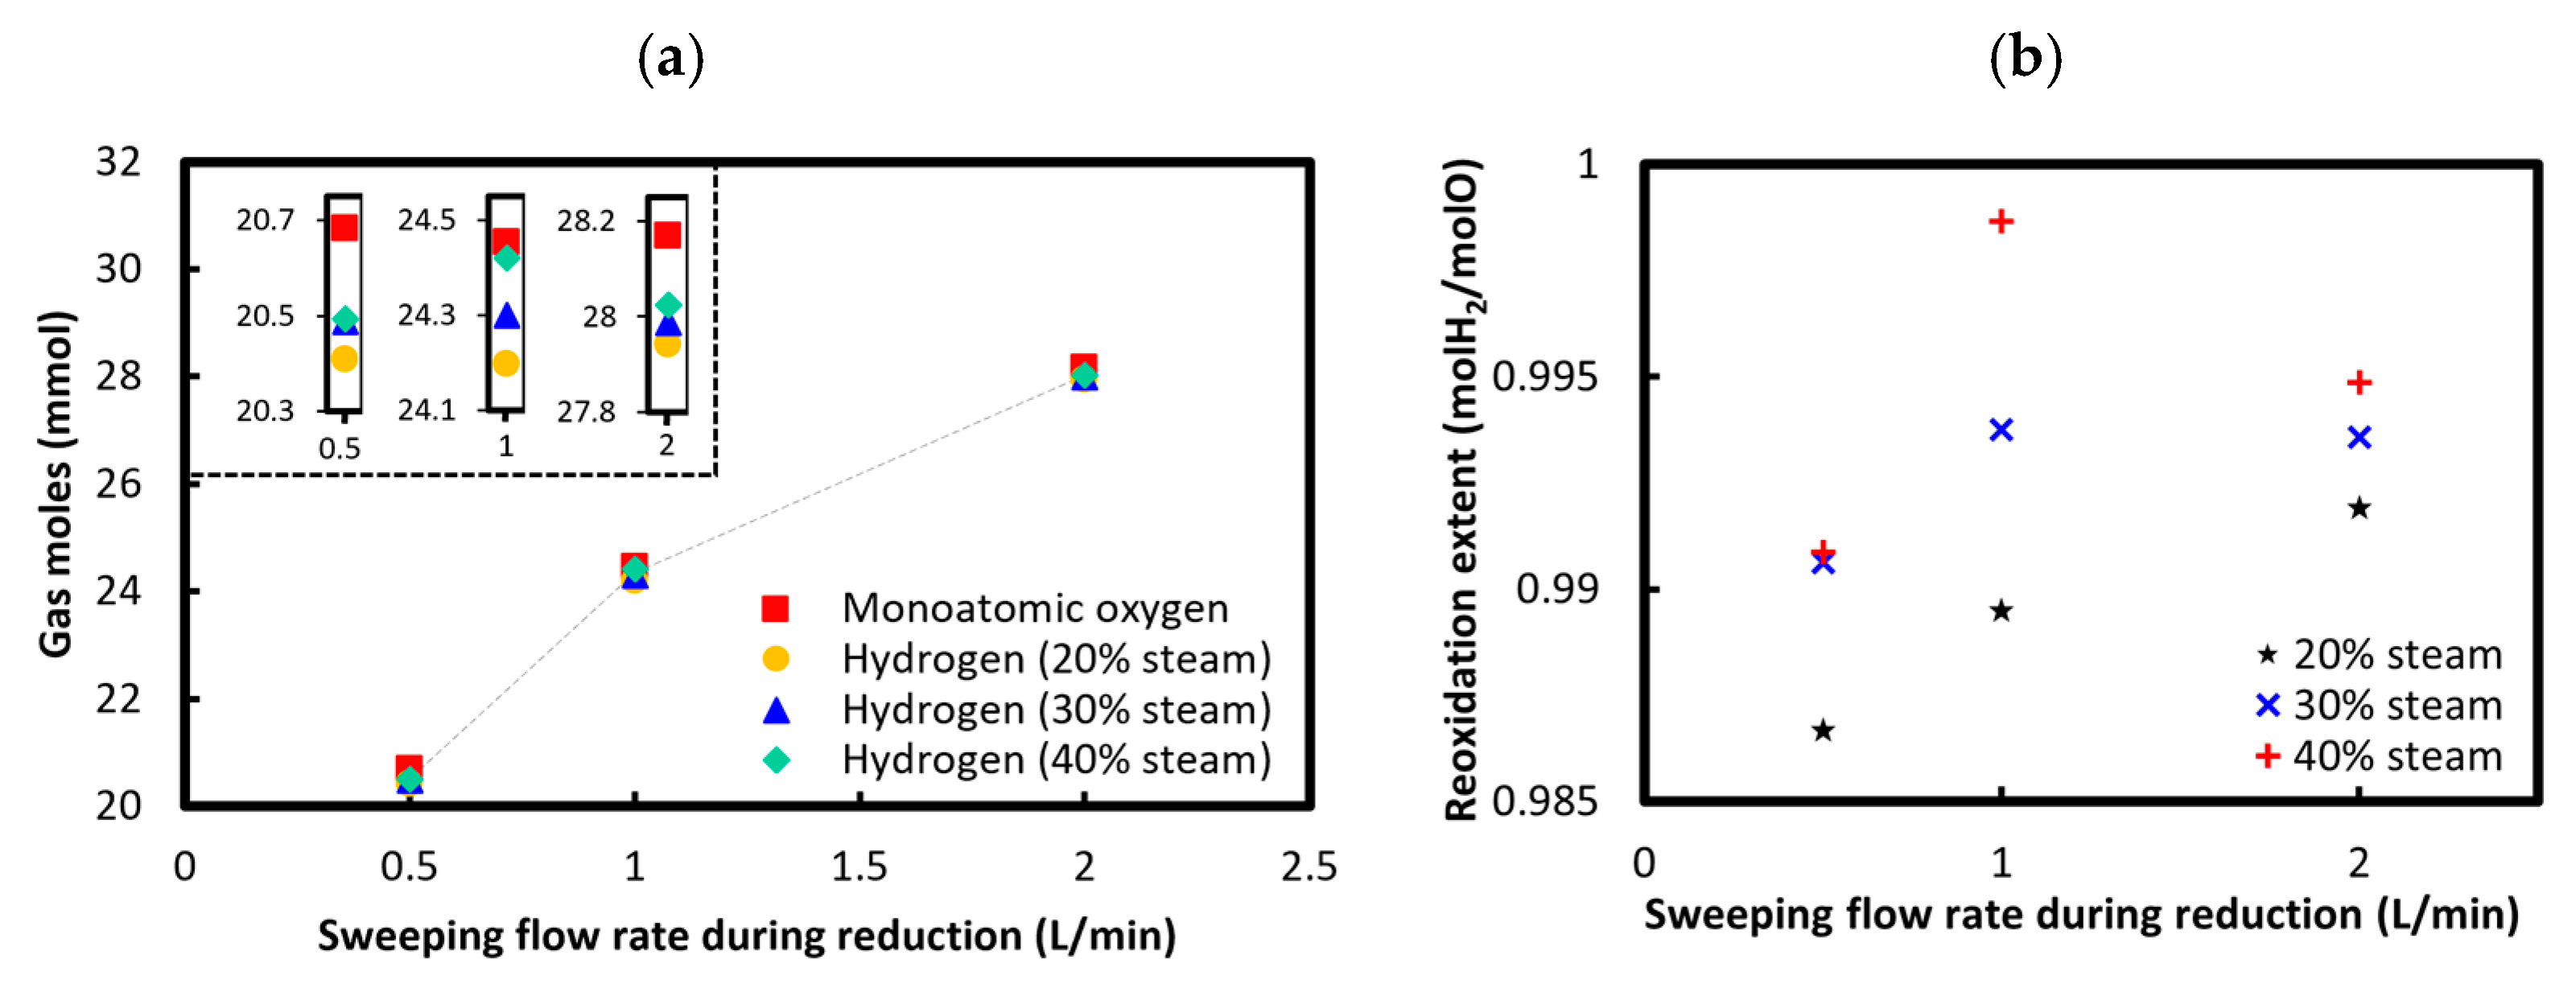
Figure 9.
Nonstoichiometry and reaction rate results from the simulation of three consecutive redox cycles.
Figure 9.
Nonstoichiometry and reaction rate results from the simulation of three consecutive redox cycles.
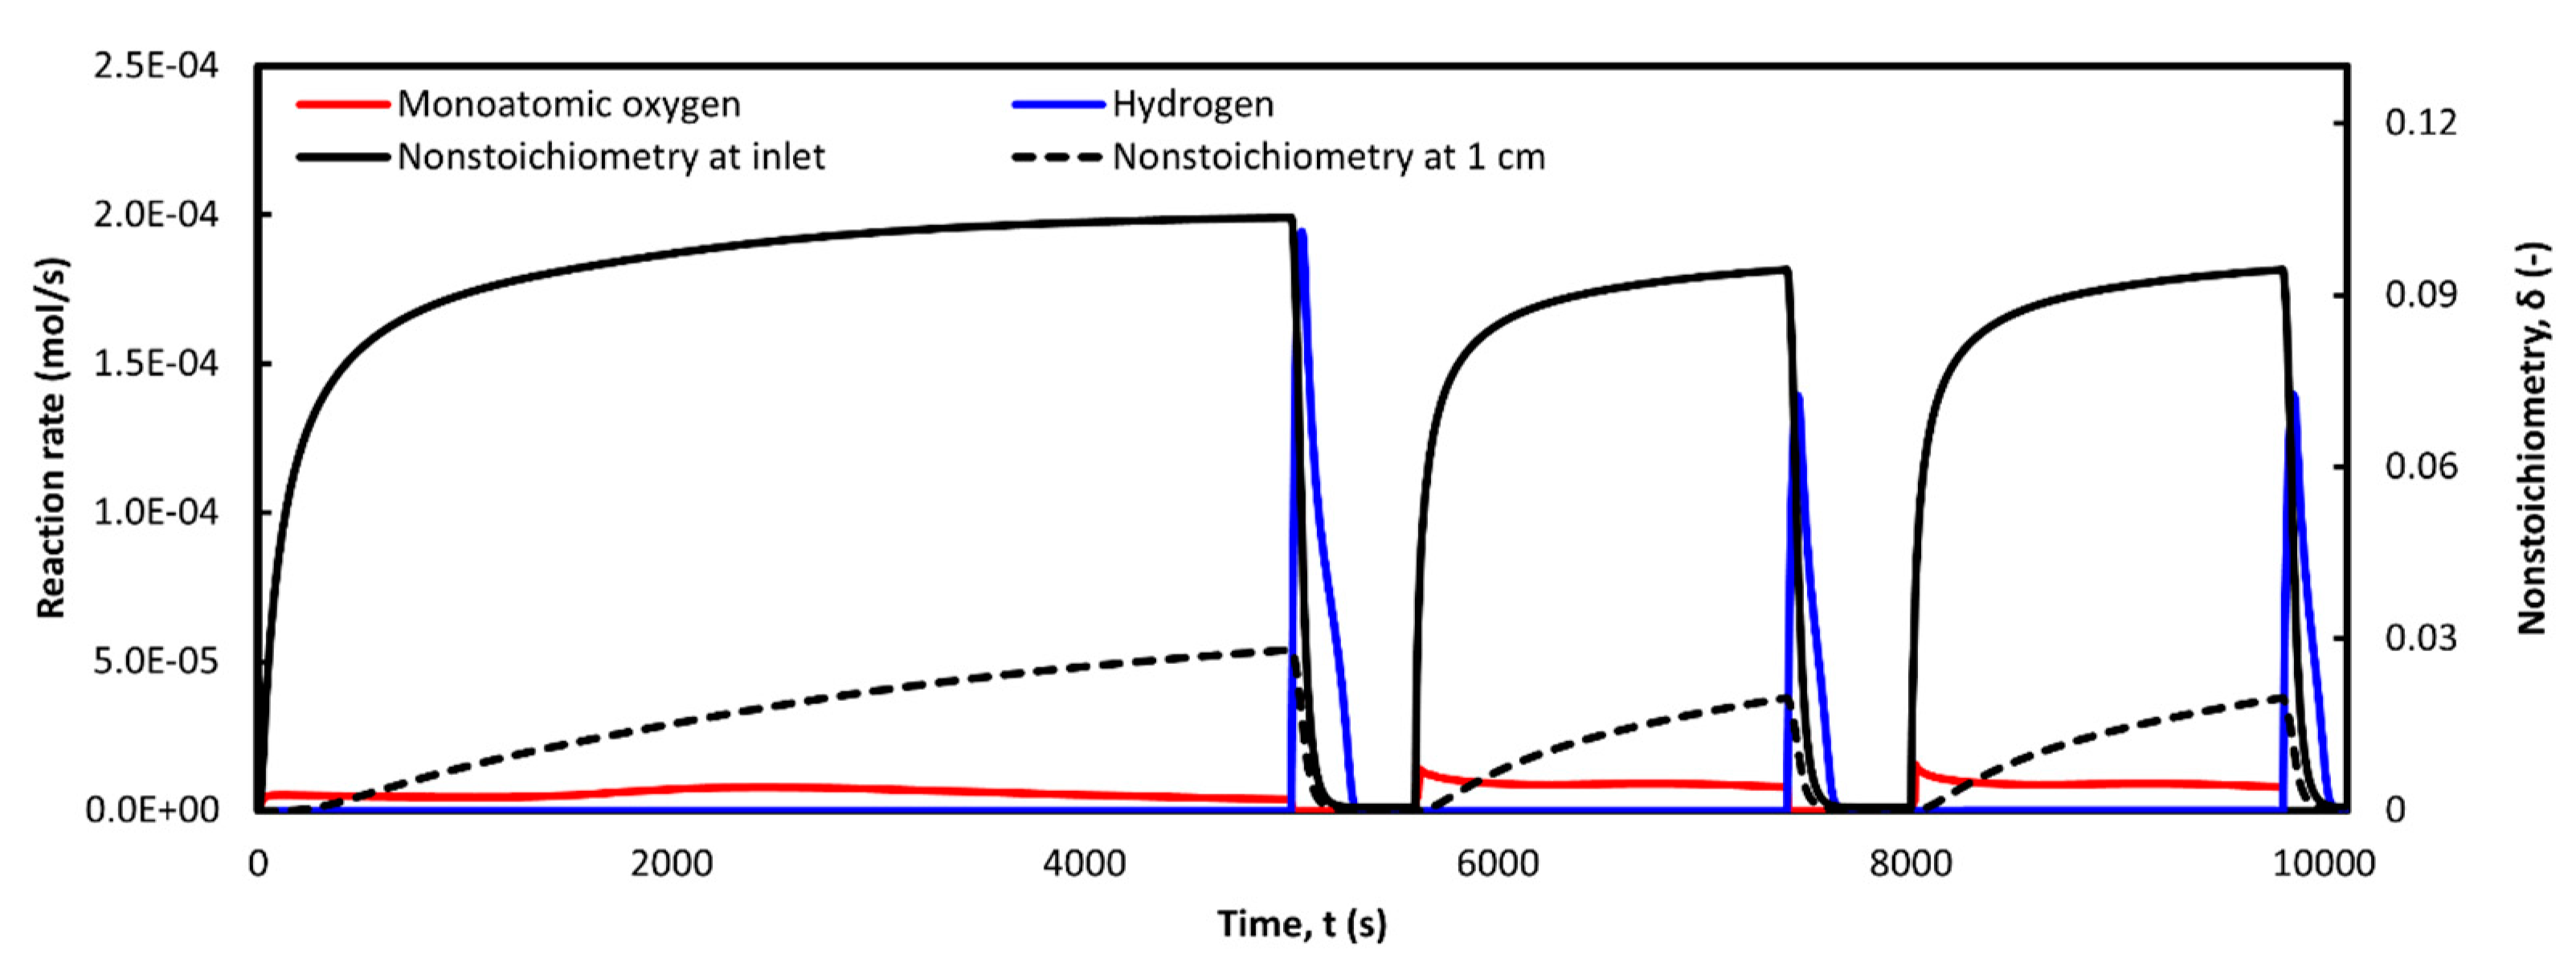
| Kinetic parameter | Value | Units |
|---|---|---|
| 720000 | ||
| 232 | ||
| 82 | ||
| 36 | ||
| 0.218 | 1 | |
| 1 | ||
| 29 | ||
| 0.89 | 1 |
Table 5.
Thermophysical properties assumed in the model.
| Property | Value | Units |
|---|---|---|
| Ceria | ||
| Porosity | 0.7 | |
| Molar mass | 172.115 [32] | |
| Density | 7215 [32] | |
| Thermal conductivity | 0.5615 [32] | |
| Heat capacity at constant pressure | [72] | |
| Gas mixture | ||
| Density | Molar fraction averaged | |
| Thermal conductivity | Molar fraction averaged | |
| Specific heat capacity | Mass fraction averaged | |
| Viscosity | Molar fraction averaged |
Table 7.
Experimental conditions were implemented in the simulation for oxidation model validation [60].
Table 7.
Experimental conditions were implemented in the simulation for oxidation model validation [60].
| Parameter | Experimental value [60] |
|---|---|
| Ceria mass (g) | 0.15 |
| Wall/inlet temperature (°C) | 800 |
| Reactor pressure (torr) | 75 |
| Inlet flow rate (sccm) | 500 |
| H2O inflow molar fraction (-) | 0.2 |
| Reduction temperature (°C) | 1500 |
| Reduction pressure (torr) | 600 |
Disclaimer/Publisher’s Note: The statements, opinions and data contained in all publications are solely those of the individual author(s) and contributor(s) and not of MDPI and/or the editor(s). MDPI and/or the editor(s) disclaim responsibility for any injury to people or property resulting from any ideas, methods, instructions or products referred to in the content. |
© 2024 by the authors. Licensee MDPI, Basel, Switzerland. This article is an open access article distributed under the terms and conditions of the Creative Commons Attribution (CC BY) license (http://creativecommons.org/licenses/by/4.0/).
Copyright: This open access article is published under a Creative Commons CC BY 4.0 license, which permit the free download, distribution, and reuse, provided that the author and preprint are cited in any reuse.


