Submitted:
20 December 2024
Posted:
23 December 2024
You are already at the latest version
Abstract
Nanostructured hybrid materials based on the combination of semiconductor QDs and GO are promising candidates for different optoelectronic and catalytic applications, being able to produce such hybrid materials in solution will expand their possible range of applications. In the current work, capping ligand exchange procedures have been developed to replace the lead oleate normally found on the surface of PbS QDs synthesized by the popular hot-injection method. After the capping ligand exchange process, the QDs are water soluble, which makes them soluble in most GO solutions. Solution-processed nanostructured hybrid materials based on GO flakes decorated with ligand exchanged (EDT, TBAI and L-Cysteine) PbS QDs were synthesized by combining PbS QDs and GO solutions. Afterward, the resulting hybrid materials were thoroughly characterized by means of FTIR, XPS, Raman, UV-Vis-NIR and photoluminescence spectroscopy, as well as SEM and TEM techniques. The results indicate a clear surface chemistry variation in the capping ligand exchanged PbS QDs, showing the presence of the exchanged ligand molecules. Thin films from the solution processed nanostructured hybrid materials were deposited by the spin-coating technique and their optoelectronic properties were studied. Depending on the capping ligand molecule, the photoresponse and resistance of the thin films varied; the sample with the EDT ligand exchange showed the highest photoresponse and the lowest resistance. This surface chemistry had a direct effect on the charge carrier transfer and transport behavior of the nanostructured hybrid materials synthesized. These results show a novel and accessible route to synthesize solution-processed and affordable nanostructured hybrid materials based on semiconductor QDs and GO. Additionally, the importance of the surface chemistry displayed by the PbS QDs, and GO, was clearly seen to determine the final optoelectronic properties displayed their hybrid materials.
Keywords:
Hybrid materials
; PbS QDs
; GO
; Optoelectronic properties
1. Introduction
Nanostructured Hybrid Materials (NHMs) based on graphene oxide (GO) or reduced graphene oxide (rGO) with semiconductor nanoparticles or quantum dots (QDs) are promising candidates to fulfill the grand expectations for solution-processed and affordable hybrid materials with tunable optical, electrical, and catalytical properties [1,2,3,4,5,6,7,8]. Common GO synthesis methodologies produce aqueous soluble GO [9]; whereas commonly used synthesis methods to produce semiconductor QDs yield nanostructures soluble in organic solvents [10]. Hence, simple solution-processed methodologies to form hybrid materials based on these types of nanostructures require the GO/rGO functionalization [2,5,11] or the ligand exchange on the nanoparticles. Ligand exchange methodologies on nanoparticles have been widely studied, mainly due to the variation it induces on the values of the nanoparticles’ highest occupied molecular orbital (HOMO) and lowest unoccupied molecular orbital (LUMO) [12,13]. Ligand exchange procedures normally have as main goal to replace long organic chain molecules for shorter chain ligands on the QDs’ surface, in order to improve their electronic properties, such as charge carrier mobility, and manipulate the majority charge carrier type [14]. These, and other, physical properties can be manipulated by the capping ligand molecule on the QDs’ surface. Capping ligand molecules commonly feature a polar head and an aliphatic non-polar group on its other end, providing steric stabilization and dispersibility in organic solvents [14]. Common polar heads include amines, carboxyl, thiols, and phosphates. These functional groups interact with the metallic cations on the QDs’ surface, producing non-stochiometric QDs, resulting in a doping effect affecting charge carrier concentration, while charge carrier mobility is highly influenced by the capping ligand length passivating the QDs’ surface [14]. Capping ligand molecules found on the QDs’ surface play a significant role in the control of their dispersibility, ambient stability and electrical properties (such as charge carrier concentration, mobility, electronic structure, and surface defects). X. Zhang et al. [15] passivated the surface of PbS QDs via ligand exchange in solid and liquid phase. For the solid phase exchange, synthesized PbS QDs with oleic acid as the capping layer were deposited on a glass substrate; afterward, they were treated with tetrabutylammonium iodide (TBAI), where oleic acid is exchanged for the I- ion in TBAI. Whereas for the liquid phase exchange, PbS QDs were dissolved in octane while TBAI was dissolved in dimethylformamide (DMF); afterward, both solutions were mixed and vigorously agitated, resulting in the PbS QDs transfer from the octane to the DMF, indicating the presence of the TBAI on the PbS QDs’ surface. They confirmed this idea with FTIR results; however, these results also suggested an incomplete ligand exchange, since low intensity signals related to the oleic acid were still detected. Even though, an improved ligand exchange for the liquid phase methodology has been observed. Several references have reported the ligand exchange in solid phase [6,12,14], however, in a liquid phase exchange QDs have a larger surface area in contact with the capping ligand molecules to be exchanged, and not only the exposed top surface available in solid phase ligand exchange methodologies [14].
On the other hand, another possibility is to functionalize GO or rGO, this procedure implies chemically treating them in order to bond, either covalently or electrostatically, a functionalizing molecule to their surface. This molecule would interact with, or replace, the hydroxyl or carboxyl functional groups found on GO and rGO, while its other end is capable to interact with the QDs’ surface, either by replacing its capping ligand molecule or interacting with it [2,5,11,16,17,18], thus creating a hybrid material that would enhance charge carrier transfer between the nanostructures and charge carrier transport in the resulting hybrid material. One of the goals to perform a surface modification in GO is to reduce its hydrophilicity, improving its solubility in organic solvents, hence, making it soluble in similar medias where QDs are normally found after their original synthesis [5,11]. Several of these functionalization procedures involve complicated methodologies that include long reaction times, multiple-steps methods, non-sustainable chemical reactants, among other disadvantages.
In the current study, PbS QDs were synthesized by the hot-injection method; afterward, the original lead oleate found on their surface as capping layer was exchanged in liquid phase for three different capping ligands soluble in aqueous solutions: ethanedithiol (EDT), TBAI and L-Cysteine (L-Cys). Then, previously synthesized GO was dissolved in ethanol to prepare a hybrid material based on the PbS QDs with the capping ligand exchanged decorating the GO flakes in solution. These hybrid materials were thoroughly characterized by different techniques, such as UV-Vis-NIR optical absorption, X-ray Photoelectron Spectroscopy (XPS), Fourier Transform IR spectroscopy (FTIR), Raman spectroscopy and Transmission Electron Microscopy (TEM). Afterward, thin films were prepared with these hybrid materials by spin-coating and were characterized by Scanning Electron Microscopy (SEM) and their electrical properties were studied.
2. Experimental Methodology
Materials: For the PbS QDs synthesis, the following reactants were used: Lead oxide (PbO) 99.99%, oleic acid (OA) 90%, 1-octadecene (ODE) 90%, hexamethyldisilathiane (TMS) reactive grade, diphenylphosphine (DPP) 98%, hexane and chloroform (CHCl3) were acquired from Sigma-Aldrich, while solvents such as acetone and isopropyl alcohol, ethanol and methanol were acquired from CTR Scientific.
The molecules used for the capping ligand exchange, L-Cysteine (L-Cys) 97%, 1,2-ethanedithiol (EDT) and tetrabutylammonium iodide (TBAI) were acquired from Sigma-Aldrich.
For the GO synthesis natural graphite was used, concentrated sulfuric acid (H2SO4), phosphoric acid (H3PO4), potassium permanganate (KMnO4), hydrogen peroxide (H2O2), hydrochloric acid, (HCl), at 30%, and ether, which were acquired from Sigma-Aldrich.
PbS QDs Synthesis: For the synthesis of the PbS QDs, the rapid hot-injection method was used, following procedures previously reported [10,19]. PbO (0.45 gr) was dissolved in the mixture of ODE (20 mL) and OA (1.6 mL), followed by magnetic stirring. This solution was degassed at 115°C under N2 atmosphere until it became completely clear and without bubbles, approximately for 1 h. Simultaneously, the sulfur precursor solution is prepared in a glove box under Ar atmosphere, for this solution 210 μL of TMS, 2 mL of ODE, and 100 μL of DPP were stirred for 30 min at room temperature. The sulfur precursor was injected rapidly into the lead precursor solution under N2; and after 4 seconds of reaction time, the reaction was cooled down with cold acetone. PbS QDs were washed five times in acetone using centrifugation (9000 rpm, 30 min) and redispersed in chloroform. The precipitated QDs were finally dissolved in chloroform.
PbS QDs Ligand Exchange: PbS QDs solution with a concentration of 5 mg mL-1 was prepared. 0.125 gr of PbS QDs were added to 25 mL of hexane, or chloroform, in order to obtain the desired concentration. Solutions were prepared with EDT and TBAI in methanol with concentrations of 0.175 M and 0.027 M, respectively. L-Cys was dissolved in deionized (DI) water in order to form a solution with a concentration of 0.075 M, it is worth to mention that this solution needed to be prepared right before it was intended to be used, otherwise, after 24 h large L-Cys crystals started to form in the solution, and then it was not useful for the intended purpose. For the ligand exchange with EDT and TBAI, 1 mL of their solution were mixed with 1 mL of the PbS QDs solution in hexane; then this mixture was vigorously agitated for 1 min, and it was left to rest for 1 min; after this rest time, the PbS QDs could be seen to change from the organic phase to the aqueous phase, indicating the proper ligand exchange. Then, the PbS QDs were extracted and stored in 2 mL centrifugation tubes, where the vials were filled with methanol. In the case of the L-Cys ligand exchange, 1 mL of the L-Cys solution in DI was mixed with 1mL of PbS QDs solution in chloroform, then this mixture was vigorously agitated for 1 min and left to rest for 1 min; again, it was possible to see the PbS QDs change from the organic phase to the aqueous phase. Afterward, the PbS QDs were extracted and stored in 2 mL centrifugation tubes, where the vials were filled with acetone. Then, all the samples were centrifuged at 13,000 rpm for 10 minutes in a Fisher Scientific Accum Spin micro17 centrifuge; after centrifugation, the supernatant was extracted, and the particles were redispersed in methanol. This process was repeated two additional times. Finally, the PbS QDs are redispersed in ethanol and centrifuged at 13,000 rpm for 10 minutes, the supernatant is again discarded, and the particles are redispersed in ethanol, this process is repeated one additional time, and the particles are finally left in ethanol for further processing.
GO synthesis: GO was synthesized using the method reported by Marcano et al. [9]. After the synthesis, GO was dispersed in ethanol.
Nanostructured Hybrid Materials (NHMs) Preparation: 4 mL of PbS QDs in ethanol with the new capping ligand molecule were deposited in 8 mL vials, this QDs solution and the GO solution were ultrasonicated, separately, for one minute; afterward, 300 μL of GO were added to the 4 mL PbS QDs solution in the 8 mL vials, they were vigorously agitated and left for 2 minutes in the ultrasonic bath. Later, the solutions were centrifuged at 13,000 rpm for 10 minutes, the supernatant was discarded and the NHMs were redispersed in ethanol.
NHMs Thin Films Deposition: Thin films of the prepared NHMs were deposited via spin coating on glass substrates thoroughly cleaned. A spin coater WS-400BZ-6NPP/LITE was used for this purpose. The deposition speed used was 2500 rpm; 1100 mL of the hybrid material were deposited on the glass substrate dropwise, while the substrate is spinning, 5 seconds in between drops were waited to let the ethanol evaporate. Once the deposition process is finished, the thin films are left to dry, and afterward, they are stored in a glove box under an Ar atmosphere and in dark conditions.
Physical Characterization: UV-Vis-NIR optical absorption spectroscopy studies of the PbS QDs, before and after the ligand exchange, were performed in an Agilent, Cary 5000 spectrometer, in the range between 200 nm and 1100 nm. Photoluminescence (PL) spectroscopy studies were performed in a StellarNet, Silver-Nova Fluor system, in the range between 700 nm and 1100 nm, with an excitation wavelength of 655 nm. For both studies, the samples were in solution, chloroform for the sample before the ligand exchange and ethanol for the samples after the ligand exchange. Fourier Transform Infrared (FTIR) spectroscopy studies were performed in a FTIR Interspec 200-X spectrometer, in the range between 400 cm-1 and 4000 cm-1, the samples were prepared with KBr in order to perform the measurements. Raman spectroscopy measurements were performed on a LabRAM HR Horiba Scientific spectrometer, with an excitation laser of 633 nm, an acquisition time of 5 s and an objective lens of 50X. X-ray Photoelectron Spectroscopy (XPS) measurements were performed on a ThermoScientific, K-Alpha spectrometer, featuring an Al Kα radiation source (1486.68 eV); for these studies, deposited thin films were used from the different samples. Scanning Electron Microscopy (SEM) studies were performed in a Hitachi, SU8020 with an acceleration voltage of 1 kV and a beam current of 10 μA, for this study, only the thin films of the NHMs were analyzed. TEM studies were performed in a FEI, TEM Titan G2 80–300 operated at 300 kV, with scanning transmission electron microscopy (STEM) capabilities, and equipped with a high-angle annular dark-field (HAADF) detector from Fishione; a bright-field (BF) and dark field (DF) STEM detectors from Gatan; and an EDAX energy-dispersive X- ray spectroscopy (EDXS) detector. TEM samples from the PbS QDs in solution were prepared by depositing one drop of the solution on carbon coated Cu grids; while the samples from the NHMs thin films were prepared as follows: the thin films were detached from the substrates; then, the thin films were grinded in an agata mortar; finally, the fine powder was deposited on lacey carbon Cu grids.
Electrical Properties Characterization: For the electrical properties studies, a Keithley 6487 picoammeter was used. I-V and photoresponse curves were acquired for the NHMs thin films. Silver paint was used for the electrodes to perform the measurements. For the I-V curves, the voltage was varied between 0 V and 20 V. Whereas for the photoresponse measurements 20 V were used, leaving the sample in a dark box for 20 seconds; then exposing it to 50 W tungsten halogen lamp for 20 seconds; and finally turning the light source off while measuring the current for another 20 seconds.
3. Results and Discussion
The synthesized and ligand exchanged PbS QDs were analyzed via UV-Vis-NIR and PL spectroscopy. Figure 1 shows the results obtained for these studies. The optical absorption spectra for the OA capped sample showed an absorption peak maximum at ~755 nm. After the ligand exchange, this absorption peak maximum shifted to approximately 811, 810 and 815 nm for the capping ligands L-Cys, TBAI and EDT, respectively. This variation in the absorption peak maximum can be associated with an increase in the average particle size in the different samples, as has been reported previously [20]. Additionally, the full width at half maximum (FWHM) in all ligand exchanged samples showed an increase, compared to the OA sample, with less intense and broader absorption peaks. These observations can be associated with an increment in particle size dispersion.
The PL spectra, shown as the dark lines in Figure 1, showed an emission signal with a Stokes shift of 100 nm, 115 nm, 84 nm, and 160 nm for the samples with the capping ligand of OA, L-Cys, TBAI and EDT, respectively. This emission is produced due to the radiative recombination of the photogenerated excitons (electron-hole pairs) within the QDs [21]. These Stokes shift variations can be related to the surface trap states generated by the defects found on the QDs’ surface; defects that have been observed in the case of PbS QDs, mainly originated by the surface passivation of OA, which displays a preferential interaction with Pb atoms, leaving un-passivated S atoms on the surface of the QDs, hence forming the mentioned surface trap [21]. The measured Stoke shift is different in all the samples analyzed; these variations will be discussed in more detail later in the manuscript.
Figure 2 shows STEM-HAADF images of the samples after the capping ligand exchange procedure with the different capping ligands, slight variations in the QDs size, shape and size distribution can be observed in the images. The measured average particle size for the QDs capped with OA, EDT, L-Cys and TBAI was 3.48 nm, 3.68 nm, 3.5 nm, and 3.79 nm, respectively (Table 1). As was suggested by the optical absorption results, a slight increment in the average particle size was observed in the STEM results for the QDs with the ligand exchanged.
Figure 3 shows the FTIR and the Raman spectroscopy results for the analyzed samples. For the PbS QDs originally synthesized with the OA as capping ligand (Figure 3a) three bands related to the symmetric vibrations of the methylene (-CH2) group can be observed at ~722, ~2853 and ~2924 cm-1; while the bands seen at ~1405 and ~1540 cm-1 correspond to the stretching of the C=O group; finally, a slow intensity band can be seen at ~3006 cm-1 related to the stretching of the C-H group. These bands can be attributed to the presence of the OA molecule on the surface of the PbS QDs [22]. In the case of the capping ligand exchanged PbS QDs, the intensity of the bands observed at ~2853 and ~2924 cm-1 decreased considerably, while the band at ~722 cm-1 can’t be detected (Figure 3a); for the case of the bands observed in the region between 500 and 1700 cm-1, new signals appeared, others disappear and others changed in intensity; all these observations support the idea of the capping ligand exchange occurring in the studied samples. Analyzing each specific case separately, it can be seen that for the EDT ligand exchange sample a new band appeared at ~825 cm-1, related to the C-S group present in the EDT molecule [22]. For the case of the TBAI ligand exchanged sample, it can be seen that all the signals related to vibrations of the C-H groups disappeared (Figure 3a), fact that has been previously reported in the literature as evidence of the OA ligand exchange for TBAI [23]. Lastly, for the L-Cys ligand exchange, it has been reported that the L-Cysteine molecule displays bands at ~1588 cm-1 and at ~1650 cm-1 related to the asymmetric stretching vibration of the carboxylate (COO-) group and the bending mode of the -NH2 group, respectively [24]; both signals can be observed in the PbS-L-Cys sample (Figure 3a), which confirms the presence of the L-Cysteine molecule on the surface of these ligand exchanged PbS QDs. It can also be noted that a clear signal related to the functional group -OH can be observed in the samples after the ligand exchange procedure (Figure 3a), this is a consequence of the ligand exchange process, and it is attributed to the solvent used during this process (ethanol) and the fact that the samples were dispersed in ethanol right before the FTIR analysis was performed. It is worth noting that for the case of the EDT ligand exchange the bands related to the C=O and -CH2 functional groups, possibly from the OA molecule, are still present, with a lower intensity than in the PbS-OA sample, but higher intensity than in the other ligand exchange samples. This could be related to the presence of OA molecules on the surface of the PbS QDs exchanged with EDT, which could be associated with a less effective ligand exchange process.
Figure 3b shows the Raman spectra acquired for the different PbS QDs with the different capping ligands in the region between 0 and 1000 cm-1. For the PbS QDs with OA as capping ligand two clear peaks can be observed at 81 cm-1 and 135 cm-1. Sample PbS-EDT showed peaks at 40 cm-1, 68 cm-1, 125 cm-1 and 962 cm-1. The PbS QDs with L-Cysteine as capping ligand showed five different peaks at 34 cm-1, 62 cm-1, 89 cm-1, 137 cm-1, and 962 cm-1, some of them similar to the peaks observed in the previous sample. Finally, sample PbS-TBAI showed four peaks at 42 cm-1, 80 cm-1, 136 cm-1 and 963 cm-1. For bulk PbS, and microcrystalline PbS, transverse acoustic (TA) phonon modes have been reported at 48 cm-1; whereas longitudinal acoustic (LA) modes have been reported at 84 cm-1 [25]. The TA phonon mode could be related to the signals observed in the PbS QDs around 40 cm-1, like the peak at 40 cm-1 in PbS-EDT sample and the peak at 42 cm-1 in PbS-TBAI sample; while the LA phonon mode signal could be related to the peak seen at 81 cm-1 in the PbS-OA sample, the peak at 89 cm-1 in the PbS-L-Cys sample, and the peak at 80 cm-1 in the PbS-TBAI sample. The variations in the final value of the phonon vibrations might be a consequence of the interactions between the capping ligand molecule and the QDs surface atoms, which might produce variations in the interplanar/interatomic distances at the surface of the QDs, as part of surface reconstruction effects previously reported in nanoparticles [26,27]. These variations in the distances between neighboring atoms will have a direct effect on the vibrational behavior displayed by the QDs. Additionally, several peaks between 34 cm-1 and 68 cm-1 appear in these samples, without clear connections to vibrational modes observed in bulk PbS. These additional peaks might be related to the mechanical softness displayed by QDs’ surface [28], which affects surface phonons by making them exhibit reduced symmetry and low energies [28]. It has been proposed that another consequence of this mechanical softness is the generation of a large number of low energy surface phonons on QDs, up to 200 possible additional vibrational modes [28]. The appearance of byproducts due to the degradation/photo-oxidation of PbS QDs due to the interaction with the laser from the equipment during Raman analyses has also been previously reported [29]; these signals are found between 100 cm-1 and 1000 cm-1. The peaks seen at 136 cm-1, 137 cm-1, 125 cm-1 and 135 cm-1 in samples PbS-TBAI, PbS-L-Cys, PbS-EDT and PbS-OA, respectively, can be attributed to the Pb-O-Pb stretching in lead oxide, as it has been previously reported [29]. The oxidation of the anion in PbS QDs gives rise to peaks between the 600 cm-1 and 1000 cm-1 range, associated with the formation of SO4 species, specifically to lead sulfate, PbSO4 [29]. The peaks at 967 cm-1, 963 cm-1 and 962 cm-1 seen in samples PbS-L-Cys, PbS-TBAI and PbS-EDT, respectively, can be attributed to the presence of PbSO4 in these samples [13,29].
XPS analyses were performed in all the synthesized samples. These results showed the variations produced by the capping ligand exchange process in the chemical state of the QDs’ surface atoms. Figure 4 shows the high-resolution XPS spectra corresponding to the Pb4f peak of the four samples studied. In the PbS-OA sample, the deconvolution analysis resulted in two signals (Figure 4a), two peaks observed at ~137 eV and ~142 eV, which can be related to the PbS 7/2 and PbS 5/2 peaks from the Pb-S bond, respectively; while the second signal, located at ∼139 eV and ∼144 eV, can be related to the presence of PbSO4 or PbO in the sample [30]. Sample PbS-EDT (Figure 4b) showed the same signals, with a clear difference in the ratio between the intensities of the peaks related to the PbS signal and the peaks related to the PbSO4/PbO signal; observing a larger ratio in the PbS-EDT sample, which can be interpreted as a lower presence of PbSO4 or PbO in this sample; which can be associated to a more stable sample under atmospheric conditions due to an improved surface protection of the capping ligand on the QDs surface. Figure 4c shows the XPS spectra for the Pb4f peak from sample PbS-TBAI, in this case two peaks can be observed at ~137 eV and ~142 eV, which can be related to the PbS 7/2 and PbS 5/2 peaks from the Pb-S bond, respectively [31]; two additional peaks of lower intensity can be observed at ~139 eV and ~144 eV, signals related to the Pb-I bond, as it has been previously reported [31]. This evidence, along with the FTIR and Raman results, contributes to support the idea of the OA being replaced by the TBAI during the capping ligand exchange process. Moreover, the absence of signals related to the degradation of PbS to PbSO4 and/or PbO, suggest that this capping ligand exchange produces PbS QDs with higher stability to ambient conditions. Finally, Figure 4d shows the XPS spectra for the Pb4f peak from PbS-L-Cys sample, where only the two peaks related to PbS 7/2 and PbS 5/2 signals of the Pb-S bond can be observed [30]; just like in the previous case, no other signals related to the degradation of PbS suggest the production of QDs with improved stability to ambient conditions due to the capping ligand exchange with L-Cysteine producing better capped QDs’ surfaces.
Figure 5 shows the XPS S2p peak for the different samples studied. Figure 5a shows the S2p peak for the PbS-OA sample, where four different signals can be observed, at ~160 eV and ~161 eV the peaks correspond to the S2p3/2 and S2p1/2 signals, respectively [32]; and the peaks at ~167 eV and ~170 eV indicate the presence of oxysulphides, such as SO32- and SO42-, products of S oxidation [33]. For the case of sample PbS-EDT (Figure 5b), again the signals related to the Pb-S bond can be observed at ~160 eV and ~161 eV (S2p3/2 and S2p1/2, respectively) [32]; while the peak at ~163 eV corresponds to the presence of poly-sulfurs (Sn2-), found on the EDT molecules in the capping ligand [34], along with the signal observed at ~165 eV, which is related to the C-S/S-S bonds, also found on the EDT molecule [35]; finally, the signal observed at ~168 eV is related to the oxidation of S, as previously mentioned [33].
The XPS spectra corresponding to the PbS-TBAI sample (Figure 5c) shows only two signals at ~160 eV and ~162 eV, both signals attributed to the S2p3/2 and S2p1/2 peaks, respectively, observed in the Pb-S bond [32]; again, the absence of signals related to the degradation of PbS suggests a successful and effective ligand exchange procedure. Finally, for the case of the PbS-L-Cys sample, the S2p peak shows several signals. The peaks at ~160 eV and ~161 eV, correspond to the S2p3/2 and S2p1/2 signals, respectively, found in the Pb-S bond [32]; additionally, a peak at ~163 eV can be seen, related to the S-H interaction found in the L-Cysteine molecule [36]; while the peak observed at ~165 eV corresponds to the presence of oxidized S atoms (SO32-) [33]; for this case, the oxidized S atoms could be from the L-Cysteine molecule, since the Pb4f peak from this sample (Figure 4d) didn’t show a signal related to the presence of PbSO3.
For the case of the NHMs several bands were observed in their FTIR spectra (Figure 6a). In the PbS-EDT/GO sample a band at ~825 cm-1 can be seen and is attributed to the C-S group vibration [22]; at ~1416 cm-1 another signal can be observed, which corresponds to vibration of the -CH3 group found on GO [37]; at ~1629 cm-1 a band can be observed related to the vibration of the -CH2 group; while the bands observed at ~2917 cm-1 and ~3429 cm-1 correspond to the vibrations of the C-H and O-H groups, respectively [37]. Similarly, for the nanostructured hybrid material (NHM) PbS-L-Cys/GO, a band can be observed at ~845 cm-1, which corresponds to the S-H group vibration; at ~1582 cm-1 the signal related to the C-O stretching can be seen; at ~1618 cm-1 a signal corresponding to the C=O group can be observed; while the bands detected at 3100 cm-1 and ~3413 cm-1 correspond to the stretching of the OH and NH2 groups, respectively [37]. For the case of the PbS-TBAI/GO hybrid material different bands were observed, at ~610 cm-1 corresponding to vibration of secondary amide NH-C [38]; two bands characteristics of the C-O group stretching at ~1070 cm-1 and ~1385 cm-1; at ~1625 cm-1 appears the signal related to the vibration of the C=O group; finally, the bands observed at ~2919 cm-1 and ~3388 cm-1 correspond to the characteristic vibrations of the C-H and O-H stretching [37], respectively. The FTIR spectra of the GO is also presented in Figure 6a, where the characteristics bands of GO can be observed. At ~1075 cm-1 and ~1385 cm-1 the bands attributed to the vibrational modes of the epoxy (C-O-C) and carboxyl (COOH) groups can be seen [37], respectively; at ~1260 cm-1 another band related to the stretching of the C-O-C group can be observed; while the bands appearing at ~1625 cm-1 and ~1725 cm-1 correspond to the stretching and vibration of the carbonyl group (C=O) [37,39]; finally, the bands observed at ~2910 cm-1 and ~3401 cm-1 correspond to the vibrations of the C-H and O-H groups, respectively [37].
The Raman spectra for the NHMs can be observed in Figure 6b,c. Particularly, Figure 6c shows the region corresponding to the phonon vibrations observed in PbS QDs, where clear signals can be detected between ~30 cm-1 and ~144 cm-1. The peaks observed at ~82 cm-1, ~81 cm-1 and ~76 cm-1 in samples PbS-EDT/GO, PbS-TBAI/GO and PbS-L-Cys/GO, respectively, might be related to the LA phonon vibrations in PbS QDs previously discussed in this manuscript, which differ from the values measured in the only PbS QDs samples. For the case of the PbS-EDT sample no clear peak was observed close to this value, while for the case of the PbS-TBAI and PbS-L-Cys the peaks were observed at 80 cm-1 and 89 cm-1, respectively. For the case of the peaks detected at ~33 cm-1, ~37 cm-1 and ~ 30 cm-1 in samples PbS-EDT/GO, PbS-TBAI/GO and PbS-L-Cys/GO, respectively, might be related to the TA phonon vibrations in PbS QDs previously discussed in this work. The different PbS QDs samples displayed peaks related to this TA phonon vibrations at ~40 cm-1, ~42 cm-1 and ~ 34 cm-1 in samples PbS-EDT, PbS-TBAI and PbS-L-Cys, respectively. The peaks observed at ~139 cm-1, ~135 cm-1 and ~ 138 cm-1 in samples PbS-EDT, PbS-TBAI and PbS-L-Cys, respectively, are still related to the Pb-O-Pb stretching in lead oxide, as has been previously discussed in this work. The variations in the values measured can be attributed to the interaction between the PbS QDs surface and the GO flakes, which have a clear effect on the surface vibrational modes observed on the PbS QDs. All the NHMs displayed a Raman peak at ~60 cm-1, which could be related to the formation of additional low energy/low symmetry phonon vibrations, as a consequence of the QDs’ surface mechanical softness, previously discussed in this paper. Finally, when comparing the Raman spectra of the PbS QDs samples after the capping ligand process and the spectra for the NHMs, it can be observed that the Raman spectra for the PbS QDs samples showed very different surface phonon vibrations in the range between 25 cm-1 and 100 cm-1, not only in the values of the peaks observed, but also in their intensities (Figure 3b); whereas in the NHMs samples, the peaks observed, and their relative intensities, are similar in all three cases. These observations suggest that the surface phonon vibrations observed in the PbS QDs, after the hybrid material is formed, are strongly determined by the interactions between the GO flake (functional groups) and the PbS QDs surface, promoting the formations of the surface phonon modes observed in Figure 6c.
Figure 6b shows the region where the D and G band for GO can be observed (~1250 cm-1 - ~1700 cm-1). The D band is located at ~1347 cm-1 and relates to the defects and structural disorder found on the GO flakes [40], this band is also related to the vibrational modes indicating the presence of sp3 hybridization between C atoms. While the G band is located at ~1594 cm-1 and can be attributed to the in-plane stretching vibration of the C bonds with sp2 hybridization in the GO flakes [40]. All NHMs samples displayed the D and G bands in the same values, which is a confirmation of the presence of GO in the NHMs with the PbS QDs with different capping ligands. Slight variations in the ratio between the intensities of the D and G bands were seen between the different samples. While in samples PbS-TBAI/GO and PbS-L-Cys/GO the D band shows a higher intensity than the G band, indicating more disorder/more presence of sp3 hybridization in the structure of the GO flake; sample PbS-EDT/GO displayed a G band slightly higher than the D band, more similar to the GO spectra, which can be related fewer defects on the GO flake structure or less disorder/more presence of sp2 hybridization between C atoms, or less interactions with surface functional groups. Table 2 shows the Tuinstra-Koenig ratio (ID/IG), which shows the ratio between the D band and G band intensity in the different samples, it has been reported that lower values for this ratio correlate to higher regularity in the GO structure [40].
Following the analysis of the NHMs, the XPS spectra were acquired. For these analyses, the C1s and the Pb4f peaks were studied. For the case of the C1s peak, the GO sample (Figure 7a) displayed three signals at ~288 eV, ~287 eV, and ~284 eV, which correspond to the functional groups C=O, C-O-C and C-C [41], respectively.
In sample PbS-EDT/GO (Figure 7b) the same signals were observed than in the GO sample, with the only difference being observed in the intensity of the epoxy group (C-O-C) signal, which decreased considerably in the PbS-EDT/GO sample. For the case of the PbS-TBAI/GO sample the same signals were observed, again, the only difference between this sample and the previous samples, was the intensity of the signals deconvoluted for the different functional groups. Finally, for the PbS-L-Cys/GO sample four signals were obtained at ~284 eV, ~286 eV, 287 eV and ~288 eV corresponding to the presence of the C-C, C-N, C-O-C and C=O functional groups [41], respectively. Figure 8 shows the XPS Pb4f peak for the NHMs analyzed. In all three samples, the peaks observed at ~138 eV and ~143 eV correspond to the PbS 7/2 and PbS 5/2 peaks, respectively, of the Pb-S bond [30]. In sample PbS-TBAI/GO (Figure 8b) and additional signal at ~140 eV and ~145 eV can be detected, which is related to the Pb-I bond found in the sample [31].
All these results (FTIR, Raman and XPS) confirm the formation of the hybrid materials in solution since clear signals related to the PbS QDs with different capping ligands and GO are present in all the results from the characterization techniques. Particularly, Raman spectroscopy showed the clear signals of the PbS QDs surface phonon vibrations and the D and G bands of the GO (Figure 6). Additionally, Raman spectroscopy suggested a strong interaction between the PbS QDs and the GO flakes, reflected by the variations observed in the Raman spectra of the hybrid materials and the PbS QDs. Moreover, XPS results contributed with more evidence on this regard, since the C1s peak showed clear differences in the three samples, especially when compared to the GO sample. The clear decreased in the intensity of the C-O-C signal in the C1s peak in sample PbS-EDT/GO suggest a reduction of the GO due to the interaction with the PbS QDs and their capping ligand; additionally, the Pb4f peak for this same sample didn’t show any signal related to the degradation/oxidation of PbS, which suggest a strong interaction of the PbS QDs and the GO flakes, that is not only reducing the GO, but also is increasing the ambient stability of the PbS QDs when they’re forming the hybrid material. Moreover, the lower Tuinstra-Koenig ratio for this same sample also supports the strong interaction between the PbS QDs surface and the GO flakes, which is contributing to restore the sp2 hybridization between the C atoms in the GO. For the case of the PbS-TBAI/GO sample, the Raman results (Tuinstra-Koenig ratio) suggest an increased disorder in the GO, compared to the GO before the hybrid material formation, which can be related to the larger capping ligand molecule, that prevents a more intimate interaction with the GO flake, like in the PbS-EDT case. The XPS C1s peak for this sample also showed a decrease in the C-O-C signal, compared to the GO sample before the hybrid formation, but not as clear as in the PbS-EDT case. The XPS Pb4f peak for this sample suggests the same ambient stability observed in the PbS-TBAI sample before the hybrid formation. Finally, the PbS-L-Cys/GO sample showed remarkably comparable results to the PbS-TBAI/GO sample, since their Tuinstra-Koenig ratios were remarkably similar and the ambient stability of the PbS QDs seemed to be similar before and after the hybrid formation. The main difference between these two samples was observed in the C1s peak, where several signals related to the functional groups found on the L-Cysteine molecule were observed.
The most relevant TEM results of the studied NHMs are shown in Figure 9. In all samples the GO flakes can be observed to be “decorated” by the PbS QDs; however, the PbS QDs can be seen to form agglomerates on the GO flakes. In sample PbS-EDT/GO, the GO can be observed with “folds” close to the center of the image and the PbS-EDT QDs are observed to form agglomerates randomly distributed on the GO flakes. HRTEM images from this sample (Figure 9b) show a higher magnification of the PbS QDs agglomerates, where clear lattice resolution can be seen on the PbS QDs, showing the high crystallinity of the ligand exchanged PbS QDs; whereas the contrast observed in the region of the GO flake corresponds to the contrast observed in amorphous materials. Comparable results can be observed in the other two NHMs. Sample PbS-TBAI/GO also showed clear aggregates of PbS QDs randomly distributed on the GO flakes (Figure 9c); again, higher magnification images showed amorphous contrast in the region corresponding to the GO flake and crystalline contrast in the PbS QDs agglomerates (Figure 9d). Finally, images of the PbS-L-Cys/GO sample showed the same trend, a high number of PbS QDs agglomerates randomly distributed on the GO flakes (Figure 9e); while HRTEM images (Figure 9f) showed the high crystallinity of the PbS-L-Cys QDs and the amorphous nature of the GO flakes.
Thin films deposited from the NHMs via spin coating were studied using SEM, surface morphology and quality were determined based on this analysis, the most relevant results are shown in Figure 10. In all three cases, at lower magnification, the thin films seemed to be homogenous, covering the substrate with a good surface quality; however, as the magnification was increased, the quality of the surface was not as good as originally observed. At higher magnifications, the GO flakes could be observed and the PbS QDs agglomerates, those previously observed in the TEM, were also clearly seen in enormous quantities randomly distributed on the GO flakes all over the thin films. The same results were observed in the three NHMs studied.
Finally, the I-V curves and photoresponse were acquired for the different NHMs thin films, the obtained results are shown in Figure 11. I-V curves for the three NHMs thin films displayed an ohmic response, as the linear dependence between the applied voltage and the measured current indicated (Figure 11a). The values of the measured currents were in the range of 10-10 A, while the resistance calculated for these NHMs thin films was in the range of 10-11 Ω; such high resistance value is related to insulators materials, materials with low charge carrier mobilities due to the difficulties found by the charge carriers when moving through this kind of materials. This electrical behavior can be related to the FTIR and XPS results previously discussed, where the presence of O-rich functional groups was observed in the GO, the presence of these functional groups reduces the mobility of the charge carriers through the GO structure. Moreover, the TEM and SEM results showed that the PbS QDs formed large agglomerates that were randomly distributed on the GO flakes throughout the NHMs thin films, also affecting the thin films surface quality, factors affecting negatively the charge carrier mobility through the NHMs thin films, producing very low currents. Sample PbS-EDT/GO showed the lowest resistance and the highest current measured, since it was the NHM with the lowest signal related to the presence of O-rich functional groups, as it was observed in the XPS results previously discussed (Figure 7b). On the other hand, the three NHMs thin films displayed a clear photoresponse, with a low photogenerated current, in the range of nA (Figure 11b-d). Hybrid material PbS-EDT/GO (Figure 11b) displayed a photogenerated current of ~2.8 nA; while sample PbS-L-Cys/GO (Figure 11d) showed a photogenerated current of ~0.02 nA; and sample PbS-TBAI/GO had a photogenerated current of ~0.007 nA. Even though the three NHMs samples displayed a clear photogenerated current when exposed to light, the more symmetrical response in the photocurrent curve, along with the highest value, was observed in sample PbS-EDT/GO. Such low values for the photogenerated current in the NHMs indicate a poor charge carrier transfer from the PbS QDs to the GO. This could be related to several factors, one of them being the presence of the O-rich functional groups in the GO, as shown in the XPS results, which affect the work function of the GO flakes, hence affecting the valence and conduction band values, as has been previously reported [42,43]; since the PbS-EDT/GO sample showed a clear decrease in the C-O-C signal in the XPS spectrum, which can be associated with some degree of reduction in the GO, improving the charge carrier transport and transfer properties in the GO, this could partially explain the superior charge transport and transfer properties of this NHM sample. Additionally, surface chemistry and crystallography can also affect the electronic structure of the PbS QDs, as previously reported [12,13,44]. The capping ligand exchange procedure changes the electronic structure of the PbS QDs, varying their HOMO and LUMO levels. The proper alignment between these HOMO and LUMO levels in the PbS QDs with the valence and conduction bands in GO will determine if there is an effective charge carrier transfer between these nanostructures, as has been reported elsewhere [42,43]; moreover, it has also been reported that the interaction between PbS QDs with EDT as capping ligand and GO produces a band alignment that promotes the transfer of photogenerated electrons from PbS QDs to GO [42,43]. It is proposed that in samples PbS-TBAI/GO and PbS-L-Cys/GO the HOMO and LUMO levels in the PbS QDs after the ligand exchange don’t align properly with the valence and conduction band levels in the GO, after the hybrid material is formed, preventing an effective charge carrier transfer between these nanostructures, hence producing lower photogenerated currents. Further studies are needed to confirm this interpretation.
4. Conclusions
In summary, three different NHMs were synthesized in solution by combining capping ligand exchanged PbS QDs with GO. Capping ligand exchange was successfully performed on OA-capped PbS QDs, replacing the OA molecule by EDT, TBAI and L-Cysteine in solution. UV-Vis-NIR absorption peaks for the ligand exchanged samples displayed red shifts in their maximum absorption peak due to an increase in the average particle size and the formation of agglomerates. Additionally, PL results also showed a red shit in the emission peak for the ligand exchanged samples, with variations in the Stokes shift for the different samples, related to the surface trap states produced by each capping ligand molecule on the surface of the PbS QDs; with TBAI showing the smallest Stoke shift, suggesting an improved surface passivation of the PbS QDs. Complementary, FTIR confirmed a decrease in the signals’ intensities related to the OA molecule and the appearance of different signals corresponding to the different molecules used in the ligand exchange procedure (EDT, TBAI and L-Cys). Moreover, Raman results evidenced the effect of the ligand exchange on the surface vibrational properties displayed by PbS QDs, and also how these surface vibrational properties also changed when the hybrid materials were formed. XPS results also provided evidence of the successful capping ligand exchange in solution procedure developed in the current work; these results also suggested an improved surface passivation by the TBAI and L-Cysteine molecules, as these capping ligand exchanges prevented more effectively the degradation/oxidation of PbS QDs. XPS results also showed that the interaction between the PbS-EDT QDs and the GO, at the time when the hybrid material was formed, reduced the GO in some degree, since it decreased significantly the intensity of the C-O-C signal in the C1s peak in the resulting hybrid material; consequence that had an important effect in the final optoelectronic properties displayed by the NHM. XPS results also suggested that the hybrid material formation, hence the interaction between the PbS QDs and the GO flakes, improved the ambient stability of the PbS QDs, since no clear signals could be observed in the NHMs samples related to the degradation/oxidation of the PbS QDs. TEM results showed that the ligand exchanged PbS QDs formed agglomerates on the GO flakes, rather than distribute homogenously on their surface; these results also showed that these PbS QDs aggregates were randomly distributed on the GO flakes; characteristics that had a major impact on the optoelectronic properties displayed by the synthesized NHMs. Even though the currents measured on these NHMs were exceptionally low, in the nA range, they exhibited clear photogenerated currents when exposed to light. PbS-EDT/GO sample was the one with the lowest resistance and the highest photogenerated current among the synthesized NHMs, as a consequence of the proper band alignment between the HOMO/LUMO levels in PbS-EDT QDs and the valence and conduction band in the GO, promoting the transfer of the photogenerated electrons from the PbS-EDT QDs to the GO; and the reduction of the GO produced by its interaction with the PbS-EDT QDs, as evidenced by XPS results. In general, these results show the significant impact that surface chemistry has on the optoelectronic properties of QDs and GO, and the hybrid materials made based on them. It was evident that gaining a complete understanding of their surface chemistry, vibrational modes, crystallography and interactions is paramount to understanding the final optoelectronic properties displayed by this type of NHMs. These results provide a methodology to produce affordable, solution-processed hybrid materials based on PbS QDs and GO with tunable optoelectronic response.
Authors Contributions
Conceptualization, Diana Garcia-Gutierrez and Domingo Garcia-Gutierrez; Data curation, Nayely Torres-Gomez; Formal analysis, Diana Garcia-Gutierrez; Funding acquisition, Domingo Garcia-Gutierrez; Investigation, Giovanny Perez-Parra, Nayely Torres-Gomez, Vineetha Vinayakumar, Diana Garcia-Gutierrez and Selene Sepulveda-Guzman; Methodology, Giovanny Perez-Parra, Nayely Torres-Gomez, Vineetha Vinayakumar and Diana Garcia-Gutierrez; Supervision, Selene Sepulveda-Guzman and Domingo Garcia-Gutierrez; Writing – original draft, Giovanny Perez-Parra; Writing – review & editing, Diana Garcia-Gutierrez and Domingo Garcia-Gutierrez.
Acknowledgements
The authors would like to acknowledge the financial support received from CONAHCYT (Mexico) through project number A1-S- 27146. G.P.P., N.T.G and V.V. acknowledge the financial support received from CONAHCYT (Mexico).
Conflicts of Interest
The authors declare no conflicts of interest.
References
- S. Ghosh, T. Pal, D. Joung, S. I. Khondaker. One pot synthesis of RGO/PbS nanocomposite and its near infrared photoresponse study. Appl Phys A, 107, p. 995–1001 (2012). [CrossRef]
- B. Martín-García, A. Polovitsyn, M. Prato, I. Moreels. Efficient charge transfer in solution-processed PbS quantum dot – reduced graphene oxide hybrid. J. Mater. Chem. C, 3, p- 7088-7095 (2015).
- R. Yousefi, M.R. Mahmoudian, A. Sa΄aedi, M. Cheraghizade, F. Jamali-Sheini, M. Azarang. Effect of annealing temperature and graphene concentrations on photovoltaic and NIR-detector applications of PbS/rGO nanocomposites. Ceramics International, 42 (14), p. 15209-15216 (2016).
- Beatriz Martín-García, Yu Bi, Mirko Prato, Davide Spirito, Roman Krahne, Gerasimos Konstantatos, Iwan Moreels. Reduction of moisture sensitivity of PbS quantum dot solar cells by incorporation of reduced graphene oxide. Solar Energy Materials and Solar Cells, 183, p. 1–7 (2018). [CrossRef]
- Zhang, Y.; Wu, G.; Ding, C.; Liu, F.; Liu, D.; Masuda, T.; Yoshino, K.; Hayase, S.; Wang, R.; Shen, Q. Surface-Modifed Graphene Oxide/Lead Sulfide Hybrid Film-Forming Ink for High-Efficiency Bulk Nano-Heterojunction Colloidal Quantum Dot Solar Cells. Nano-Micro Lett. 12:111 (2020).
- Lara-Canche, A. R.; Garcia Gutierrez, D. F.; Torres-Gomez, N.; Reyes-Gonzalez, J.; Bahena-Uribe, D.; Sepulveda-Guzman, S.; Hernande-Calderon, I.; Garcia-Gutierrez, D. I. Solution processed nanostructured hybrid materials based on PbS quantum dots and reduced graphene oxide with tunable optoelectronic properties. Nanotechnology, 32, 055604 (2021). [CrossRef]
- Wenqing Fan, Qinghua Lai, Qinghong Zhang and Ye Wang. Nanocomposites of TiO2 and Reduced Graphene Oxide as Efficient Photocatalysts for Hydrogen Evolution. J. Phys. Chem. C. 115, p. 10694–10701 (2011). [CrossRef]
- K.Ramesh, B.Gnanavel, Mohd.Shkir. Enhanced visible light photocatalytic degradation of bisphenol A (BPA) by reduced graphene oxide (RGO)–metal oxide (TiO2, ZnO and WO3) based nanocomposites. Diamond and Related Materials, 118, p. 108514 (2021).
- Daniela C. Marcano, Dmitry V. Kosynkin, Jacob M. Berlin, Alexander Sinitskii, Zhengzong Sun, Alexander Slesarev, et al. Improved Synthesis of Graphene Oxide. ACS Nano 4, p. 4806–4814 (2010). [CrossRef]
- Hines, M. A.; Scholes, G. D. Colloidal PbS Nanocrystals with Size-Tunable Near-Infrared Emission: Observation of Post-Synthesis Self-Narrowing of the Particle Size Distribution. Adv. Mater. 15, p. 1844−1849 (2003).
- X. Zhang, C. Jia and Y. Xue. Fabrication of CdTe QD-rGO composites with different linkers for controlling charge separation and recombination. Mat. Res. Bull. 98, p. 53-58 (2018).
- Patrick R. Brown, Donghun Kim, Richard R. Lunt, Ni Zhao, Moungi G. Bawendi, Jeffrey C. Grossman, and Vladimir Bulović. Energy level modification in lead sulfide quantum dot thin films through ligand exchange. ACS Nano 8, p. 5863–5872 (2014). [CrossRef]
- Garcia-Gutierrez, D. F.; Hernandez-Casillas, L.P.; Capellari, M.V., Fungo, F.; Martinez-Guerra, E. and Garcia-Gutierrez, D.I. Influence of the Capping Ligand on the Band Gap and Electronic Levels of PbS Nanoparticles through Surface Atomistic Arrangement Determination. ACS Omega, 3, p. 393–405 (2018). [CrossRef]
- J.H. Song and S. Jeong. Colloidal quantum dot based solar cells: from materials to devices. Nano Convergence, 4, 21 (2017). [CrossRef]
- X. Zhang, U. B. Cappel, D. Jia, Q. Zhou, J. Du, T. Sloboda, et al. Probing and Controlling Surface Passivation of PbS Quantum Dot Solid for Improved Performance of Infrared Absorbing Solar Cells. Chem. Mater. 31 (11), p. 4081–4091 (2019). [CrossRef]
- M.-H. Jung and M.-J. Chu. Comparative experiments of graphene covalently and physically binding CdSe quantum dots to enhance the electron transport in flexible photovoltaic devices. Nanoscale, 6, p. 9241–9249 (2014). [CrossRef]
- C.V. Pham, M. Eck, and M. Krueger. Thiol functionalized reduced graphene oxide as a base material for novel graphene-nanoparticle hybrid composites. Chemical Engineering Journal, 231, p. 146-154 (2013). [CrossRef]
- F.-X. Xiao, J. Miao, and Bin Liu. Layer-by-Layer Self-Assembly of CdS Quantum Dots/Graphene Nanosheets Hybrid Films for Photoelectrochemical and Photocatalytic Applications. J. Am. Chem. Soc. 136, p. 1559−1569 (2014). [CrossRef]
- Diana Fabiola García Gutierrez, Denysse González Ovalle, Laura Patricia Hernández Casillas, Fernando Fungo, Domingo Ixcóatl García Gutiérrez. Efecto del cambio de agente protector en las características y las propiedades ópticas y eléctricas de nanopartículas de sulfuro de plomo (PbS). Ingenierías, 17(63), p. 6-16 (2014).
- Bakueva, B. L.; Gorelikov, I.; Musikhin, S.; Zhao, X. S.; Sargent, E. H. & Kumacheva, E. PbS Quantum Dots with Stable Efficient Luminescence in the Near-IR Spectral Range. Adv. Mater. 16 (11), p. 926-929 (2004). [CrossRef]
- Y. P. Rakovich, S.A. Filonovich, M.J.M. Gomes, J.F. Donegan, D.V. Talapin, A.L. Rogach, A. Eychmüller. Anti-Stokes Photoluminescence in II–VI Colloidal Nanocrystals. Phys. Stat. Sol. (b), 229 (1), p. 449 – 452 (2002). [CrossRef]
- Garcia-Gutierrez, D.F., Hernandez, L., Sepulveda-Guzman, S., Vazquez-Rodriguez, S., & Garcia-Gutierrez, D. I. Enhancement of the Optoelectronic Properties of PEDOT: PSS–PbS Nanoparticles Composite Thin Films Through Nanoparticles’ Capping Ligand Exchange. Journal of Electronic Materials, 47, p. 2718–2730 (2018). [CrossRef]
- Tom, A.E., Thomas, A., & Ison, V.V. Novel post-synthesis purification strategies and the ligand exchange processes in simplifying the fabrication of PbS quantum dot solar cells. Royal Society of Chemistry, 10, p. 30707-30715 (2020). [CrossRef]
- Bhardwaj, K., Pradhan, S., Basel, S., Clarke, M., Brito, B., Thapa, S., Roy, P., Borthakur, S., Saikia, K., Shankar, A., Stasiuk, G., Pariyar, A., & Tamang, S. Tunable NIR-II emitting silver chalcogenide quantum dots using thio/selenourea precursors: preparation of an MRI/NIR-II multimodal imaging agent. Dalton Transactions, 49, p. 15425-15432 (2020). [CrossRef]
- Merck. (2021). IR Spectrum Table. Sigma Aldrich. https://www.sigmaaldrich.com/technical-nocuments/articles/biology/ir-spectrum-table.html.
- Rodríguez-López, J.L., Montejano-Carrizales, J.M., Pal, U., Sánchez-Ramírez, J.F., Troiani, H.E., Garcia, D., Miki-Yoshida, M. and Jose-Yacaman, M. Surface Reconstruction and Decahedral Structure of Bimetallic Nanoparticles. Physical Review Letters, 92(19), p. 1961021-1961024 (2004). [CrossRef]
- Giovanetti, L.J., Ramallo-López, J.M., Requejo, F.G., Garcia-Gutierrez, D.I., Jose-Yacaman, M., and Craievich, A.F. Anomalous Vibrational Properties Induced by Surface Effects in Capped Pt Nanoparticles. Journal of Physical Chemistry C, 111(21), 7599-7604 (2007). [CrossRef]
- Bozyigit, D., Yazdani, N., Yarema, M., Yarema, O., Matteo, W., Lin, M., Volk, S., Vuttivorakulchai, K., Luisier, M., Juranyi, F. & Wood, V. Soft surfaces of nanomaterials enable strong phonon interactions. Nature, 531, p. 618-622 (2016). [CrossRef]
- Blackburn, J., Chappell, H., Luther, J., Nozik, A., & Johnson, J. Correlation between Photooxidation and the Appearance of Raman Scattering Bands in Lead Chalcogenide Quantum Dots. The Journal of Physical Chemistry Letters, 2(6), 599–603 (2011). [CrossRef]
- Russ, T., Hu, Z., Junker, B., Liu, H., Weimar, U., Barsan, N. Operando Investigation of the Aging Mechanism of Lead Sulfide Colloidal Quantum Dots in an Oxidizing Background. J. Phys. Chem. C. 125 (36), p. 19847–19857 (2021). [CrossRef]
- Albargues, R., Navarro, J., Rodriguez, P., Maulu, A., Sanchez, J., & Martinez, J. Enhancing the photocatalytic properties of PbS QD solids: the ligand exchange approach. The Royal Society of Chemistry, 11, p. 1978-1987 (2018).
- Bhandari, K., Choi, H., Jeong, S., Mahabaduge, H., & Ellingson, R. Determination of heterojunction band offsets between CdS bulk and PbS quantum dots using photoelectron spectroscopy. Applied Physics Letters, 105, 131604 (2014). [CrossRef]
- Khot, K., Mali, S., Mane, R., Patil, P., Hong, C., Kim, J., Heo, J., & Bhosale, P. Synthesis, characterization and photoelectrochemical properties of PbS sensitized vertically aligned ZnO nanorods: modified aqueous route. Journal of Materials Science: Materials in Electronics, 26, p. 6897–6906 (2015). [CrossRef]
- Luther, J., Law, M., Song, Q., Perkins, C., Beard, M., & Nozik, A. Structural, Optical, and Electrical Properties of Self-Assembled Films of PbSe Nanocrystals Treated with 1,2-Ethanedithiol. ACS Nano, 2(2), p. 271–280 (2008). [CrossRef]
- Zhanga, Q., Wena, S, Fenga, Q., & Zhang, S. Surface characterization of azurite modified with sodium sulfide and its response to flotation mechanism. Separation and Purification Technology, 242, 116760 (2020).
- Honda, M., Matsui, F., & Daimon, D. Chemisorption of L-Cysteine on Au(111)/Si(111) surfaces. Surface Review and Letters, 13, p. 197-200 (2006).
- Huízar-Félix, A.M., Cruz-Silva, R., Barandiarán, J.M., García-Gutiérrez, D.I., Orue, I., Merida, D., Sepúlveda-Guzmán, S. Magnetic Properties of Thermally Reduced Graphene Oxide Decorated with PtNi Nanoparticles. Journal of Alloys and Compounds, 678, p. 541-548 (2016). [CrossRef]
- Parker, F. (1971). Amides and Amines. Springer, p. 165-172.
- Si, Y., & Samulski, E. Synthesis of Water Soluble Graphene. Nano Letters, 8(6), p. 1679-1682 (2008). [CrossRef]
- Pei S., & Cheng, H. The reduction of graphene oxide. Carbon, 5(9), p. 3210-3228 (2012).
- Stankovich, S., Dikin, D., Piner, R., Kohlhaas, K., Kleinhammes, A., Jia, Y., Wu, Y., Nguyen, S., & Ruoff, R. Synthesis of graphene-based nanosheets via chemical reduction of exfoliated graphite oxide. Carbon, 45(7), 1558-1565 (2007). [CrossRef]
- Lara-Canche, A.R., Garcia-Gutierrez, D.F., Torres-Gomez, N., Reyes-Gonzalez, J.E., Bahena-Uribe, D., Sepulveda-Guzman, S., Hernandez-Calderon, I., Garcia-Gutierrez, D.I. Solution Processed Nanostructured Hybrid Materials based on PbS Quantum Dots and Reduced Graphene Oxide with Tunable Optoelectronic Properties. Nanotechnology, 32 055604 (2021).
- Lara-Canche, A. R., Vinayakumar, V., Garcia-Gutierrez, D. F., Martinez-Guerra, E. and Garcia-Gutierrez, D. I. Energy band alignment engineering in nanostructured hybrid materials based on PbS QDs and reduced graphene oxide: Enhancing photodetector device performance. Journal of Alloys and Compounds, 932, 167707 (2023). [CrossRef]
- Torres-Gomez, N., Garcia-Gutierrez, D. F., Lara-Canche, A. R., Triana-Cruz, L., Arizpe-Zapata, J. A., Garcia-Gutierrez, D. I. Absorption and Emission in the Visible Range by Ultra-Small PbS Quantum Dots in the Strong Quantum Confinement Regime with S-terminated Surfaces Capped with Diphenylphosphine. Journal of Alloys and Compounds, 860, 158443 (2021). [CrossRef]
Figure 1.
UV-Vis-NIR optical absorption (blue line) and PL (black line) spectra for the PbS QDs with the different capping ligands: a) OA, b) EDT, c) L-Cys and d) TBAI.
Figure 1.
UV-Vis-NIR optical absorption (blue line) and PL (black line) spectra for the PbS QDs with the different capping ligands: a) OA, b) EDT, c) L-Cys and d) TBAI.
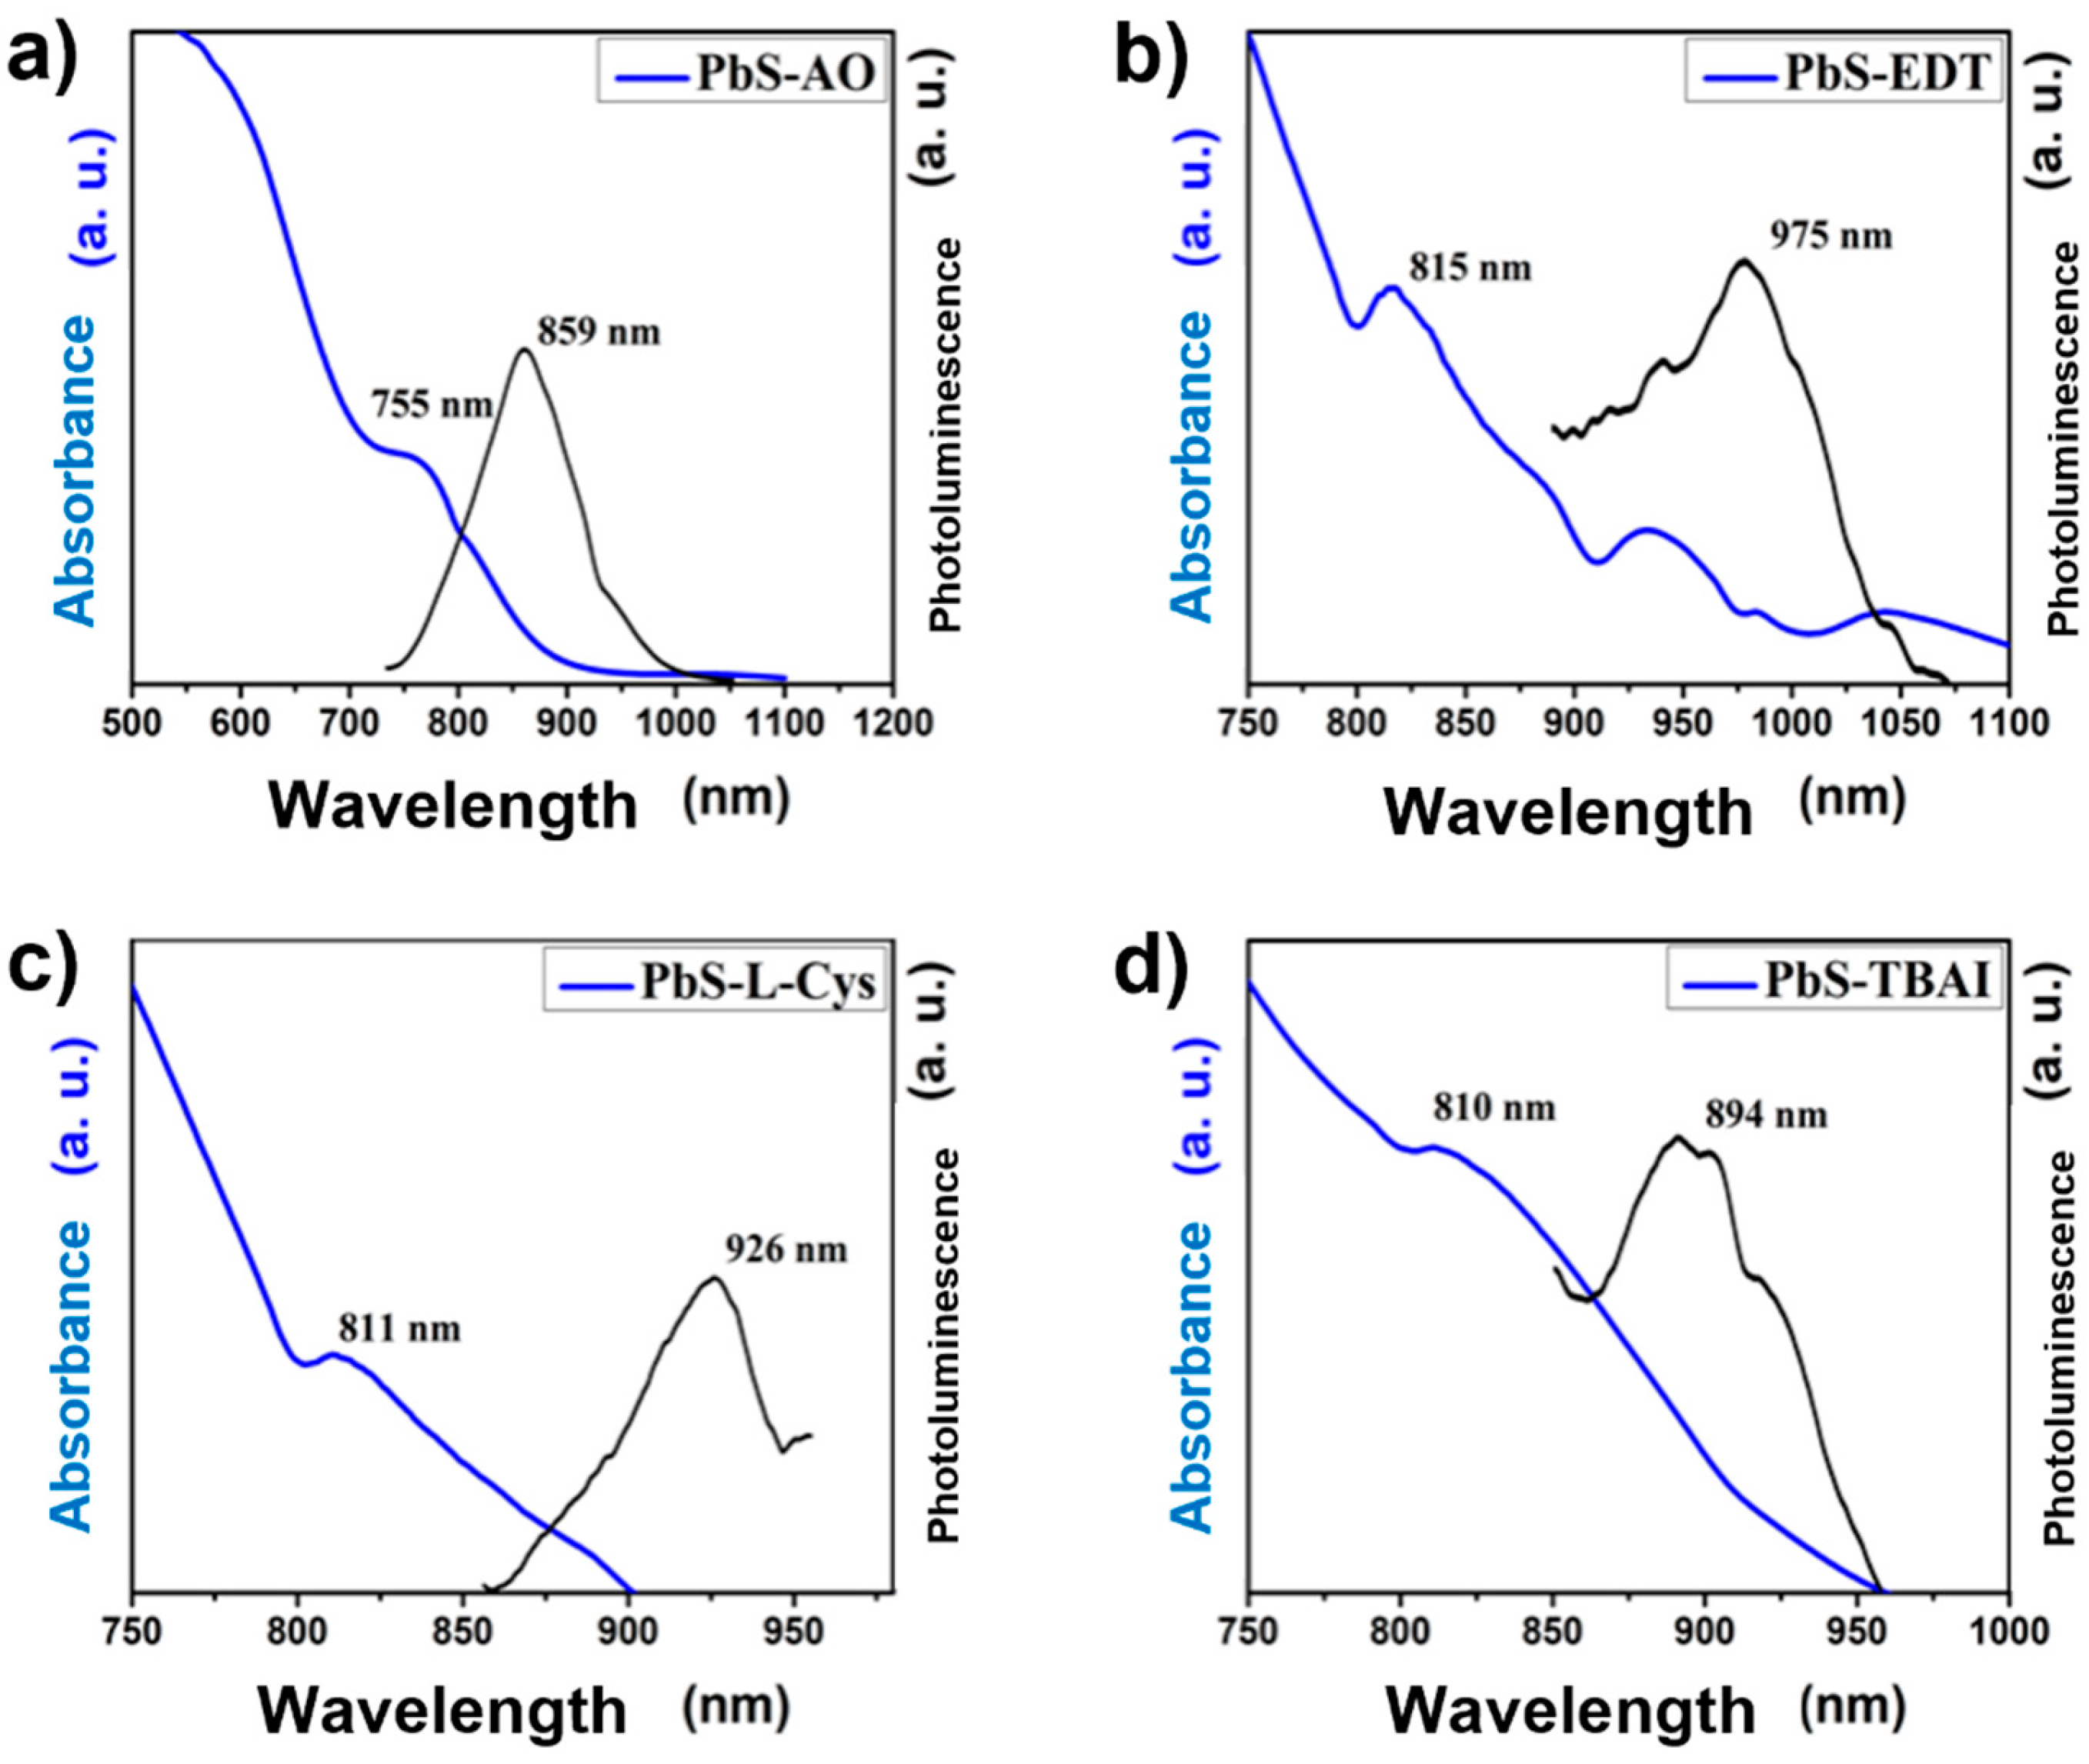
Figure 2.
STEM images of the PbS QDs with different capping ligands: a) PbS-OA, b) PbS-EDT, c) PbS-L-Cys and d) PbS-TBAI.
Figure 2.
STEM images of the PbS QDs with different capping ligands: a) PbS-OA, b) PbS-EDT, c) PbS-L-Cys and d) PbS-TBAI.
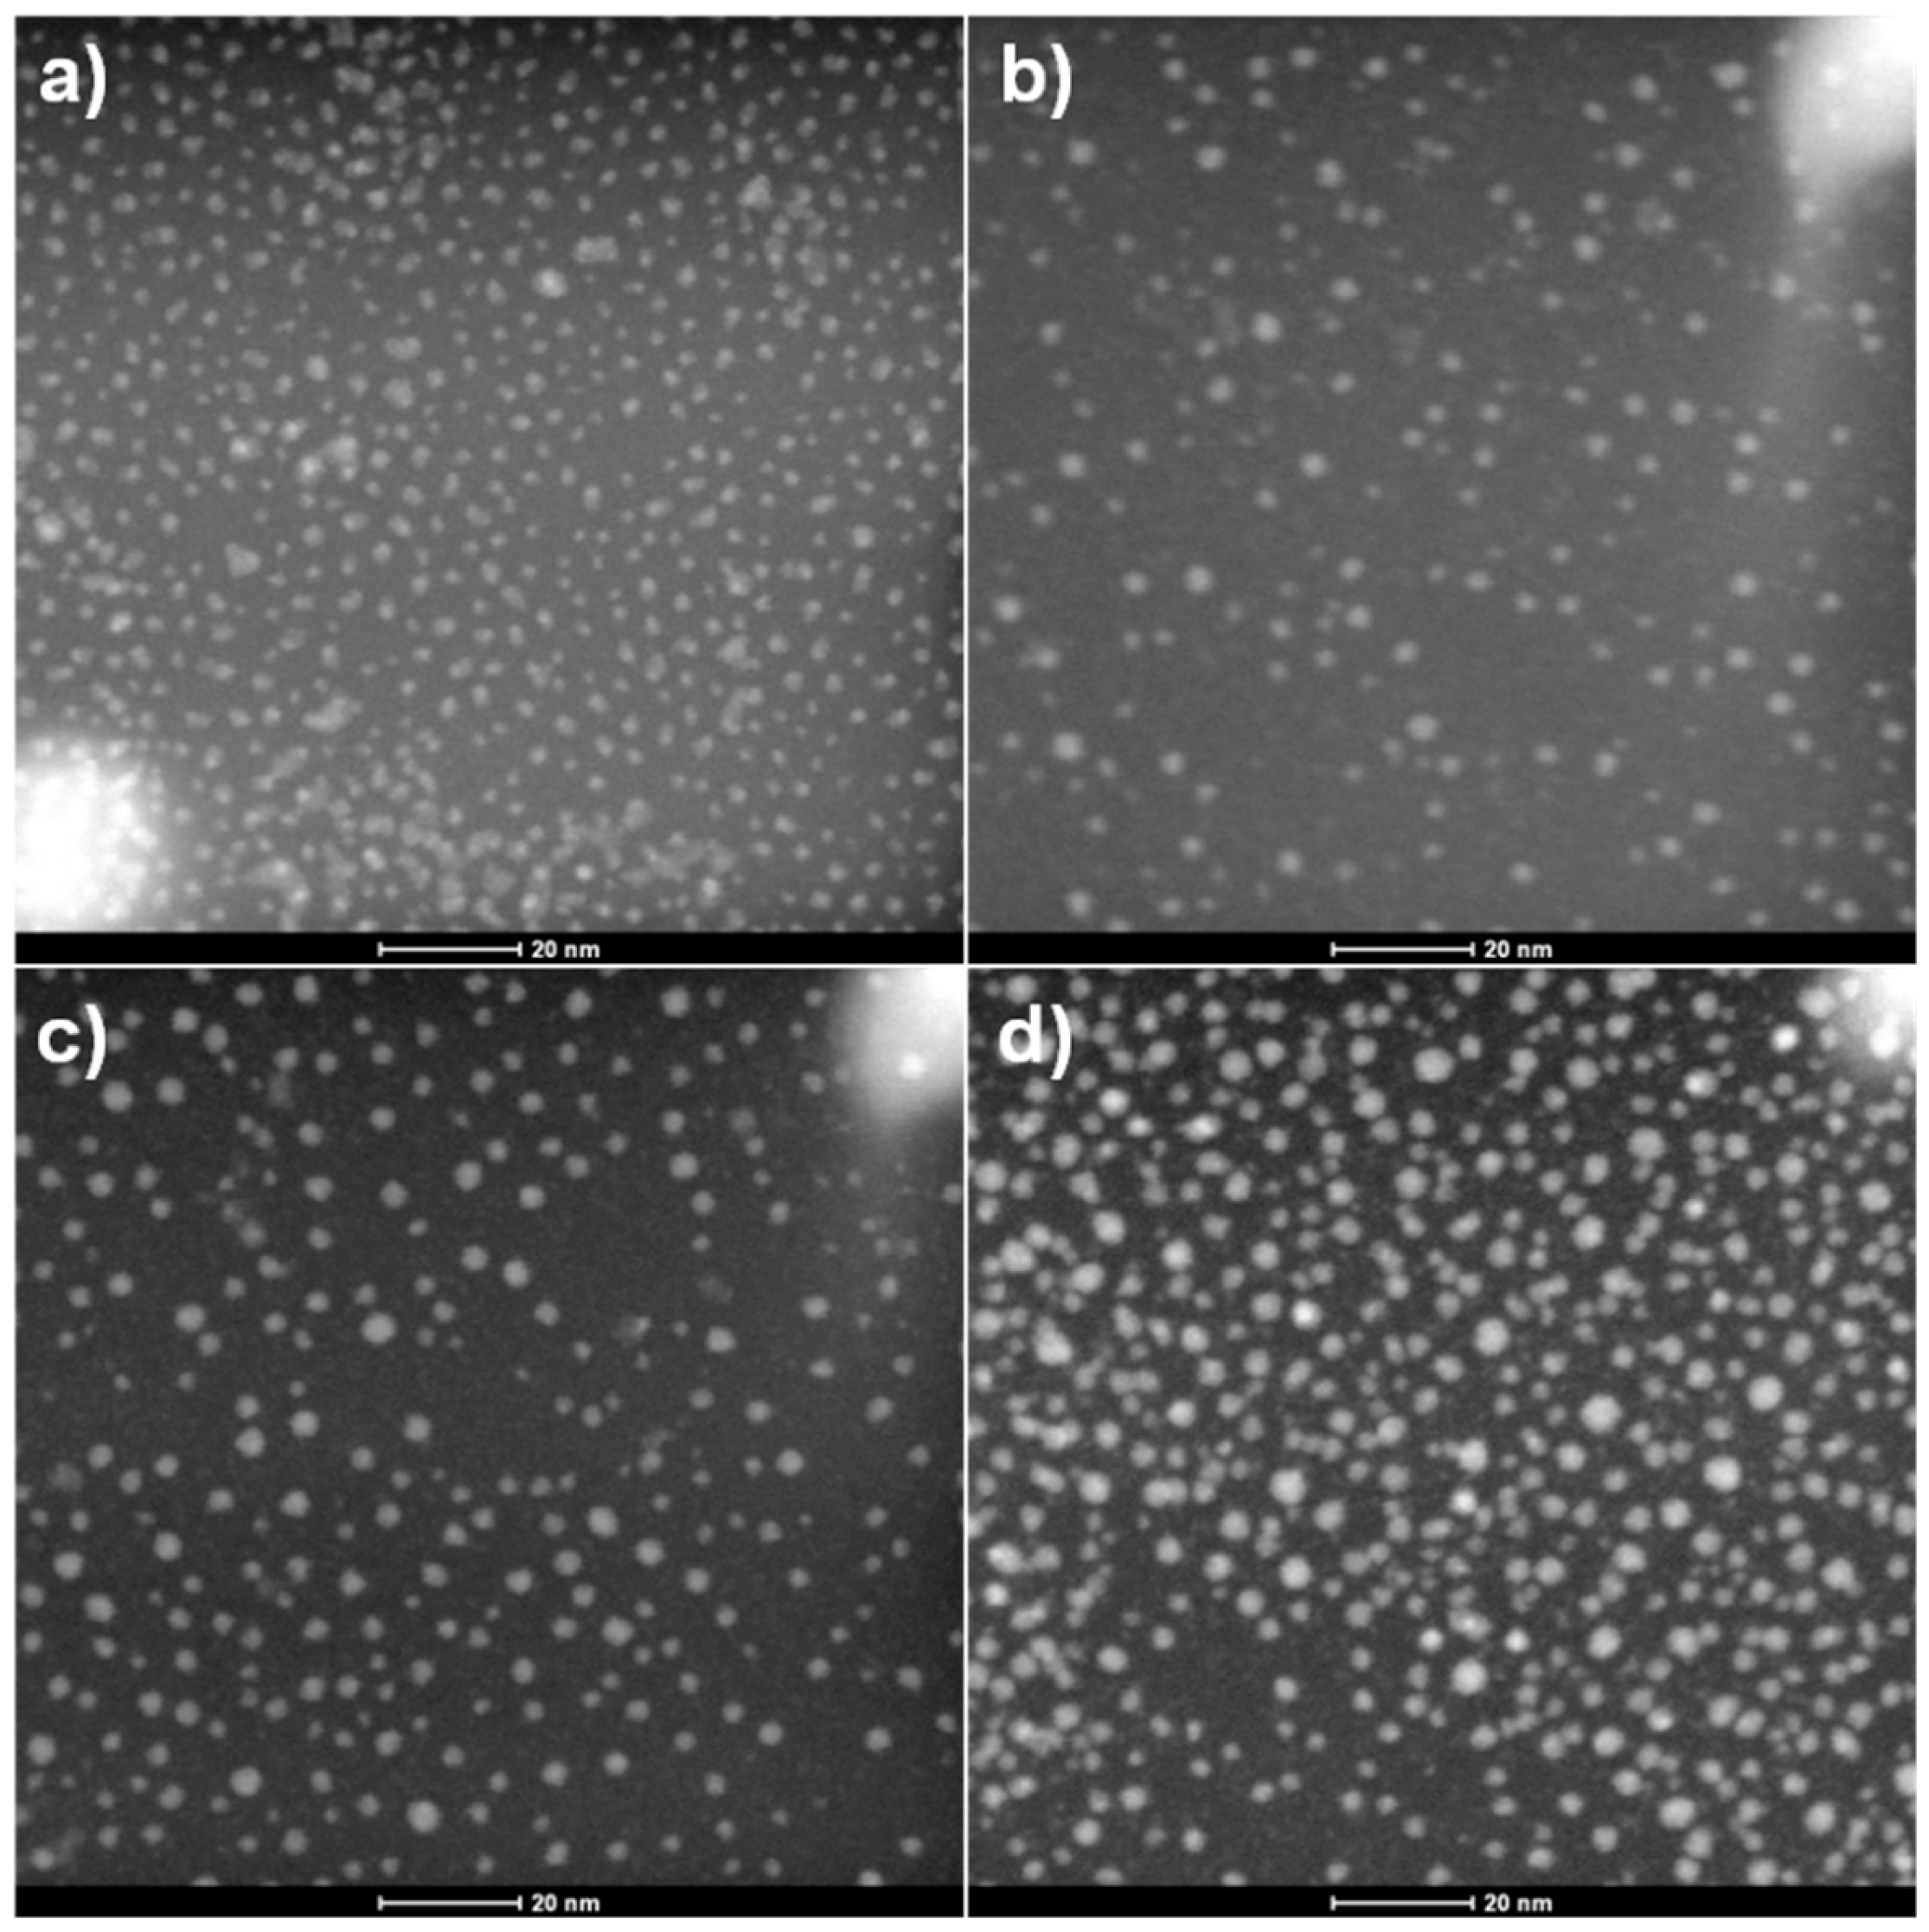
Figure 3.
a) FTIR and b) Raman spectra obtained for the PbS QDs with different capping ligands.
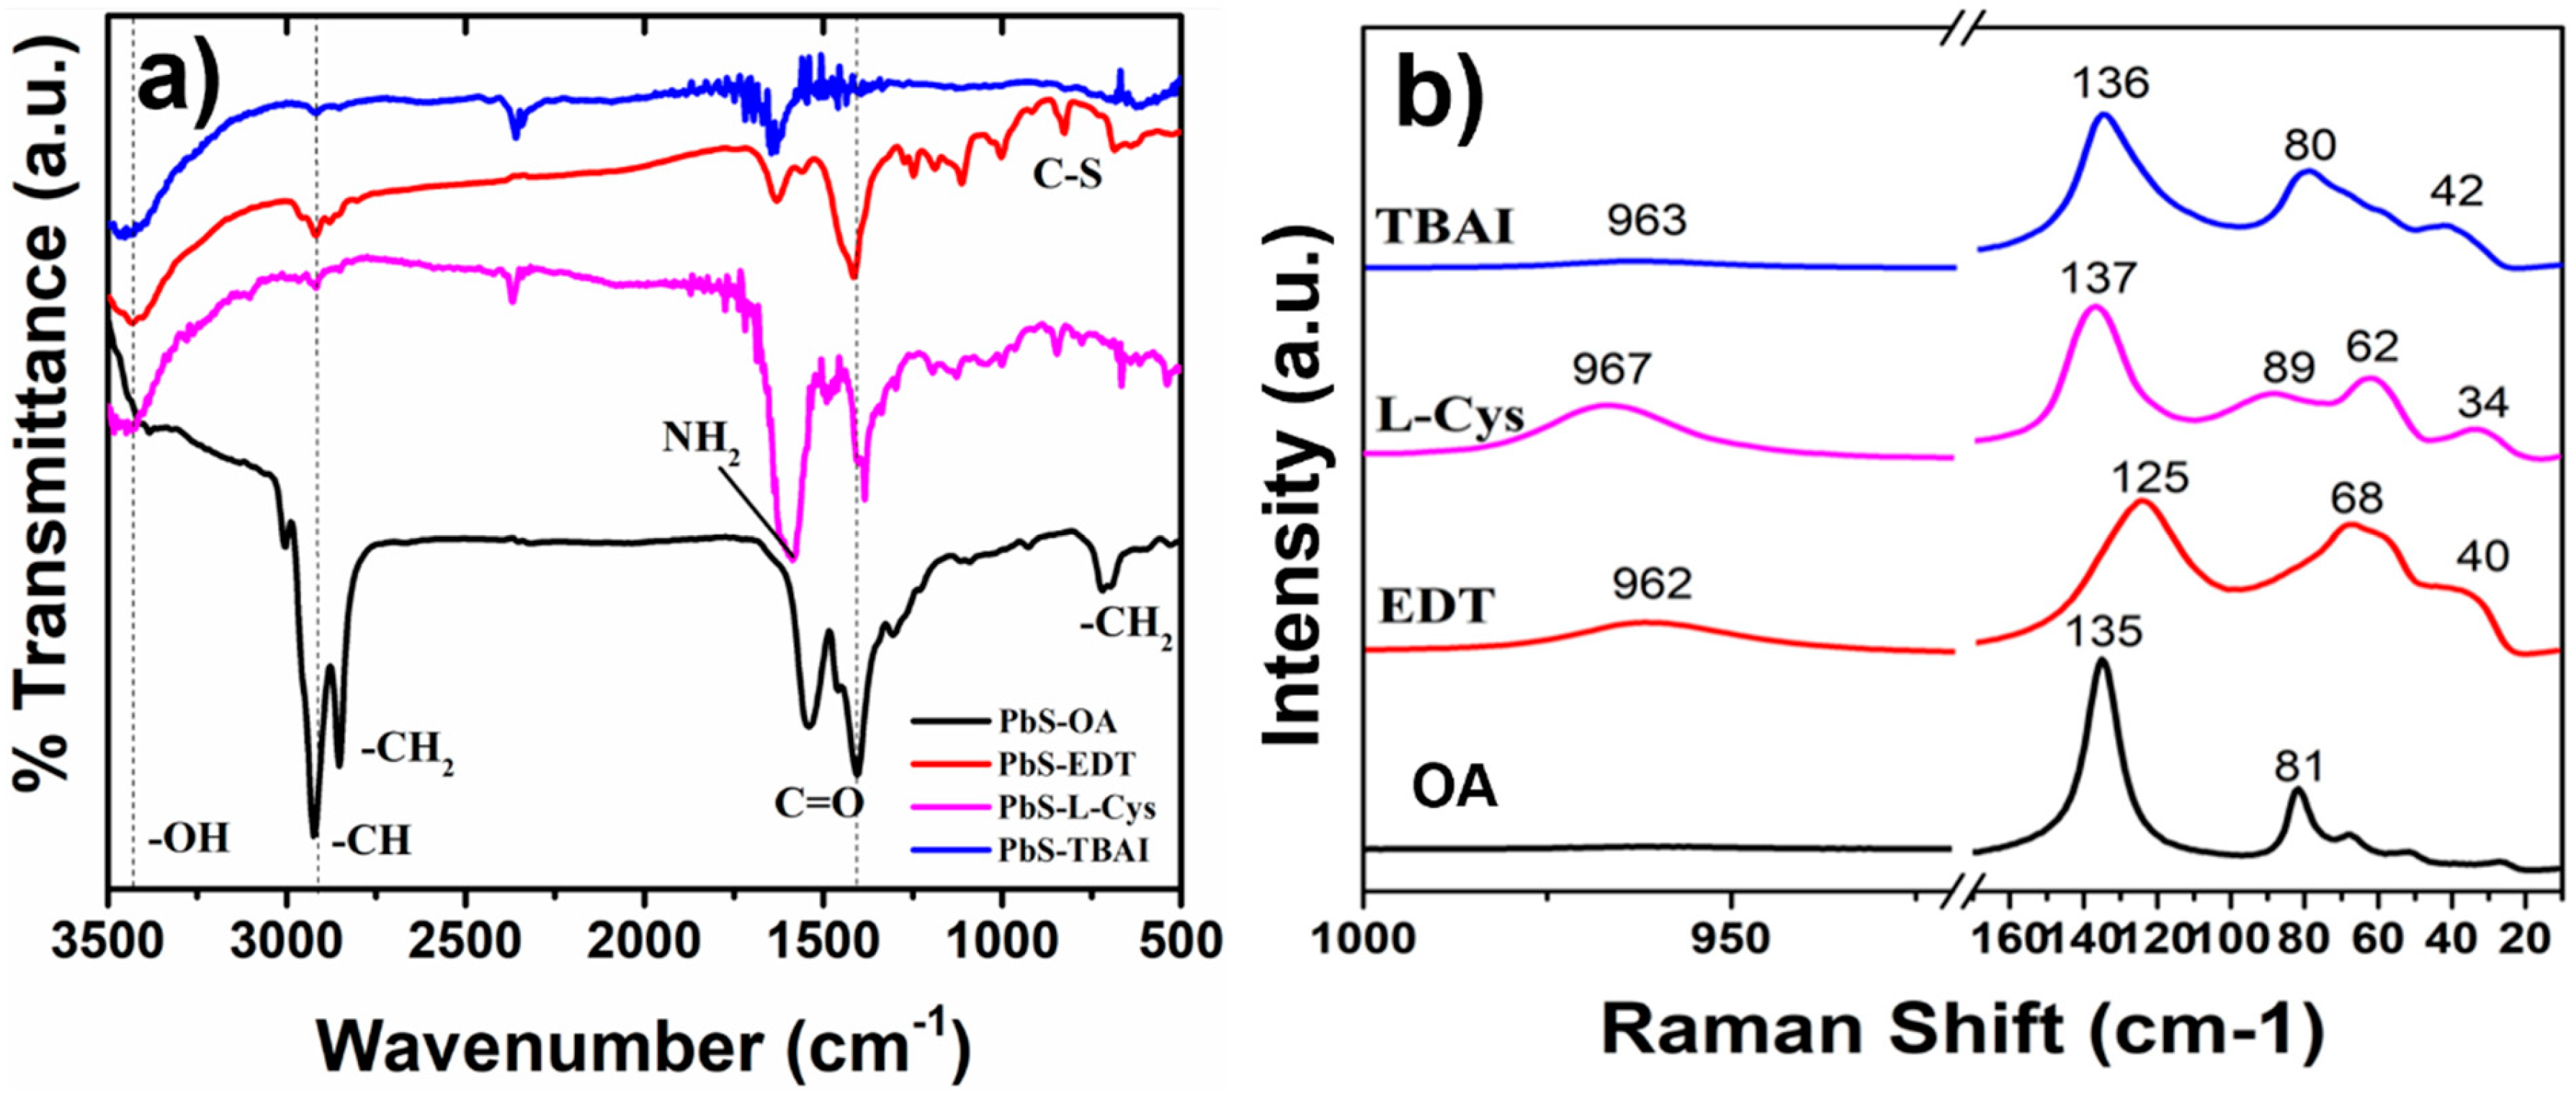
Figure 4.
XPS Pb 4f peak for the PbS QDs samples with different capping ligands: a) OA, b) EDT, c) TBAI and d) L-Cys.
Figure 4.
XPS Pb 4f peak for the PbS QDs samples with different capping ligands: a) OA, b) EDT, c) TBAI and d) L-Cys.
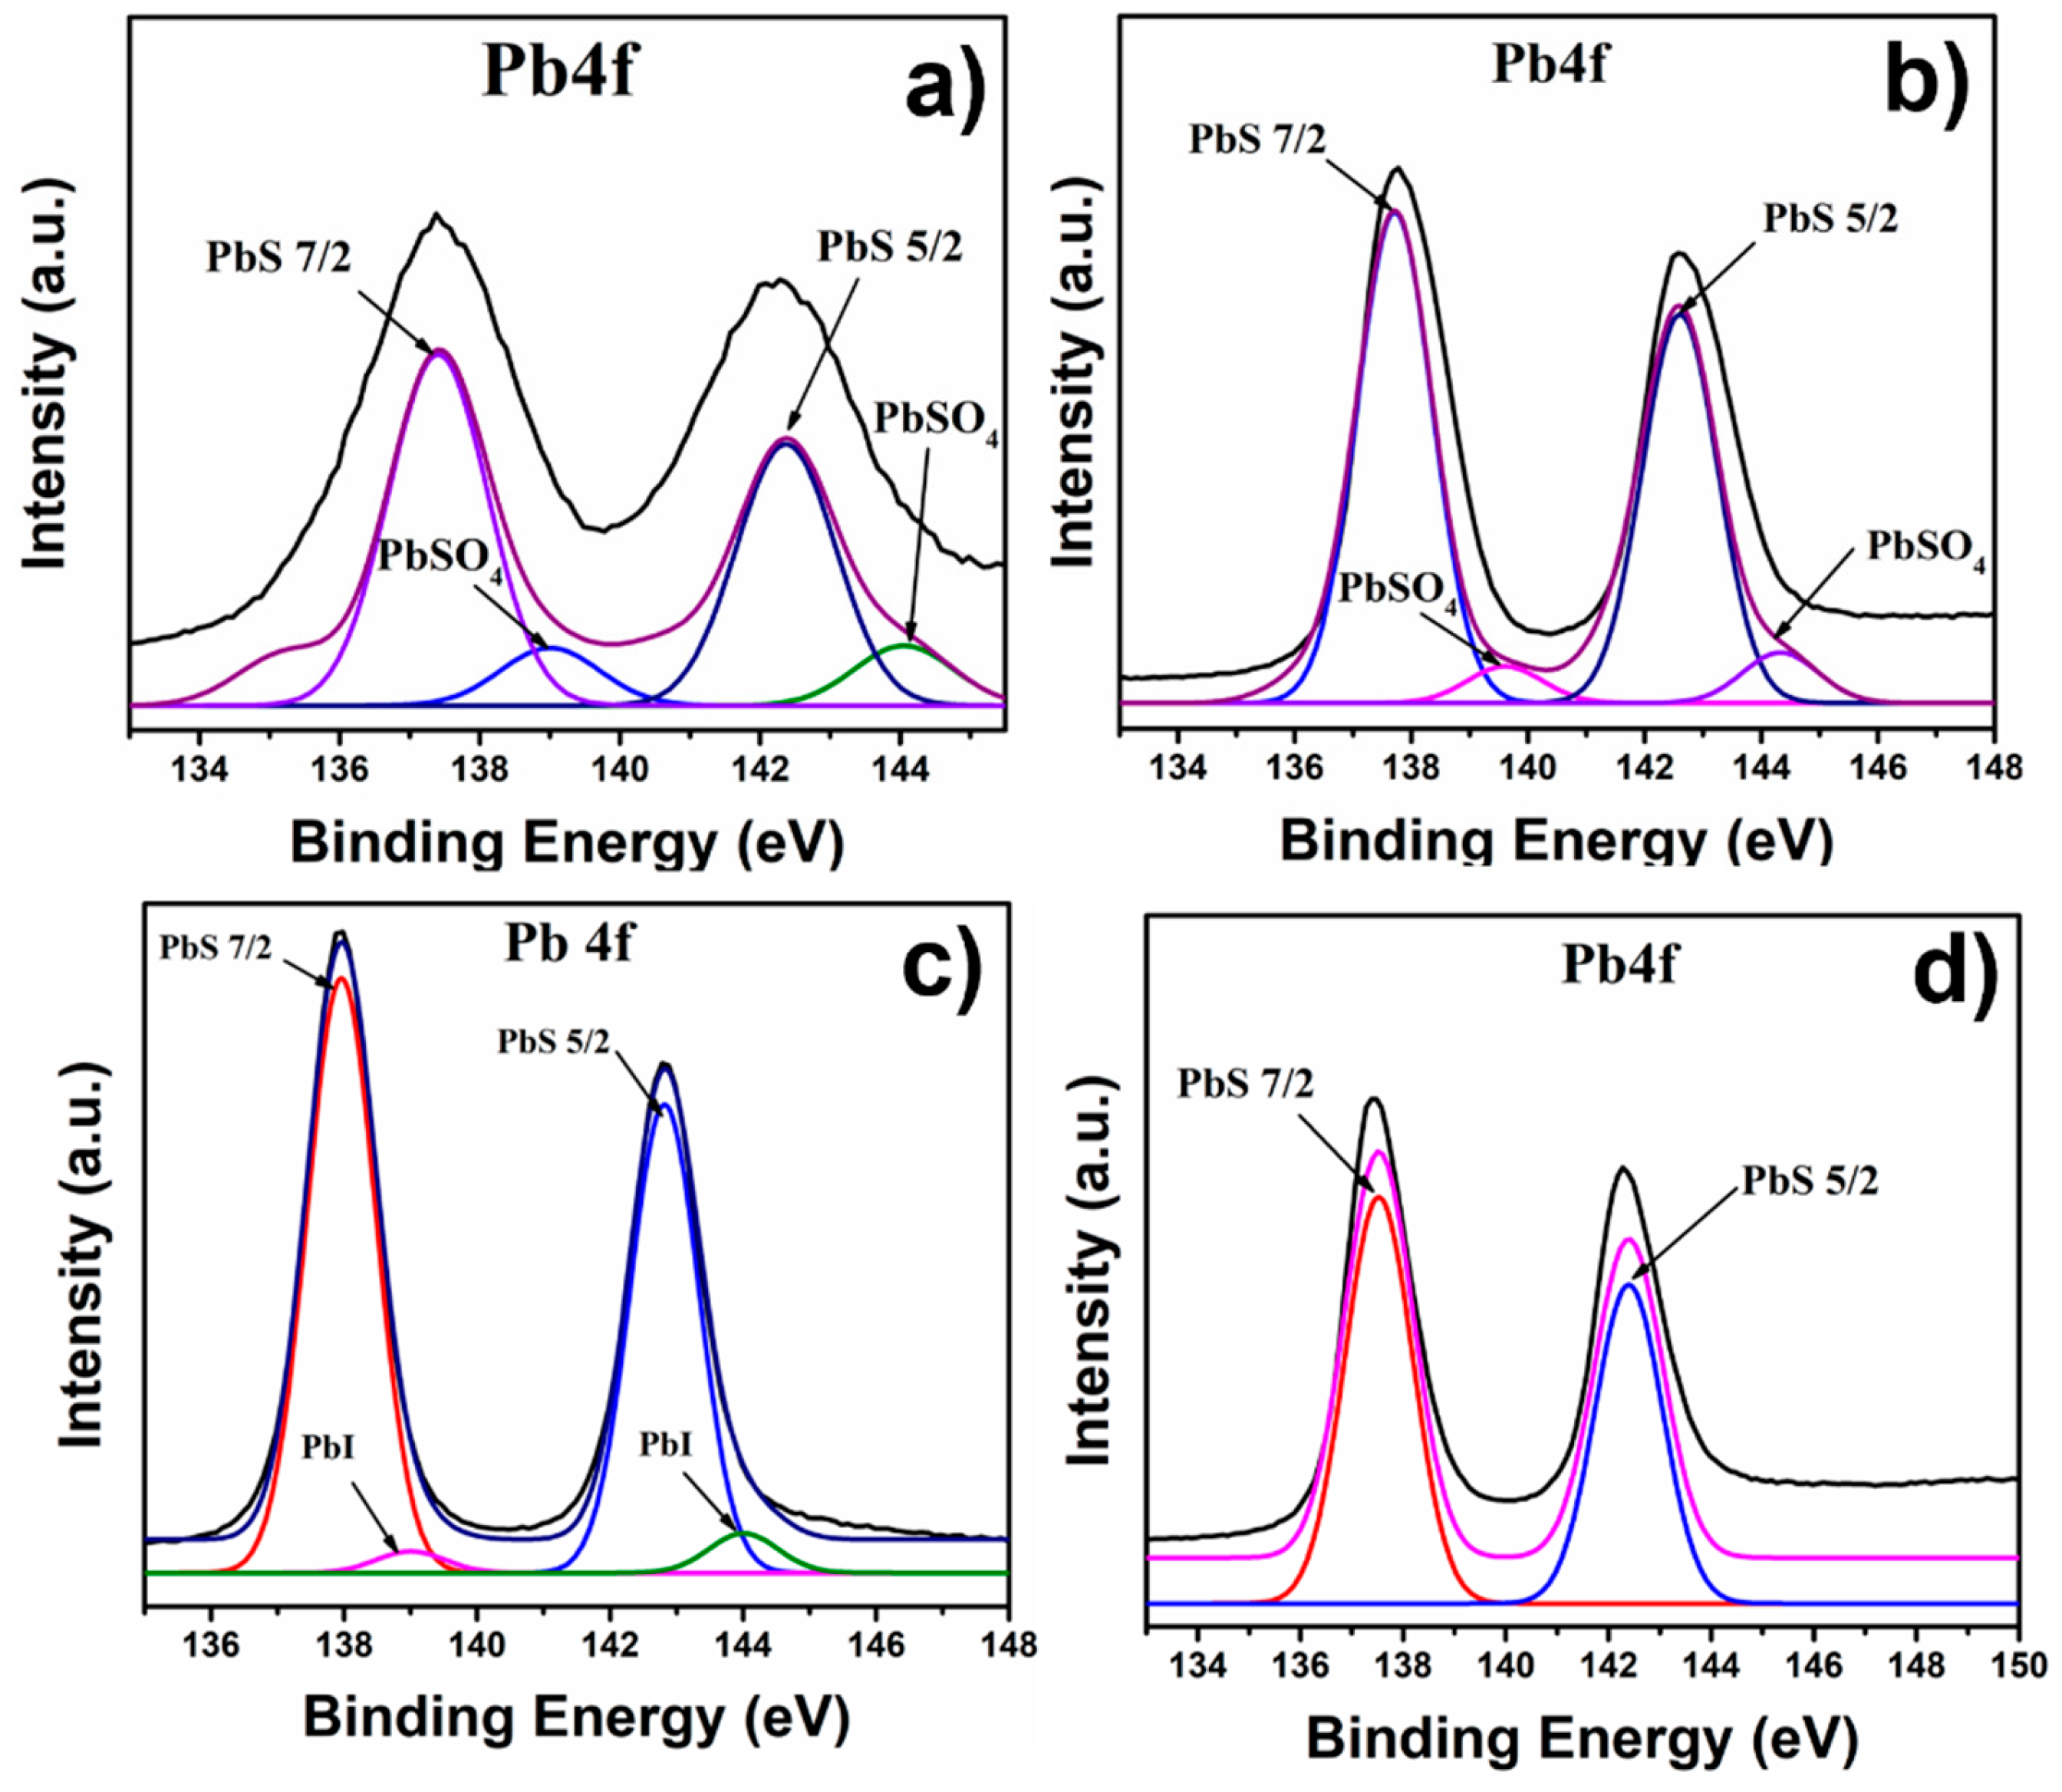
Figure 5.
XPS S2p peak for the PbS QDs samples with different capping ligands: a) OA, b) EDT, c) TBAI and d) L-Cys.
Figure 5.
XPS S2p peak for the PbS QDs samples with different capping ligands: a) OA, b) EDT, c) TBAI and d) L-Cys.
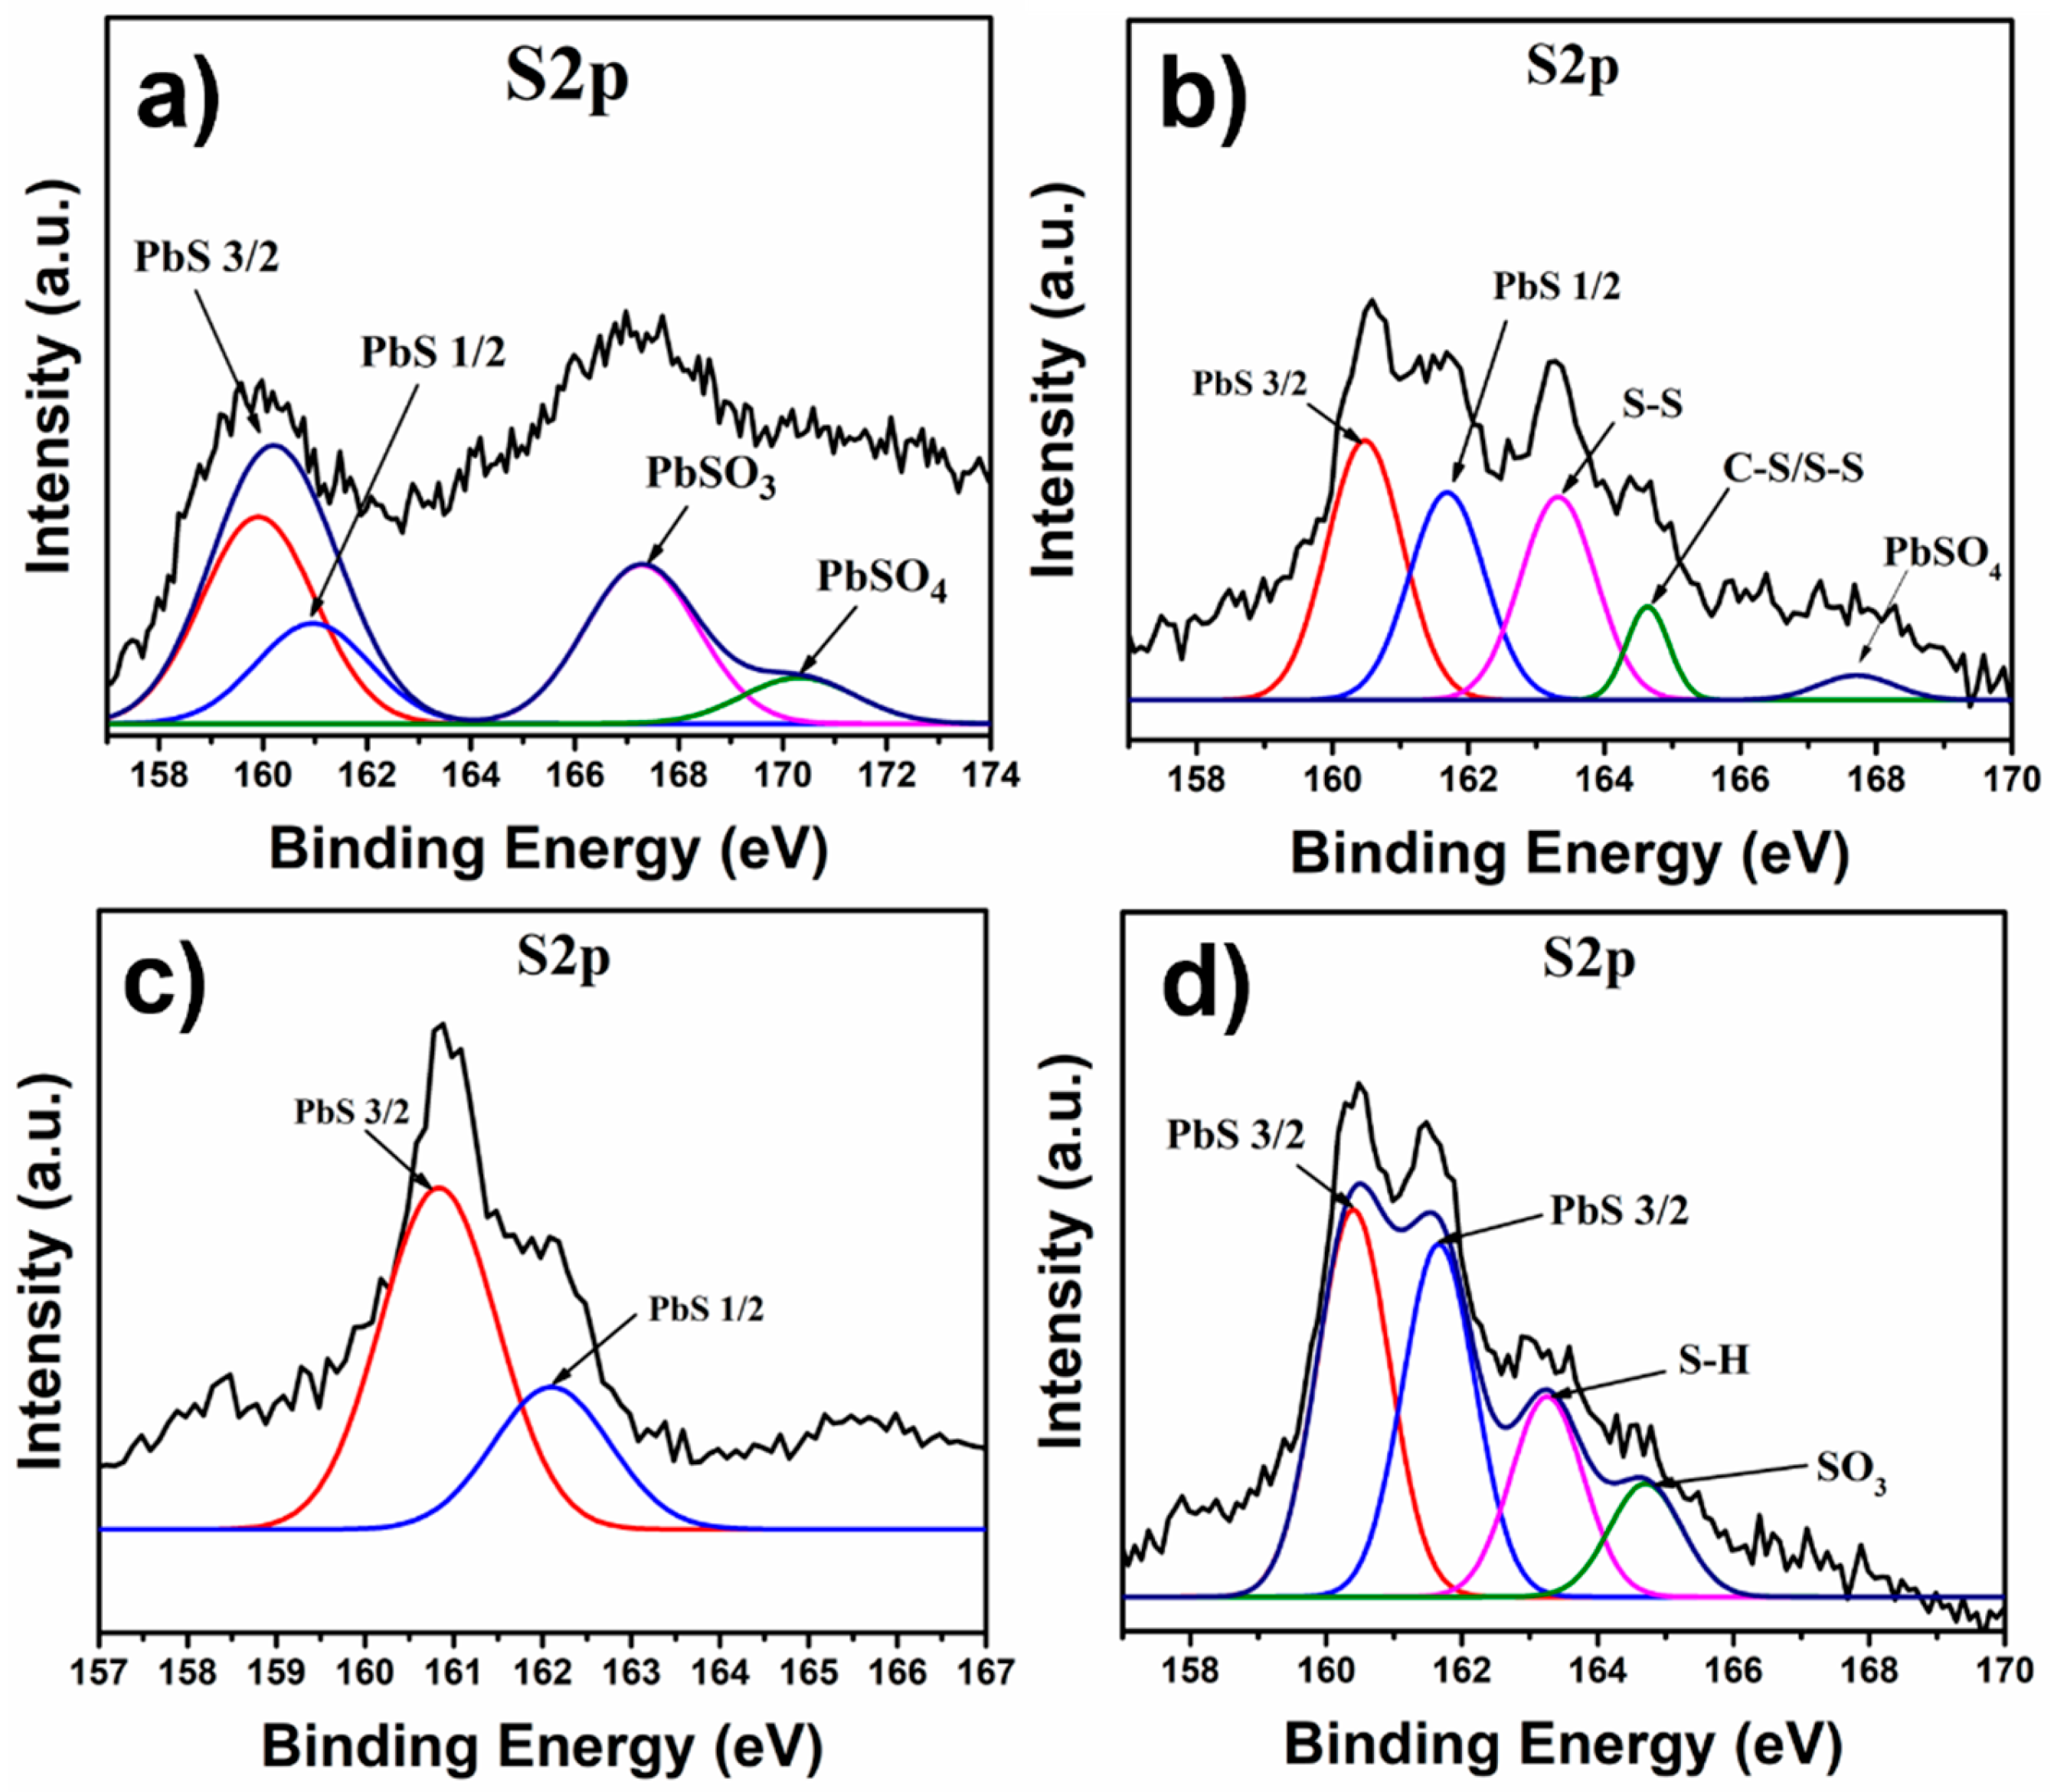
Figure 6.
a) FTIR spectra of the NHMs based on different capping ligands PbS QDs/GO. Raman spectra of the NHMs based on different capping ligands PbS QDs/GO: b) region comprising the D and G signals from GO; c) region comprising the phonon vibrations in PbS QDs.
Figure 6.
a) FTIR spectra of the NHMs based on different capping ligands PbS QDs/GO. Raman spectra of the NHMs based on different capping ligands PbS QDs/GO: b) region comprising the D and G signals from GO; c) region comprising the phonon vibrations in PbS QDs.
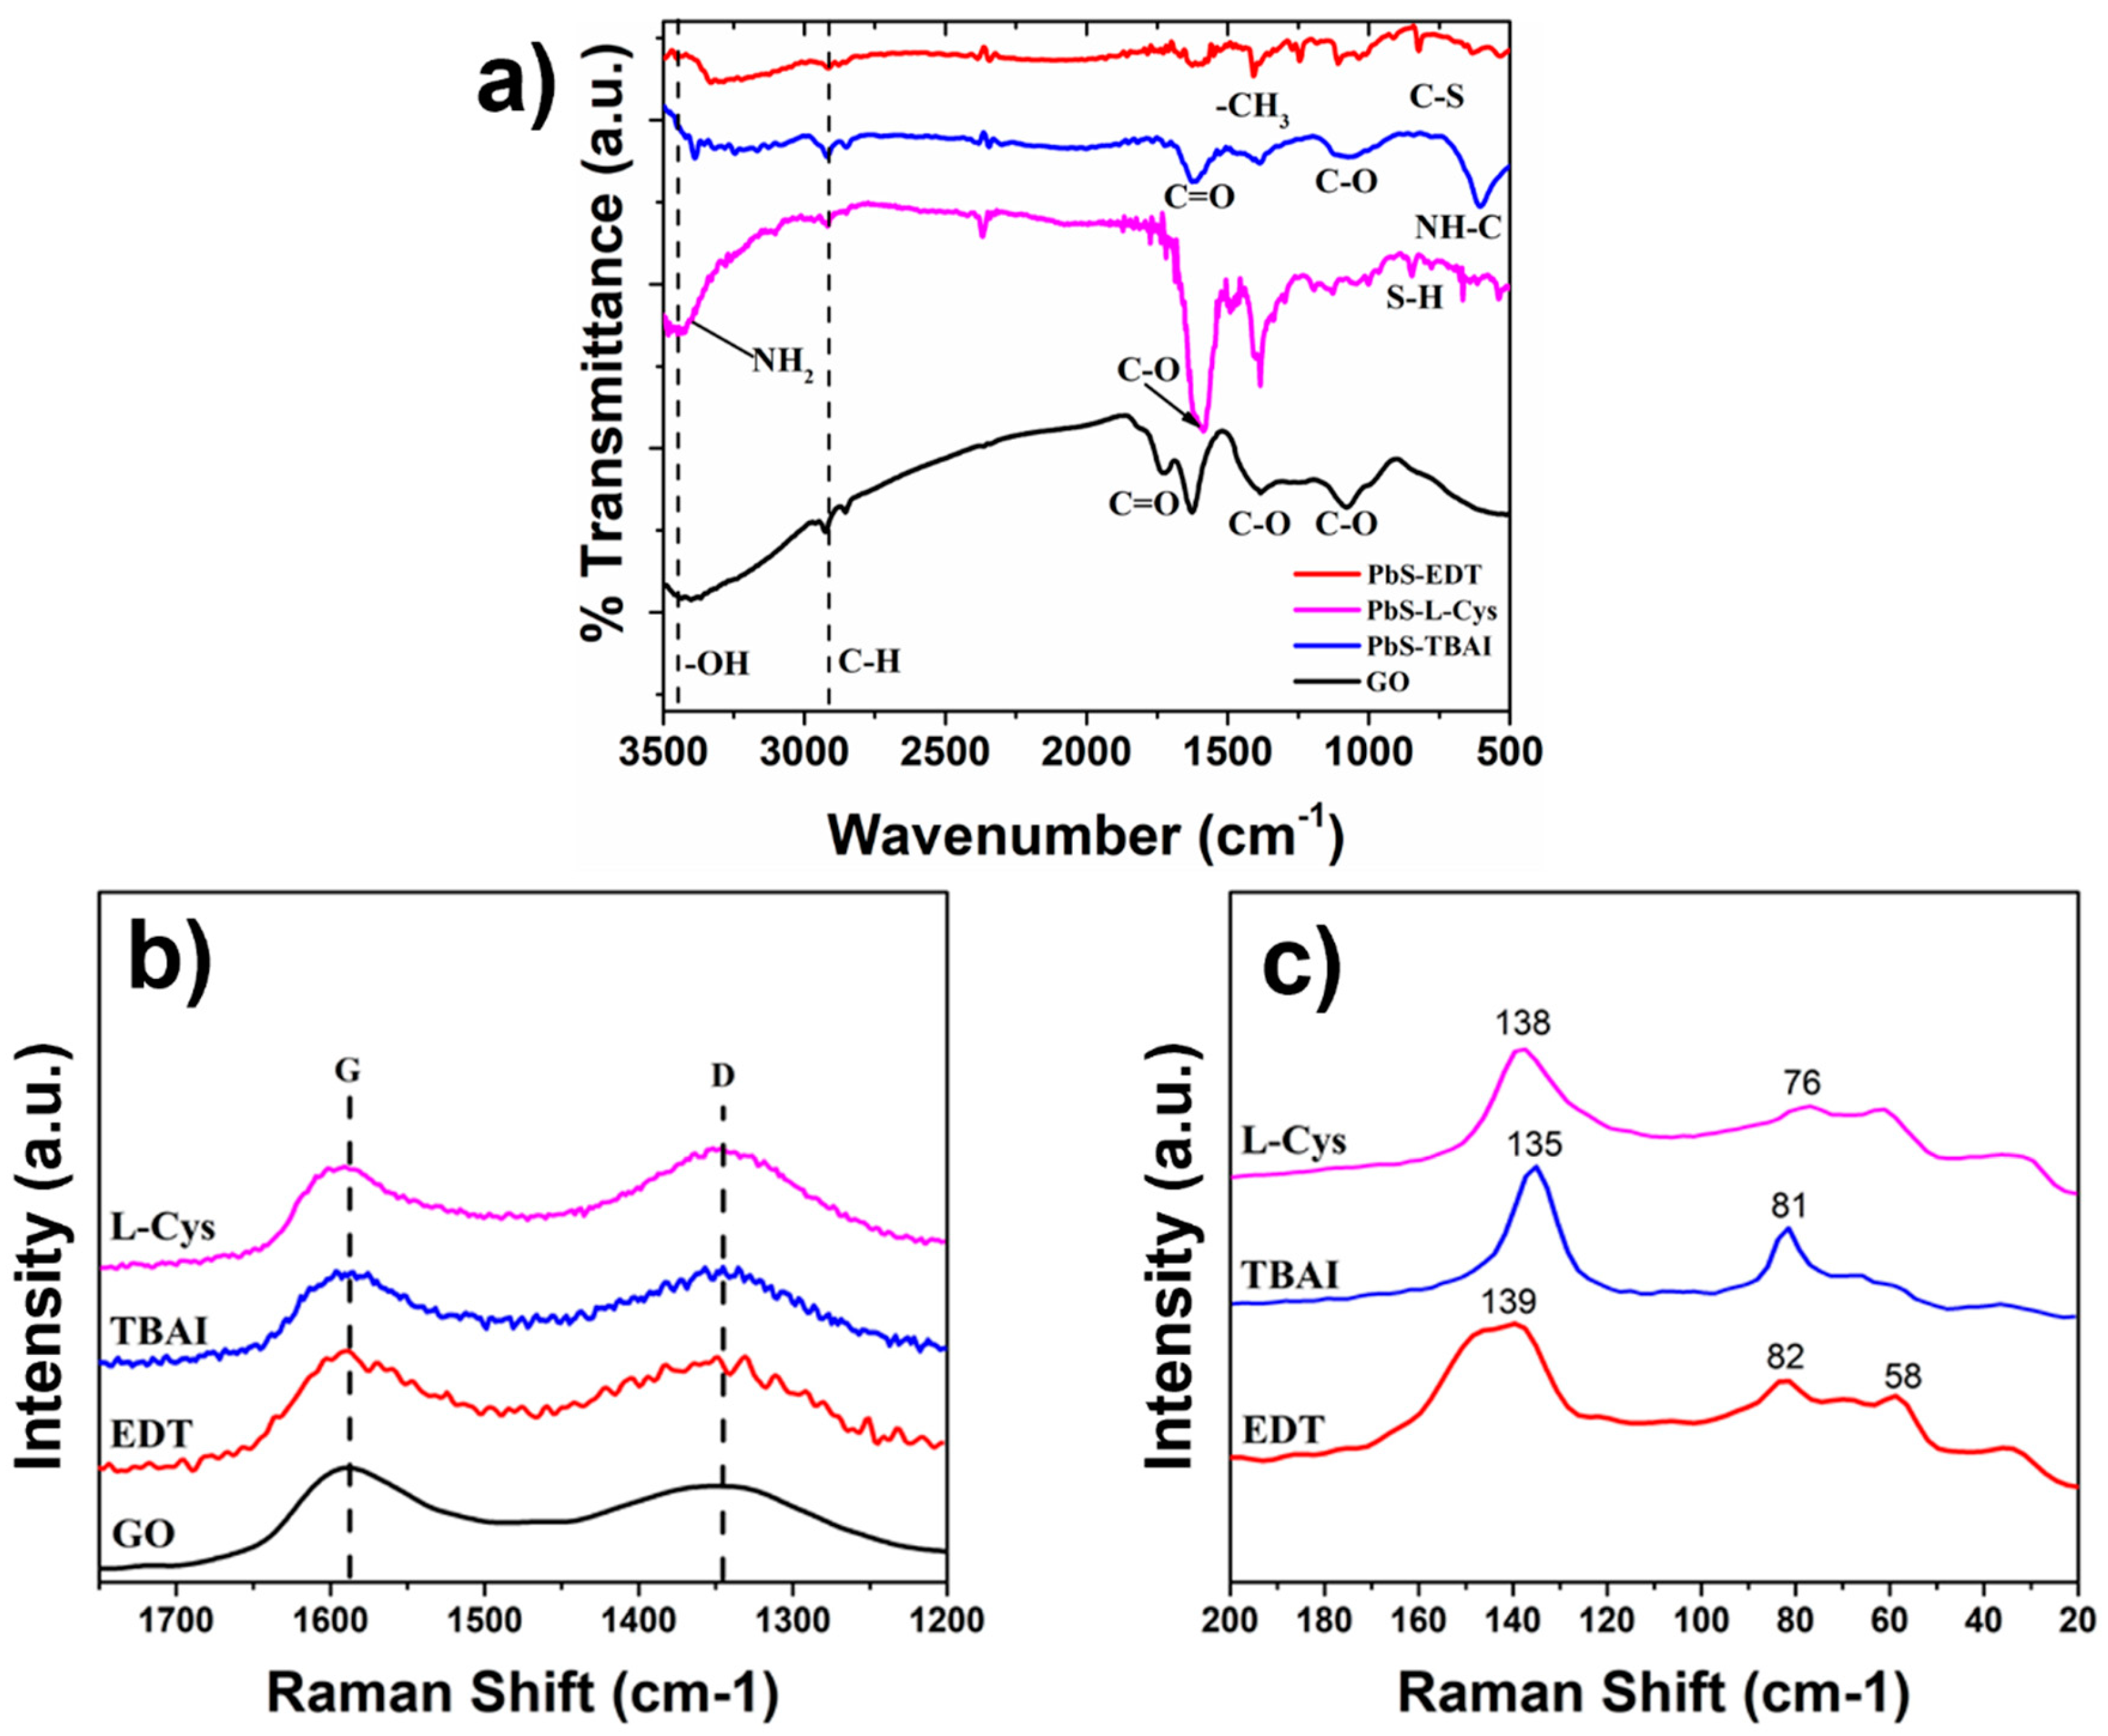
Figure 7.
XPS C1s peak for the different samples analyzed: a) GO, b) PbS-EDT/GO, c) PbS-TBAI/GO and d) PbS-L-Cys/GO.
Figure 7.
XPS C1s peak for the different samples analyzed: a) GO, b) PbS-EDT/GO, c) PbS-TBAI/GO and d) PbS-L-Cys/GO.
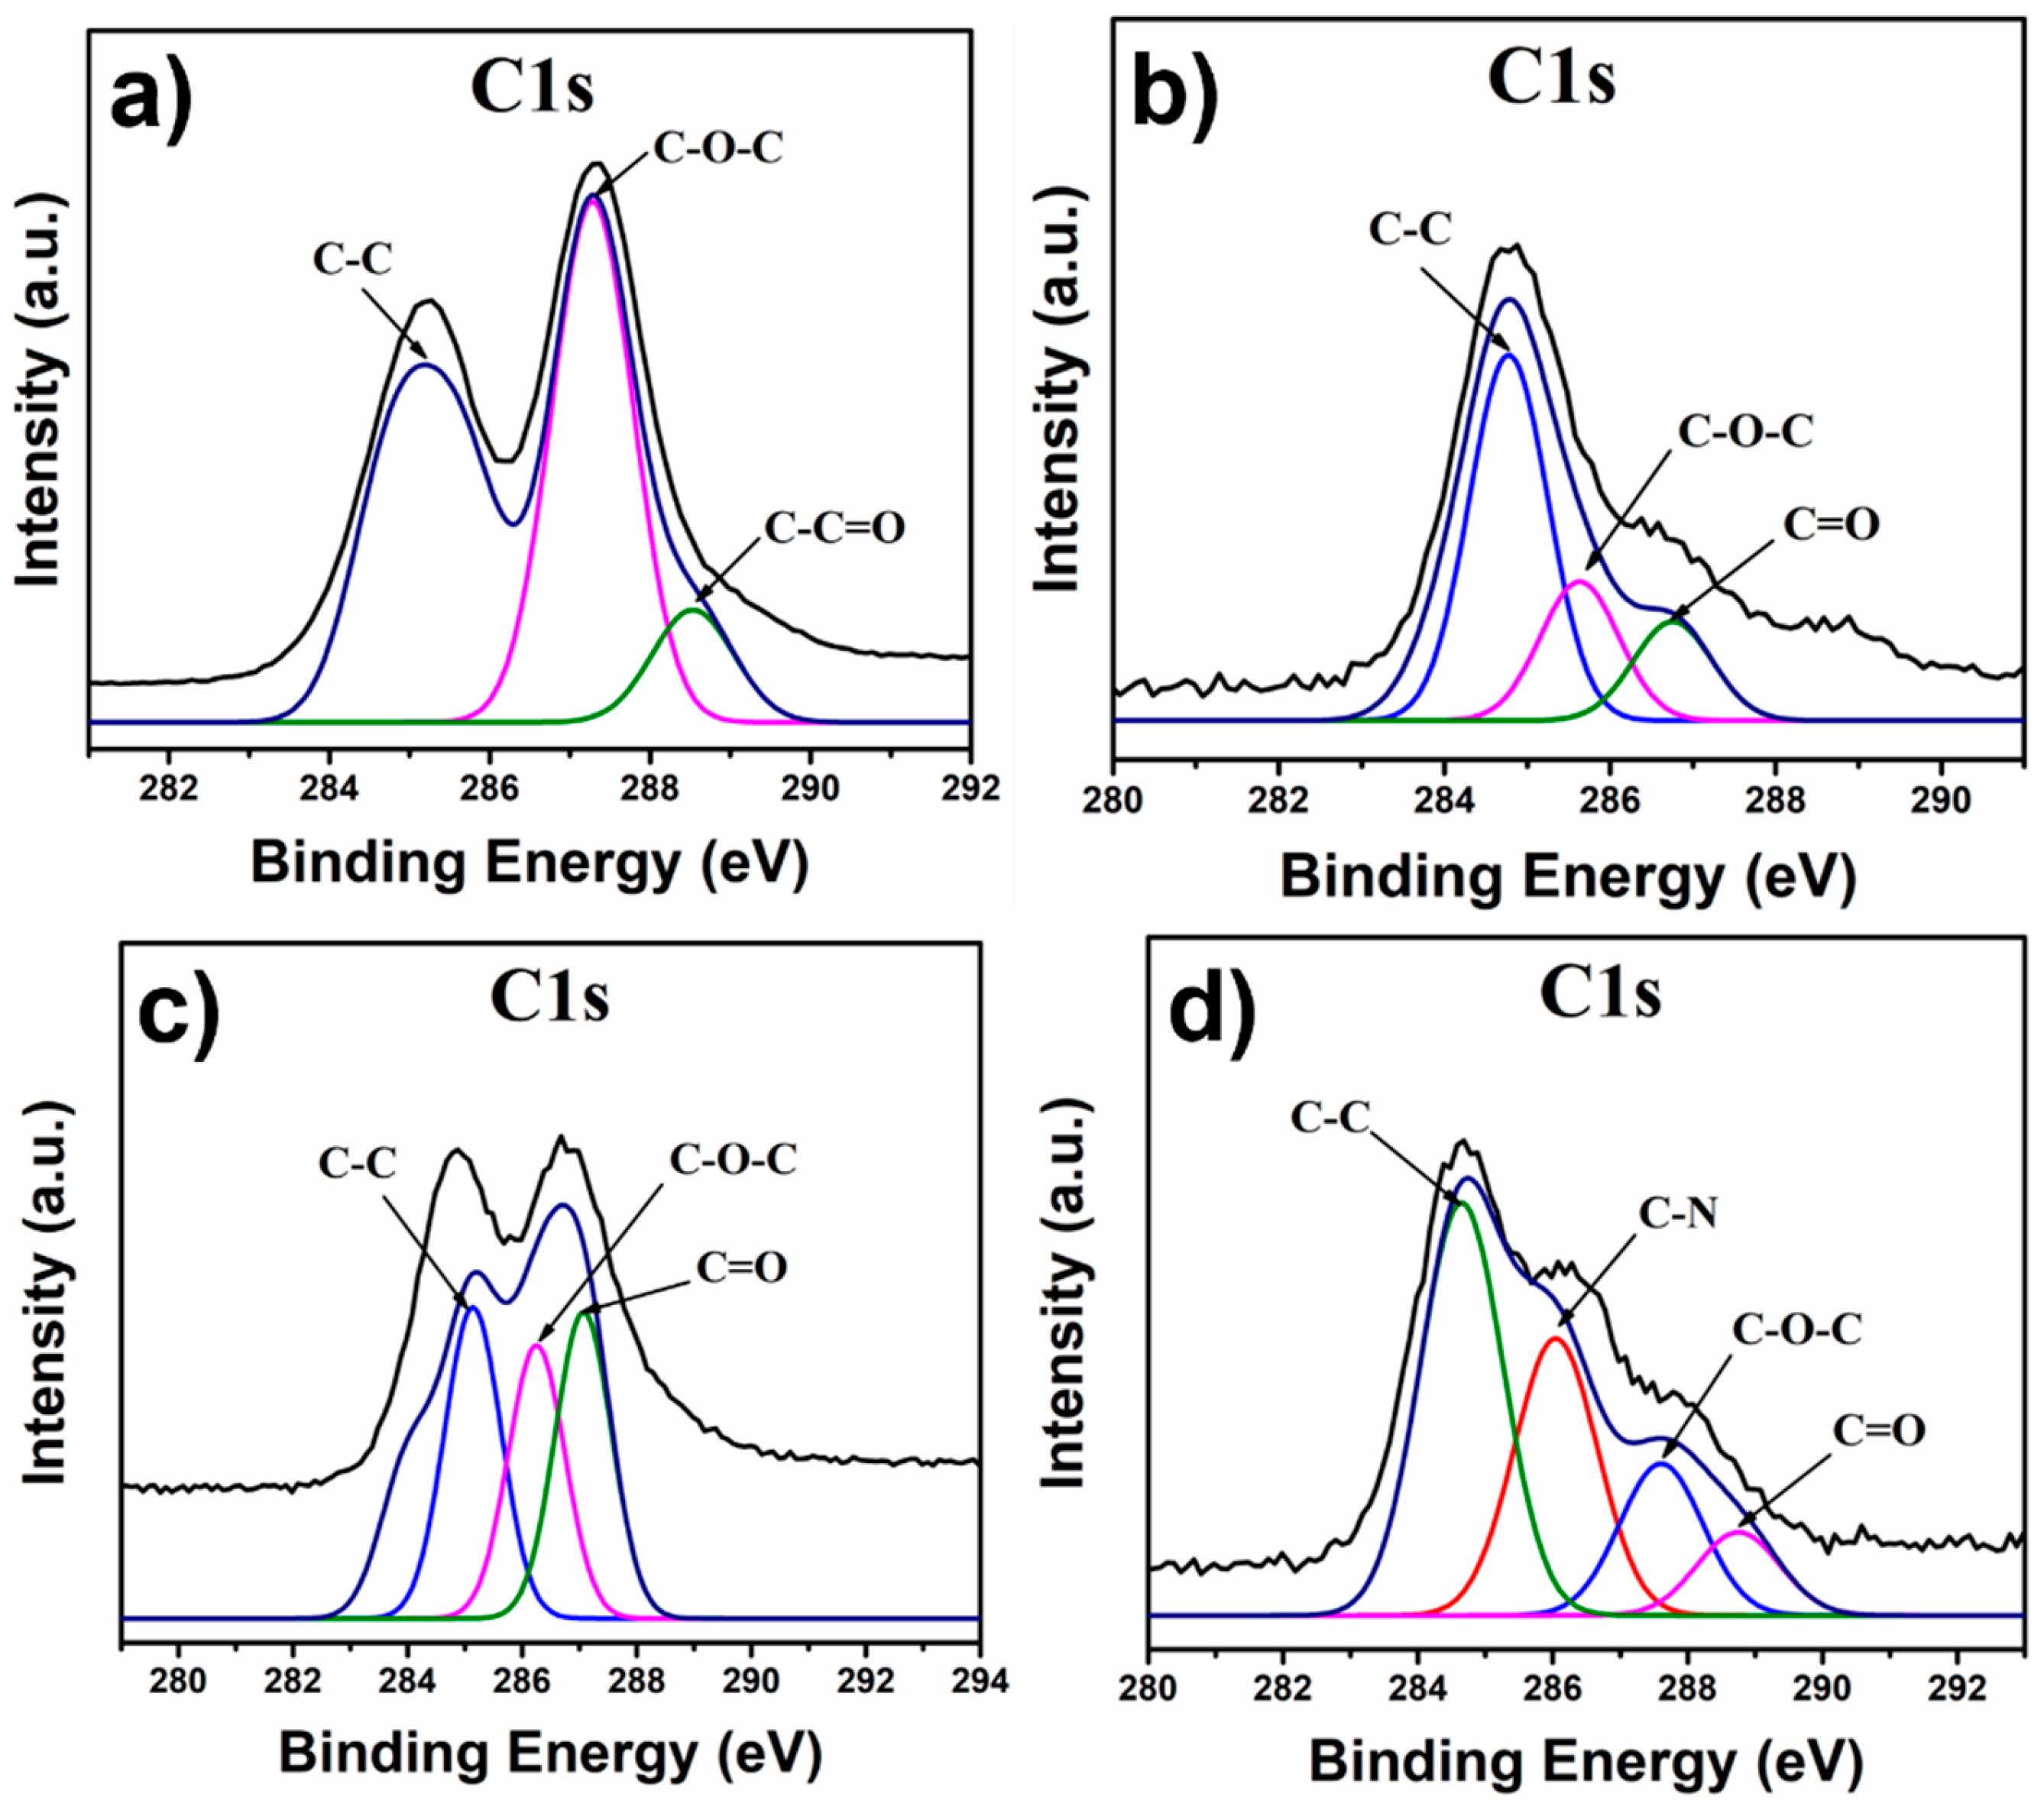
Figure 8.
XPS Pb4f peak for the different NHMs: a) PbS-EDT/GO, b) PbS-TBAI/GO and c) PbS-L-Cys/GO.
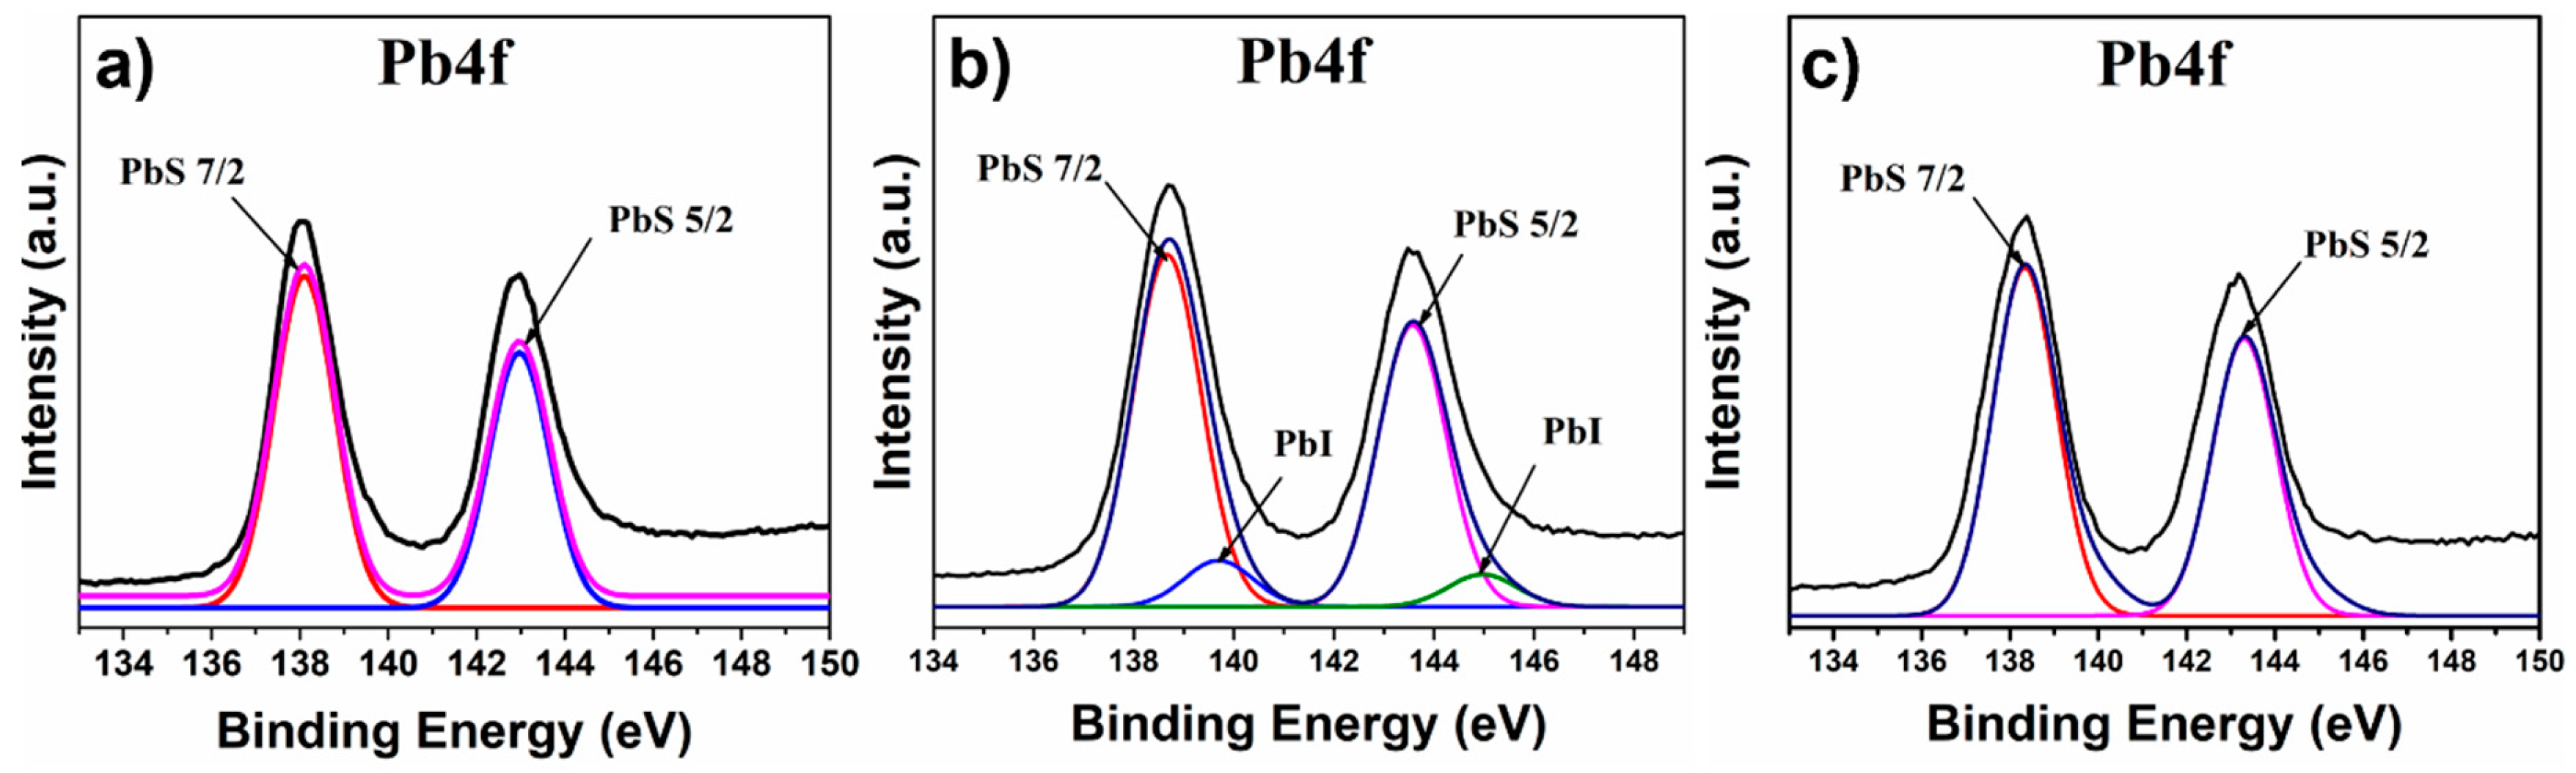
Figure 9.
TEM and HRTEM images for the different NHMs: a), b) PbS-EDT/GO, c), d) PbS-TBAI/GO and e), f) PbS-L-Cys/GO.
Figure 9.
TEM and HRTEM images for the different NHMs: a), b) PbS-EDT/GO, c), d) PbS-TBAI/GO and e), f) PbS-L-Cys/GO.
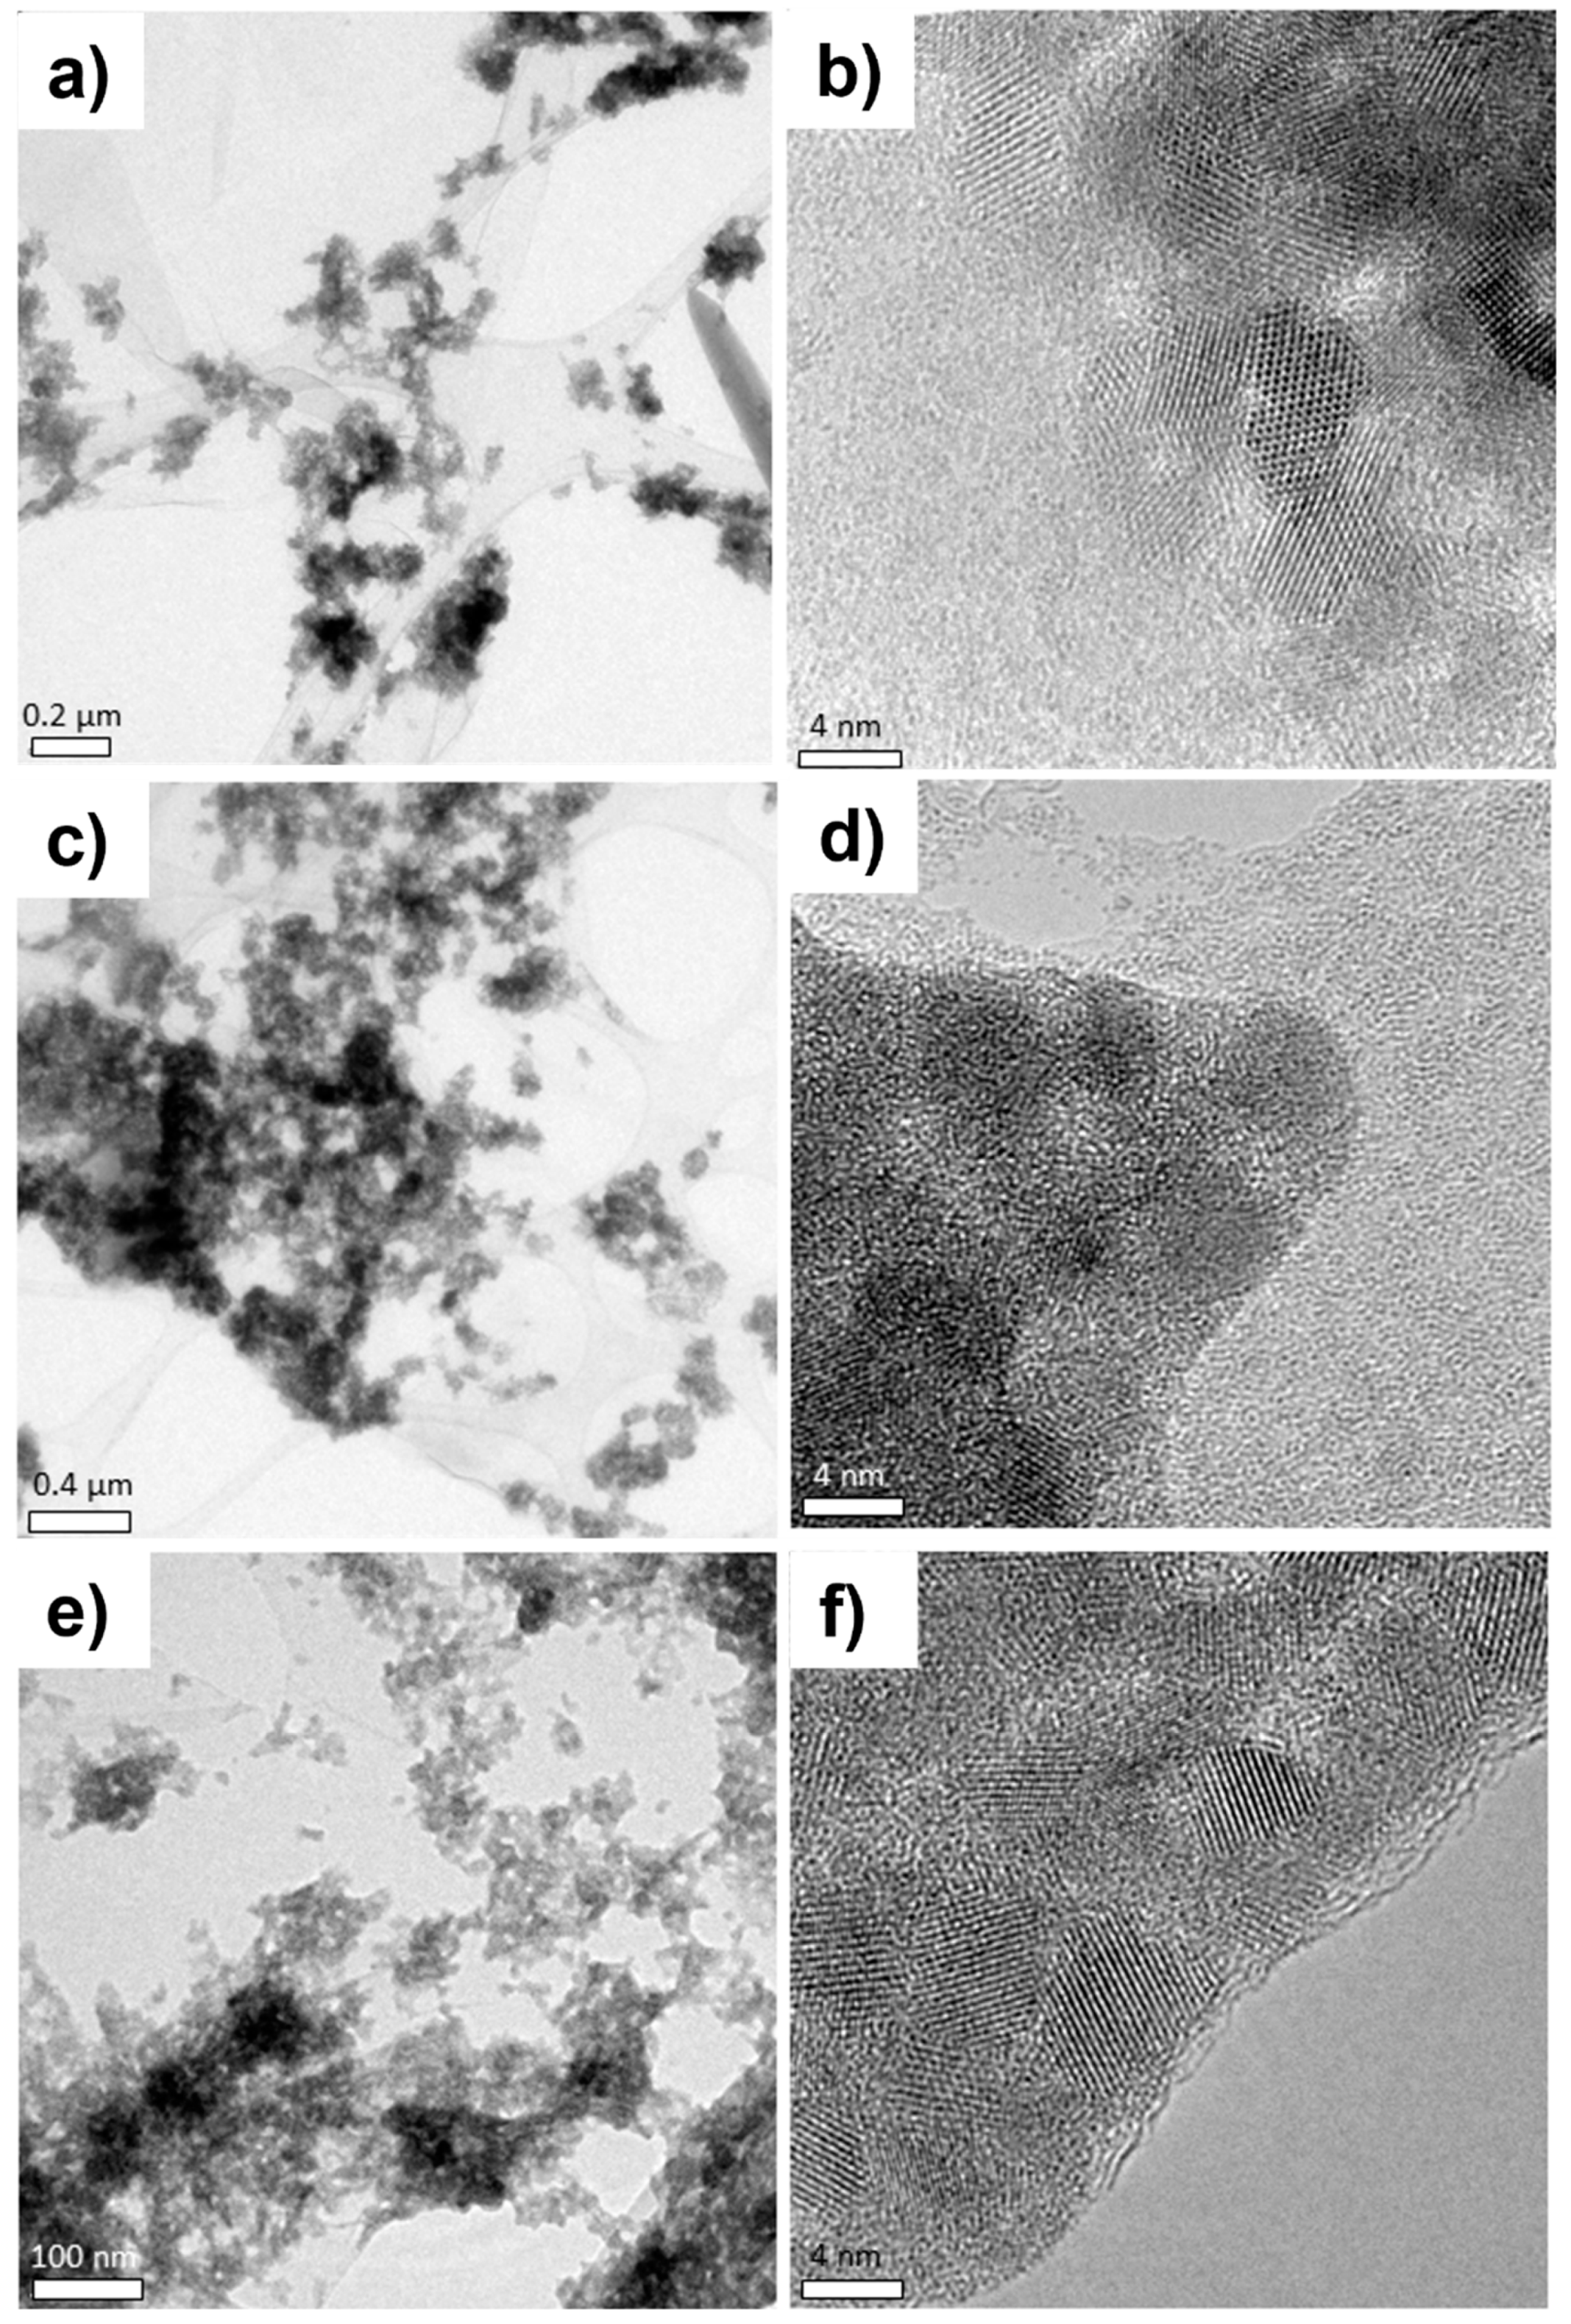
Figure 10.
SEM images for the surface of thin films based on the different NHMs: a), b) PbS-EDT/GO, c), d) PbS-TBAI/GO and e), f) PbS-L-Cys/GO.
Figure 10.
SEM images for the surface of thin films based on the different NHMs: a), b) PbS-EDT/GO, c), d) PbS-TBAI/GO and e), f) PbS-L-Cys/GO.
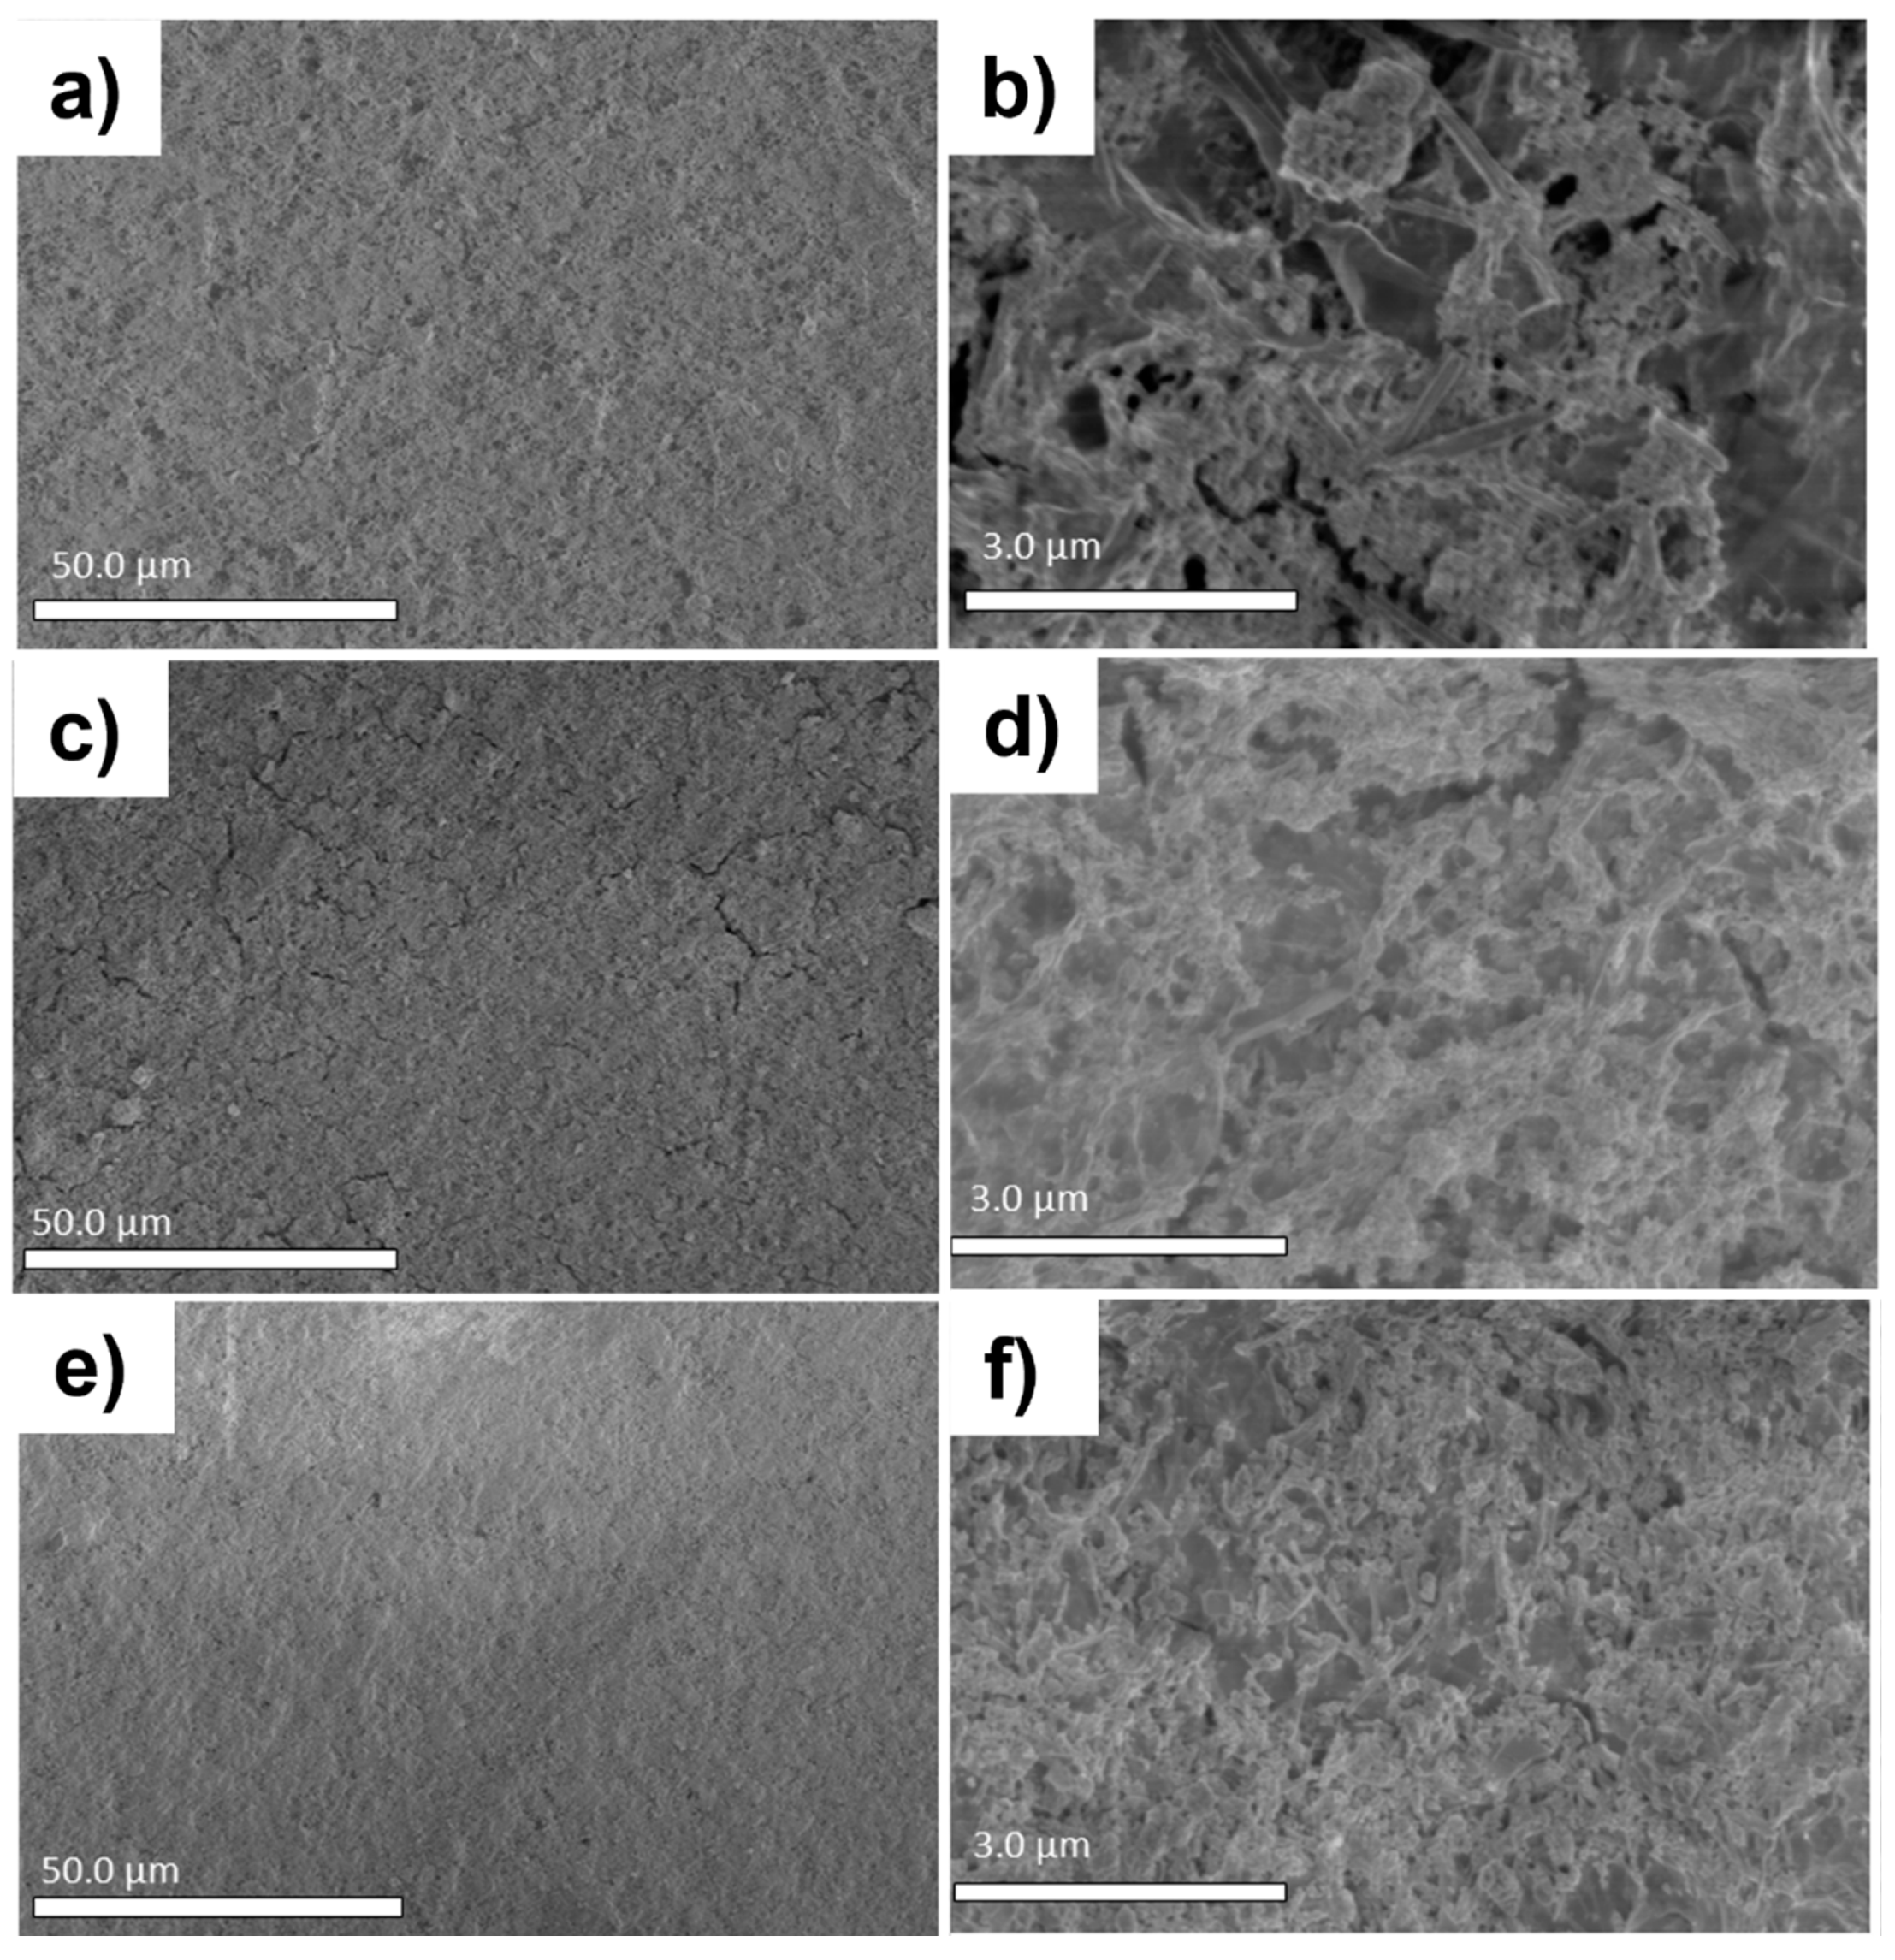
Figure 11.
a) I-V curves obtained from the NHMs thin films. Photoresponse for the different NHMs samples: b) PbS-EDT/GO, c) PbS-TBAI/GO and d) PbS-L-Cys/GO.
Figure 11.
a) I-V curves obtained from the NHMs thin films. Photoresponse for the different NHMs samples: b) PbS-EDT/GO, c) PbS-TBAI/GO and d) PbS-L-Cys/GO.
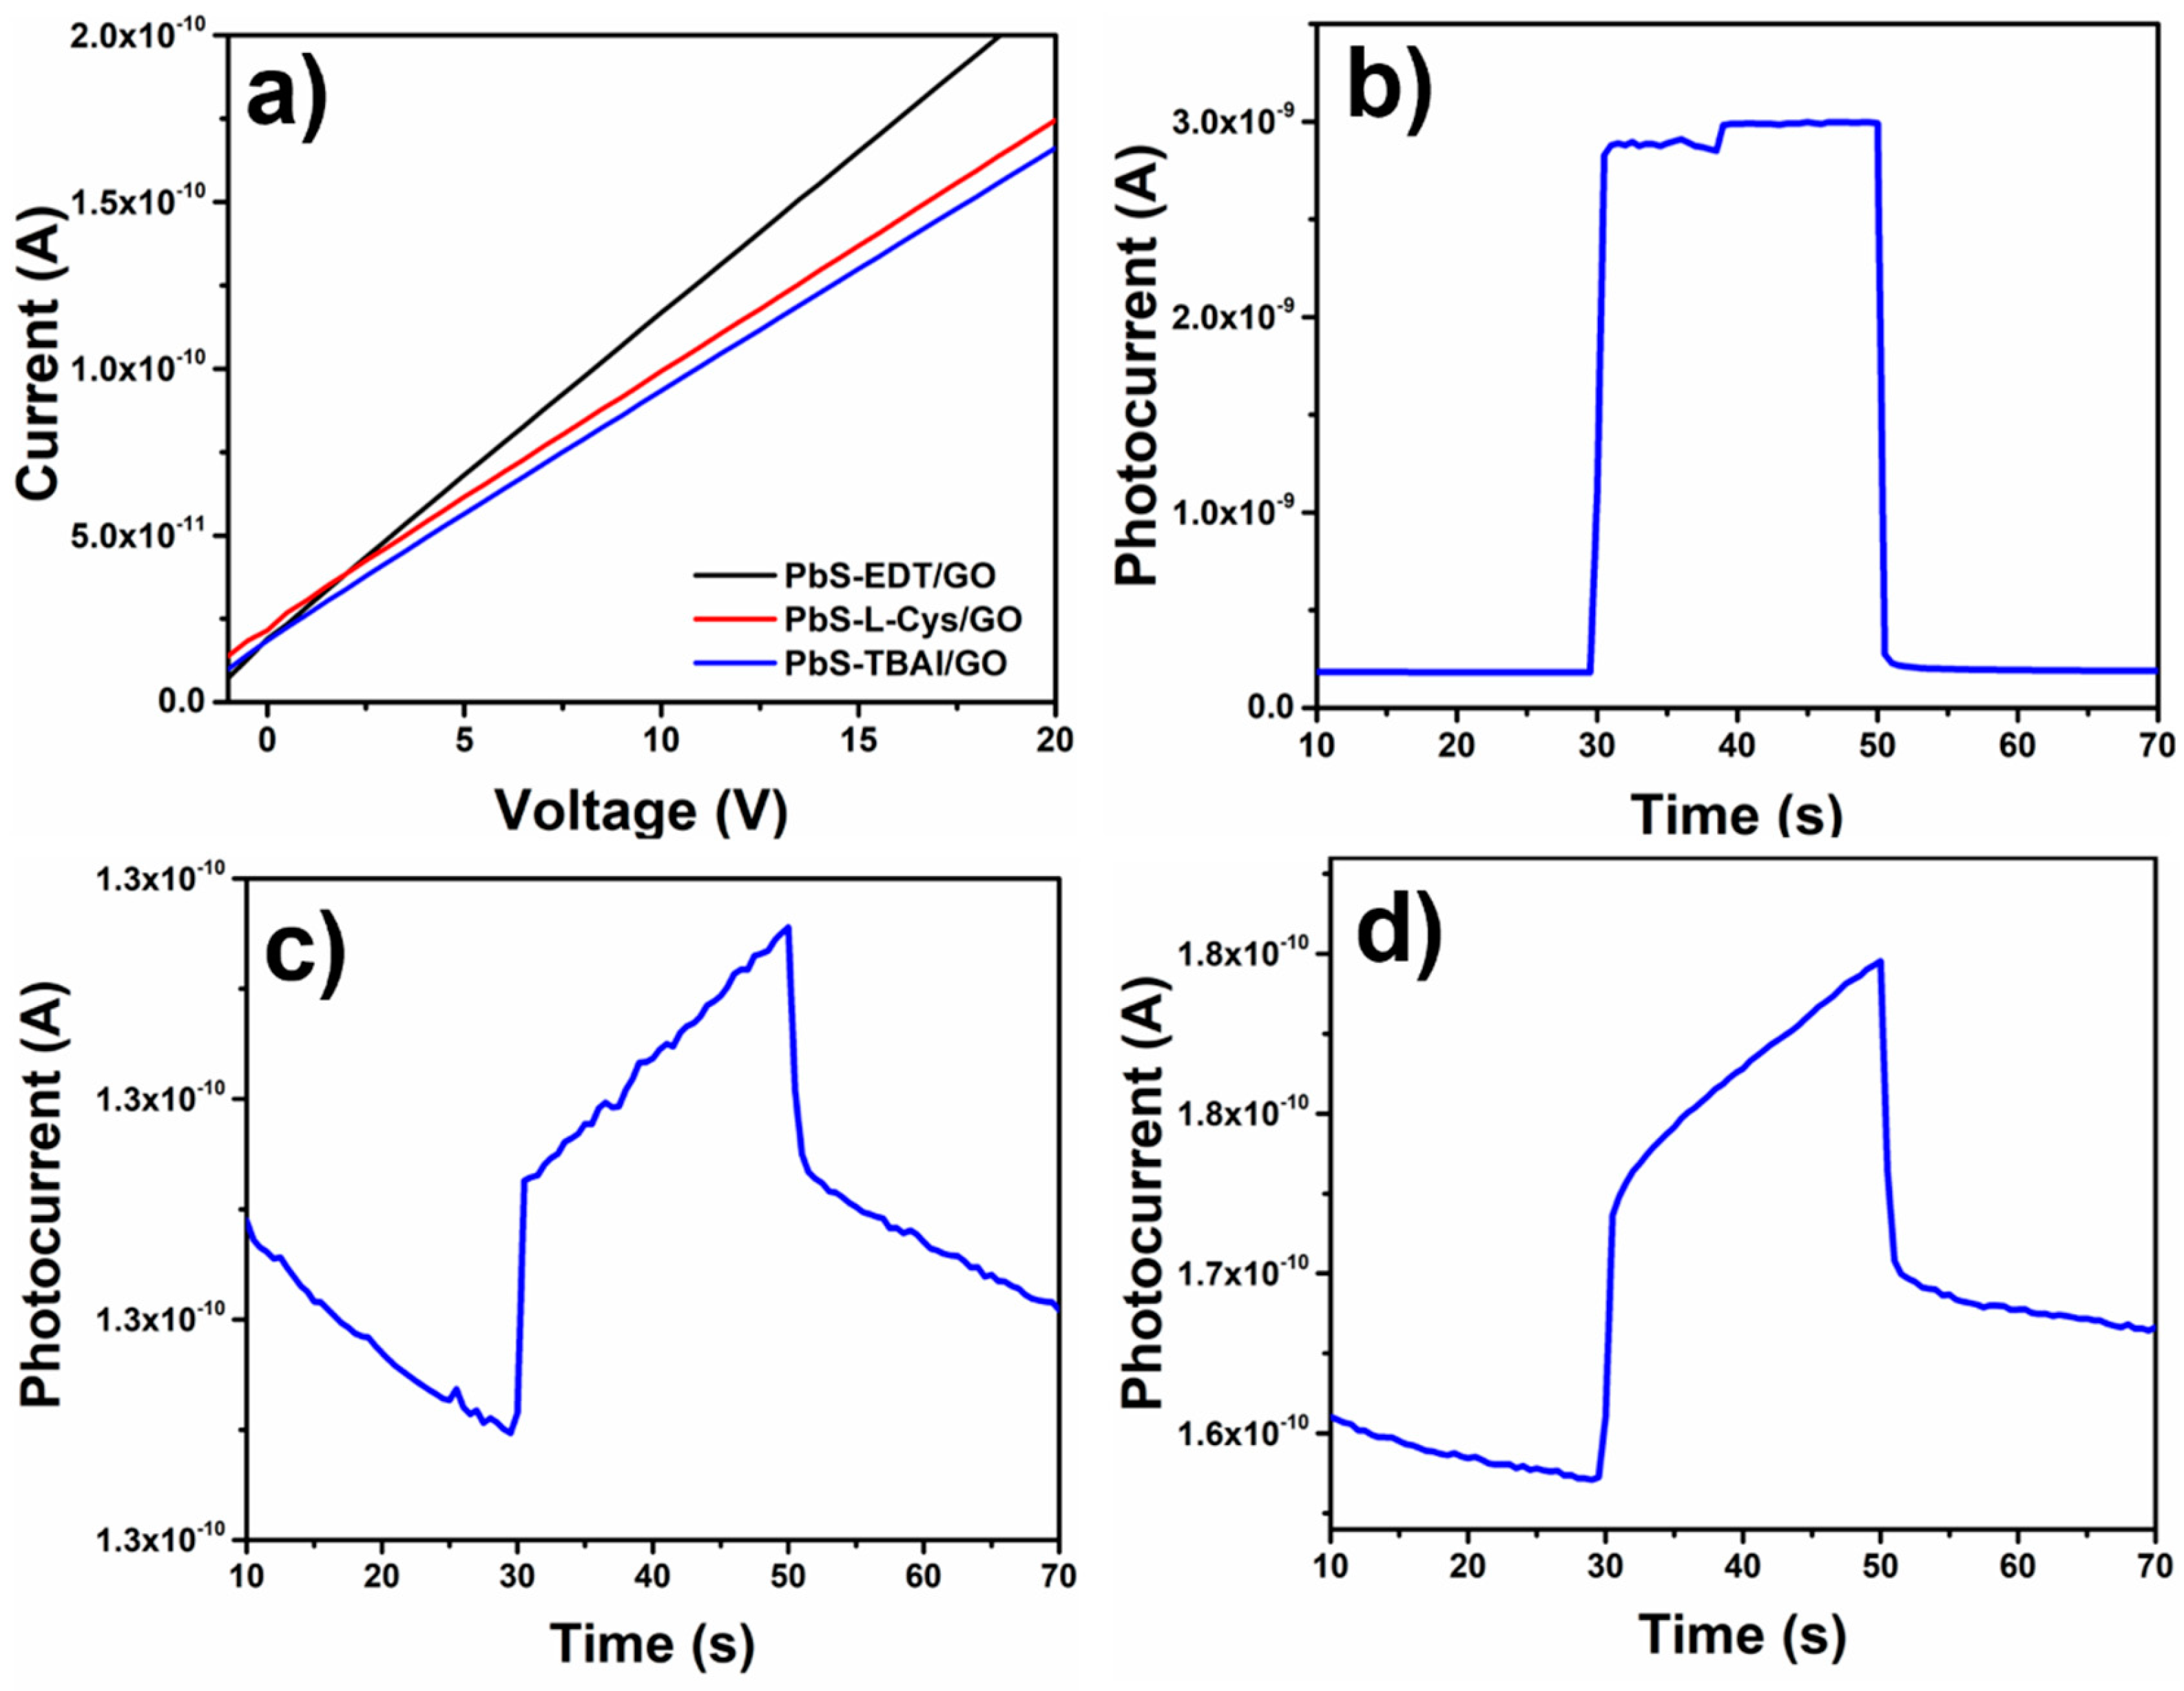

Table 1.
Average size and standard deviation for the PbS QDs with different capping ligand.
| Sample | Average size (nm) |
Standard Deviation (nm) |
|---|---|---|
| PbS-OA | 3.48 | 1.27 |
| PbS-EDT | 3.68 | 1.02 |
| PbS-L-Cys | 3.50 | 0.68 |
| PbS-TBAI | 3.79 | 0.74 |
Table 2.
Tuinstra-Koenig ratio (ID/IG) for the different NHM samples and the GO.
| Sample | |
|---|---|
| GO | 0.9052 |
| PbS-EDT/GO | 0.9156 |
| PbS-L-Cys/GO | 1.1698 |
| PbS-TBAI/GO | 1.0133 |
Disclaimer/Publisher’s Note: The statements, opinions and data contained in all publications are solely those of the individual author(s) and contributor(s) and not of MDPI and/or the editor(s). MDPI and/or the editor(s) disclaim responsibility for any injury to people or property resulting from any ideas, methods, instructions or products referred to in the content. |
© 2024 by the authors. Licensee MDPI, Basel, Switzerland. This article is an open access article distributed under the terms and conditions of the Creative Commons Attribution (CC BY) license (http://creativecommons.org/licenses/by/4.0/).
Copyright: This open access article is published under a Creative Commons CC BY 4.0 license, which permit the free download, distribution, and reuse, provided that the author and preprint are cited in any reuse.


