Introduction
Importantly, AMR is extensively recognised as a global health problem, yet in many parts of the world its enormity is not well expounded [
1]. Rising drug resistance is caused mainly by abuse or misuse of antimicrobials in humans and livestock. The spread of resistant strains in humans and livestock is increasing globally because of greater access to antibiotic drugs in low- and middle-income countries [
2]. The necessity to improve human health, animal health and agricultural productivity has led to the extensive use of antimicrobials without respecting therapy guidelines in many places particularly, in Africa.
Current status of AMR
In developing countries like Nigeria, the misuse and abuse of antimicrobials poses serious threats to public health. Also, farmer’s ignorance of the hazards related to AMR in food-producing animals and the urgent need to safe their dying animals has escalated the emergence of AMR (AMR) [
3,
4,
5,
6,
7,
8,
9]. The worldwide public health concerns with antibiotics used in food-producing animals are that they are closely related to those used in human medicine and select for resistance. Cross-species transmission of resistant bacteria or resistance genetic elements from animals or environment to humans has been reported [
10,
11]. Worldwide, AMR is increasing; if present trends carry on unrestricted, there may possibly be as many as 10 million annual AMR-associated deaths from a widespread array of infections by 2050 [
12]. The World Health Organization (WHO) has incorporated AMR as one of the topmost ten threats to global health in 2019 [
13]. Thus, the WHO and other international agencies (e.g. FAO, OIE), along with many individual countries, have developed comprehensive action plans to address the AMR crisis and one of the five main pillars of the Global action plan on AMR 2016-2020 is to strengthen the knowledge and evidence base through surveillance and research [
14]. The report from the monitoring of the global action plan by FAO has suggested and recommended the need for situation analysis and production of action plans for individual countries [
15].
Factors Contributing to AMR in Nigeria
Nigeria is faced with the challenge of poverty and poor environmental conditions such as lack of potable water and sanitation, and poor infection control in farms and hospitals. These factors aid the spread of resistant strains of microbes in the environment. Also, the understanding and awareness of AMR in Nigeria is poor [
16]. Antimicrobials, are mainly acquired over-the-counter without proper prescription and disease diagnosis thereby increasing the indiscriminate use of antimicrobials. The repeated use of antimicrobials in small doses in food animals for growth promotion, feed proficiency enhancement and prophylaxis, has been identified as a significant contributing factor to increasing antimicrobial resistance [
17].
Implication of AMR for Human and Animal Health
Antimicrobial resistance leads to ‘treatment failure’, the main consequence of which is Morbidity and mortality in patients. Resistant microbes will increase the chances of developing serious health conditions, longer hospital stays, higher medical costs and even death [
18]. The impact of AMR on animal health has been given far less attention than that for human health. Similar to humans Impacts of AMR on livestock is significant. AMR in animals will lead to infections that would not have occurred, increased frequency of treatment failures and increased severity of resulting in increased mortality and morbidity. The increase in resistance to antimicrobials will make treatments on animals ineffective and cause the infections to become more severe.
Antimicrobial Susceptibility Testing
Antimicrobial susceptibility testing (AST) methods are available to determine bacterial susceptibility to antimicrobials. The selection of a method is centred on many factors including practicality, flexibility, automation, cost, reproducibility, accuracy, and individual preference. It is important that AST methods provide reproducible results in day-to-day laboratory use and that the data be as good as with those results obtained by an acknowledged ‘gold standard’ reference method. In the absence of standardised methods or reference procedures, susceptibility results from different laboratories cannot be reliably compared [
19]. The following three methods have been shown to consistently provide reproducible and repeatable results when followed correctly; disc diffusion, broth dilution and agar dilution [
20]. The AST results should be recorded quantitatively; as distribution of MICs in milligrams per litre or µg/ml or as inhibition zone diameters in millimetres. Generally, antimicrobial susceptibility breakpoints are established by national standards organisations, professional societies or regulatory agencies. Only the CLSI has developed protocols for susceptibility testing of bacteria of animal origin and determination of interpretive criteria [
20]. However, protocols and guidelines are available from a number of standards organisations and professional societies for susceptibility testing for similar bacterial species that cause infections in humans. It is possible that such guidelines can be adopted for susceptibility testing for bacteria of animal origin. Additionally, efforts focusing on both standardisation and harmonisation of susceptibility/resistance breakpoints on an international scale are progressing. These efforts have primarily focused on the adoption of the standards and guidelines of CLSI and EUCAST, which provide laboratories with methods and quality control values enabling comparisons of AST methods and generated data [
20]. The results of AST are reported with interpretative categories; as “susceptible” which indicates that the bacteria was inhibited by the achievable concentrations of antimicrobial agent when the dosage recommended to treat the site of infection is used, “intermediate” which defines the bacteria for which the response rates to usually attainable blood and tissue levels of antimicrobial agent are lower compared to susceptible isolates and “resistant” which defines that the bacteria are not inhibited by the usually achievable concentrations of the agent with normal dose regimens. The AST procedure is sensitive to changes in the environment and test conditions, therefore it is crucial that each variable in the procedure should be standardised and carefully controlled [
21]. The continuous monitoring of the performance is best achieved by testing of quality control strains. Quality control strains are well-characterised organisms with defined susceptibility or resistance mechanisms to the antimicrobial agent(s) tested, testing quality control strains help concurrently monitor the performance of the test and ensures that the test is being performed properly [
22].
Nigeria Poultry Industry
The Nigeria Poultry industry contributes approximately 25% to agricultural GDP, consumption of chicken meat in Nigeria is growing so fast that capacity is not meeting demand [
23]. An estimated 454 billion tonnes of meat and 3.8 million eggs per year is produced in the poultry sector in Nigeria, with a standing population of 180 million birds. Approximately 80 million chicken are reared in extensive systems, 60 million in semi-intensive systems and the remaining 40 million in intensive systems [
24]. Poultry production in Nigeria has become increasingly intense consequently playing a key role in food security. There is no religious or cultural restrictions to its consumption therefore its wide consumption is associated with some food safety risks including AMR. Nigeria constitutes a large market for pharmaceuticals; accounting for 60% of volume of health products consumed in ECOWAS sub-region, but has limited regulatory capacity. Furthermore, manufacturers and importers have vertical drug distribution channels for wholesalers, retailers and hospitals with minimal government supervision. Thus, medicines are often sold in unregistered and unlicensed premises and in many cases by non-pharmacists. The Nigeria action plan on AMR control developed in 2017 has five focus areas, which one of it is, building a “One Health” AMR surveillance system [
25]. An earlier report of the trend, status and situation of AMR arising from food animals and the environment in Nigeria, Oloso,
et al. [
26], reviewed 48 AMR reports from different food animals and the environment within 2000-2016. This present study is focused on AMR in poultry and were viewed 91 AMR reports from 69 AMR studies from poultry only within 2005-2020 and we also considered other data not covered in the previous study such as the inclusion or absence of control strains in antimicrobial testing, the antimicrobial testing method and interpretative criteria used.
This study was carried out to collate, curate, and analyse data on AMR in Nigeria related to poultry and the immediate human link as contributors to the AMR burden in Nigeria and used the Preferred Reporting Items for Systematic Review and Meta-Analysis (PRISMA) for retrieval of articles and screening processes. This study serves as a reference source towards the development of good antimicrobial stewardship program by stakeholders through the “One Health Platform” for poultry in Nigeria.
Methods
Search Strategy and Selection Criteria
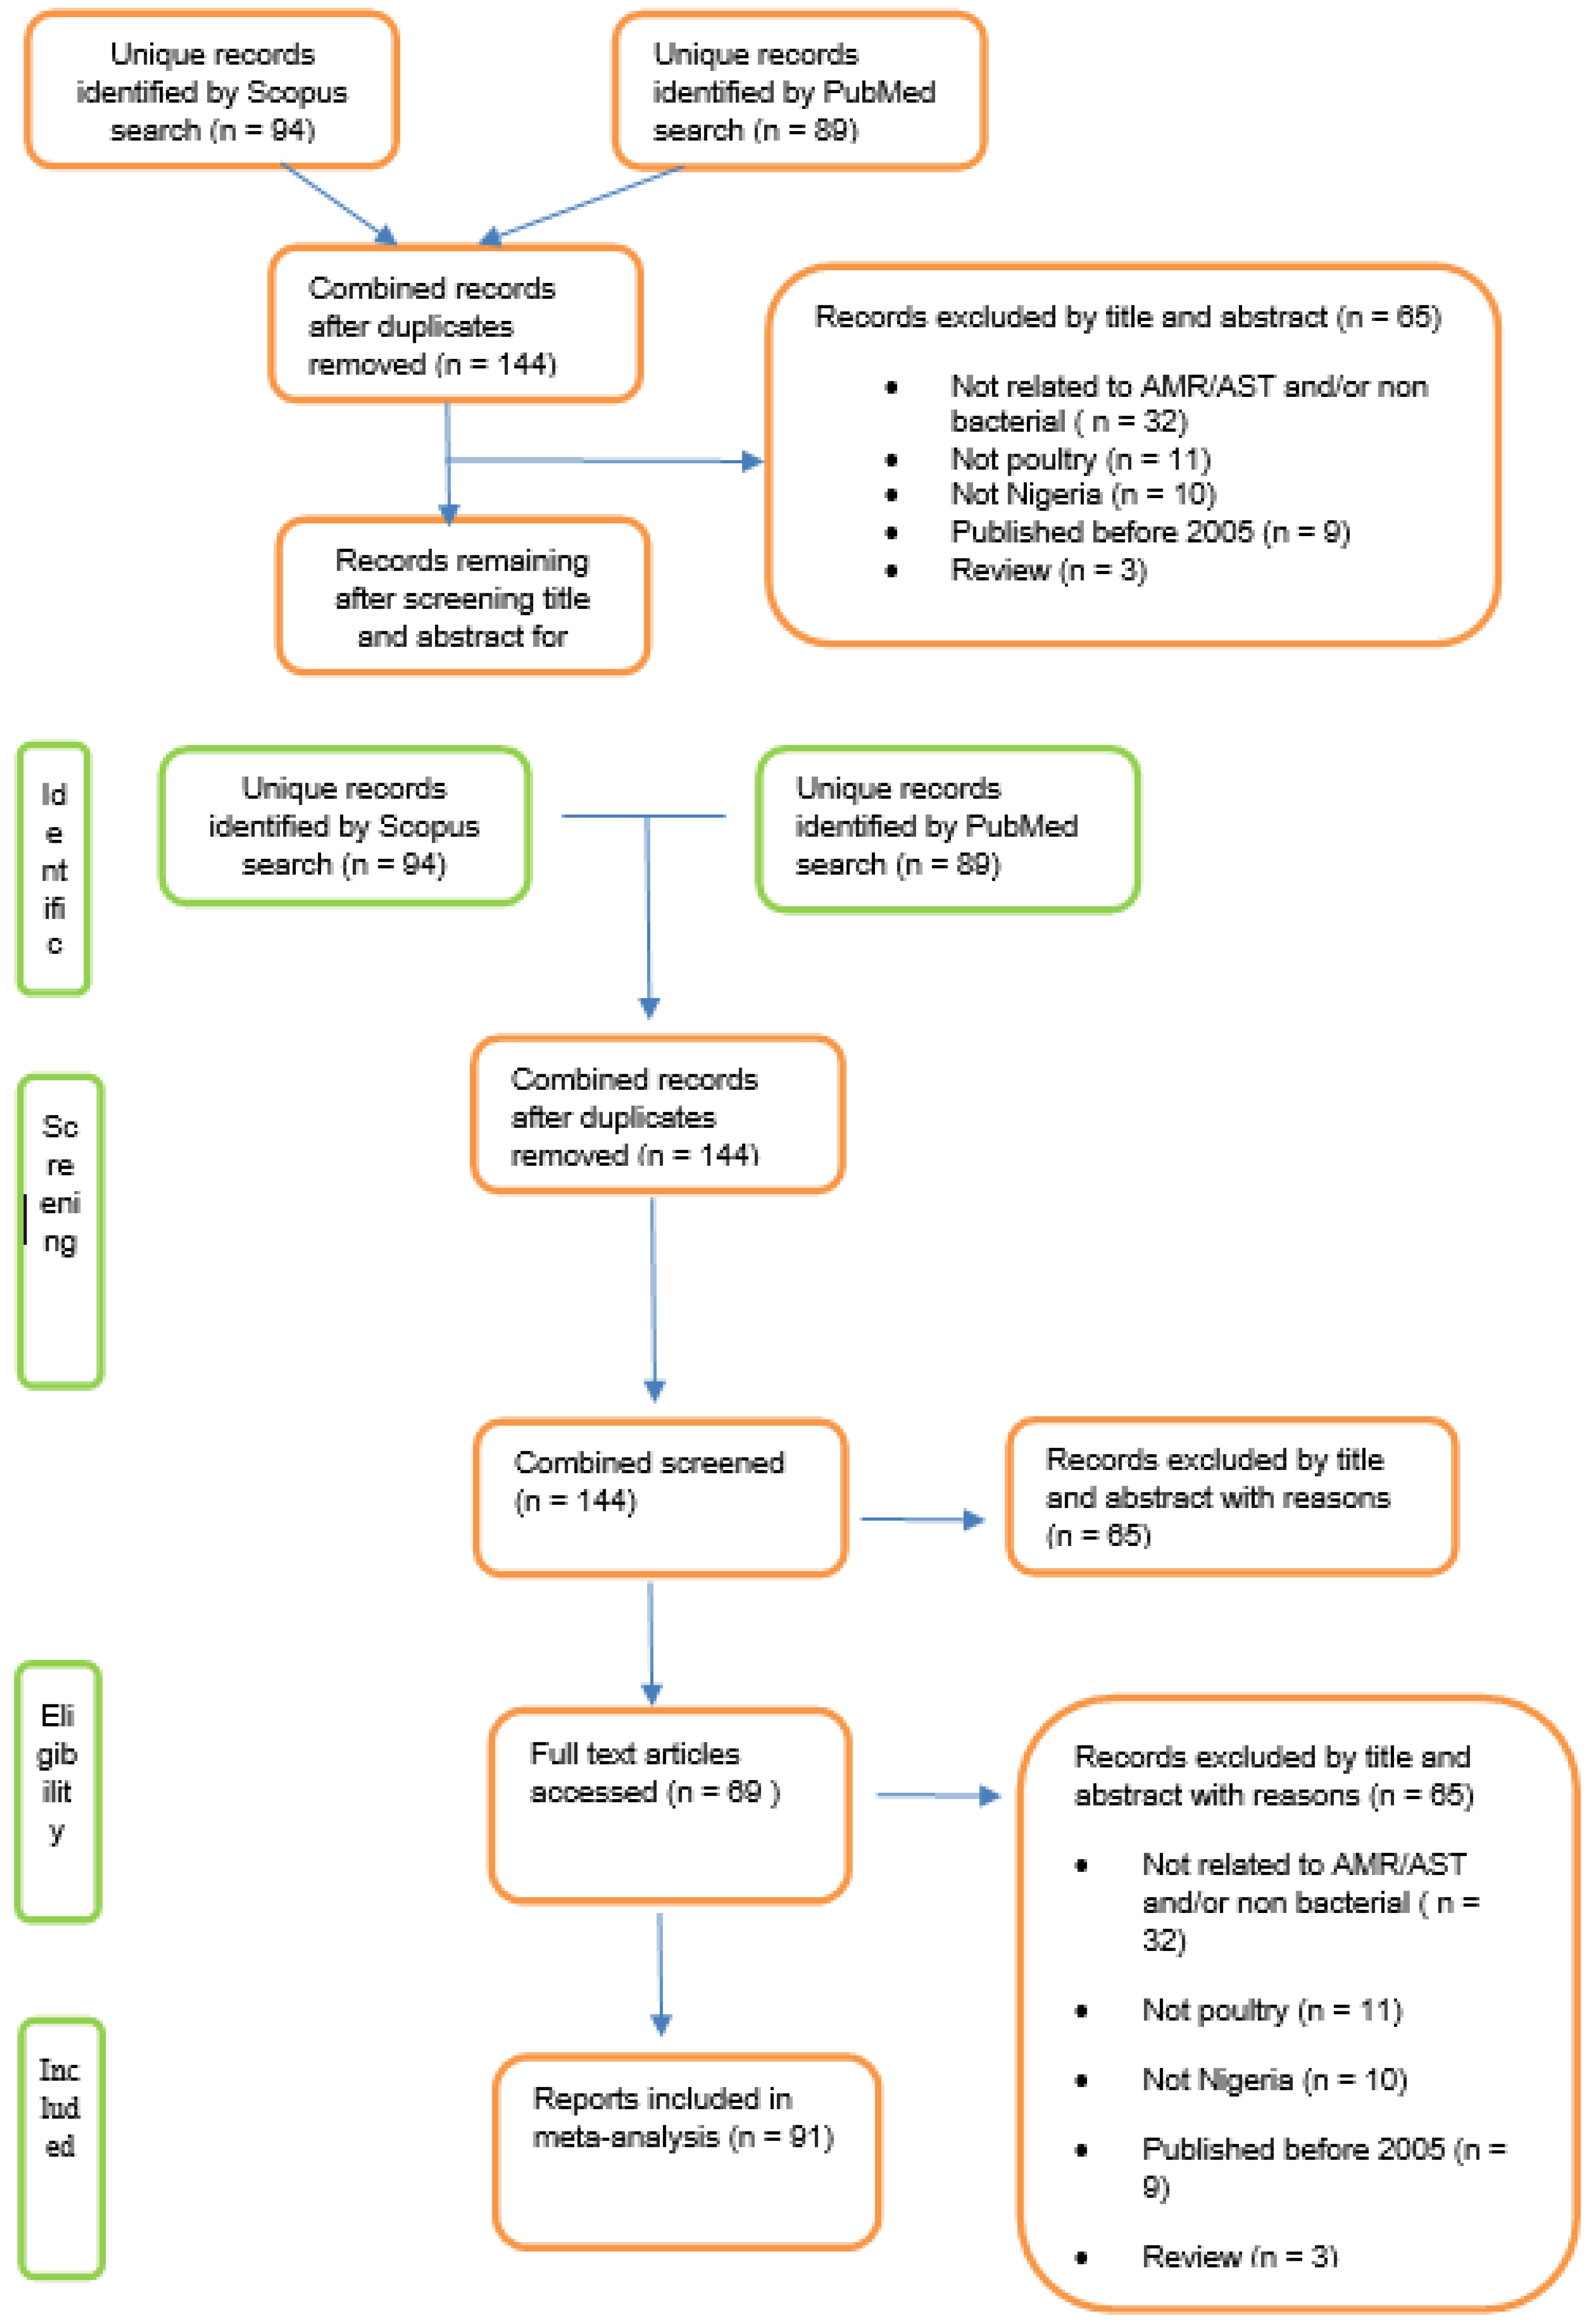
To obtain relevant articles the Scopus database was searched for English text articles from all years for records relating to AMR in Nigerian poultry using the search terms defined in
Figure 1. Additionally, the PubMed database was searched using related terms as defined in
Figure 1. The records from the two searches were combined and duplicates removed (
Figure 1). The title and abstracts (when available) were then screened for relevance and articles excluded if any of the following criteria were met: not related to AMR/AST or non-bacterial; out of geographic area (
i.e. not Nigeria); did not concern poultry; publication year earlier than 2005; and reviews. Records that remained were included in the review.
Data Extraction and Analysis
To harmonize the diverse data for analysing the situation of AMR from poultry reports in Nigeria the scale developed by Oloso
et al. [
26] was employed. In this scheme the percentage (proportion) of resistant microbe populations (species) per study was assigned a scale from 1 (no resistance) to 5 (very high resistance), as shown in
Table 1.
Some studies reported AMR results from more than one bacterial species and in these cases each species was analysed separately. A total of 69 studies were reviewed (
Table 2). Given the diversity of antimicrobials employed in the different studies and to further facilitate analysis and comparison, antimicrobials were grouped by class according to OIE, [
27] (
Table 3). The sulphonamides, trimethoprim and the combination drug trimethoprim-sulfamethoxazole were analysed as a single group named folic acid synthesis inhibitors. A large diversity of drug-bug combinations was observed in the overall data set, and to ensure integrity of interpretation only drug-bug combinations with a clinical breakpoint defined by CLSI or EUCAST were included for analysis. For example, the disc diffusion method for polymyxin susceptibility testing is not recommended by CLSI or EUCAST, and there are currently no established zone diameter breakpoints for colistin or polymyxin B [
28]. Therefore, colistin susceptibility data derived from this method were not included in subsequent analysis. The number of reports describing each drug-bug combination and each antimicrobial class-bug combination was calculated and these data were summarised by bacterial species. Additional information extracted for analysis from each study included: year of publication, Nigerian State or geopolitical zone, bacterial species tested, antibiotics tested, antimicrobial susceptibility testing (AST) method, AST interpretation standard, and use of quality control strains.
Determination of Multiple Antibiotics Resistance (MAR) index followed the procedure described by Ayandele
et al. [
29] in which the number of antibiotics an isolate is resistant to (a) is divided by the total number of the antibiotics used in the study (b), so that the MAR Index = a/b. Resistance to antibiotics was defined by the resistance proportion that fall under scale 4 or 5 (high or very high) and it was calculated for each bacterial species from all 69 reviews containing 91 reports.
Results
Overview of Records Returned
Search of the Scopus database yielded 94 unique records and the PubMed search yielded 89 unique records. In total 144 records were identified following combination of the two searches and removal of duplicates (
Figure 1). Of these, 69 met the inclusion criteria to give 91 AMR records (nine studies reported AMR results for more than one organism (range 2-6) and were included in the final analysis. All 69 records were from surveillance studies and none was a clinical report. These spanned the years 2005 to 2020 with an average of four records per year; the greatest number of records was from the year 2019 (n=12), whereas only a single report was from 2009 (
Table 2). All geopolitical zones in Nigeria were represented, and some records covered more than one zone; the highest number of reports was from South West Nigeria (27) and, in descending order, South East (18), South South (10) North Central (8), North West (6), and North East (5) (
Supplementary File 3).
The most commonly used antimicrobial susceptibility testing method was disc diffusion (n=60; 87%), broth dilution was used in eight studies (12%) and one study used agar dilution (1%). The majority (n=66, 96%) of the studies used the CLSI standards for interpretation and EUCAST was used in three studies (4%). Most of the studies (n=55; 80%) did not describe the use of quality control strains for antimicrobial susceptibility testing. Eight of the 69 studies reviewed did not provide AMR results as percentage resistance or sensitivity.
Cumulatively the 91 reports tested 69 different antimicrobials or combination antimicrobials belonging to 16 different classes, yielding a total of 760 AMR categorisations using to the scale of Oloso
et al. [
26] (
Table 3). The most commonly used antimicrobial groups for susceptibility testing included: quinolones (163 resistance categorisations; 21%), penicillins (153; 20%), aminoglycosides (119; 15%), and cephalosporins (85; 11%). Within these groups the most commonly tested antimicrobials included: ciprofloxacin and nalidixic acid (quinolones); ampicillin and amoxicillin/clavulanic acid (penicillins); gentamicin and streptomycin (aminoglycosides); and ceftazidime and ceftriaxone (cephalosporins) (
Table 3). Other antimicrobials groups used in these studies included trimethoprim-sulfamethoxazole, tetracyclines, and phenicols; the full list is given in
Table 3. Eight studies reported susceptibilities for polymyxins but in all cases these were determined by disc diffusion and consequently these data were not included for further analysis.
A total of seventeen bacterial species or genera were tested for antimicrobial susceptibility across the 91 reports. The most tested were
Salmonella spp. (n=28 reports; 31%),
Escherichia coli (n=24; 26%)
, Staphylococcus aureus (n=14; 15%) and
Campylobacter spp. (n=5; 5%).
Klebsiella and
Bacillus each had three reports, and there were two reports each for
Listeria,
Enterobacter, Staphylococcus spp. and
Proteus. There was one report each for
Alkaligenes,
Enterococcus,
Micrococcus,
Norcardia, Ochrobacturm,
Shigella,
Streptococcus, and
Yersinia. The scale developed by Oloso
et al., [
26] was employed to assess the burden of AMR in the four most reported bacterial species or genera:
Salmonella spp.,
Escherichia coli,
Staphylococcus aureus, and
Campylobacter spp.
Salmonella
There were 28 reports of AMR in
Salmonella spp. from Nigerian poultry. All geopolitical zones were represented, and studies spanned the years 2005-2019. Data for 29 antibiotics belonging to 10 antimicrobial groups were available, to give a total of 237 resistance categorisations according to the Oloso
et al. [
26] scale (
Figure 3a). In aggregate, resistance categorisations of “very high” or “high” were the most abundant (n=117; 49%), and “no” or “very low” categorisations were less common (n=80; 34%). Many studies employed the same antimicrobials; at least ten used ampicillin, amoxicillin/clavulanic acid, chloramphenicol, ciprofloxacin, folic acid inhibitors (sulphonamides, trimethoprim, or trimethoprim-sulfamethoxazole), gentamicin, nalidixic acid, nitrofurantoin, ofloxacin, streptomycin, and tetracycline. The 3
rd generation cephalosporins cefotaxime, ceftazidime, and ceftriaxone were employed in five or more studies. However, due to the diversity of antibiotics examined in the 28 reports, the total number of categorisations differed by antimicrobial class (
Figure 2a).
The most tested class was the quinolones (n=60), with 26 “very high” or “high” resistance categorisations and 26 categorised as “no” or “very low” (
Figure 2a). High proportions of “very high” or “high” resistances were noted for nitrofurantoin (8/10 reports), tetracyclines (16/21 reports), folic acid inhibitors (15/26 reports), penicillins (20/37 reports), cephalosporins (11/24 reports), and chloramphenicol (5/11 reports) (
Figure 2a). Three reports investigated susceptibility towards carbapenems and each had “very low” and “no” resistance categorisation. There was a single report for fosfomycin which noted “no” resistance.
Figure 2.
a. Summary of antimicrobial resistances for Salmonella spp.. The data are presented by antimicrobial group, with resistance categorizations expressed as proportions (left side scale) and ordered by the number of categorisations, as indicated by the red line (right-side scale).
Figure 2.
a. Summary of antimicrobial resistances for Salmonella spp.. The data are presented by antimicrobial group, with resistance categorizations expressed as proportions (left side scale) and ordered by the number of categorisations, as indicated by the red line (right-side scale).
Escherichia coli
E. coli was the second most represented bacterium in the papers examined, with 24 AMR reports spanning the years 2007-2020. Data was from all geopolitical zones, with the greatest number from the South West and South East. Data for 34 antibiotics belonging to 10 antimicrobial groups were analysed, to give a total of 134 resistance categorisations according to the Oloso
et al. [
26] scale (
Figure 2b). Overall, resistance categorisations of “very high” or “high” were in the majority (n=76; 57%) whereas “no” or “very low” categorisations were less common (n=42; 31%). As was observed with
Salmonella, the number of resistance categorisations differed by antimicrobial class (
Figure 2b), again reflecting the diversity of antibiotics employed in the papers included for analysis. Certain antimicrobials were employed in several studies and the following were used in at least ten: ampicillin, ciprofloxacin, gentamicin, trimethoprim-sulfamethoxazole, and tetracycline. High proportions of “very high” or “high” resistances were noted for nitrofurantoin (4/4 reports), tetracycline (9/10 reports), chloramphenicol (6/7 reports), folic acid inhibitors (10/14 reports), penicillins (11/16 reports), and cephalosporins (13/25 reports). Quinolones were the most tested and 47% (15/32 reports) had a “very high” or “high” categorisation. Four studies examined nitrofurantoin resistance, and each reported a “very high” or “high” categorisation. Conversely the four studies (with seven reports) that examined carbapenem resistance all had “very low” (1.2 - 8.0%) or “no” resistance while a study reported ‘no’ resistance to fasfomycin. The percentage MAR greater than 0.5 for both Salmonella and
E.coli are 38.9% and 44.8% respectively.
Figure 2.
b. Summary of antimicrobial resistances for E. coli. The data are presented by antimicrobial group, with resistance categorizations expressed as proportions (left side scale) and the number of categorisations for each group indicated by the red line (right-side scale).
Figure 2.
b. Summary of antimicrobial resistances for E. coli. The data are presented by antimicrobial group, with resistance categorizations expressed as proportions (left side scale) and the number of categorisations for each group indicated by the red line (right-side scale).
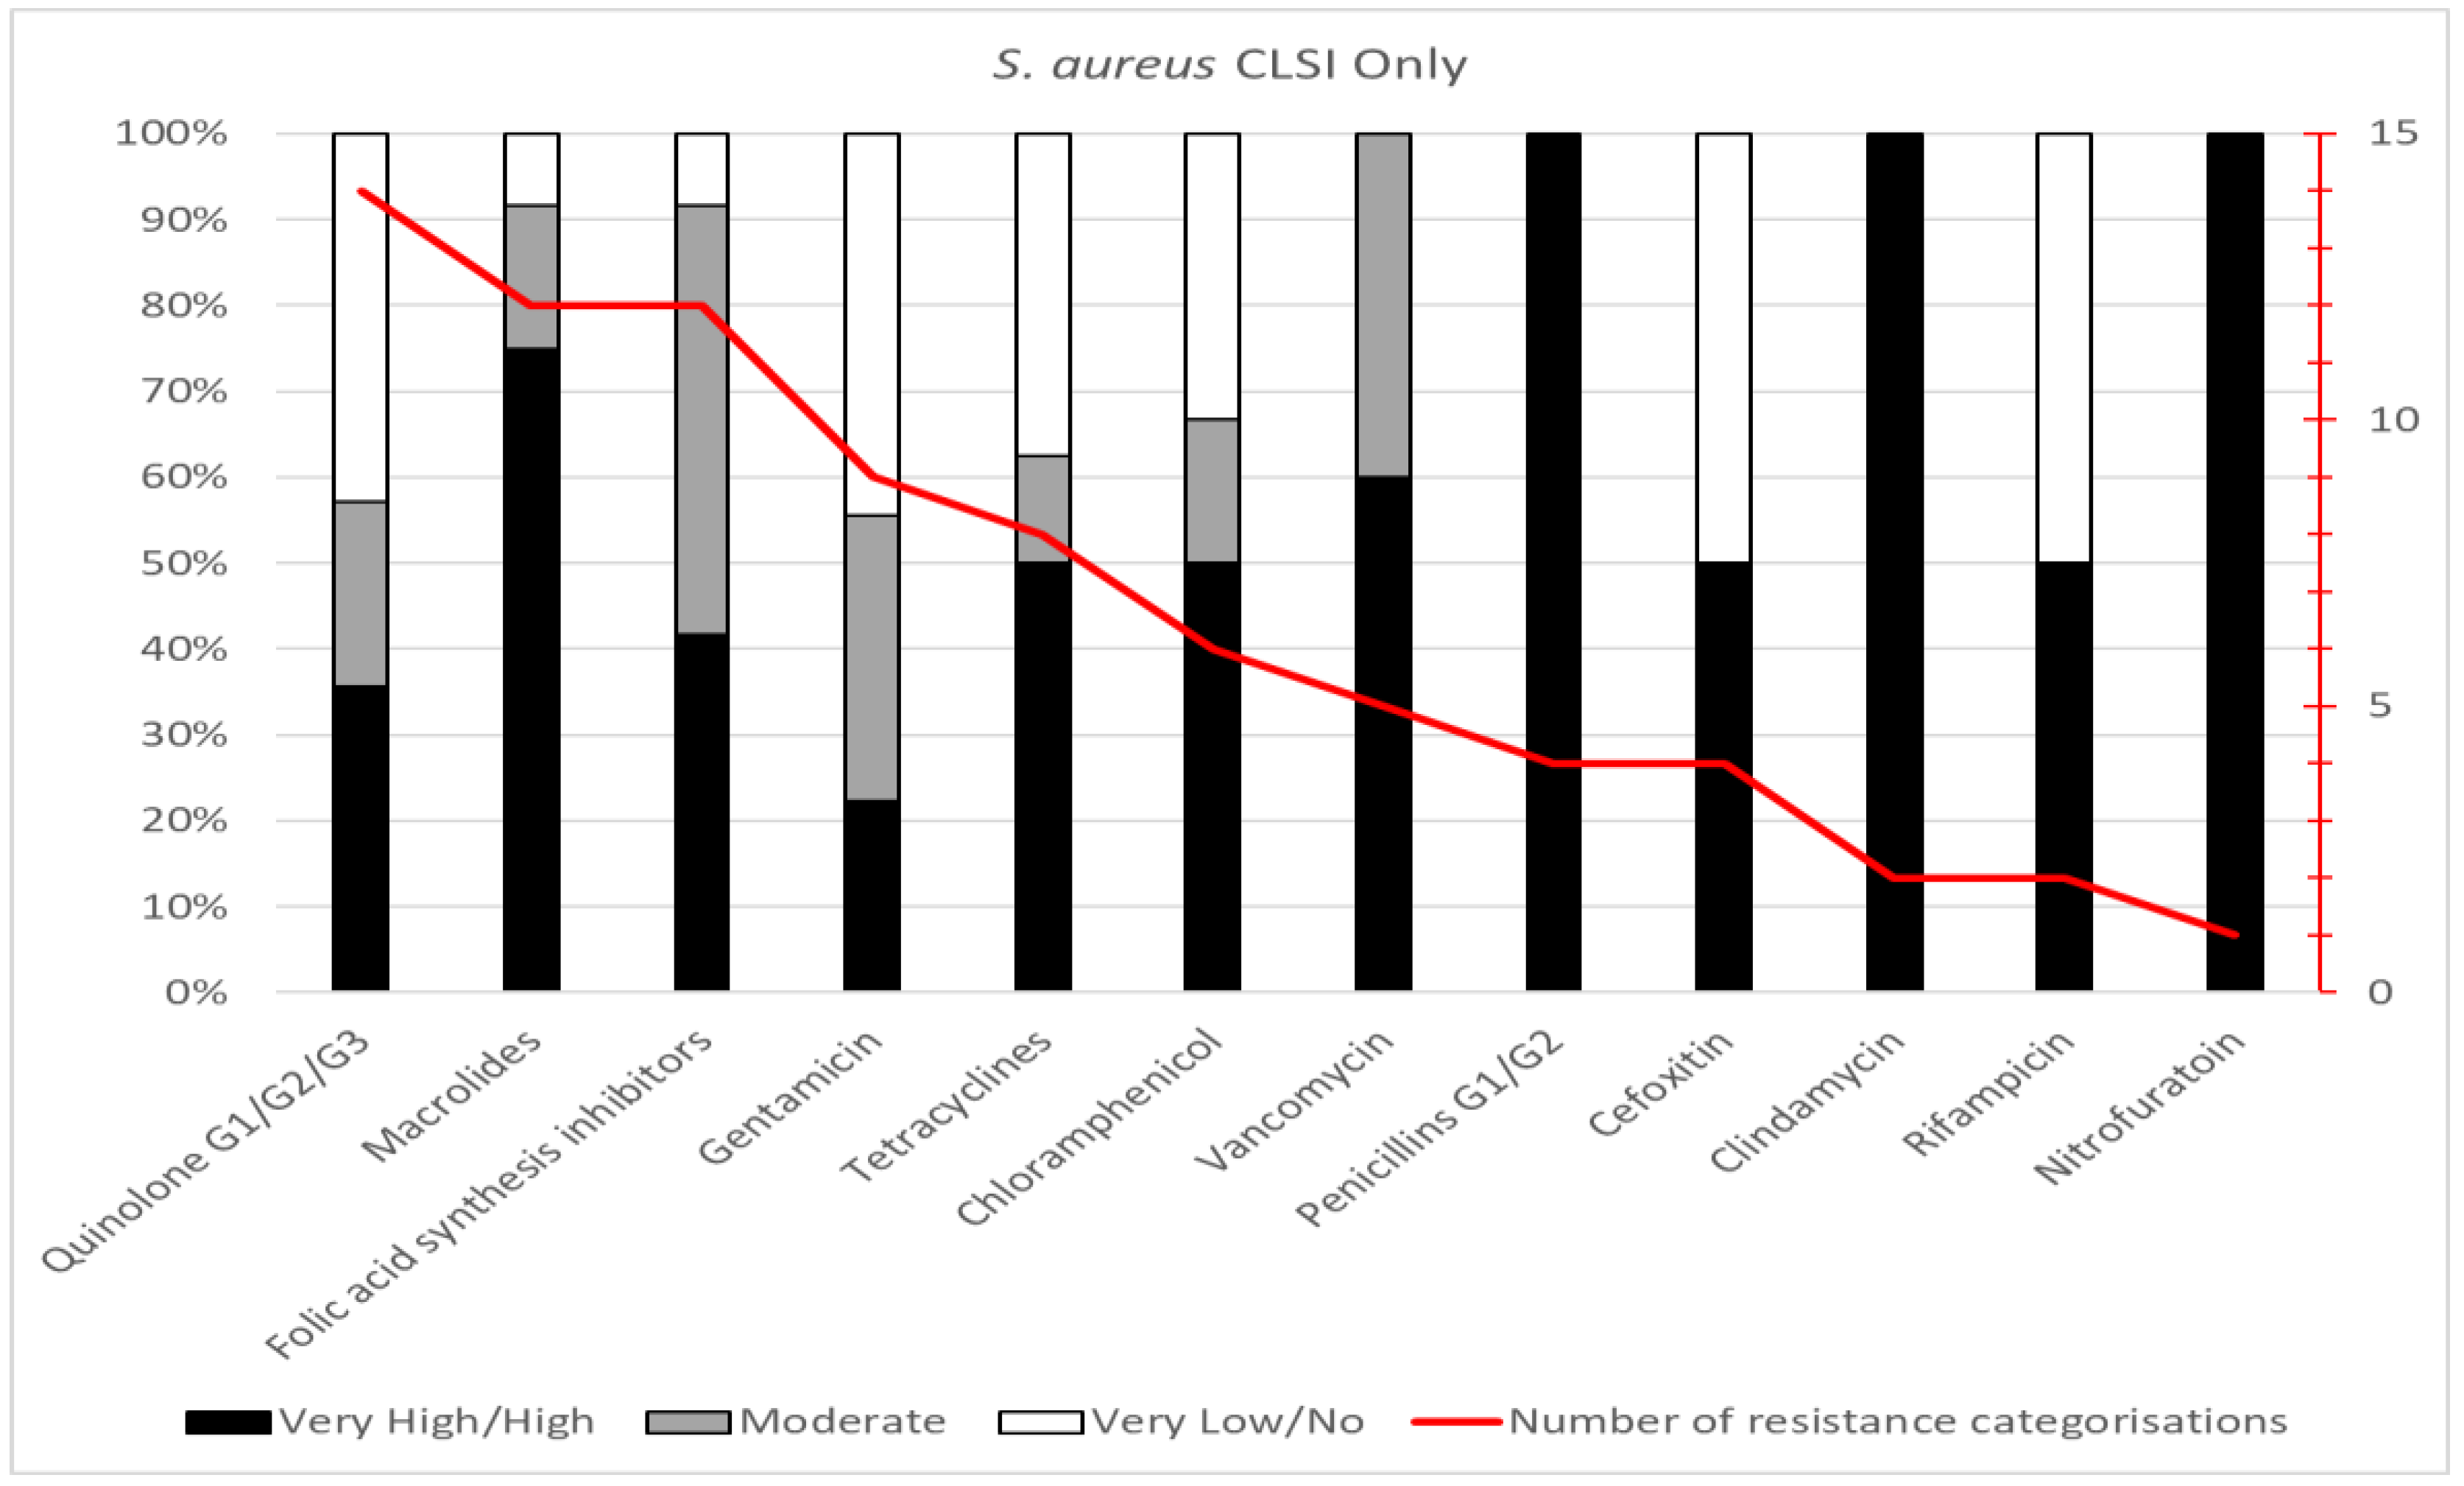
Staphylococcus aureus
Fourteen studies had tested susceptibilities for
Staphylococcus aureus, from the years 2010-2018, with a least one report from each geopolitical zone of the country. Data for 20 antibiotics belonging to 12 antimicrobial groups were analysed, to yield 79 resistance categorisations (
Figure 2 c). The most tested individual antibiotics (≥9 studies) were gentamicin and erythromycin; 5-8 studies employed trimethoprim-sulfamethoxazole, tetracycline, ciprofloxacin, chloramphenicol, and vancomycin; other antibiotics were used in less than five studies. In aggregate, resistance categorisations of “very high” or “high” comprised 52% (n=41), whereas “no” or “very low” categorisations were 25% (n=20). The most tested class was quinolones (n=14), with 36% categorised as “very high” or “high”. Macrolides and folic acid synthesis inhibitors were the next most tested (12 reports each) with 75% and 42% categorised as “very high” or “high”, respectively. All four reports for penicillins had a “very high” resistance categorisation. The studies on
Staphylococcus aureus isolates reported many to be MDR and 70-100% resistance to Macrolides, penicillin G1/G2, clindamycin and nitrofuratoin.
Figure 2.
c. Summary of antimicrobial resistances for Staphylococcus aureus. The data are presented by antimicrobial group, with resistance categorizations expressed as proportions (left side scale) and the number of categorisations for each group indicated by the red line (right-side scale).
Figure 2.
c. Summary of antimicrobial resistances for Staphylococcus aureus. The data are presented by antimicrobial group, with resistance categorizations expressed as proportions (left side scale) and the number of categorisations for each group indicated by the red line (right-side scale).
Campylobacter spp.
Five studies provided susceptibility data for Campylobacter spp., limited to the South West, South East and North Central geo-political zones of Nigeria. Although a wide diversity of antimicrobial was employed across these studies (n=20) clinical breakpoints were available for only erythromycin, tetracycline, and ciprofloxacin.
Data for 20 antibiotics belonging to 12 antimicrobial groups were available for analysis. All five studies reported susceptibility data for gentamicin and streptomycin and four studies had used erythromycin, chloramphenicol, trimethoprim-sulfamethoxazole, nalidixic acid and tetracycline. The remaining antimicrobials were used in one or two studies only. Due to the low numbers of studies and susceptibility data available, interpretation of proportions for resistance categorizations was not undertaken.
More studies reported very high/high (50% or above) resistance to aminoglycosides, cephalosporins(G1), penicillins (G2), phenicols, quinolones (G1) and sulphonamide derivatives. However, there was very low or no (50% or above) resistance to penicillins (G3 and G4), lincosamides, quinolone (G3 and G4) and nitrofurans.
Other Organisms
All other organisms that made minute contributions (with three or less reports) were pooled together as Gram positive and Gram negative organisms. This organisms include Gram negatives; Klesiella, Proteus, Yersinia, Shigella, Ochrobactrum and Gram positives;Listeria, Streptococcus, Bacillus, Enteroccus, Alkaligenes, Enterobacter, Nocardia and Micrococcus.
These Gram positive organisms tested 32 antibiotics belonging to 16 antimicrobial groups; the penicillins, quinolones and aminoglycosides, were the most tested in descending order. Of the 16 groups, phenicols, had 100% proportion of “very high to high” resistance, followed bytetracycline, 87.5%, penicillins (3rd and 4th generation) and (1st and 2nd), 81.8% and 81.3% each, then nitofurans, 66.7% and quinolones (2nd and 3rd generation) 53.3%. The proportion of “very low to no resistance” was very small or absent for most of the antibiotics groups.
Resistance Pattern of the Organisms Studied
The frequency of report of the various organisms in descending order were; Salmonella, E. coli, S. aureus, Campylobacter, Klebsiella, Bacillus, Listeria, Enterobacter, Proteus, Norcardia, Streptococcus, Alkaligenes, Shigella, Micrococcus, Enterococcus, Ochrobacturm, and Yersinia (
Figure 3;
Table 6). All AMR reports were from surveillance studies, none was clinical report. All of the organisms showed varying multi-drug resistance. Very high resistance was reported in various studies for Quinolones (n=34), Tetracycline (n=26) and Aminoglycosides (n=24) (
Table 4). Greater proportion of the isolates for each organism has MAR greater than 0.2; E. coli (83.3%), Salmonella (71.5%), Staphylococcus (85.7%), Klebsiella and Bacillus, (66.7%), Listeria (50%), while Campylobacter and all others (100%) (
Table 5 and
Table 6,
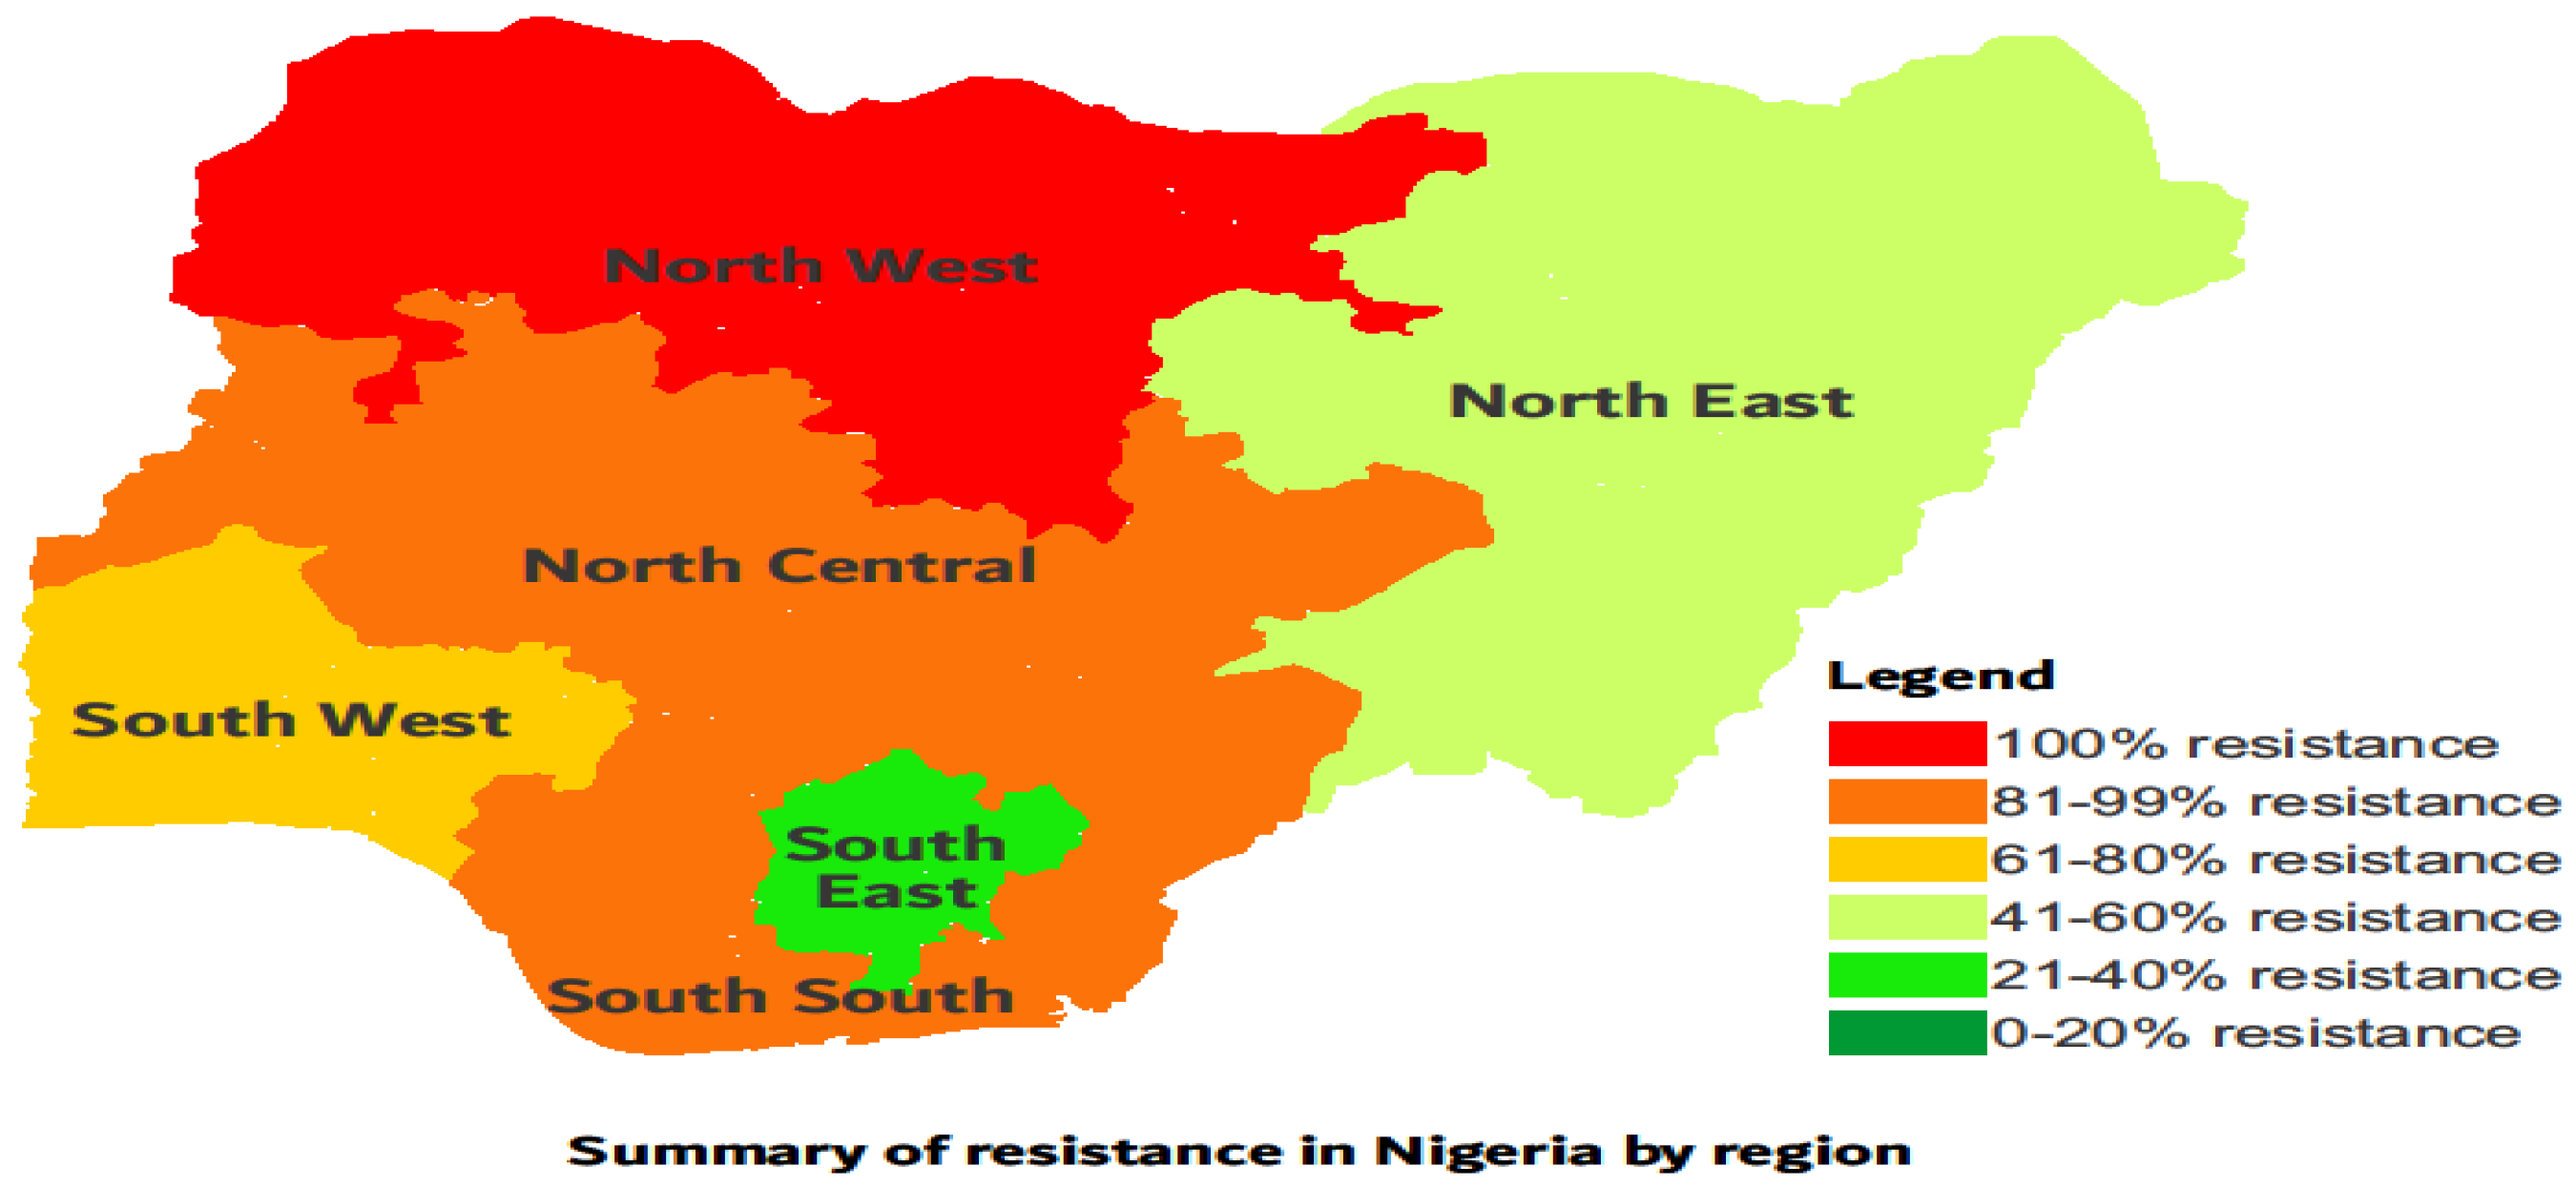
Figure 3). Overall, isolates were multi-drug resistant and more resistance was reported for South west, North central and North west regions in Nigeria (
Table 7 and
Figure 4).
Figure 3.
Reported Organisms and the percentage of their MAR Index that is greater than 0.2.
Figure 3.
Reported Organisms and the percentage of their MAR Index that is greater than 0.2.
Discussion
According to the OIE, [
19], the disc diffusion, broth dilution and agar dilution methods have been shown to consistently provide reproducible and repeatable results, when followed correctly. These three methods were the only once used for AMR surveillance in poultry in Nigeria, but the disc diffusion method was mostly used (80.2%). A number of standards and guidelines are currently available for AST for bacteria of human origin and can be adopted for testing bacteria of animal origin but each country must evaluate its own AST guidelines [
19]. The disc diffusion and CLSI standard was mostly used (94.5%) for AST in Nigeria (
Supplementary Figures 1 & 2), which aligns with the guideline of the Nigeria National Action Plan (NAP) for AMR, 2017-2022 that recommends the CLSI standard. It is noteworthy that the AST done for colistin in all papers reviewed is not the appropriate method, thus the colistin resistance may have been reported differently, therefore this data was not suitable for analysis at this time. In conducting microbial analysis, positive control bacteria strains are routinely used to assure the satisfactory performance of various elements in the test procedures [
30]. It was observed that only 27.5% of the studies included control strains, failure to include control strains in AST is not a standard practice. The importance of using approved standard methods for AST and use of proper interpretation criteria from CLSI cannot be over emphasised. The consideration of Epidemiological Cut-Off (ECOFF) is useful in the selection of the Minimal Effective concentration for the antimicrobial in question for effective treatment. Inadequate AST methods will result in inconsistencies and errors in the susceptibility results obtained. These errors may result in the initiation of inadequate antimicrobial therapy which has fatal outcomes in severely ill patients where these antibiotics are common first-line substances. Conversely, errors may deny the patients of treatment with an effective antibiotic and lead to the use of second-choice drugs, usually more recent and expensive, and thus contribute to economic losses and the selection of resistant strains.
It is imperative that studies on antibiogram in Nigeria should consider current susceptibility data being generated by national AMR surveillance projects and AMR surveillance at Veterinary Teaching Hospital sentinel centers nationwide. Furthermore penicillins and tetraxyclines have very resistant profiles across all species studied making them inappropriate for disease treatment in the poultry sector in Nigeria. This study revealed several patterns of multidrug resistance with greater proportion having MAR index above 0.2 as reported in the different studies reviewed and points out the high levels of resistance of the common pathogens in poultry to readily available antimicrobials commonly used and studied in these sectors within Nigeria and this agrees with the findings of Oloso
et al. [
26]. A survey of antibiotics commonly used in Poultry in Nigeria reported trimethoprim-sulfamethoxazole (71.7%), neomycin (66.7%), oxytetracycline (48.3%), chloramphenicol (45%), tetracycline (33.3%) and penicillin (30%) as the most used antibiotics [
31].
The broad purview of the reviewed studies indicates that despite the increase surveillance on AMR in the country (across all geopolitical zones), there seem to be low compliance with the standard practice for antimicrobial usage amongst poultry farmers. The overall results in this study, therefore, reflects great AMR risk to humans through the food chain, exposure of farm workers to resistant strains of bacteria and untreatable poultry diseases. Antibiotics used in food-producing animals and in particular the poultry sector are closely related to those used in humans and transmission through the food chain results in the spread of resistance. There would also be increase in microbial risk and associated economic loss to the poultry industry, as poultry organisms are resistant to commonly used antibiotics. The resistance pattern of similar organisms in poultry as reviewed by this study is mostly related. Salmonella had the highest reports followed by
E. coli,
Staphylococcus and
Campylobacter, these organisms were reported across all geopolitical zones of the country which may indicate that these organisms are implicated in diseases in the poultry sector of the nation or are easy to study in every parts of the country. The AMR reports showed that some antimicrobial groups had similar resistance proportion to almost all the organisms tested. Highest proportion of “very high to high” resistance across most of the organisms was noticed among the; penicillins (1
st, 2
nd, 3
rd and 4
th generations), tetracyclines, nitrofurans, cephalosporins (particularly the 1
st and 2
nd generations), sulphonamide derivatives, quinolones (mostly 1
st generation) and phenicols in no particular order. While the highest proportion of “very low” to “no” resistance across most of the organisms were observed among; the carbapenems, quinolones (2
nd and 3
rd generations) and aminoglycosides. This widespread resistance to all generations of penicillins can be explained by the findings of the report that stated that penicillins and its combinations were the most consumed over-the-counter (self-medicated) drugs by humans and in animals in Nigeria [
32,
33].
Observations of AMR within the classes of antibiotics reflected higher percentages of resistance in the antibiotics belonging to the macrolides, tetracyclines and β-lactams (mostly penicillins) raising further concerns of the threat posed by AMR. These drugs have been listed by WHO as medically important antimicrobials in food-producing animals as they can result to resistance in human and thus their overall reduction in use in food-producing animals has been recommended [
34]. Additionally, the presence low levels of resistance to carbapenems is of public health significance since these drugs are the last-line drugs in therapy of serious infections. The situation of AMR in Nigeria as reflected in this study and other reports from Nigeria is a reason to stimulate and encourage the Nigeria government and other appropriate bodies to embrace and actively practice the “One Health” approach to tackle the nations AMR situation through the establishment and monitoring of an institutionalized system already established to monitor, control, and promote good antimicrobial stewardship.
In addition, studies that tested Polymixin and colistin used the disc diffusion method for analysis, whereas there is no CLSI or EUCAST recommendation for the disc diffusion (DD) method usage for polymyxin and colistin susceptibility testing. Hence, we do not really have a reliable picture of polymyxin and colistin resistance in poultry derived bacteria in Nigeria in this review (Table 8). Also worthy to note, is the low AMR record for Campylobacter, an organism of public health importance but hard to grow.
In conclusion, this review revealed very high multi-drug resistance among bacterial of poultry origin, important zoonotic pathogens like Salmonella, E. coli and S. aureus among others showed high MARI >0.2 and also gaps were identified in AST carried out in Nigeria. Studies based on genotypes not addressed in this study were limited. We therefore recommend improvement in research methods to be of global standard and additional efforts to be made towards creating awareness of the general public to the dangers of AMR and also education of farmers on the benefits of animal production with minimal antibiotics usage; the use of preventive measures such as vaccinations, probiotics, hygienic production and biosecurity should be encouraged. As minimal or no usage of antibiotics will result in no antibiotics resistance. Future research should target existing regions where resistance is emerging to understand current trends in the epidemiology of AMR in poultry Nigeria.
Supplementary Materials
The following supporting information can be downloaded at the website of this paper posted on Preprints.org.
Acknowledgments
This work was supported by the Fleming Fellowship Programme. RMC was additionally supported by the UK FAO Reference Centre for Antimicrobial Resistance (which receives funding from the Department for Environment, Food & Rural Affairs and UK aid funding from the Department of Health and Social Care’s Fleming Fund).
Conflicts of Interests
The authors declare that there is no conflict of interests regarding the publication of this paper.
References
- Mouiche Mohamed Moctar Mouliom, Frédéric Moffo, Jane-Francis Tatah Kihla Akoachere, Muhammad Maryam, Muhammad Lawal, Ambali Abdul-Ganiyu, Mani Aliyu U, Azard Samuel, Lisa Barco (2009); Prevalence of Salmonella associated with chick mortality at hatching and their susceptibility to antimicrobial agents. Veterinary Microbiology, Volume 140, Issues 1-6, 6 January 2010, Pages 131-135.
- Centre for Disease Control (2018); About Antimicrobial Resistance (https://www.cdc.gov/drugresistance/about.html). www.cdc.gov. 10 September 2018.
- Tadesse, T.B.; Ashley, A.E.; Ongarello, S.; Havumaki, J.; Wijegoonewardena, M.; González, J.I.; Dittrich, S. Antimicrobial resistance in Africa: a systematic review. BMC Infect Dis. 2017, 17, 616. [Google Scholar] [CrossRef] [PubMed]
- Al-Mustapha, A.I.; Adetunji, V.O.; Heikinheimo, A. Risk Perceptions of Antibiotic Usage and Resistance:A Cross-Sectional Survey of Poultry Farmers in Kwara State, Nigeria. Antibiotics 2020, 29, 378. [Google Scholar] [CrossRef] [PubMed]
- Okon, E.M.; Okocha, R.C.; Adesina, B.T.; Ehigie, J.O.; Alabi, O.O.; Bolanle, A.M.; Matekwe, N.; Falana, B.M.; Tiamiyu, A.M.; Olatoye, I.O.; Adedeji, O. Antimicrobial resistance in fish and poultry: Public health implications for animal source food production in Nigeria, Egypt, and South Africa. Frontiers in Antibiotics 2022, 1, 1043302. [Google Scholar] [CrossRef]
- Malik, F.; Nawaz, M.; Anjum, A.A.; Firyal, S.; Shahid, M.A.; Irfan, S.; Ahmed, F.; Bhatti, A.A. Molecular characterization of antibiotic resistance in poultry gut origin Enterococci and horizontal gene transfer of antibiotic resistance to Staphylococcus aureus. Pakistan Veterinary Journal 2022, 42, 383–389. [Google Scholar] [CrossRef]
- Sagor, M.S.; Hossain, M.S.; Islam, T.; Mahmud, M.A.; Miah, M.S.; Karim, M.R.; Giasuddin, M.; Samad, M.A. Phenotypic and genotypic antibiotic resistance and virulence profiling of Enterococcus faecalis isolated from poultry at two major districts in Bangladesh. Pakistan Veterinary Journal 2022, 42, 153–160. [Google Scholar] [CrossRef]
- Al-Mustapha, A.I.; Raufu, I.A.; Ogundijo, O.A.; Odetokun, I.A.; Tiwari, A.; Brouwer, M.S.A.; Adetunji, V.O.; Heikinheimo, A. Antibiotic resistance genes, mobile elements, virulence genes, and phages in cultivated ESBL-producing Escherichia coli of poultry origin in Kwara State, North Central Nigeria. International Journal of Food Microbiology 2023, 389, 110086. [Google Scholar] [CrossRef] [PubMed]
- Ndahi, M.D., Hendriksen, R., Helwigh, B. et al. Determination of antimicrobial use in commercial poultry farms in Plateau and Oyo States, Nigeria. Antimicrob Resist Infect Control 2023, 12, 30. [Google Scholar] [CrossRef]
- Tang, L.K.; Caffrey, P.N.; Nóbrega, B.D.; Cork, C.S.; Ronksley, E.P.; Barkema, W.H.; Polachek, J.A.; Ganshorn, H.; Sharma, N.; Kellner, D.J.; et al. Restricting the use of antibiotics in food-producing animals and its associations with antibiotic resistance in food-producing animals and human beings: a systematic review and meta-analysis. Lancet Planet Health 2017, 1, 316–327. [Google Scholar] [CrossRef] [PubMed]
- Bougnom, P.B.; Piddock, J.L. Wastewater for urban agriculture. A significant factor in dissemination of antibiotic resistance. Environ Sci Technol. 2017, 51, 5863–5864. [Google Scholar] [CrossRef] [PubMed]
- Review on Antimicrobial Resistance. Tackling drug-resistant infections globally: Final report and recommendations. 2016. Available online: https://amr-review.org/sites/default/files/160525_Final%20paper _with%20cover.pdf.
- World Organisation for Animal Health (OIE). The OIE Strategy on Antimicrobial Resistance and the Prudent Use of Antimicrobials 2016. Trop. Med. Infect. Dis. 2019, 4, 22 21 of 21.
- World Health Organization (WHO). Global Action Plan on Antimicrobial Resistance; WHO: Geneva, Switzerland, 2015; Available online: http://www.wpro.who.int/entity/drug_resistance/resources/global_action_plan_ eng.pdf.
- Food and Agriculture Organization of the United Nations. Monitoring and Evaluation of the Global Action Plan on Antimicrobial Resistance. Produced Jointly by FAO, OIE and WHO. 2016.
- Popoola Olanrewaju Olamide, Damilola Samson Adepitan, Adebowale Sylvester Adeyemi, Opeyemi Fortunate Oladeru, Sodiq Inaolaji Yusuff. A national survey of the antibiotic use, self-medication practices, and knowledge of antibiotic resistance among graduates of tertiary institutions in Nigeria. Scientific African 2024, 23, e01978. [Google Scholar] [CrossRef]
- Hosain, M.Z.; Kabir, S.M.L.; Kamal, M.M. Antimicrobial uses for livestock production in developing countries. Vet World 2021, 14, 210–221. [Google Scholar] [CrossRef] [PubMed] [PubMed Central]
- Friedman, N.D.; Temkin, E.; Carmeli, Y. The negative impact of antibiotic resistance. Clinical-Microbiology-Infections- 2016, 22, 416–422. [Google Scholar] [CrossRef] [PubMed]
- OIE Terrestial Manual (2012); Laboratory methodologies for bacterial antimicrobial susceptibility testing.
- Clinical and Laboratory Standards Institute (CLSI) (2008); Document M31-A3. Performance Standards for Antimicrobial Disk and Dilution Susceptibility Tests for Bacteria Isolated from Animals, Approved Standard, Third Edition. CLSI, 940 West Valley Road, Suite 1400, Wayne, Pennsylvania 19087-1898, USA.
- Bodunde, R.S.; Ogidi, C.O.; Akinyele, B.J. Load and Antibiotic Susceptibility Pattern of Microorganisms in muscle foods sold on Akure, Southwest Nigeria. Hazards Control 2019, 6, 30–36. [Google Scholar] [CrossRef]
- Onur, K. Quality assurance in antimicrobial susceptibility testing. Latest Reseach into uality Control, Isin Akyar, IntechOpen. 2012. Available online: https://www.intechopen.com/books/latest-research-into-quality-control/quality-assurance-in-antimicrobial-susceptibility-testing. [CrossRef]
- RVO Netherlands Enterprise Agency. Poultry Sector Study in Nigeria. 2020. Available online: https://www.rvo.nl/sites/default/files/2020/10/Poultry-Sector-Study-Nigeria.
- ASL 2050. Livestock production systems spotlight Nigeria; FAO: Rome, Italy, 2018. [Google Scholar]
- National Action Plan for Antimcrobial Resistance 2017-2022; Federal Ministries of Agriculture, Environment and Health.
- Oloso Nurudeen Olalekan, Shamsudeen Fagbo, Musa Garbati, Steve O. Olonitola, Emmanuel Jolaoluwa Awosanya, Mabel Kamweli Aworh, Helen Adamu, Ismail Ayoade Odetokun and Folorunso Oludayo Fasina. Antimicrobial Resistance in Food Animals and the Environment in Nigeria: A Review. International Journal of Environmental Research. Public Health 2018, 15, 1284. [Google Scholar] [CrossRef]
- OIE LIST OF ANTIMICROBIAL AGENTS OF VETERINARY IMPORTANCE, OIE_List_antimicrobials_May2015.pdf. Available online: https://www.oie.int/app/uploads/2021/03/eng-oie-list-antimicrobials-may2015.
- Ezadi, F.; Ardebili, A.; Mirnejad, R. Antimicrobial Susceptibility Testing for Polymyxins: Challenges, Issues, and Recommendations. Journal of clinical microbiology 2019, 57, e01390-18. [Google Scholar] [CrossRef] [PubMed]
- Ayandele, A.A.; Oladipo, E.K.; Oyebisi, O.; Kaka, M.O. Prevalence of Multi-Antibiotic Resistant Escherichia coli and Klebsiella species obtained from a Tertiary Medical Institution in Oyo State, Nigeria. Qatar Medical Journal 2020, 2202, 9. [Google Scholar] [CrossRef] [PubMed]
- Burton, W.B.; Amalia, M.; Martine, G.; Raymond, A.; Franco, P.; Kevin, T. Development of Unique Bacterial Strains for Use as Positive Controls in the Food Microbiology Testing Laboratory. Journal of Food Protection 2008, 71, 2301–2306. [Google Scholar]
- Awogbemi, J.; Adeyeye, M.; Akinkunmi, E.O. A Survey of Antimicrobial Agents Usage in Poultry Farms and Antibiotic Resistance in Escherichia coli and Staphylococci Isolates from the Poultry in Ile-Ife, Nigeria. Journal of Infectious Disease and Epidemiology 2018, 4, 047. [Google Scholar]
- Israel, E.U.; Emmanuel, E.G.; Sylvester, E.G.; Chukwuma, E. Self-medication with antibiotics amongst Civil Servants in Uyo, Southern Nigeria. Journal of Advanced. Medical. Pharmacological Sciences. 2015, 2, 89-7. [Google Scholar] [CrossRef] [PubMed]
- Federal Ministries of Agriculture and Rural Development, Environment, and Health; Antimicrobial Use and Resistance in Nigeria: Situation Analysis and Recommendations. 2017. Available online: http://www.ncdc.gov.ng/themes/common/docs/protocols/56_1510840387.pdf.
- World Health Organization (2017) WHO guidelines on use of medically important antimicrobials in food-producing animals. Licence: CC BY-NC-SA 3.0 IGO, Geneva: World Health Organization.
|
Disclaimer/Publisher’s Note: The statements, opinions and data contained in all publications are solely those of the individual author(s) and contributor(s) and not of MDPI and/or the editor(s). MDPI and/or the editor(s) disclaim responsibility for any injury to people or property resulting from any ideas, methods, instructions or products referred to in the content. |
© 2024 by the authors. Licensee MDPI, Basel, Switzerland. This article is an open access article distributed under the terms and conditions of the Creative Commons Attribution (CC BY) license (http://creativecommons.org/licenses/by/4.0/).