
Submitted:
19 December 2024
Posted:
20 December 2024
You are already at the latest version
Abstract
Studying natural hazards in the context of human-induced landscape transformation is complex, especially in regions with limited information. Elderly narratives can play a role in filling these knowledge gaps at the multi-decadal timescale. Here, we build upon a citizen-based elderly approach to understand natural hazard patterns and landscape transformation in a tropical mountainous environment, the Kigezi highlands (Uganda). We engaged 98 elderly citizens (70 years old and above) living in eight small watersheds with contrasting characteristics. Through interviews and focus group discussions, we reconstructed historical timelines and used participatory mapping to facilitate the interview process. We cross-checked the information of the elderly citizens with historical photographs, archives and field visits. Our results show that major land use/cover changes are associated with a high population increase over the last 80 years. We also evidence an increase in reported natural hazard events such as landslides and flash floods from the 1940’s until the 1980’s. Then, we notice a stabilization in the number of hazard events per decade, although the two most impacted decades (1980’s and 2000’s) stand out. Despite this new information, an increase of natural hazard frequency due to land use/cover change cannot yet be quantitatively validated, especially when the probable modulator effect of climate variability is considered. Nevertheless, the increase in exposure of vulnerable population to natural hazards is clear, and population growth together with poor landscape management practices are key culprits to explain this evolution. This study demonstrates the added value of historical narratives to understand natural hazards in the context of environmental changes.
Keywords:
geo-hydrological hazards
; land use and land cover change
; citizen science
; historical narratives
; participatory mapping
; disaster risk
; population growth
; climate variability
; Uganda
1. Introduction
The use of historical (multi-decadal) record of natural hazard events, including their types, mechanisms, causal factors, and incidence is important for constraining the driving factors behind the evolution of risk in a region and devising appropriate disaster risk reduction measures [1,2,3,4,5]. For example, the scars of hazards, such as flash floods and landslides, are not permanent in a landscape, disappearing sometimes over short, month-to-year periods of time [6,7]. In other words, a landscape that currently does not show any recent evidence of a hazard does not mean that it cannot pose dangerous problems.
Although climate change is deemed to play a role on natural hazard occurrences [8], human-induced landscape transformations has been linked to an increase in the incidence of natural hazards [9,10,11]. For example, deforestation, urbanization and road construction change the spatio-temporal distribution patterns of the occurrence of landslide and flood events [5,12,13,14,15]. These human disturbances of the landscape are particularly pronounced in the tropics, frequently associated with population growth, land needs and agricultural expansion e.g. [12,16,17]. In addition, an increase in settlements frequently pushes populations into hazard-prone areas, thereby increasing their exposure to natural hazards [18,19,20]. This exposure is expected to rise especially in the tropics due to the projected population increases and weak management policies [14,21].
Understanding multi-decadal natural hazard patterns and landscape transformation is challenging, especially in data-scarce environments [22,23]. In such regions, data collection is impeded by inadequate resources, insufficient monitoring systems and lack of technical expertise for effective collection and analysis, often combined with difficult-to-access terrains [24,25]. Such hindrances preclude proper trend analysis of natural hazards and understanding of their driving environmental processes [23,26]. Addressing the challenge of data collection requires multi-facetted approaches, involving participatory processes and remote sensing products to gain information on the historical patterns of natural hazard occurrences and the evolution of the landscape e.g. [27,28,29,30].
Most studies of multi-decadal natural hazard occurrences and landscape transformation have been based on analysis of historical aerial photographs e.g. [31,32]. Historical aerial photographs are valuable sources of information as they provide some of the earliest records of land use/cover at a high spatial resolution of around 1 meter [33]. For example, [34] analysed historical maps to understand the impact of past natural hazards on various features, whereas [33] analyzed historical archived photographs to understand past landforms. However, due to the limited number of photograph acquisition periods in many regions, the historical aerial photographs often miss subtle details about the dynamics of the landscape [1]. Additionally, for the inventory of natural hazards, only relatively large-scale features such as large landslides can be identified in a reliable manner with these photographs [35].
Historical narratives about evolution of the local environment reported by elderly citizens provide an opportunity to mitigate these historical data gaps in environments with limited information [36,37]. Because of their long interactions with the environment, the elderly citizens have rich knowledge of past hazards, and their understanding of the historical landscape transformation is recognized as highly valuable [38]. [39] argues that narratives constructed from reliable participants such as the elderly citizens are based on non-fictional events and thus provide credible insights in research. For instance, [27] applied the elderly citizen approach to reconstruct gully evolution in northern Ethiopia over several decades. Despite their importance in contributing to knowledge, the added value of the elderly citizens in understanding landscapes and past natural hazards has hitherto been overlooked [29].
Engaging elderly citizens through participatory approaches, such as participatory mapping, facilitates the structured narration of historical events, ensuring that their knowledge is shared in a coherent and systematic manner [40,41]. Participatory mapping is a collaborative process where community members actively engage in creating maps that reflect their local knowledge, experiences, and perceptions of their environment [28,41]. Researchers have used this approach to facilitate the understanding of environmental changes through the integration of local knowledge with scientific methods [42,43]. These methods allow for the visualization and spatial contextualization of historical events, enhancing the accuracy and depth of the narratives. Moreover, timelines have been shown to effectively aid in the reconstruction of historical events, particularly in overcoming the challenges associated with memory decay when recalling past occurrences [44]. Timelines, defined as visual representations of chronological events have been successfully applied to reconstruct historical information across various domains. For instance, [45] applied timelines to examine historical environ-mental changes in the river systems of South Africa, while [46] used them to analyze the processes that shape indigenous knowledge in understanding flood risk in the Rwenzori region in Uganda. Moreover, [44] demonstrated that the temporal recall of past events heavily relies on reconstructive and inferential processes, where individuals draw upon their general knowledge of notable periods in their lives to place events in time.
The aim of our research is to document historical natural hazard patterns in relation to the historical landscape transformations in a data-scarce environment of Africa through the narratives of elderly citizens. More specifically, we focus on the Kigezi highlands (southwestern Uganda), a mountainous region where problems associated with the occurrence of natural hazards are a growing concern [22,47,48]. This research also aims to assess the relevance of elderly citizens’ knowledge and experiences in enriching the understanding of natural hazards and landscape characteristics. First, we focus on the implementation of the elderly citizen approach that is at the heart of this research. Then, we compile data on natural hazards and land transformation from elderly’s narratives, complemented by secondary data sources and interpretation of aerial photographs. We then analyze these patterns and discuss results with respect to disaster risk reduction, land management and population dynamics.
2. Materials and Methods
2.1. Study Area
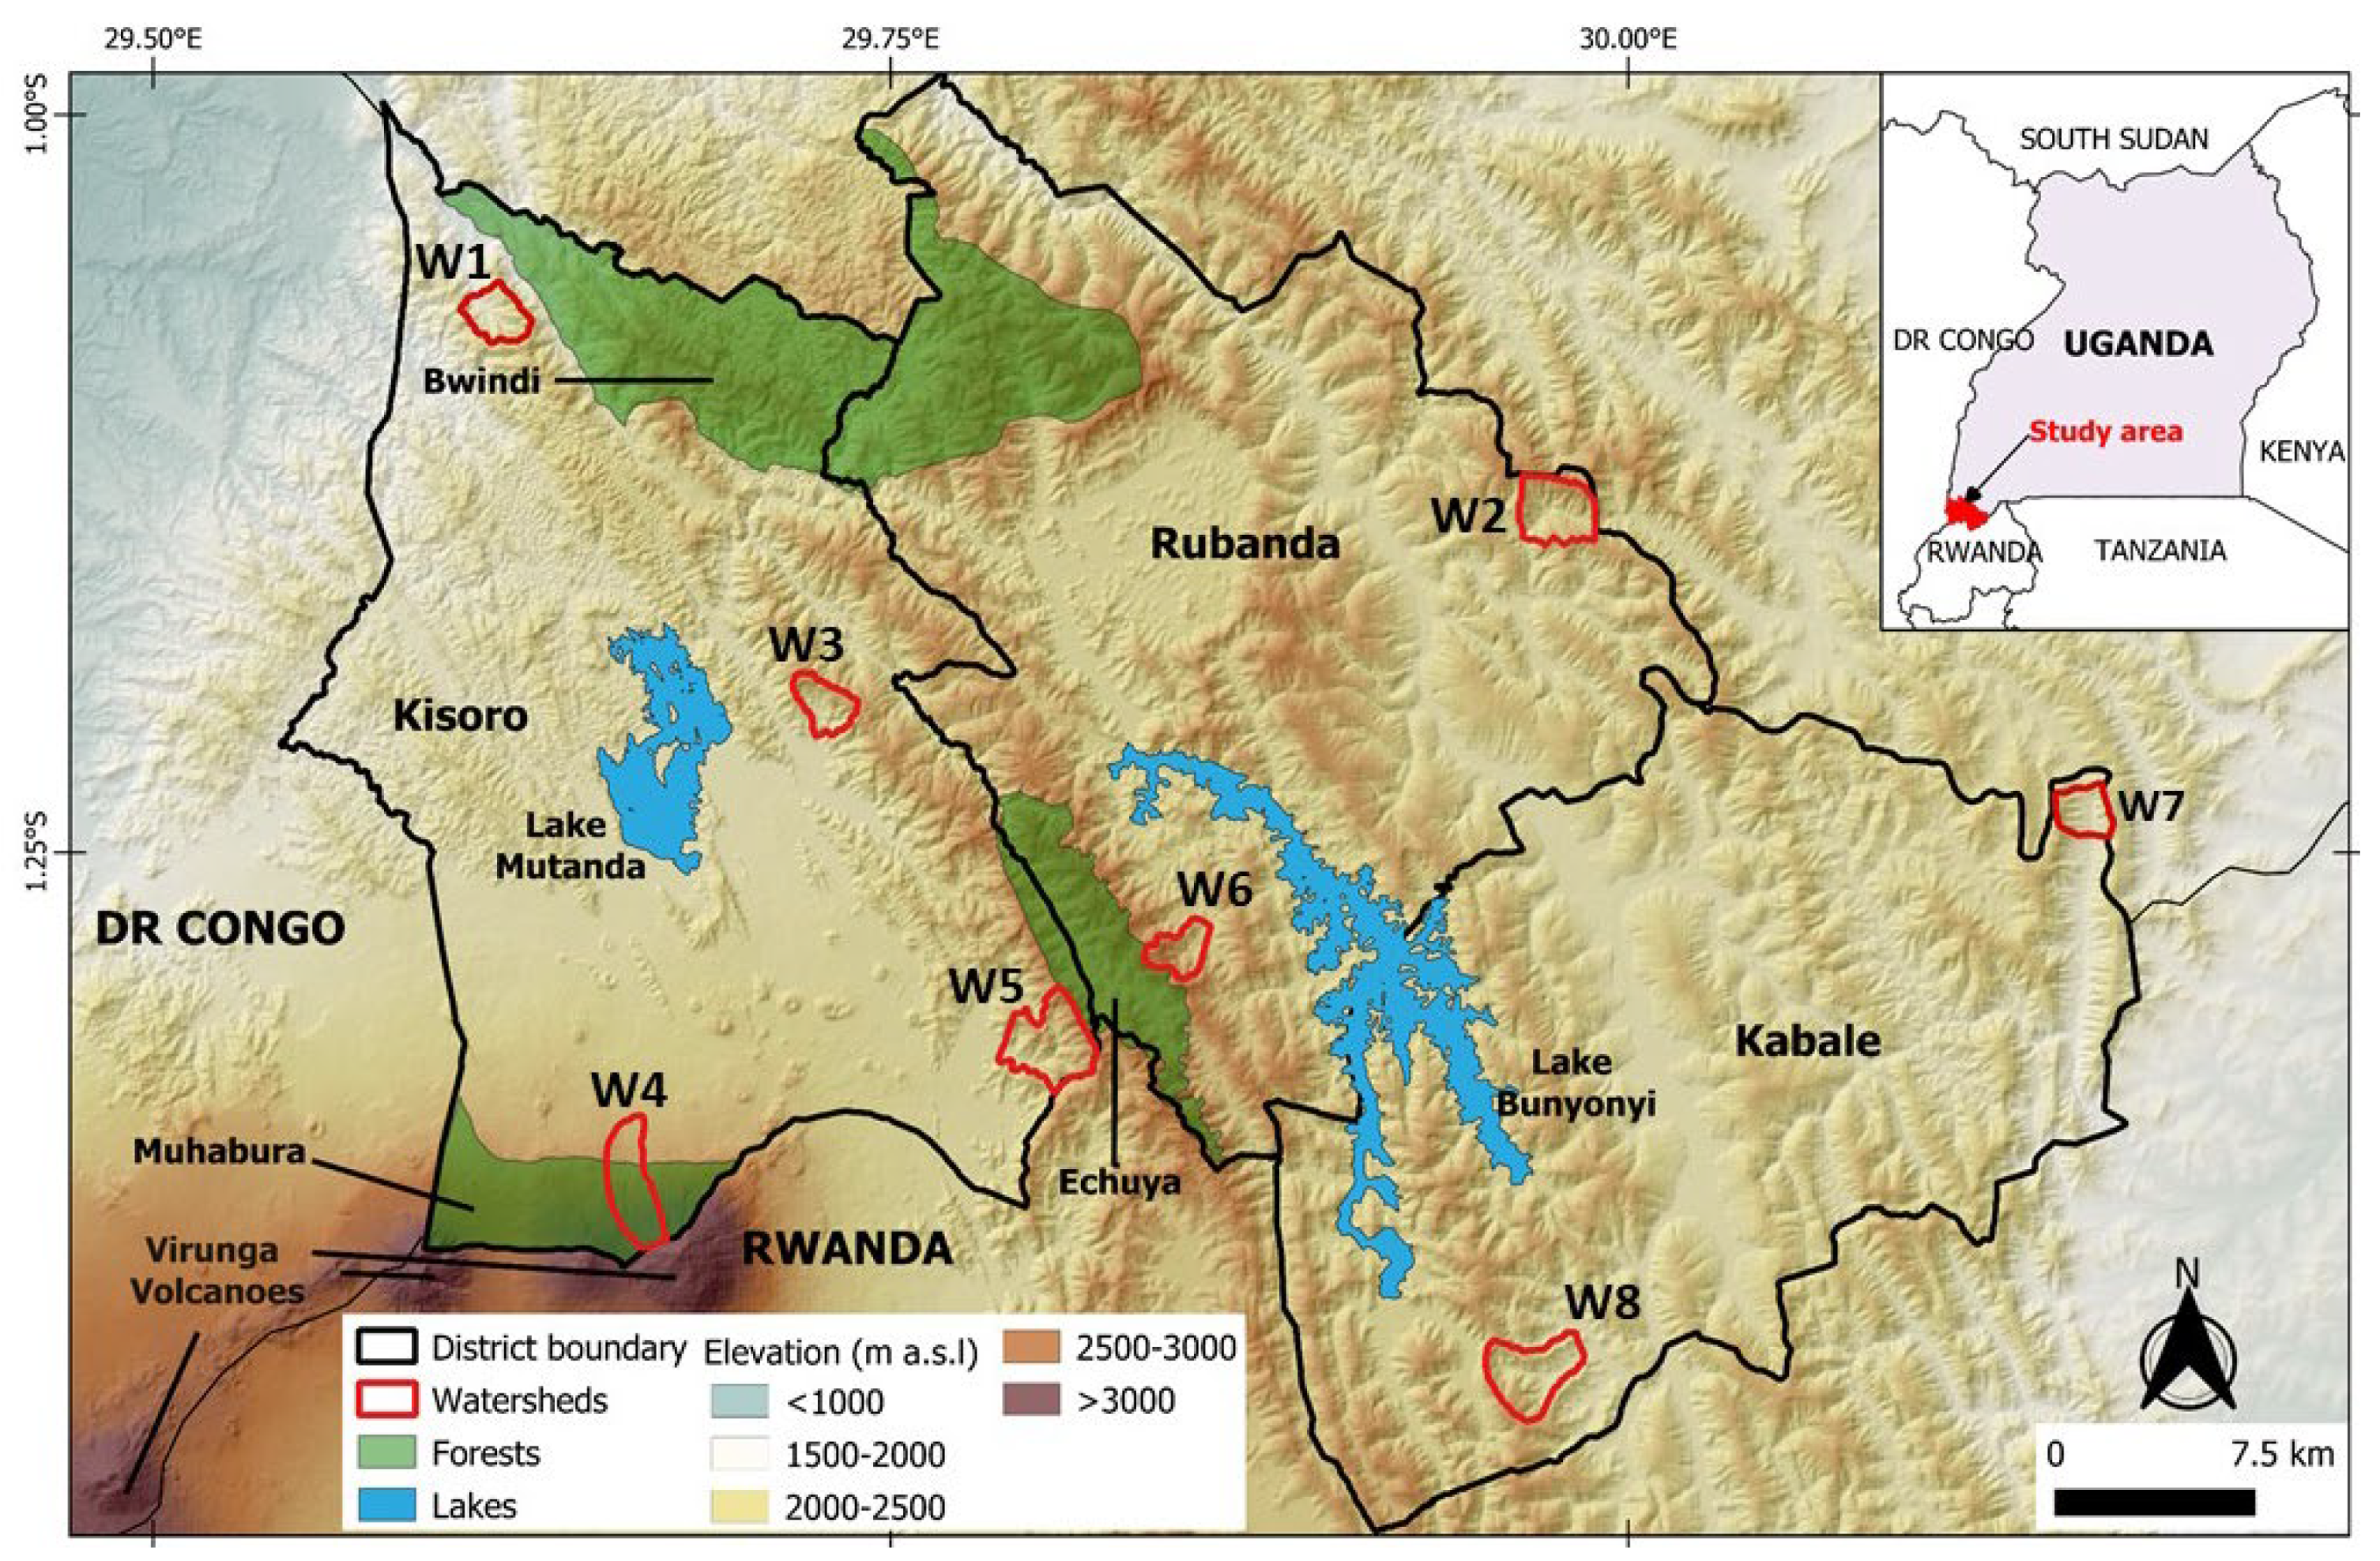
The Kigezi highlands are part of the southwestern highlands of Uganda bordering Rwanda to the south and the Democratic Republic of Congo to the west. More specifically, the study was conducted in eight relatively small watersheds (see Section 3) distributed throughout the three districts of Kabale, Rubanda and Kisoro (Figure 1). Kigezi highlands experiences rainfall during two wet seasons: March to May and September to November. The region received an average annual rainfall of 2500 mm between 2014 and 2020, as measured by the Kabale weather station [49]. The region is one of the most densely populated regions in Uganda with an average of 370 to 600 inhabitants per km2 [50]. The population consists mainly of smallholder farmers, dependent on subsistence agriculture and livestock production. The vegetation cover which was largely comprised of montane forests many years ago [51] has been greatly modified due to human activities arising from increasing population [52,53,54]. According to [48], subsistence agricultural land has been increasing, at the expense of forest and woodland. For many decades, the Kigezi highlands have had an ‘overpopulated’ status, frequently cited as a primary cause of environmental degradation in the region [52]. Recent research in the region shows an increase in reported impactful landslide and flood hazard occurrences [47,55] that have caused loss of lives, displacement of people, and severe damage to property [56]. Anthropogenic processes most likely play preparatory roles in the occurrence of landslides and floods [12,47,57].
Figure 1.
Location of the Kigezi Highlands comprising the Kabale, Rubanda and Kisoro districts and the eight studied watersheds (W1 to W8). Forest cover data are from Google Earth imagery 2021. Map background is a shaded relief with elevation in colour extracted from 1 arc sec SRTM DEM (USGS, 2021).
The study area consists of eight small watersheds (Figure 1) of rather similar size (3-8 m²) but possess contrasting natural and human-related characteristics (Figure 2) such as land use/cover (e.g. proportion of forest vs agricultural land), lithology, topography, land management practices, and population density (see Section 3 Results).
2.2. Data Collection
2.2.1. Selection of the Study Participants
In this study, we engaged elderly citizens to gather their insightful narratives about past natural hazard events and landscape changes. To be eligible, the elderly participants were required to be 70 years old and above to make sure to get records over a period that goes back to, at least, the acquisition period of historical aerial photographs (see Section 3.3). Extra eligibility criteria included being a native of the watershed and possessing the ability to provide clear and detailed historical accounts of landscape events. We worked with community leaders who knew the community members well and were therefore our mobilisers and field guides. These included local chiefs, community-based officers, and geo-observers; the latter being a network of citizens trained at reporting natural hazard events and the associated impacts occurring in their communities [47]. To identify suitable elderly citizens, we integrated a snowball approach — a sampling technique suited for hard-to-reach or hidden populations [58]. The snowball sampling process begins with identifying a few participants who are part of the target population. These participants are then asked to refer other individuals they know who meet the study's criteria [58]. This approach was advantageous in finding the targeted population given the difficulty in finding eloquent elderly citizens who could recall and ably narrate the historical aspects of their environment.
2.2.2. Historical Narratives with the Elderly Citizens
We conducted interviews and focus group discussions (FGDs) with a total of 98 elderly citizens of which 37% were women. Guiding questions (see Appendix A1) were prepared and administered during the interviews and FGDs. We interviewed 24 elderly citizens in their homes while 74 participants were engaged through FGDs. The house-to-house interviews allowed to reach elderly citizens (mostly > 80 years old) that were unable to move to the designated centers for FGDs. In addition to enabling triangulation [59], FGDs allowed for validation of information provided in individual interviews, thereby enhancing the reliability of the findings. As compared to individual interviews, FGDs offer the advantage that respondents complemented one another to remember and clearly describe past events. Further validation of the elderly narratives was carried out during field visits, where we observed features related to past hazard events. For example, boulders associated with flash flood or landslide events were examined in the field, and their age and time of appearance were confirmed with residents. All the interviews and FGDs were carried out in November 2021.
2.2.3 Reconstructing of Key Events with a Timeline
We constructed historical timelines and incorporated them in the interviews and FGDs to establish the actual year when natural hazards and key landscape changes took place, as narrated by elderly citizens (Appendix A2). Using key political and social events as references in the timeline (e.g., presidential regimes: Elizabeth II (British colonial rule), Edward Mutesa II (first Ugandan president), Obote I, Obote II, Idi Amin, and Museveni), we asked the elderly what the landscape looked like in different past periods i.e., the type of vegetation/tree cover, housing characteristics, roads, type of crops grown, land management practices and associated policies that existed as well as any natural hazards that occurred. The narratives provided by the elderly highlighted key changes occurring between the colonial (pre-1962) and post-colonial (post-1962) eras. Therefore, the timing of key events was analyzed in relation to these two distinct periods to better contextualize the transformations. The interview and FGD sessions were recorded and transcribed with the consent of participants, and key thematic areas extracted for further exploration and analysis.
2.2.4. Participatory Mapping and Spatial Reference of Events
For the eight FGDs, we applied the participatory mapping technique, where the elderly drew on manilla papers the past (i.e., from the 1940’s) and current (2021) land use/cover of their land (Figure 3). The mapping was guided by providing the exact delineation of the watershed boundaries as background information. The elderly citizens indicated (1) the location and numbers of buildings and roads, and (2) the extent of croplands, tree cover, wetlands, and water bodies. Colored markers were used to distinguish between the past and present land use/cover (Figure 3).
3. Results
From the elderly citizens’ narratives, we have generated a record of natural hazards that occurred since 1940s. We have recorded 73 natural hazard occurrences (landslides and flash (floods) for the period between 1940-2021. We have also analyzed landscape change dynamics for the same period using historical narratives from the elderly citizens, aerial photographs of 1954 and available historical literature about Kigezi region.
3.1. Watershed Characteristics
The eight watersheds exhibit diverse characteristics that highlight the distinct variations of their environmental profiles (Table 1). The variations include differences in size, reflecting the spatial extent of each watershed; land use/cover, which provide insights into the dominant vegetation, agricultural activities, and urban development within the watersheds; and topography. Additionally, the watersheds differ in terms of lithology, the level of human disturbance as well as the type of frequent natural hazards experienced in each watershed.
3.2. Characterization of Watersheds During the Colonial Era (1940-1962)
From the narrations of the elderly citizens, we obtained historical information from as early as 1940. In a few cases, the elderly narrated events that they were told by their parents, thus delving in the 1930s. However, such narrations from before the 1940’s were considered as less reliable and were therefore not considered in our analysis. The information obtained since the 1940’s comprises themes on land use/cover, management practices, land management laws and policies enforced, population and housing characteristics, road development, degradation activities such as deforestation and wetland drainage, restoration programs, and natural hazard occurrences. Examples of quotes from the elderly narratives are provided in Appendix A3.
3.2.1. Land Use/Cover
When referring to their childhood (1940-1950’s), the elderly citizens described the landscape as hills covered with different natural tree species such as Ficus, shrubs, and short grass especially Hyperemia ruffa (emburara in Runyankole-Rukiga dialect), which were inhabited by wild animals such as wild pigs, foxes, and leopards. In watersheds adjacent to national parks, elephants and buffaloes were also regularly present. Our analysis of the 1954 aerial photographs and participatory mapping with the elderly citizens show that settlements were in the mid-lower slopes of the hills since most valleys were covered with large papyrus swamps and the hill tops were forested. In some watersheds such as W5, W6, W7, the upper slopes and hilltops were used for cultivation and grazing, and many livestock were kept since grazing land was widely available.
3.2.2. Land Use and Management Practices
Reports from the elderly show that during the colonial period, land was freely acquired and the boundaries for land ownership were dependent on the family labor force and strength, i.e., as far as one could cultivate determined the boundary of their land. The elderly citizens reported that the main crops grown in the area included sorghum, maize, beans, millet, peas, sweet potatoes, and indigenous potatoes. These crops were notably resilient and could therefore be cultivated throughout the year. The elderly citizens also shared that farming was minimal due to the abundance of land, with cultivation primarily focused on subsistence food production. At that time, money was not a concept familiar to the community, and there were no markets for buying or selling food involving money. The elderly vividly recalled that barter trade was the sole method of exchange, where people traded food for other goods or services.
Despite the low-intensity farming practices, the elderly indicated that food was abundant for the relatively small population, and there were established regulations regarding food storage. Regarding land management, the elderly recounted that the colonial administrators enforced strict fallowing practices, known locally as Hinga raza, along with the use of contours or strip cropping stabilized by elephant grass (locally known as katikankingo in Runyankole-Rukiga dialect). Fallowing required farmers to divide their land into three plots, with one plot always left under fallow in rotation each season. The elderly citizens also emphasized that colonial administrators, through local chiefs, enforced laws to protect the vegetation cover. For instance, bush burning and tree cutting were strictly prohibited and punishable by law. It was also mandatory for every household to plant 18 black wattle trees on hilltops. Other tree species such as eucalyptus and pine were not allowed on the land. According to the elderly respondents, the black wattle tree species helped to prevent soil erosion, landslides, and flash floods. The elderly citizens believe that these regulations played a crucial role in protecting the land from soil erosion, preventing natural hazards, and enhancing soil fertility.
3.2.3. Hydrology
According to the elderly citizens, the lowland in some watersheds such as W3, W7 and W8 were covered by wetlands, and no permanent river existed. In W3 and W8, the wetlands in the valley were drained through a channel to create the river during road construction in 1971 (post-colonial period). The river in W7 was formed in 1959 but the elderly residents have different beliefs on how it happened. Some believe that an aquifer was compromised during borehole construction which produced the river, others believe it emerged from the drainage of a wetland in the valley. In all aspects, the residents are happy with the river today as it helps to provide water for animals and domestic use. According to the elderly in W6, a narrow river existed in the 1950s and traversed through the watershed, but it has recently widened and silted because of flash floods.
3.2.4. Natural Hazards
According to the elderly citizens, natural hazards were experienced in some watersheds as early as 1945 (Figure 4). However, they noted that these events did not cause severe damage, and their frequency was low at the time. For example, in W8 a large event involving the co-occurrence of landslides and flash floods happened in April 1945, but it did not cause human or property losses since it affected locations that were not inhabited. Despite the low population in the past, the elderly citizens reported that landslides frequently occurred in W8 during the colonial period. One village in W8, for instance, was named after landslides: Nyamutenguzi (literally meaning ‘the sliding land’ in Runyankole-Rukiga dialect) a name that has remained to date. According to the elderly citizens, residents always relocated from Nyamutenguzi during the rainy season for fear of landslides. Similarly, the elderly in W5 reported the occurrence of landslides in the 1950s, which led people to avoid living on steep slopes for fear of these hazards. However, the elderly confirmed that flooding never existed before 1962 when the wetland was still existing in W5. In addition, the elderly in W5 indicated that there were natural waterways which effectively drained the watershed during periods of excess water. They asserted that a desilting schedule existed in the community to maintain the channels, which prevented floods. The desilting practice was however, abandoned after the colonial rule in 1962, leading to the channels getting silted and flooding started occurring as reported by elderly citizens. The elderly acknowledged that the frequency of flooding worsened in the 1980s when the wetland was completely drained, for cultivation and settlements. Today, the watershed experiences severe flooding every rainy season. In contrast, other watersheds like W1, W2 and W3 did not experience natural hazards during the colonial period (Figure 4).
As reported by the elderly, watersheds did not have gullies which are associated to flash floods until the 1980s when the first gully formed in W6. Gullies that were large enough to create a hazard began to appear in other watersheds during the 1990s and early 2000s.
3.2.5. Temporal Trend of Reported Natural Hazards in Relation to Ages of the Elderly
According to the elderly citizens, the number of natural hazards increased significantly from the 1940’s to the 1980s, and quite high frequencies continued to be observed the following decades (Figure 5). The elderly citizens attribute the increase in the natural hazard occurrences to various factors. For instance, W4 suffered from severe flash floods, including fatalities, which the elderly believe were caused by the deforestation of the Muhabura forest before the 1960s. Similarly, they attribute the landslides experienced in W1 after the colonial period to the deforestation that took place between 1960 and 1980. During our field observations, we noted large boulders scattered throughout the watershed, reportedly carried by flash floods more than 20 years ago (as recounted by the elderly). These boulders vividly demonstrate the intensity of the past flash floods. As attested by the elderly residents, protecting the forest from further human activities not only saved it from extinction but also reduced the frequency of severe fatal disasters.
Our analysis of the trend in reported hazards in relation to participant ages (Figure 5), shows that few or no hazards are reported from periods when participants were younger (e.g., the 1940s). In contrast, more hazard reports concentrate in periods when participants were middle-aged or older (typically 30 years and above). Notably, the 1980s show a high number of events and coincides with a period when the median age of the elderly participants was 39, an age where they likely recall significant environmental changes (Teitelbaum et al, 1991).
3.3. Catchment Characteristics in the Post-Colonial Era (1962–2021)
Narrations from the elderly citizens indicate that significant changes took place in policies, land management, and farming systems after independence in 1962 (Figure 4 and Appendix A3). For instance, land ownership changed from public to private ownership and people were free to use their land the way they wished. This period also saw a rise in the buying and selling of land, a practice that was uncommon before independence. The elderly reported that the land management practices and laws, which had been strictly enforced by the colonial government, were gradually abandoned, as shown in the timeline (Figure 4). These changes led to poor management practices on the land according to the elderly citizens. For instance, there was an increase in the removal of vegetation cover through tree cutting and bush burning, including the cutting of natural tree species and black wattle for charcoal and timber. This deforestation intensified in 1971 during Idi Amin’s regime. According to the elderly, this is the period when markets were opened and trading of different commodities such as food, livestock, construction materials, and charcoal increased. More so, the population had increased and therefore the demand for construction materials and fuel energy was high. The elderly also reported that after 1980, eucalyptus trees increasingly replaced native tree species, and by 2000, most landscapes had been planted with eucalyptus, leaving no traces of black wattle or other natural species. The elderly further narrate that after independence, traditional practices such as fallowing and contour ploughing were abandoned (Figure 4). Instead, people began cultivating land up and down the hills without contouring, and this was done year round. They also observed that starting from the 1970s, both the human population and livestock numbers increased significantly (Figure 4). This led to overcultivation, characterized by excessive tillage, a reduction in grazing areas, and the draining of wetlands for farming and settlements. Addition-ally, the elderly pointed out that after the 1970s, with the emergence of a growing market economy, people began to recognize the value of money and began growing food for sale. This practice further contributed to overcultivation.
The elderly citizens also recall that after independence, new crop varieties were introduced to increase productivity. For example, a potato variety more suitable for growing in lowlands was introduced, which led to further drainage of wetlands to accommodate its cultivation. Unlike the indigenous potato, this new variety required the extensive use of chemicals. From the 1980s through the 1990s, the construction of new roads accelerated, often cutting through hills and draining wetlands to improve access for the growing population. The elderly also noted changes in housing during this period, with traditional grass-thatched houses gradually being replaced by iron-roofed structures in the 1980s.
3.4. Land Use/Cover Change Analysis with the 1954 Aerial Panchromatic Photographs
Significant changes in land use/cover have occurred between 1954 and 2021 (Figure 6, Figure 7 and Figure 8). As explained by the elderly, forests existed on hilltops and the upper slopes of most watersheds in 1954. However, this is no longer the case for most of the watersheds in 2021. For W3, W7 and W8, forests existed in 1954 mainly along steep ridges on slopes whereas the hilltops were covered with short grass. Generally, watersheds adjacent to large, forested areas like W1, W4, W5, and W6 experienced extensive deforestation before 1990 since there were no boundaries separating the forest from the community and these forested areas were not yet restricted for use as National Parks (Figure 6c and Figure 7) [53]. The analysis further shows that W2 and W3 experienced deforestation as well. However, W8 did not show major changes in forest cover (Figure 6c and Figure 7). Whereas deforestation in W1 commenced from 1954, results suggest that the deforestation in W4, W5 and W6 was conducted way before 1954 (Appendix B1). This is confirmed by [67] who showed that heavy exploitation of Muhabura forest (adjacent to W4) for cultivation and grazing took place in the 1940s. The exploitation of the forest in W4 is also confirmed in the analysis of the 1954 landcover map, where terraces and cultivated fields are shown extended in the forest (Figure 8).
The land use and cover change analysis reveal a significant increase in the area covered by settlements across all watersheds (Figure 7 and Figure 8). The most notable increase occurred in W5, where the area covered by settlements grew from 0.5% in 1954 to 22% in 2021. The analysis also shows that, with the exception of W7, settlements in most watersheds have extended to upper slopes, a shift from 1954 when settlements were primarily located on lower slopes or in valleys. The elderly citizens recall that in the past, housing consisted of scattered grass-thatched huts locally known as kateteyi (dress-shaped). These huts were progressively replaced by iron sheet roofs during the 1970s and 1980s as the population expanded.
The total road length increased from 29 km in 1954 to 66 km in 2021 (Figure 7 and Figure 8). Increases in areas covered by agricultural terraces land are noted in W2 and W5, by 75% and 61% respectively, while reduction is experienced in W4 and W8 (Figure 7 and Figure 8). No significant changes in terraced land were observed in the other watersheds (Figure 7 and Figure 8). Our field observations also revealed that many of the existing terraces are from the colonial period and have not been maintained since then, leading to their collapse over time.
3.5. Population Dynamics
The overall national population of Uganda has grown from two million people in 1911 to 46 million people in 2024 with an average population density of 224 people per square kilometre [50]. For Kigezi region, based on the delineation of the areas covered by settlements on Google Earth imagery, we see that the highest settlement density is in W5, followed by W6 and W8 with settlement proportions of 22%, 17% and 15% respectively (Figure 6b). According to the elderly citizens, the population in all the watersheds was low and sparsely distributed in the 40s, ranging between 6-15 households in each watershed. This is confirmed from the 1954 historical land use/cover analysis (Figure 7 and Figure 8). Early researchers reported a rapidly increasing population density in the 50s which put pressure on land. In his book, ‘Kigezi and its people’ [62], Ngologoza describes the dilemma of the increasing population density in Kigezi with associated effects of conflicts and competition over land, which necessitated the colonial administrators to establish a resettlement scheme to relocate people to other regions in Uganda. The first resettlement was executed in 1957 where people were resettled from Kigezi to other districts in Uganda. According to the elderly, the resettlement scheme continued in Kigezi in the 60s and after the colonial period.
3.6. Restoration Programs and Natural Hazards
We note that there is forest cover increase in some watersheds such as W4 and W7. According to the elderly narrative in W4, Muhabura forest was inhabited by the community residents who carried out their farming activities in the forest until 1991 when they were evicted by the government, and the forest gazetted as a protected area. The demarcation and establishment of buffer zones on the forests significantly restored the lost forest cover in W4, which is noted in our results, i.e., from 38% in 1954 to 60% in 2021 (Figure 6c and Figure 7). This forest increase was noted within the forest park and surrounding communities (Appendix A). Forest cover increase was also shown in W7 from 14% in 1954 to 40% in 2021 (Figure 6c and Figure 7). According to the elderly in the W7, this increase is attributed to restoration programs introduced in the watershed by NGO programs from 2000, which is confirmed in the Google Earth imagery. The elderly reported that afforestation programs in W7 were carried out from 2000 on one side of the watershed where eucalyptus and pine trees were grown and resulted in increased tree cover. The elderly testimonies suggest that natural hazards have been controlled by the increased tree cover in this watershed. Our field observations indicate that restoration programs have been implemented in some watersheds and they include afforestation and soil and water conservation programs. For instance, during our interactions with the elderly, we learnt that in W1 there are initiatives of planting indigenous tree species to replace those that were cut long ago. In W6 and W7, NGOs and Government programs installed soil and water conservation programs including water diversions, planting of pine, eucalyptus, and grevilia trees, implementing of mulching, and fanya chini trenches (trenches and earthen ridges facing downslope). According to the elderly, these practices if adopted by all residents could help in reducing incidences of natural hazards.
4. Discussion
4.1. The Added Value and Limitations of the Elderly Approach. Can the Information be Trusted?
Analysis of the aerial photographs of 1954 for the region and the historical literature validate the elderly citizens’ narratives, confirming the reliability of the information collected on region’s landscape dynamics. This shows that the elderly citizen-based approaches through lived experience can be a reliable way for retrieving historical information. A detailed inventory of natural hazards in the Kigezi region was compiled from global databases and archives by [47]. When comparing this inventory with the data we gathered from elderly citizens for the same period and locations, i.e., the eight watersheds, we found only 12 events recorded in the existing global databases. This inconsistency clearly highlights the added value of using the elderly approach in documenting natural hazards. While other researchers have recognized the importance of documentary historical records and archives in recording natural hazards and reconstructing the historical landscapes [1], such records are often lacking in both quantity and quality, particularly in data-scarce regions [68,69].
Obtaining historical narrative of environmental changes offers several advantages, including increasing the understanding of the dynamic nature of landscapes [68]. Record of past natural hazards not mentioned in other inventory might also contribute to improved risk assessments and better understanding of potential future hazard events [70]. However, most current databases do not provide records for events that occurred many decades ago. For instance, DesInventar database which has the largest data for Kigezi region contains records from 1989 as the earliest [71]. In addition, historical trends in land use and land cover were not easily available before the start of satellite missions [34,72]. It even becomes more difficult when historical aerial photography is required because such records are not always easy to find [1,73]. Consequently, the elderly citizens could help to fill in this information gap. Natural hazard records from the elderly are often accurate in spatial scale, as they typically provide the exact locations where events occurred. This positive attribute has been recognized in various studies using the citizen science approach e.g. [74,75,76]. When reconstructing past land use/cover, the elderly articulate much more landscape-related information that cannot be found in satellite images or aerial photographs. For instance, we gathered information on the farming systems, land management practices, types of vegetation that existed and the regulations that governed land use. As demonstrated by [46], this comprehensive information offers a deeper understanding of natural hazard processes and mechanisms, which is crucial for effective disaster risk reduction.
While the elderly approach was valuable in accounting of the natural hazards and historical landscape, there are limitations associated with the approach. First, the elderly recollections are incomplete in terms of exact timing of events. Even if the timeline assisted in memory recall, there were still challenges in obtaining the exact date of an event. In some cases, statements like ‘the event happened during that regime’ were experienced, leading to inaccuracy in the time of occurrence. In comparison, [77] demonstrated that children and adolescents tend to be less accurate in recalling past events compared to adults. [78] revealed that memory accuracy for past events improves with age, indicating that older adults often provide more precise accounts of historical events due to their broader life experience and more developed cognitive recall abilities. This suggests that elderly participants have clearer memories of hazards from the periods when they were most actively engaged with their environment or when their memory capacities were active, than when they were younger with limited early memories. However, research has also shown that information from the elderly is often limited by memory decay, as memories can fade or become distorted over time, leading to inaccuracies in recalled events [79]. The apparent trend of reported hazard events shown in Figure 5 may therefore be influenced by the age and memory capacity of elderly participants. Spatial biases also exist in the data collected because the elderly primarily recall events that occurred in their areas of residence [80]. Consequently, the information provided is highly context and place-specific, necessitating caution when extrapolating these insights to broader scales. Such biases can lead to underreporting of events in less populated or uninhabited areas, potentially skewing the data. As a result, it may seem that natural hazards are more frequent in densely populated areas, when in fact this could simply be due to higher rates of recollection and reporting in these regions. Regarding documenting natural hazards, biases exist in recording only large and impactful events [55,81,82]. The elderly tend to recall events that caused severe impacts or fatalities, while less impactful events are often over-looked. As noted by [36], it is natural for people to remember events with a significant impact, while omitting or for-getting those of lower magnitude, which can result in incomplete historical records. Inventory of low magnitude and frequent events is important in building a reliable hazard susceptibility [83]. Similar biases in citizen science data have been reported by other authors, including [76,81,84]. Another limitation is that the information provided by the elderly citizens is often limited in terms of process understanding of the events, hence causal relations are inferred from personal perceptions, cultural beliefs, and social contexts [36,85]. With such discrepancies and biases in mind, the elderly information, although valuable, must be analyzed with care.
4.2. Natural Hazards and Forest Cover Changes
Accounts from elderly attribute the increase in the reports of natural hazards to land use changes, especially vegetation removal and changes in land management practices. According to [86], the most significant and predominant land use change that took place in Kigezi region from 1987 to 2014 was the conversion of tropical high forests to small-scale farmland and woodlots, and the decline in the wetland areas. Similar findings were made by [53,87], highlighting, for example, important deforestation of the Bwindi Impenetrable Forest Reserve where largescale clearance of forest cover took place from 1960 to the 80s before restrictions and boundaries separating the forest and community land were established. It is possible that landslides were favoured by this deforestation. Forest conversion, especially to agricultural land has been associated with increased landslide activity in similar regions just south of our study area [12,22,88] demonstrated that when deforestation occurs, an increase in landslides is experienced over a span of approximately 10-15 years.
Our results further indicate that the natural vegetation as well as cultivable lands were or are quickly being converted to eucalyptus plantations. As mentioned by the elderly, black wattle trees which were enforced by the colonial government protected the land against soil degradation. This observation aligns with findings by [89,90] who highlighted that black wattle trees enhance soil aggregate stability and reduce soil erodibility, thereby preventing the risk of landslides and flash floods. According to the elderly citizens, the rising demand for wood products, high economic value, and fast maturing factors of eucalyptus are causing the rapid conversion of native tree species. Other countries in the region have recorded a rapid rate at which eucalyptus is replacing native tree species as well as crop land. In Ethiopia for example, eucalyptus is perceived positively for its economic benefits and many small-holder farmers have engaged in the conversion of croplands to eucalyptus stands [91]. However, there is controversy from the elderly citizens surrounding the effectiveness of eucalyptus trees in controlling natural hazards. Some elderly citizens and local residents believe that eucalyptus has done more harm than good regarding land management. Other elderly citizens attached a positive role to eucalyptus in controlling natural hazards. For instance, the section of W7 where afforestation programs were done with eucalyptus has registered a reduction in landslides and flash floods according to the residents. In a recent fatal disaster that occurred in one of the watersheds (W4), a cascading event comprising of landslides and flashfloods killed nine people and displaced about 300 households [92]. From our interactions with survivors, homes that had eucalyptus plantations around them were saved from being swept away by the flashfloods. Other controversies of eucalyptus in land management have been highlighted by some researchers such as [93] who noted that successive planting of eucalyptus reduces soil aggregate stability and renders the land to soil to erosion and landslides. Moreover, eucalyptus landscapes were found with soil compaction problems, as well as poor aeration and water-holding capacity, which could be linked to flash flood occurrences. Another study in Ethiopia by [27] highlighted the role played by eucalyptus plantations in initiating gully formation and flash floods. eucalyptus trees do not encourage undergrowth which limits retention of water which increases surface runoff and therefore contributes to flash flood occurrence [94].
4.3. Land Management Practices and Farming Systems’ Influence on Natural Hazards
Historical researchers in the region like [63] had previously warned of the disasters that Kigezi region might face due to the increasing population pressure that was noted as early as the colonial era. According to the elderly and confirmed by [63], the increase in population was attributed to immigration from Rwanda that started in 1932 and continued to the 50s. The elderly reported that the increase in population prompted the colonial administrators to set up laws and policies governing the use and management of land. These findings align with [40,63] who established that in response to the increased population and shortage of land, the colonial administrators passed several policies including planting of black wattle trees for every household, restrictions in cutting of trees and bush burning, fallowing and terracing. These policies and practices to conserve the land, transformed and made Kigezi a model region as far as terracing is concerned [52,95]. The terraces still existing today are a heritage of the policies that were put in place to curb the increasing land degradation. In W2 and W5, terraces increased at the expense of forest cover as forested land was converted into cropland land (Figure 7 and Figure 8). On the other hand, the terraces in W8 reduced as the cropland land was turned into settlements as confirmed by the increase in the area covered by houses. The reduction of terraces in W4 can be explained by the restriction of cultivating in Muhabura forest. The terraces which were in the forest were concealed as the forest rejuvenated. With the abandonment of land management practices, the terraces have not been maintained and are therefore dilapidated.
According to the elderly, terracing and consistent fallowing practices prevented natural hazards from occurring, however as population grew and these practices were no longer practiced, the land became more susceptible to natural hazards. However, there is controversy on the effectiveness of terraces in controlling natural hazards. For instance, [96] argues that terraces control floods by reducing the velocity of runoff. On the other hand, terraces create favourable conditions for landslides because of their capacity to increase water infiltration [97,98]. The problem is exacerbated by the unmaintained terraces which are a source of shallow landslides. Most shallow landslides we observed recently in the field have their scarp/head originating from an old terrace ridge. The role of terraces in initiating shallow landslides was demonstrated in a study by [99] in Italy. The same was also demonstrated in Eastern Uganda [100], and in a region of Rwanda close to that of our study area [101]. Furthermore, [98] highlighted the risks associated with abandoned terraces in terms of causing gully initiation and flash floods. According to the elderly, the terraces in the past were stabilized with elephant grass, which prevented the terrace from collapsing and causing shallow landslides. The issue of terracing and landslides could therefore be linked to land management practices and the nature of the terraces.
Another land management practice abandoned was fallowing. Apart from keeping the soil covered, fallowing allows the soil to regenerate and therefore increase water infiltration thereby reducing runoff and flash floods [102]. Previous research has shown the role of fallows and elephant grass along contours in positively improving the soil physical properties and preventing run off and flash floods [103]. Our field observations discovered that W1 is making efforts to maintain the traditional crops; for instance, millet is still grown in this watershed, a crop which other watersheds abandoned after the colonial period. Millet promotes conservation agriculture by acting as a cover crop but also improving the soil structure [104,105], which can be associated with reduced frequencies of natural hazards in W1.
4.4. Population Growth and Infrastructure Development in Relation to Natural Hazard Risks
Our analysis shows that the population in the watersheds has grown rapidly, increasing exposure to natural hazards. For example, in contrast to the 40s and 50s, many settlements are currently located on hillslopes, which exposes people and their property to landslides (Figure 8). Similarly, other new settlements were mapped in the drained wetlands, which puts the population at a risk of floods. This trend is also highlighted by various authors who have reported the increasing impacts of natural hazards, exacerbated by population growth, which pushes people to live in more hazardous terrain [5,14,19,20,106]. Infrastructure has developed in the watersheds with more roads constructed especially starting from 1980. With the hilly terrain of the region, roads had to be dissected through the hills, which probably reduced the stability of the slopes and increased the susceptibility of the landscape to landslides. The role played by road construction in causing landslides in mountainous environments is clearly demonstrated [107]. Furthermore, the type of roads constructed were sand and gravel type without embarkment of the side cuts, which led to more slope instability. In our previous landslide inventory by [47], several land-slides were mapped along newly constructed roads in W3 and W8. Moreover, in most cases the roads were crossing wetlands which necessitated drainage; a management action that can influence the occurrence of floods.
4.5. Natural Hazards and Climate Variability
Despite the potential role of human activities on the occurrence of natural hazards as highlighted in the former sections, and the evident increase of population exposure, the trends observed in reported hazards must also be analyzed in the context of climatic variability. El Niño and the Southern Oscillation (ENSO) are examples of such a variability that influenced rainfall pattern in the region [108]. For instance, the 1982-83 El Niño event was particularly intense and linked to a noticeable rise in rainfall and hazard occurrences [109]. Beyond ENSO variability, anomalous periods of rainfall not only lead to more frequent hazard events but may also potentially result in more impactful events [110]. Such impactful events are more likely to be vividly recalled by the elderly participants [80].
5. Conclusions
Our findings reveal that major land use/cover changes associated with a high population increase have occurred over the last 80 years. The changes which include vegetation removal, conversion from natural to exotic tree species, increased cultivation of hillslopes, road construction, wetland drainage, abandonment of agricultural terraces and fallowing practices, are all associated with an increase in population pressure, laxity in the land management laws and policies, and change from public to private land ownership. These changes are commonly reported to be associated with an increase of natural hazard frequency. However, despite an unprecedented amount of new information for the region, this association between natural hazard frequency and land use change cannot yet be quantitatively validated. Nevertheless, the increasing exposure of vulnerable populations to the dangers of natural hazards is evident, with population growth and poorly designed landscape management practices as key drivers. Integrating the knowledge of elderly citizens into the analysis of natural hazards and land transformation has proven to be highly valuable. The integration of elderly citizens’ knowledge in the analysis of natural hazards and land transformation has demonstrated to be highly valuable. The rich knowledge of the past narrated by the elderly citizens underscores the effectiveness of this approach in generating unique and otherwise inaccessible knowledge that would be hard to get with other scientific or social research methods, contributing to a comprehensive understanding of landscape transformation and natural hazard dynamics.
Ethical considerations
This research in its entirety was approved by the Research Ethics Committee of Mbarara University of Science and Technology and the Uganda National Council of Science and Technology. .
Author Contributions
Conceptualization, V.K., R.T., M.K. and O.D.; methodology, V.K., R.T., M.K. and O.D.; software, V.K.; validation, R.T., M.K. and O.D.; formal analysis, V.K., R.T., M.K. and O.D.; investigation, V.K., R.T., M.K. and O.D.; resources, V.K., R.T., M.K. and O.D; data curation, V.K., D.M., R.T., and GKR, writing—original draft preparation, V.K., R.T., M.K. and O.D.; writing—review and editing, V.K., R.T., M.K., O.D., MGA, and C.M., visualization, V.K., R.T., M.K. and O.D.; supervision, R.T., M.K. and O.D.; project administration, R.T. and O.D. All authors have read and agreed to the published version of the manuscript.”.
Funding
This research was funded by the Development Cooperation programme of the Royal Museum for Central Africa with support of the Directorate-General Development Cooperation and Humanitarian Aid of Belgium (RMCA-DGD) through the HARISSA (RMCA-DGD 2019–2024; https://georiska.africamuseum.be/en/activities/harissa) project.
Data Availability Statement
Data are available on request from the corresponding author.
Acknowledgments
We extend our gratitude to all the institutions and individuals whose invaluable contributions made this study possible. Special thanks go to the elderly citizens who generously shared their time and knowledge for this study. We are also grateful to Dr. François Kervyn for his exceptional coordination and unwavering moral support throughout this research.
Conflicts of Interest
The authors declare no conflicts of interest.
Appendix A
Questionnaire A1: Questionnaire guide for the elderly interviews
Introduction
Hello. I am Violet Kanyiginya a PhD researcher attached to Mbarara University of Science and Technology. I will be having a discussion with you about how the landscape in your area has evolved and identify any natural hazards that have occurred in the past.
The purpose of the interview/discussions is to understand landscape change dynamics and how it is linked to natural hazard occurrences over the past decades. The information you provide is very important for this study to enable the understanding of the natural hazard processes, with a hope of contributing to disaster risk reduction
I will keep your name and your answers confidential. Your responses will be used only for the purpose of this re-search.
Name: __________________________________________________________
Sex: ________________________________________________________________
Age (when were you born?) ______________________________________________
Village: _______________________________________________________________
Parish: ________________________________________________________________
Sub-county: ____________________________________________________________
District: _______________________________________________________________
- How long have you lived in this area?
- From the time you started understanding, what do you remember about your village? How many were you in this village (household)? Show on the map where your houses were located.
- How did your village look like generally? Or what was in the environment when you were young (structure of houses, roads, budlings, wetlands, forest, etc.) for FGDs use the map to show how the landscape looked like in the past and What it looks like currently.
- What changes on the landscape do you remember happened? what has changed, what has not changed in your environment when did the change happen and where did it happen? - Use the timeline to re-member and the map to show where the changes occurred
- What about the river in your area, can you tell me about its history/evolution through time?
- How were the land managed, what crops did you grow?
- Any policies that existed?
- Have you experienced landslides and floods in the past?
- If yes, when did they happen- which years/months/seasons- use the timeline of historical political or social events to remember)
Appendix A2

Table A2.
Historical timeline guide used during interviews.
| Year | Historical event/change | Visualisation of landscape change | ||
|---|---|---|---|---|
| Political & cultural changes (new laws, policies and practices, immigrants) | Socio-economic changes (livelihoods, farming practices, promotion of certain crops, population, infrastructure, building architecture) | Environmental/landscape changes (deforestation, afforestation, what natural hazards occurred) | Using the available map, show how the landscape looked like in this period? (forested, terraced or not, bare, bushy, uncultivated, wetland, grazing land, uninhabited, etc) | |
Appendix A3
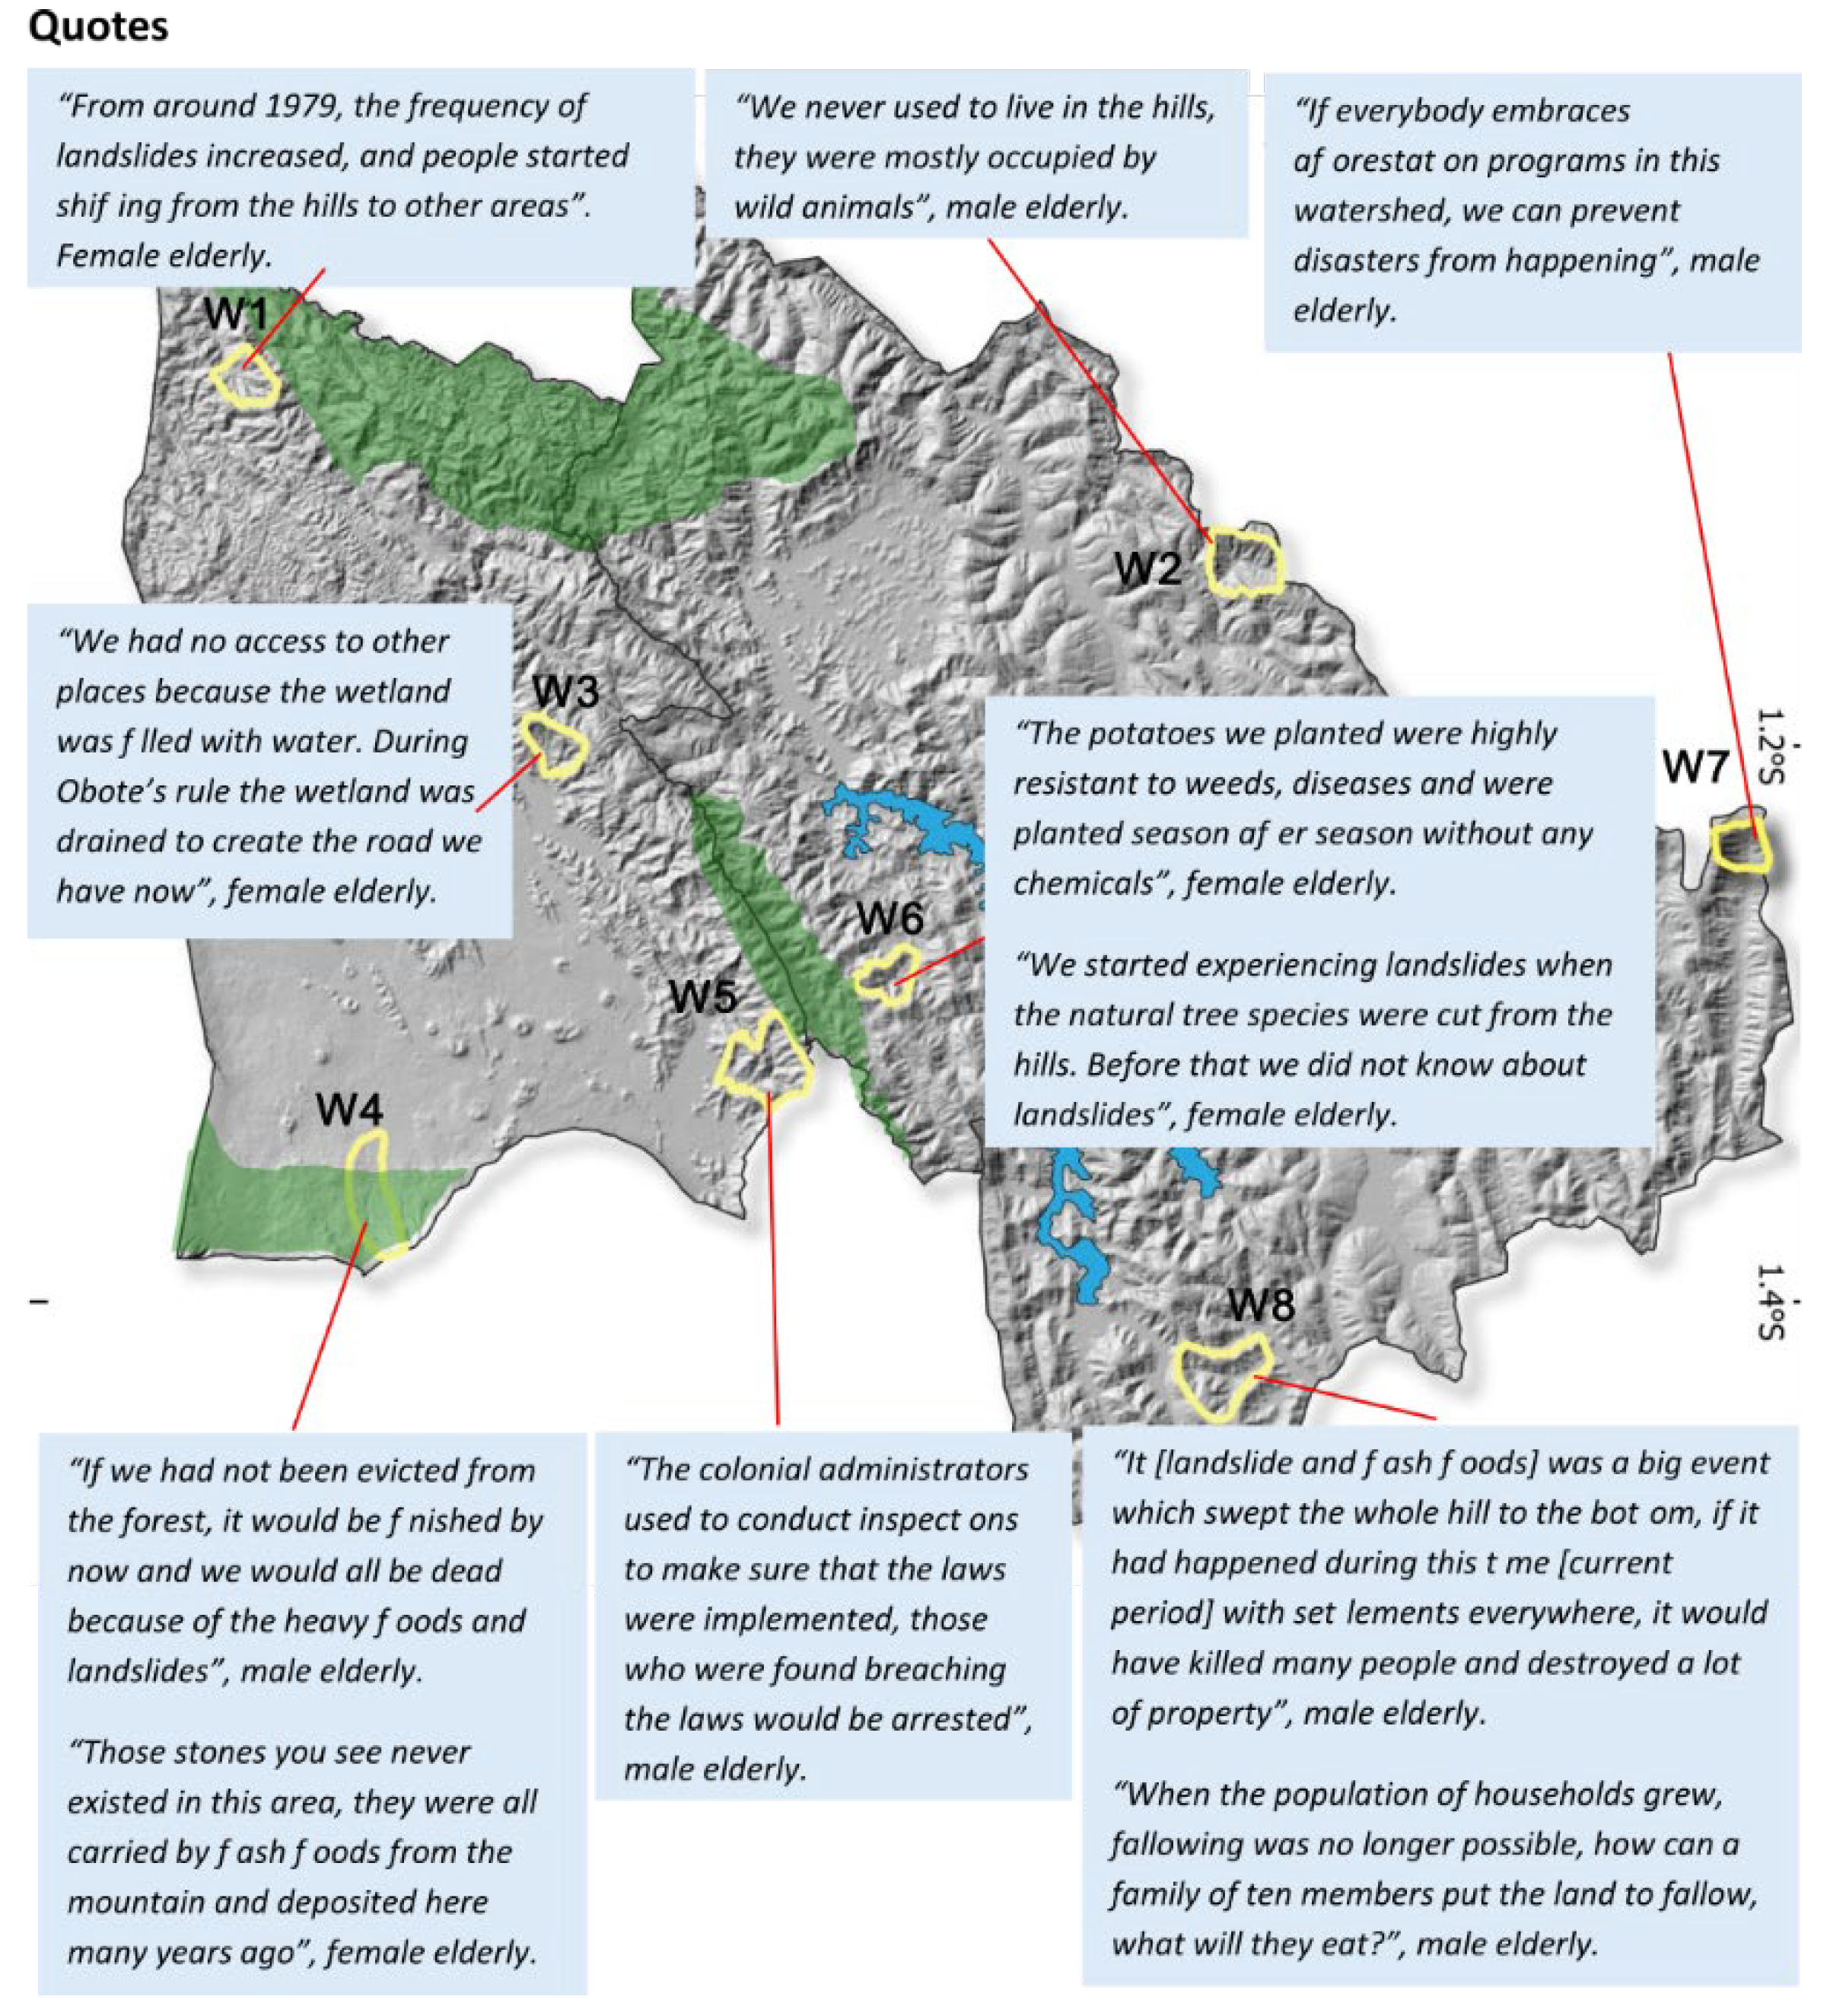
Figure A3.
Examples of quotes from interactions with the elderly citizens.
Appendix A3
Table A4.
Detailed watershed timelines.
| W1 - Nteko | |||||
|---|---|---|---|---|---|
| Dates | National/regional context | Local events | |||
| 1932 | pre-colonial period | Park boundary was established separating Bwindi Forest and communities | |||
| 1960 | Colonial period | heavy deforestation in the catchment started | |||
| 1979 | Obote I president | Landslides experienced and people started shifting due to landslides | |||
| 1991 | Museveni's rule | Bwindi forest was gazzeted a national park | |||
| 2016 | Museveni's rule | restoration program by NGOs to plant indigenous trees | |||
| 2019 | Museveni's rule | Heavy landslides occurred | |||
| W2 - Kyokezo | |||||
| Dates | National/regional context | Local events | |||
| 1950-60 | Colonial period | Resettlement scheme took place as a depopulation strategy | |||
| 1971 | Obote I president | The natural forest started to decline, replaced with eucalyptus | |||
| 1980 | Obote II rule | population grew, land fragmentation | |||
| 1986 | Museveni became president | many iron sheets roofed houses; fallowing competently ended | |||
| 1998 | Museveni's rule | The first road was constructed | |||
| 2000 | Museveni's rule | Swamp drainage | |||
| 2009 | Museveni's rule | The first serious landslides occurred killing 6 people and destroying several properties. Many large gulleys were formed | |||
| Museveni's rule | buying and selling of land increased; land fragmentation | ||||
| Apr-17 | Museveni's rule | Deadly landslides | |||
| 2004 | Museveni's rule | Road constructed began | |||
| 1980 | Obote II rule | Over Population and cultivation | |||
| W3 - Nyundo | |||||
| Dates | National/regional context | Local events | |||
| 1952 | Colonial period | Mass wetland drainage for cultivation and road access | |||
| 1966-70s | Obote I rule | Land management practices abandoned | |||
| 1971 | Obote I president | constructed many roads cutting through the mountains | |||
| 1980 | Obote II rule | population increase, over cultivation overgrazing ; Disasters increased happening in April and September every year | |||
| 1990-98 | Museveni's rule | fallowing was no more | |||
| 2000 | Museveni's rule | Eucalyptus dominated the landscape natural tree species cut | |||
| 2004 | Museveni's rule | Road constructed began | |||
| W4 - Rukonji | |||||
| Dates | National/regional context | Local events | |||
| 1950 | Colonial period | Muhabura forest heavily cut down for cultivation | |||
| 1957 | Colonial period | Flash floods | |||
| Apr-74 | President Amin rule | Heavy flashfloods involving deaths occurred | |||
| Mar-82 | Obote II rule | Heavy flashfloods involving deaths occurred | |||
| Apr-88 | President Museveni's rule | Heavy flashfloods involving deaths occurred | |||
| 1991 | Museveni's rule | Forest gazetted a national park and regrowth of the of the forest | |||
| W5 - Chibumba | |||||
| Dates | National/regional context | Local events | |||
| 1950 | Colonial period | Landslides occurred in the hills, people relocated to lowlands | |||
| 1954 | Colonial period | fallowing, planting elephant grass along contours, black wattle trees enforced | |||
| 1957 | Colonial period | depopulation plan, people were resettled | |||
| 1959 | Colonial period | Rwandese war, immigrants | |||
| 1960 | Colonial period | Mining of tin | |||
| 1966-70s | Obote I rule | Land management practices abandoned, natural trees cut down, cultivating in the swamp | |||
| 1969 | Obote I president | Iron sheet houses | |||
| 1980 | Obote II rule | Wetland in the valley was reclaimed and finished | |||
| 1981 | Obote II rule | Natural hazards, especially floods increased in the catchment | |||
| 1986 | Museveni's rule | Road construction | |||
| W6 - Kacereere | |||||
| Dates | National/regional context | Local events | |||
| 1936 | pre-colonial period | Echuya forest separated from community land | |||
| 1959 | Colonial period | Echuya forest gazetted a forest reserve | |||
| 1955-66 | Colonial period | Resettlement plan for depopulation happened | |||
| 1960 | Colonial period | sinkholes experienced | |||
| 1970 | Obote I rule | Land management practices abandoned; natural trees cut down replaced with exotic ones | |||
| 1974 | President Amin rule | Elephants left the catchment | |||
| 1979 | President Amin rule | Over cultivation and shortage of land | |||
| 1980-90 | Obote II rule | landslides and floods were experienced, and gulleys started to form | |||
| Apr-84 | Obote II rule | Serious flashfloods happened and swept crops and houses | |||
| 1990-98 | Museveni's rule | wetland lost completely because of siltation | |||
| Sep-94 | Museveni's rule | Landslides occurred and destroyed 3 houses, bridges, animals, and crops | |||
| 2016 | Museveni's rule | soil and water conservation programs introduced | |||
| W7 - Kahondo | |||||
| Dates | National/regional context | Local events | |||
| 1946 | Colonial period | landslides occurred and killed livestock, destroyed crops | |||
| 1950 | Colonial period | First main road constructed | |||
| 1954 | Colonial period | fallowing, planting elephant grass along contours, black wattle trees enforced | |||
| 1956-1959 | Colonial period | The first iron sheet houses were built | |||
| 1966-70s | Obote I rule | Land management practices abandoned, natural trees cut down, cultivating in the swamp | |||
| 1971 | Obote I president | Public land became private land with land titles. There was no source of water, the first borehole was constructed. A river was formed and flows | |||
| 1980 | Obote II rule | overpopulation of people and livestock, overgrazing and cattle trails all over the landscape, over cultivation | |||
| 1984 | Obote II rule | buying and selling of food, food scarcity | |||
| 1990-98 | Museveni's rule | gullies started forming in the catchment | |||
| 1992 | Museveni's rule | severe famine happened in 1992 due to drought, and pests and diseases | |||
| 2000 | Museveni's rule | Afforestation programs introduced with Eucalyptus and pine dominating | |||
| 2005-2009 | Museveni's rule | soil and water conservation programs introduced | |||
| Apr-13 | serious landslides and floods occurred | ||||
| W8 - Kibuga | |||||
| Dates | National/regional context | Local events | |||
| 1945 | Colonial period | Deadly landslides occurred | |||
| 1952 | Colonial period | Mass wetland drainage | |||
| 1966-70s | Obote I rule | Land management practices abandoned | |||
| 1971 | Obote I president | constructed many roads cutting through the mountains | |||
| 1972 | Immigration started | population increase | |||
| 1980 | Obote II rule | over cultivation overgrazing set in; Landslides and floods increased | |||
| 1990-98 | Museveni's rule | The natural vegetation began to shrink, Eucalyptus dominated the land cover, iron sheet houses replaced grass thatched houses; fallowing was no more | |||
| Museveni's rule | buying and selling of land increased; land fragmentation | ||||
| Apr-17 | Museveni's rule | Deadly landslides | |||
| 2004 | Museveni's rule | Road construction began, more landsides occurred | |||
| 1980 | Obote II rule | Over Population and cultivation; landslides and flash floods | |||
Appendix B
Appendix B1
Figure 1.
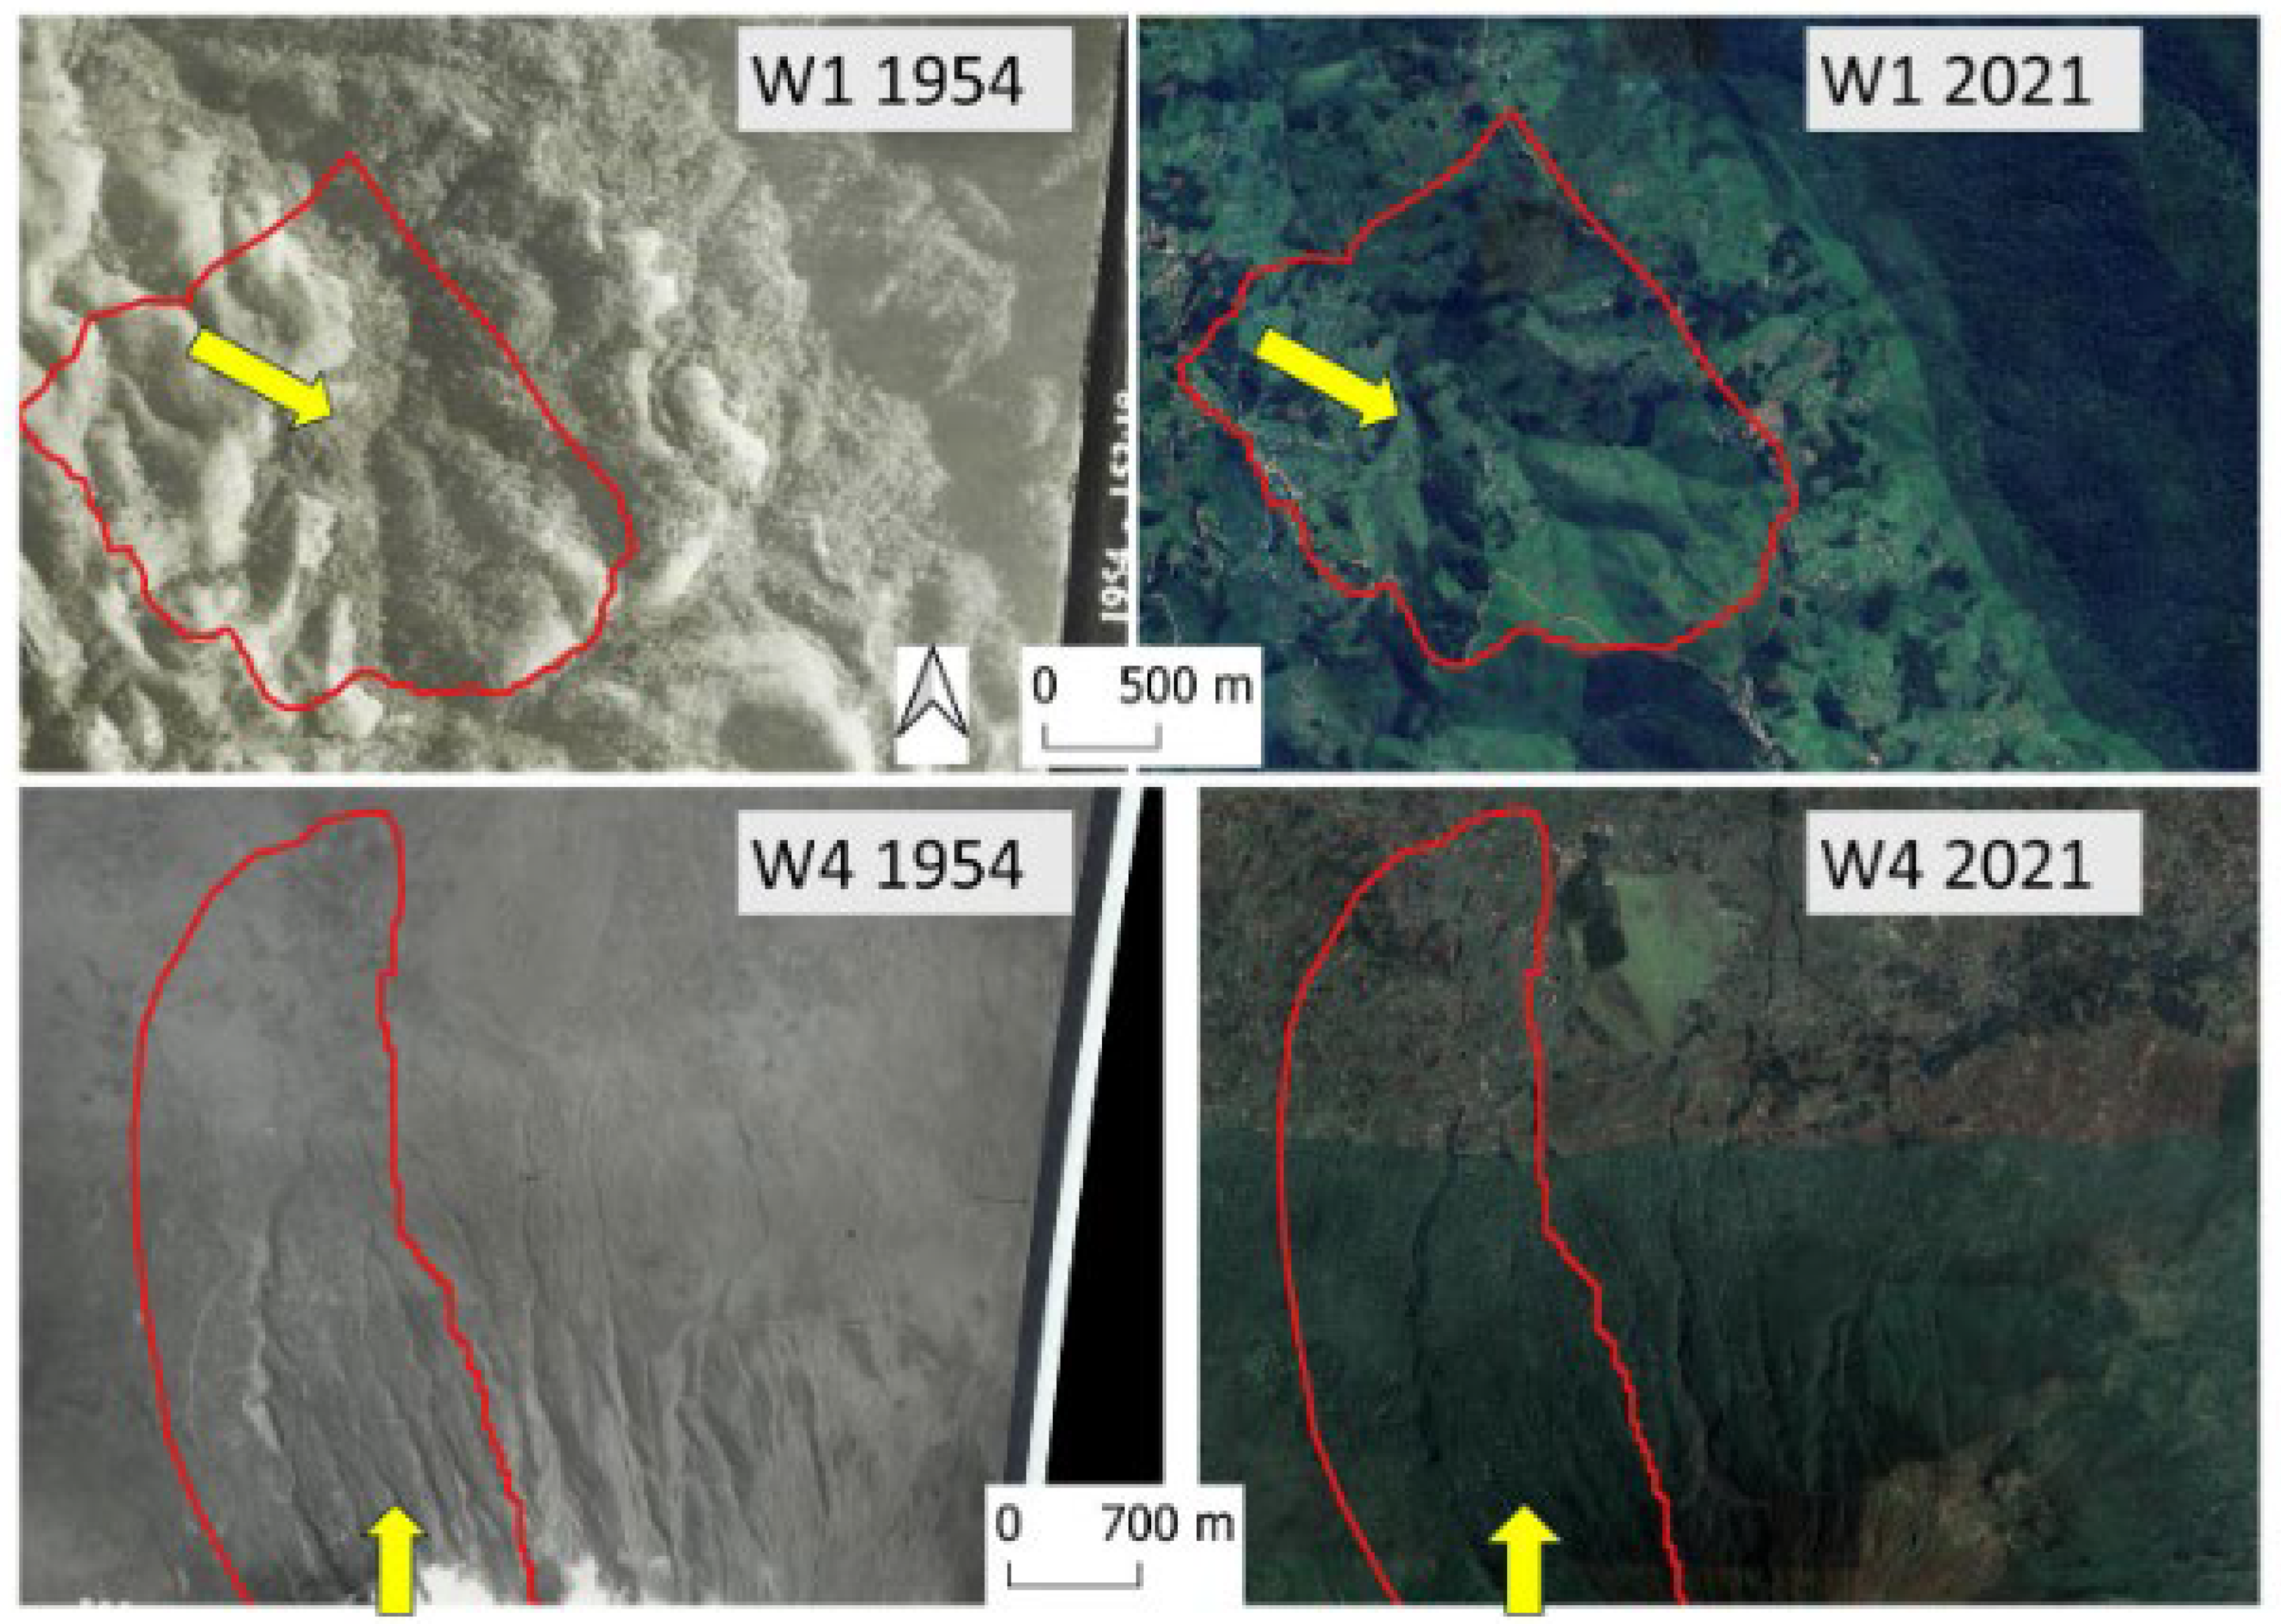
Examples of land use and land cover changes in the watersheds. W1 shows a reduction in forest cover, showing that deforestation took place after 1954 and W4 shows an increase in forest cover. The red polygons are the watershed boundaries.
Figure 1.
Examples of land use and land cover changes in the watersheds. W1 shows a reduction in forest cover, showing that deforestation took place after 1954 and W4 shows an increase in forest cover. The red polygons are the watershed boundaries.
References
- Luino, F.; Barriendos, M.; Gizzi, F. T.; Glaser, R.; Gruetzner, C.; Palmieri, W.; Porfido, S.; Sangster, H.; Turconi, L. Historical data for natural hazard risk Mitigation and land use planning. Land 2023, 12, page range. [Google Scholar] [CrossRef]
- Sidle, R. C.; Taylor, D.; Lu, X. X.; Adger, W. N.; Lowe, D. J.; de Lange, W. P.; Newnham, R. M.; Dodson, J. R. Interactions of Natural Hazards and Society in Austral-Asia: Evidence in Past and Recent Records. Quat. Int. 2004, 118–119, 181–203. [CrossRef]
- Napolitano, E.; Marchesini, I.; Salvati, P.; Donnini, M.; Bianchi, C.; Guzzetti, F. LAND-DeFeND – An Innovative Database Structure for Landslides and Floods and Their Consequences. J. Environ. Manage. 2018, 207 (February), 203–218. [Google Scholar] [CrossRef]
- Hill, E. M.; McCaughey, J. W.; Switzer, A. D.; Lallemant, D.; Wang, Y.; Sathiakumar, S. Human Amplification of Secondary Earthquake Hazards through Environmental Modifications. Nat. Rev. Earth Environ. 2024, 5 (June), 463–476. [Google Scholar] [CrossRef]
- Dille, A.; Dewitte, O.; Handwerger, A. L.; d’Oreye, N.; Derauw, D.; Ganza Bamulezi, G.; Ilombe Mawe, G.; Michellier, C.; Moeyersons, J.; Monsieurs, E.; Mugaruka Bibentyo, T.; Samsonov, S.; Smets, B.; Kervyn, M.; Kervyn, F. Acceleration of a Large Deep-Seated Tropical Landslide Due to Urbanization Feedbacks. Nat. Geosci. 2022, 15, 1048–1055. [Google Scholar] [CrossRef]
- Deijns, A. A. J.; Malet, J.-P.; Michéa, D.; Déprez, A.; Kervyn, F.; Thiery, W.; Dewitte, O. A Semi-Supervised Multi-Temporal Landslide and Flash Flood Event Detection Methodology for Unexplored Regions Using Massive Satellite Image Time Series. ISPRS J. Photogramm. Remote Sens. 2024, 215, 400–418. [Google Scholar] [CrossRef]
- Wang, X.; Fan, X.; Fang, C.; Dai, L.; Zhang, W.; Zheng, H.; Xu, Q. Long-Term Landslide Evolution and Restoration After the Wenchuan Earthquake Revealed by Time-Series Remote Sensing Images. Geophys. Res. Lett. 2024, 51 (2). [CrossRef]
- IPCC. Climate Change 2022: Impacts, Adaptation, and Vulnerability. Contribution of Working Group II to the Sixth Assessment Report of the Intergovernmental Panel on Climate Change; Cambridge University Press: Cambridge, UK and New York, NY, USA, 2022. [CrossRef]
- Froude, M. J.; Petley, D. N. Global Fatal Landslide Occurrence 2004 to 2016. Nat. Hazards Earth Syst. Sci. 2018, No. 2012, 1–44. [Google Scholar] [CrossRef]
- Cendrero, A.; Forte, L. M.; Remondo, J.; Cuesta-Albertos, J. A. Anthropocene Geomorphic Change. Climate or Human Activities? Earth’s Future. 2020, 8. [Google Scholar] [CrossRef]
- Cendrero, A.; Remondo, J.; Beylich, A. A.; Cienciala, P.; Forte, L. M.; Golosov, V. N.; Gusarov, A. V.; Kijowska-Strugała, M.; Laute, K.; Li, D.; Navas, A.; Soldati, M.; Vergari, F.; Zwoliński, Z.; Dixon, J. C.; Knight, J.; Nadal-Romero, E.; Płaczkowska, E. Denudation and Geomorphic Change in the Anthropocene; a Global Overview. Earth-Science Rev. 2022, 233, 104186. [Google Scholar] [CrossRef]
- Depicker, A.; Govers, G.; Jacobs, L.; Campforts, B.; Uwihirwe, J.; Dewitte, O. Interactions between Deforestation, Landscape Rejuvenation, and Shallow Landslides in the North Tanganyika–Kivu Rift Region, Africa. Earth Surf. Dyn. 2021, 9, 445–462. [Google Scholar] [CrossRef]
- Rengers, F. K.; McGuire, L. A.; Kean, J. W.; Staley, D. M.; Hobley, D. E. J. Model Simulations of Flood and Debris Flow Timing in Steep Catchments after Wildfire. Water Resour. Res. 2016, 52, 6041–6061. [Google Scholar] [CrossRef]
- Ozturk, U.; Bozzolan, E.; Holcombe, E. A.; Shukla, R.; Pianosi, F.; Wagener, T. How Climate Change and Unplanned Urban Sprawl Bring More Landslides. 2022, 608, 262-265. [CrossRef]
- McAdoo, B. G.; Quak, M.; Gnyawali, K. R.; Adhikari, B. R.; Devkota, S.; Rajbhandari, P. L.; Sudmeier-Rieux, K. Roads and Landslides in Nepal: How Development Affects Environmental Risk. Nat. Hazards Earth Syst. Sci. 2018, 18, 3203–3210. [Google Scholar] [CrossRef]
- Depicker, A.; Jacobs, L.; Mboga, N.; Smets, B.; Van Rompaey, A.; Lennert, M.; Wolff, E.; Kervyn, F.; Michellier, C.; Dewitte, O.; Govers, G. Historical Dynamics of Landslide Risk from Population and Forest-Cover Changes in the Kivu Rift. Nat. Sustain. 2021, 4, 965–974. [Google Scholar] [CrossRef]
- Rentschler, J.; Salhab, M.; Jafino, B. A. Flood Exposure and Poverty in 188 Countries. Nat. Commun. 2022, 13(1), 1–11. [Google Scholar] [CrossRef] [PubMed]
- CRED-UNDRR. Human Cost of Disasters: An Overview of the Last 20 Years. 2000–2019. Hum. Cost Disasters 2020. [CrossRef]
- Otto, F. E. L.; Raju, E. Harbingers of Decades of Unnatural Disasters. 2023, 1–7. [CrossRef]
- Raju, E.; Boyd, E.; Otto, F. Stop Blaming the Climate for Disasters. Commun. Earth Environ. 2022, 3 (1). [CrossRef]
- Ferrer, J. V.; Samprogna Mohor, G.; Dewitte, O.; Pánek, T.; Reyes-Carmona, C.; Handwerger, A. L.; Hürlimann, M.; Köhler, L.; Teshebaeva, K.; Thieken, A. H.; Tsou, C.; Urgilez Vinueza, A.; Demurtas, V.; Zhang, Y.; Zhao, C.; Marwan, N.; Kurths, J.; Korup, O. Human Settlement Pressure Drives Slow-Moving Landslide Exposure. Earth’s Future. 2024, 12. [CrossRef]
- Merz, B.; Blöschl, G.; Vorogushyn, S.; Dottori, F.; Aerts, J. C. J. H.; Bates, P.; Bertola, M.; Kemter, M.; Kreibich, H.; Upmanu, L.; Macdonald, E. Causes, Impacts and Patterns of Disastrous River Floods. Nat. Rev. Earth Environ. 2021, 2, 592–609. [Google Scholar] [CrossRef]
- Muñoz-Torrero Manchado, A.; Allen, S.; Ballesteros-Cánovas, J. A.; Dhakal, A.; Dhital, M. R.; Stoffel, M. Three Decades of Landslide Activity in Western Nepal: New Insights into Trends and Climate Drivers. Landslides 2021, 18, 2001–2015. [Google Scholar] [CrossRef]
- Monsieurs, E. , Kirschbaum, D.B., Thiery, W., van Lipzig, N., Kervyn, M., Demoulin, A., *Jacobs, L., Kervyn, F., Dewitte, O., 2017. Constraints on Landslide-Climate Research Imposed by the Reality of Fieldwork in Central Africa. In: De Graff, J. V., Shakoor, A. (eds.), 3rd North American Symposium on Landslides: Landslides: Putting Experience, Knowledge, and Emerging Technologies into Practice. Association of Environmental & Engineering Geologists (AEG), pp. 158–168. ISBN 978-0-9897253-7-8.
- Juang, C. S.; Stanley, T. A.; Kirschbaum, D. B. Using Citizen Science to Expand the Global Map of Landslides: Introducing the Cooperative Open Online Landslide Repository (COOLR). PLoS One 2019, 14(7), 1–28. [Google Scholar] [CrossRef]
- Schlögl, M.; Fuchs, S.; Scheidl, C.; Heiser, M. Trends in Torrential Flooding in the Austrian Alps: A Combination of Climate Change, Exposure Dynamics, and Mitigation Measures. Clim. Risk Manag. 2021, 32, 100294. [Google Scholar] [CrossRef]
- Nyssen, J.; Poesen, J.; Veyret-Picot, M.; Moeyersons, J.; Haile, M.; Deckers, J.; Dewit, J.; Naudts, J.; Teka, K.; Govers, G. Assessment of Gully Erosion Rates through Interviews and Measurements: A Case Study from Northern Ethiopia. Earth Surf. Process. Landforms 2006, 31(2), 167–185. [Google Scholar] [CrossRef]
- McCall, M. K. Participatory Mapping and Participatory GIS (PGIS) for CRA, Community DRR and Hazard Assessment; 2008. [CrossRef]
- Solecka, I.; Krajewski, P.; Krzyżanek, A.; Garczyńska, A. Citizens’ Perceptions of Landscape Changes and Their Driving Forces: Evidence from Poland. Int. J. Environ. Res. Public Health 2022, 19 (3). [CrossRef]
- Barclay, J.; Robertson, R.; Armijos, M. T. Scientists as Storytellers: The Explanatory Power of Stories Told about Environmental Crises. Nat. Hazards Earth Syst. Sci. 2023, 23(11), 3603–3615. [Google Scholar] [CrossRef]
- Young, N. E.; Evangelista, P. H.; Mengitsu, T.; Leisz, S. Twenty-Three Years of Forest Cover Change in Protected Areas under Different Governance Strategies: A Case Study from Ethiopia’s Southern Highlands. Land use policy 2020, 91 (December 2019), 104426. [Google Scholar] [CrossRef]
- Kubwimana, D.; Ait Brahim, L.; Nkurunziza, P.; Dille, A.; Depicker, A.; Nahimana, L.; Abdelouafi, A.; Dewitte, O. Characteristics and Distribution of Landslides in the Populated Hillslopes of Bujumbura, Burundi. Geosci. 2021, 11, 259. [Google Scholar] [CrossRef]
- Riquelme, A.; Del Soldato, M.; Tomás, R.; Cano, M.; Jordá Bordehore, L.; Moretti, S. Digital Landform Reconstruction Using Old and Recent Open Access Digital Aerial Photos. Geomorphology 2019, 329, 206–223. [Google Scholar] [CrossRef]
- Luino, F.; Gizzi, F. T.; Palmieri, W.; Porfido, S.; Turconi, L. Historical Memory as an Effective and Useful Tool for Proper Land Use Planning: Lessons Learnt from Some Italian Cases. Land 2023, 12 (9). [CrossRef]
- Depicker, A.; Govers, G.; Jacobs, L.; Vanmaercke, M.; Uwihirwe, J.; Campforts, B.; Kubwimana, D.; Maki Mateso, J.-C.; Mugaruka Bibentyo, T.; Nahimana, L.; Smets, B.; Dewitte, O. Mobilization Rates of Landslides in a Changing Tropical Environment: 60-Year Record over a Large Region of the East African Rift. Geomorphology 2024, 454, 109156. [Google Scholar] [CrossRef]
- Flicker, S.; Campo, P. O.; Monchalin, R.; Thistle, J.; Worthington, C.; Masching, R.; Guta, A.; Pooyak, S.; Whitebird, W.; Thomas, C. Research Done in “A Good Way”: The Importance of Indigenous Elder Involvement in HIV Community-Based. 2015, 105 (6), 1149–1154. [CrossRef]
- Lawrence, M. G.; Williams, S.; Nanz, P.; Renn, O. Characteristics, Potentials, and Challenges of Transdisciplinary Research. One Earth 2022, 5(1), 44–61. [Google Scholar] [CrossRef]
- Richardson, D. Reconstructing a Community with Oral History. Oral Hist. Rev. 2002, 29(2), 97–102. [Google Scholar] [CrossRef]
- Moezzi, M.; Janda, K. B.; Rotmann, S. Using Stories, Narratives, and Storytelling in Energy and Climate Change Research. Energy Res. Soc. Sci. 2017, 31 (May), 1–10. [Google Scholar] [CrossRef]
- Turyahabwe, N.; Banana, A. Y. An Overview of History and Development of Forest Policy and Legislation in Uganda. Int. For. Rev. 2008, 10(4), 641–656. [Google Scholar] [CrossRef]
- Capitani, C.; Mukama, K.; Mbilinyi, B.; Malugu, I. O.; Munishi, P. K. T.; Burgess, N. D.; Platts, P. J.; Sallu, S. M.; Marchant, R. From Local Scenarios to National Maps: A Participatory Framework for Envisioning the Future of Tanzania. Ecol. Soc. 2016, 21 (3). [CrossRef]
- Gregory, K. Mapping the Landscape of Identity. 2002, 28 (2), 51–71.
- Hordijk, M.; Baud, I. The Role of Research and Knowledge Generation in Collective Action and Urban Governance: How Can Researchers Act as Catalysts? Habitat Int. 2006, 30(3), 668–689. [Google Scholar] [CrossRef]
- Ben Malek, H.; Berna, F.; D’Argembeau, A. Reconstructing the Times of Past and Future Personal Events. Memory 2017, 25(10), 1402–1411. [Google Scholar] [CrossRef]
- Hoffman, M. T.; Rohde, R. F. Rivers Through Time: Historical Changes in the Riparian Vegetation of the Semi-Arid, Winter Rainfall Region of South Africa in Response to Climate and Land Use. J. Hist. Biol. 2011, 44(1), 59–80. [Google Scholar] [CrossRef]
- Bwambale, B.; Nyeko, M.; Sekajugo, J.; Kervyn, M. The Essential Contribution of Indigenous Knowledge to Understanding Natural Hazards and Disaster Risk: Historical Evidence from the Rwenzori (Uganda). Nat. Hazards 2021, 110(3), 1847–1867. [Google Scholar] [CrossRef]
- Kanyiginya, V.; Twongyirwe, R.; Kagoro-Rugunda, G.; Sekajugo, J.; Mutyebere, R.; Deijns, A. A. J.; Kervyn, M.; Dewitte, O. Inventories of Natural Hazards in Under-Reported Regions: A Multi-Method Insight from a Tropical Mountainous Landscape. African Geogr. Rev. 2024, 43, 827–846. [Google Scholar] [CrossRef]
- Nseka, D.; Mugagga, F.; Opedes, H.; Ayesiga, P.; Wasswa, H.; Mugume, I.; Nimusiima, A.; Nalwanga, F. The Damage Caused by Landslides in Socio-Economic Spheres within the Kigezi Highlands of southwestern Uganda. Environ. Socio-Economic Stud. 2021, 9 (1), 23–34. [CrossRef]
- UBOS. Statistical Abstract 2022. Uganda Bur. Stat. Stat. 2022, 1–336.
- UBOS. National Population and Housing Census. Main Report. Uganda Bur. Stat. 2024, No. October, 73 pp.
- Bagoora, F. D. Soil Erosion and Mass Wasting Risk in the Highland Area of Uganda Author (s): Festus D.K. Bagoora Source: Mountain Research and Development, May - Aug., 1988, Vol. 8, No. 2 / 3, African Mountains and Highlands ( May - Aug., 1988 ), Pp. 173-. 1988, 8 (2), 173–182.
- Carswell, G. Farmers and Fallowing: Agricultural Change in Kigezi District, Uganda. Geogr. J. 2002, 168(2), 130–140. [Google Scholar] [CrossRef]
- Twongyirwe, R.; Majaliwa, J.; Ebanyat, P.; Tenywa, M.; Sheil, D.; Heist, M.; Oluka, M.; Kumar, L. Dynamics of Forest Cover Conversion in and around Bwindi Impenetrable Forest, Southwestern Uganda. J. Appl. Sci. Environ. Manag. 2011, 15 (1). [CrossRef]
- Mwanjalolo, M. G. J.; Bernard, B.; Paul, M. I.; Joshua, W.; Sophie, K.; Cotilda, N.; Bob, N.; John, D.; Edward, S.; Barbara, N. Assessing the Extent of Historical, Current, and Future Land Use Systems in Uganda. Land 2018, 7(4), 1–17. [Google Scholar] [CrossRef]
- Monsieurs, E.; Jacobs, L.; Michellier, C.; Basimike Tchangaboba, J.; Bamulezi Ganza, G.; Kervyn, F.; Maki Mateso, J. C.; Mugaruka Bibentyo, T.; Kalikone Buzera, C.; Nahimana, L.; Ndayisenga, A.; Nkurunziza, P.; Thiery, W.; Demoulin, A.; Kervyn, M.; Dewitte, O. Landslide Inventory for Hazard Assessment in a Data-Poor Context: A Regional-Scale Approach in a Tropical African Environment. Landslides 2018, 15, 2195–2209. [Google Scholar] [CrossRef]
- OPM. National Vulnerability and Risk Atlas of Uganda, Vol.1.; OPM, Ed.; Kampala, 2019.
- Nseka, D.; Kakembo, V.; Bamutaze, Y.; Mugagga, F. Analysis of Topographic Parameters Underpinning Landslide Occurrence in Kigezi Highlands of Southwestern Uganda. Nat. Hazards 2019, 99(2), 973–989. [Google Scholar] [CrossRef]
- Atkinson, R.; Flint, J. Accessing Hidden and Hard-to-Reach Populations: Snowball Research Strategies. Soc. Res. Updat. 2001.
- Carter, N.; Bryant-Lukosius, D.; DiCenso, A.; Blythe, J.; Neville, A. J. The Use of Triangulation in Qualitative Research. Oncol. Nurs. Forum 2014, 41(5), 545–547. [Google Scholar] [CrossRef]
- Rocchio, F. J. Assessing Ecological Condition of Headwater Wetlands in the Southern Rocky Mountains Using a Vegetation Index of Biotic Integrity. Prepared for U.S. Environmental Protection Agency, Region 8 and Colorado Department of Natural Resources, Denver, CO. 2007, No. 07. 20 January. [CrossRef]
- Ibsen, M.-L.; Denys, B. The Nature, Use and Problems of Historical Archives for the Temporal Occurrence of Landslides, with Specific Reference to the South Coast of Britain, Ventnor, Isle of Wight. Geomorphology 1996, 15 (3–4), 241–258. [CrossRef]
- Ngologoza, P. Kigezi and Its People; Translation of Kigezi n’abantu Baamwo; East African Literature Bureau, Dar es Salaam, 1969.
- Purseglove, J. W. Land Use in the Over-Populated Areas of Kabale, Kigezi District, Uganda. East African Agric. J. 1946, 12(1), 3–10. [Google Scholar] [CrossRef]
- Denoon, D. A History of Kigezi in South-West Uganda; The National Trust. Adult Education Centre: Kampala Uganda, 1972. [Google Scholar]
- Department of Geology. Geological Map of Uganda. Geological Survey and Mines Department.: Entebbe 2012.
- Teitelbaum, L.; Ginsburg, M. L.; Hopkins, R. W. Cognitive and Behavioural Impairment among Elderly People in Institutions Providing Different Levels of Care. Cmaj 1991, 144(2), 169–173. [Google Scholar]
- Bill, A.; Mark, I. Community Conservation Research in Africa: Principles and Comparative Practice. Working Papers. Community Conservation at Mgahinga Gorilla National Park, Uganda.; 1 90251814; Manchester, 1998.
- Swetnam, T. W.; Allen, C. D.; Betancourt, J. L. Applied Historical Ecology: Using the Past to Manage for the Future. Ecol. Appl. 1999, 9(4), 1189–1206. [Google Scholar] [CrossRef]
- Oliva, A.; Olcina, J. Historical Floods and Territorial Planning: Lessons Learned and Opportunities Lost after the Santa Teresa Flood (1879) in the Segura Basin (Spain). Land 2024, 13 (1). [CrossRef]
- Blahut, J.; van Westen, C. J.; Sterlacchini, S. Analysis of Landslide Inventories for Accurate Prediction of Debris-Flow Source Areas. Geomorphology 2010. [CrossRef]
- UNDRR. Uganda profile of landslide and flood events in the Kigezi region. DesInventar database. DesInventar Sendai. https://www.desinventar.net.
- Hong, Y.; Alder, R.; Huffman, G. Evaluation of the Potential of NASA Multi-Satellite Precipitation Analysis in Global Landslide Hazard Assessment. Geophys. Res. Lett. 2006, 33(22), 1–5. [Google Scholar] [CrossRef]
- Lathouwers, E.; Segers, Y.; Verstraeten, G. Reconstructing Valley Landscapes. GIS-Analyses of Past Land Use Changes in Three Flemish River Valleys since the Late 18th Century. Land use policy 2023, 135 (May), 106960. [CrossRef]
- Bonney, R.; Phillips, T. B.; Ballard, H. L.; Enck, J. W. Can Citizen Science Enhance Public Understanding of Science? Sci. 2016, 25(1), 2–16. [Google Scholar] [CrossRef]
- Jacobs, L.; Kabaseke, C.; Bwambale, B.; Katutu, R.; Dewitte, O.; Mertens, K.; Maes, J.; Kervyn, M. The Geo-Observer Network: A Proof of Concept on Participatory Sensing of Disasters in a Remote Setting. Sci. Total Environ. 2019, 670, 245–261. [Google Scholar] [CrossRef]
- Sekajugo, J.; Kagoro-Rugunda, G.; Mutyebere, R.; Kabaseke, C.; Namara, E.; Dewitte, O.; Kervyn, M.; Jacobs, L. Can Citizen Scientists Provide a Reliable Geo- Hydrological Hazard Inventory? Environ. Res. Lett. 2022, 17. [Google Scholar] [CrossRef]
- Jack, F.; Friedman, W.; Reese, E.; Zajac, R. Age-Related Differences in Memory for Time, Temporal Reconstruction, and the Availability and Use of Temporal Landmarks. Cogn. Dev. 2016, 37, 53–66. [Google Scholar] [CrossRef]
- Friedman, W. J.; Wilkins, A. J. Scale Effects in Memory for the Timeof Events. Mem. Cognit. 1985, 13(2), 168–175. [Google Scholar] [CrossRef]
- Baydala, L.; Worrell, S.; Fletcher, F.; Letendre, S.; Letendre, L.; Ruttan, L. “Making a Place of Respect”: Lessons Learned in Carrying out Consent Protocol with First Nations Elders. Prog Community Heal. Partnersh 2013, 7(2), 135–143. [Google Scholar] [CrossRef]
- Andrews, G. J.; Kearns, R. A.; Kontos, P.; Wilson, V. “Their Finest Hour”: Older People, Oral Histories, and the Historical Geography of Social Life. Soc. Cult. Geogr. 2006, 7(2), 153–177. [Google Scholar] [CrossRef]
- Arazy, O.; Malkinson, D. A Framework of Observer-Based Biases in Citizen Science Biodiversity Monitoring: Semi-Structuring Unstructured Biodiversity Monitoring Protocols. 2021, 9 (July), 1–13. [CrossRef]
- Nsabimana, J.; Henry, S.; Ndayisenga, A.; Kubwimana, D.; Dewitte, O.; Kervyn, F.; Michellier, C. Geo-Hydrological Hazard Impacts, Vulnerability and Perception in Bujumbura (Burundi): A High-Resolution Field-Based Assessment in a Sprawling City. Land 2023, 12, 1876. [Google Scholar] [CrossRef]
- Corominas, J.; Westen, C. Van; Frattini, P.; Cascini, L.; Fotopoulou, S.; Catani, F.; Eeckhaut, M. Van Den; Mavrouli, O.; Agliardi, F.; Pitilakis, K.; Winter, M. G.; Pastor, M.; Ferlisi, S.; Tofani, V.; Smith, J. T.; Herva, J.; van Westen, C.; Frattini, P.; Cascini, L.; Malet, J. P.; Fotopoulou, S.; Catani, F.; Van Den Eeckhaut, M.; Mavrouli, O.; Agliardi, F.; Pitilakis, K.; Winter, M. G.; Pastor, M.; Ferlisi, S.; Tofani, V.; Hervás, J.; Smith, J. T. Recommendations for the Quantitative Analysis of Landslide Risk. Bull. Eng. Geol. Environ. 2014, 73(2), 209–263. [Google Scholar] [CrossRef]
- Foody, G. M.; See, L.; Fritz, S.; Van der Velde, M.; Perger, C.; Schill, C.; Boyd, D. S. Assessing the Accuracy of Volunteered Geographic Information Arising from Multiple Contributors to an Internet Based Collaborative Project. Trans. GIS 2013, 17(6), 847–860. [Google Scholar] [CrossRef]
- Mahlangu, M.; Garutsa, T. C. Application of Indigenous Knowledge Systems in Water Conservation and Management: The Case of Khambashe, Eastern Cape South Africa. Acad. J. Interdiscip. Stud. 2014. [CrossRef]
- Kizza, C. L.; Tenywa, M. M.; Majaliwa, J. G. M.; Kansiime, F.; Magunda, M.; Nakileza, B.; Barasa, B.; Gabiri, G.; Sebuliba, E.; Nampijja, J. Land Use/Cover Change Patterns in Highland Ecosystems of Lake Bunyonyi Catchment in Western Uganda. African Crop Sci. J. 2017, 25(1), 43. [Google Scholar] [CrossRef]
- Barasa, B.; Egeru, A.; Patrick, O.; Fridah, M. Dynamics of Land Use/Cover Trends in Kanungu District, South-Western Uganda. J. Appl. Sci. Environ. Manag. 2011, 14 (4). [CrossRef]
- Maki Mateso, J. C.; Bielders, C. L.; Monsieurs, E.; Depicker, A.; Smets, B.; Tambala, T.; Bagalwa Mateso, L.; Dewitte, O. Characteristics and Causes of Natural and Human-Induced Landslides in a Tropical Mountainous Region: The Rift Flank West of Lake Kivu (Democratic Republic of the Congo). Nat. Hazards Earth Syst. Sci. 2023, 23(2), 643–666. [Google Scholar] [CrossRef]
- Wit, M. P. De; Crookes, D. J.; Wilgen, B. W. Van. Conflicts of Interest in Environmental Management: Estimating. Biol. invations 2001, 3 (2001), 167–178.
- Babur, E.; Kara, O.; Fathi, R. A.; Susam, Y. E.; Riaz, M.; Arif, M.; Akhtar, K. Wattle Fencing Improved Soil Aggregate Stability, Organic Carbon Stocks and Biochemical Quality by Restoring Highly Eroded Mountain Region Soil. J. Environ. Manage. 2021, 288 (March), 112489. [Google Scholar] [CrossRef]
- Tesfaw, A.; Alemu, D.; Feyera, S.; Teferi, E. Eucalyptus Succession on Croplands in the Highlands of Northwestern Ethiopia: Economic Impact Analysis Using Farm Household Model. Resources 2022, 71 (11).
- Floodlist. At least 9 Killed in Western Region Flash Floods. https://floodlist.com/africa/uganda-floods-kisoro-january-2022 (accessed 2022-12-22).
- Wang, J.; Deng, Y.; Li, D.; Liu, Z.; Wen, L.; Huang, Z.; Jiang, D.; Lu, Y. Soil Aggregate Stability and Its Response to Overland Flow in Successive Eucalyptus Plantations in Subtropical China. Sci. Total Environ. 2022, 807, 151000. [Google Scholar] [CrossRef]
- Du, W.; Zhang, J.; Chen, H.; Wang, T. Do Ecological Evidences Support Biodiversity Optimizing Roles of Eucalyptus Plantation 4 Forests? preprint; 2022.
- Hartter, J.; Ryan, S. J.; Mackenzie, C. A.; Goldman, A.; Diem, J. E.; Chapman, C. A. Now There Is No Land: A Story of Ethnic Migration in a Protected Area Landscape in Western Uganda. Popul. Environ. 2015, 452–479. [Google Scholar] [CrossRef]
- Cornelis, W.; Waweru, G.; Araya, T. Building Resilience Against Drought and Floods: The Soil-Water Management Perspective. Sustain. Agric. Rev. 2019, 125–142. [Google Scholar] [CrossRef]
- Sidle, R. C.; Bogaard, T. A. Dynamic Earth System and Ecological Controls of Rainfall-Initiated Landslides. Earth-Science Rev. 2016, 159, 275–291. [Google Scholar] [CrossRef]
- Rogger, M.; Agnoletti, M.; Alaoui, A.; Bathurst, J. C.; Bodner, G.; Borga, M.; Chaplot, V.; Gallart, F.; Glatzel, G.; Hall, J.; Holden, J.; Holko, L.; Horn, R.; Kiss, A.; Quinton, J. N.; Leitinger, G.; Lennartz, B.; Parajka, J.; Peth, S.; Robinson, M.; Salinas, J. L.; Santoro, A.; Szolgay, J.; Tron, S.; Viglione, A. Land Use Change Impacts on Floods at the Catchment Scale:Challenges and Opportunities for Future Research. Water Resour. Res. 2016, No. June 2013, 5209–5219. [Google Scholar]
- Schilirò, L.; Cevasco, A.; Esposito, C.; Mugnozza, G. S. Shallow Landslide Initiation on Terraced Slopes: Inferences from a Physically Based Approach. Geomatics, Nat. Hazards Risk 2018, 9 (1), 295–324. [CrossRef]
- Kitutu, M. G.; Muwanga, A.; Poesen, J.; Deckers, J. A. Farmer’s Perception on Landslide Occurrences in Bududa District, Eastern Uganda. African J. Agric. Res. 2011, 6(1), 7–18. [Google Scholar]
- Sibomana, P.; Vanmaercke, M.; Depicker, A.; Tychon, B.; Hubert, A.; Dewitte, O. Effects of Agricultural Terraces on Landslide Occurrence: Insights from a Tropical Mountainous Region. In review, CATENA.
- Srivastava, S.; Basche, A.; Traylor, E.; Roy, T. The Efficacy of Conservation Practices in Reducing Floods and Improving Water Quality. Front. Environ. Sci. 2023, 11, 1–16. [Google Scholar] [CrossRef]
- Sinore, T.; Kissi, E.; Aticho, A. The Effects of Biological Soil Conservation Practices and Community Perception toward These Practices in the Lemo District of Southern Ethiopia. Int. Soil Water Conserv. Res. 2018, 6(2), 123–130. [Google Scholar] [CrossRef]
- Mason, S. C.; Ouattara, K.; Taonda, S. J. B.; Palé, S.; Sohoro, A.; Kaboré, D. Soil and Cropping System Research in Semi-Arid West Africa as Related to the Potential for Conservation Agriculture. Int. J. Agric. Sustain. 2015, 13(2), 120–134. [Google Scholar] [CrossRef]
- Raj, S.; Chaudhary, S.; Ghule, N. S.; Baral, K.; Padhan, S. R.; Gawande, K. N.; Singh, V. Sustainable Farming and Soil Health Enhancement through Millet Cultivation: A Review. Int. J. Plant Soil Sci. 2024, 36(3), 222–233. [Google Scholar] [CrossRef]
- Tellman, B.; Sullivan, J. A.; Kuhn, C.; Kettner, A. J.; Doyle, C. S.; Brakenridge, G. R.; Erickson, T. A.; Slayback, D. A. Satellite Imaging Reveals Increased Proportion of Population Exposed to Floods. Nature 2021, 596(7870), 80–86. [Google Scholar] [CrossRef]
- Tanyaş, H.; Görüm, T.; Kirschbaum, D.; Lombardo, L. Could Road Constructions Be More Hazardous than an Earthquake in Terms of Mass Movement? Hazards 2022. [CrossRef]
- Emberson, R.; Kirschbaum, D.; Stanley, T. Global Connections between El Nino and Landslide Impacts. Nat. Commun. 2021, 12 (1). [CrossRef]
- Nicholson, S. E.; Kim, J. The relationship of the el nino–southern oscillation to african rainfall. Int. J. Climatol. 1997, 17(2), 117–135. [Google Scholar] [CrossRef]
- Marc, O.; Gosset, M.; Saito, H.; Uchida, T.; Malet, J. P. Spatial Patterns of Storm-Induced Landslides and Their Relation to Rainfall Anomaly Maps. Geophys. Res. Lett. 2019, 46(20), 11167–11177. [Google Scholar] [CrossRef]
Figure 2.
Field pictures of the eight watersheds (W1 to W8) illustrating the contrasted topographic and land use /land cover characteristics. Photos taken in September and October 2021.
Figure 2.
Field pictures of the eight watersheds (W1 to W8) illustrating the contrasted topographic and land use /land cover characteristics. Photos taken in September and October 2021.
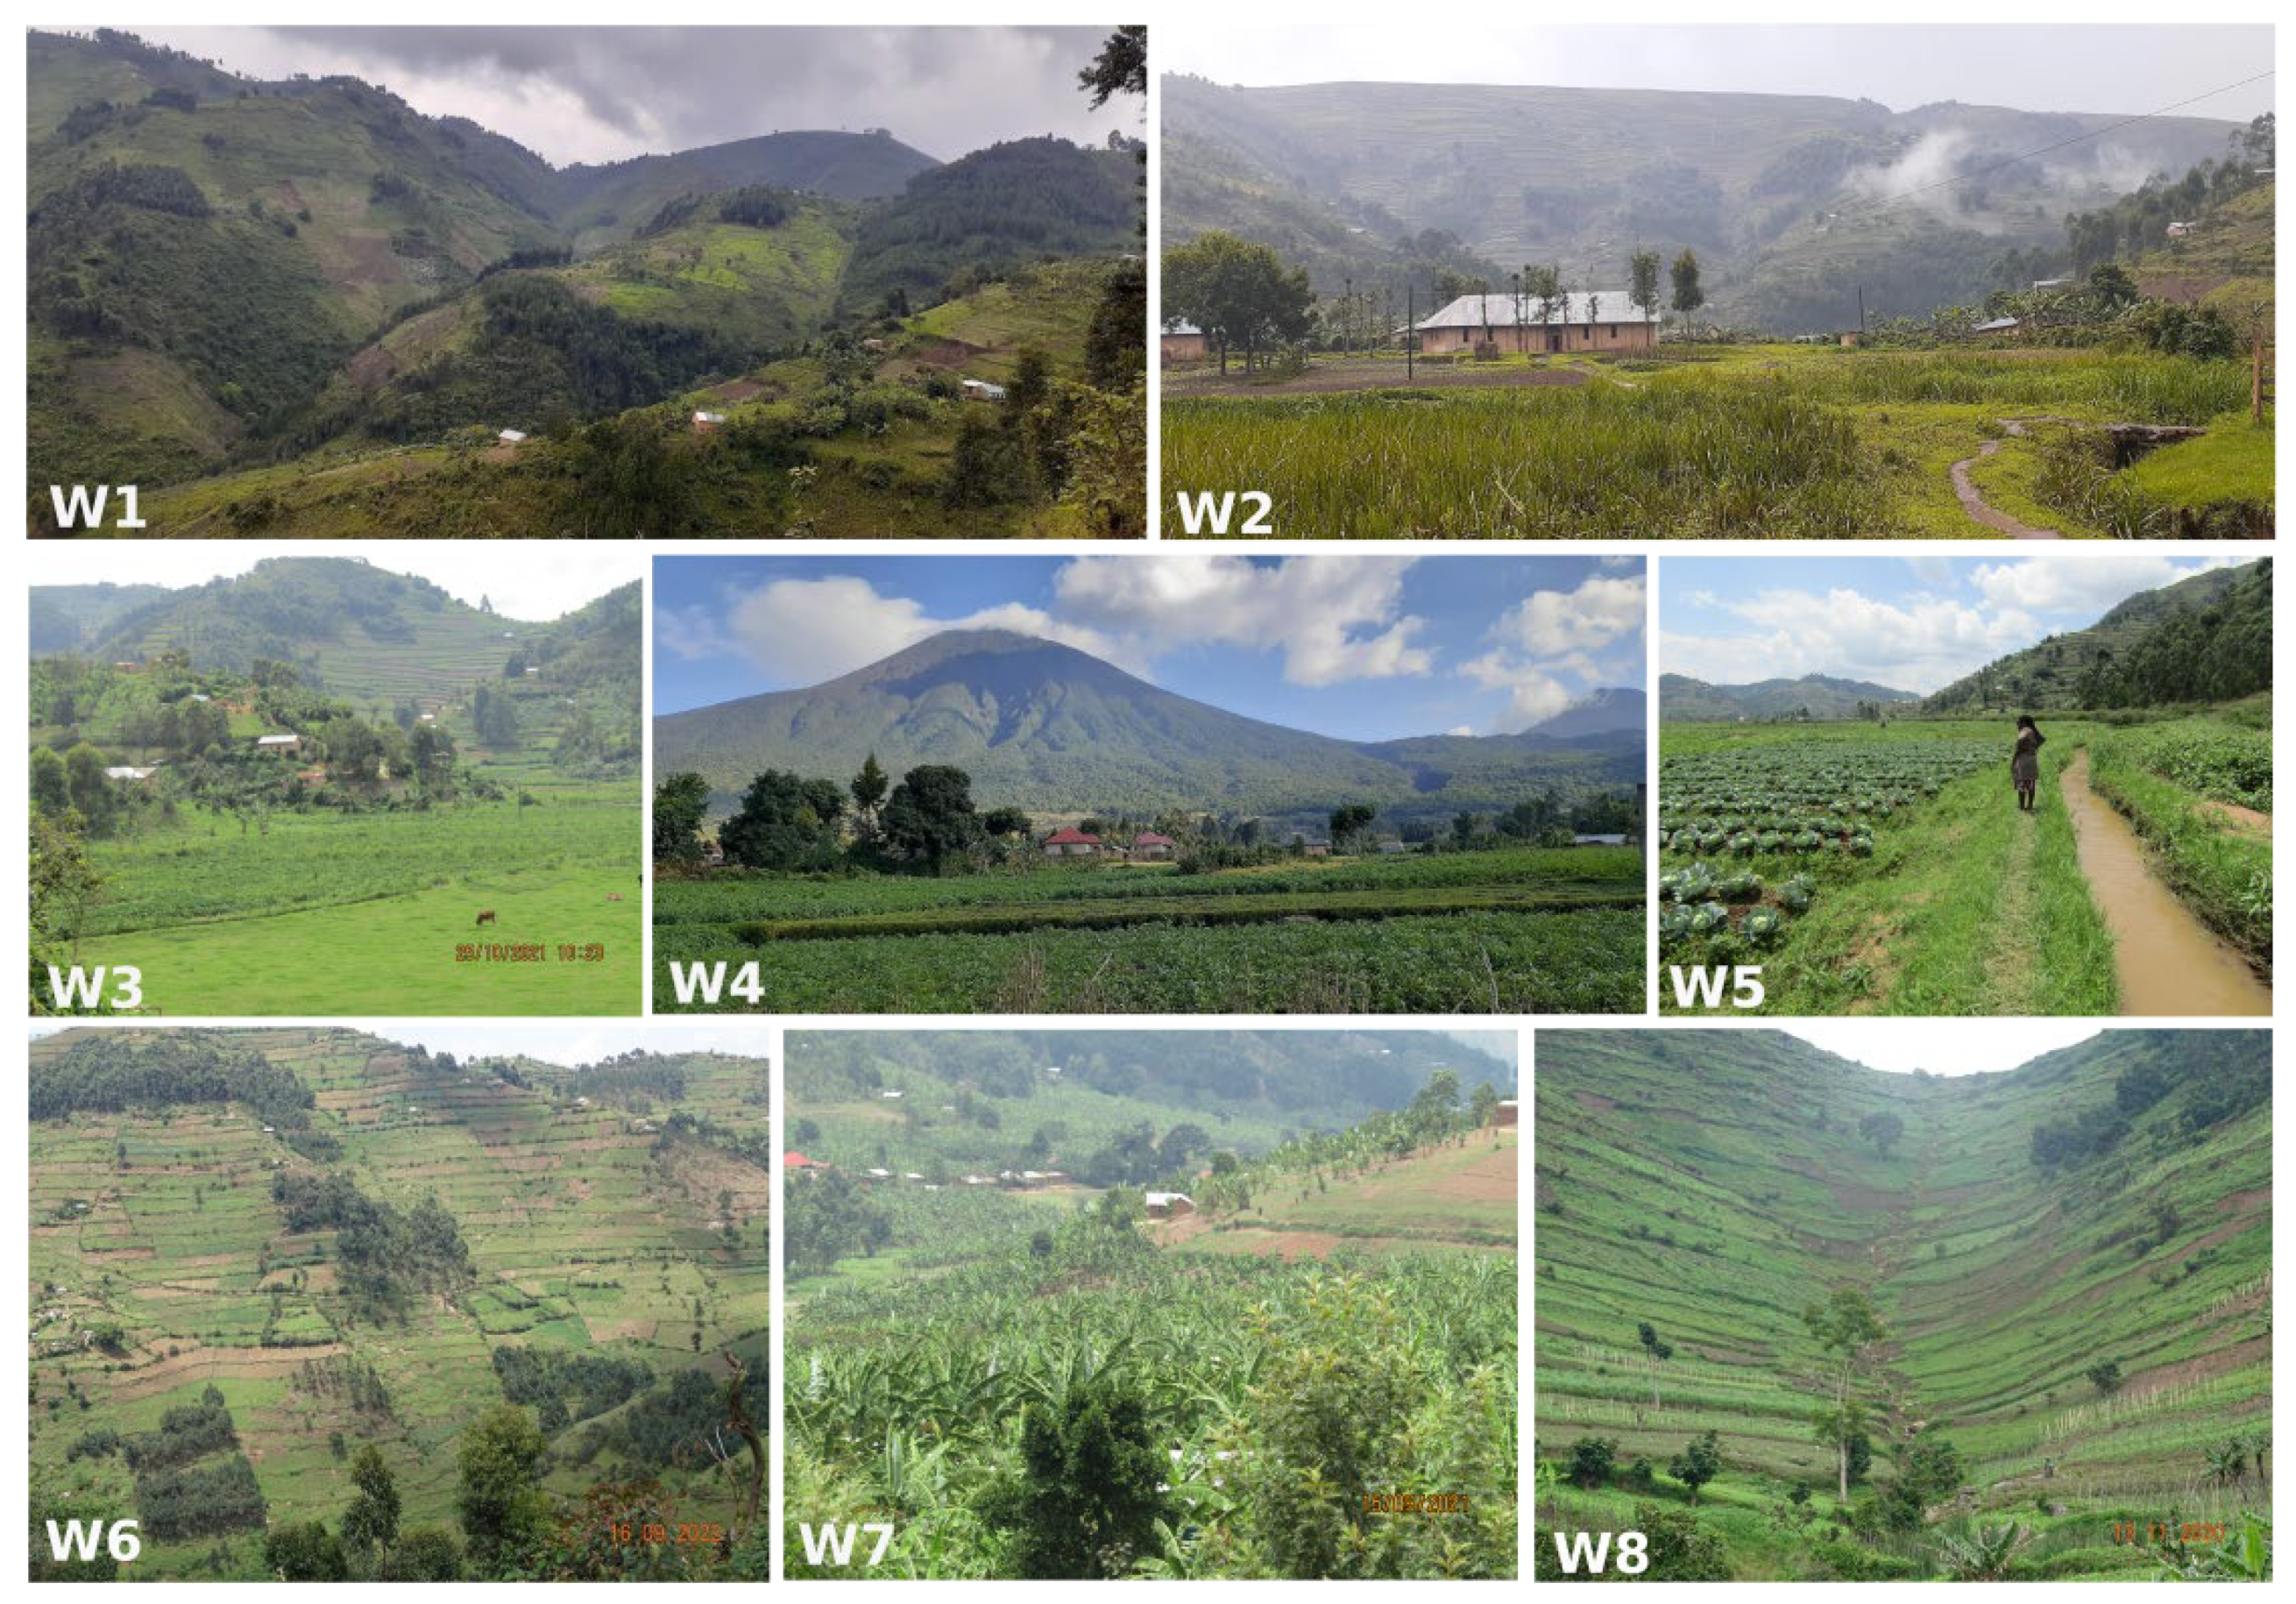
Figure 3.
Interview and participatory mapping with the elderly citizens. a) one of the maps drawn by the elderly citizens during a FGD in W6, showing past (blue marker) and current (red marker) land use and cover. b) and c) participatory mapping during FGDs with elderly citizens in W2 and W5 respectively. d) Individual interview session with an elderly citizen in W8.
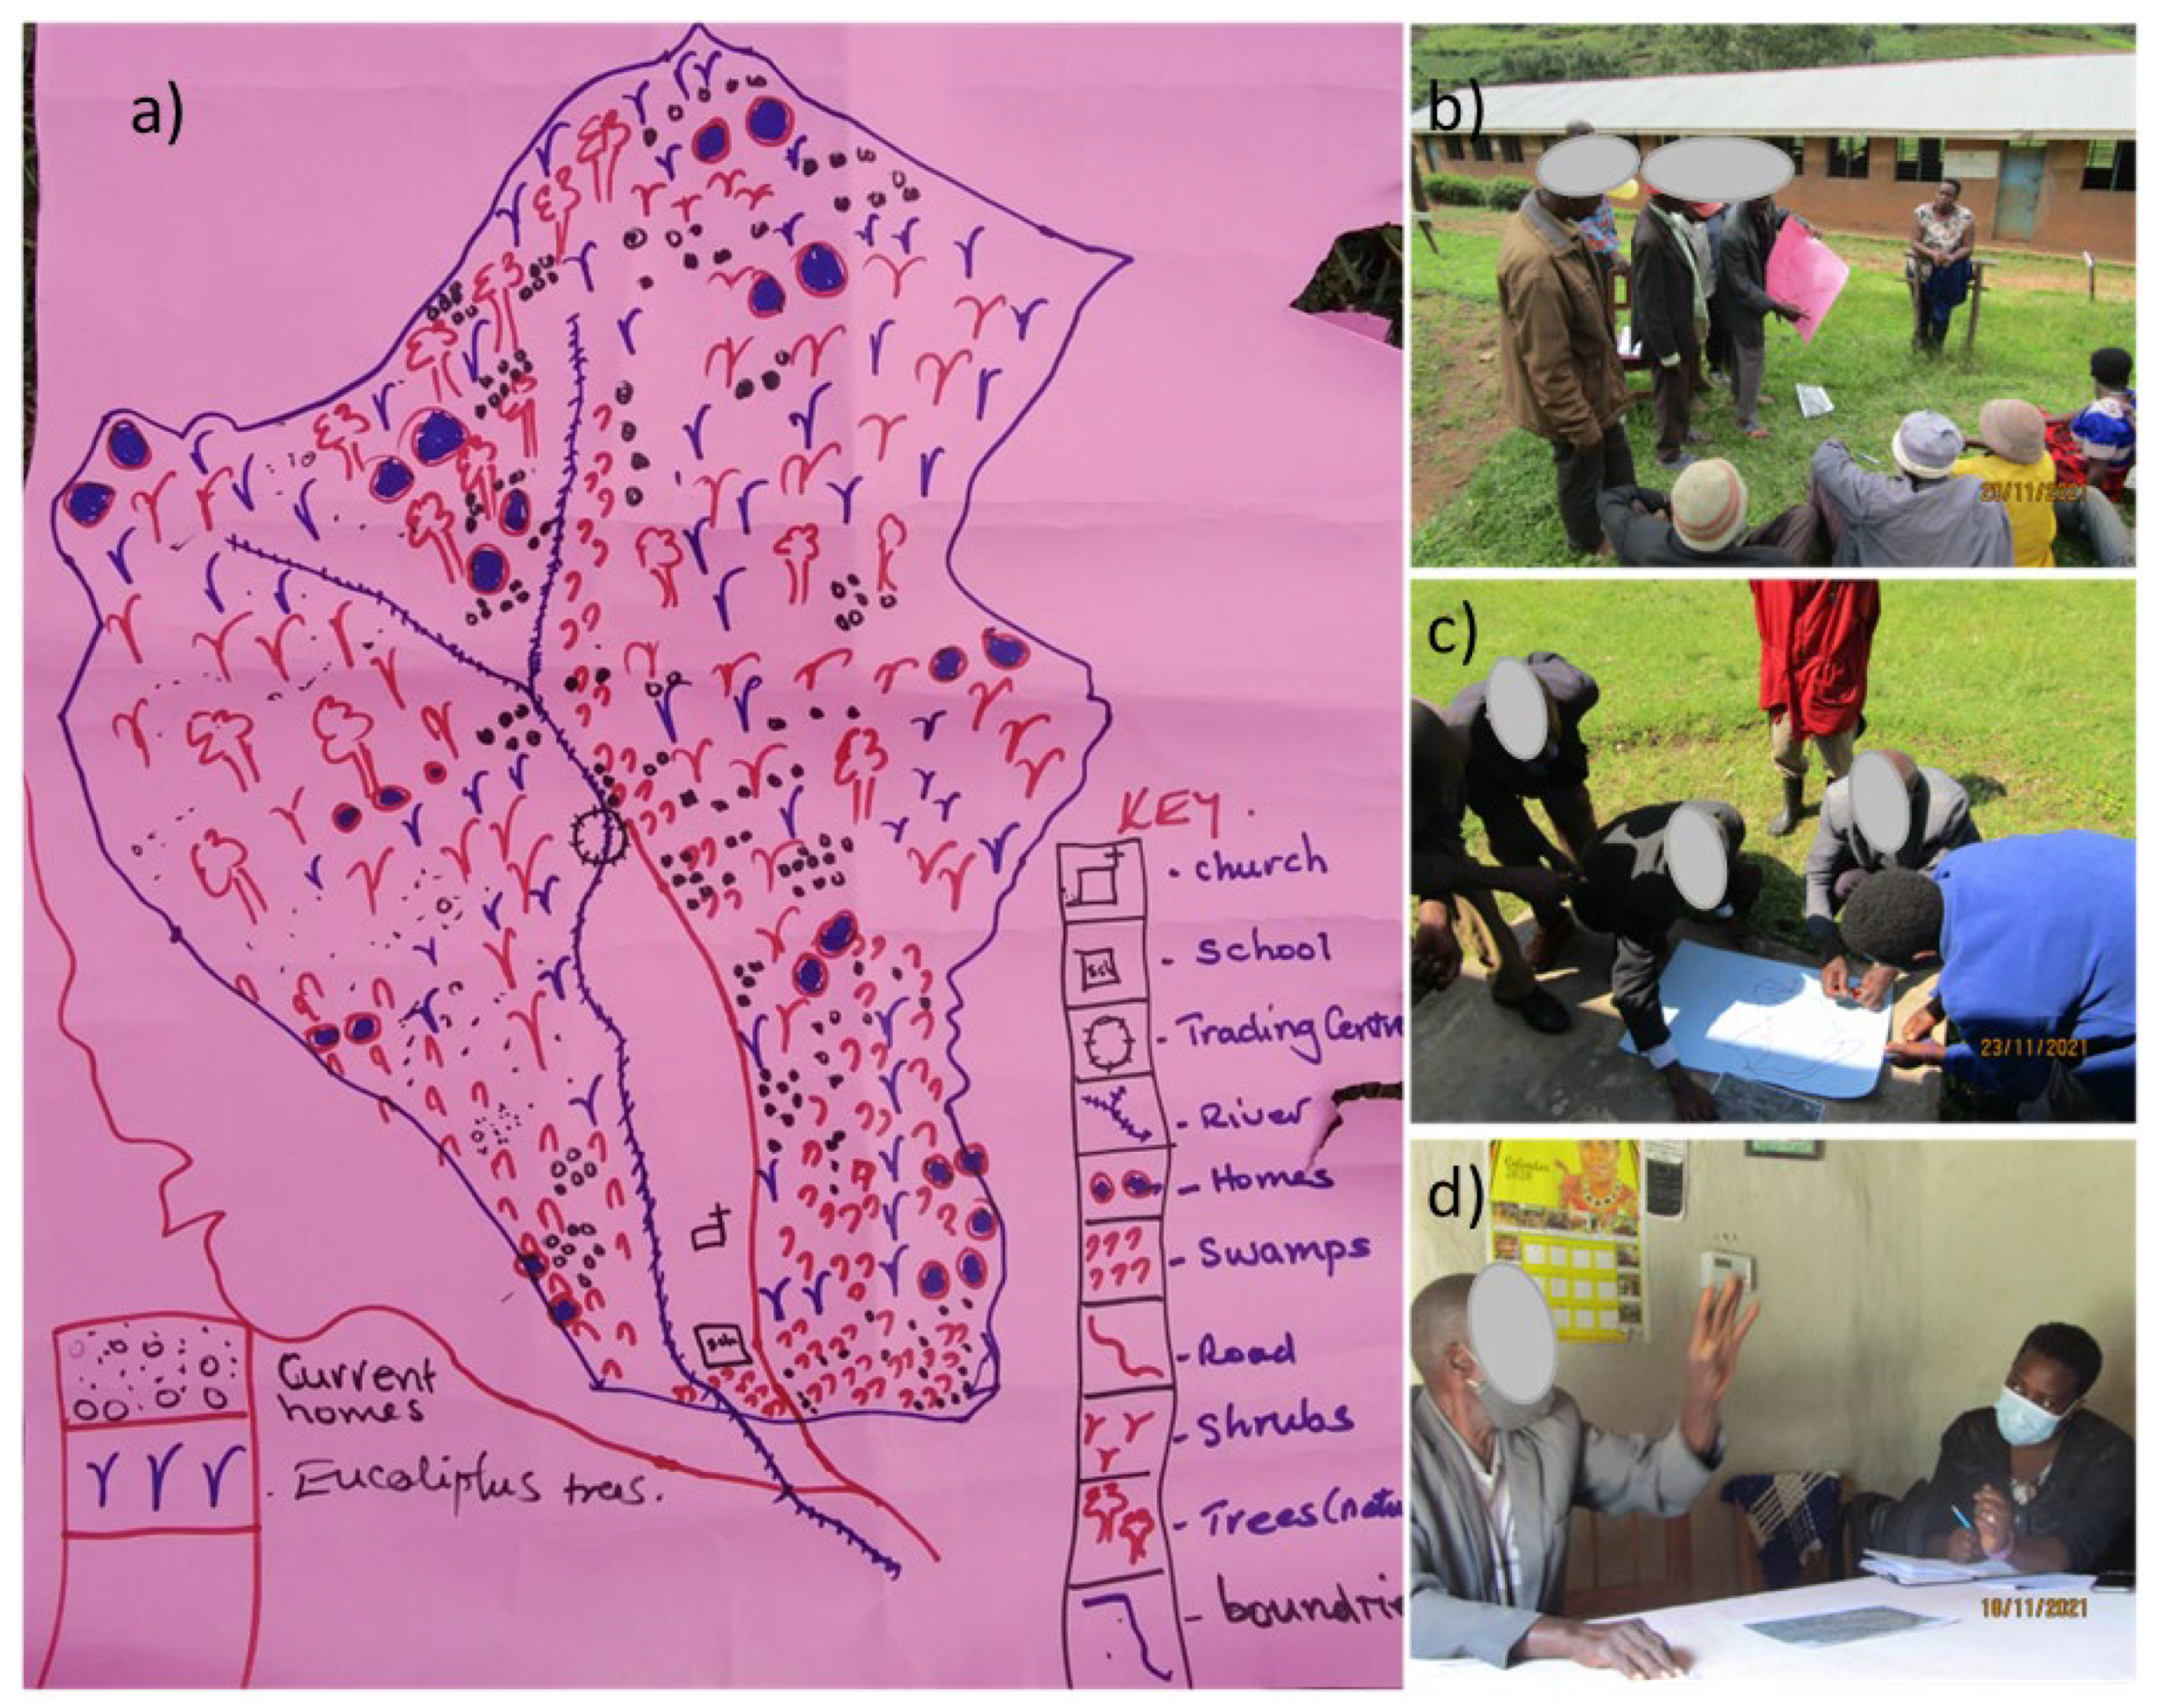
Figure 4.
Timeline of events constructed from elderly interviews. The numbers represent watersheds where a particular event happened. “Natural hazard events” include landslides, floods, and gullies associated with flash flood events. “Deforestation” includes natural tree species that were cut down. “Wetland drainage refers to the reclamation of wetlands for agricultural and construction purposes. “Road and housing development” include the roads that were constructed and change from grass thatched to iron roofed houses. “Resettlement schemes” are the measures implemented to depopulate the region. “Population increase” includes increase in the numbers of both people and livestock, land shortage and overcultivation. “Land laws enforced” includes the land management regulations that were followed during the colonial period. “Land management practices abandoned” include the end of practices such as fallowing, planting of native tree species, contour strip cropping, avoidance of bush burning and stabilizing contours with elephant grass. “Public land to private land ownership” refers to the time when land titling began to be given to individual owners and rights of buying and selling land were established. “Restoration programs” include initiatives that have been done to rehabilitate the degraded landscapes like afforestation, diversion channels and creation of forest buffer zones.
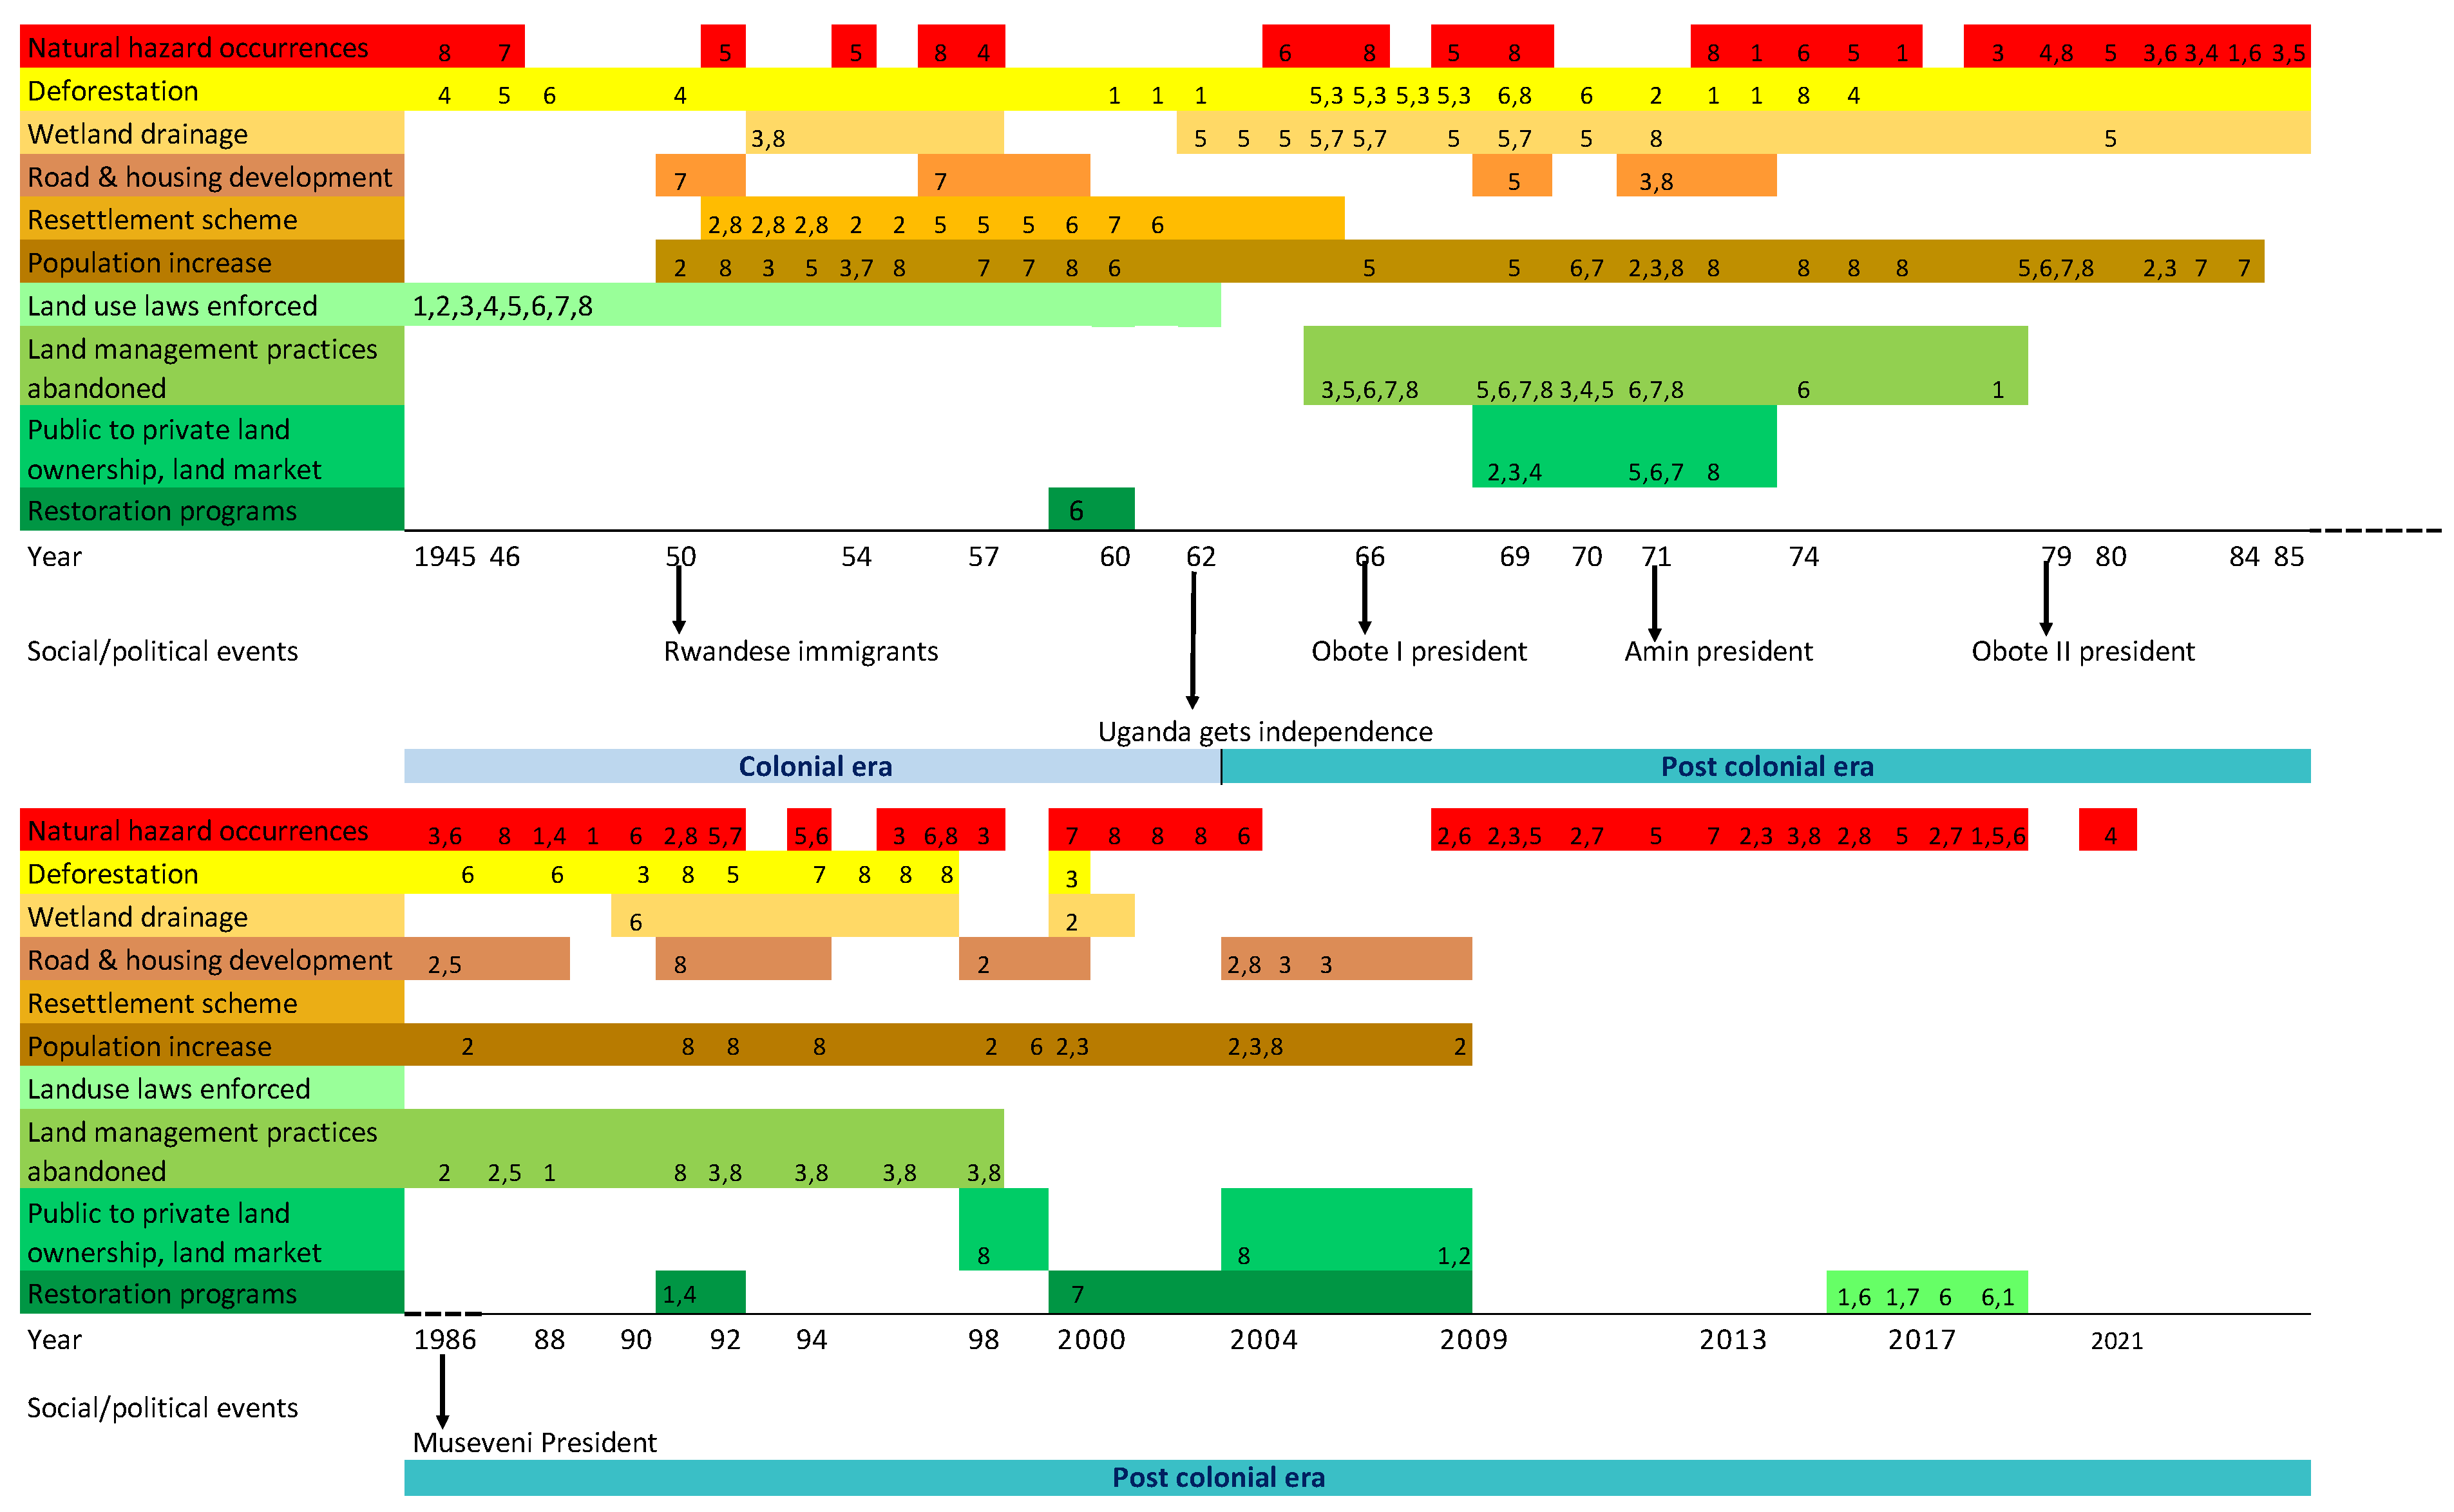
Figure 5.
Temporal trend of natural hazard events recorded for each decade as per the elderly citizens between 1940-2020 and the corresponding median ages of the participants calculated at the centre of each decade.
Figure 5.
Temporal trend of natural hazard events recorded for each decade as per the elderly citizens between 1940-2020 and the corresponding median ages of the participants calculated at the centre of each decade.
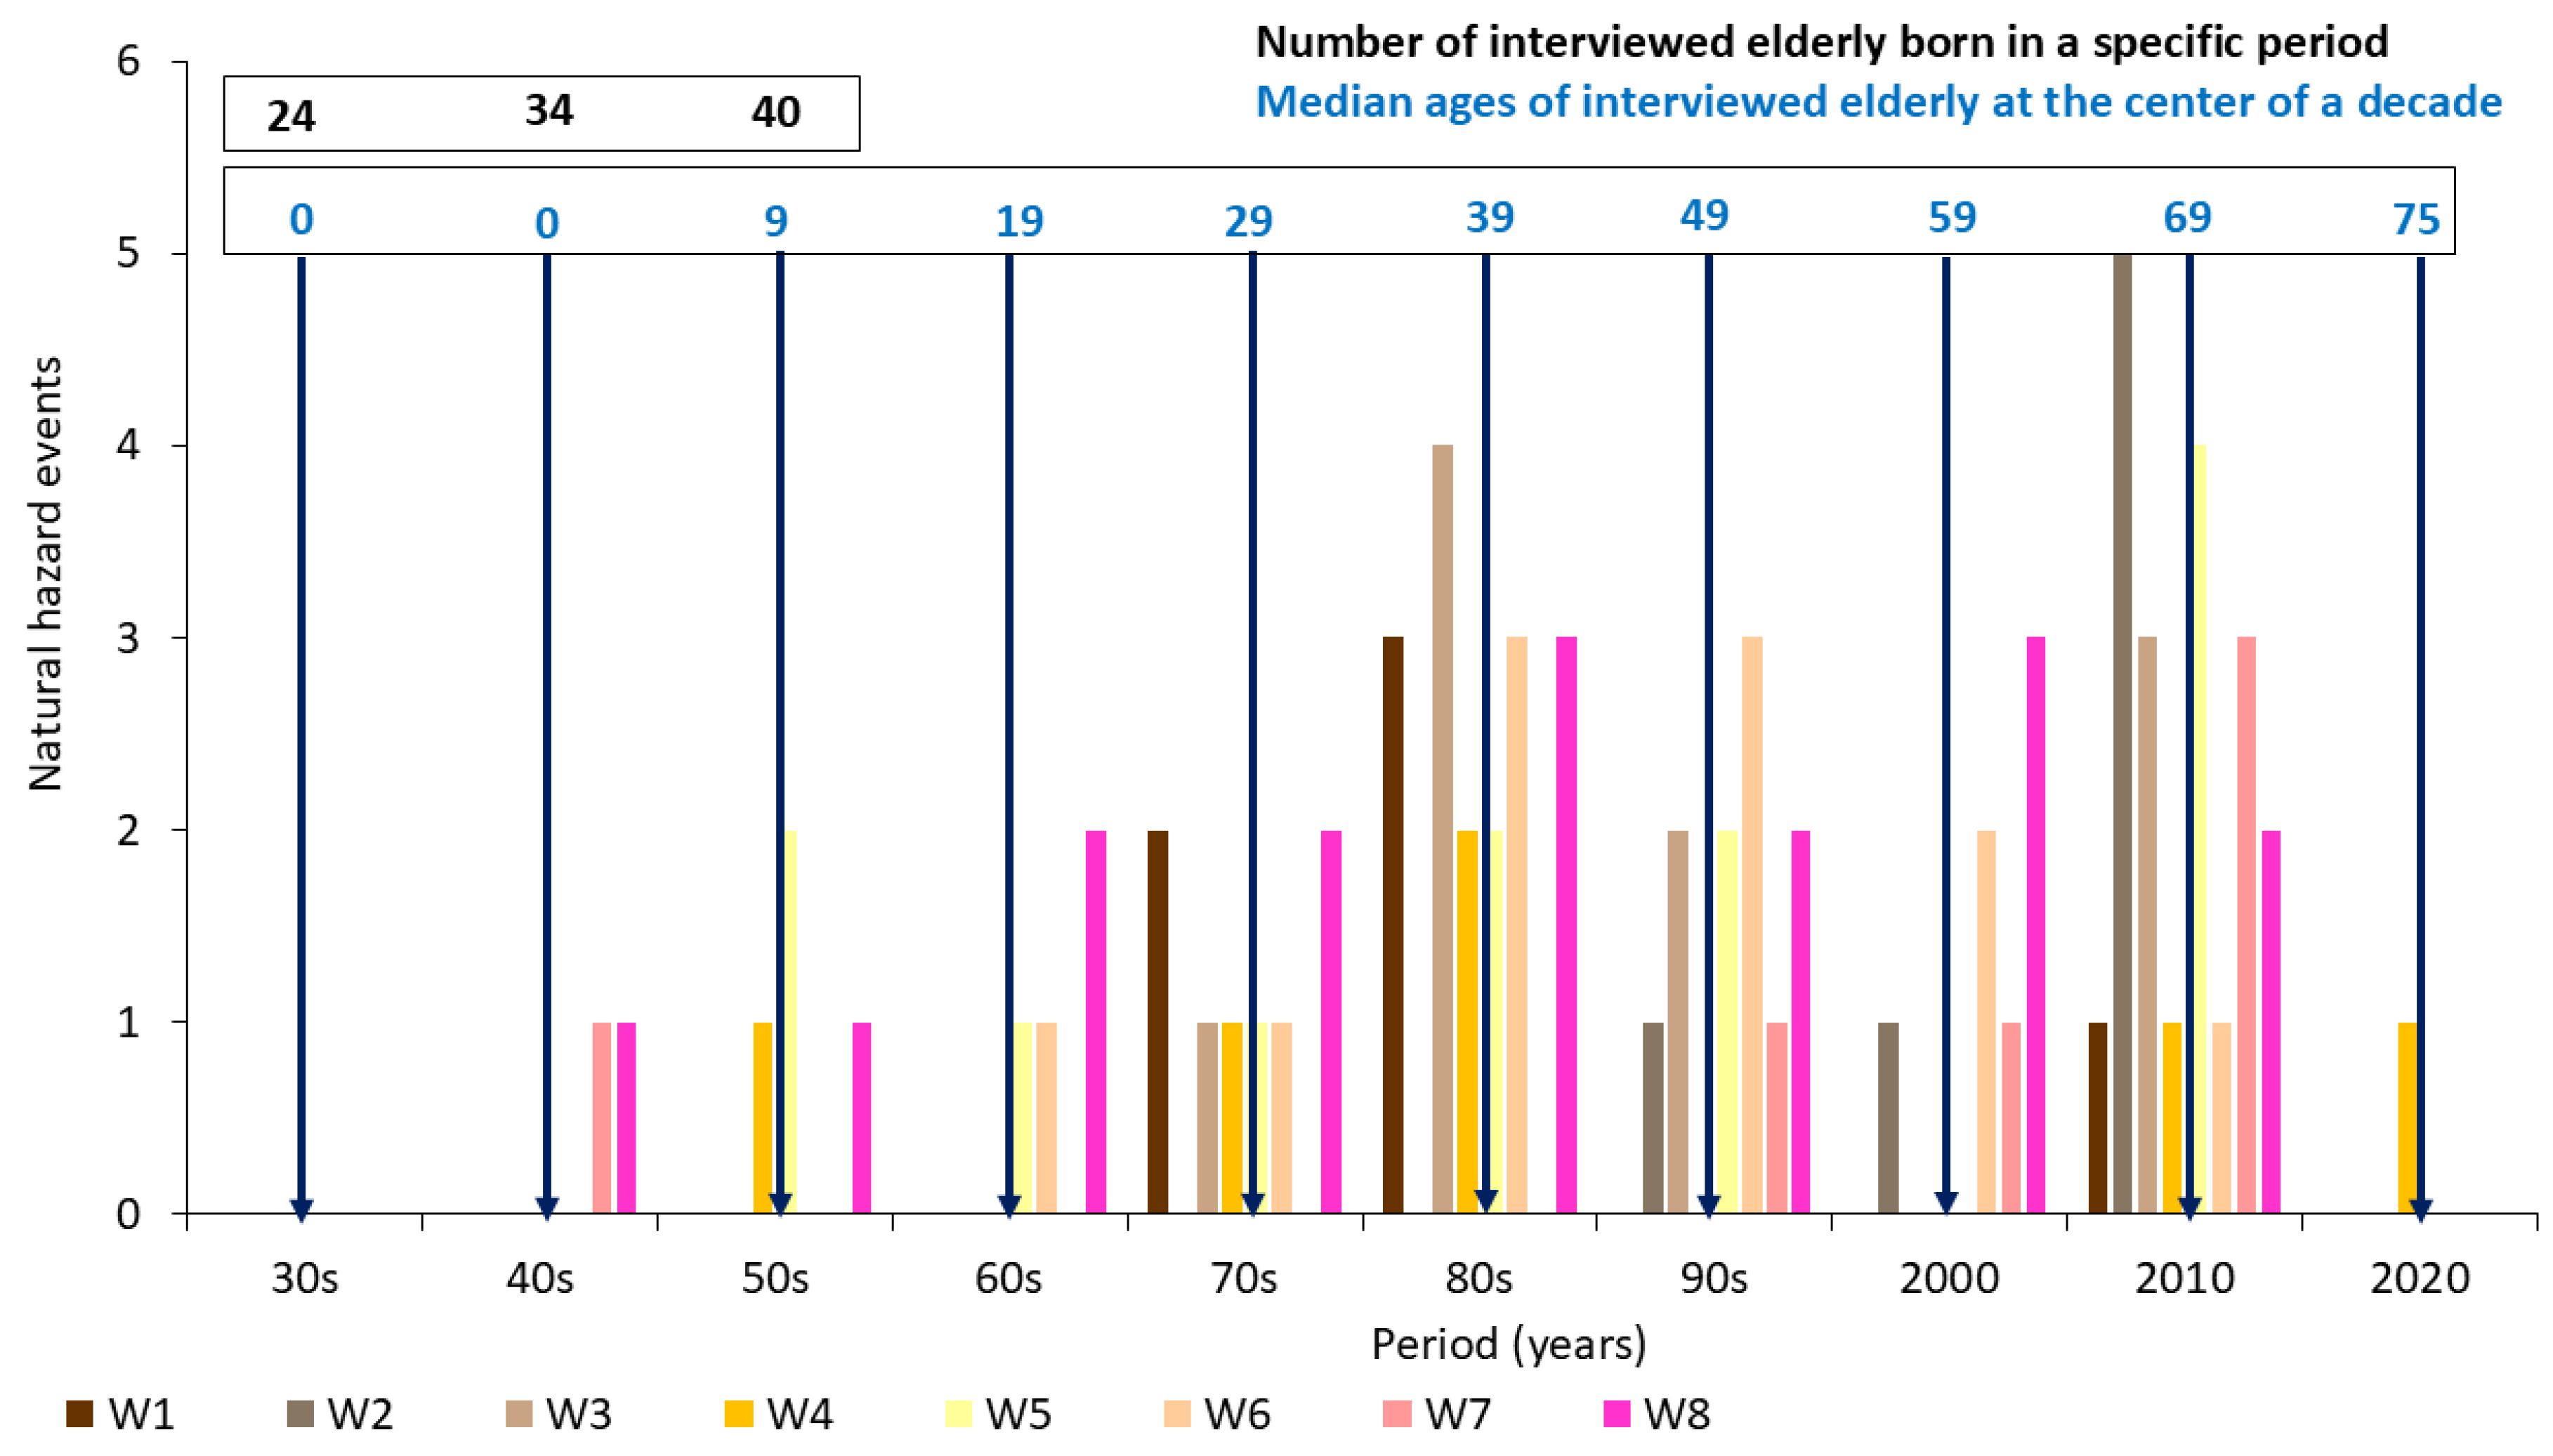
Figure 6.
a) Landslide and flash flood events recorded as per the elderly respondents from 1940-2021. b) Watershed settlement density for 2021 expressed as a ratio of the total area covered by settlements and the total area of the watershed (settlement area was manually extracted from Google Earth imagery 2021). c) Percentage forest cover change between 1954 (historical aerial photographs) and 2021 (Google Earth). Positive values indicate an increase in forest cover since 1954.
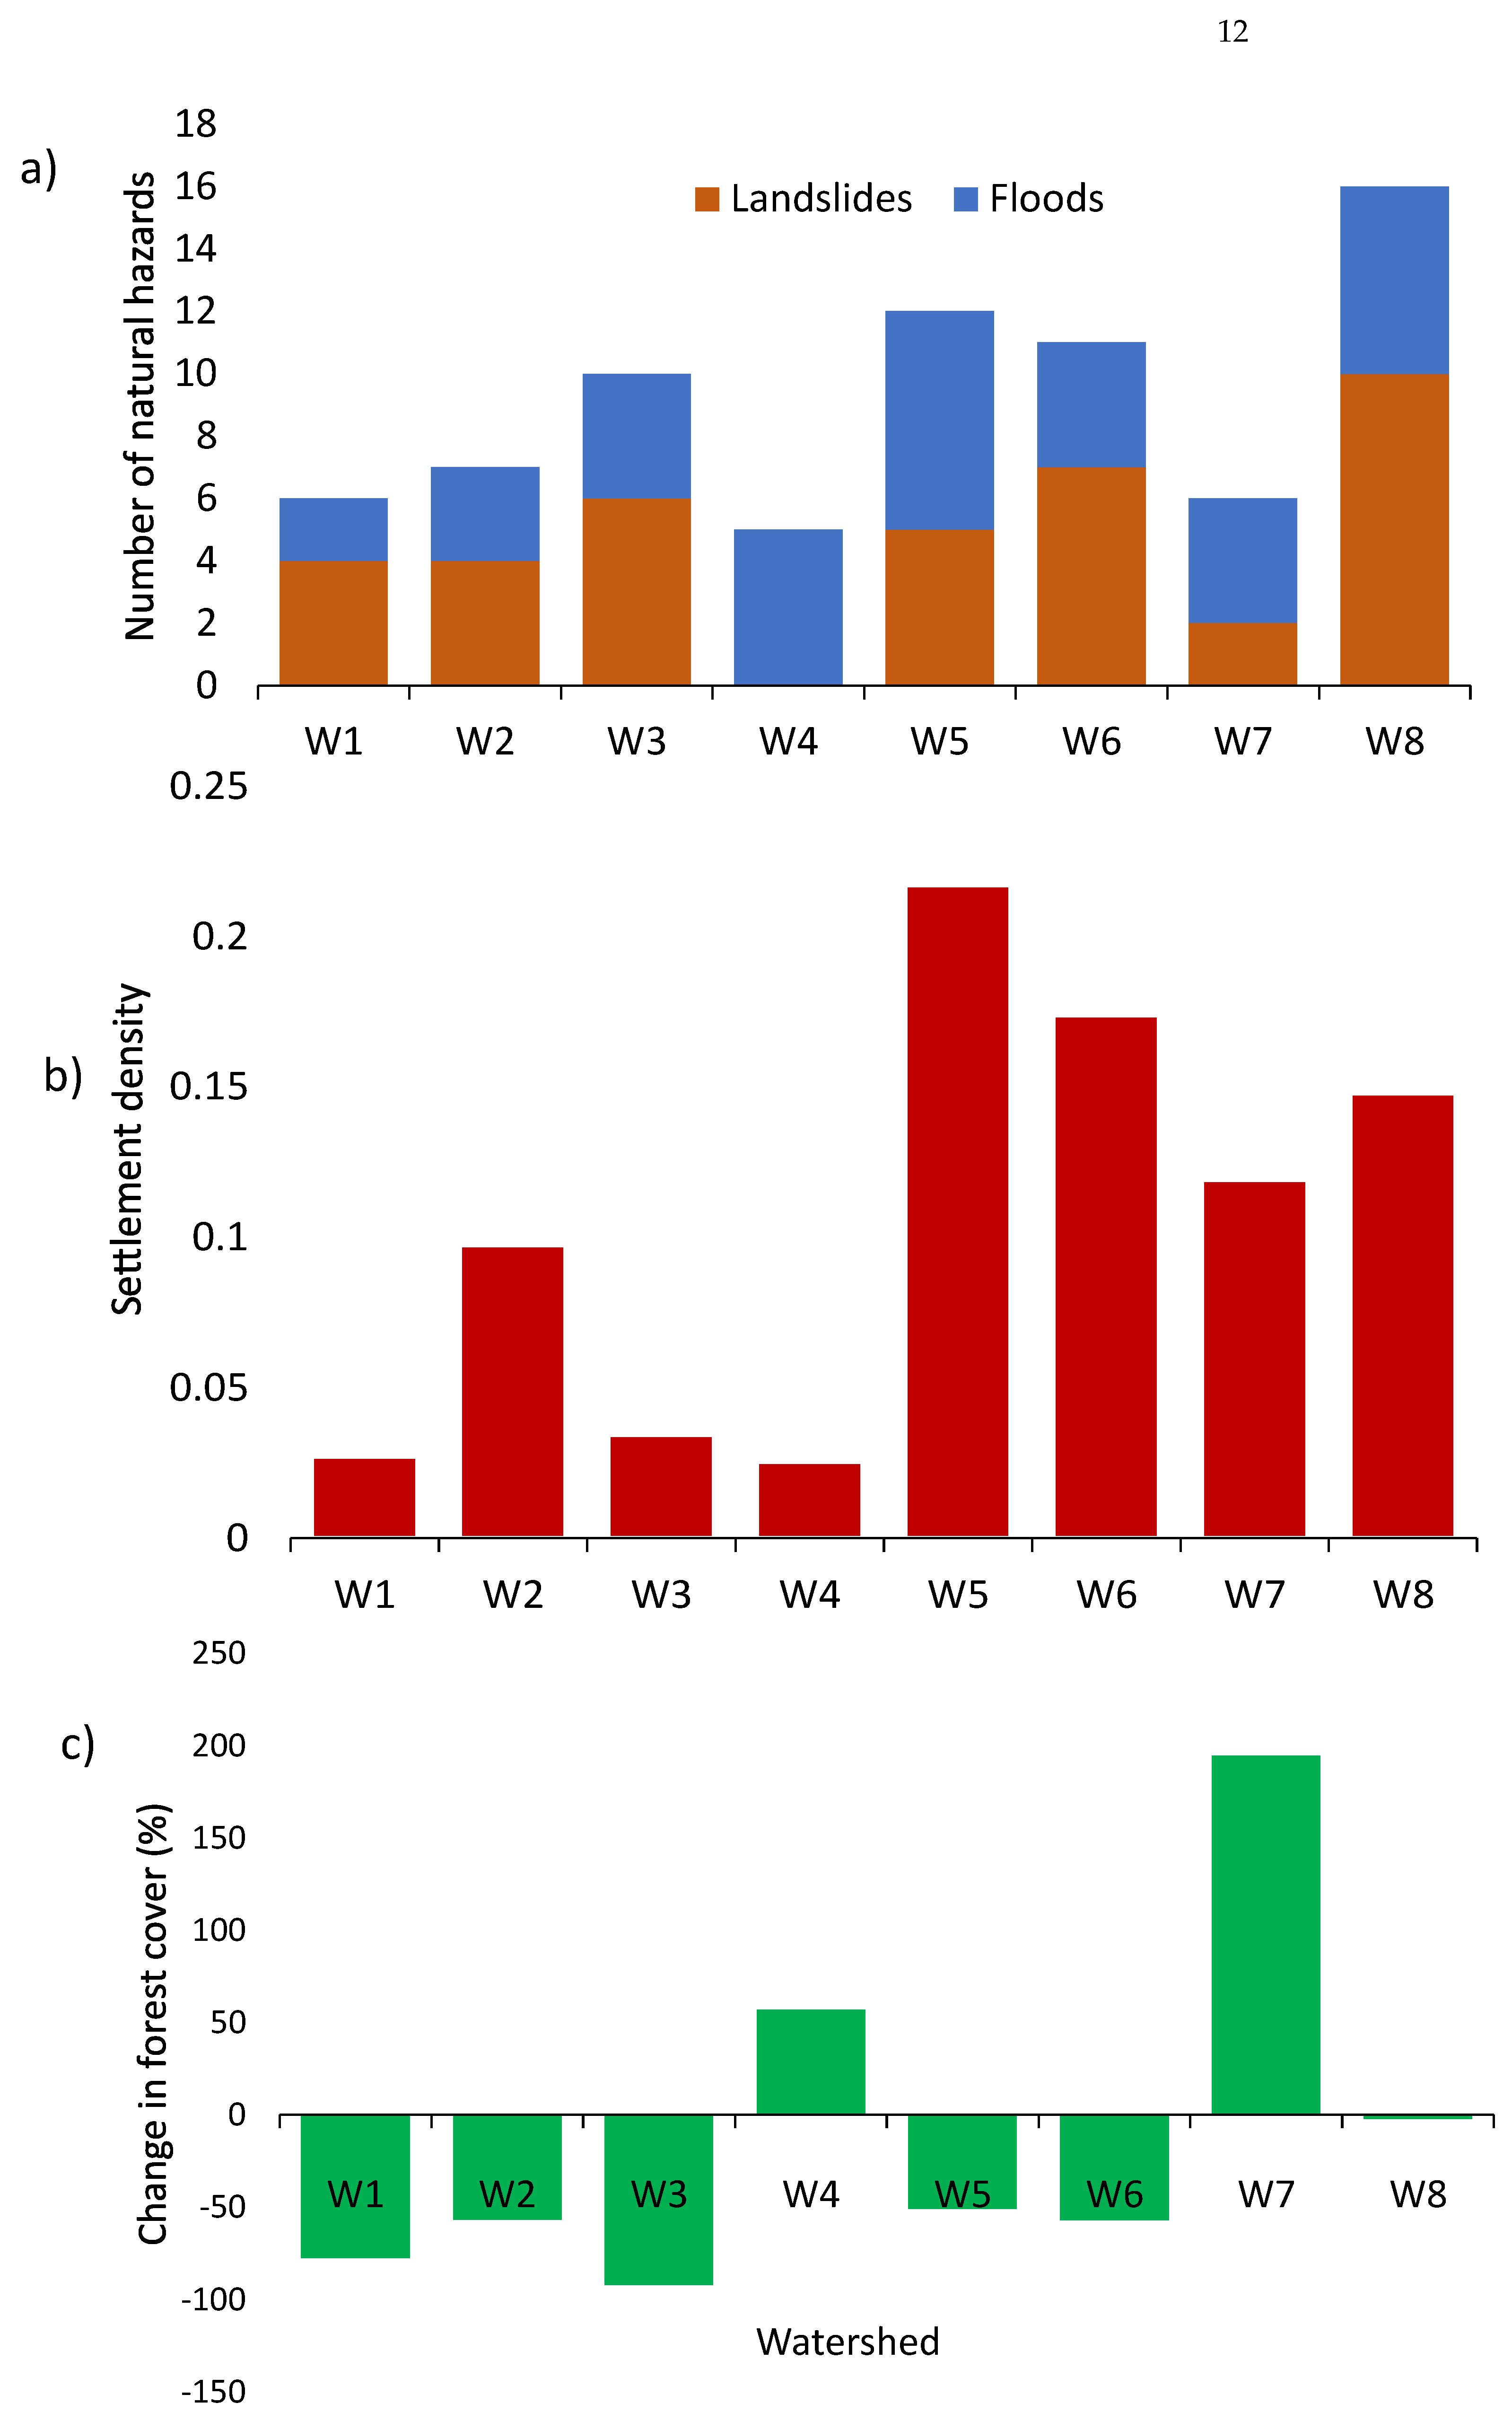
Figure 7.
Proportions of different land use/cover classes for 1954 (circles with black stippled line) and 2021 (circles with black contour) in each watershed (yellow polygons) as mapped manually on the 1954 aerial photographs and 2021 Google Earth imagery. The ‘other’ class represents unterraced croplands, wetlands, and other mixed land uses.
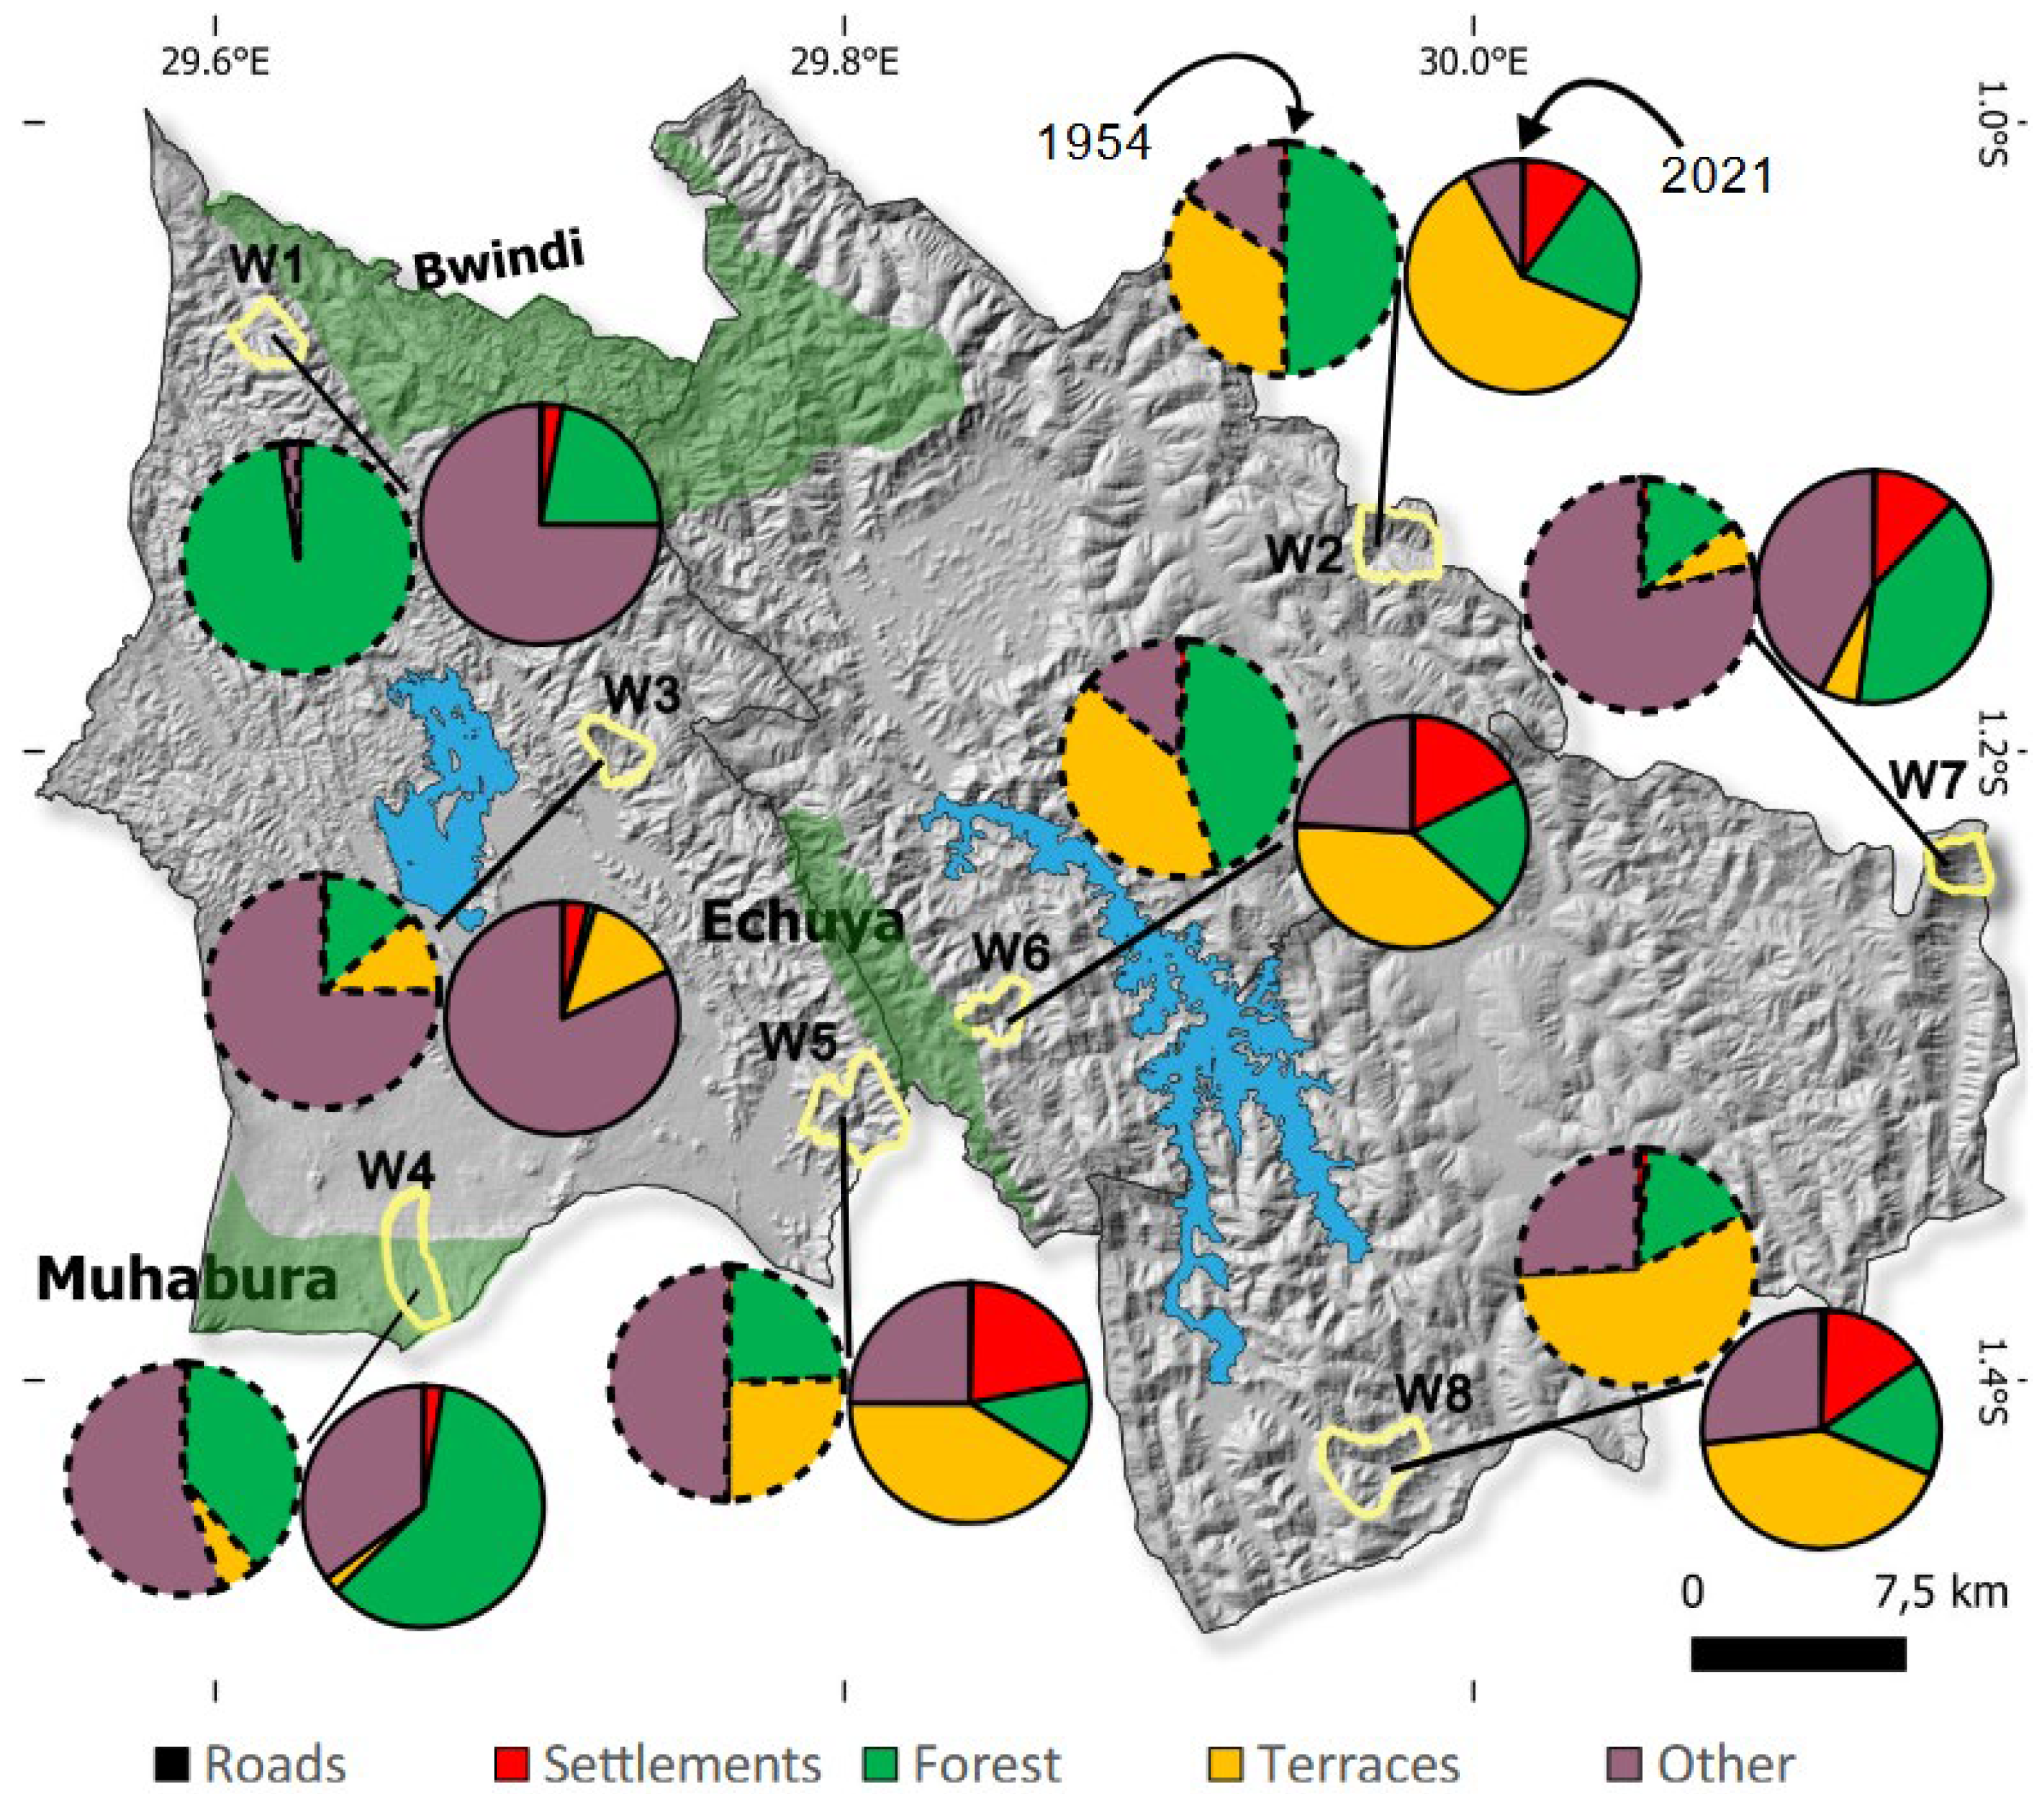
Figure 8.
Land use/ cover maps of the eight watersheds for 1954 and 2021.The empty spaces encompass other unmapped land uses such as unterraced croplands, grasslands and all mixed land uses.
Figure 8.
Land use/ cover maps of the eight watersheds for 1954 and 2021.The empty spaces encompass other unmapped land uses such as unterraced croplands, grasslands and all mixed land uses.
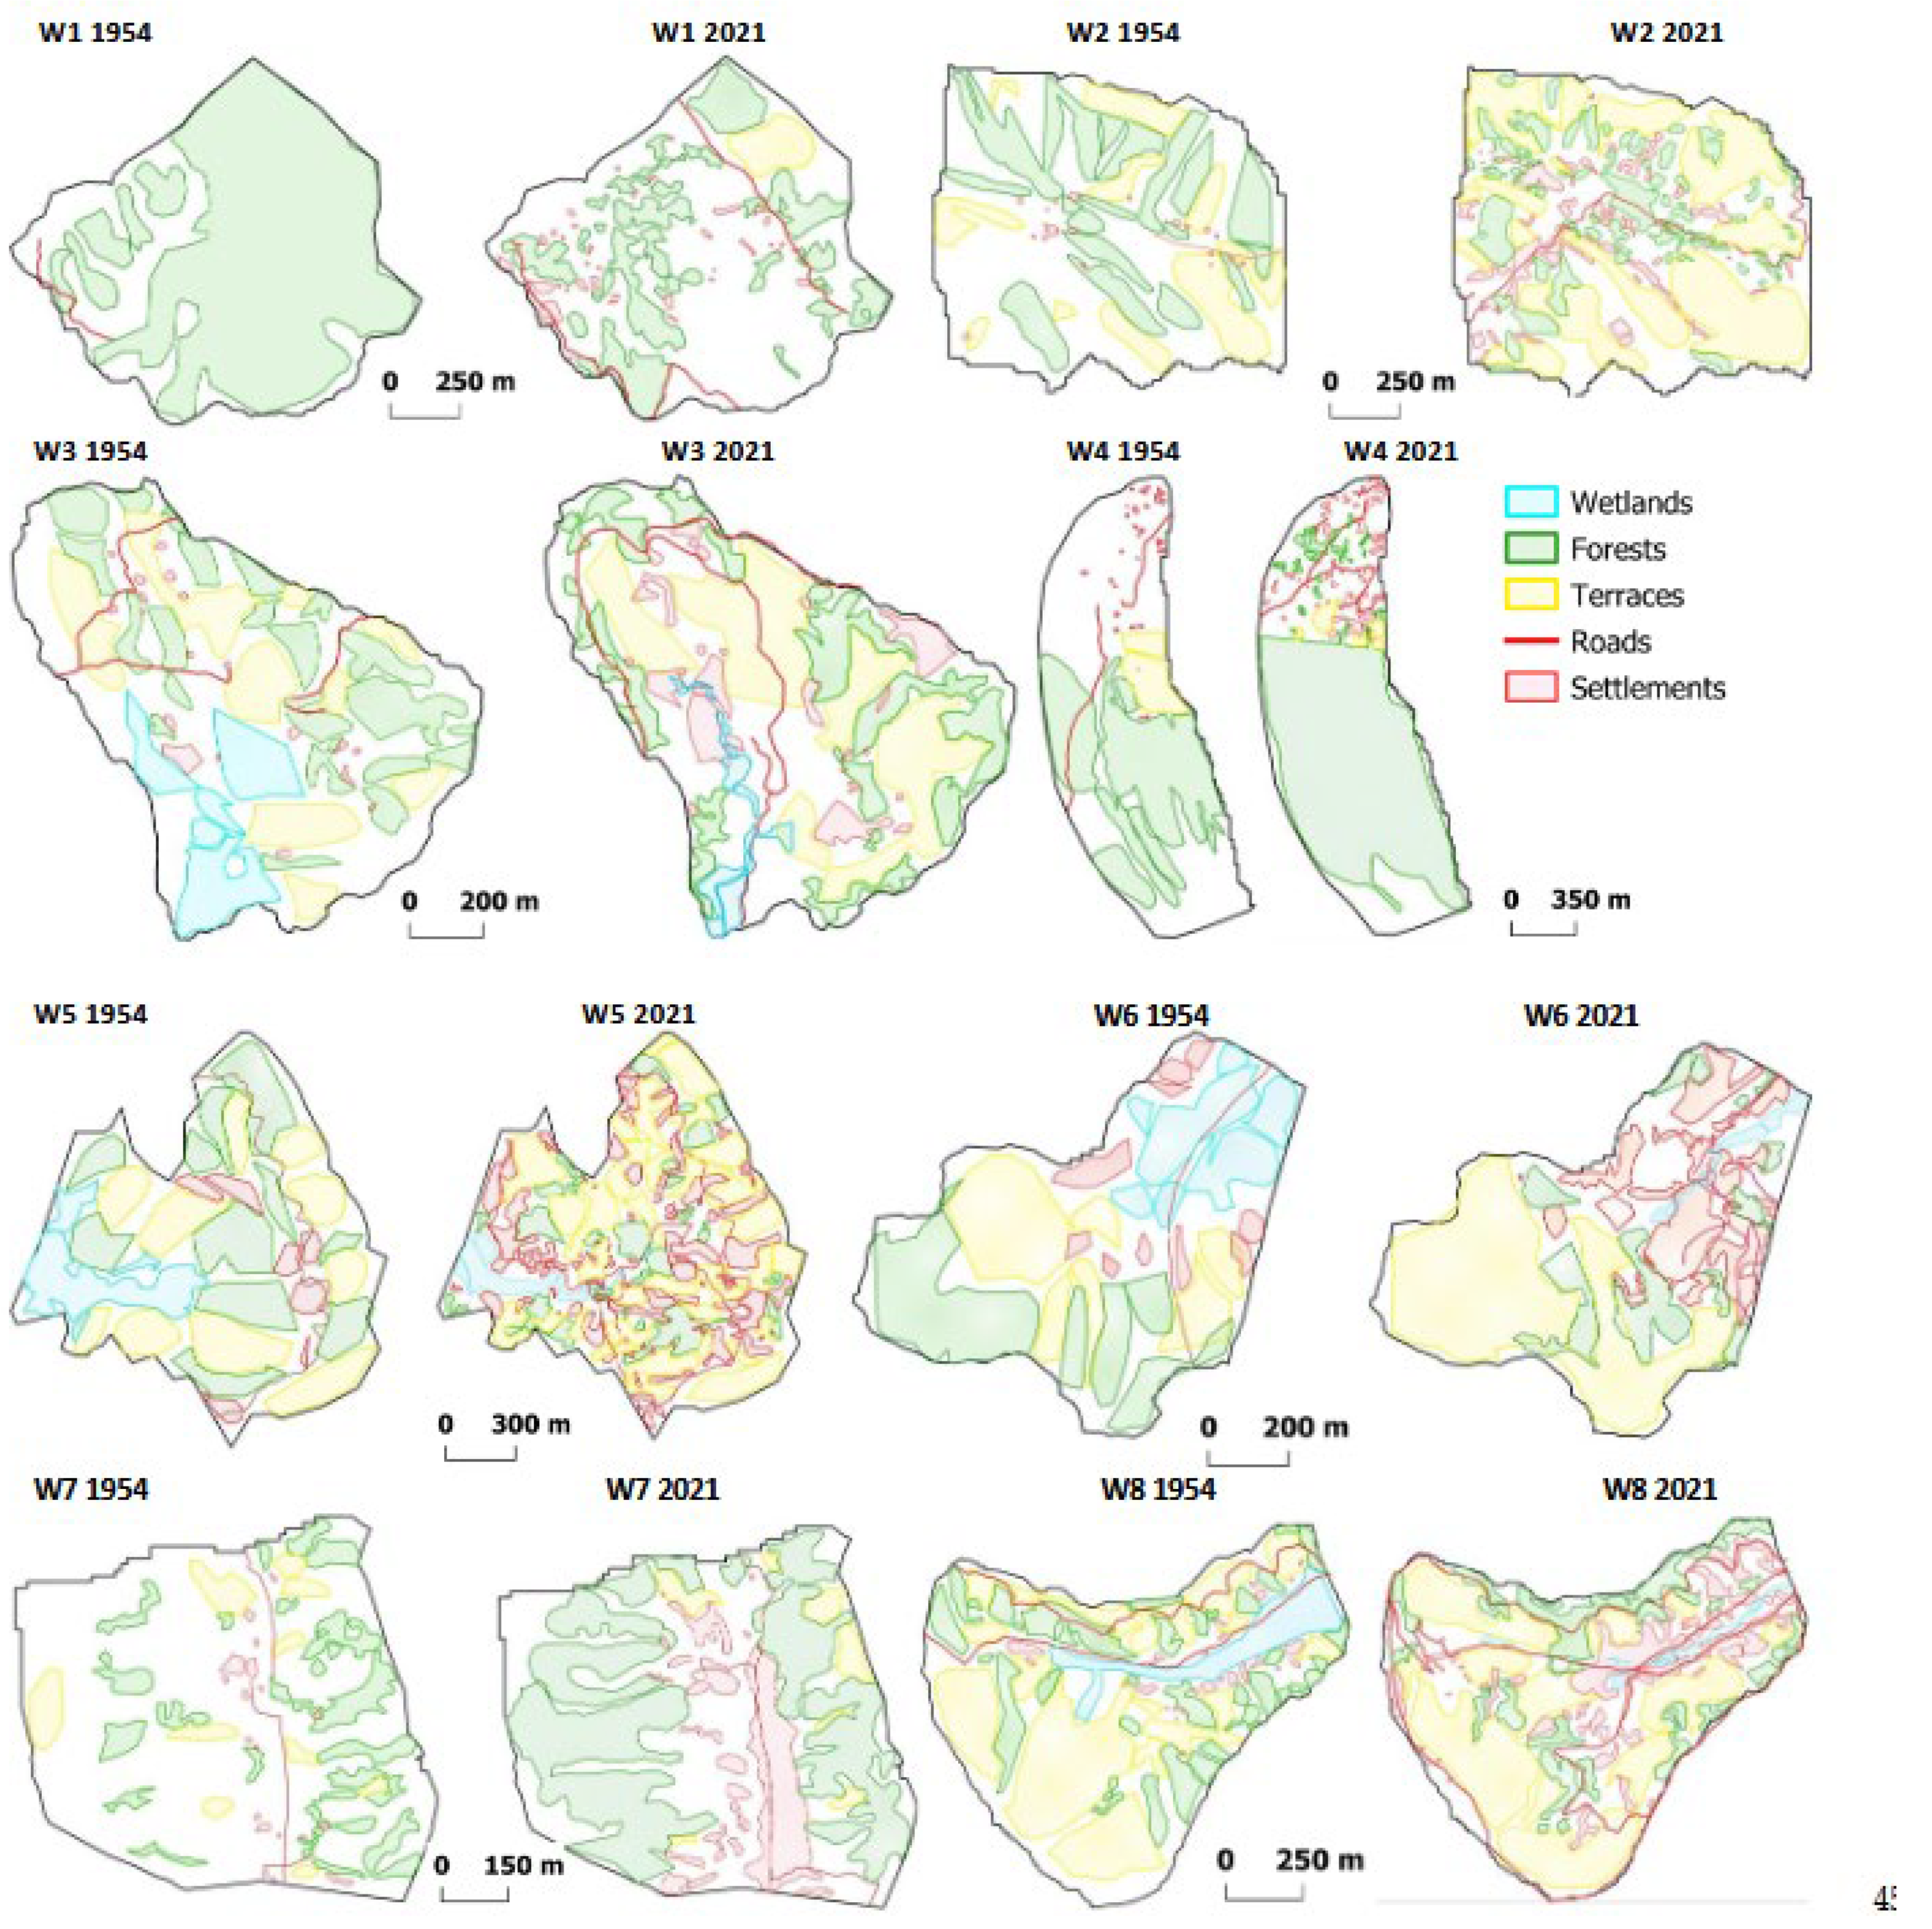
Table 1.
Characteristics of the eight watersheds. Lithology information is from the geological map of Uganda [65]. Information on frequent natural hazards information is from the elderly citizens.
Table 1.
Characteristics of the eight watersheds. Lithology information is from the geological map of Uganda [65]. Information on frequent natural hazards information is from the elderly citizens.
| Watershed | W1 | W2 | W3 | W4 | W5 | W6 | W7 | W8 |
|---|---|---|---|---|---|---|---|---|
| Size (km2) | 3.5 | 4.5 | 7.2 | 6.7 | 8.2 | 3.2 | 3.5 | 7.2 |
| Land use/cover | Forest, shrubs, crops (millet, tea, sweet potatoes, beans). Settlements on hilltops & upper slopes | Eucalyptus, crops (maize, potatoes, beans), agricultural terraces, drained wetland | Eucalyptus, crops (beans, maize, sweet potatoes), agricultural terraces, drained wetland | Forest, Eucalyptus, crops (potatoes, climbing beans, maize), ridges | Eucalyptus, crops (potatoes, climbing beans), rock outcrops on upper slopes, wetland under cultivation | Eucalyptus, crops (climbing beans, potatoes, maize), agricultural terraces, gullies | Eucalyptus, pine, grassland on hilltops. settlements mainly in the valley, crops (banana, sorghum, peas) | Eucalyptus, crops (sorghum, beans, maize), agricultural terraces gullies, numerous gravel roads, drained wetland |
| Average Slope (%) | 48 | 42 | 49 | 34 | 47 | 40 | 39 | 39 |
| Lithology | Mudstone, Shale, Slate, Phyllite | Mudstone, Shale, Slate, Phyllite: Sandstone, Quartzite, Grit | Mudstone, Shale, Slate, Phyllite | Leucite, Basanite | Mudstone, Shale, Slate, Phyllite, Sandstone, Quartzite, Grit | Mudstone, Shale, Slate, Phyllite: Sandstone, Quartzite, Grit | Mudstone, Shale, Slate, Phyllite: Sandstone, Quartzite, Grit | Mudstone, Shale, Slate, Phyllite |
| Level of human disturbance | Low | Moderate | Moderate | Moderate | High | High | Low | High |
| Frequent natural hazards | Landslides | Landslides Flash floods | Landslides Flash floods | Flash floods | Floods | Landslides Flash floods | Landslides | Landslides Flash floods |
Disclaimer/Publisher’s Note: The statements, opinions and data contained in all publications are solely those of the individual author(s) and contributor(s) and not of MDPI and/or the editor(s). MDPI and/or the editor(s) disclaim responsibility for any injury to people or property resulting from any ideas, methods, instructions or products referred to in the content. |
© 2024 by the authors. Licensee MDPI, Basel, Switzerland. This article is an open access article distributed under the terms and conditions of the Creative Commons Attribution (CC BY) license (http://creativecommons.org/licenses/by/4.0/).
Copyright: This open access article is published under a Creative Commons CC BY 4.0 license, which permit the free download, distribution, and reuse, provided that the author and preprint are cited in any reuse.


