Submitted:
19 December 2024
Posted:
20 December 2024
You are already at the latest version
Abstract
Electrical motors and drives are the unseen forces driving our modern world, powering everything from electric vehicles to industrial machinery. The efficiency, precision, and sustainability of these systems are very important. Unexpected motor failures can cause major disruptions, risk human lives, and cause costly downtime. This research aims to improve the efficiency and performance of three-phase synchronous machines using Artificial Intelligence (AI) strategies. This research uses real-time data and optimization techniques to explore advanced diagnostic techniques, fault diagnosis, fault tolerance, and condition monitoring schemes to enhance safety, reliability, and performance in electric synchronous operations.
Keywords:
Fault Diagnostics
; Fault Tolerance
; Synchronous Electric Drives
; Industrial Applications
; Artificial Intelligence
1. Introduction
A synchronous motor is necessary for industrial processes since it operates at a constant speed related to the fixed frequency. So, early fault detection is required to prevent production stoppages and financial losses. Artificial Intelligence (AI) offers improved fault detection and analysis accuracy, identifies fault patterns, improves motor sustainability, analyzes live data, and improves efficiency, reducing maintenance costs and downtime. This paper explores AI-based fault diagnosis and tolerance strategies for synchronous motors in industrial applications, focusing on large-scale drives, conveyor belt systems, and dynamic servos [1].
Drives can control Synchronous Motors. These drives control the speed and frequency of the motor, allowing it to be compatible with the electrical grid or with other motors operating in parallel. This process is known as synchronization and is necessary to ensure the stability and compatibility of the electrical energy produced.
The synchronization process requires several conditions to be met, including (1) Voltage matching: The motor voltage must be compatible with the voltage of the grid or other motors. (2) Frequency matching: The motor frequency must equal the grid's or other motors' frequency. (3) Phase angle matching: The phase angle of the motor must be compatible with the grid's or other motors' phase angle [2,3].
As shown in Figure 1, developing a machine drive using AI for accurate power sharing and synthetic inertia control, ensuring guaranteed performance, will provide performance evaluation tools to enhance the efficiency of the three-phase multifunction machines driven by artificial intelligence Real-Time infrastructure upgrade and implementation. The testing methodologies developed and coordinated control of the advanced model predictive field-oriented control of power electronics converters and electric machine drives of synchronous motors are based on the adaptive equilibrium of distributed energy storage units [4] fault diagnostics of synchronous machines for industrial applications-based AI. The proposed machines and drives can perform their function for a given period under certain conditions. The models and results will provide insight into the reason for the mixed consensus-based distributed dynamic control strategy for economic optimization in the machine [5].
The research objectives are (1) Design and implement a machine drive testbed based on AI technologies for fault detection and diagnostics,(2) Develop power electronics solutions for variable-speed AC motor drives,(3) Apply model predictive control and reinforcement learning for optimal machine drive performance, (4) Integrate Artificial Intelligence algorithms for real-time fault detection and anomaly management, and (5) Develop adaptive control algorithms for varying load conditions and generation fluctuations. The research introduces real-time AI-driven machine control, integrates predictive control with power electronics, and proposes novel fault detection algorithms to enhance motor reliability.
Mechanisms for Success: Continuous system performance monitoring, regular fault diagnostics, and real-time optimization of motor drives. Routine testing of control strategies and scalability to industrial-scale applications. AI techniques like deep learning and model predictive control can optimize real-time voltage regulation, improve power sharing, and enhance system stability. Power electronics converters integrate AI control strategies, improving the efficiency of variable-speed AC motor drives. Challenges include data complexity and scalability, but ensemble learning methods like random forests can enhance prediction accuracy. Deep Neural Networks, Convolutional Neural Networks, and Recurrent Neural Networks are used for complex pattern recognition and control tasks.
Synchronous motor applications include industrial automation, which ensures the continuous operation of production lines and manufacturing systems, and Electric Vehicles, Which Increase the reliability of electric propulsion systems. Another application of the synchronous motor is Renewable Energy Systems. Fault-tolerant drives ensure consistent power generation for wind turbines and other renewable energy systems.
2. Background
As some of the literature indicates, given the importance of reliability and efficiency in synchronous motors for industrial applications, various faults can negatively affect their performance, requiring effective diagnosis and control strategies. Table 1 reviews research on fault diagnosis and control using AI techniques [6,7,8,9,10,11,12,13,14,15,16,17].
3. AI Technologies Used in the Electric Machine Control
In this research, modern AI technologies are used in machine control to enhance reliability, raise efficiency, and improve stability. Fuzzy and Adaptive Neural Fuzzy Inference Systems (ANFIS) processes can adapt control strategies based on changing system dynamics without requiring an explicit model. Fuzzy logic is a heuristic approach that allows more advanced decision-tree processing and better integration with rules-based programming. It is a generalization from standard logic, in which all statements have a truth value of one or zero. ANFIS is a class of adaptive networks incorporating neural networks and fuzzy logic principles. AI strategies provide advanced solutions for increasing electric machine stability since they work well with its dynamic behavior. Figure 2 shows the integration of the electrical machine domains with AI techniques to address the problems.
4. Comparison Between Fuzzy Logic and ANFIS
Fuzzy Logic: A system based on fuzzy rules to interpret variables and make decisions under uncertainty. Relies on manually crafted fuzzy If-Then rules by experts or engineers. Rules are manually set, relying on human expertise to define boundaries and membership levels. Suitable for applications requiring simple rule-based decisions, such as basic control. It uses fixed shapes like triangular (trim), Gaussian (gaussmf), and trapezoidal (trap me), often defined manually. Accuracy depends on user expertise and range definition, making the system stable but less adaptive to data changes. Requires manual adjustment when there are changes in the operating environment, as the membership functions remain fixed after design [18].
Adaptive Neuro-Fuzzy Inference System: A hybrid system combining artificial neural networks and fuzzy logic to enhance modeling accuracy and adaptability. It starts with fuzzy rules, but the neural network adjusts them using training data to improve performance. It begins with an initial setup, but ANFIS’s neural network automatically modifies rules during training. An adaptive system capable of learning from new data, making it more suitable for dynamic environments. It is ideal for advanced applications like fault detection, automatic classification, and complex pattern analysis. It starts with initial shapes (e.g., triangular or Gaussian) but can automatically adjust during training based on data. More flexible and accurate due to automatic adaptation and adjustment based on learned patterns. Automatically responds to changes by adjusting membership function shapes based on new data during training [19]. Figure 3 shows the memberships used in this research in (a) the Fuzzy and (b) the ANFIS membership.
5. Types of Faults in Synchronous Electric Drives
The faults in synchronous motors are classified as electrical and mechanical faults.
Electrical Faults: The electrical faults in the synchronous motor are:
Stator Winding Faults: These are caused by insulation failures, leading to short circuits or open circuits.
Rotor Faults: These can include broken rotor bars or issues in the excitation system, which affect torque generation.
Power Supply Issues: Variations in voltage or frequency affecting drive performance.
Mechanical Faults: The mechanical faults in the synchronous motor are:
Bearing Failures: Resulting from improper lubrication, wear, or contamination.
Misalignment and Imbalance: Lead to vibrations, noise, and potential motor and connected machinery damage.
Coupling and Shaft Faults, Such as misalignment or shaft cracks [20].
6. Fault Diagnostics Techniques
The fault diagnostics techniques done by three techniques are
- Model-Based Approaches:
- i. State Estimation Techniques: Observers and Kalman filters to monitor system states and detect abnormalities.
- ii. Analytical Redundancy: Comparing measurements with expected values from system models.
- Data-Driven Techniques:
- i. Machine Learning: Using supervised learning models (e.g., SVM, neural networks) trained on historical fault data to predict failures.
- ii. Deep Learning: Advanced models (like CNNs and RNNs) for feature extraction from complex datasets such as vibration or current signals.
- iii. Signal Processing: Techniques like FFT (Fast Fourier Transform), wavelet analysis, and time-domain analysis for detecting irregularities in motor currents, vibrations, or acoustic signals.
7. Fault Tolerance in Synchronous Electric Drives
Fault tolerance refers to the driver’s ability to continue operating even when a fault occurs without causing a complete system shutdown. Fault-Tolerant Control Algorithms Modify the control strategy to handle faults by switching control to a different phase in case of a phase fault; these strategies are
- (i)
- Redundancy: Designing systems with redundant components, such as dual inverters and backup power supplies, that can take over when the primary component fails.
- (ii)
- Reconfigurable Control: Adjusting control algorithms in real-time to compensate for faulty components, such as de-rating motor power or shifting operation modes.
- (iii)
- Fault-Tolerant Control Algorithms: Adjusting the control strategy to handle faults by switching control to a different phase in case of a phase fault and
- (iv)
8. Advanced AI Techniques for Fault Diagnostics and Tolerance
The Artificial Intelligence (AI) Integration is done by:
- AI for Predictive Maintenance: AI models can analyze sensor data (temperature, vibration, etc.) to predict potential failures. (i) Real-Time Monitoring: Implementing AI for continuous monitoring of drive systems, enabling rapid detection of abnormalities. (ii) Fuzzy Logic and ANFIS-Based Controllers: Adaptive systems that adjust drive control in real-time to handle faults seamlessly.
- b. Internet of Things (IoT) and Edge Computing: (i) IoT Integration: Sensors across the drive system can communicate data in real-time for centralized analysis. (ii) Edge Computing: Performing diagnostic processing locally on devices for faster and more efficient fault detection [22].
9. Challenges and Future Directions
One of the challenges of the synchronous motor system is model complexity, which involves developing accurate models to capture the complexities of synchronous electric drives. Another challenge is data management: handling large volumes of data from sensors and ensuring the quality of diagnostic data. The last challenge is cost, implementation, and the expense of deploying advanced diagnostic systems and maintaining redundancy.
Future research aims to address and overcome these challenges: (1) Real-Time AI Algorithms and enhancing AI models for faster and more accurate fault identification. (2) Combining model-based and data-driven approaches for more robust fault detection. (3) Development of Lightweight Fault-Tolerant Controllers.
10. Materials and Specifications
The specifications of the motor used in this research are given in Table 2.
11. Enhance Efficiency with Artificial Intelligence.
The efficiency of three-phase multifunction machine drives is achieved by developing and implementing enhanced advanced real-time control algorithms and optimization techniques based on artificial intelligence. These will reduce energy losses, improve motor design, and optimize the drive system's performance. The expected outcomes include increased energy savings, improved reliability, and enhanced operational efficiency of multifunction machines in industrial applications. MATLAB/Simulink and other dynamic response software packages will interface with hardware to expose other insights and identify additional challenges that could be addressed through the proposed method.
Improving the efficiency of the synchronous motor reduces energy loss and increases the motor’s production capacity. Efficient performance also reduces energy consumption and heat generation, prolonging the life of electrical components. Improving efficiency helps reduce noise and variation in operating signals, facilitating data analysis and making fault detection models more accurate. High operating efficiency improves natural operating patterns, allowing early fault detection, enhances motor reliability, reduces costs, and leads to a stable, regular operating environment, enhancing the system's sustainability and early fault detection [23].
This section addresses designing, simulating, and implementing software and hardware to increase motor efficiency by reducing losses and improving performance. The design aims to enhance the motor, improve drive system performance with AI-based control algorithms, and develop new control strategies for improved system stability and dynamics.
The modified nonlinear droop control strategy and the conventional current-mode droop control approach exhibit inherent limitations. Integrating the Multifunction Machine (MFM) proposed with AI techniques is a potential solution to address these drawbacks. The seamless incorporation of the MFM with AI into the existing droop control frameworks offers a multifaceted approach to mitigate the challenges associated with voltage stability, dynamic performance, and system robustness. Evaluate stability and reliability in various operating environments utilizing the equipment of the Lucas-Nülle Laboratory.
This research used a three-phase multifunction machine, a synchronous motor that can be used as an asynchronous or synchronous motor.
The synchronous motor (Three-phase multifunction machine) connects and starts a three-phase multifunction machine as a synchronous motor, measures the motor voltage at a constant speed and variable exciter current, and assembles circuits according to diagrams. Load characteristics are also discussed, with instructions on switching on the servo machine test system, which does not subject the machine to any load.
Mains synchronization (Three-phase multifunction machine) synchronization to mains, utilizing a three-phase multifunction machine, bright, dark, three-lamp methods, double frequency, double-voltage meter, and zero-voltage synchronoscope to determine the synchronization time point. The part also covers power feed, generating active and reactive power, measuring motor power, assembling circuits, and testing the servo machine without load, as shown in Figure 4. Figure 4 shows a proposed control schematic hardware interface with MATLAB/Simulink.
11. Modeling the Machine Dynamics
11.1. Resistive Companion Form Modeling Technique
Consider a power system component with three terminals that can be interconnected to other elements, as illustrated in Figure 5. Each terminal has an associated across and a through variable. If the terminal is electrical, these variables are the terminal voltage concerning a common reference and the electrical current flowing into the terminal, respectively.
Such a component can be described with a set of algebraic-integral-differential equations of the following general form:
Where:
Arbitrary vector functions.
i: A vector of through variables.
A vector of across variables.
A vector of internal state variables.
A vector of independent controls.
The functionsanddefine two sets of equations named external equations and internal equations. The through variables appear only in the external equations. The device states are classified as external states, (the across variables) and internal states .
i. The RCF Model Equation
The Resistive Companion Form (RCF) device terminal definition includes the following parameters:
Terminal voltages.
lectrical currents flowing into the terminals. The RCF model for a system component is defined as follows:
Where G is the Jacobian matrix, defined as:
additionally,andare vectors depending on history values of through variables, across variables or internal states. The application of Kirchhoff's Voltage Law, Kirchhoff's Current Law, and Faraday's Law yields the following equations:
Where:
(7)
(9)
Inductances are functions of the rotor position and are time dependent.
Electromagnetic Torque
iii. Electromagnetic Torque
11.2. The d-q Model of a Three-Phase Synchronous Machine
The d-q model for a synchronous machine is also derived and implemented in MATLAB/Simulink. The synchronous machine model equations are expressed in the rotor reference frame as follows:
i. Electrical Equations:
ii. Mechanical Equation:
iii. Flux Linkages:
iv. Electromagnetic Torque:
All quantities, including variables and parameters, are referred to on the rotor side.
11.3. Park's Transformation
Let the three phases' input voltages be represented by and represent the corresponding currents.
Using Park's transformation, the three-phase system can be converted into a two-axis (d-q) model:
where is the electrical angle, and and are the direct and quadrature axis voltages, respectively. Park’s transformation is well-suited for synchronous motors, as it converts three-phase voltages or currents into the d-q reference frame, a rotating coordinate system, simplifying motor control.
12. Control Strategy with AI
An AI-driven control algorithm can be implemented to optimize efficiency and regulate the d-q currents. for achieving optimal torque and flux levels.
Define the objective function. For efficiency as:
Where T is the torque, ω is the angular speed in . and are the output and input powers, respectively.
12.1. Optimization with Neural Networks or Fuzzy Logic
Use Adaptive Neuro-Fuzzy Inference System (ANFIS) or a neural network model to map input parameters (e.g., load, speed) to control outputs (e.g., ). The neural network model can adjust voltage and current to minimize losses, aiming to maximize the efficiency, . The AI controller can reduce power losses by adjusting the switching states in the inverter, represented as:
where is the stator resistance and represents switching losses in the inverter.
Real-time measurements of , and are fed into the AI model, which iteratively refines control signals to sustain high efficiency [24].
12.2. Time Response of a Second-Order System
In this section, we will discuss the time response of a second-order system. Consider the following block diagram of a closed-loop control system shown in Figure 6. G(s) is an open-loop transfer function related to a unity of negative feedback.
where is the damping ratio, and is the natural frequency. The transfer function of the closed-loop control system having unity negative feedback is:
Substitute, in the above equation:
where:
is the Laplace transform of the output signal, .
is the Laplace transform of the input signal, .
The power of is two in the denominator term. Hence, the above transfer function is of the second order, and the system is said to be the second-order system.
The characteristic equation is:
The roots of the characteristic equation are:
The roots can be classified as follows:
- The two roots are imaginary when .
- The two roots are real and equal when .
- The two roots are real but not equal when .
- The two roots are complex conjugate when .
We can write the equation as:
Consider the unit step signal as an input to the second-order system. The Laplace transform of the unit step signal is .
Time-Domain Response
The response of the system depends on the damping ratio , which determines the behavior of the system:
1. Underdamped The response exhibits oscillations that decay over time:
where is the damped natural frequency.
2. Critically Damped Substitute into the transfer function:
Perform partial fractions and simplify:
Apply the inverse Laplace transform:
So, the unit step response of the system when reaches a steady state quickly without oscillations.
The response approaches the final value as quickly as possible without oscillating.
3. Overdamped The response does not oscillate and approaches the final value slowly:
4. Undamped Substitute into the transfer function:
apply the inverse Laplace transform:
So, the unit step response of the system when is a continuous oscillatory signal.
Performance Metrics of a Second-Order System
The key performance metrics of a second-order system include the Peak Time Rise Time and Settling Time These metrics are used to evaluate the system's dynamic behavior based on its damping ratio, and natural frequency .
Peak Time The peak time is the time taken to reach the first peak of the response, and it is defined for underdamped systems .
Where:
The damped natural frequency.
Rise TimeFor underdamped systems, the rise time is the time it takes for the system's response to rise from 10% to 90% of its final value.
Where: The phase angle.
Settling Time The settling time is the time required for the system's response to remain within a specified percentage (commonly 2% or 5%) of its final value.
For 2% Criterion
For 5% Criterion
Where: A smaller damping ratio results in slower damping and hence longer settling and rise times. A larger natural frequency results in faster oscillations and shorter settling, rise, and peak times.
The dynamic behavior of a three-phase synchronous motor linking ωₙ and ζ. In a three-phase synchronous motor, the parameters ωₙ (natural frequency) and ζ (damping ratio) from second-order system theory can be connected to the physical and dynamic behavior of the motor as follows:
The natural frequency ωₙ represents the system's inherent oscillatory response to stored energy. In the context of a synchronous motor:
- ωₙ relates to the electrical frequency generated by the interaction of the stator's rotating magnetic field and the rotor.
- It can be mathematically expressed as:
Where:
- Kₑ: Electromechanical coupling constant (proportional to motor torque constant).
- J: Rotor's moment of inertia.
Damping Ratio (ζ)
The damping ratio ζ determines the system's ability to minimize oscillations during transient states. In synchronous motors:
- It depends on damping currents or resistance to oscillations caused by the rotor and stator interactions.
- It can be expressed as:
Where:
B: Damping coefficient (depends on internal resistance and eddy current losses).
Relationship Between ωₙ and ζ
The second-order system parameters (ωₙ and ζ) define the motor's dynamic performance during transient conditions (such as startup or load changes):
1. Natural Frequency (ωₙ): Governs the speed of oscillations after a disturbance.
2. Damping Ratio (ζ): Controls how quickly these oscillations decay and how the motor stabilizes.
System Behavior Based on ζ
1. Critically Damped : The motor reaches a steady state as quickly as possible without oscillations.
2. Underdamped : The motor exhibits oscillatory behavior before stabilizing.
3. Overdamped : The motor stabilizes slowly without oscillations.
4. Undamped : The motor oscillates indefinitely without decay.
Mathematical Model
The second-order dynamic behavior of a synchronous motor can be represented as:
Where:
- : Mechanical torque is applied to the rotor.
- : Angular displacement of the rotor.
Practical Usage
- Analyze the motor's transient response during startup or load changes.
- Use ωₙ and ζ to predict the motor's behavior and optimize its design for specific applications.
13. Simulation Model
Figure 8 and Figure 9 show the proposed control schematic using MATLAB/Simulink. They also show the development of AI techniques using the Lucas-Nülle machine/ power electronics laboratory equipment sets at PVAMU and the design of a closed-loop control mode using MATLAB/Simulink. The ANFIS subsystem is shown in Figure 10.
Fuzzy Inference System: Set up membership functions (like NG, NM, NP, EZ, PP, PM, PG) for inputs and outputs, defining fuzzy rules to control torque and flux in the d-q frame.
ANFIS Training: Use input-output data to train the ANFIS model, allowing it to adaptively adjust voltage and current settings.
Synchronous machines are primarily deployed as motors supplying electrical power. For this purpose, their power levels can reach up to approximately 2000 MVA. Additional application areas include large-scale drives for cement mills and conveyor belt systems with power levels in the megawatt range. Highly dynamic servos with permanently excited rotors round off the scope of synchronous machines. In contrast to synchronous machines, the rotor runs synchronously with the rotating field.
14. Fault Diagnostics
This research aims to enhance the fault diagnosis capabilities of synchronous motors used in industrial applications through artificial intelligence technologies. Accurate and effective fault diagnosis adjusts operating efficiency, reduces unplanned downtime, increases equipment reliability, and enhances maintenance practices.
i. Concept:
This section will address improving diagnostic accuracy based on AI to reduce downtime through early fault detection and improved preventive maintenance. It will also increase reliability by developing adaptive control strategies that accommodate system changes without an explicit model. It will also enhance operational efficiency through advanced diagnostic systems that reduce downtime and improve performance using AI techniques to improve fault diagnostics of synchronous machines. Fuzzy logic and Adaptive Neural Fuzzy Inference Systems (ANFIS) improve fault detection accuracy, reduce downtime, and enhance machine reliability by allowing advanced decision-tree processing and rules-based programming integration. It is a generalization from standard logic, in which all statements have a truth value of one or zero. ANFIS is a class of adaptive networks incorporating neural networks and fuzzy logic principles.
Fuzzy and ANFIS adapt control strategies based on changing system dynamics without requiring an explicit model. They integrate neural networks with fuzzy logic to develop more adaptive control strategies. MATLAB/Simulink will evaluate system performance under various operating conditions and hardware implementation. A smart scheme for real-time applications that detect and recognize faults has been implemented [25].
Figure 11 shows MATLAB/Simulink used to model the motor current variable's time response, speed variation, and torque under pre-fault, during, and post-fault conditions.
ii. Mathematical Analysis
The synchronous machine can be described by voltage equations that represent the dynamics of current and voltage in the d-q axis system for simplification:
Where:
and are the voltages in the d and q axes, respectively.
and are the currents in the d and q axes, respectively.
is the stator resistance.
and are the inductances in the d and q axes.
is the angular velocity.
is the excitation voltage.
Feature Extraction and Analysis
Frequency analysis using Fourier Transform helps to analyze signals in the frequency domain:
X(f) represents the signal in the frequency domain, aiding in identifying vibration frequencies indicative of specific faults.
Time-frequency analysis using Wavelet Transform is also applied to extract distinctive features for each fault type:
Where:
is the wavelet coefficient.
is the wavelet function, with a and b representing scale and translation in time and frequency.
iii. Fault Classification Using AI Techniques
Neural networks or ANFIS can represent fault classification as nonlinear equations in which the model learns fault patterns from training data.
Let denote the model that maps the captured signals (such as currents and vibrations) to fault classes to minimize the error function E between actual and predicted outputs:
where:
are the true values.
are the predicted values from the model.
Real-Time Feedback Mechanism
Real-time data integration with the AI model continuously updates system outputs, using gradient descent to adjust model weights [26] :
Where: represents the weights and is the learning rate.
15. Results and Discussion
Figure 12a shows motor current vs. excitation current points where the values change significantly, indicating different excitations' effects on motor performance. Figure 12b shows torque vs. motor current. It shows the gradual increase in motor current as torque increases, indicating a partial linear response in the system. Figure 12c shows the power factor vs. excitation current Iexc. It shows the fluctuations in values and how they affect the index, reflecting the stability of the system and its periodic changes. Figure 12d shows torque vs. speed. It shows the change in speed as torque increases and includes sudden drops or changes that may indicate potential points of instability in the system. The speed characteristics at the steady state after using the controller are given in Figure 13.
Table 3 shows that using ANFIS, raising time, settling time, and setting time as the maximum overshoot will modify the maximum overshoot.
Figure 14 shows the synchronous motor P-Q curve per unit. It shows the relationship between active power (P) and reactive power (Q) in a synchronous motor with and without AI sequences. This research aims to raise efficiency and improve stability. This graph shows the changes in motor performance under different influences, which helps analyze the system's stability. The stability increased by reducing the reactive power generated and improving the power factor using the ANFIS algorithm.
Figure 15 shows the synchronous machine's response to the fault and the control's effect on returning the machine to a steady state after removing the fault. Figure 15a shows the motor voltage response. Significant fluctuations can be observed, indicating changes in load or the system's response to unstable conditions.
At the beginning of the graph, a voltage drop period is shown (about the first second). During this period, the voltage starts to fluctuate very rapidly, with a noticeable drop from a positive value close to +400 V to a negative value close to -400 V. This rapid voltage drop is the result of a sudden change in the motor properties due to a fault where certain components in the system are activated that affects the voltage. After this short period of fluctuation and drop, the voltage stabilizes at stable values, indicating that the system has reached a state of equilibrium or stability after these initial changes under the controller's influence. Figure 15b shows the system oscillation with clear signs of sequential changes. These fluctuations indicate changes in the motor voltage or current under certain conditions, such as start-up or changes in load. Output a repeating sequence of numbers specified in a table of time-value pairs. Time values should be monotonically increasing.
Figure 1 shows the input torque response to the fault. Figure 1a shows the effect of the fault or fluctuations on the torque time response. In the period from 0 to 1 sec, the torque fluctuations are large, with values changing rapidly between positive and negative limits up to ±500 Nm, indicating that the system is beginning to be affected by a transient. In the second period, from 1 sec to 4 sec, the torque will be zero due to the fault effect. The torque begins gradually and returns to a steady state after 4 seconds because of the controller. The torque remains completely stable at almost zero without any fluctuations, indicating complete system stability.
Figure 16b shows quieter fluctuations, which indicate periods of stability after previous fluctuations. Because of the ANFIS, analyzing this region can help understand the system response during stabilization. Figure 16c shows the torque oscillating sharply between positive and negative values from 0 to about 50, indicating the system's beginning of operation and oscillation. From about 50 to 200, the oscillation gradually decreases, and the system stabilizes as the torque decreases and progressively approaches zero. From 200 to about 300, the torque shows a slight upward trend with angular velocity stabilizing, indicating that the system is approaching a steady state. From about 300 and above, almost complete stability is evident in the system, as the points cluster in a small region, indicating that angular velocity and torque are stable.
The range distribution for the sustainable index based on the analysis of motor data is given in Table 4.
Figure 17 shows the relationship between the excitation current and the related variable and their effect on the sustainability index. The graph shows peaks and troughs, indicating where the sustainability index reaches its highest (peaks) and lowest (troughs) values. This reflects that the response at different excitation current levels and the related variable varies as load changes, changes in other factors change, and temperature rises due to motor operation and friction. The color gradient shows the sustainability index's transition from negative to positive values . Blue indicates low values, while yellow and red indicate higher values. It can be concluded that the sustainability index is significantly affected by the change in the motor's excitation current and the related variable. The index's high positive value may indicate ideal conditions for achieving higher sustainability in the system. In opposition, the negative values indicate weak points or potential instability. This type of analysis can help evaluate the performance and improve the control of electrical systems such as motors.
Figure 18 shows the relationship between excitation current and output and their effect on the sustainability index. The figure shows the peaks and troughs reflecting the points where the sustainability index is highest and lowest. These values indicate the stability or fluctuation of the system at certain points of excitation current and output. Yellow indicates areas with a high sustainability index, while blue indicates low values. High levels of sustainability can be achieved at certain excitation current and output values. Changes in excitation current greatly affect the response, highlighting the importance of precise control to improve system performance. This analysis can improve motor performance by understanding the impact of variables on performance and sustainability indicators.
The results show that using AI improves fault detection accuracy in synchronous motors, reducing unexpected downtime and increasing system reliability. The results show that Fuzzy and ANFAS identify fault patterns and extract useful data from complex signals. Simulations using MATLAB/Simulink show that predictive algorithms improve system response in real-time, enhancing motor control efficiency. ANFIS effectively faces environmental and operational changes, providing more flexible solutions. The conclusion indicates the importance of continuing to develop these technologies to enhance operational efficiency and reduce unexpected failures in industrial applications. Experiments show that integrating AI and edge computing devices can improve fault detection time, enabling fast and accurate response. The study demonstrated the importance of adaptive systems such as ANFIS, which can handle changes in operating conditions without the need for explicit models, enhancing operational flexibility. Applying smart systems to three-phase electric motors significantly improves energy efficiency and reduces total maintenance costs.
16. Conclusions
The results confirm that integrating AI technologies with motor control systems significantly improves efficiency and reliability. Simulation and predictive tools are highly effective in improving system performance, reflected in system stability and safety. A framework for an electrical drive testbed-based AI was designed and implemented using the Lucas-Nülle Power Electronics / Electrical Machines and Drives Laboratory equipment sets at PVAMU to model and simulate the multifunction machine drive. A real-time testbed developed machine-driven AI technology. A real-time testbed machine framework is demonstrated using a communication simulator/emulator and hardware model. This research investigated an advanced power electronic solutions testbed that enables precise control and high efficiency for variable-speed three-phase AC motor drives. The real-time monitoring and data acquisition systems are integrated to improve control precision performance and motor efficiency and improve advanced strategies to power electronics converters and electric machine drives based on AI technology. Simulated and studied the control of the three-phase synchronous machine model in the real-time testbed and evaluated and optimized the efficiency of power electronics converters and the response time of the machine. AI techniques to develop advanced fault diagnostics systems for synchronous machines using machine learning and neural networks to diagnose open and short circuit faults and Improve fault detection accuracy, reduce downtime, and enhance machine reliability.
References
- Vargas, M. , Teixeira, D., Jiménez, G., Ladines, M., Machacuay, J., & Ipanaqué, W. Model-Free ANN-based control for Three-Phase Synchronous Motor Speed Control. In 2023 IEEE International Conference on Electronics, Electrical Engineering and Computing (INTERCON), IEEE, 23, pp. 1-8. 20 November.
- Patel, R. A. , & Bhalja, B. R. Condition monitoring and fault diagnosis of the synchronous motor using support vector machine. Electric Power Components and Systems, 2016, 44(6), pp. 683-692.
- Ali, M.; Khalid, M. Multiphase Matrix Converter Modulation for Wind Energy Systems using Genetic Algorithm. 2022 Saudi Arabia Smart Grid (SASGIEEE, 22; pp. 1–5. 20 December.
- Zhou, Y. , Shang, Q., & Guan, C. Three-phase synchronous motor fault diagnosis using attention mechanism and hybrid CNN-MLP by multi-sensor information. IEEE Access, 2023.
- Sunori, S. K. , Mittal, A., Bisht, V. S., Joshi, N., Garia, P., Juneja, P., & Kaliraj, S. Title of the article. Simulation, 122, 23. 3rd International Conference on Electronics and Sustainable Communication Systems (ICESC 2022), -19, 2022. 17 August.
- Preethi, I. , Suryaprakash, S., & Mathankumar, M. A state-of-the-art approach to fault detection in a three-phase synchronous motor using AI techniques. In 2021 5th International Conference on Computing Methodologies and Communication (ICCMC), IEEE, 21, pp. 567-573. 20 April.
- de Araújo, V.G.; Teixeira, R.d.A.; Nascimento, T.F.D.; Salazar, A.O.; Fonseca, D.A.d.M. Application of Artificial Intelligence Techniques for Monitoring and Fault Diagnosis in Three-Phase Induction Motors. 2023 IEEE 8th Southern Power Electronics Conference and 17th Brazilian Power Electronics Conference (SPEC/COBEP). LOCATION OF CONFERENCE, BrazilDATE OF CONFERENCE; pp. 1–8.
- Akin, M.; Canbay, Y.; Ocak, C. Deep Learning Based Phase Current Prediction Model in Three-Phase IGBT Two-Level Inverter for Electrical Drives. 2024 IEEE 18th International Conference on Compatibility, Power Electronics and Power Engineering (CPE-POWERENG). LOCATION OF CONFERENCE, PolandDATE OF CONFERENCE; pp. 1–6.
- Yaghobi, H. , Ansari, K., & Mashhadi, H. R. Stator Turn-to-Turn Fault Detection of Synchronous Motor Using THD Analysis. Iranian Journal of Science and Technology, 2013, 37(2), pp. 161-182.
- Redondo, M.; Platero, C.A.; Gyftakis, K.N. Turn-to-turn fault protection technique for synchronous machines without additional voltage transformers. 2017 IEEE 11th International Symposium on Diagnostics for Electrical Machines, Power Electronics and Drives (SDEMPED). LOCATION OF CONFERENCE, GreeceDATE OF CONFERENCE; pp. 117–121.
- Hoffe, S. J. , Meyer, A. S., & Cronje, W. A. Determination of Shaft Position from Shaft Voltage on a Synchronous Motor. IEEE International Symposium on Diagnostics for Electric Machines, Power Electronics and Drives (SDEMPED), IEEE, 2005.
- Varzaneh, M.G.; Iranshahi, M.; Mansour, I.; Kamali-Omidi, N.; Panah, A.S. Implementing V/F Control of Three-Phase Induction Motors without the Use of Digital Processors for Electric Propulsion Applications. 2023 2nd International Engineering Conference on Electrical, Energy, and Artificial Intelligence (EICEEAI). LOCATION OF CONFERENCE, JordanDATE OF CONFERENCE; pp. 1–4.
- E Okpo, E.; Le Roux, P.F.; Nnachi, A.F. Induction Motor Fault Identification using Support Vector Machine. 2023 6th International Conference on Renewable Energy and Power Engineering (REPE). LOCATION OF CONFERENCE, ChinaDATE OF CONFERENCE; pp. 168–174.
- Casadei, D. , Filippetti, F., Rossi, C., Stefani, A., Capolino, G. A., & Yazidi, A. A General Diagnostic Method for Doubly Fed Synchronous Machine Drives Based on Field Oriented Control. IEEE Transactions on Industry Applications, 2005, 50(2), pp. 1206-1213.
- Freire, N. M. A. , Estima, J. O., & Cardoso, A. J. M. A New Approach for Current Sensor Fault Diagnosis in PMSG Drives for Wind Energy Conversion Systems. IEEE Transactions on Industry Applications, 2013, 50(2), pp. 1207-1214.
- Sabir, R. , Rosato, D., Hartmann, S., & Gühmann, C. Detection and Localization of Electrical Faults in a Three Phase Synchronous Motor with Rectifier. In 2019 International Conference on Electrical Drives & Power Electronics (EDPE), IEEE, -26, 2019. 24 September.
- Kiani, M. , Lee, W.-J., Kenarangui, R., & Fahimi, B. Detection of Rotor Faults in Synchronous Motors. IEEE Transactions on Industry Applications, 2008, 50(2), pp. 1206-1213.
- Mahmoud, H. , Abdallah, A., El-Hakim, S., & Shaltout, A. An Inverse Approach for Interturn Fault Detection in Synchronous Machines. IEEE Transactions on Industry Applications, 2016, 52(1), pp. 226-233.
- Awadallah, M. , Morcos, M., Gopalakrishnan, S., & Nehl, T. A Neuro-Fuzzy Approach to Automatic Diagnosis of Stator Inter-Turn Faults. IEEE Transactions on Energy Conversion, 2005, 20(2), pp. 253-259.
- Antonino-Daviu, J. A. , & Penman, J. Fault Detection of Synchronous Machines Using Discrete Wavelet Transform. IEEE Transactions on Industry Applications, 2005, 41(2), pp. 257-265.
- Bouzid, M. , Champenois, G., Bellaaj, N., Signac, L., & Jelassi, K. An Effective Neural Approach for Automatic Location of Stator Interturn Faults in Synchronous Motors. IEEE Transactions on Industrial Electronics, 2008, 55(12), pp. 4277-4289.
- Shah, D. , Nandi, S., & Neti, P. Stator-Interturn-Fault Detection of Doubly Fed Synchronous Motors Using Rotor-Current Signature Analysis. IEEE Transactions on Industry Applications, 2009, 45(5), pp. 1831-1842.
- Soualhi, A. , Clerc, G., & Razik, H. Faults Classification of Synchronous Machine Using Improved Ant Clustering Technique. IEEE Symposium on Diagnostics for Electrical Machines, Power Electronics & Drives.
- Kim, C. E. , & Sykulski, J. K. Harmonic Analysis of Output Voltage in Synchronous Motor Using Finite Element Method. IEEE Transactions on Magnetics, 2002, 38(2), pp. 1249-1252.
- Neti, P.; Nandi, S. Stator Inter-turn Fault Detection of Synchronous Machines Using Field Current Signature Analysis. Conference Record of the 2006 IEEE Industry Applications Conference Forty-First IAS Annual Meeting. LOCATION OF CONFERENCE, United StatesDATE OF CONFERENCE;
- Antonino-Daviu, J. A. , Penman, J., & Negrea, M. D. On-Line Detection of Faults in Electrical Machines by Wavelet Analysis of Current Signals. IEEE Transactions on Power Electronics, 2018, 23(1), pp. 50-59.
Figure 1.
Interactions between the research parts.
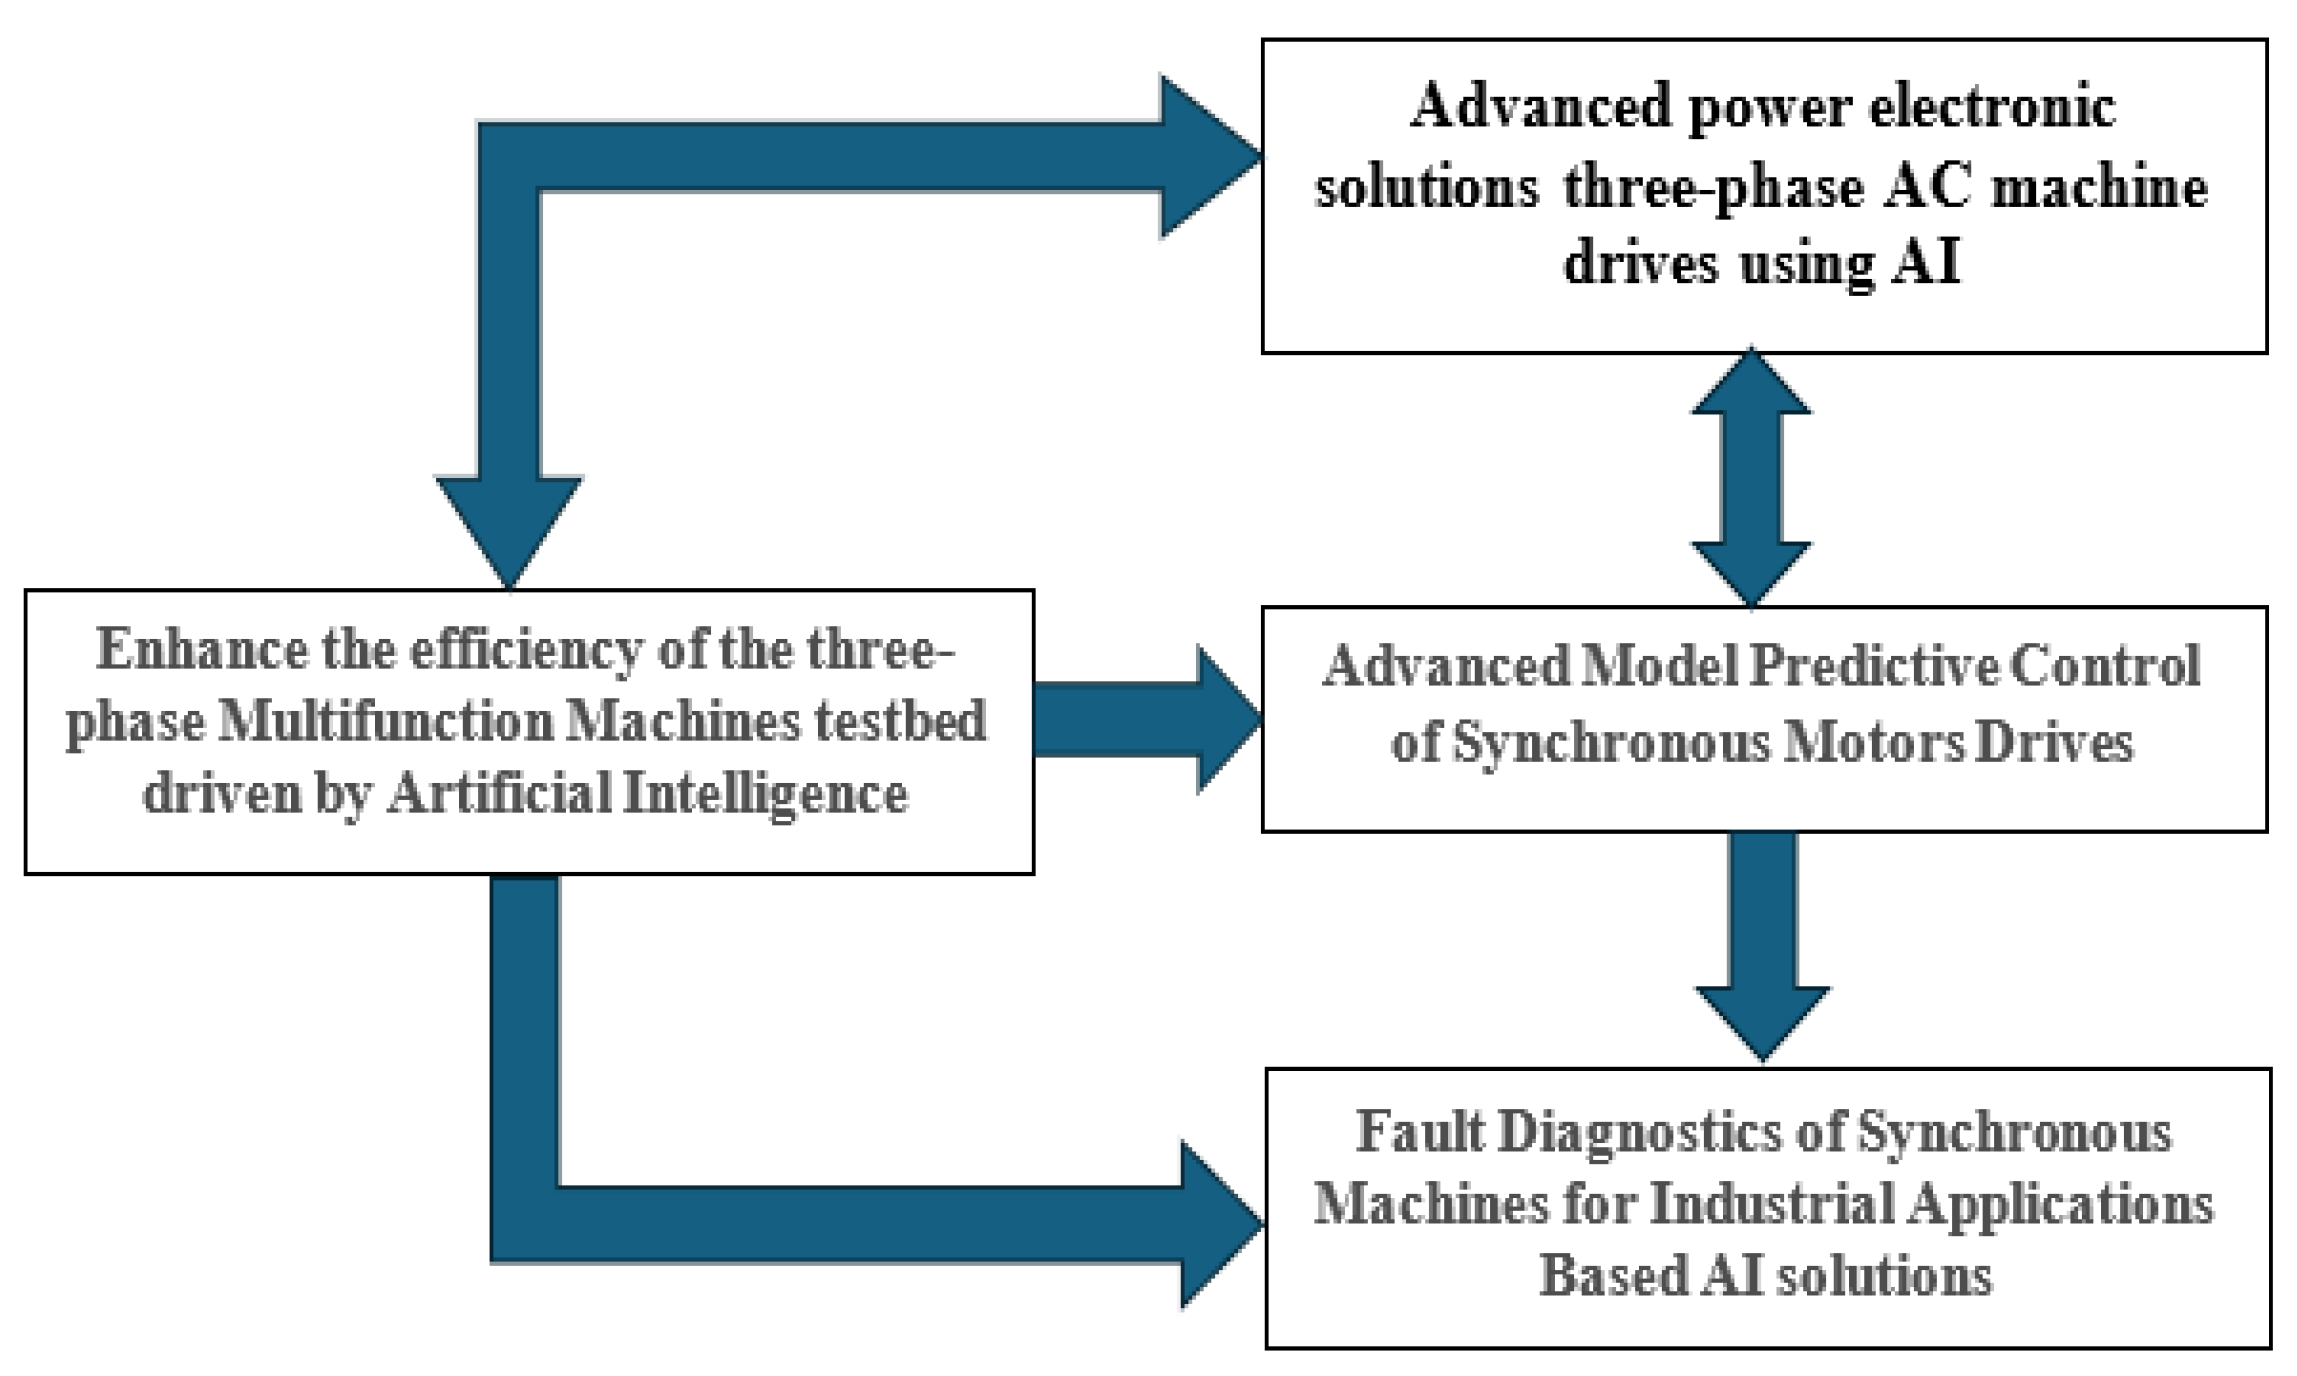
Figure 2.
Integration of the electrical machine domains with AI techniques to address the problems.
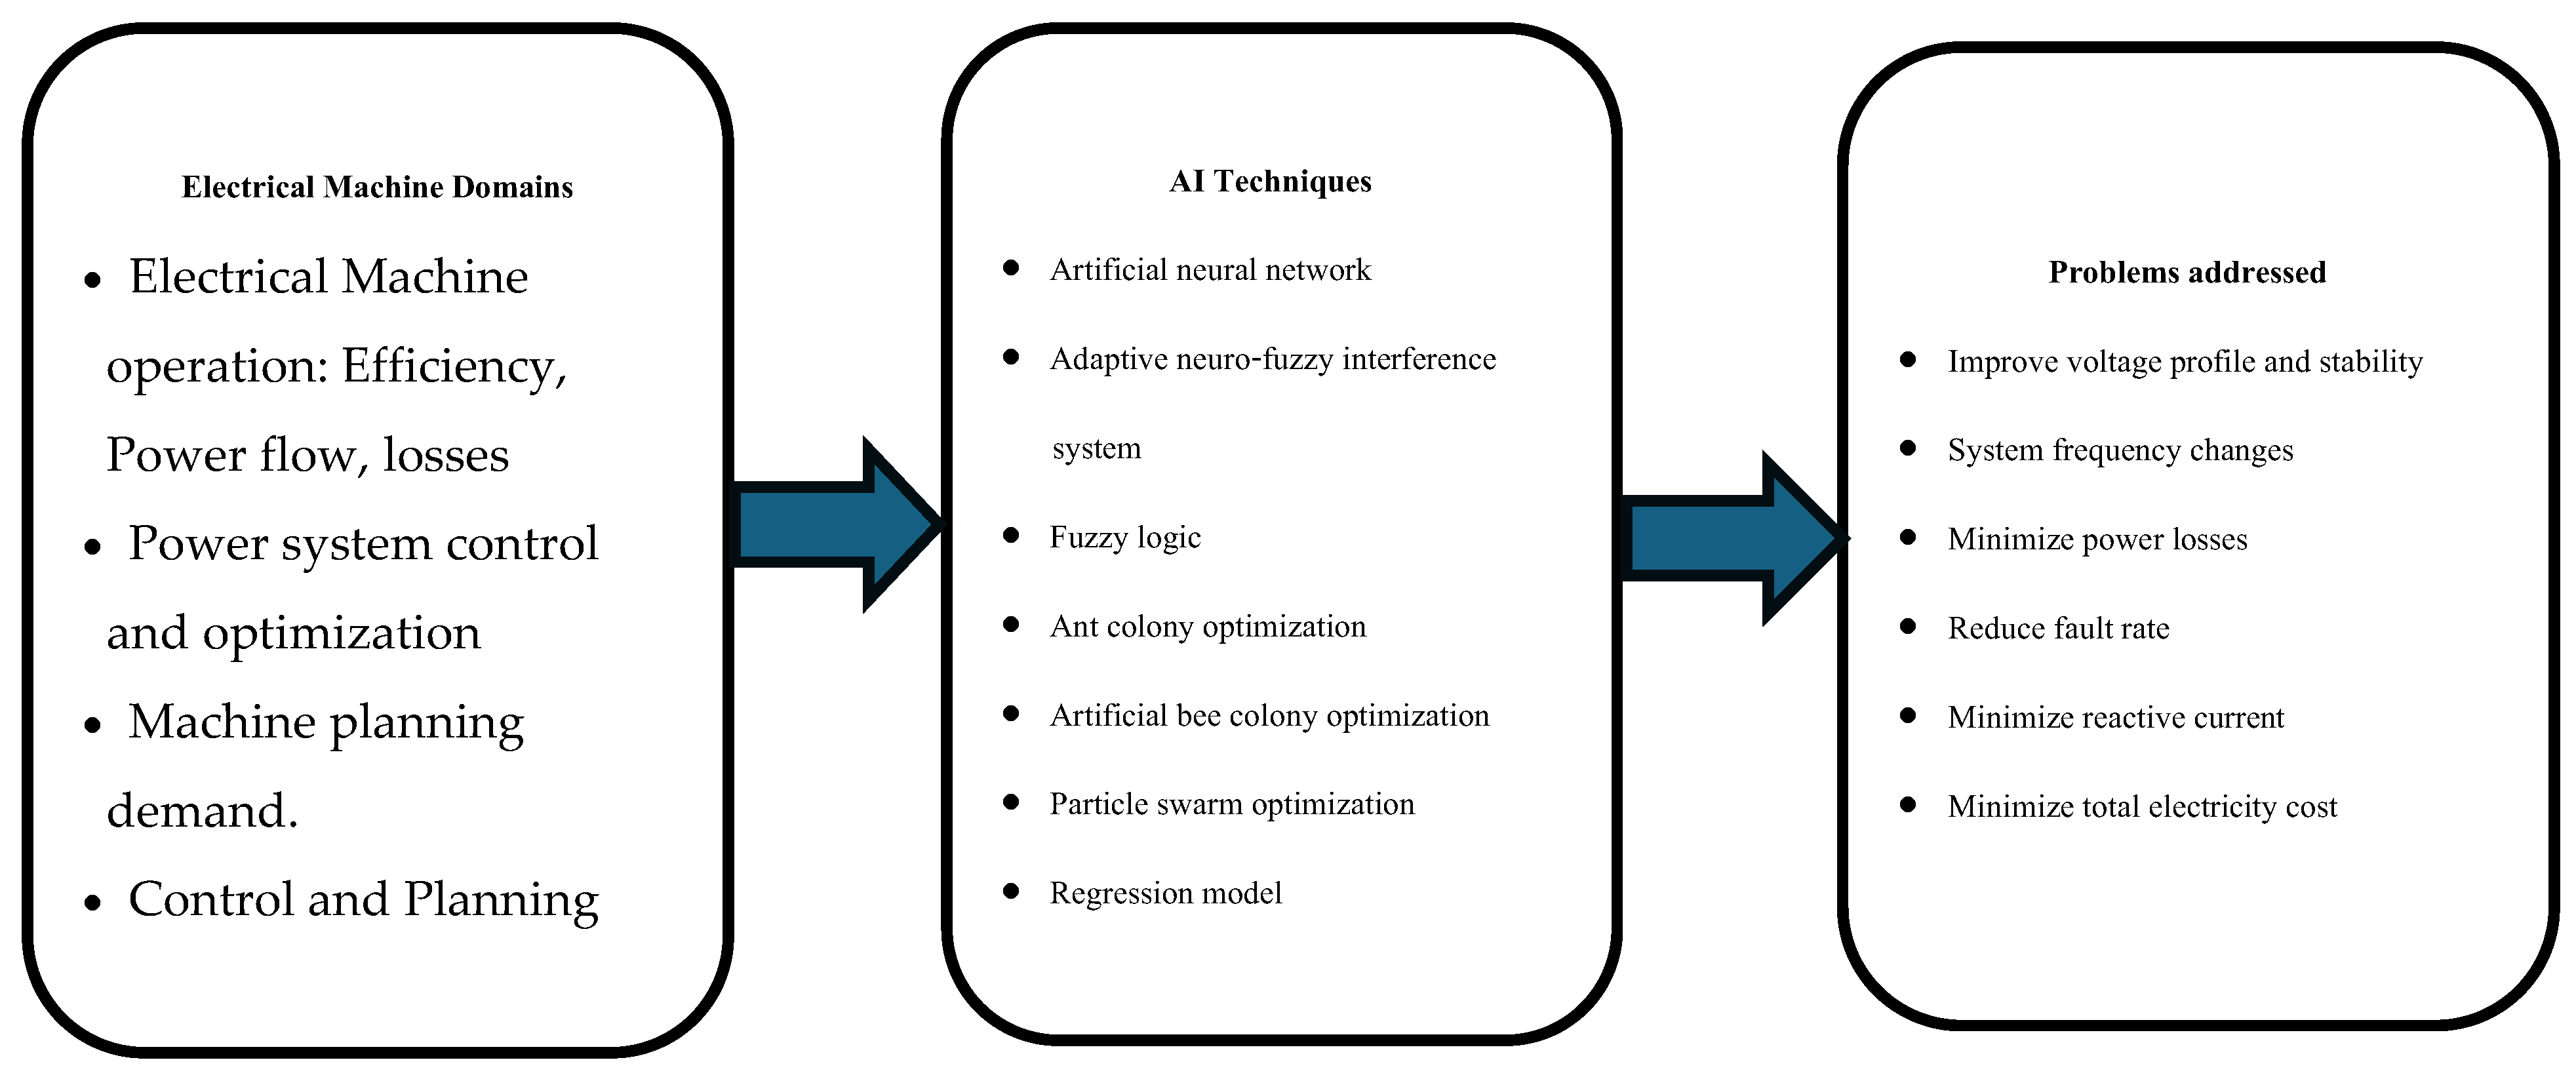
Figure 3.
The memberships used in this research are (a) Fuzzy and (b) ANFIS membership.
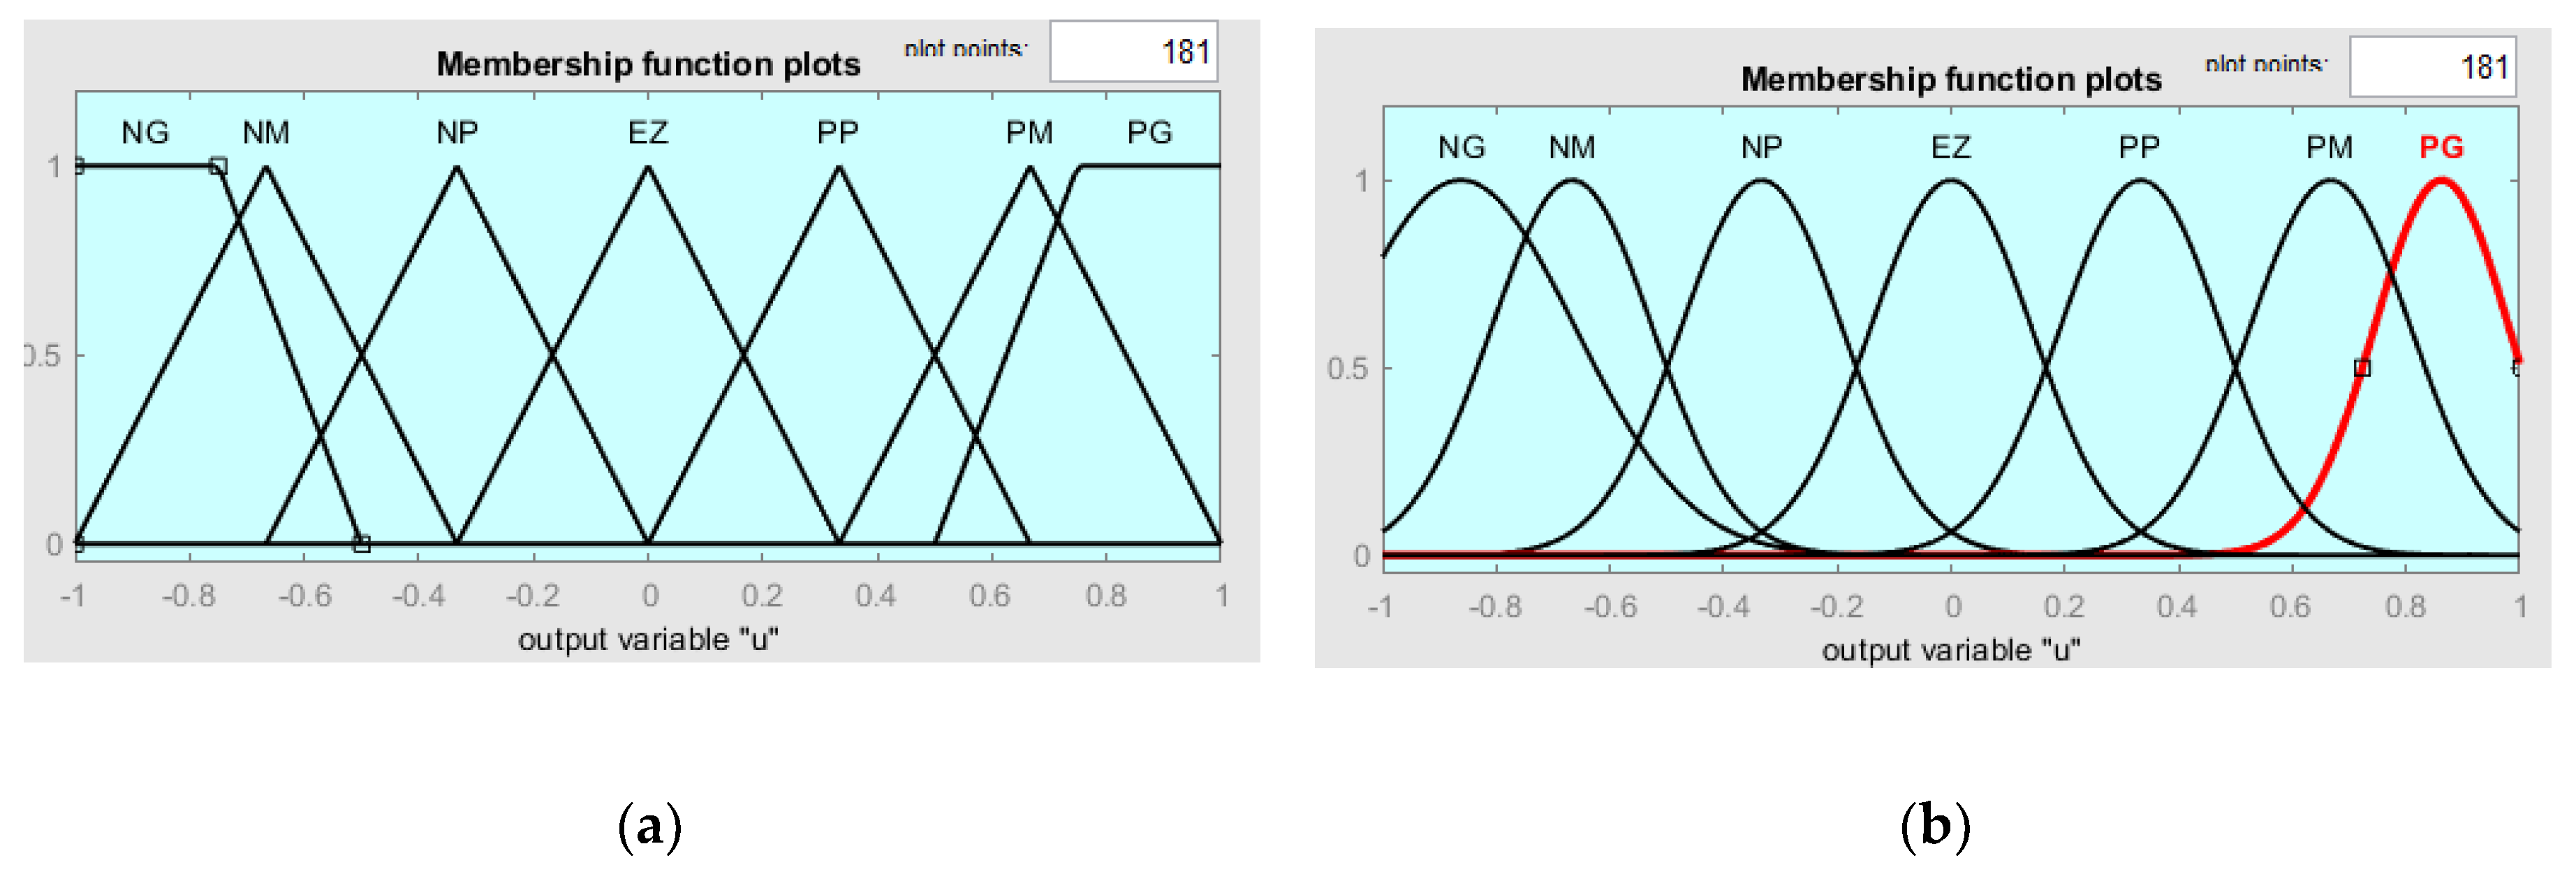
Figure 4.
Proposed Three-phase Multifunction Machines system (a) The wiring diagram. (b) The hardware connection.
Figure 4.
Proposed Three-phase Multifunction Machines system (a) The wiring diagram. (b) The hardware connection.
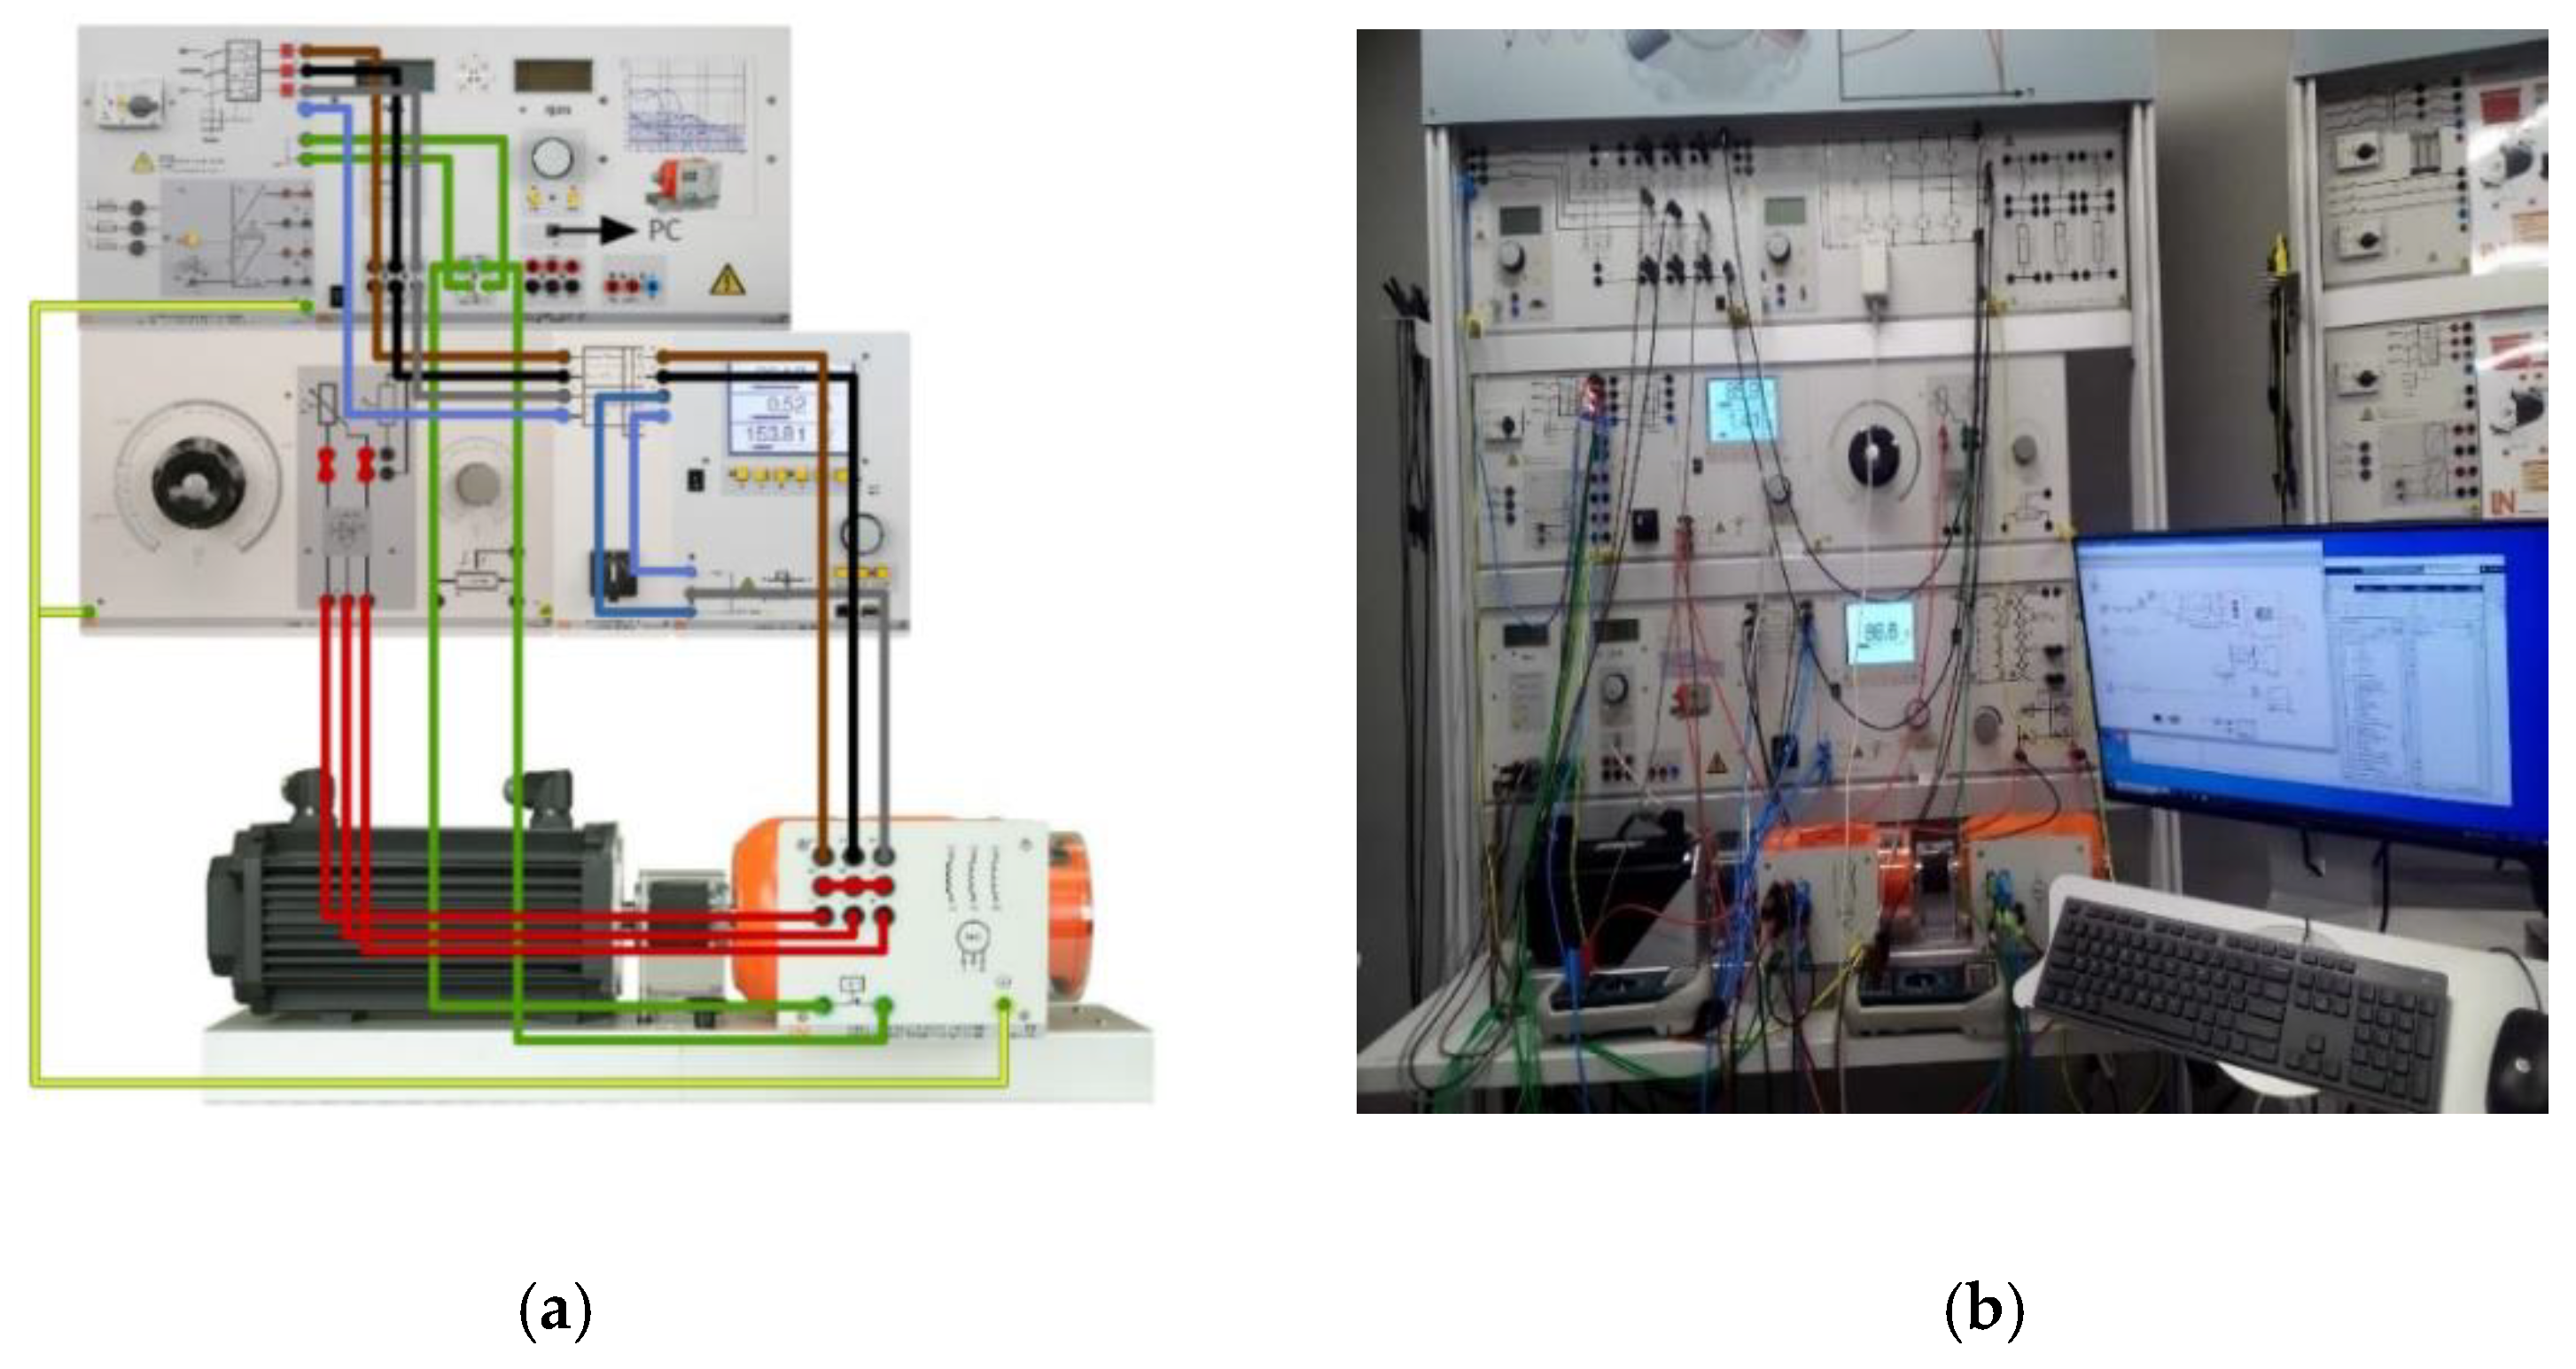
Figure 5.
The RCF device terminal definition.
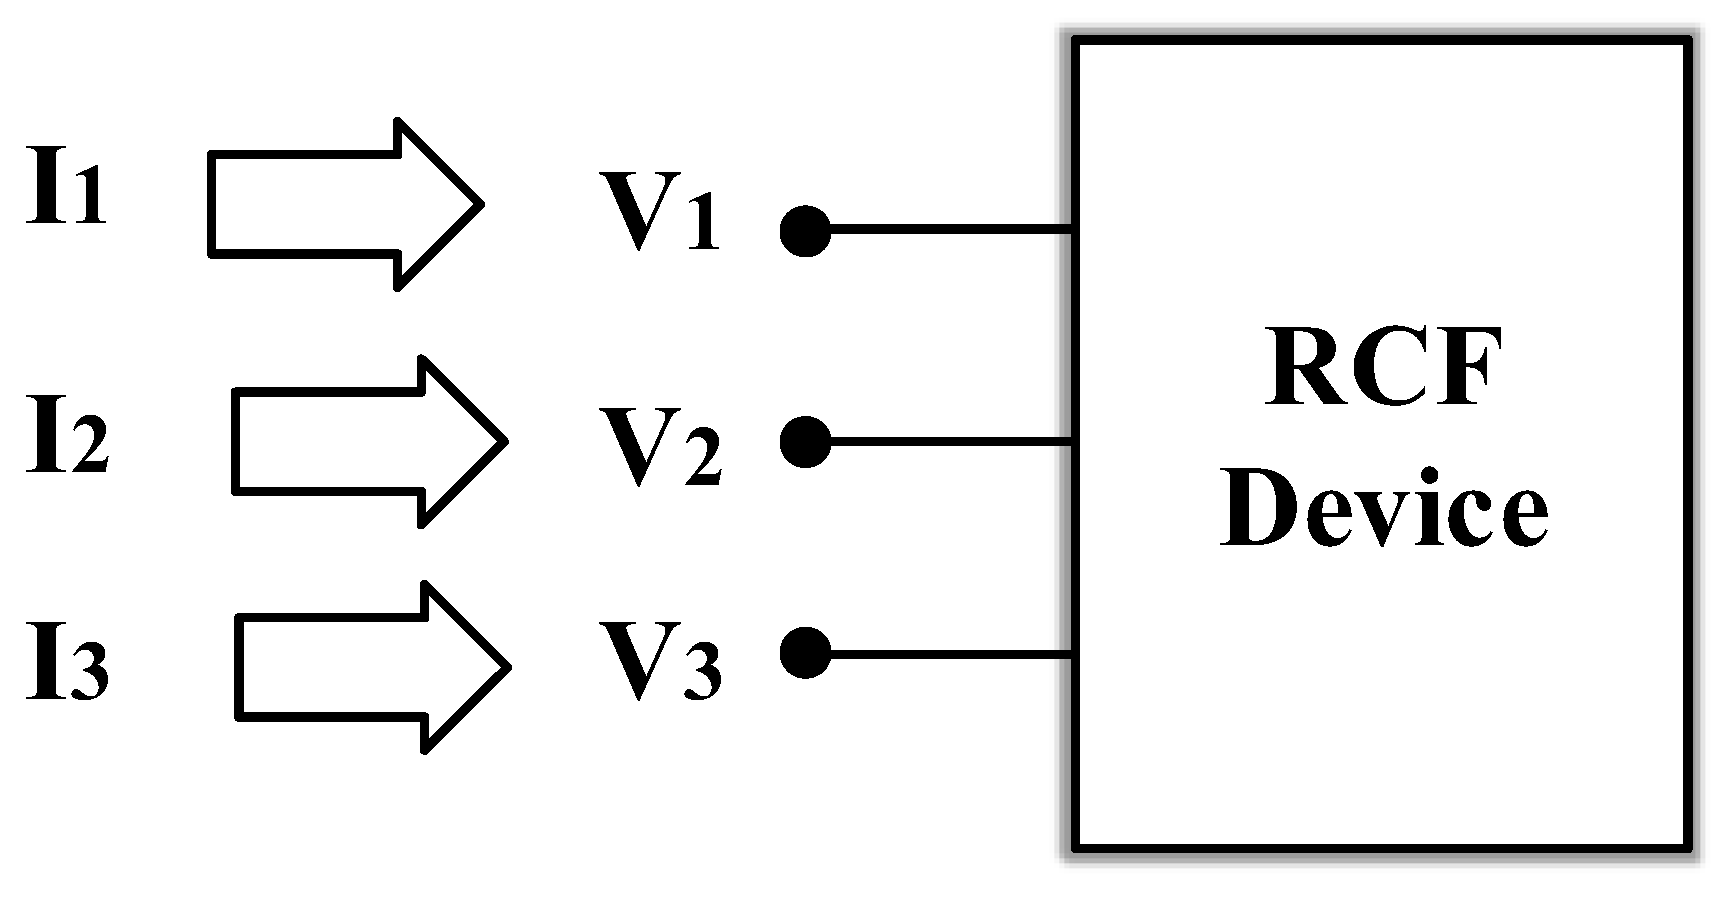
Figure 6.
Closed-loop system.
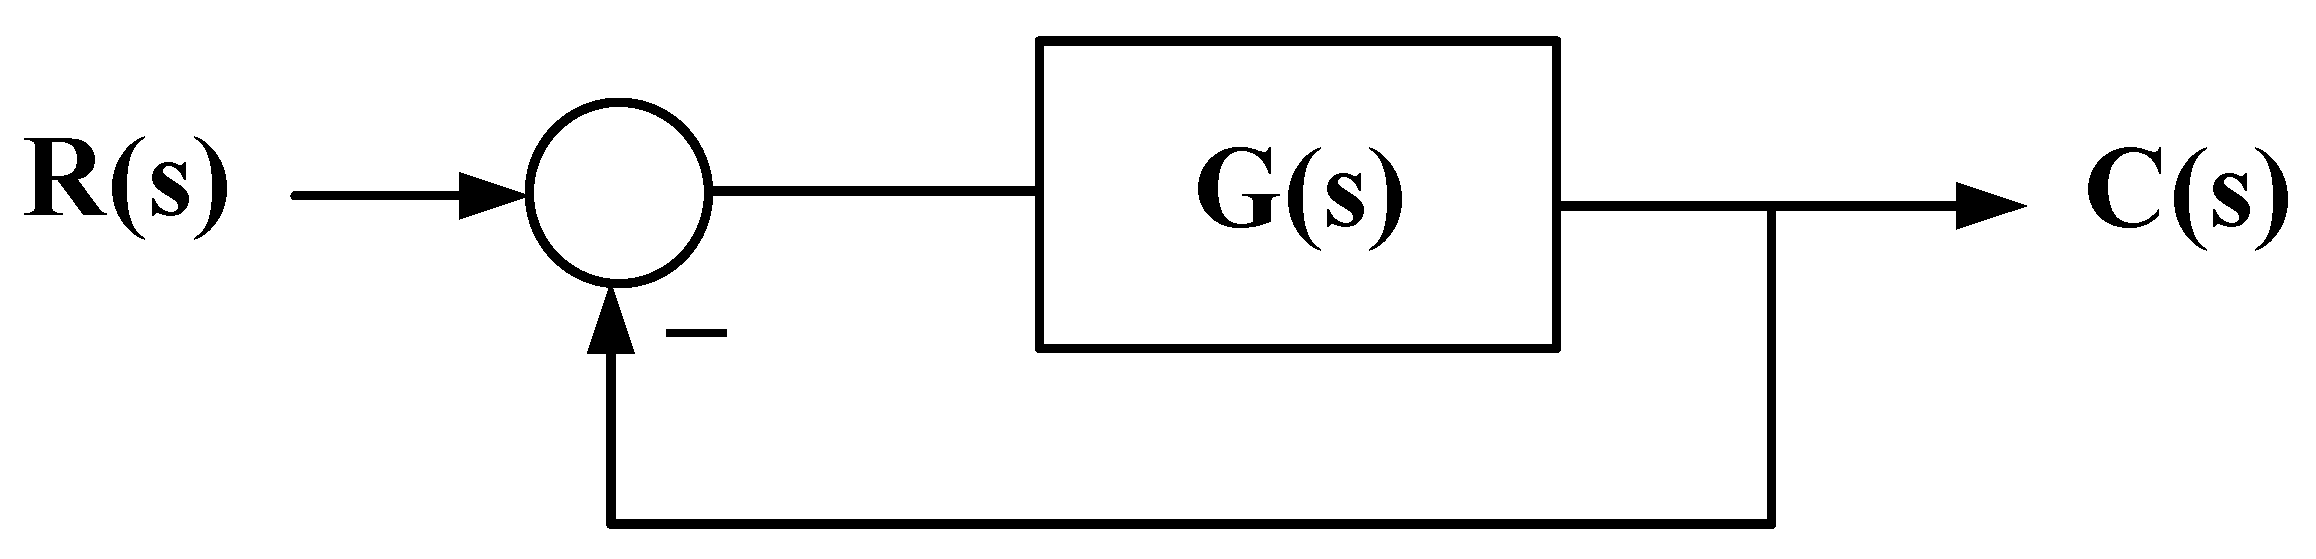
Figure 7.
[M1] Time response of the second order.
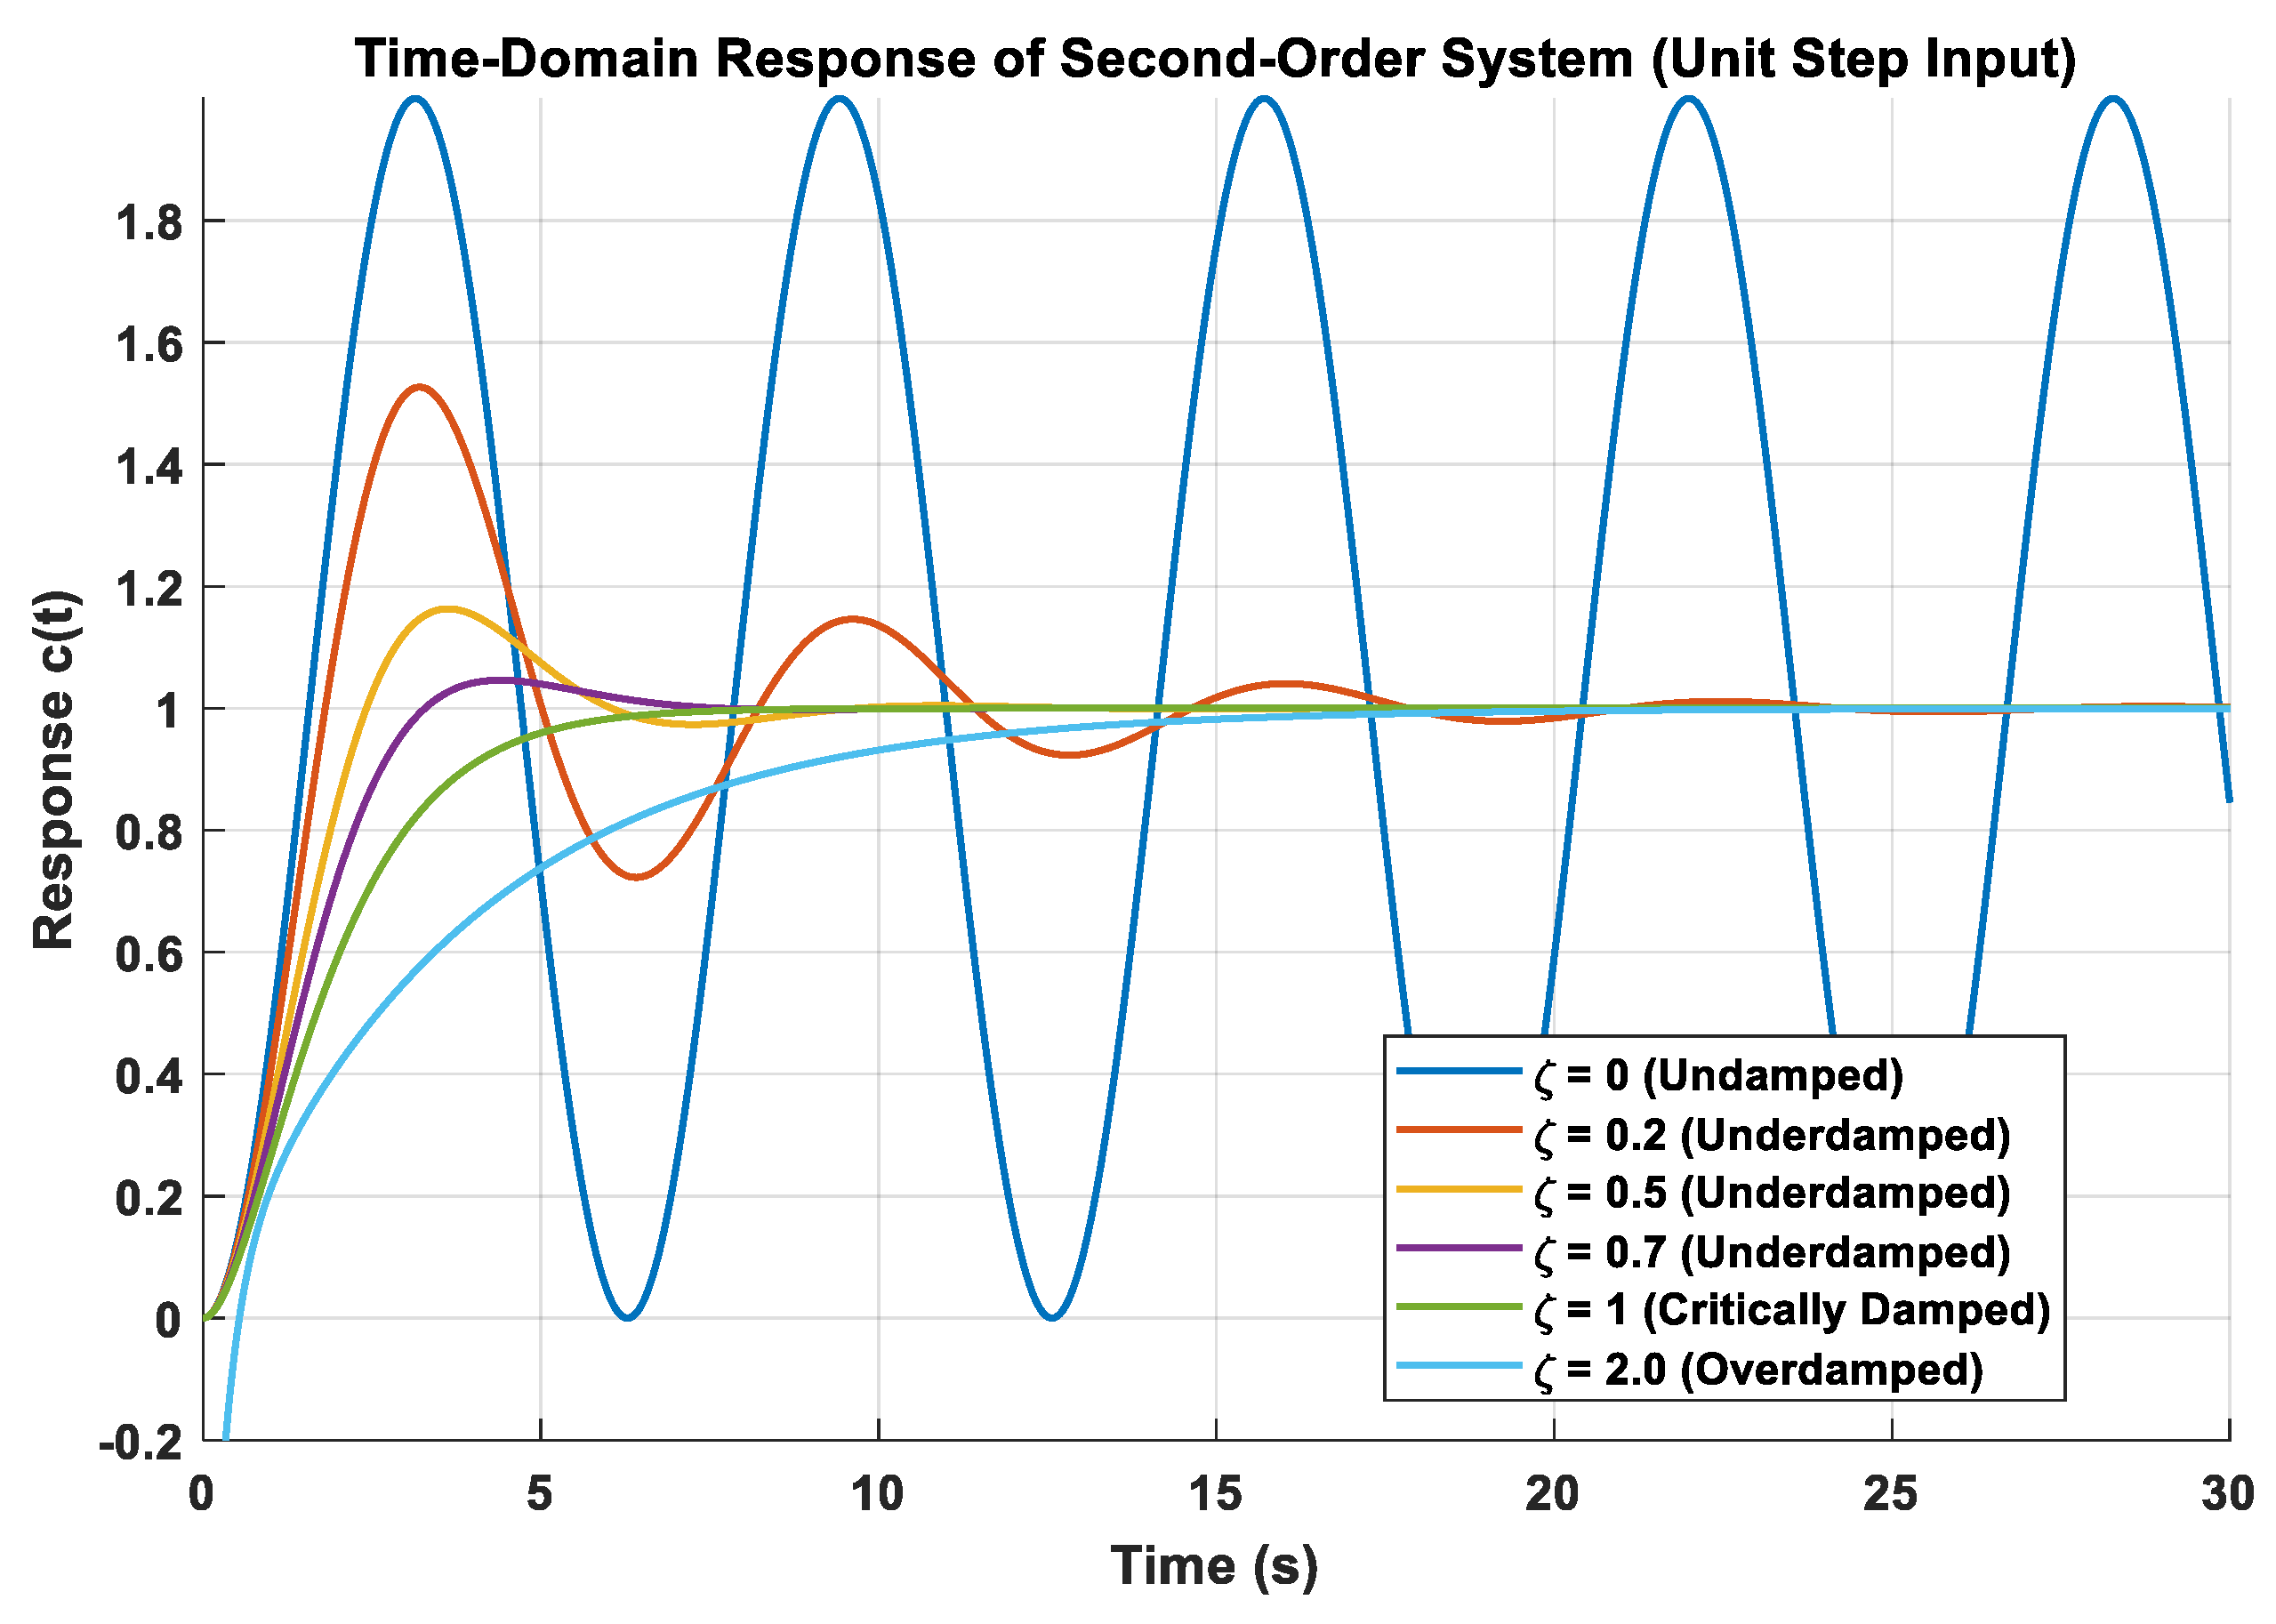
Figure 8.
MATLAB /Simulink interfaced with Lucas-Nülle machine lab.
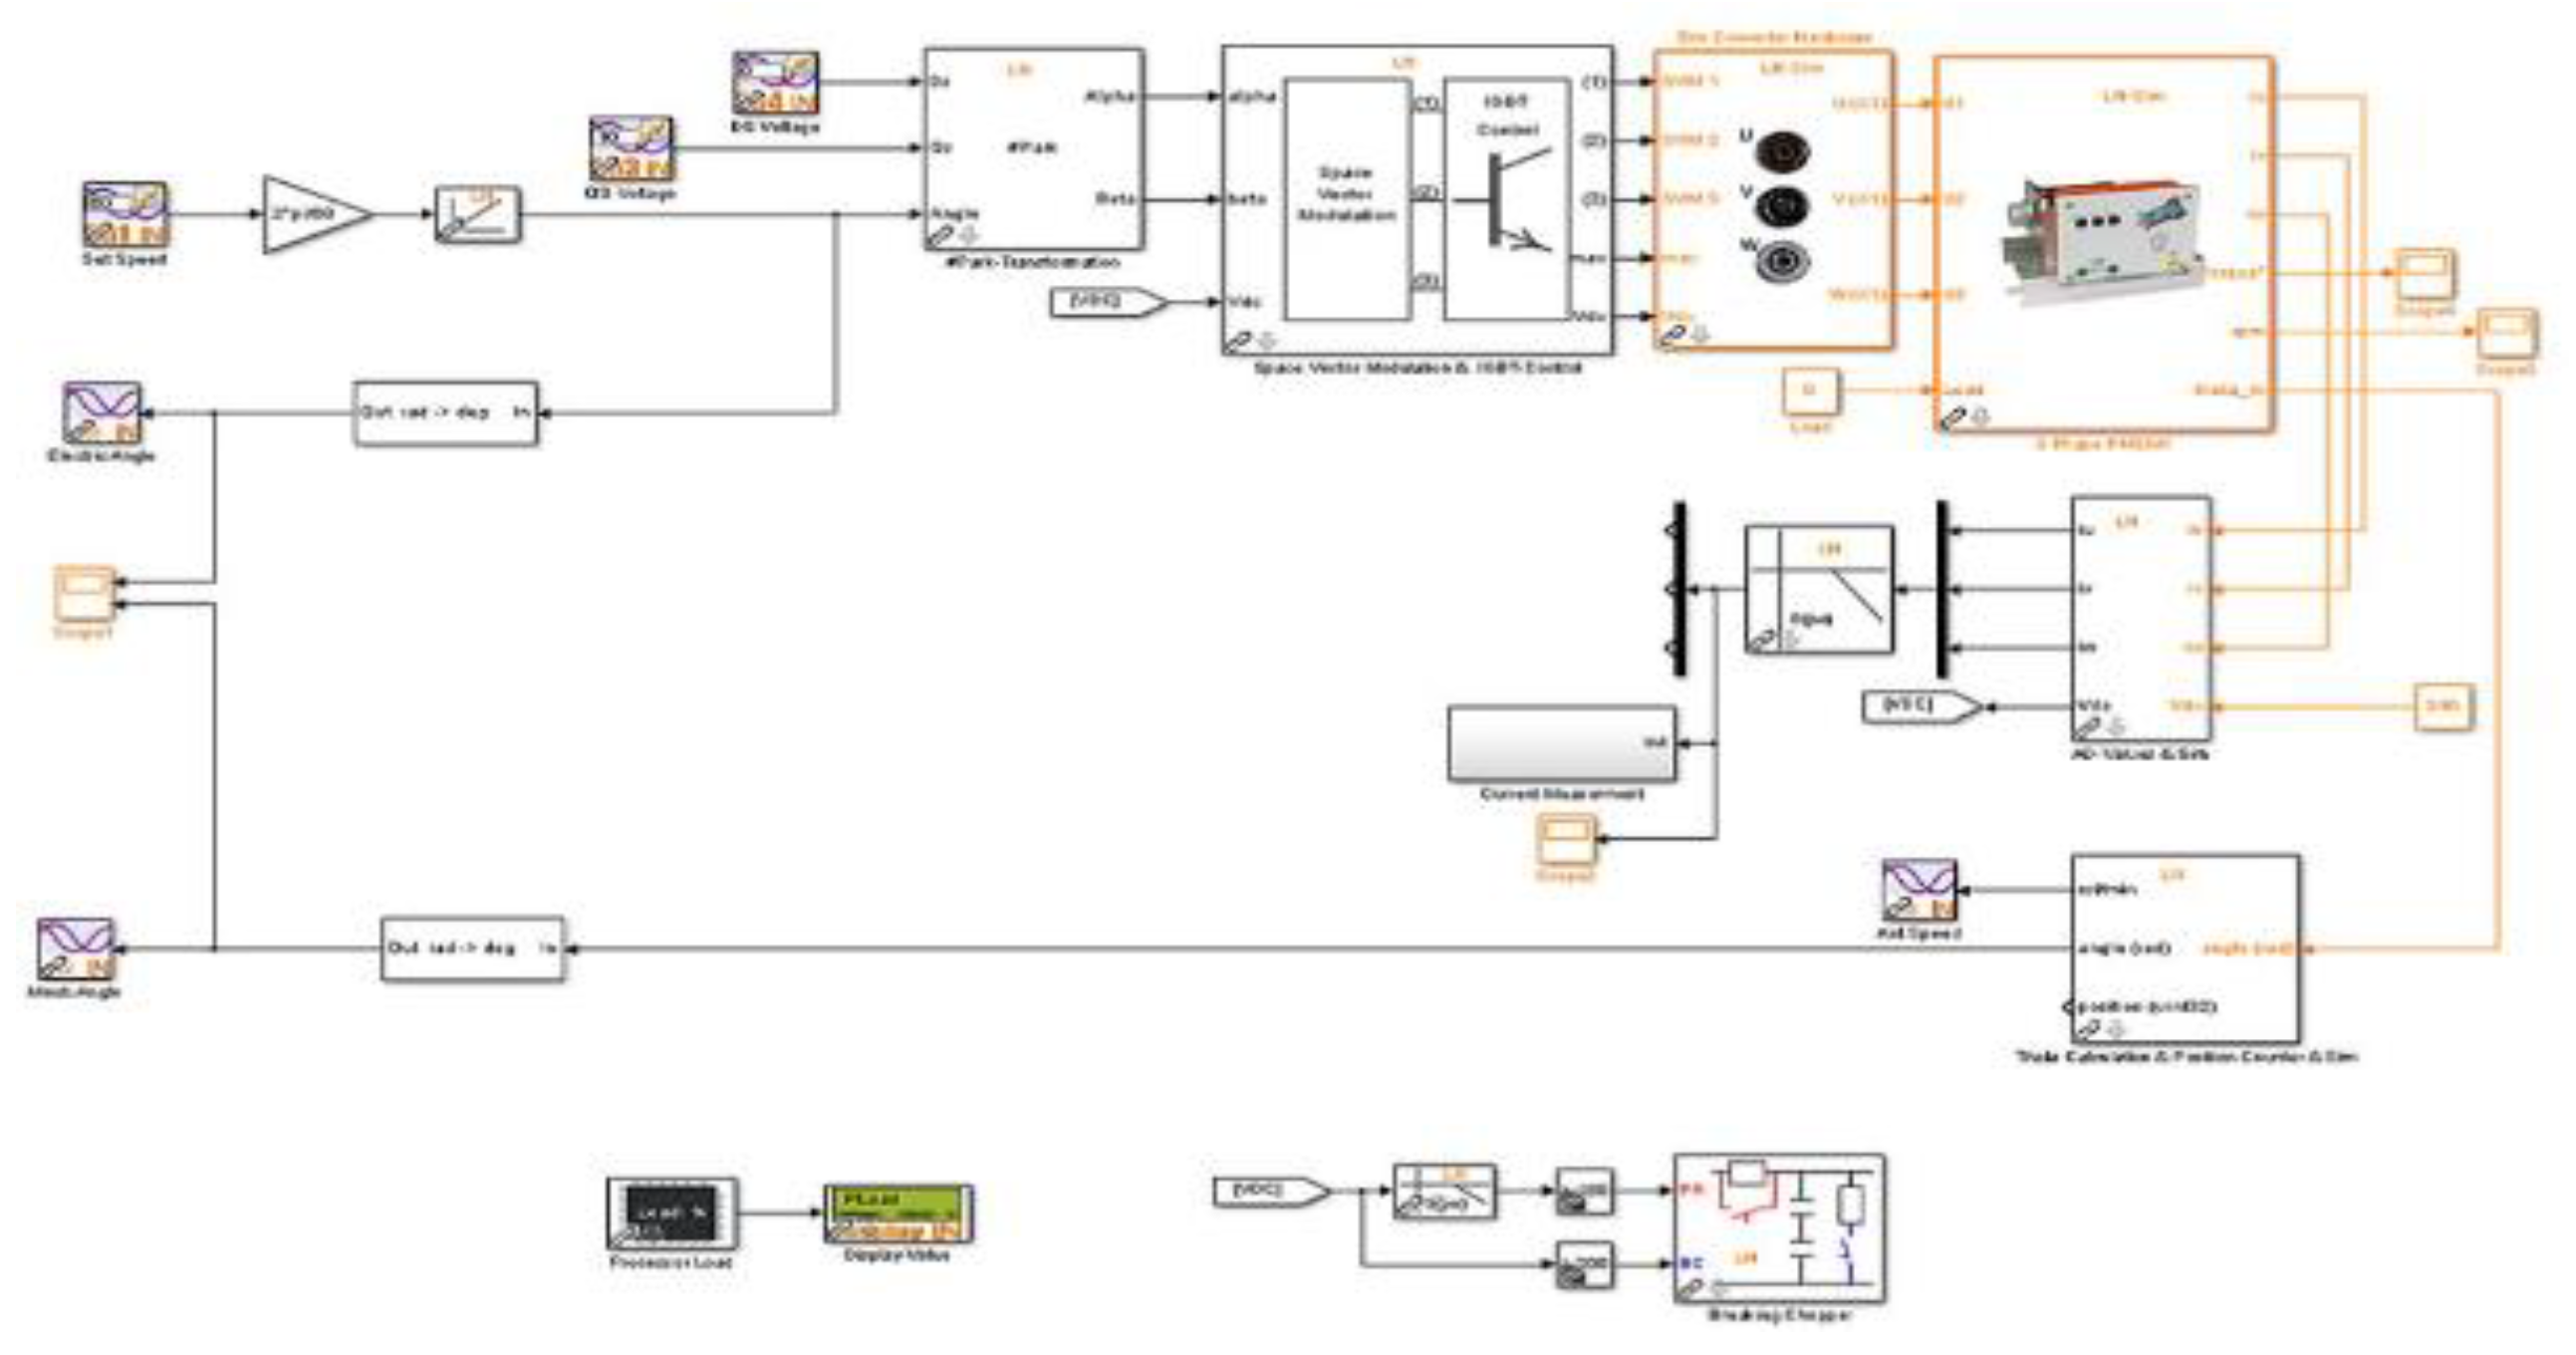
Figure 9.
MATLAB /Simulink interfaced with Lucas-Nülle machine lab using ANFIS control.
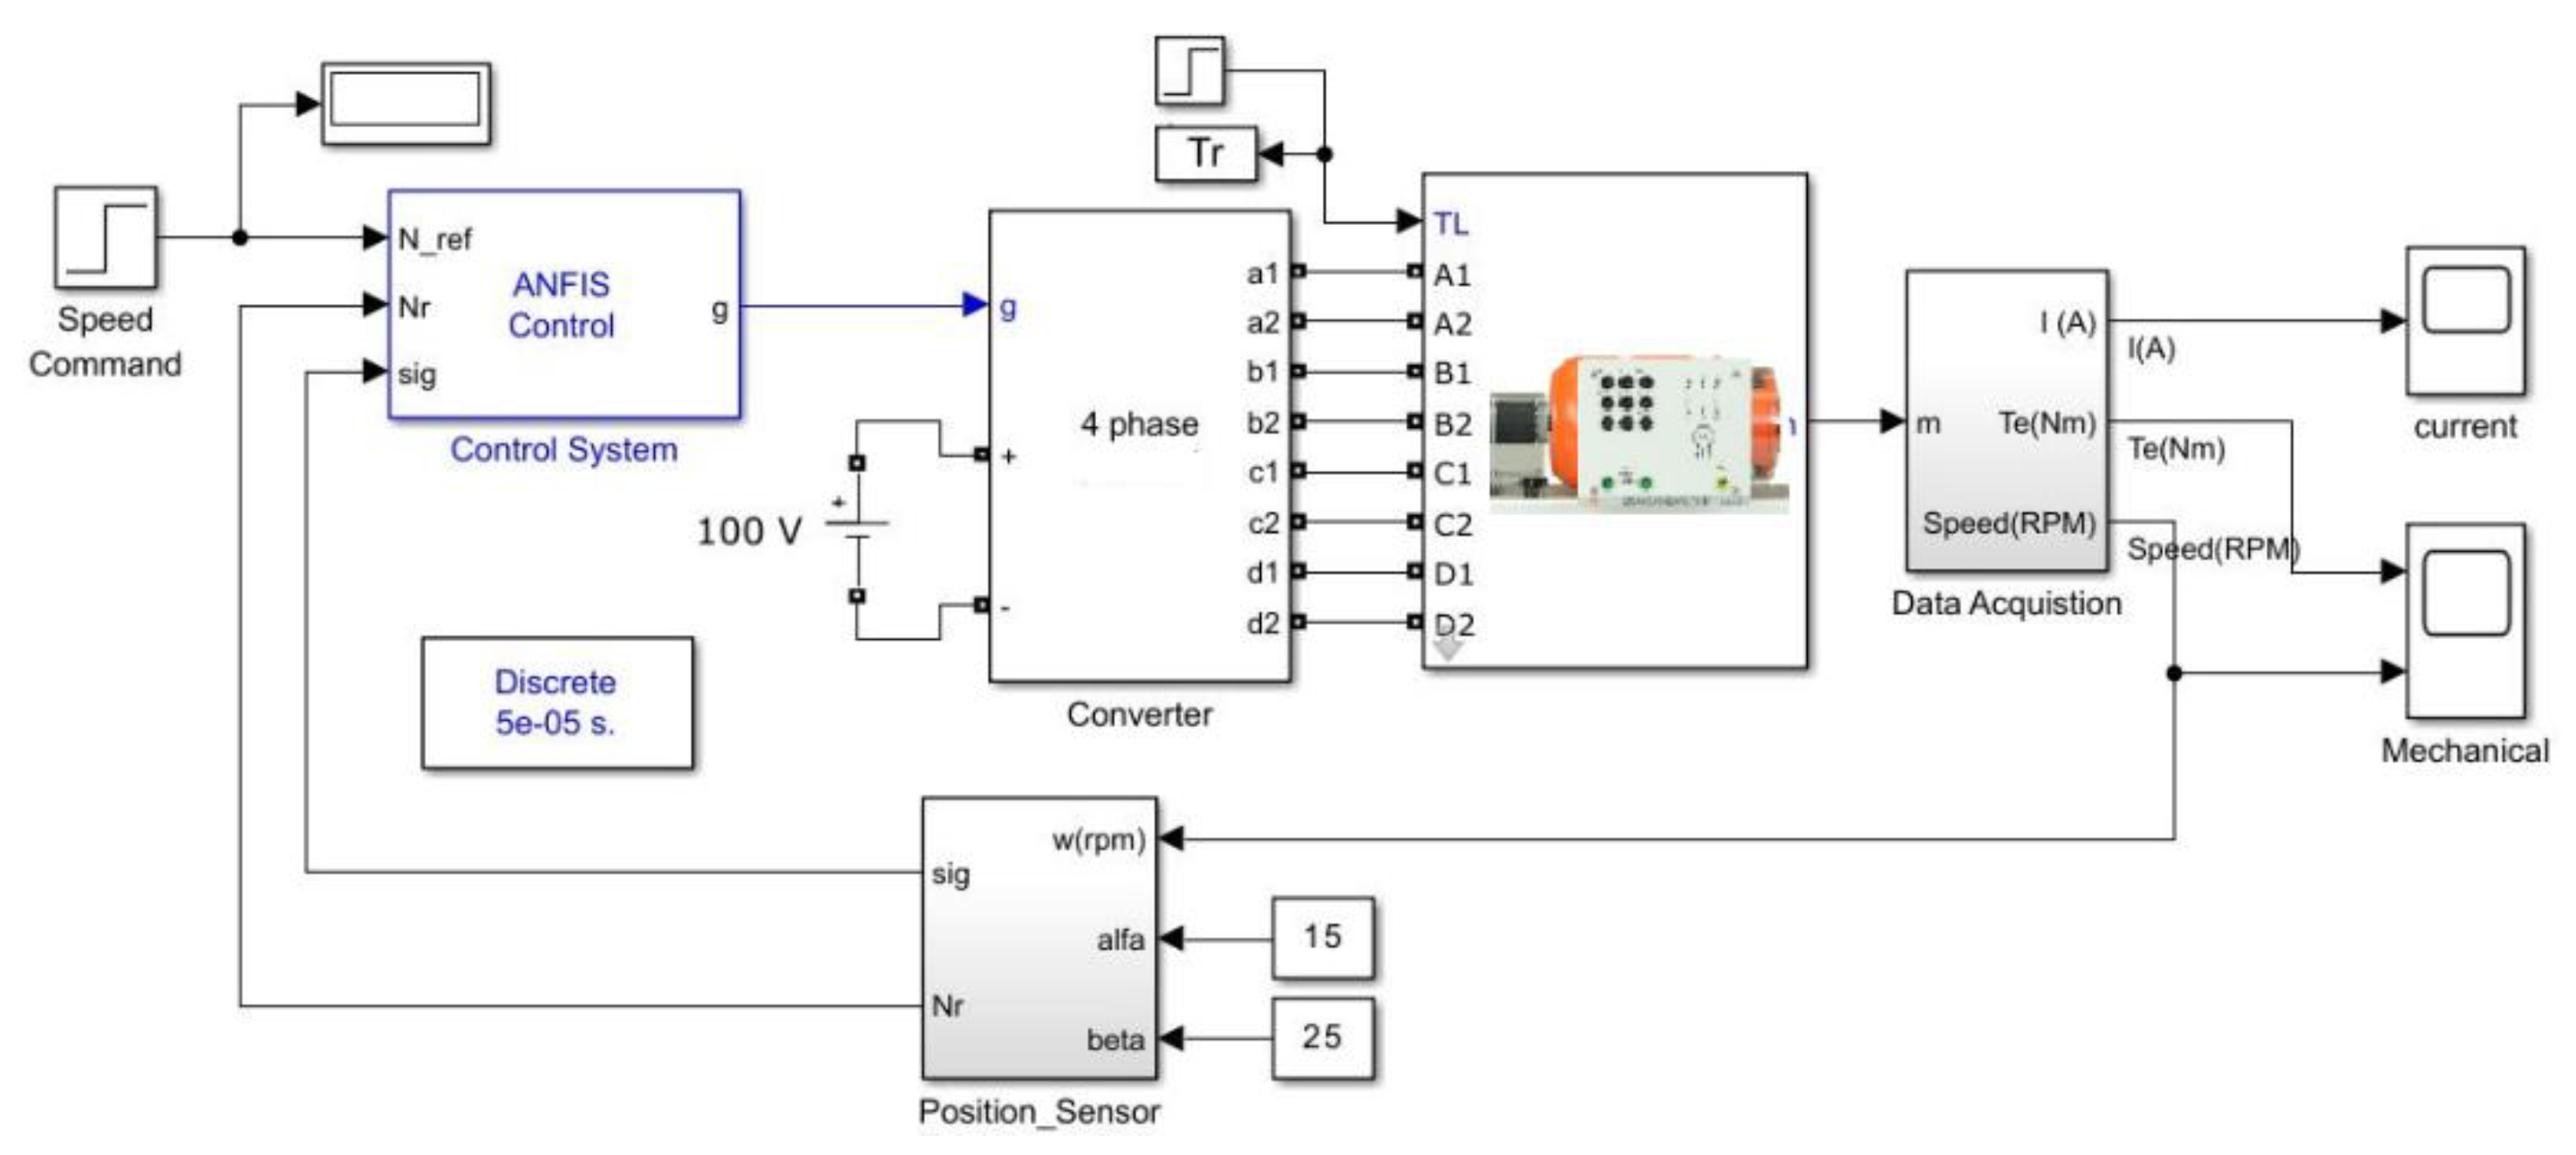
Figure 10.
Internal ANFIS subsystem.
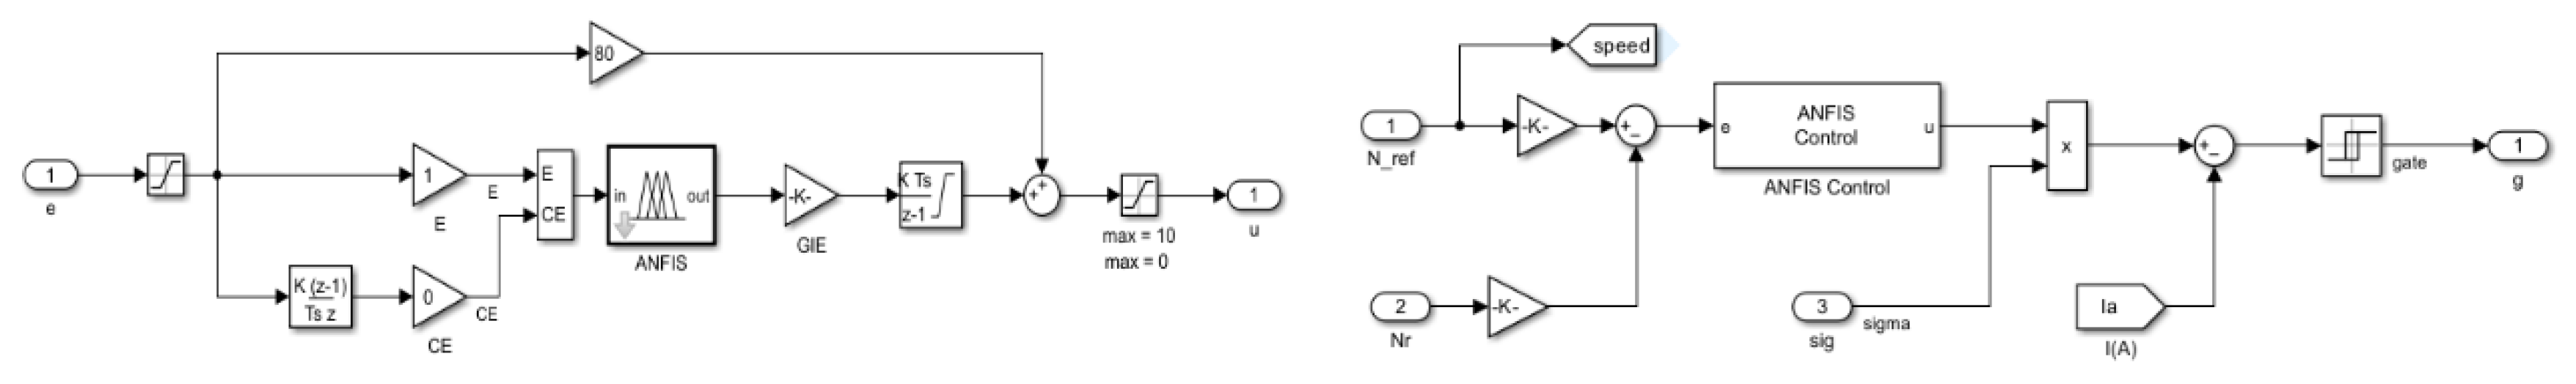
Figure 11.
The internal subsystem of the fault diagnostics of synchronous machines.
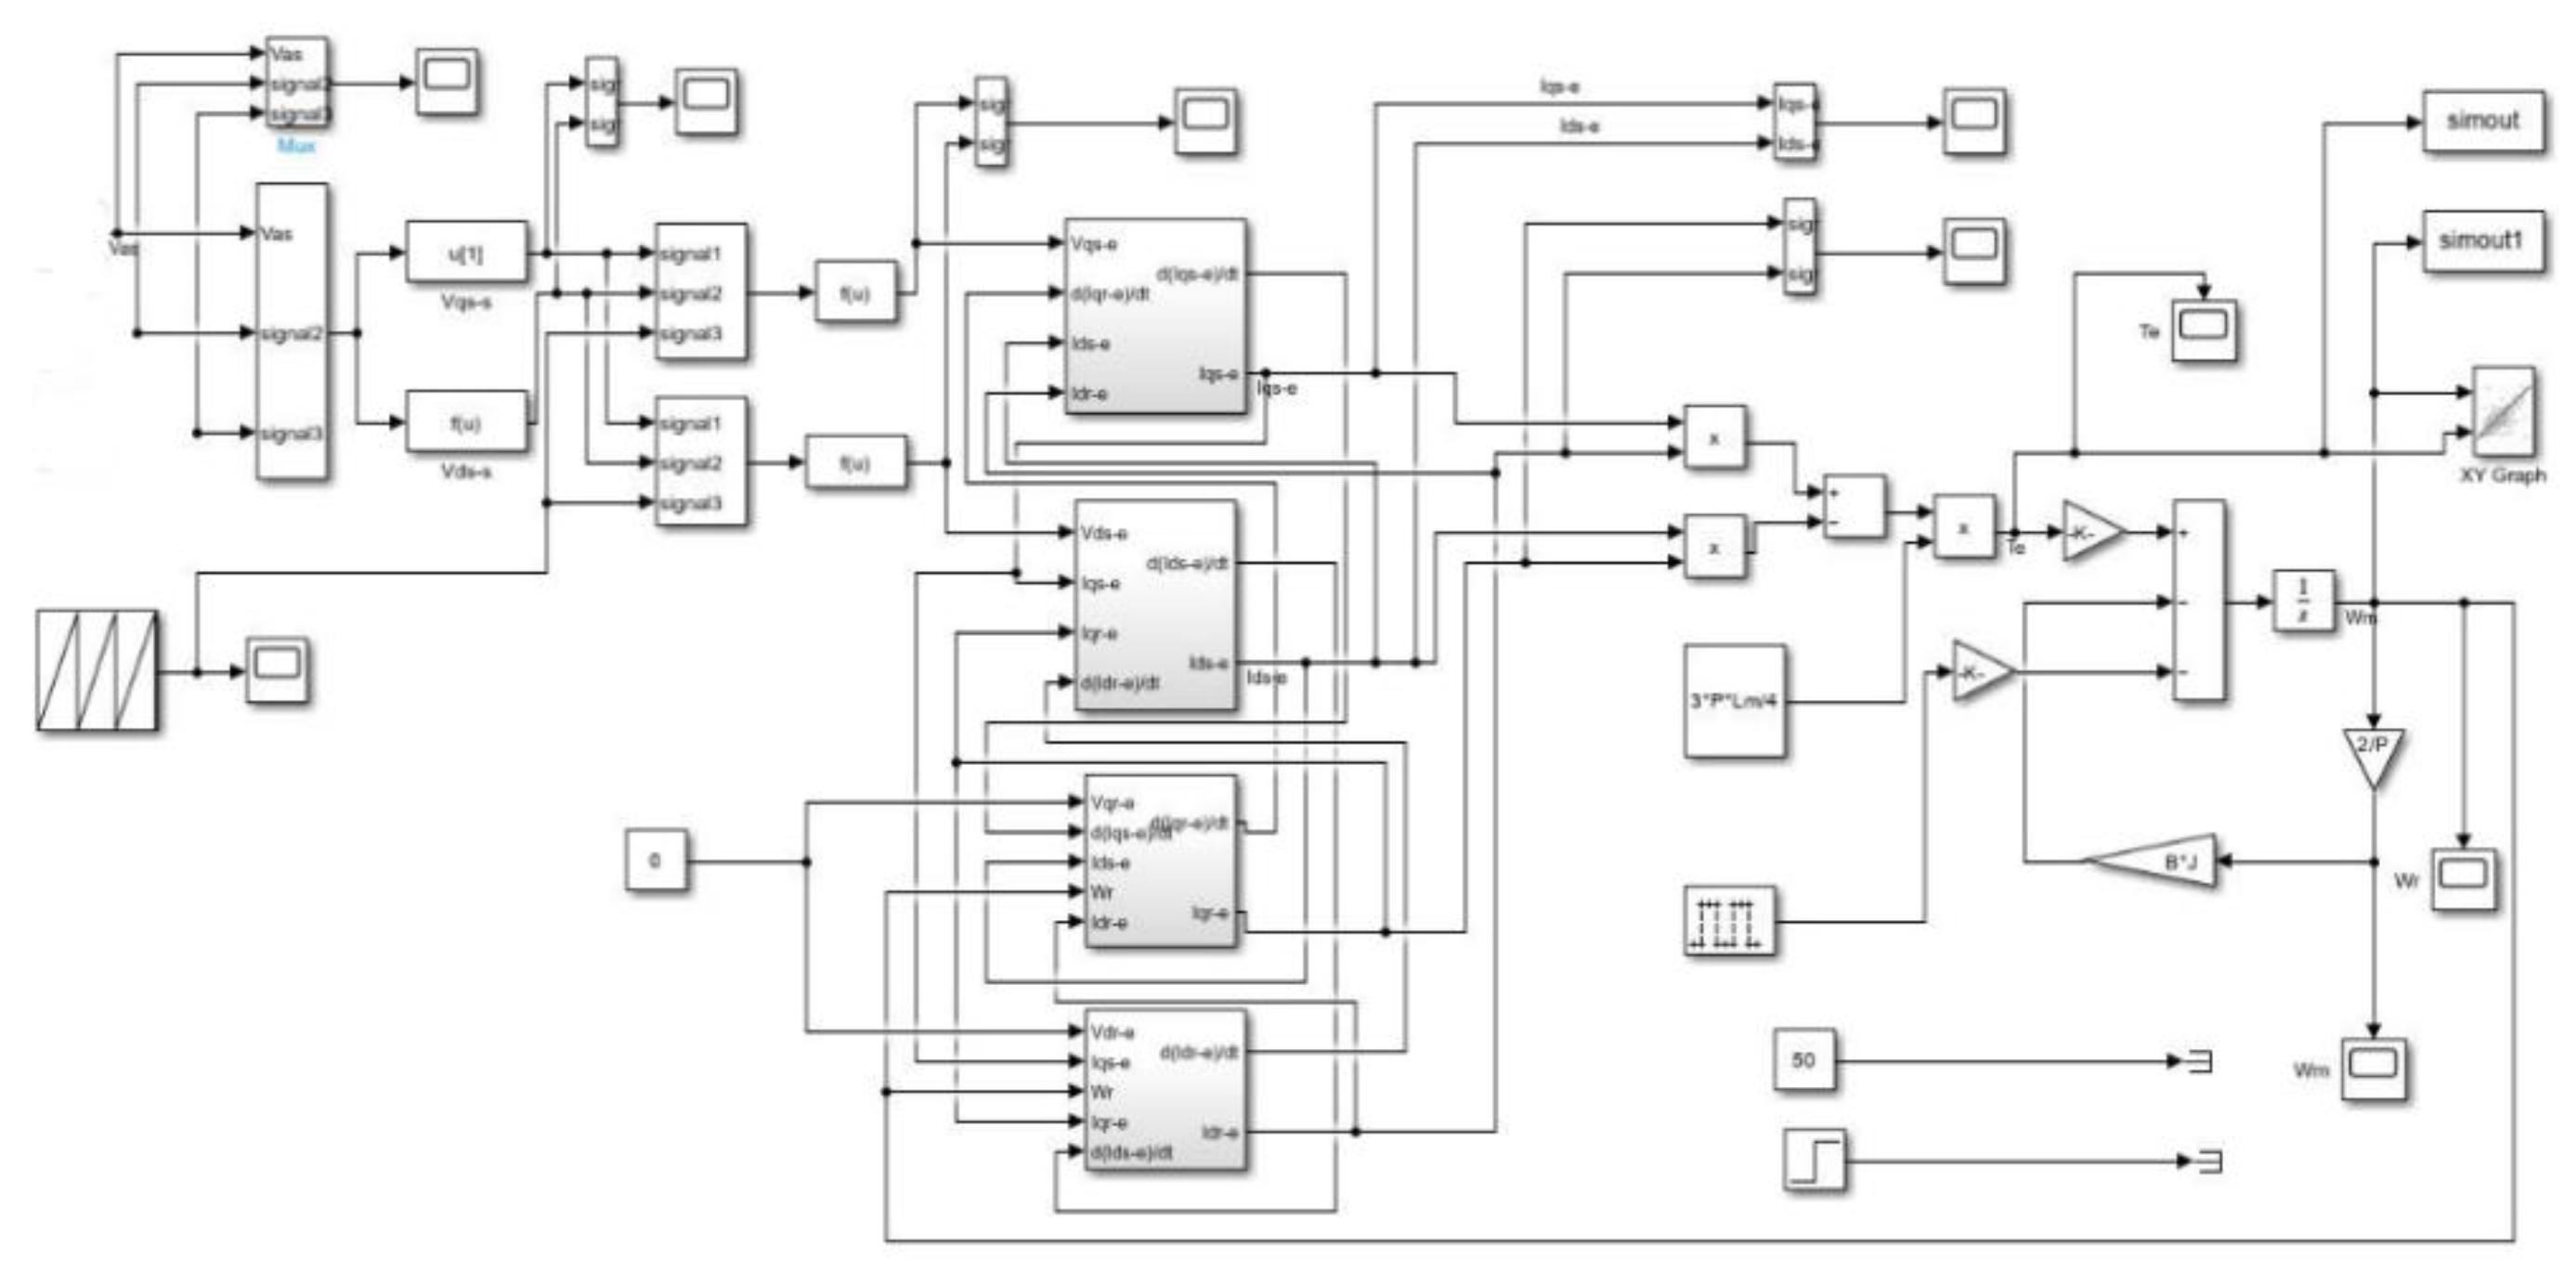
Figure 12.
Motor characteristics with and without control are (a) motor current vs excitation current, (b) mechanical torque vs motor current, (c) excitation current vs. power factor, and (d) torque-speed characteristics.
Figure 12.
Motor characteristics with and without control are (a) motor current vs excitation current, (b) mechanical torque vs motor current, (c) excitation current vs. power factor, and (d) torque-speed characteristics.
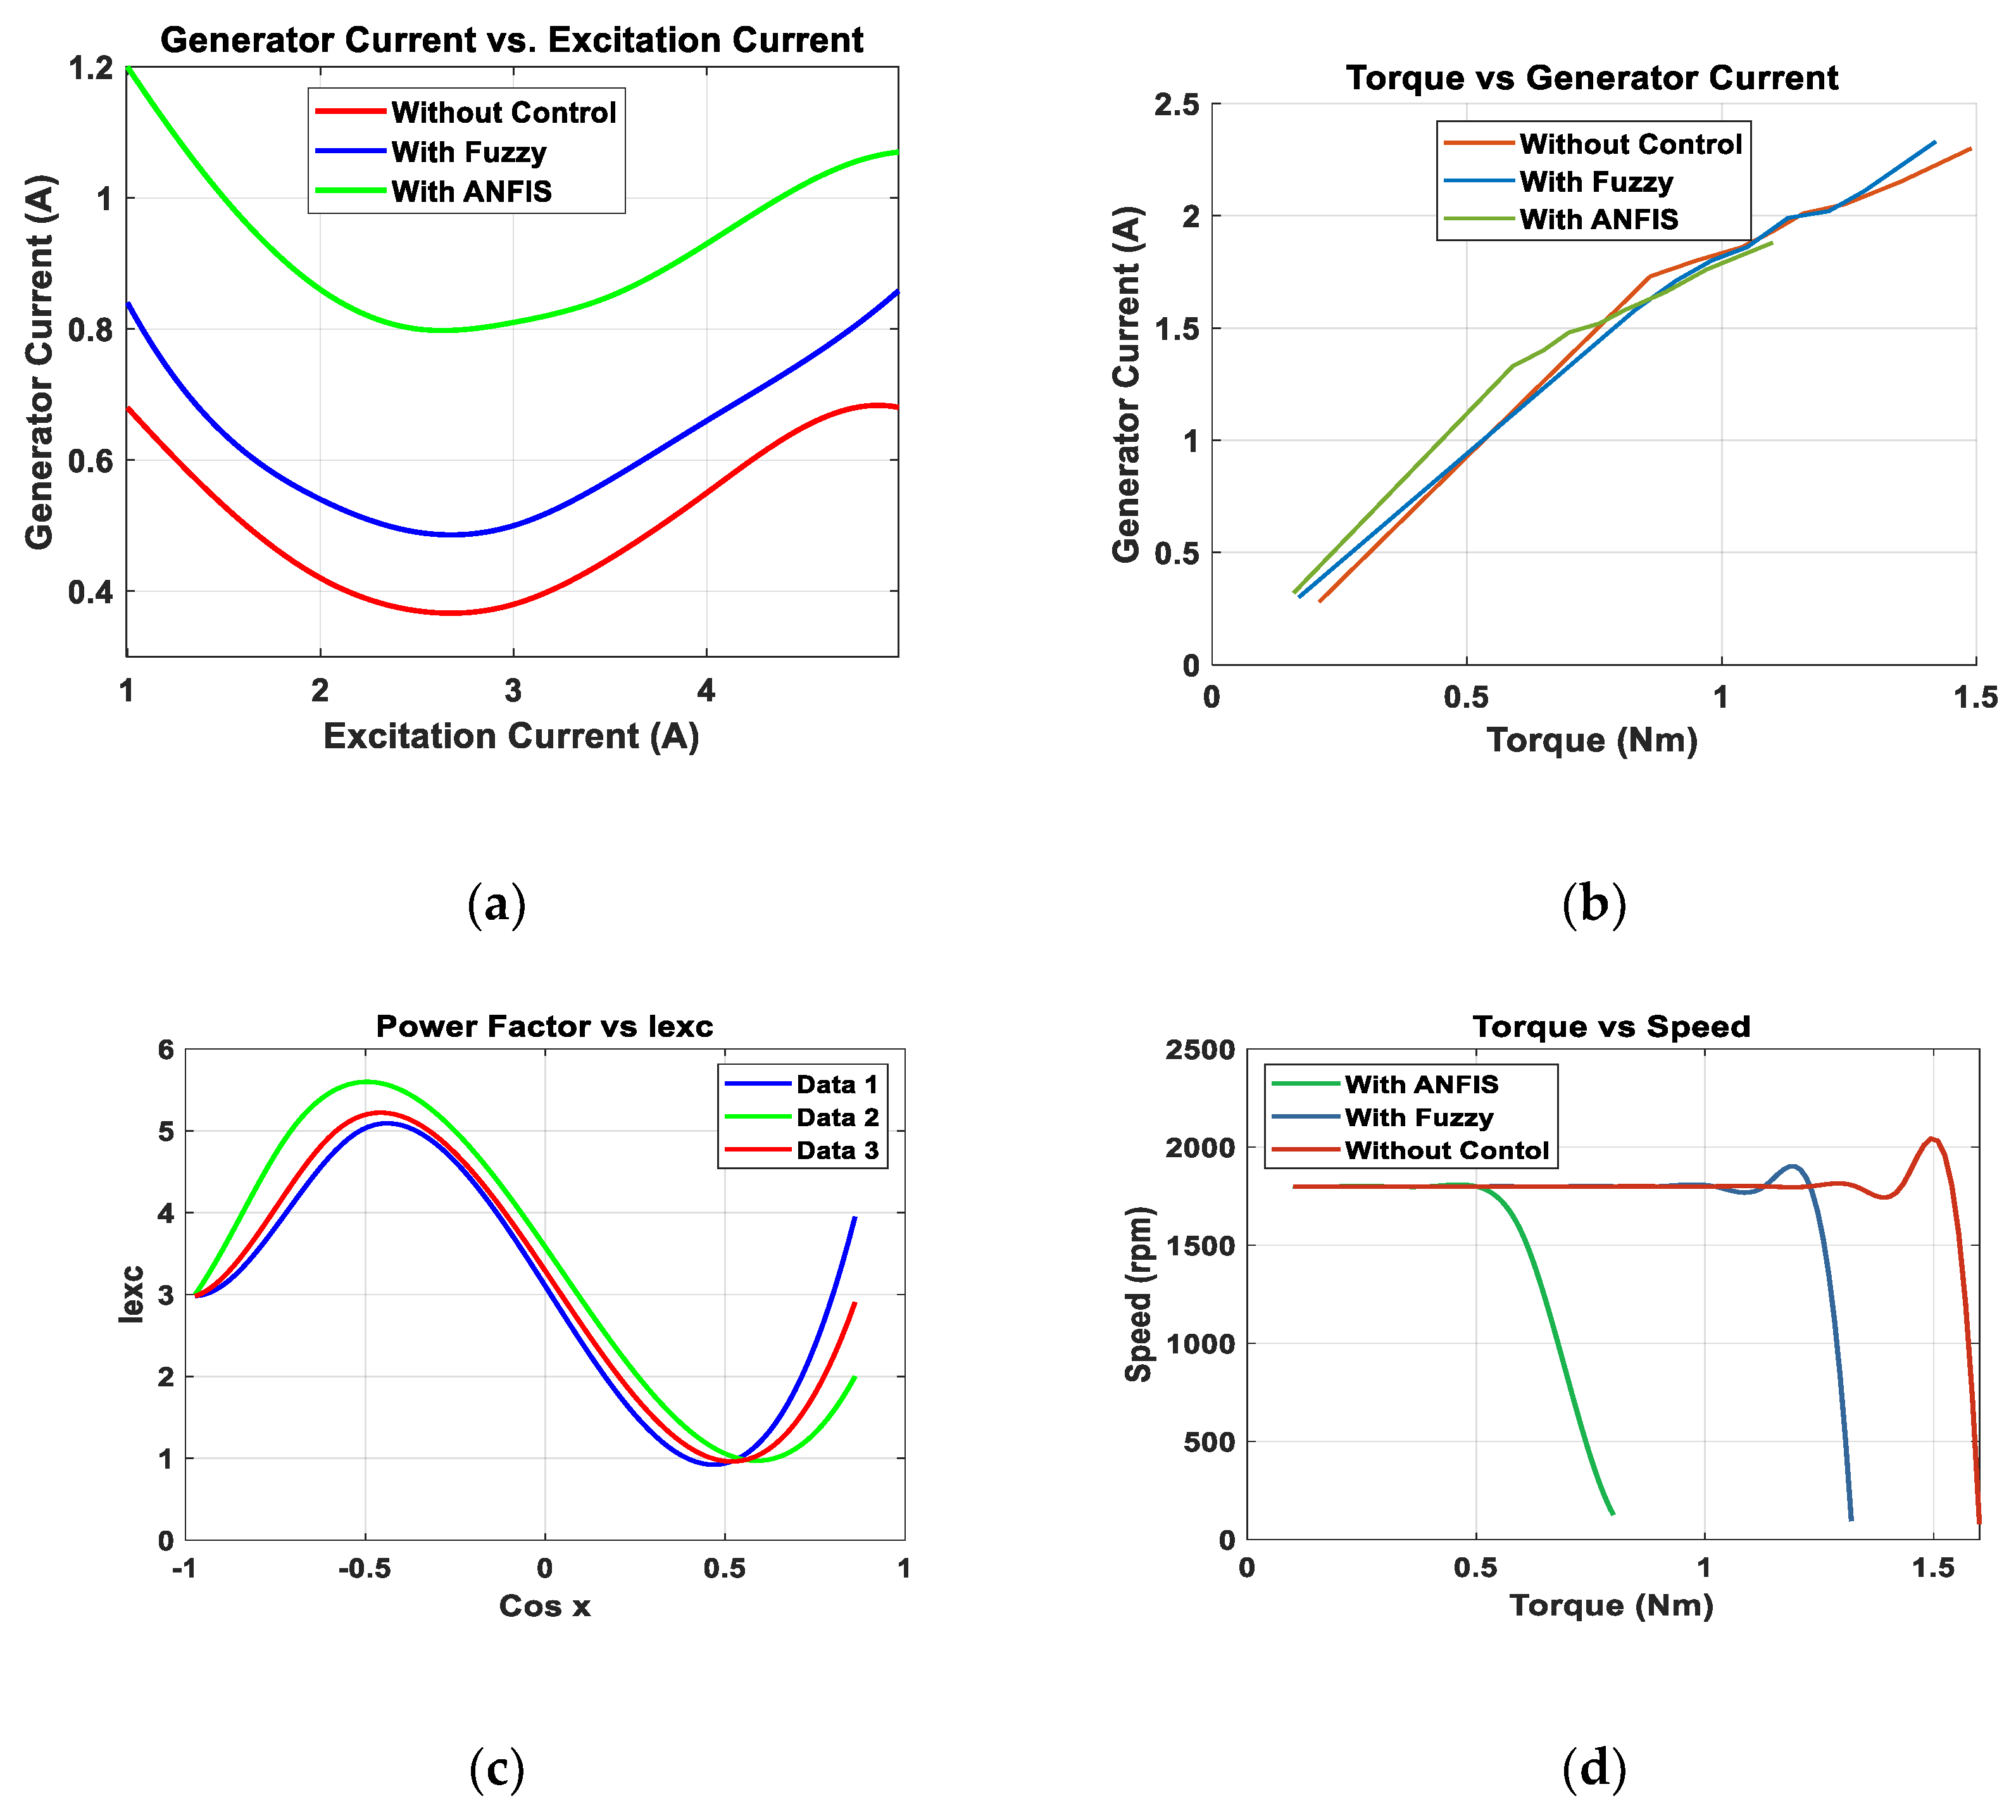
Figure 13.
The speed characteristics are at a steady state after using the controller.
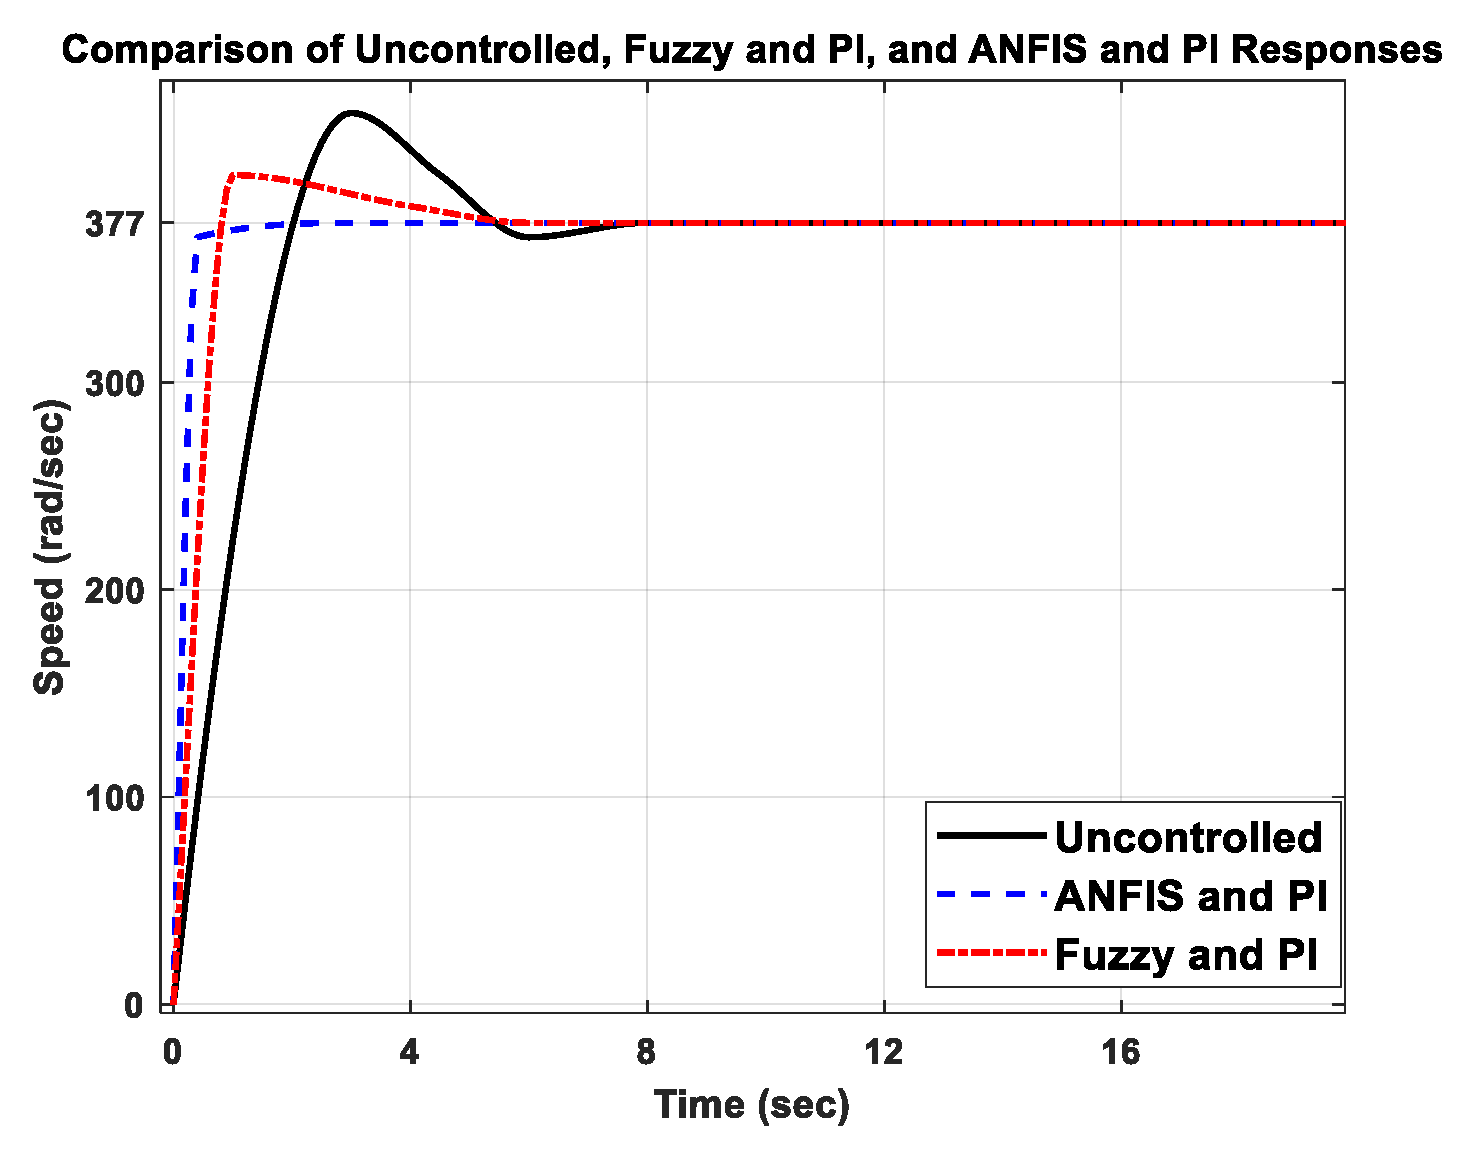
Figure 14.
Synchronous Motor P-Q Curve.
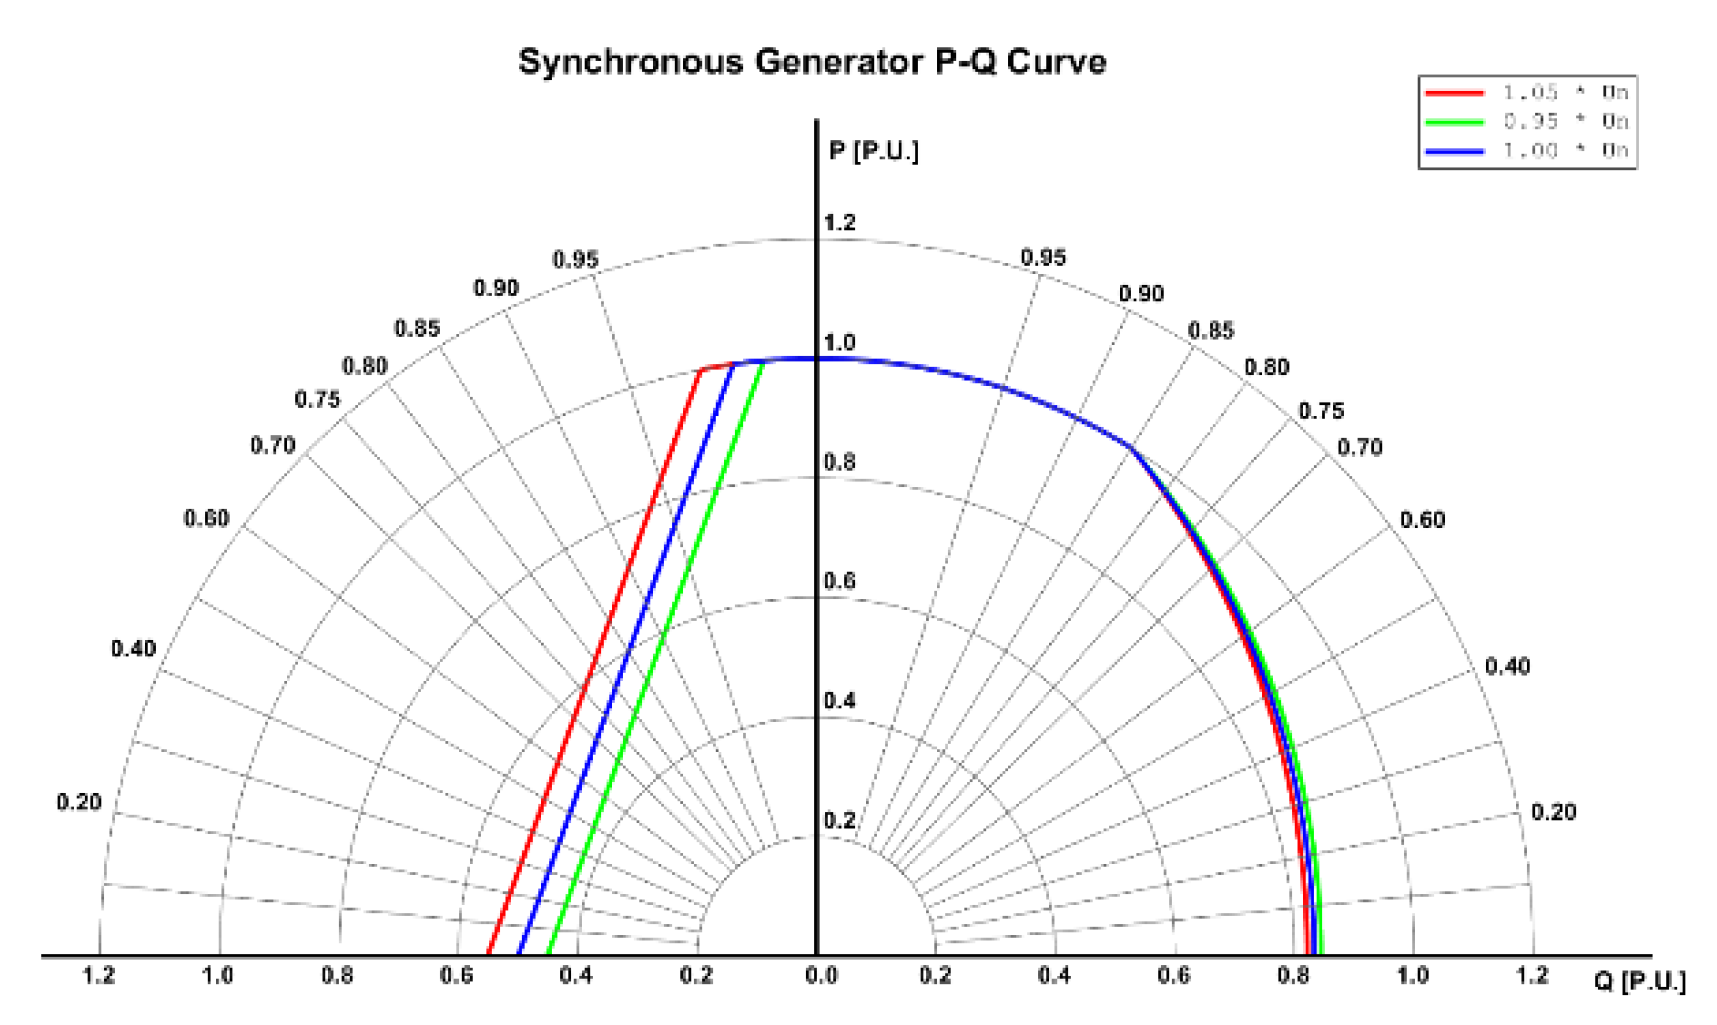
Figure 15.
The synchronous machine's response to the fault. (a) The motor voltage response. (b) Terminal voltage response.
Figure 15.
The synchronous machine's response to the fault. (a) The motor voltage response. (b) Terminal voltage response.
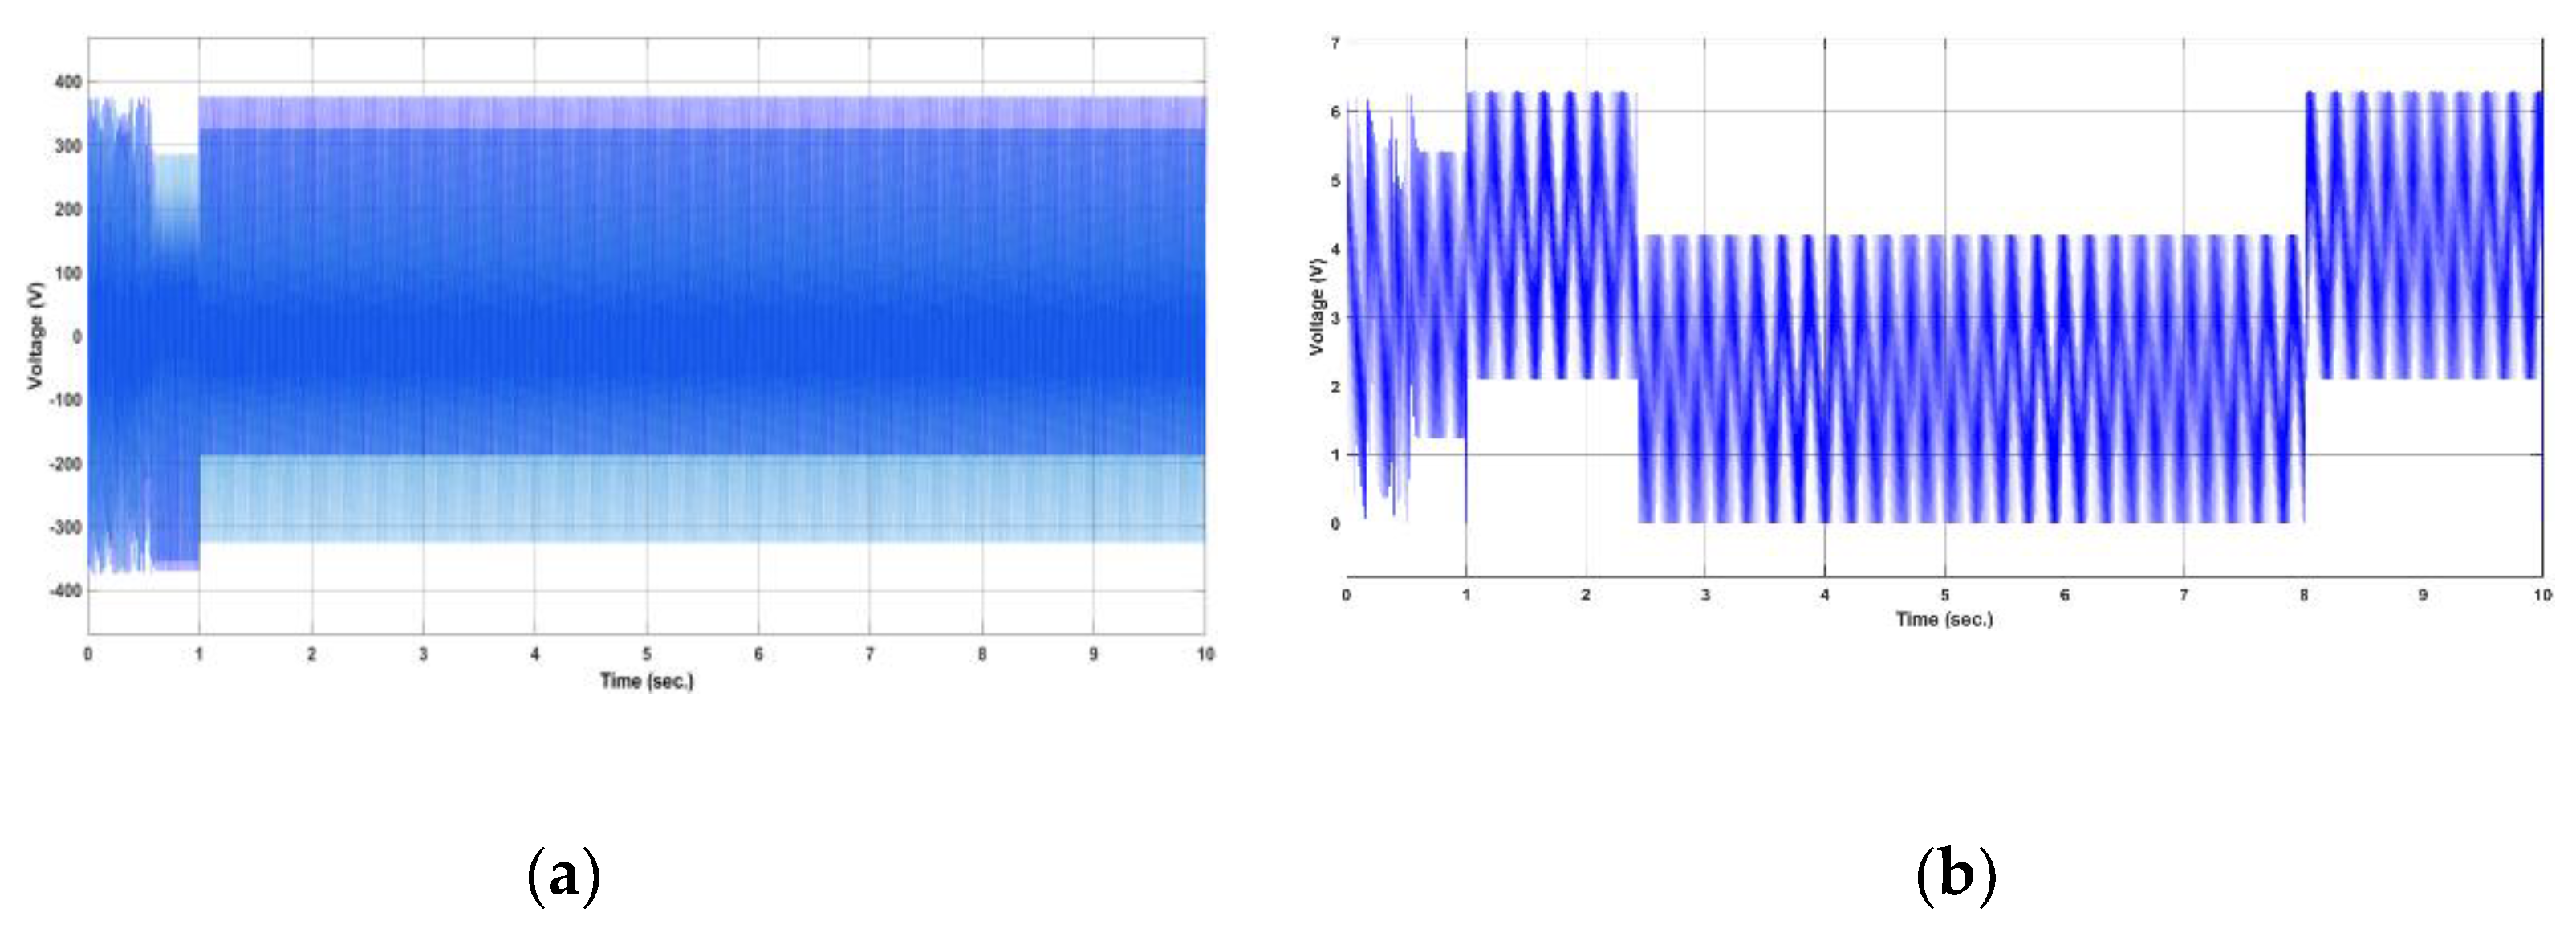
Figure 16.
The input torque response to the fault (a) Torque affected by the fault (b) Torque control by Fuzzy and ANFIS control. (c) Torque-speed characteristics.
Figure 16.
The input torque response to the fault (a) Torque affected by the fault (b) Torque control by Fuzzy and ANFIS control. (c) Torque-speed characteristics.
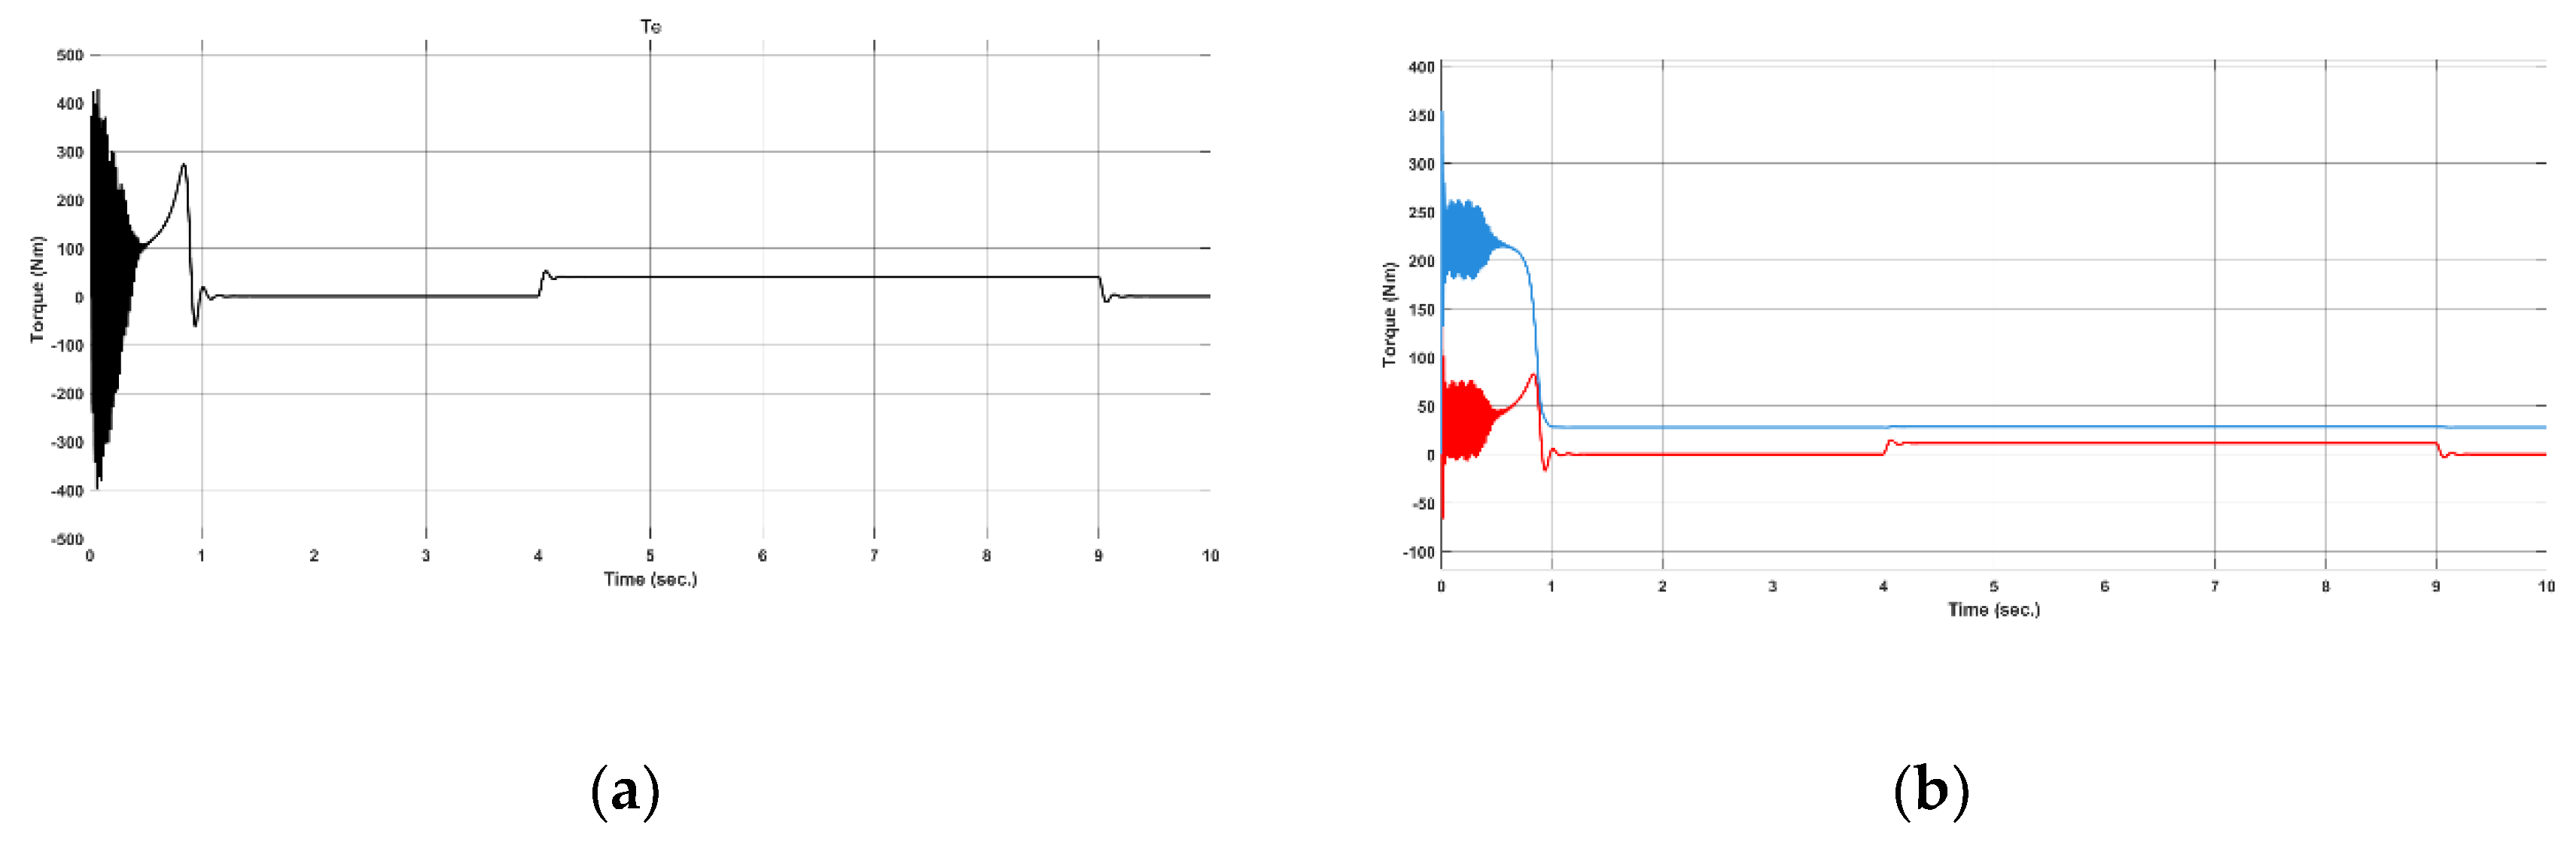
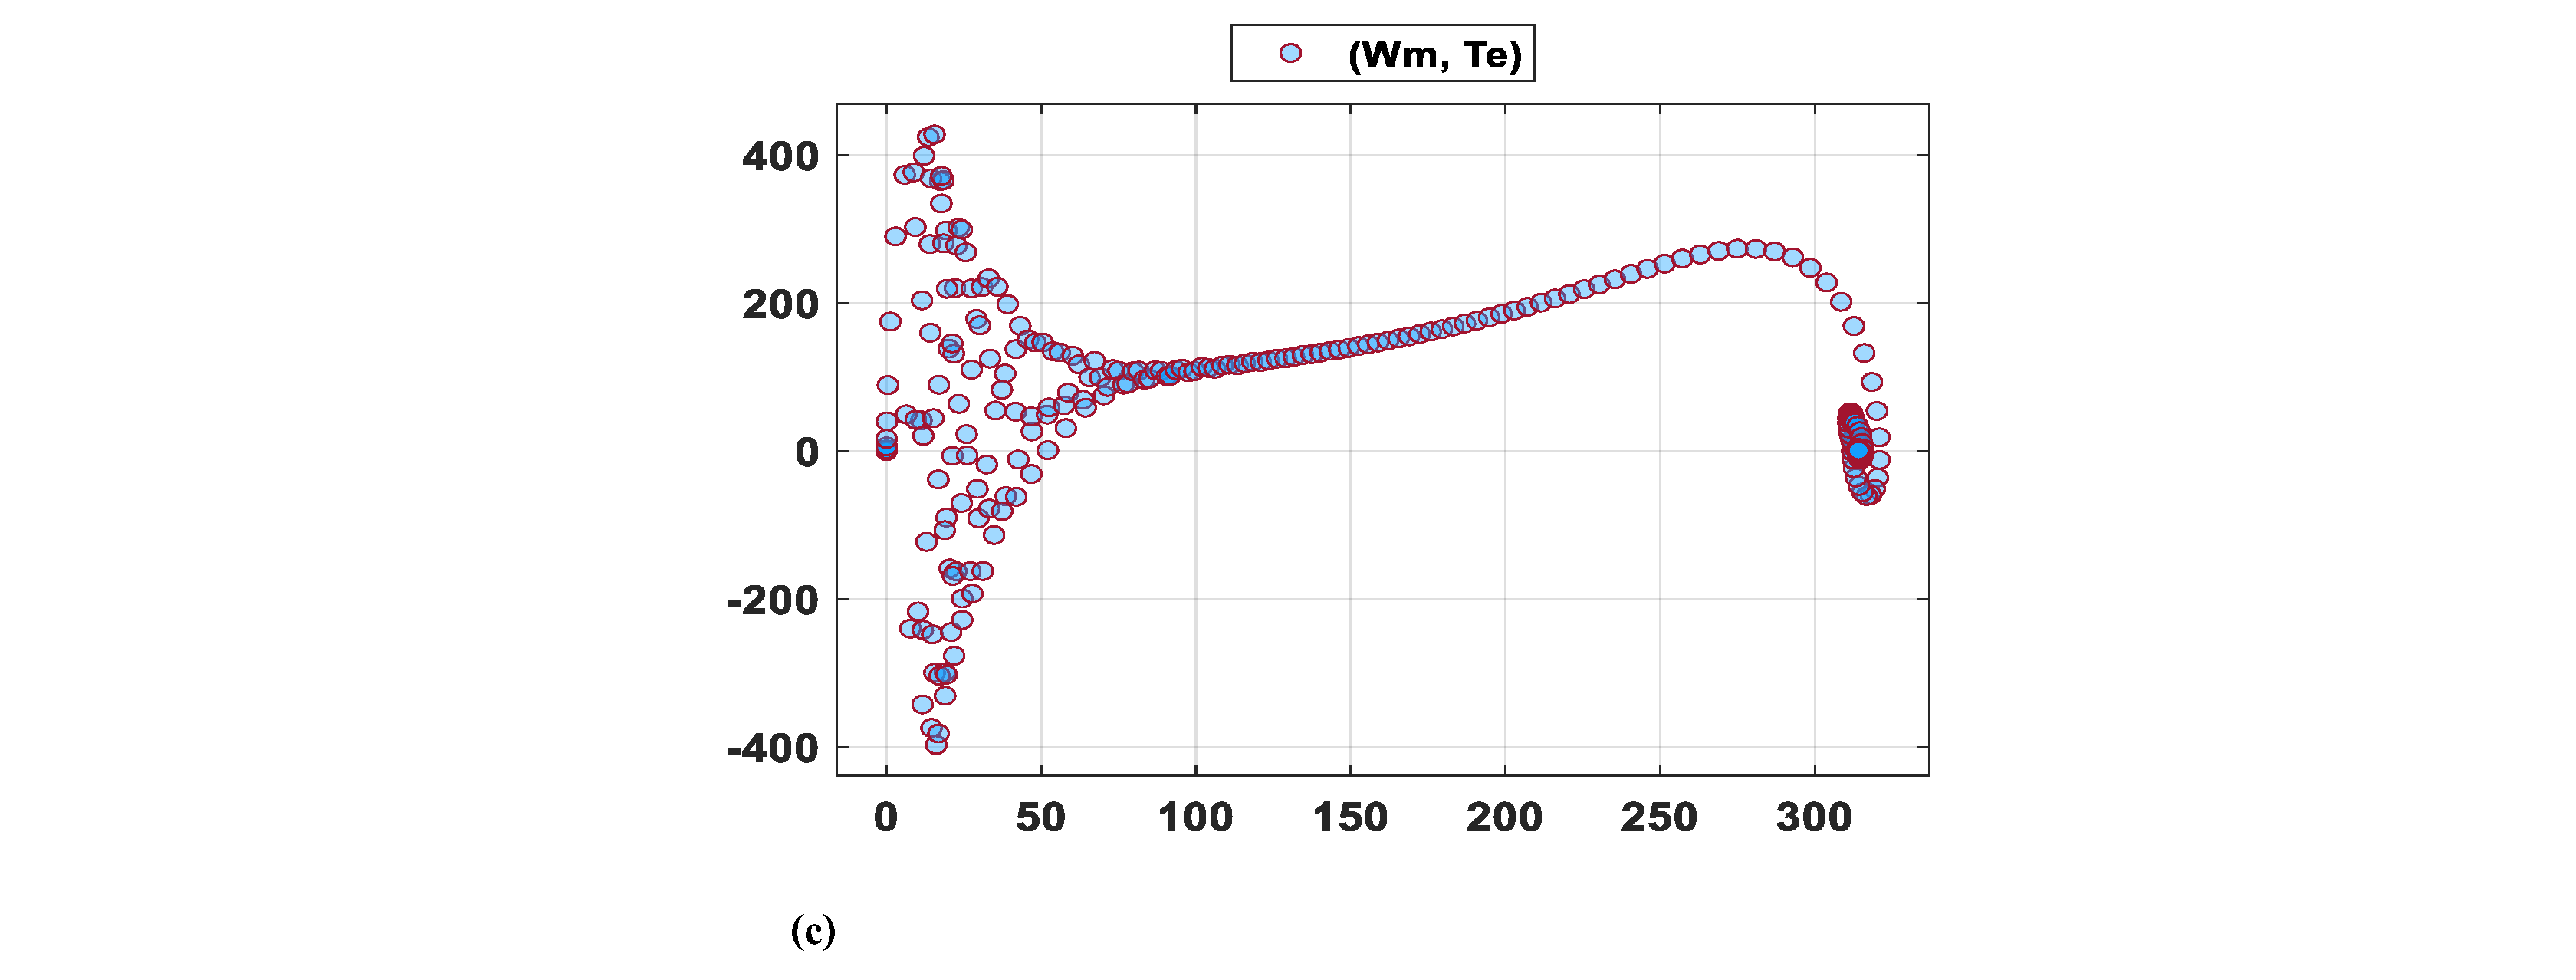
Figure 17.
The excitation current, related variable, and their effect on the sustainability index.
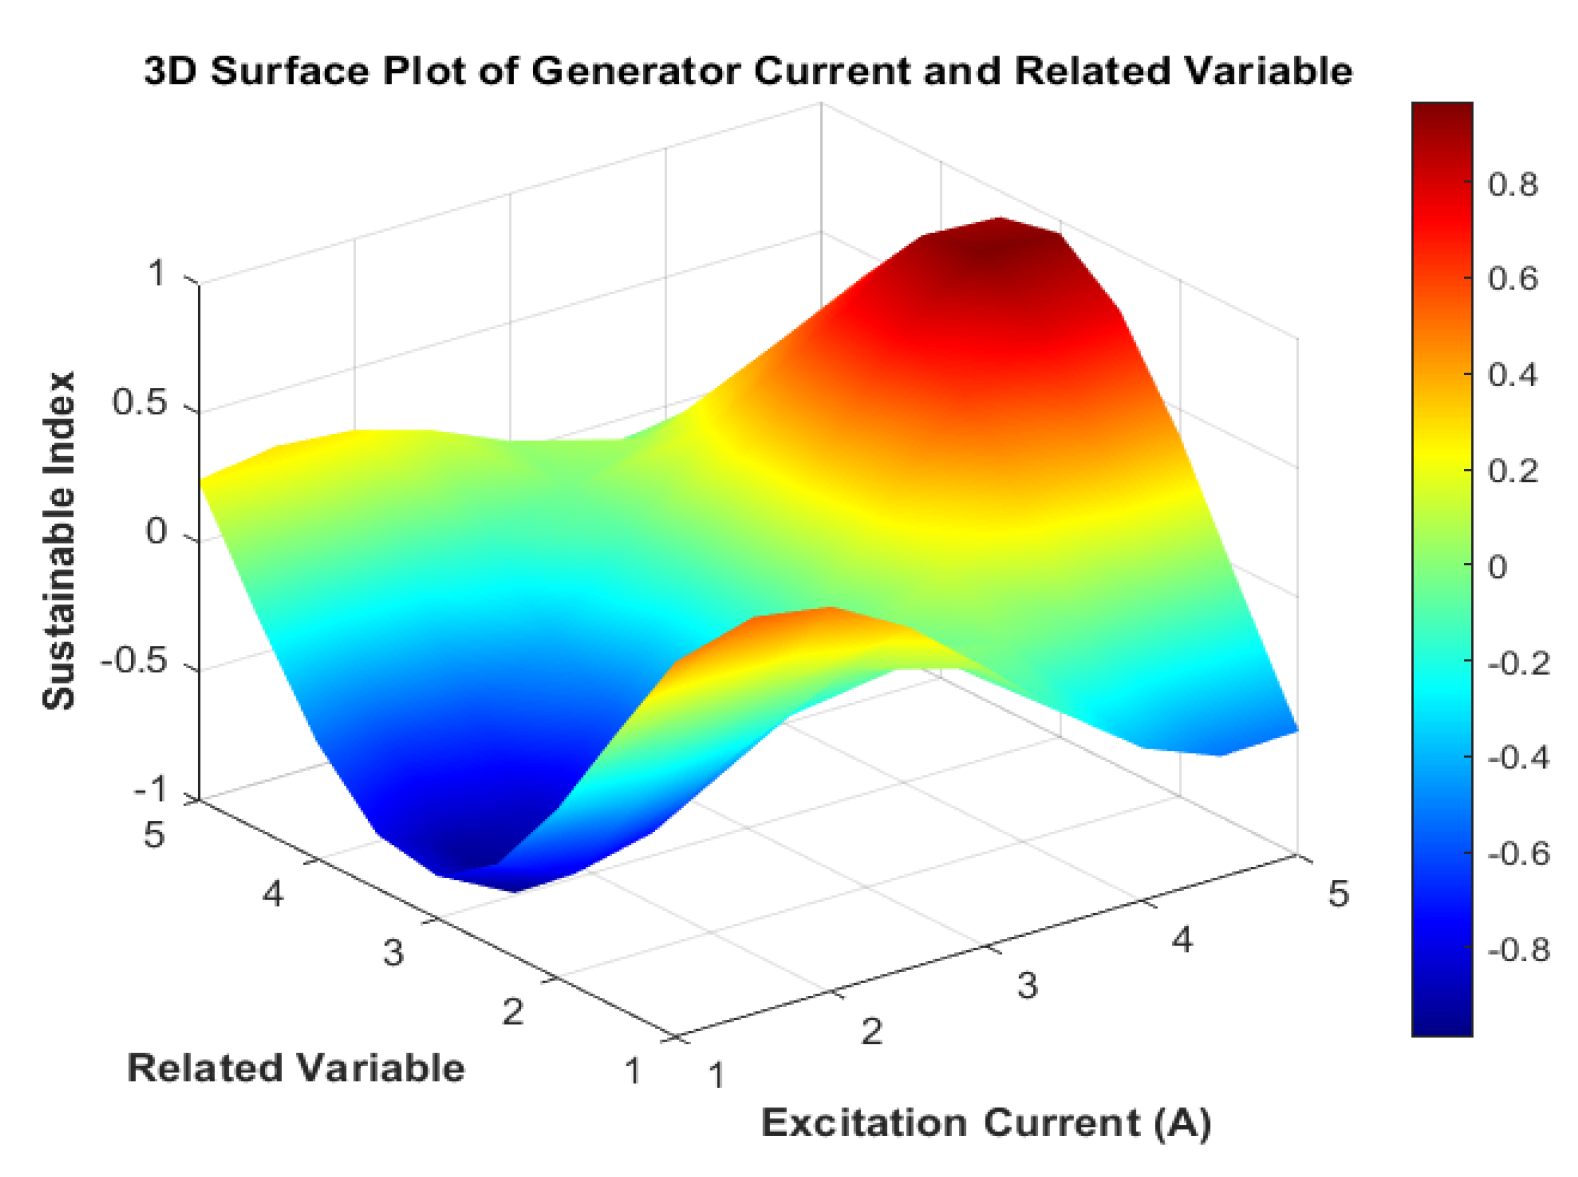
Figure 18.
The excitation current, output, and their effect on the sustainability index.
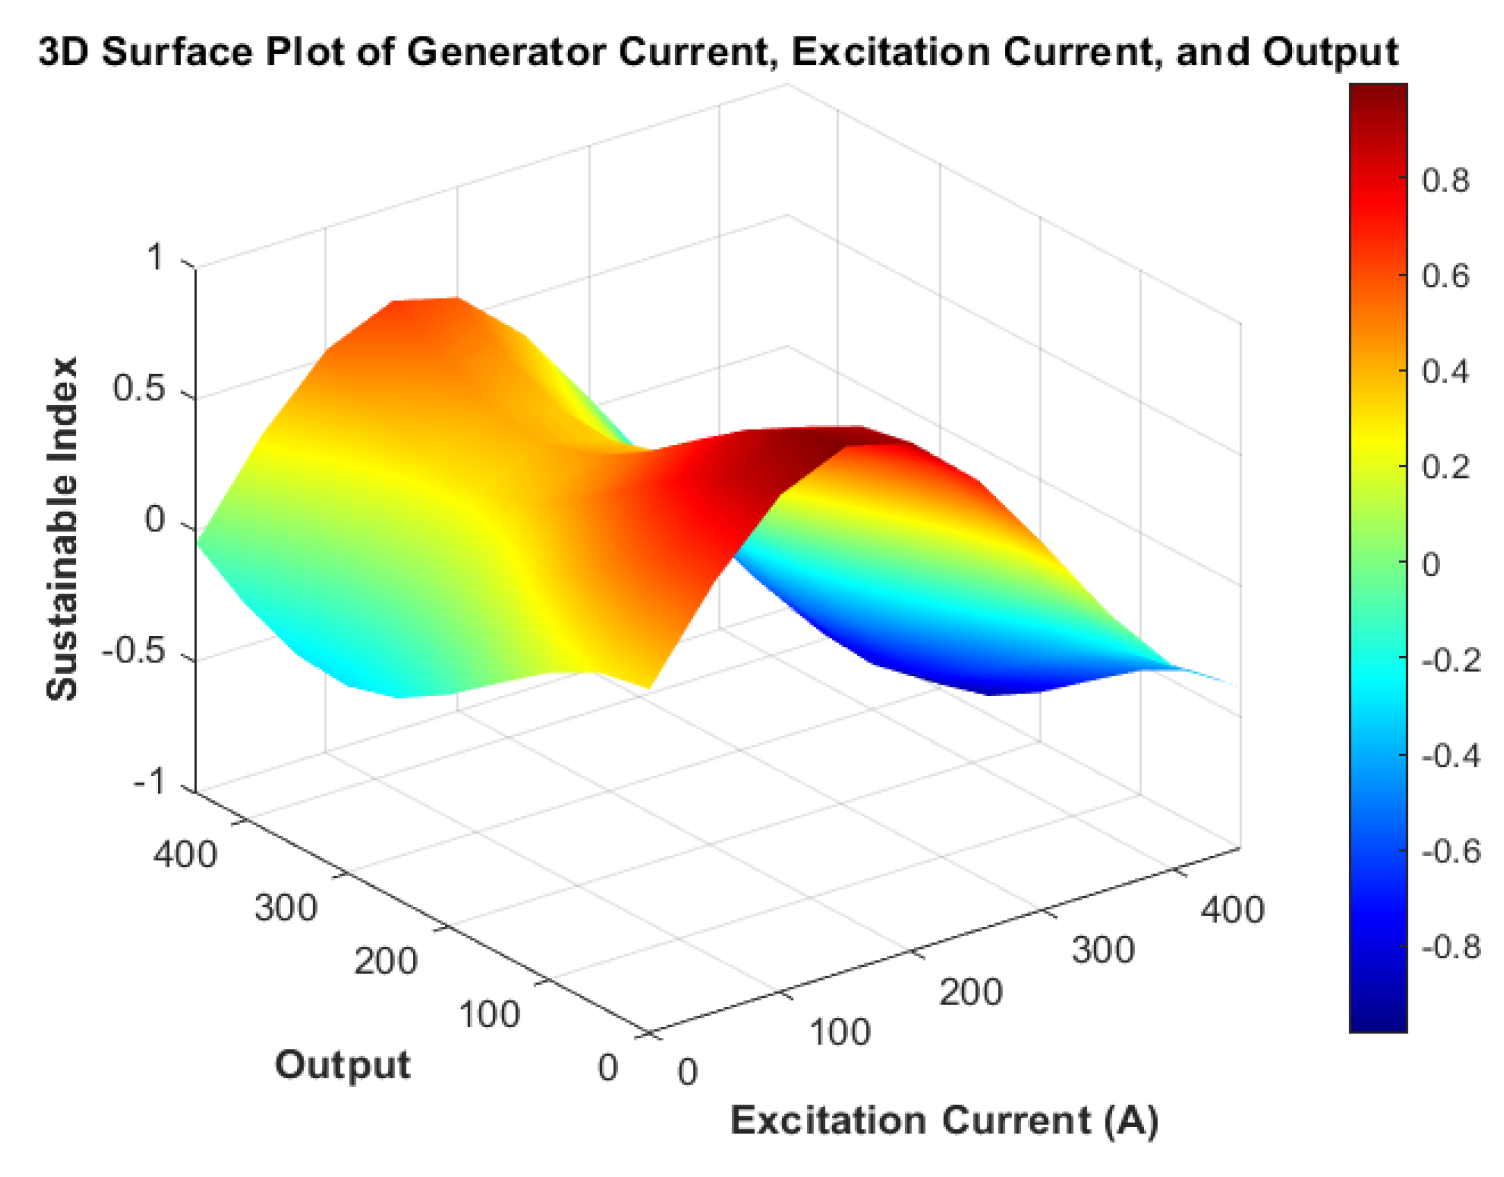

Table 1.
Literature review.
| Researchers | Year | Technology Used | Type of Fault or Control | Results |
|---|---|---|---|---|
| Gonzaga de Araujo et al. | 2023 | Self-forming neural network | fault classification (bearing faults and shaft imbalance) | High efficiency in fault classification |
| Okpo and Lo Ro | 2023 | Support Vector Machines (SVM) | Diagnosis of Unbalanced Voltage and Mechanical Overload Faults | High Accuracy in Fault Diagnosis |
| Vargas et al. | 2023 | Artificial neural network with modified Adam algorithm for | speed control of synchronous motors with better | performance than conventional controllers |
| Akin and Kanbi | 2023 | BiLSTM Network for Phase Current Prediction | Inverter Management High Prediction | Accuracy Compared to Conventional Models |
| Zhou et al. | 2023 | Hybrid model (CNN and MLP) with attention mechanism | Fault diagnosis using vibration signals and electrical signals | High accuracy and stability compared with traditional methods |
| Rich et al. | 2023 | Processor-free V/F control system | Improves safety and reliability in sensitive applications (e.g., marine propulsion) | System effectiveness verified by simulation |
| Ali and Khaled | 2022 | Multiphase Strategy Using Genetic Algorithms | Improving Torque Density and Fault Tolerance in Six-phase Synchronous Motors | Success of the Strategy Supported by Simulation in MATLAB |
| Kumar et al. | 2021 | Machine Learning Algorithms (KNN and SVM) Fault | Diagnosis by Analyzing Vibration Signals and Operational Parameters | Facilitating Fault Diagnosis and Failure Avoidance |
| Preethi and Surya Praka | 2021 | Logit Boosting Algorithm and Sample Optimization Techniques | Fault Classification | High-Performance Fault Detection |
| Hossein Ehya, Arne Nysveen | 2021 | Pattern Recognition Algorithm | Static, Dynamic, and Mixed Eccentricity Faults | Non-invasive, verified on large setups |
| B. Tabbache, M. Benbouzid | 2013 | Virtual-Sensor-Based Approach | Electric Vehicle Powertrain Faults | Enhanced fault tolerance |
| S. Karimi, A. Gaillard | 2009 | Fault-Tolerant Control for WECS | Current Sensor Fault Control for DFIG | Improved stability and fault tolerance |
Table 2.
The synchronous motor specifications used in this research.
| Specification | Typical Value |
|---|---|
| Motor Type | Three-phase Synchronous, 300 W |
| Nominal Voltage | 230/400 V |
| Frequency/Pole | 60 Hz, 4-pole |
| Nominal Current | 1.4 A / 2.4 A |
| Nominal Speed | 1800 rpm |
| Nominal Power | 0.3 kW |
| Power Factor | 0.9 (lagging) |
| Dimensions | 340 × 210 × 210 mm |
| Weight | 10 kg |
| Cooling Method | Air-cooled |
Table 3.
Compression of maximum overshoot raising time, settling time, and setting time for different controllers.
Table 3.
Compression of maximum overshoot raising time, settling time, and setting time for different controllers.
| Type | Max. Overshoot (rad/sec) | Rise Time (sec) |
Settling Time (sec) |
Time at Max. Overshoot (sec) |
|---|---|---|---|---|
| Uncontrolled | 53.16 | 2.90 | 8 | 3.10 |
| Fuzzy and PI | 16.79 | 1.10 | 6 | 1.40 |
| ANFIS and PI | - | 0.80 | 4 | 0.9 |
Table 4.
Results of the Fuzzy Sustainable Index of the motor.
| Variable | Sustainable Index (FSBI) |
|---|---|
| Excitation Current | 0.5–0.9 |
| Motor Current 1 | 0.4–0.8 |
| Motor Current 2 | 0.3–0.7 |
| Motor Current 3 | 0.2–0.6 |
| Output | 0.6–1.0 |
Disclaimer/Publisher’s Note: The statements, opinions and data contained in all publications are solely those of the individual author(s) and contributor(s) and not of MDPI and/or the editor(s). MDPI and/or the editor(s) disclaim responsibility for any injury to people or property resulting from any ideas, methods, instructions or products referred to in the content. |
© 2025 by the authors. Licensee MDPI, Basel, Switzerland. This article is an open access article distributed under the terms and conditions of the Creative Commons Attribution (CC BY) license (https://creativecommons.org/licenses/by/4.0/).
Copyright: This open access article is published under a Creative Commons CC BY 4.0 license, which permit the free download, distribution, and reuse, provided that the author and preprint are cited in any reuse.


