
Submitted:
19 December 2024
Posted:
19 December 2024
You are already at the latest version
Abstract
Patient-derived xenograft (PDX) models are powerful tool in cancer research, offering a more accurate platform for evaluating the cancer treatment efficacy and predicting responsiveness. However, these models necessitate surgical techniques for tumor tissue transplantation and face challenges with non-uniform tumor growth among animals. To address these issues, we attempted to develop a new PDX modeling method using high-grade serous ovarian cancer (HGSC), a fatal disease with a 5-year survival rate of 29%, that requires personalized research due to its morphological, genetic, and molecular heterogeneity. In this study, we developed a new patient-derived cancer cell xenograft (PDCX) model with high engraftment efficiency (64%) that utilizes primary cancer cells instead of patient tissues. Primary cancer cells can be stably cryopreserved for extended periods (up to 485 days), and when transplanted into animals, they maintain morphological and molecular characteristic without significant genetic differences compared to their original primary tumors. Furthermore, PDCX models can be easily produced using a syringe, allowing for uniform tumor sizes across multiple animals. Additionally, M2 PDCX exhibited significantly faster growth rate compared to M2 PDTX (5.04 vs. 1.85, ****p< 0.0001). Consequently, our PDCX model offers a streamlined approach for the efficacy evaluation of personalized cancer treatments with minimal experimental variability.
Keywords:
Patient-derived xenografts
; Primary cancer cell
; Ovarian cancer
; HGSC
; Cryopreservation
1. Introduction
Patient-derived xenograft (PDX) models have emerged as valuable tools for cancer research and drug development. These models are established by transplanting human tumor tissue into immunodeficient mice, thereby preserving the cancer microenvironment, heterogeneity, and molecular characteristics of the original tumor [1,2,3]. PDX models offer significant advantages over traditional cell line-derived xenografts, particularly in their ability to more accurately reflect the complexity of human tumors. PDX models play a crucial role in cancer drug screening and development by evaluating drug safety, efficacy, and pharmacokinetic properties in preclinical trials [4,5]. They also allow for the observation of molecular changes that help predict individual treatment responses and improve clinical trial design and patient selection [6]. Therefore, PDX models are powerful tool in cancer research, offering a more accurate and reliable platform for evaluating the efficacy of cancer treatment and predicting its responsiveness in terms of precision medicine.
In this regard, there are several limitations to planning an in vivo experiment using PDX models. First, the engraftment rates of PDX models vary greatly depending on the condition of the primary tumor. Even within the same tumor, if the cellular composition of each piece is different, the growth rate of each xenografted tumor will be different [5]. Even if the tissue fragments have the same condition, it is not easy to cut tumor tissue into numerous small pieces of uniform size. If uneven tissues are used for xenografting, the experimental results will be quite difficult to analyze. Therefore, to ensure equitable grouping, a larger number of mice is required. Another problem here is that xenografting human tumor tissue into mice requires the use of immunodeficient mice, which are more expensive than wild-type mice. Therefore, it increases the cost of producing a PDX model. Second, although it would be the best to inject it into mice immediately after extracting the patient’s tumor, most laboratories freeze the tissue because it is difficult to transplant the fresh tissue into the mice in a timely manner. However, freezing tissue can cause tissue damage due to ice crystal formation, and the viability after thawing is very low [7], therefore it could reduce the engraftment rates. Lastly, when producing a PDX model using tumor tissue, surgical techniques such as anesthesia, incision, and suturing are required to transplant it into an animal.
Meanwhile, high-grade serous ovarian carcinoma (HGSC) is the most aggressive and prevalent subtype of epithelial ovarian cancer, accounting for approximately 70% of cases, with 85% diagnosed at stage 2 or higher, leading to a 5-year survival rate of only 29% for late-stage diseases [8,9]. Despite being initially platinum-sensitive, 20-30% of patients do not respond to chemotherapy, with recurrence frequently occurring within six months post-treatment, underscoring the limitations of current standard therapies [10]. Characterized by significant genetic and molecular heterogeneity, HGSC exhibited a wide range of copy number alterations (CNAs) and multiple molecular subtypes [11,12], which resulted in complicating treatment development and necessitating personalized approaches. Therefore, in this study, we attempted to develop a more advanced PDX model for this type of tumor.
In general, for establishing PDX model, the method of freezing tumor samples has been used for a long time, but its successful rate has been low. The first PDX model using cryopreserved primary cancer tissue showed a transplant success rate of only 21%[13]. To overcome this, a study published in 2015 increased the transplant success rate to 68% by minimizing ice crystals using the vitrification method, but it was cumbersome because it required 3 steps for tissue freezing and 4 steps for thawing [14]. In other studies, instead of using tissue fragments, cancer cells isolated from a patient’s tumor have been used to simply generate PDX models [15,16,17]. Some experiments reported that sufficient numbers of patient-derived cell xenograft (PDCX) mice were established only with a small number of cells, such as 2x10^5 after one or two passages in vivo [16]. However, in most of reports covering PDCX, the mice were injected using cancer cells that had never been frozen. Therefore, the experiments must have been laborious, as many steps had to be completed immediately within a short period of time.
In this study, we established the method for PDCX model with cryopreserved cells from HGSC ovarian cancers. In this process, we isolated cells from tumor tissues of HGSC patients and cryopreserved them in LN2, and then those cells were used to establish PDCX models by a non-surgical method whenever needed. We found that the tumors of PDCX mice generated in this manner had histologically and genetically identical to those of original human tumors or patient-derived tissue xenograft tumors (PDTX). In addition, we showed that uniform-sized tumors were formed in the third generation PDCX model using a small number of cells.
2. Materials and Methods
- Tumor Tissue Samples from Patients
All the HGSC ovarian cancer tissue specimens were obtained from ovarian cancer patients who underwent tumor removal surgery with salpingo-oophorectomy at CHA Bundang Medical Center from October 2019 to March 2023. None of the patients received pre-operative chemotherapy. The tissues were transported to the laboratory immediately after surgery in cold saline solution and stored at 4℃ until further processing, but no longer than 1 day. The study was approved by the institutional review board of CHA Bundang Medical Center (IRB #CHAMC 2019-08-039) and were conducted with written informed consent from all patients.
- Single Cell Isolation of Primary Cancer Tissue
The fresh tumor tissue obtained from HGSC patient was placed in 100mm culture dish (SPL, Cat# 20100, Pocheon, South Korea,) containing McCoy’s 5A medium (Gibco, Cat# 16600-082, MA, USA). Fat and contaminants contained in the tissue were removed using fine forceps and washed two to three times with the media. After transferring 3 g of tumor tissue to a 50mL tube (SPL, Cat# 50050), 10mL of McCoy’s 5A medium was added, and the tissue was finely cut into small pieces. Some small pieces of tissue were snap-frozen immediately to create the PDTX model, while others were dissociated into cells for the PDCX model. When freezing the specimen in tissue form, one of the tissue fragments were simply minced to approximately 1mm^3. To isolate the specimen into cancer cells, we used the Miltenyi gentleMACS Tissue Dissociator (Miltenyi Biotec, Cat# 130-093-235, Bergisch Gladbach, Germany) with Multi Tissue Dissociation Kit (Miltenyi Biotec, Cat# 130-110-201). Tissue samples were placed in a c-Tube with the enzymatic dissociation reagents and processed according to the gentleMACS program, with 30 minute incubation at 37 ℃. The cell suspension was filtered through a 70μm MACS SmartStrainer (Miltenyi Biotec, Cat# 130-098-462), centrifuged at 1500rpm for 10 minutes, and then resuspended in McCoy’s 5A medium containing 10% Fetal Bovine Serum (FBS) (Gibco, Cat# 26140-079) for cell counting.
- Cryopreservation and Thawing
After counting, the cells were centrifuged at 1500 rpm for 5 minutes, the supernatant was discarded, resuspended in Gibco freezing agent (Gibco, Cat# 12648010), and 1x10^7 cells were frozen in 1.8ml cryovials (Thermo Scientific, Cat# 377267, Roskilde, Denmark). All the cryotubes were transferred to a -1 ℃/min freezing container, slowly lowed to -80 ℃, and then transferred to liquid nitrogen for long-term storage. For thawing, the tubes are quickly thawed in a 37℃ water bath for 2 minutes. Transfer each ml of thawed cells to a clean tube containing 10 ml of cancer medium containing 20% FBS. After washing by centrifugation (1600 rpm, 10min, RT), cancer media was added to the pellet and the cell numbers were determined.
- In Vivo Transplantation
Six-week-old NSGA (NOD.Cg-Prkdcscid Il2rgtm1Wjl/SzJ) female mice (JA BIO, Inc., Suwon, South Korea) were used after one week of adjustment. The cryopreserved cells were thawed and counted and adjusted to a maximum of 1x10^7 cells/75 µl/mouse. For the cryopreserved tissue fragments, the tissue pellet was adjusted to 150 mg/75 µl/mouse. After that, an equal volume of Matrigel (Corning, Cat# 454248, NY, USA) was mixed at 4℃ and injected into the flank of the mice using a 1 ml syringe. Tumors were measured once a week using calipers, and the measurement method was calculated as follows. Tumor volume = Width2 x Length x 0.5.
- Specific Growth Rate (SGR) Method
The Specific Growth Rate (SGR) was calculated to standardize tumor growth across different initial tumor volumes and experimental durations. The SGR value per 100 days was determined using the following equation:
SGR = [ln(V2) - ln(V1)] / (t2 - t1) × 100
Where V1 and V2 are the tumor volumes or implanted tumor cell numbers at the initial time point (t1) and the final time point (t2), respectively.
- Cancer Cell Isolation from M1 or M2 Tumors of PDCX or PDTX Mice
M1 or M2 tumors of PDCX or PDTX mice were extracted when they grew to over 500 mm^3 in the volumes. The tumor tissues were placed on 60 mm petri dishes (SPL, Cat# 10060) with dissociation buffer composed of Hanks’ Balanced Salt Solution (HBSS, Gibco, Cat# 14175-095) with 2 mg/ml Collagenase A (Roche, Cat# 10103578001, Mannheim, Germany) and 27 µg/ml DNase I (Sigma-Aldrich, Cat# D5025, St. Louis, MO, USA). The tumor tissue was cut into small pieces using a fine razor and placed at 37℃ for the enzymatic reactions for 20 minutes. When the tissue was sufficiently decomposed, EDTA (Gibco, Cat# 15400-054) was added to 0.5 mM to stop the enzyme reaction and filtered through a 70 µm cell strainer (SPL, Cat# 93070). The tube was filled with complete cancer medium (MacCoy’s 5A with 10% FBS and 1% Antibiotics-antimycotic (Gibco, Cat# 15240-062)), washed by centrifugation (1800 rpm, 10 min, RT), and the remaining pellet was resuspended in 1X RBC lysis buffer (Biolegend, Cat# 420302, San Diego, CA, USA) to remove red blood cells. After 15 min, samples were washed twice with complete medium (1500 rpm, 5 min, RT), and resuspended in the medium for cell counting.
- Immunohistochemistry
The extracted tumors from PDX mice were cut into small pieces and fixed in 4% formalin for at least 1 day. The tissue was prepared for a paraffin-embedded block. Four μm sections of formalin-fixed paraffin-embedded blocks were placed on amino-propyl-ethoxy-silan-coated glass slides. The sections were stained with hematoxylin and eosin (H&E), and stained with anti-human antibodies to detect p53, PAX8, Ki67, Vimentin, and anti-mouse CD31 (Cell signaling Technology, Cat# 77699T, Danvers, MA, USA). Except anti-mouse CD31, immunohistochemical stains were performed with a Ventana Benchmark automated staining platform (Ventana Medical Systems, Incl, Tucson, AZ, USA) using a VENTANA OptiView diaminobenzidine (DAB) tetrahydrochloride IHC Detection Kit ( P/N 760-700) and its staining protocol. The sections were deparaffinized, rehydrated, and heated following the protocol. The antigen-retrieval time, retrieval buffer, and incubation time of each antibody are shown in Table 1. For the anti-mouse CD31 staining, the procedure was performed by CM BioPATH, a preclinical pathology contract research organization based in South Korea. Briefly, using ABC kit (Vector, Cat# PK-6100, Burlingame, CA, USA), the incubation condition of primary antibody is detailed in Table 1. Secondary staining was conducted using anti-rabbit HRP (Dako, Cat# K4003, Agilent Technologies, Santa Clara, CA, USA) for 30 minutes.
- DNA Isolation
For genetic analysis, DNAs were extracted from the isolated cells from SC155 and SC156 patients’ cancer and their corresponding M1 and M2 PDCX cancers that were all cryopreserved. The extraction was performed according to the standard protocol. After thawing the cancer cells at 37 ℃ water bath, the cells were washed with DPBS by centrifugation (1600rpm, 5min, RT), and the supernatant was discarded. DNAs were extracted from the pellets using DNeasy Blood & Tissue Kits (Qiagen, Cat#69504, Hilden, Germany). The qualities and quantities of the DNA samples were assessed using a NanoDrop (Lifereal, Cat# FC-1100) and delivered to a genetic analysis company.
- Genetic Analysis
The genetic analysis was performed by DNA Link Inc (Seoul, South Korea). Agilent SureselectXT V6 kit was used for Whole Exome Sequencing (WES) analysis. Briefly, mouse contamination reads were removed from the produced data using bbsplit of bbmap. Kinship analysis was done after converting the variant calling format (VCF) to plink genome (PLINK). The heatmap was drawn using the PI_HAT value obtained at this time. Allele-specific copy number analysis of tumors (ASCAT) was performed using the copy number alterations (CNA). The CNAs on all the chromosome loci are shown.
3. Results
3.1. Cryopreserved Primary Cancer Cells Can Be Used to Establish a PDX Model with HGSC
To determine whether cryopreserved cells isolated from tumors of human high-grade serous carcinoma (HGSC) would establish PDX model when implanted on immune-deficient mice, fresh tumor tissues of HGSC patients were obtained from CHA Bundang Medical Center. Initially, we dissociated some tumor tissue to cells using enzymes and cryopreserved in LN2. After 15 to 557 days of cryopreservation, 2 to 10x10^6 of the cancer cells of each case was inoculated on a side flank of immune-deficient NOD-Prkdcem1BaekIl2rgem1Baek (NSGA) mice (Figure 1A). Nine out of 14 cases (64%) were successfully established tumors on mice (Mouse passage 1; M1) (Table 2). When the established M1 tumors were compared with the corresponding primary tumors using H&E staining, all the cases (9 cases) showed consistent with the primary tumors (Figure 1B). These results showed that cryopreserved cells from patients’ tumor tissues are good material for PDX modeling.
Interestingly, SC39 primary cancer cells successfully established tumor tissue despite being cryopreserved for a long time as 485 days. This indicates that the cells from patients’ primary cancer can be stably preserved for more than a year in liquid nitrogen for generating PDX models.
3.2. Comparison in Tumor Growth Rate and Tumor Size Between PDCX and PDTX Models
To establish PDCX modeling, it is also required to check whether there is any difference between patient-derived cell xenograft (PDCX) and patient-derived tissue xenograft (PDTX). In two cases (SC155 and SC156), we dissociated part of the tumor into cells using enzymes and simply chopped the other part into small tissues, and then cryopreserved. The dissociated cancer cells for PDCX and the tissue fragments for PDTX were thawed just before inoculation. In each case, 5x10^6 cancer-derived cells or 150mg of tumor tissues were inoculated on right side flank of three to four NSGA mice. The PDCX group showed a fairly uniform tumor growth rate, while the PDTX group showed notable individual variations or no growth at all (Figure 2A). In the case of SC156, the transplantation success rate was 100% for both PDCX and PDTX, whereas in the case of SC155, the success rate was 50% for PDCX and 25% for PDTX. Initially, the SC155 PDTX model showed tumor formation in two mice; however, these tumors did not exhibit growth grossly until day 140. After 193 days, when the remaining mice were sacrificed, a very small tumor tissue weighing only 180 mg was unexpectedly obtained from one mouse. Unfortunately, it was too small to be used for the next passage. In terms of the time taken for the tumors reached 500mm^3, it took 56.5 days for SC156 PDCX and 64.3 days for SC156 PDTX (Figure 2B).
Considering that 3.2x10^8 cancer cells were obtained from 11.2g of SC155 primary cancer, and 1.7x10^8 cancer cells were obtained from 6.4g of SC156 primary cancer (data not shown), 1g of tumor tissue would be dissociated into 2.7x10^7 cells. This means that 150mg of cancer tissue corresponds to approximately 4x10^6 cells. Therefore, PDTX injected a slightly smaller amount (80%) of primary tumor cells compared to PDCX, which injected 5x10^6 cells. However, PDTX showed a significantly lower engraftment rate and tumor growth rate compared to PDCX, suggesting that primary tumors in a cell state are more efficient than in a tissue state.
When the M1 tumor volumes were sufficiently large, greater than 500mm^3, the tumors were extracted, and tumor cells and tissues were prepared and frozen in the same manner as before. Next, SC156 M2 (Mouse passage 2) PDCX was produced using 7 to 8x10^5 M1 tumor cells, with some experiments utilizing half that number (3.5 to 4x10^5 cells) to assess tumor growth at lower cell densities. Concurrently, SC156 M2 PDTX was established using 160 mg of M1 tumor tissue (Table 3, Figure 2C and Figure 2D). Two M2 PDTX mice were produced from one M1 PDTX tumor, and seven M2 PDCX mice were produced from three PDCX tumor. To maximize the number of M2 tumor cells using a small number of animals, we inoculated both the left and right flanks of the mice this time. The M2 PDTX model produced tumors ranging from 720 to 880 mg at 87 days after implanting 160 mg of tumor tissue. In contrast, the M2 PDCX model, initiated with only 7 × 10^5 cells, yielded tumors of similar or greater mass (670-1140 mg) at 80 days (Figure 2C). Due to variations in the initial tumor volume and extraction dates among individual mice, we employed the Specific Growth Rate (SGR) method to compare tumor growth rates between PDCX and PDTX models. This method calculates the daily percentage increase in tumor volume, assuming exponential tumor growth, thereby allowing for standardized comparisons across different experimental time frames and initial tumor sizes [18] (Table 3 and Figure 2D). When calculating the SGR over a 100-day period for each tumor, we observed that M2 PDCX exhibited significantly faster growth rate compared to M2 PDTX (5.04 vs. 1.85, ****p< 0.0001). Therefore, it is thought that PDCX has a greater efficacy than PDTX in M2 PDX compared to in M1 PDX. These results demonstrate that even a small amount, such as 3.5x10^5 cells of cryopreserved M1 cancer cells is sufficient to generate M2 PDCX models.
When we compare the growth rate between M1 and M2 tumors, the M2 tumors grew approximately twice as fast as M1 tumors regardless of whether they were PDCX or PDTX (Figure 2E). To calculate the number of cells obtained from an M2 tumor, the tumors were dissociated into cells. The live cells obtained from SC155 and SC156 averaged 5.57x10^7 cells per 1 gram (5.5x10^7 from SC155 and 5.6X10^7 from SC156) (Table S1). Taken together, PDCX models exhibit higher engraftment rates and faster tumor growth rates compared to PDTX models, and the M2 tumor growth rate was twice that of the M1 tumor.
3.3. M1 and M2 Generations of PDCX and PDTX Are Histologically and Immunohistochemically Conserved Their Originalities
To confirm whether tumor tissue xenografted over several generations maintains its original histological properties, their morphology and protein markers were analyzed. Despite differences in tumor size depending on the amount of injected cancer cells or tissue and the time of extraction, the M1 and M2 tumors extracted from PDCX and PDTX models showed similar appearance when visually inspected (Fig S1). Examining the cross sections of PDCX and PDTX tumors, there were no morphological differences across all generations, and no significant differences compared to the primary tumor (Figure 3).
Regarding the immunohistochemical stains for protein markers, the most important aspect of producing a PDX model is ensuring that the expression of p53 in the PDX model mirrors that of the original tumor. The abnormal expression of p53, indicating a mutation in the p53 tumor suppressor gene, is a common characteristic in various types of cancer, including HGSCs. This abnormal expression can indicate the severity of tumor progression and prognosis [19]. When comparing p53 expression in PDCX and PDTX models with the original tumors, the immunohistochemical staining results showed consistent patterns with the original tumors in both cases, even after several generations (Table 4, Figure 3). Specifically, all SC155 tumors exhibited a null (-) pattern, while all SC156 tumors showed a 100% strong positivity pattern.
When we checked the expression of PAX8 in the two generations of PDCX and of PDTX tumor tissues, it was well preserved as same as the original primary tumors. Additionally, the high levels (70~90% positivity) of Ki67 in SC155 case on the xenografted tissues showed maintaining of high proliferation rate (80~90%) over multiple generations. On the other hand, the Ki67 index in SC156 on the xenografted tumor showed higher proliferation index (80~90%) compared with moderate Ki67 index (15~25% positivity) of their primary tumor. In M1 and M2 xenograft tumors, expression of the human stromal marker, vimentin, was focally present in the stroma and blood vessels in some PDCX tumor. The mouse endothelial CD31 was positively stained in the blood vessels of M1 and M2 tumors in PDCX and PDTX models, indicating that the tumors were adapting to the mouse environment over several generations.
These results showed that xenografted tumors produced using frozen cells are not different from xenografted tumors using tissue, and that they adapt to the mouse environment as generations pass but maintain the morphological characteristics of the primary tumor except increased Ki-67 index in one case.
3.4. PDCX and PDTX Tumors Maintain Genetic Conservation from the Original Tumors Across Multiple Generations
In PDX model production, genetic testing between the xenografted tumor and the primary tumor is essential to evaluate the accuracy of the model. To confirm if the tumors from M1 and M2 PDCX preserve their genetic characteristics descended from their corresponding patients’ primary tumors, WES microarray was performed using M1 and M2 PDCX tumors and their primary tumors of two cases (SC155 and SC156).
Kinship analysis showed that the PI_HAT (Proportion IBD) value between each patient’s primary tumor cells and their corresponding M1 and M2 derived tumor cells were exceeding 0.91, confirming the genetic identicality and ruling out potential sample cross-contamination or misidentification (Table 5). When these results were analyzed by heatmap, the original patients’ tumor cells and the two generations of mouse tumors derived from them were clustered together (Figure 4A). In contrast, the PI_HAT values between SC155 and SC156 samples, derived from different patients, were significantly lower, approximating 0.7, indicating genetic distinctness and confirming their origin from different individuals. These results show that even if multiple generations of PDX are produced using cryopreserved cells, the tumor tissue retains the same human characteristics.
Additionally, ASCAT analysis was used to identify the size and location of CNAs in M1 and M2 tumor cells (Figure 4B,C). In SC155M1 and M2, chromosomes 1, 6, 7, 10, 11, 12, 16, and 19 exhibited recurrent CNAs. Similarly, SC156M1 and M2 displayed frequent CNAs on chromosomes 1, 3, 6, 11, 15, 16, 19, and 22. The preservation of these CNA patterns between M1 and M2 passages for each sample indicates the retention of intrinsic genetic characteristics.
3.5. Third Generation of PDCX Could Efficiently Be Used in Large Scale Tests with Uniform Tumor Growth
In experiments using animals, inter-individual variation is bound to occur. To reduce this variation and ensure accurate evaluation, it is recommended that experiments use at least 5 animals per group. In animal experiments using PDTX, it is difficult to inject the same amount of tissue pieces into many subjects, so the results had to be derived from a larger number of subjects or considered tumors differently growing. However, if the PDCX model is used, it is possible to reduce inter-individual variation by injecting the same number of cells. To prove this, we produced several M3 PDCXs using cells obtained and cryopreserved from M2 tumors. As a result, it was found that tumors on M3 PDCX mice grew at the same rate in all subjects when we administered 2x10^6 cells derived from M2 PDCX tumors per each mouse (Figure 5). We confirmed that PDCX model markedly reduce the inter-individual variation by administering the same number of M2 cancer cells to each individual, and it is possible to produce multiple M3 PDCXs with the same conditions, which is more suitable for in vivo anti-cancer efficacy evaluation.
4. Discussion
Patient-derived xenograft (PDX) models have significantly advanced cancer research by providing more accurate representations of human tumors in preclinical settings. These models involve transplanting patient tumor tissue directly into immunodeficient mice, preserving tumor heterogeneity and microenvironment. PDX models have shown varying engraftment rates across cancer types, with colorectal cancer at 76%, head and neck cancer at 85%, non-small cell lung cancer at 41%, breast cancer at 19-21%, gastric cancer at 24%, and liver cancer at 14%. While valuable for drug discovery and personalized medicine, traditional PDX models face challenges such as low engraftment rates for certain cancers and scaling difficulties. High-grade serous carcinoma (HGSC) exhibits a relatively high engraftment rate of 58%[20]. However, the inherent high heterogeneity of HGSC increases the likelihood of different tumor phenotypes developing in different mice when utilizing tissue slices, thereby diminishing inter-subject uniformity in experimental design [21,22]. In addition, beyond HGSC, the method of creating PDX using primary tumor tissue requires surgical techniques such as anesthesia, incision, and suturing, so it may be difficult to start in laboratories where these techniques are not established.
In the present study, we demonstrated that the PDCX model has an advantage for advancing in vivo cancer research, particularly in the context of high-grade serous carcinoma (HGSC). This innovative approach offers several key advantages over traditional patient-derived xenograft (PDX) models. The first one is that it shows successful tumor engraftment potential with long-term viability. The traditional PDTX engraftment rates vary significantly depending on cancer type, ranging from 14% for liver cancer to 85% for head and neck cancer when using NSG or NOG mice [23]. Although HGSC has a relatively high engraftment rate, with reported success rates of 58% at 3-6 months[20,24], they suggested the complex preparation method using fresh tissue. In our study, the PDCX model achieved a high success rate of 64% (9 out of 14 cases) using cryopreserved tumor cells with a maximum latency time of 6 months. This result surpasses even PDTX models of previous report [20,24] using fresh tissue. Notably, one case (SC39) exhibited tumor growth consistent with the original patient tumor after 485 days of cryopreservation, indicating that cancer cells can be stably preserved for over a year in liquid nitrogen for generating PDCX models. The second one is that our PDCX modeling simplifies the establishment process, requiring only a syringe without complex surgical techniques. In addition, the use of isolated cancer cells can more easily and accurately measure the amount of transplanting material, which results in more uniform engraftment across animals, reducing experimental variability and minimizing outliers. This uniformity is particularly beneficial, especially when using expensive immunodeficient mice, providing economic advantages in research settings.
This study also provided detailed information about the number of cells obtained from extracted M2 tumors. On average, approximately 5.57 x 10^7 live cells were isolated per gram of M2 tumor tissue. This high yield to obtain cells from the tumor tissue enables us to develop enough subsequent generations of xenografts. Theoretically, assuming an inoculation dose of 3.5x10^5 cells per animal, 1g of M2 tumor tissue is sufficient to establish approximately 160 M3 PDCX mice (Table 3). In this study, the cell viability after extraction was consistently high, ranging from 79.7% to 90.9%, indicating the robustness of the isolation process. These findings highlight the scalability of the PDCX approach, enabling researchers to produce large numbers of uniform xenografts from a single tumor sample, which is particularly valuable for large-scale drug screening studies.
This study demonstrated that PDCX tumors we developed maintained the genetic and histological characteristics of the original patients’ primary tumors. Kinship analysis showed high PI_HAT values (over 0.91) between patient tumor cells and derived M1 and M2 tumor cells, confirming their genetic similarity. ASCAT analysis revealed consistent CNA patterns across generations. Histologically, the expression of key markers such as p53 and PAX8, was preserved in M1 and M2 PDCX tumors as well as their similarity of H&E morphology to their primary tumors, indicating the maintenance of important tumor characteristics. It was reported that nearly all HGSC cases (96%) display mutations in the TP53 gene, which is crucial for cell cycle regulation, apoptosis, and DNA repair [25,26], while PAX8, a gene that promotes cancer cell proliferation and invasion, is often overexpressed in ovarian cancer including HGSCs, which serves as an important diagnostic indicator for ovarian cancers [27,28,29,30]. In our PDCX model, we confirmed that M1 and M2 tumors preserved the aberrant expression of p53 protein (Null negativity for SC155, and diffuse strong positivity for SC156). In this study, we found that one (SC155) of PDCX tumors showed similar Ki67 proliferation index to that of primary tumor, while another PDCX tumor (SC156) revealed increased Ki67 proliferation index compared to its primary tumor (80% vs. 25%). This indicates that PDX model may not always be identical and can be more aggressive. This phenomenon can be attributed to several factors : (1) selection bias ; the process of establishing a PDX model might inadvertently select more aggressive tumor cells because the primary tumor may have different aggressiveness in different areas, (2) tumor microenvironment and immune system interaction of the host animal ; the tumor micro- and immune environment in the host animal can differ significantly from that of the human patient, potentially promoting faster tumor growth and higher proliferation rates. However, other molecular and genetic characteristics were the same as the primary tumor in SC156, leading us to conclude that the PDX tumors accurately represent the primary tumor.
As for the stromal marker, vimentin, some of PDCX or PDTX tumors showed focal positivity in the stroma and blood vessels. In general, changes in the expression of human stromal markers and mouse endothelial markers were observed across multiple generations of xenografts. The expression of the human stromal marker, vimentin, decreased in M1 and M2 xenograft tumors, while the mouse endothelial marker CD31 increased. This shift indicates that the tumors were adapting to the mouse environment over successive generations [14,31]. The increase in mouse CD31 expression suggests a process of tumor vascularization using the host’s endothelial cells, crucial for tumor growth and survival. Taken together, despite these changes in the tumor microenvironment, our xenografts maintained the key morphological and genetic characteristics of the primary tumors, highlighting the robustness of the PDCX model for cancer research. Therefore, the PDCX model in this study holds promise for various applications beyond HGSC in preclinical trials, including cancer drug screening, biomarker discovery, and evaluation of drug efficacy, safety, and pharmacokinetics. Future studies are needed to focus on expanding the application of this model to other cancer types and exploring its potential for personalized medicine approaches.
In conclusion, we developed PDCX model representing a significant advancement in cancer research methodology. Especially, the model’s ability to produce uniform tumor growth in third-generation xenografts (M3 PDCX) suggests its potential for large-scale, standardized drug efficacy testing with reduced inter-individual variation. In addition, its advantages in terms of long-term storage, uniform tumor growth, easy-to-establish method, and preservation of original tumor characteristics provide a valuable tool for more cost-effective and efficient in vivo experimental designs in cancer research.
5. Patents
The authors have filed a patent application (#10-2024-0181613) describing a method for producing PDCX using cells obtained from the tumor of ovarian cancer patients developed in this study.
Supplementary Materials
The following supporting information can be downloaded at the website of this paper posted on Preprints.org. Table S1: Number of cancer cells obtained from 1 mg of M2 PDCX tumor, Figure S1: Comparisons of morphology between PDCX and PDTX models in two different cases.
Author Contributions
Conceptualization, K.K. and H.A.; methodology, K.K., J.L., A.G.; software, K.K. and D.J.; validation, E.L.; formal analysis, K.K.; investigation, K.K., J.L., E.L., and D.J.; resources, H.A.,M.C, S.J.,H.P.,S.H., and H.K.; data curation, K.K.; writing—original draft preparation, K.K. and H.A.; writing—review and editing, H.A.; visualization, K.K. and H.A.; supervision, H.A.; project administration, H.A.; All authors have read and agreed to the published version of the manuscript.
Funding
This research was supported by a grant from the Korean Government through the Korea Health Industry Development Institute (KHIDI), funded by the Ministry of Health & Welfare, Republic of Korea (grant number: HI16C1559 and HI22C1433).
Institutional Review Board Statement
The study was conducted in accordance with the Declaration of Helsinki and approved by the Institutional Review Board of CHA Bundang Medical Center, CHA University (protocol code: IRB #CHAMC 2019-08-039, date of approval: 2019-10-02). The animal study protocol was approved by the Institutional Animal Care and Use Committee (IACUC) of CHA University (IACUC-200052, date of approval: 2020-03-01).
Informed Consent Statement
Informed consent was obtained from all subjects involved in the study. Written informed consent has been obtained from the patients to publish this paper
Data Availability Statement
There is no new data were created.
Conflicts of Interest
The authors declare no conflicts of interest.
References
- Bertotti, A.; Migliardi, G.; Galimi, F.; Sassi, F.; Torti, D.; Isella, C.; Corâ, D.; Di Nicolantonio, F.; Buscarino, M.; Petti, C.; et al. A Molecularly Annotated Platform of Patient-Derived Xenografts (“Xenopatients”) Identifies HER2 as an Effective Therapeutic Target in Cetuximab-Resistant Colorectal Cancer. Cancer Discovery 2011, 1, 508-523. [CrossRef]
- Gao, H.; Korn, J.M.; Ferretti, S.; Monahan, J.E.; Wang, Y.Z.; Singh, M.; Zhang, C.; Schnell, C.; Yang, G.Z.; Zhang, Y.; et al. High-throughput screening using patient-derived tumor xenografts to predict clinical trial drug response. Nature Medicine 2015, 21, 1318-1325. [CrossRef]
- Wang, Y.N.; Duval, A.J.; Adli, M.; Matei, D. Biology-driven therapy advances in high-grade serous ovarian cancer. Journal of Clinical Investigation 2024, 134, doi:ARTN e174013. [CrossRef]
- Liu, Y.; Wu, W.; Cai, C.; Zhang, H.; Shen, H.; Han, Y. Patient-derived xenograft models in cancer therapy: technologies and applications. Signal Transduct Target Ther 2023, 8, 160. [CrossRef]
- Jin, J.K.; Yoshimura, K.; Sewastjanow-Silva, M.; Song, S.M.; Ajani, J.A. Challenges and Prospects of Patient-Derived Xenografts for Cancer Research. Cancers 2023, 15, doi:ARTN 4352. [CrossRef]
- Hidalgo, M.; Amant, F.; Biankin, A.V.; Budinská, E.; Byrne, A.T.; Caldas, C.; Clarke, R.B.; de Jong, S.; Jonkers, J.; Mælandsmo, G.M.; et al. Patient-Derived Xenograft Models: An Emerging Platform for Translational Cancer Research. Cancer Discovery 2014, 4, 998-1013. [CrossRef]
- Tan, M.T.; Mei, J.; Xie, J. The Formation and Control of Ice Crystal and Its Impact on the Quality of Frozen Aquatic Products: A Review. Crystals 2021, 11, doi:ARTN 68. [CrossRef]
- Buckley, D.N.; Lewinger, J.P.; Gooden, G.; Spillman, M.; Neuman, M.; Guo, X.M.; Tew, B.Y.; Miller, H.; Khetan, V.U.; Shulman, L.P.; et al. OvaPrint-A Cell-free DNA Methylation Liquid Biopsy for the Risk Assessment of High-grade Serous Ovarian Cancer. Clin Cancer Res 2023, 29, 5196-5206. [CrossRef]
- Wallis, B.; Bowman, K.R.; Lu, P.; Lim, C.S. The Challenges and Prospects of p53-Based Therapies in Ovarian Cancer. Biomolecules 2023, 13, doi:ARTN 159. [CrossRef]
- Bradbury, M.; Borras, E.; Vilar, M.; Castellvi, J.; Sanchez-Iglesias, J.L.; Perez-Benavente, A.; Gil-Moreno, A.; Santamaria, A.; Sabido, E. A combination of molecular and clinical parameters provides a new strategy for high-grade serous ovarian cancer patient management. J Transl Med 2022, 20, 611. [CrossRef]
- Smith, P.; Bradley, T.; Gavarro, L.M.; Goranova, T.; Ennis, D.P.; Mirza, H.B.; De Silva, D.; Piskorz, A.M.; Sauer, C.M.; Al-Khalidi, S.; et al. Author Correction: The copy number and mutational landscape of recurrent ovarian high-grade serous carcinoma. Nat Commun 2023, 14, 5992. [CrossRef]
- Govindarajan, M.; Wohlmuth, C.; Waas, M.; Bernardini, M.Q.; Kislinger, T. High-throughput approaches for precision medicine in high-grade serous ovarian cancer. J Hematol Oncol 2020, 13, doi:ARTN 134. [CrossRef]
- Sorio, C.; Bonora, A.; Orlandini, S.; Moore, P.S.; Capelli, P.; Cristofori, P.; Dal Negro, G.; Marchiori, P.; Gaviraghi, G.; Falconi, M.; et al. Successful xenografting of cryopreserved primary pancreatic cancers. Virchows Arch 2001, 438, 154-158, doi:DOI 10.1007/s004280000343.
- Alkema, N.G.; Tomar, T.; Duiker, E.W.; Meersma, G.J.; Klip, H.; van der Zee, A.G.J.; Wisman, G.B.A.; de Jong, S. Biobanking of patient and patient-derived xenograft ovarian tumour tissue: efficient preservation with low and high fetal calf serum based methods. Scientific Reports 2015, 5, doi:ARTN 14495. [CrossRef]
- O’Brien, C.A.; Pollett, A.; Gallinger, S.; Dick, J.E. A human colon cancer cell capable of initiating tumour growth in immunodeficient mice. Nature 2007, 445, 106-110. [CrossRef]
- Xia, L.; Zheng, Z.; Liu, J.Y.; Chen, Y.J.; Ding, J.; Hu, G.S.; Hu, Y.H.; Liu, S.; Luo, W.X.; Xia, N.S.; et al. Targeting Triple-Negative Breast Cancer with Combination Therapy of EGFR CAR T Cells and CDK7 Inhibition. Cancer Immunol Res 2021, 9, 707-722. [CrossRef]
- Jespersen, H.; Lindberg, M.F.; Donia, M.; Soderberg, E.M.V.; Andersen, R.; Keller, U.; Ny, L.; Svane, I.M.; Nilsson, L.M.; Nilsson, J.A. Clinical responses to adoptive T-cell transfer can be modeled in an autologous immune-humanized mouse model. Nature Communications 2017, 8, doi:ARTN 707. [CrossRef]
- Mehrara, E.; Forssell-Aronsson, E.; Ahlman, H.; Bernhardt, P. Quantitative analysis of tumor growth rate and changes in tumor marker level: Specific growth rate versus doubling time. Acta Oncol 2009, 48, 591-597, doi:Pii 909952374. [CrossRef]
- Alakonya, H.; Koustoulidou, S.; Hopkins, S.L.; Veal, M.; Ajenjo, J.; Sneddon, D.; Dias, G.; Mosley, M.; Amoroso, F.; Anderson, A.; et al. Molecular Imaging of p53 in Mouse Models of Cancer Using a Radiolabeled Antibody TAT Conjugate with SPECT. Journal of Nuclear Medicine 2024, 65, 1626-1632. [CrossRef]
- Chen, J.Y.; Jin, Y.; Li, S.Y.; Qiao, C.; Peng, X.X.; Li, Y.; Gu, Y.; Wang, W.; You, Y.; Yin, J.; et al. Patient-Derived Xenografts Are a Reliable Preclinical Model for the Personalized Treatment of Epithelial Ovarian Cancer. Front Oncol 2021, 11, doi:ARTN 744256. [CrossRef]
- Cassidy, J.W.; Caldas, C.; Bruna, A. Maintaining Tumor Heterogeneity in Patient-Derived Tumor Xenografts. Cancer Res 2015, 75, 2963-2968. [CrossRef]
- Liu, Y.H.; Wu, W.T.; Cai, C.J.; Zhang, H.; Shen, H.; Han, Y. Patient-derived xenograft models in cancer therapy: technologies and applications. Signal Transduct Tar 2023, 8, doi:ARTN 160. [CrossRef]
- Cho, S.Y. Patient-derived xenografts as compatible models for precision oncology. Lab Anim Res 2020, 36, doi:ARTN 14. [CrossRef]
- Dong, R.F.; Qiang, W.A.; Guo, H.Y.; Xu, X.F.; Kim, J.J.; Mazar, A.; Kong, B.H.; Wei, J.J. Histologic and molecular analysis of patient derived xenografts of high-grade serous ovarian carcinoma. J Hematol Oncol 2016, 9, doi:ARTN 92. [CrossRef]
- Kyo, S.; Ishikawa, N.; Nakamura, K.; Nakayama, K. The fallopian tube as origin of ovarian cancer: Change of diagnostic and preventive strategies. Cancer Medicine 2020, 9, 421-431. [CrossRef]
- Ghezelayagh, T.S.; Pennington, K.P.; Norquist, B.M.; Khasnavis, N.; Radke, M.R.; Kilgore, M.R.; Garcia, R.L.; Lee, M.; Katz, R.; Leslie, K.K.; et al. Characterizing mutations in ovarian carcinomas with and without concurrent BRCA1 or BRCA2 mutations. Gynecologic Oncology 2021, 160, 786-792. [CrossRef]
- Soriano, A.A.; de Cristofaro, T.; Di Palma, T.; Dotolo, S.; Gokulnath, P.; Izzo, A.; Calì, G.; Facchiano, A.; Zannini, M. PAX8 expression in high-grade serous ovarian cancer positively regulates attachment to ECM via Integrin β3. Cancer Cell International 2019, 19, doi:ARTN 303. [CrossRef]
- Di Palma, T.; Zannini, M. PAX8 as a Potential Target for Ovarian Cancer: What We Know so Far. Oncotargets and Therapy 2022, 15, 1273-1280. [CrossRef]
- Adler, E.K.; Corona, R.I.; Lee, J.M.; Rodriguez-Malave, N.; Mhawech-Fauceglia, P.; Sowter, H.; Hazelett, D.J.; Lawrenson, K.; Gayther, S.A. The PAX8 cistrome in epithelial ovarian cancer. Oncotarget 2017, 8, 108316-108332. [CrossRef]
- Chaves-Moreira, D.; Morin, P.J.; Drapkin, R. Unraveling the Mysteries of PAX8 in Reproductive Tract Cancers. Cancer Res 2021, 81, 806-810. [CrossRef]
- Eguchi, S.; Kimura, K.; Kageyama, K.; Tani, N.; Tanaka, R.; Nishio, K.; Shinkawa, H.; Ohira, G.O.; Amano, R.; Tanaka, S.; et al. Optimal Organ for Patient-derived Xenograft Model in Pancreatic Cancer and Microenvironment that Contributes to Success. Anticancer Res 2022, 42, 2395-2404. [CrossRef]
Figure 1.
Establishment of PDCX and PDTX models with cryopreserved cells and tissues. A. Modeling process of PDCX and PDTX. Fresh primary cancers were dissociated or simply minced prior to cryopreservation. The cryopreserved cancer cells or tissues were transplanted to NSG mice for M1 PDCX or PDTX production. The extracted tumors from M1 PDCX or PDTX are proceed using the same steps for the next generation fabrication. B. Representative H&E images of M1 PDCX tumors showing the same histological patterns as the primary tumors.
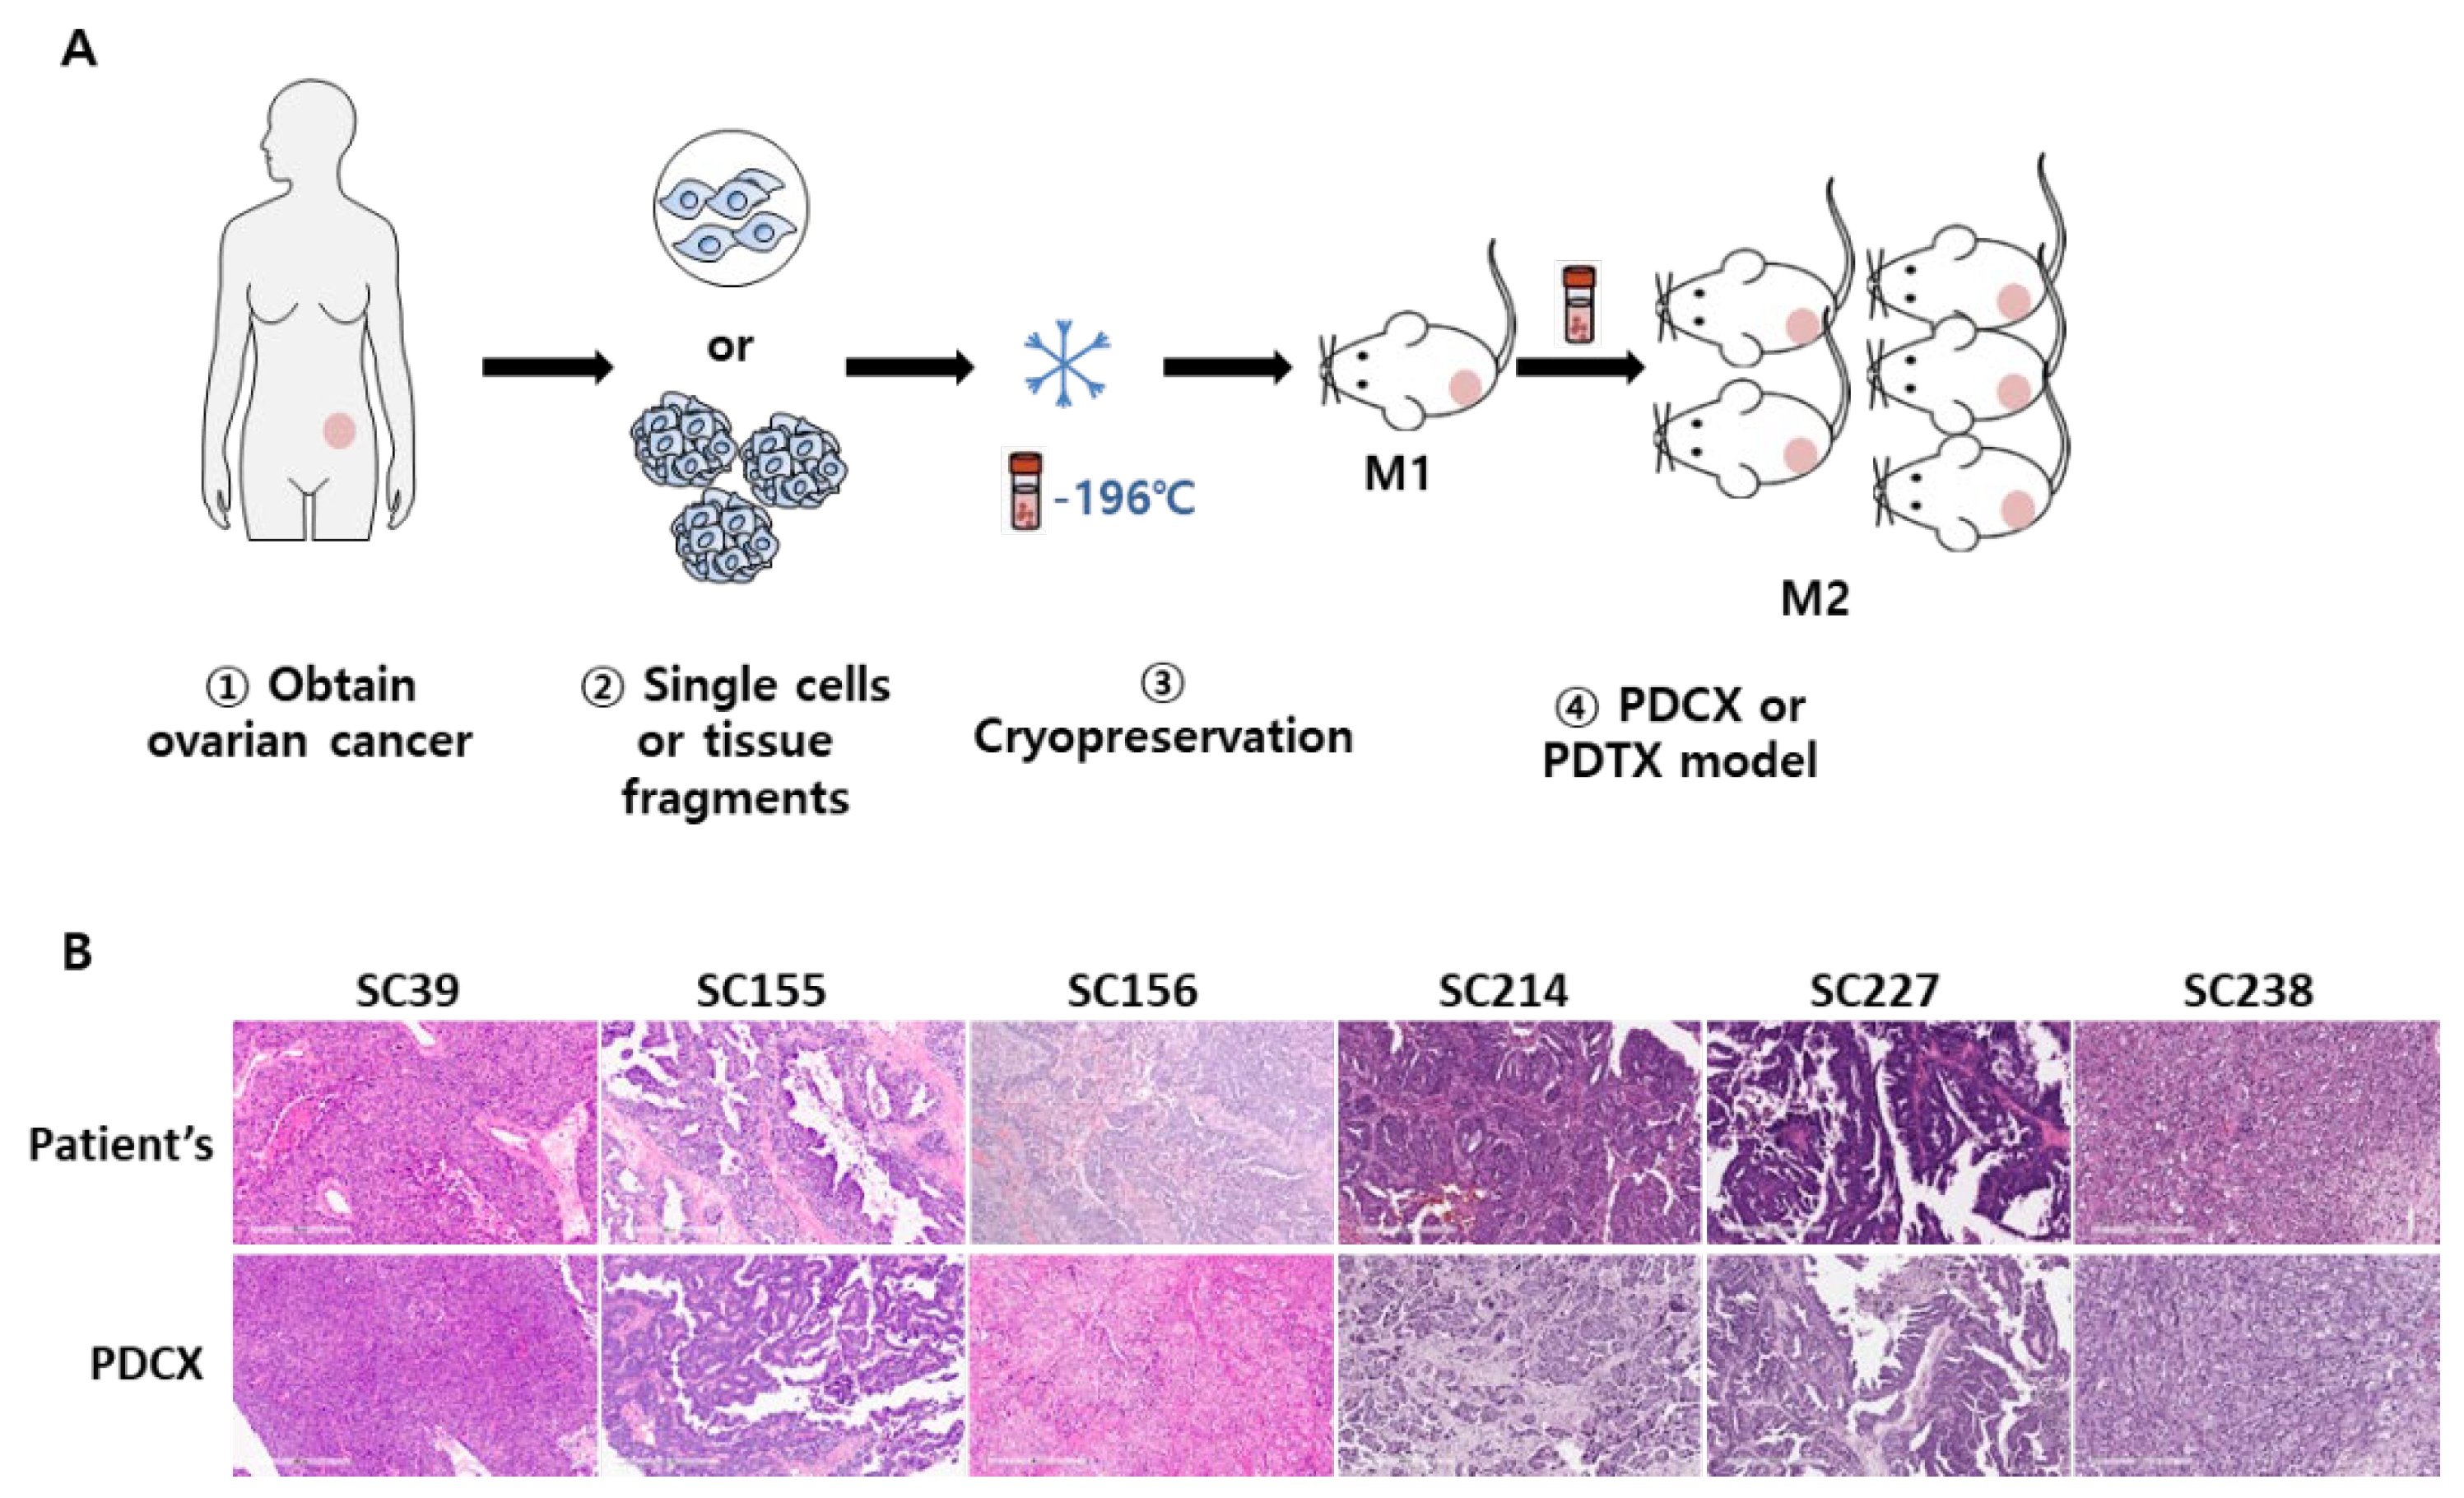
Figure 2.
Comparisons of tumor growth between PDCX and PDTX models. A. The tumor growth curves for each case of M1 PDCX and M1 PDTX for SC155 (N=3) and SC156 (N=4). B. The number of days until M1 tumor volumes reached 500mm^3 for each case (N=2 to 4). None of the SC155 PDTX tumors grew over 500mm^3. C. The M2 PDCX and M2 PDTX tumor growth curves of SC156 are shown, with each line representing one tumor. PDCX1_M2, PDCX2_M2, and PDCX3_M2 are derived from different M1 entities (N= 2 to 4). D. Comparisons of specific growth rates were made between SC156 M2 PDCX and PDTX tumors from both flanks of M2 PDX mice. The sample size was N=7 for PDCX or N=2 for PDTX. E. The correlation between tumor weight and extraction days of M1 and M2 tumors, regardless of being PDCX or PDTX. This included three M1 PDCX with their corresponding three M2 PDCX, and two M1 PDTX with their corresponding two M2 PDTX.
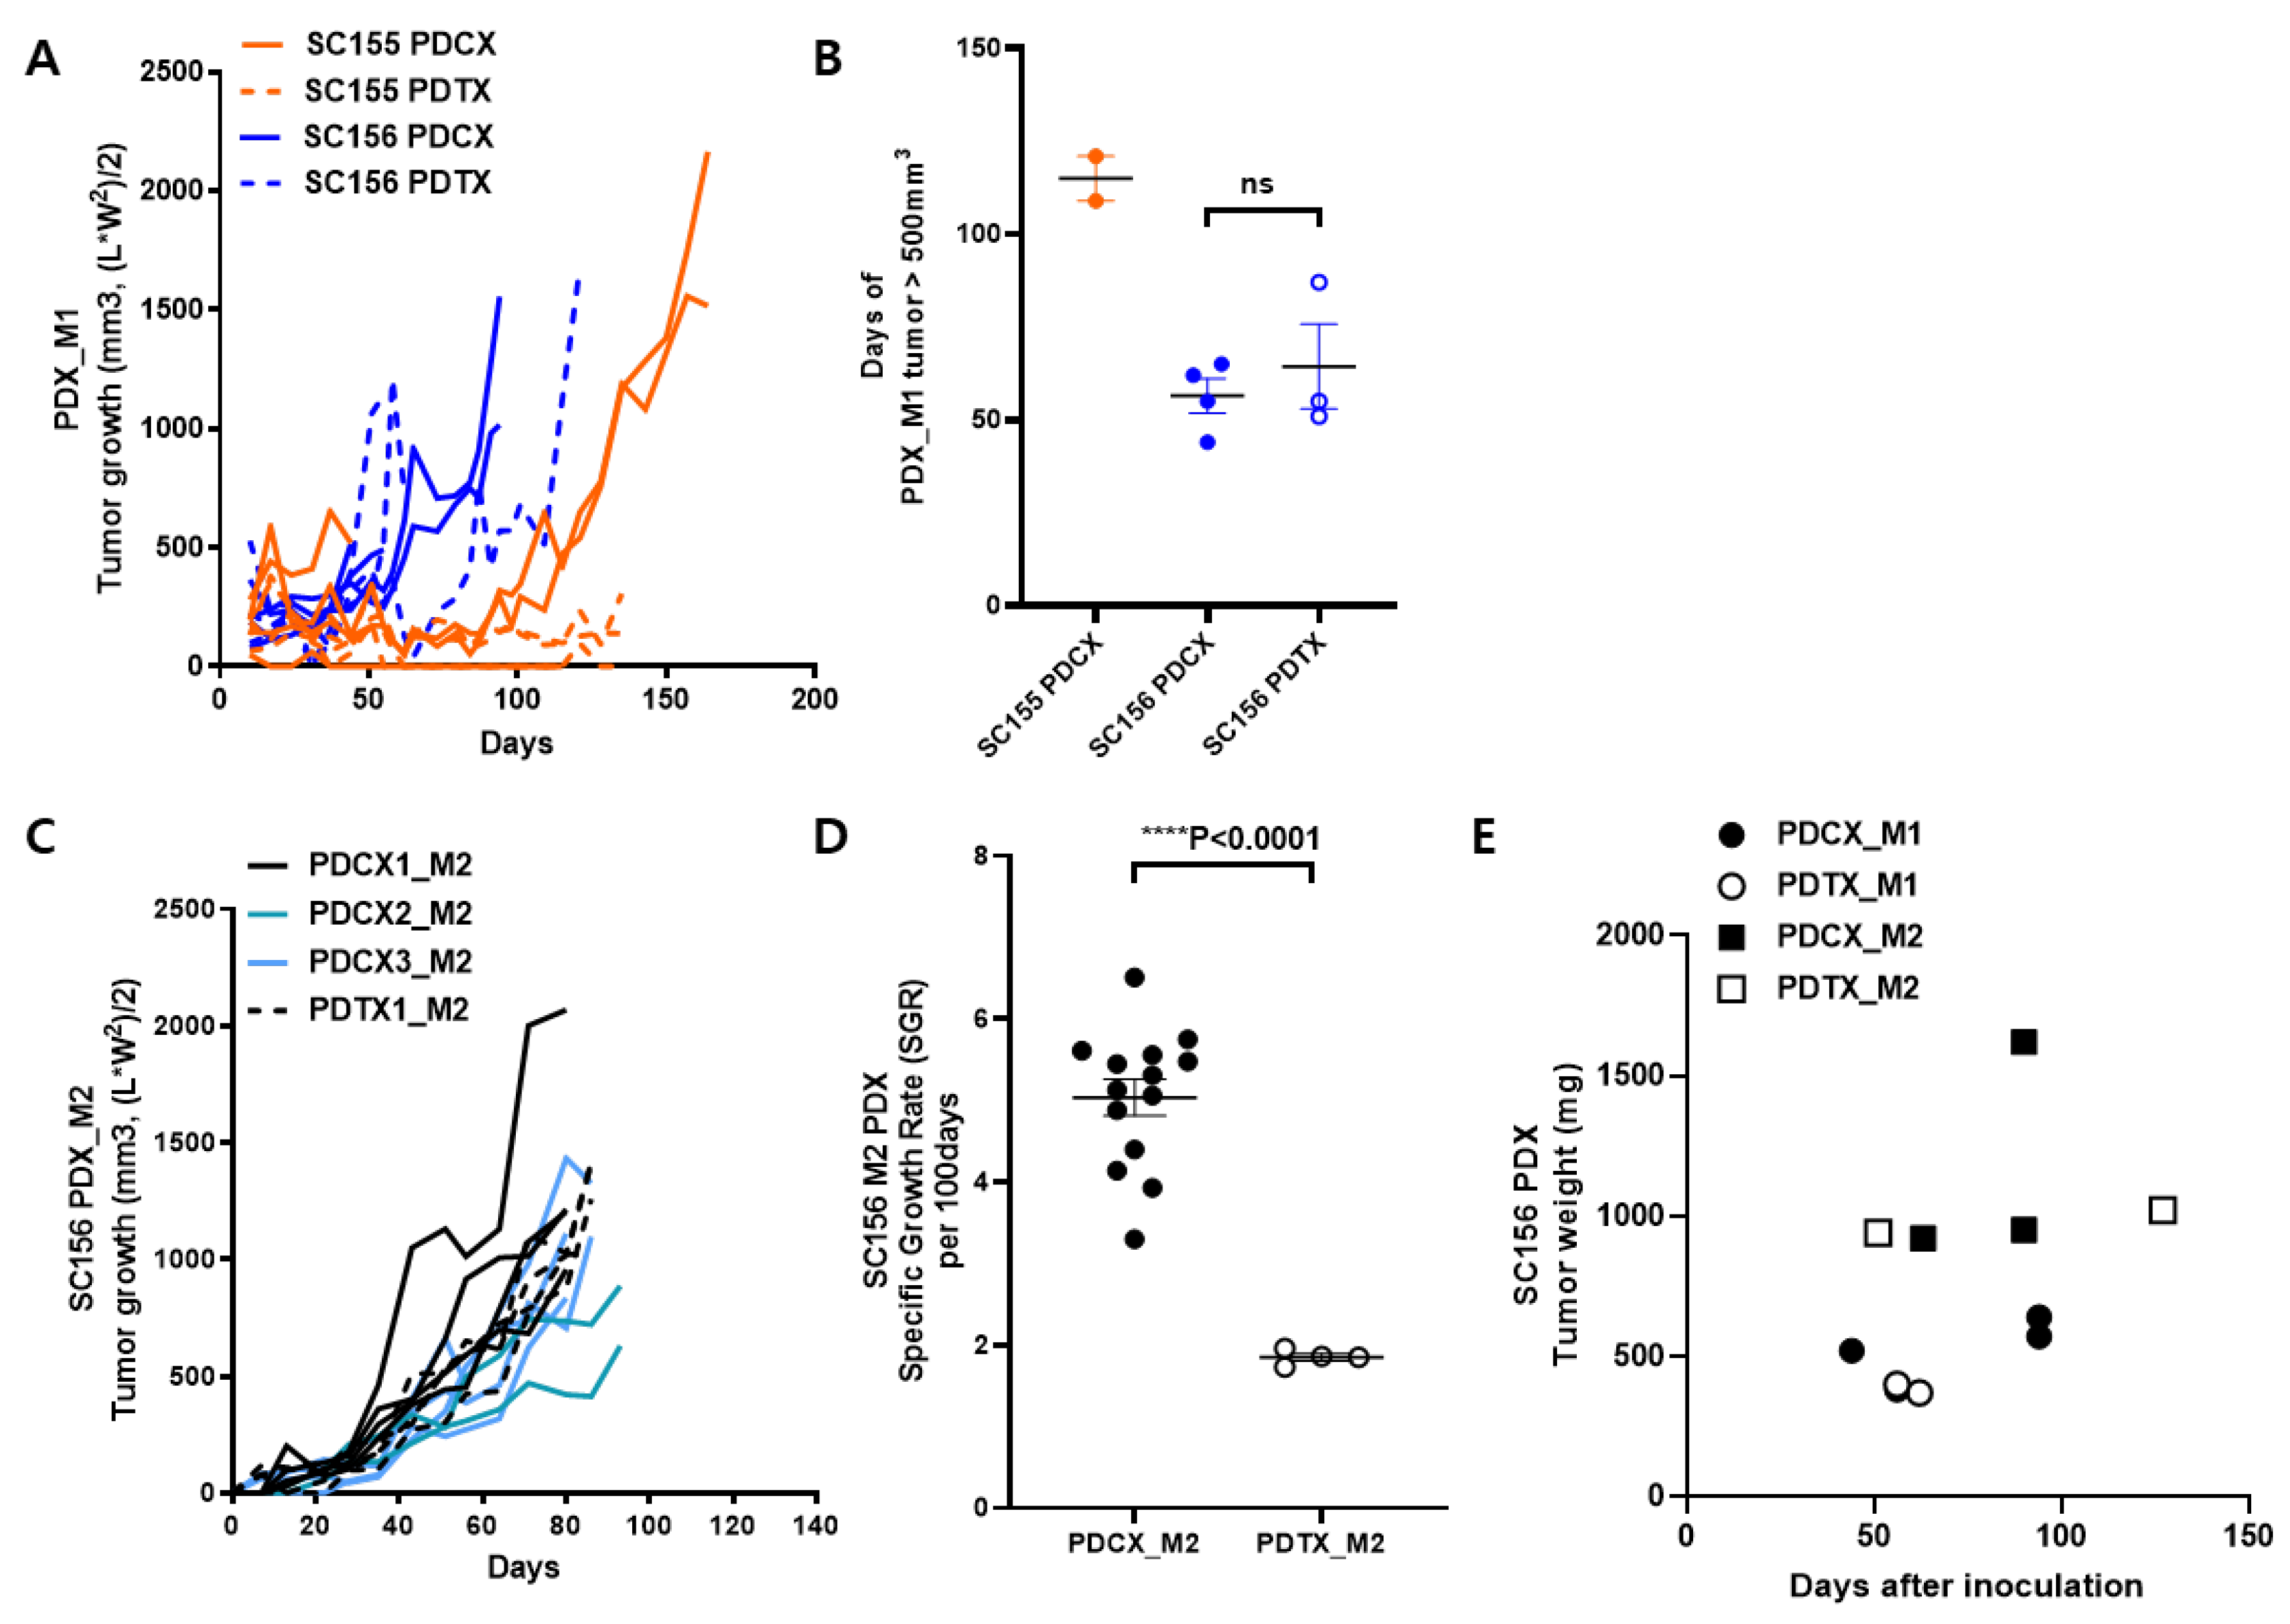
Figure 3.
H&E and immunohistochemical stains of primary cancers and their corresponding PDCX or PDTX tumors. Representative images of H&E and immunohistochemical stains with anti-human p53, PAX8, Ki67, vimentin and anti-mouse CD31 antibodies for the patient’s primary tumor and their corresponding M1, M2 tumors for SC155 (A) and SC 156(B). The expression of essential markers for ovarian cancer was conserved in M1 and M2 tumors, except for the Ki-67 index in SC156, where M1 and M2 PDCX or PDTX tumors showed a higher proliferation index compared to the patient’s primary tumor.
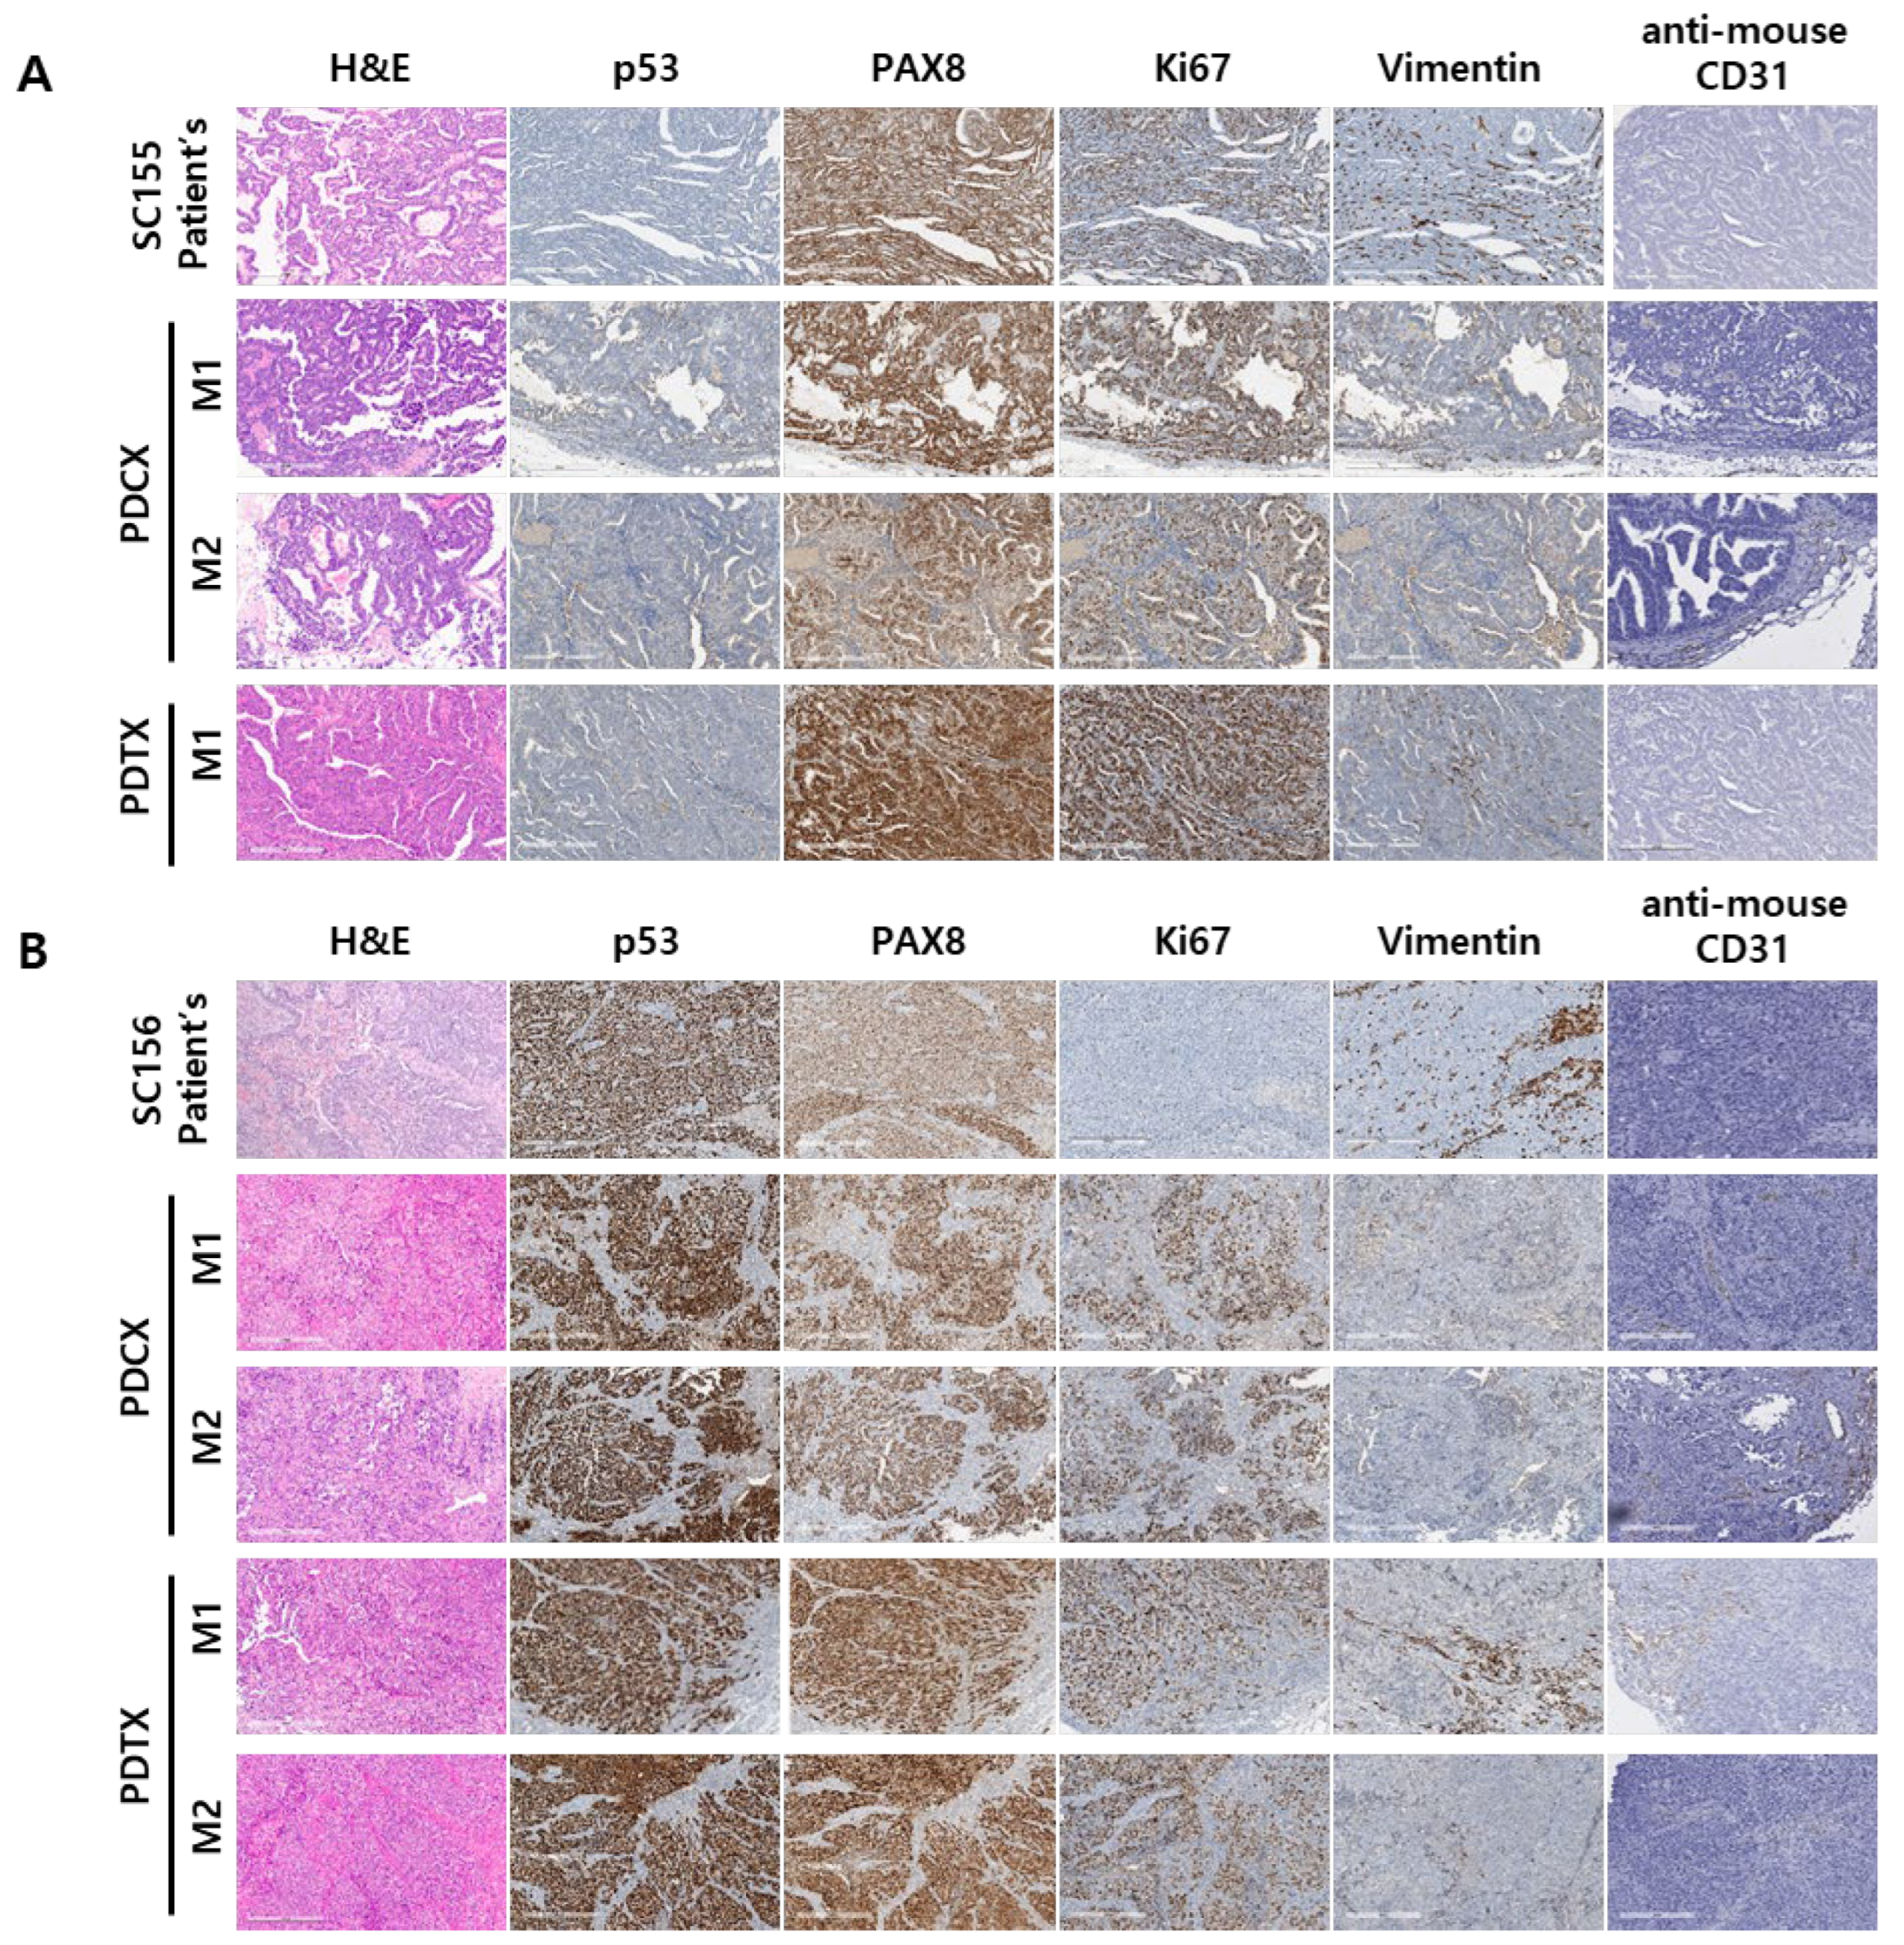
Figure 4.
Genetic identities among three generations in two different cases. A. Kinship analysis between the patient’s cancer cells and M1 or M2 PDCX cancer cells. Dark red & high numbers indicate the same person, while dark blue & low numbers indicate different people. B. ASCAT analysis between SC155M1 PDCX and SC155M2 PDCX. C. ASCAT analysis between SC156M1 PDCX and SC156M2 PDCX. ASCAT: Allele-specific copy number analysis of tumors. Green dot: Copy Number Alteration (CNA) at a specific gene locus.
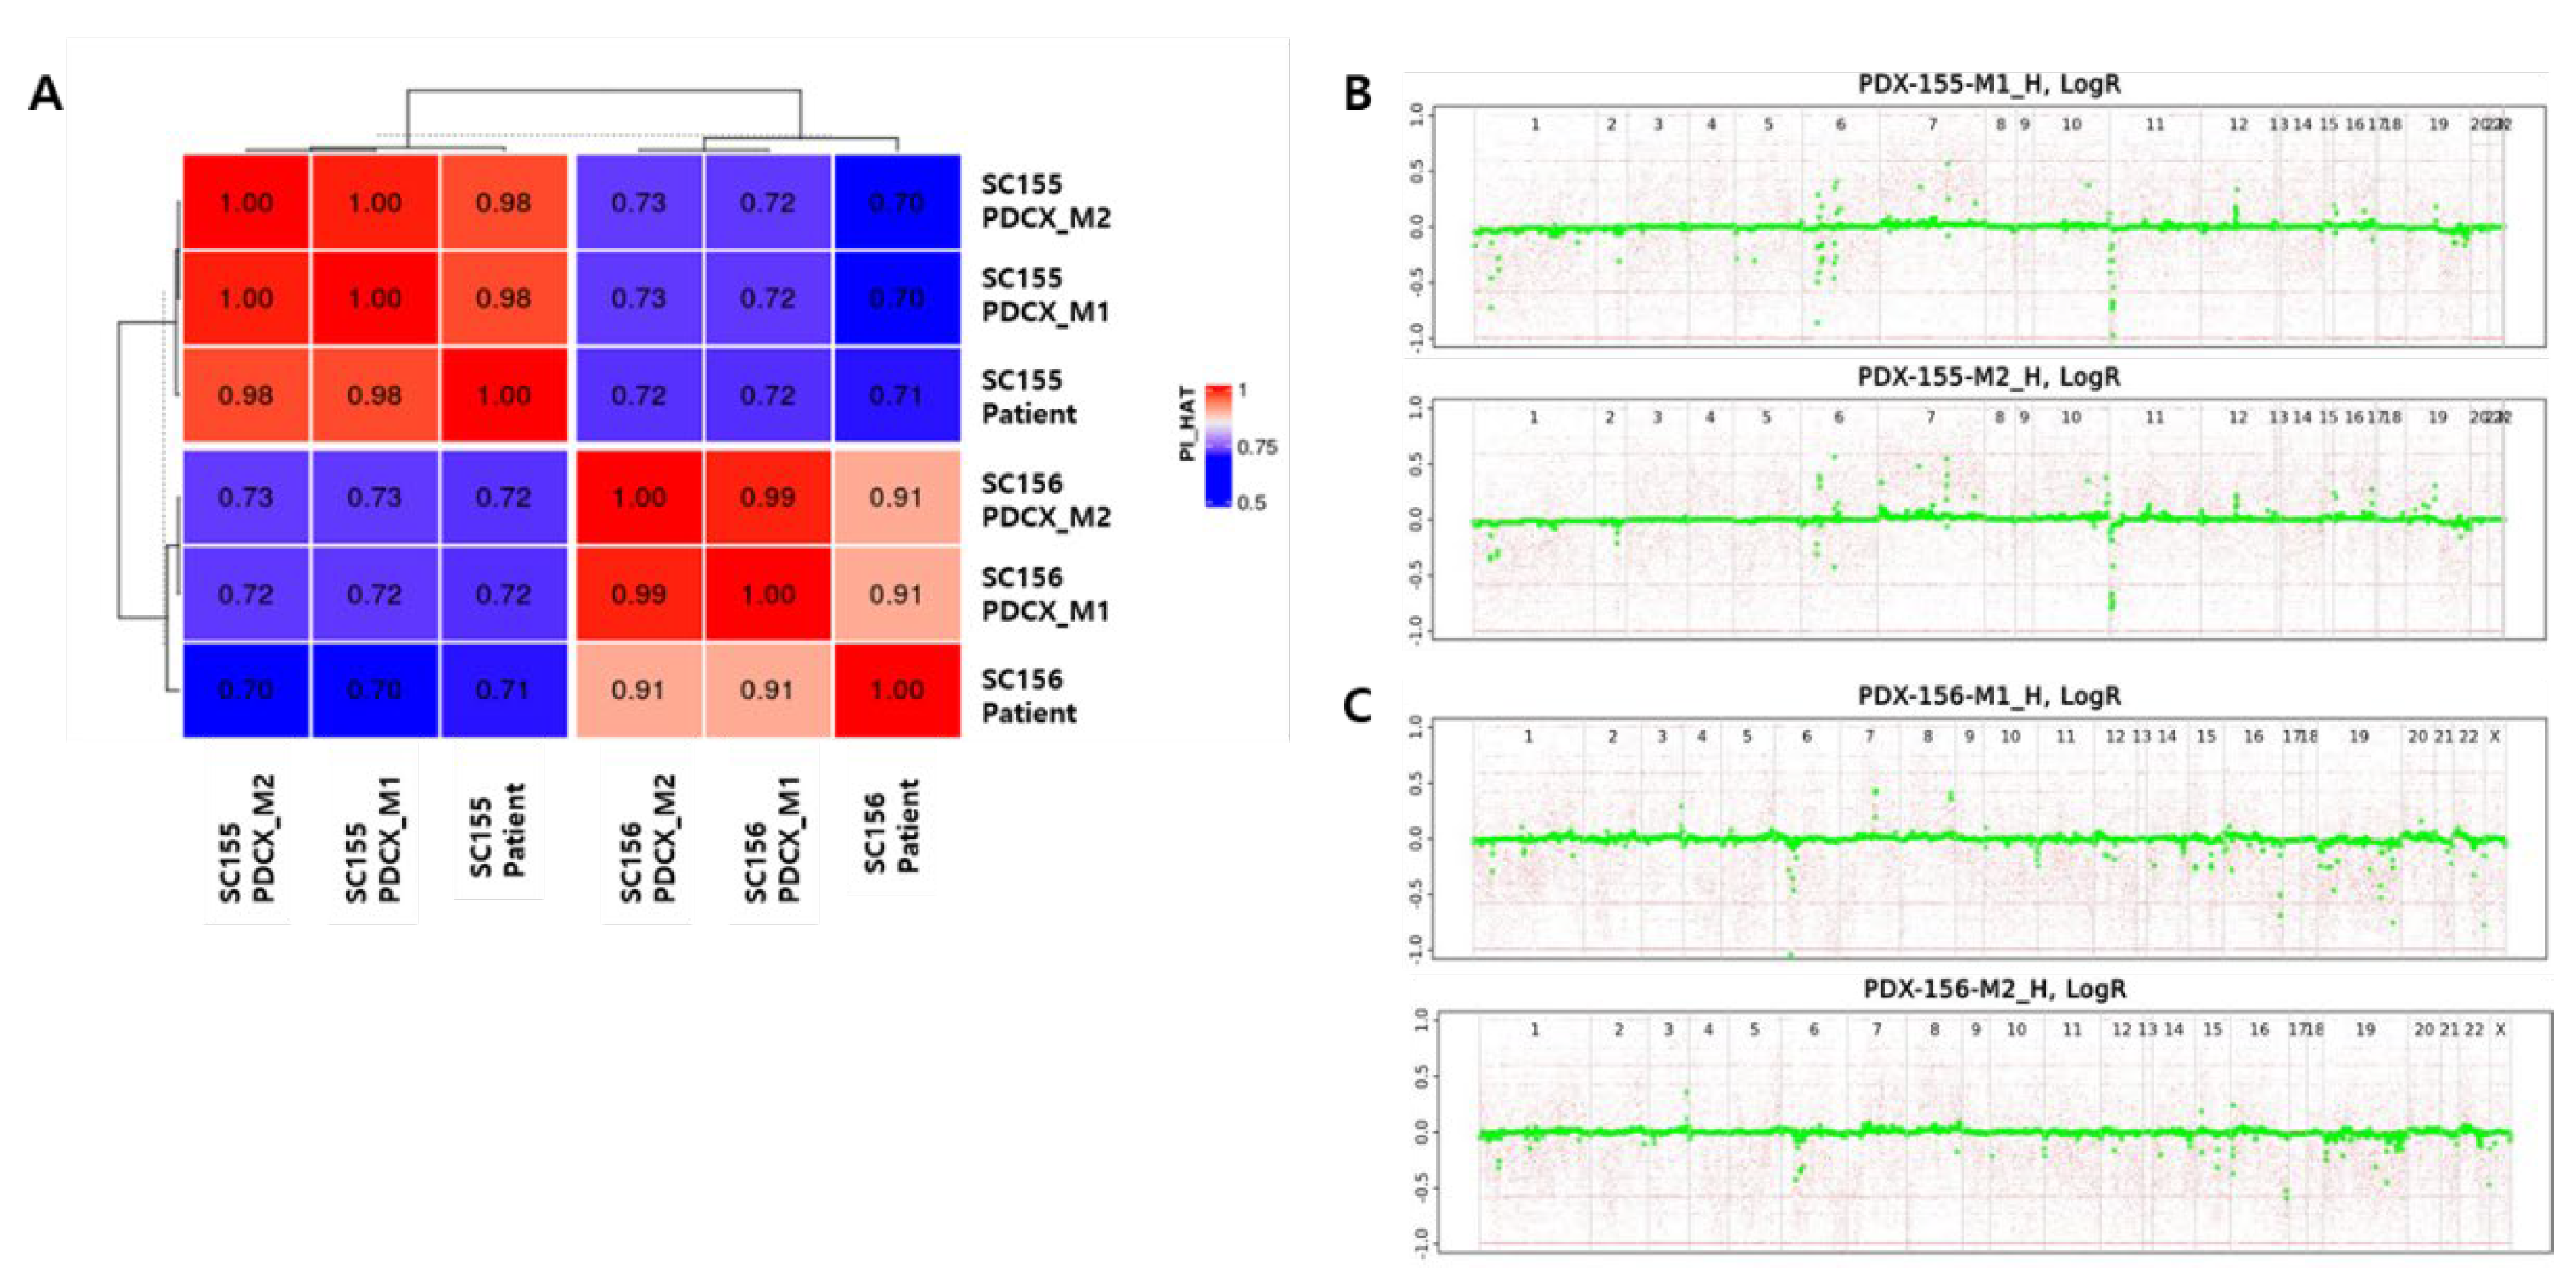
Figure 5.
The uniform tumor growth rates of M3 PDCX individuals in two different cases. A. Tumor growth rates of SC156 M3 PDCX mice implanted 2x10^6 cancer cells. B. Tumor growth rates of SC214 M3 PDCX mice implanted 2x10^6 cancer cells.
Figure 5.
The uniform tumor growth rates of M3 PDCX individuals in two different cases. A. Tumor growth rates of SC156 M3 PDCX mice implanted 2x10^6 cancer cells. B. Tumor growth rates of SC214 M3 PDCX mice implanted 2x10^6 cancer cells.
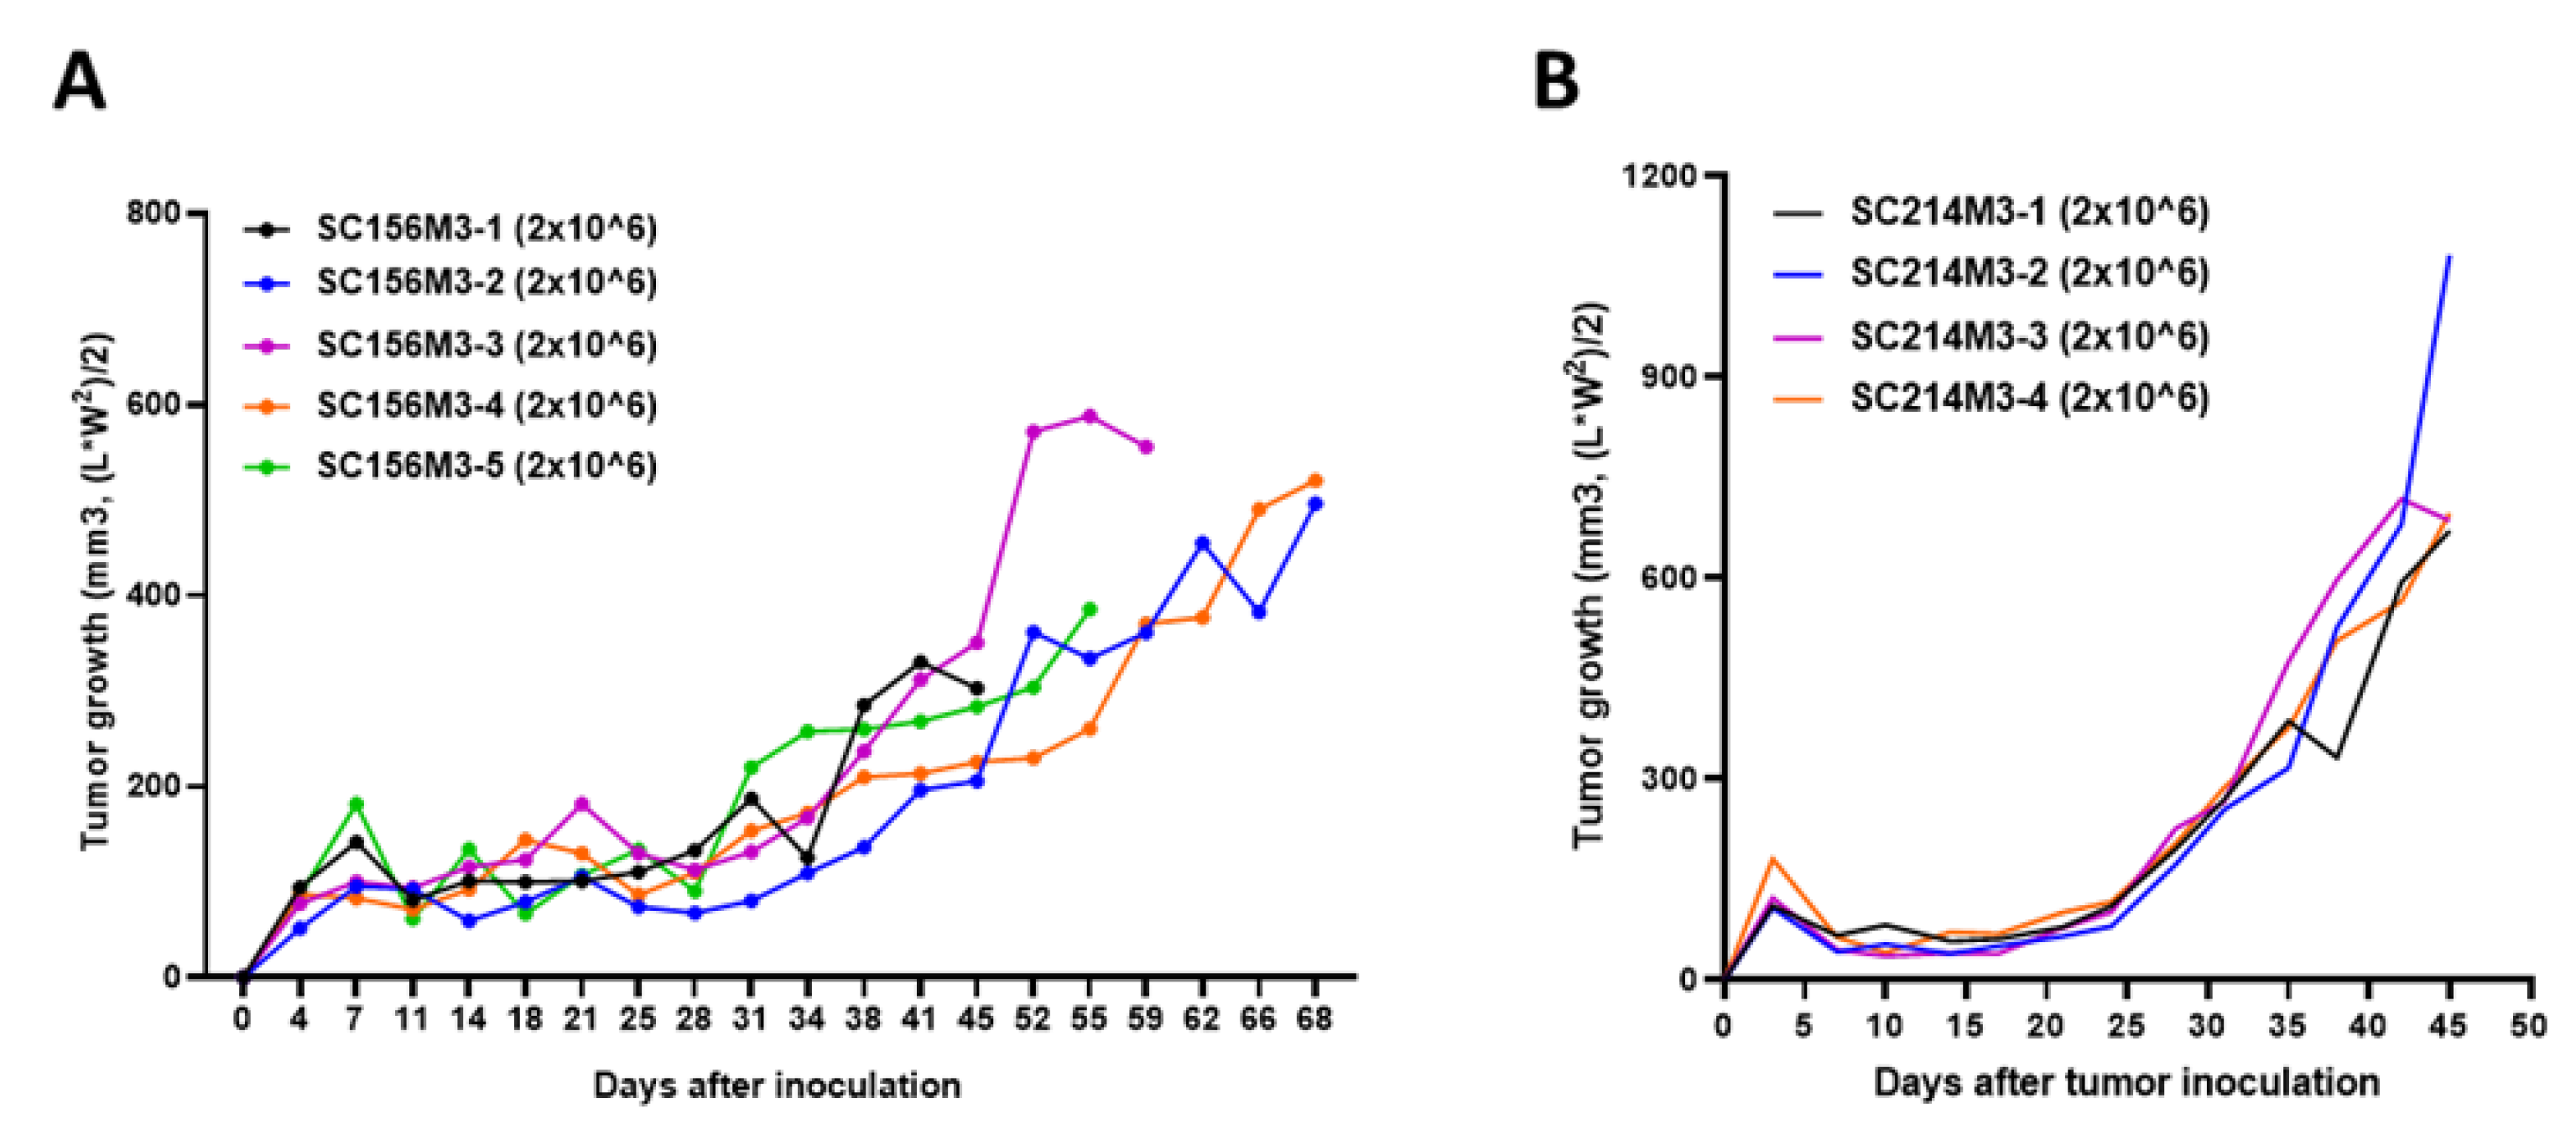

Table 1.
Information of primary antibodies in Immunohistochemical stain.
| Antibody | Company | Cat. No. | Dilution | Retrieval time | Retrieval buffer | Antibody incubation |
|---|---|---|---|---|---|---|
| P53 | Dako | 71709 | 1:2000 | 36min | EDTA | 32min |
| PAX8 | Roche | 760-4618 | RTU | 36min | EDTA | 32min |
| Ki 67 | Dako | M7240 | 1:200 | 36min | EDTA | 32min |
| Vimentin | Zymed | 18-0052 | 1:2000 | 36min | EDTA | 32min |
| Mouse-CD31 | Cell signaling | 77699T | 1:1000 | 30min | EDTA | 60min |
Table 2.
PDX establishment with cryopreserved HGSC ovarian cancer samples.
| Patient ID | Age/Sex | Sample type | Cryopreserved Days in LN2 | Amount for inoculation |
Xenograft success rate |
Xenograft periods (days) | Histology results |
|---|---|---|---|---|---|---|---|
| SC18 | 56/F | Cell | 557 | 3x10^6 | 0/1 | N/A | N/A |
| SC39 | 56/F | Cell | 485 | 4x10^6 | 1/1 | 231 | HGSC |
| SC101 | 56/F | Cell | 269 | 2x10^6 | 0/1 | N/A | N/A |
| SC124 | 43/F | Cell | 119 | 4 ~ 10x10^6 | 0/2 | N/A | N/A |
| SC155 | 59/F | Tissue | 30 | 150mg | 1/4 | 193 | HGSC |
| Cell | 5x10^6 | 2/4 | 164 | HGSC | |||
| SC156 | 68/F | Tissue | 19 | 150mg | 3/3 | 56~164 | HGSC |
| Cell | 5x10^6 | 4/4 | 44~94 | HGSC | |||
| SC214 | 33/F | Cell | 24/386 | 4x10^6/5x10^6 | 3/4 | 125~310 | HGSC, N/A |
| SC227 | 74/F | Cell | 15 | 2.5x10^6 | 2/2 | 72~183 | HGSC |
| SC236 | 56/F | Cell | 126 | 7.6x10^6 | 2/2 | 270~284 | HGSC |
| SC238 | 62/F | Cell | 79 | 3.7x10^6 | 1/1 | 68 | HGSC |
| SC243 | 46/F | Cell | 37 | 5.8x10^6 | 0/2 | N/A | N/A |
| SC245 | 40/F | Cell | 115 | 1x10^7 | 1/1 | 278 | HGSC |
| SC246 | 53/F | Cell | 148 | 7.5x10^6 | 0/2 | N/A | N/A |
| SC248 | 59/F | Cell | 100 | 2.4x10^6 | 2/2 | 310 | HGSC |
Table 3.
Establishment of M2 PDCX and M2 PDTX.
| Sample type |
Mouse ID | Days of tumor growth | Left flank | Right flank | Average SGR per 100days |
||||
|---|---|---|---|---|---|---|---|---|---|
| Injected amount | Extracted amount | SGR per 100 days |
Injected amount | Extracted amount | SGR per 100 days |
||||
| Tissue | SC156T4M2-1 | 87 | 160mg | 800mg | 1.85 | 160mg | 720mg | 1.73 | 1.85 |
| SC156T4M2-2 | 87 | 160mg | 880mg | 1.96 | 160mg | 810mg | 1.86 | ||
| Cell | SC156C1M2-1 | 80 | 7x10^5 | 670mg (4.88x10^7) | 5.31 | 7x10^5 | 1140mg (6.97x10^7) |
5.75 | 5.04 |
| SC156C1M2-2 | 80 | 3.5x10^5 | 1190mg (6.4x10^7) | 6.51 | 7x10^5 | 970mg (6.23x10^7) |
5.61 | ||
| SC156C2M2-1 | 104 | 4x10^5 | 660mg (2.96x10^7) |
4.14 | 8.3x10^5 | 530mg (2.57x10^7) |
3.3 | ||
| SC156C3M2-1 | 87 | 7.6x10^5 | 700mg (5.29x10^7) |
4.88 | 7.6x10^5 | 1200mg (8.74x10^7) |
5.45 | ||
| SC156C3M2-2 | 87 | 3.8x10^5 | 540mg (3.11x10^7) |
5.06 | 7.6x10^5 | 580mg (3.48x10^7) |
4.40 | ||
| SC156C3M2-3 | 80 | 4x10^5 | 400mg (0.93x10^7) |
3.93 | 4x10^5 | 1050mg (3.2x10^7) |
5.48 | ||
| SC156C3M2-4 | 86 | 4x10^5 | 680mg (3.31x10^7) |
5.13 | 4x10^5 | 1000mg (4.79x10^7) |
5.56 | ||
Table 4.
Comparison of immunohistochemical markers between original human tumors and M1 and M2 generation of PDCX and PDTX models.
Table 4.
Comparison of immunohistochemical markers between original human tumors and M1 and M2 generation of PDCX and PDTX models.
| P53 | PAX8 | Ki67 | Vimentin | Anti-mouse CD31 | ||
|---|---|---|---|---|---|---|
| SC155 | Primary tumor | Null, (-) | 100% (+) | 70~90% | (+) in stroma b.v. |
(-) |
| PDCX M1 | Null, (-) | 100% (+) | 80~90% | (+) in stroma, focally & b.v. | (+) in b.v. | |
| PDCX M2 | Null, (-) | 100% (+) | 80~90% | (+) in b.v. | (+) in b.v. | |
| PDTX M1 | Null, (-) | 100% (+) | 80~90% | (+) in b.v. | (+) in b.v. | |
| SC156 | Primary tumor | 100 % (+) | 100% (+) | 15 ~ 25% | (+) in stroma, focally & b.v. |
(-) |
| PDCX M1 | 100 % (+) | 100% (+) | 80~90% | (+) in stroma, focally, & b.v. | (+) in b.v. | |
| PDCX M2 | 100 % (+) | 100% (+) | 80~90% | (+) in b.v. | (+) in b.v. | |
| PDTX M1 | 100 % (+) | 100% (+) | 80~90% | (+) in stroma, focally & b.v. |
(+) in b.v. | |
| PDTX M2 | 100 % (+) | 100% (+) | 80~90% | (+) in b.v. | (+) in b.v. |
b.v.: blood vessels.
Table 5.
Genetic identity between primary tumor and corresponding M1 and M2 tumors.
| IID1 | IID2 | RT | EZ | Z0 | Z1 | Z2 | PI_HAT | PHE | DST | PPC | RATIO |
|---|---|---|---|---|---|---|---|---|---|---|---|
| SC155 | PDX-155-M1 | UN | NA | 0.0000 | 0.0439 | 0.9561 | 0.9780 | -1 | 0.988684 | 1.0000 | NA |
| SC155 | PDX-155-M2 | UN | NA | 0.0000 | 0.0445 | 0.9555 | 0.9777 | -1 | 0.988527 | 1.0000 | NA |
| PDX-155-M1 | PDX-155-M2 | UN | NA | 0.0000 | 0.0090 | 0.9910 | 0.9955 | -1 | 0.997669 | 1.0000 | NA |
| SC156 | PDX-156-M1 | UN | NA | 0.0000 | 0.1837 | 0.8163 | 0.9081 | -1 | 0.952665 | 1.0000 | NA |
| SC156 | PDX-156-M2 | UN | NA | 0.0000 | 0.1825 | 0.8175 | 0.9088 | -1 | 0.952985 | 1.0000 | NA |
| PDX-156-M1 | PDX-156-M2 | UN | NA | 0.0000 | 0.0109 | 0.9891 | 0.9946 | -1 | 0.997202 | 1.0000 | NA |
Disclaimer/Publisher’s Note: The statements, opinions and data contained in all publications are solely those of the individual author(s) and contributor(s) and not of MDPI and/or the editor(s). MDPI and/or the editor(s) disclaim responsibility for any injury to people or property resulting from any ideas, methods, instructions or products referred to in the content. |
© 2024 by the authors. Licensee MDPI, Basel, Switzerland. This article is an open access article distributed under the terms and conditions of the Creative Commons Attribution (CC BY) license (http://creativecommons.org/licenses/by/4.0/).
Copyright: This open access article is published under a Creative Commons CC BY 4.0 license, which permit the free download, distribution, and reuse, provided that the author and preprint are cited in any reuse.


