1. Introduction
The carotid body (CB), the main peripheral arterial chemoreceptor in humans, is a tiny anatomical structure with remarkable complexity that integrates information from various sources, processes it, and triggers adequate physiological responses. The CB registers the levels of gases in blood and responds to their changes by regulating breathing. It is strategically positioned in the vicinity of the common carotid artery bifurcation for monitoring blood chemicals before they reach the brain, an organ that is particularly sensitive to oxygen deprivation [
1]. Its basic morphofunctional unit, known as glomerulus or glomoid, is a ball of highly vascular tissue, composed of two juxtaposed cell types: neuron-like type I or glomus cells and glial-like type II, also called sustentacular cells [
2,
3]. Glomus cells are considered the chemosensory cells of the organ that contain secretory granules packed with putative neurotransmitters and selectively express tyrosine hydroxylase (TH) [
4]. Classically, the sustentacular cells are supporting cells which play a role in metabolic support, but they have recently been assumed to be stem cells that behave as glomus cell precursors [
5,
6].
One of the most striking morphological traits of the CB is its rich vascularization. Previous stereological studies have demonstrated that nearly one-fourth of the total CB volume in the cat is occupied by blood vessels and our microangioCT data have further shown that it is also true for the rat CB [
3,
7]. Moreover, it has been revealed that the CB as a single entity is one of the most irrigated organs per unit weight of any tissue in the body and its vascularization is 5-6-fold higher than that of the brain [
4,
8]. Fine blood vessels pierce the glomoids, and a dense vascular bed of fenestrated capillaries forms around them. In contrast, a profuse capillary network travels in the walls of the connective tissue, which converges on the surface to create a fibrous organ capsule [
9,
10].
Another distinct structural feature of the CB is its dense innervation. It has been found that this highly vascular complex is dually innervated by sensory nerve fibers and autonomic nerve fibers of both sympathetic and parasympathetic origins. The afferent innervation of glomus cells is mainly provided by petrosal ganglion neurons of the glossopharyngeal nerve through the carotid sinus nerve, and it also comes from the superior (jugular) ganglion and inferior (nodose) ganglion cells of the vagus nerve [
11]. The sympathetic nerve supply is relayed by postganglionic neurons from the closely located superior cervical ganglion via the ganglioglomerular nerve [
12] while the parasympathetic innervation is received from vasomotor fibers of ganglion cells located around or even inside the CB, so the latter are collectively referred to as the (internal) carotid ganglion [
11,
13]. Most sympathetic nerve fibers are thought to supply blood vessels [
14] and a few of them may also innervate glomus cells [
11,
15] while parasympathetic fibers are supposed to innervate smooth muscle cells of CB arteries or arterioles, and may also affect the glomus cell transmitter content and release [
16,
17]. It is believed that the presence of such an inhibitory efferent innervation, mediated by the release of nitric oxide, provides additional control of the afferent discharge [
18].
In the last decades CB dysfunction has been implicated in various physiological and pathophysiological conditions and its structure and neurochemical profile is altered in certain human sympathetic-related diseases, including essential hypertension. Hypertension is characterized by hypersensitivity to hypoxia and is associated with endothelial dysfunction, increased oxidative stress in blood vessels and activation of the inflammatory mediators [
19,
20]. Prior studies have indicated that the CB parenchyma is slightly enlarged in size in hypertensive rats than in age-matched normotensive controls, and that this enlargement is primarily due to glomus cell hypertrophy and hyperplasia, insignificant vasodilation and vascular remodeling but no neovascularization [
21,
22].
In addition to the significant cellular rearrangement that culminates in structural plasticity, hypertension also induces neurochemical changes in chemosensory cells of the CB. Indeed, we have previously shown that the nitrergic metabolism of its cell population is impaired under hypertensive conditions, which may activate CB chemosensitivity [
23]. Our research has further demonstrated that the components of the neurotrophin signaling system (growth factors and corresponding receptors) display an abnormally enhanced expression in the hypertensive CB which possibly modulates the chemosensory processing [
21]. In addition, experimental evidence has suggested that the morpho-chemical changes in the rat CB exposed to chronic hypoxia may be associated with an increased production of angiogenic factors such as vascular endothelial growth factor (VEGF) and endothelin (ET-1) in both endothelial and chemoreceptor cells [reviewed in 24,25].
Since chronic hypoxia is also known to be associated with elevated sympathetic activity and hypertension, and may cause angiogenesis in the CB, we tested the hypothesis that hypertension induces up-regulation of these two angiogenic peptides which can mediate microvascular remodeling and affect the chemosensory function of the hypertensive CB. We studied the immunohistochemical expression of VEGF and ET-1 and their corresponding receptors in the CB of adult spontaneously hypertensive rats (SHRs), a well-known experimental model of hypertension. Then, we compared their expression patterns to that of age-matched normotensive Wistar rats (NWR).
2. Results
2.1. Vascular Endothelial Growth Factor
We examined the most important members of VEGF family, VEGF variant A (VEGF-A) and B (VEGF-B) which promote angiogenesis and vascular permeability by activating two receptors, VEGFR-1 and VEGFR-2.
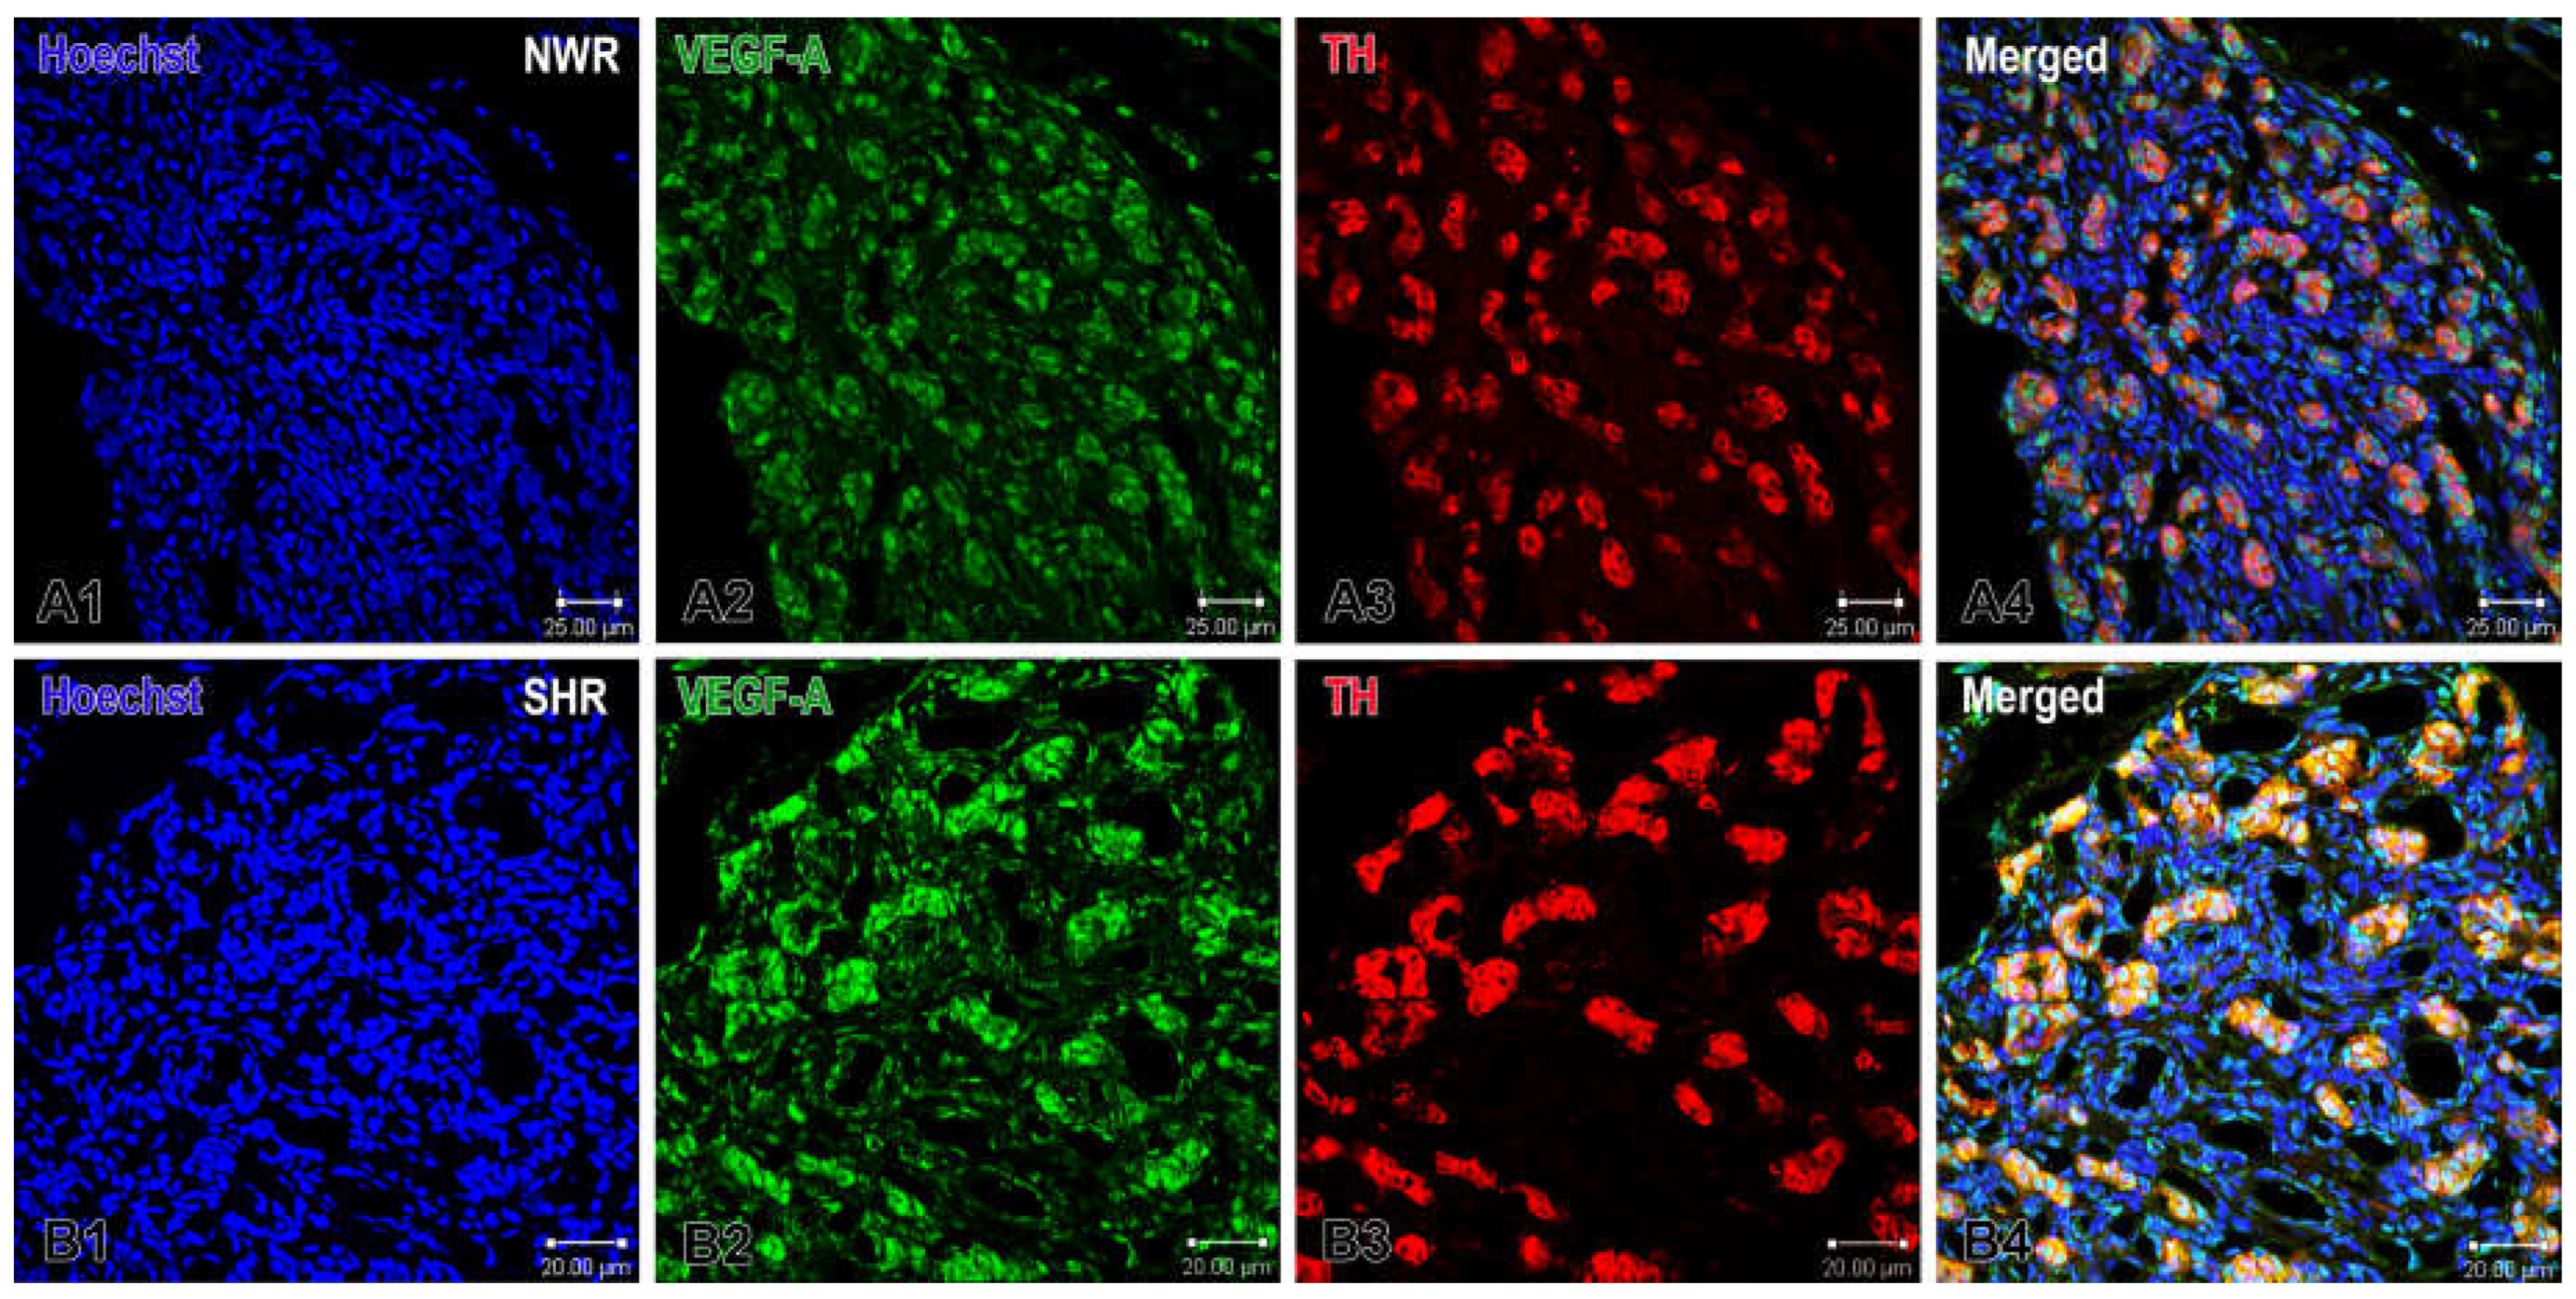
Immunofluorescence and confocal microscopy revealed a strongly increased protein expression of both VEGF-A and VEGF-B in glomus and endothelial cells in the enlarged CB glomeruli of SHRs compared with that in NWR. Specifically, we observed that a subset of glomus cells and some endothelial cells in the CB were immunoreactive to VEGF-A and immunostaining of the glomus cells was stronger in the hypertensive than that in normotensive rats (
Figure 1).
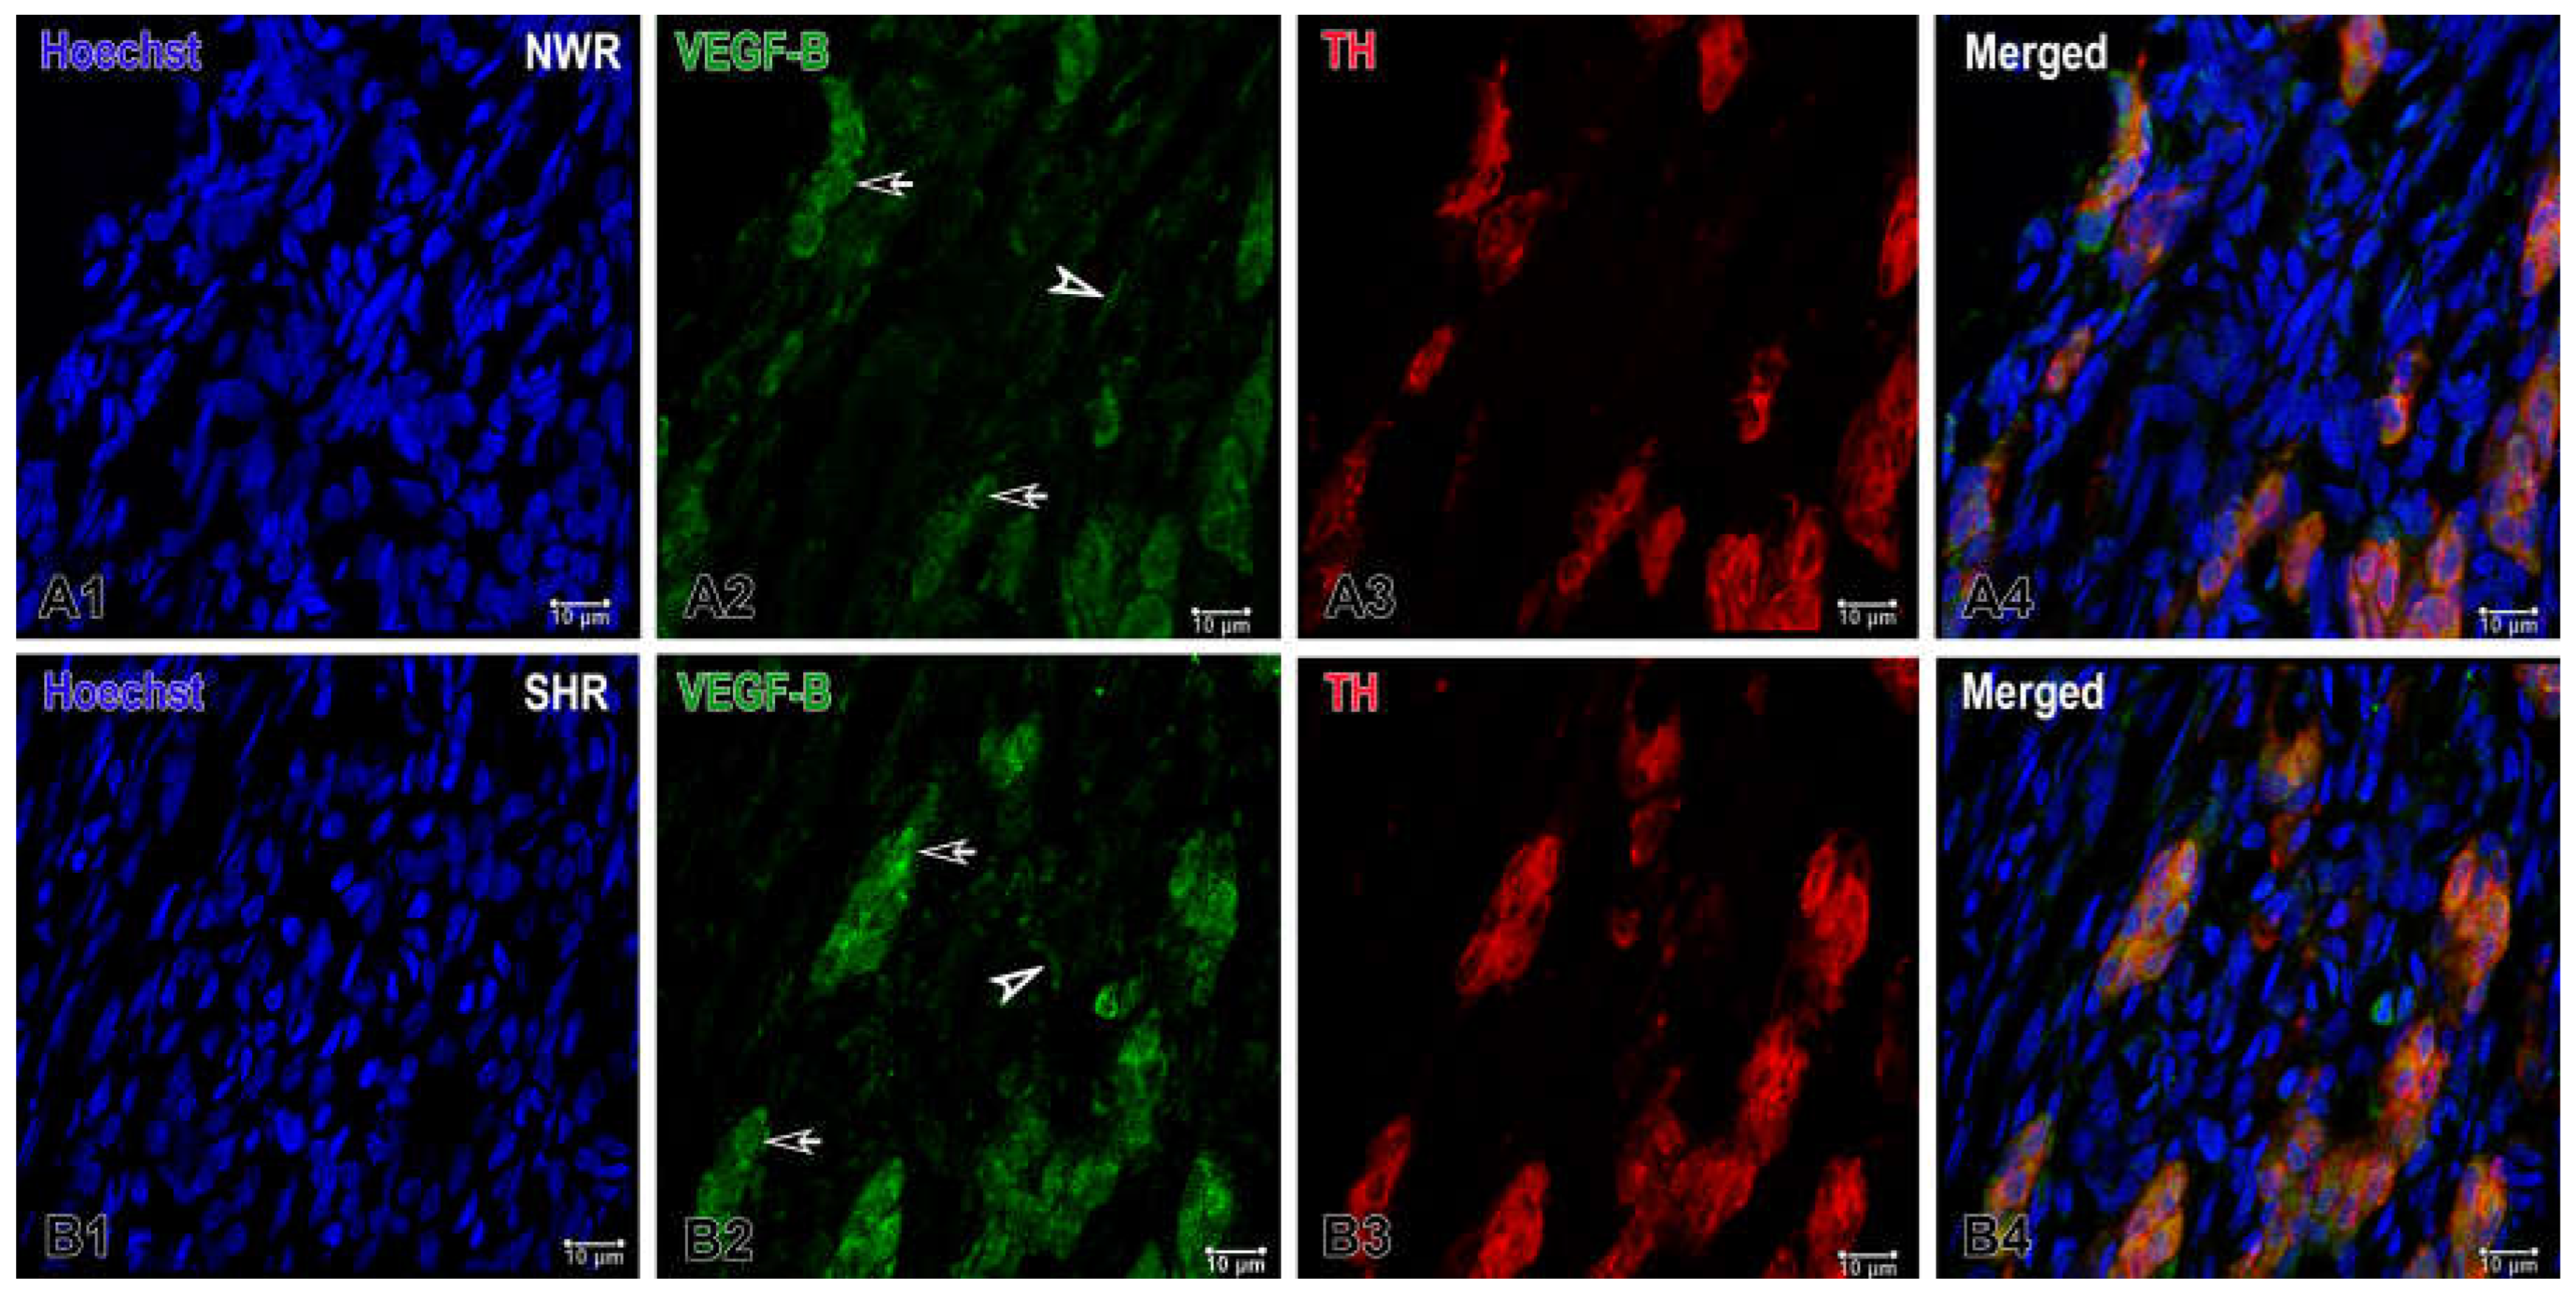
Similarly, VEGF-B was expressed in a few endothelial and several glomus cells in the CB of NWR and the visual examination of sections revealed that its expression was higher in glomus cells of the enlarged glomeruli in the hypertensive CB compared with that in the normotensive CB, as highlighted by double-immunostaining with TH (
Figure 2).
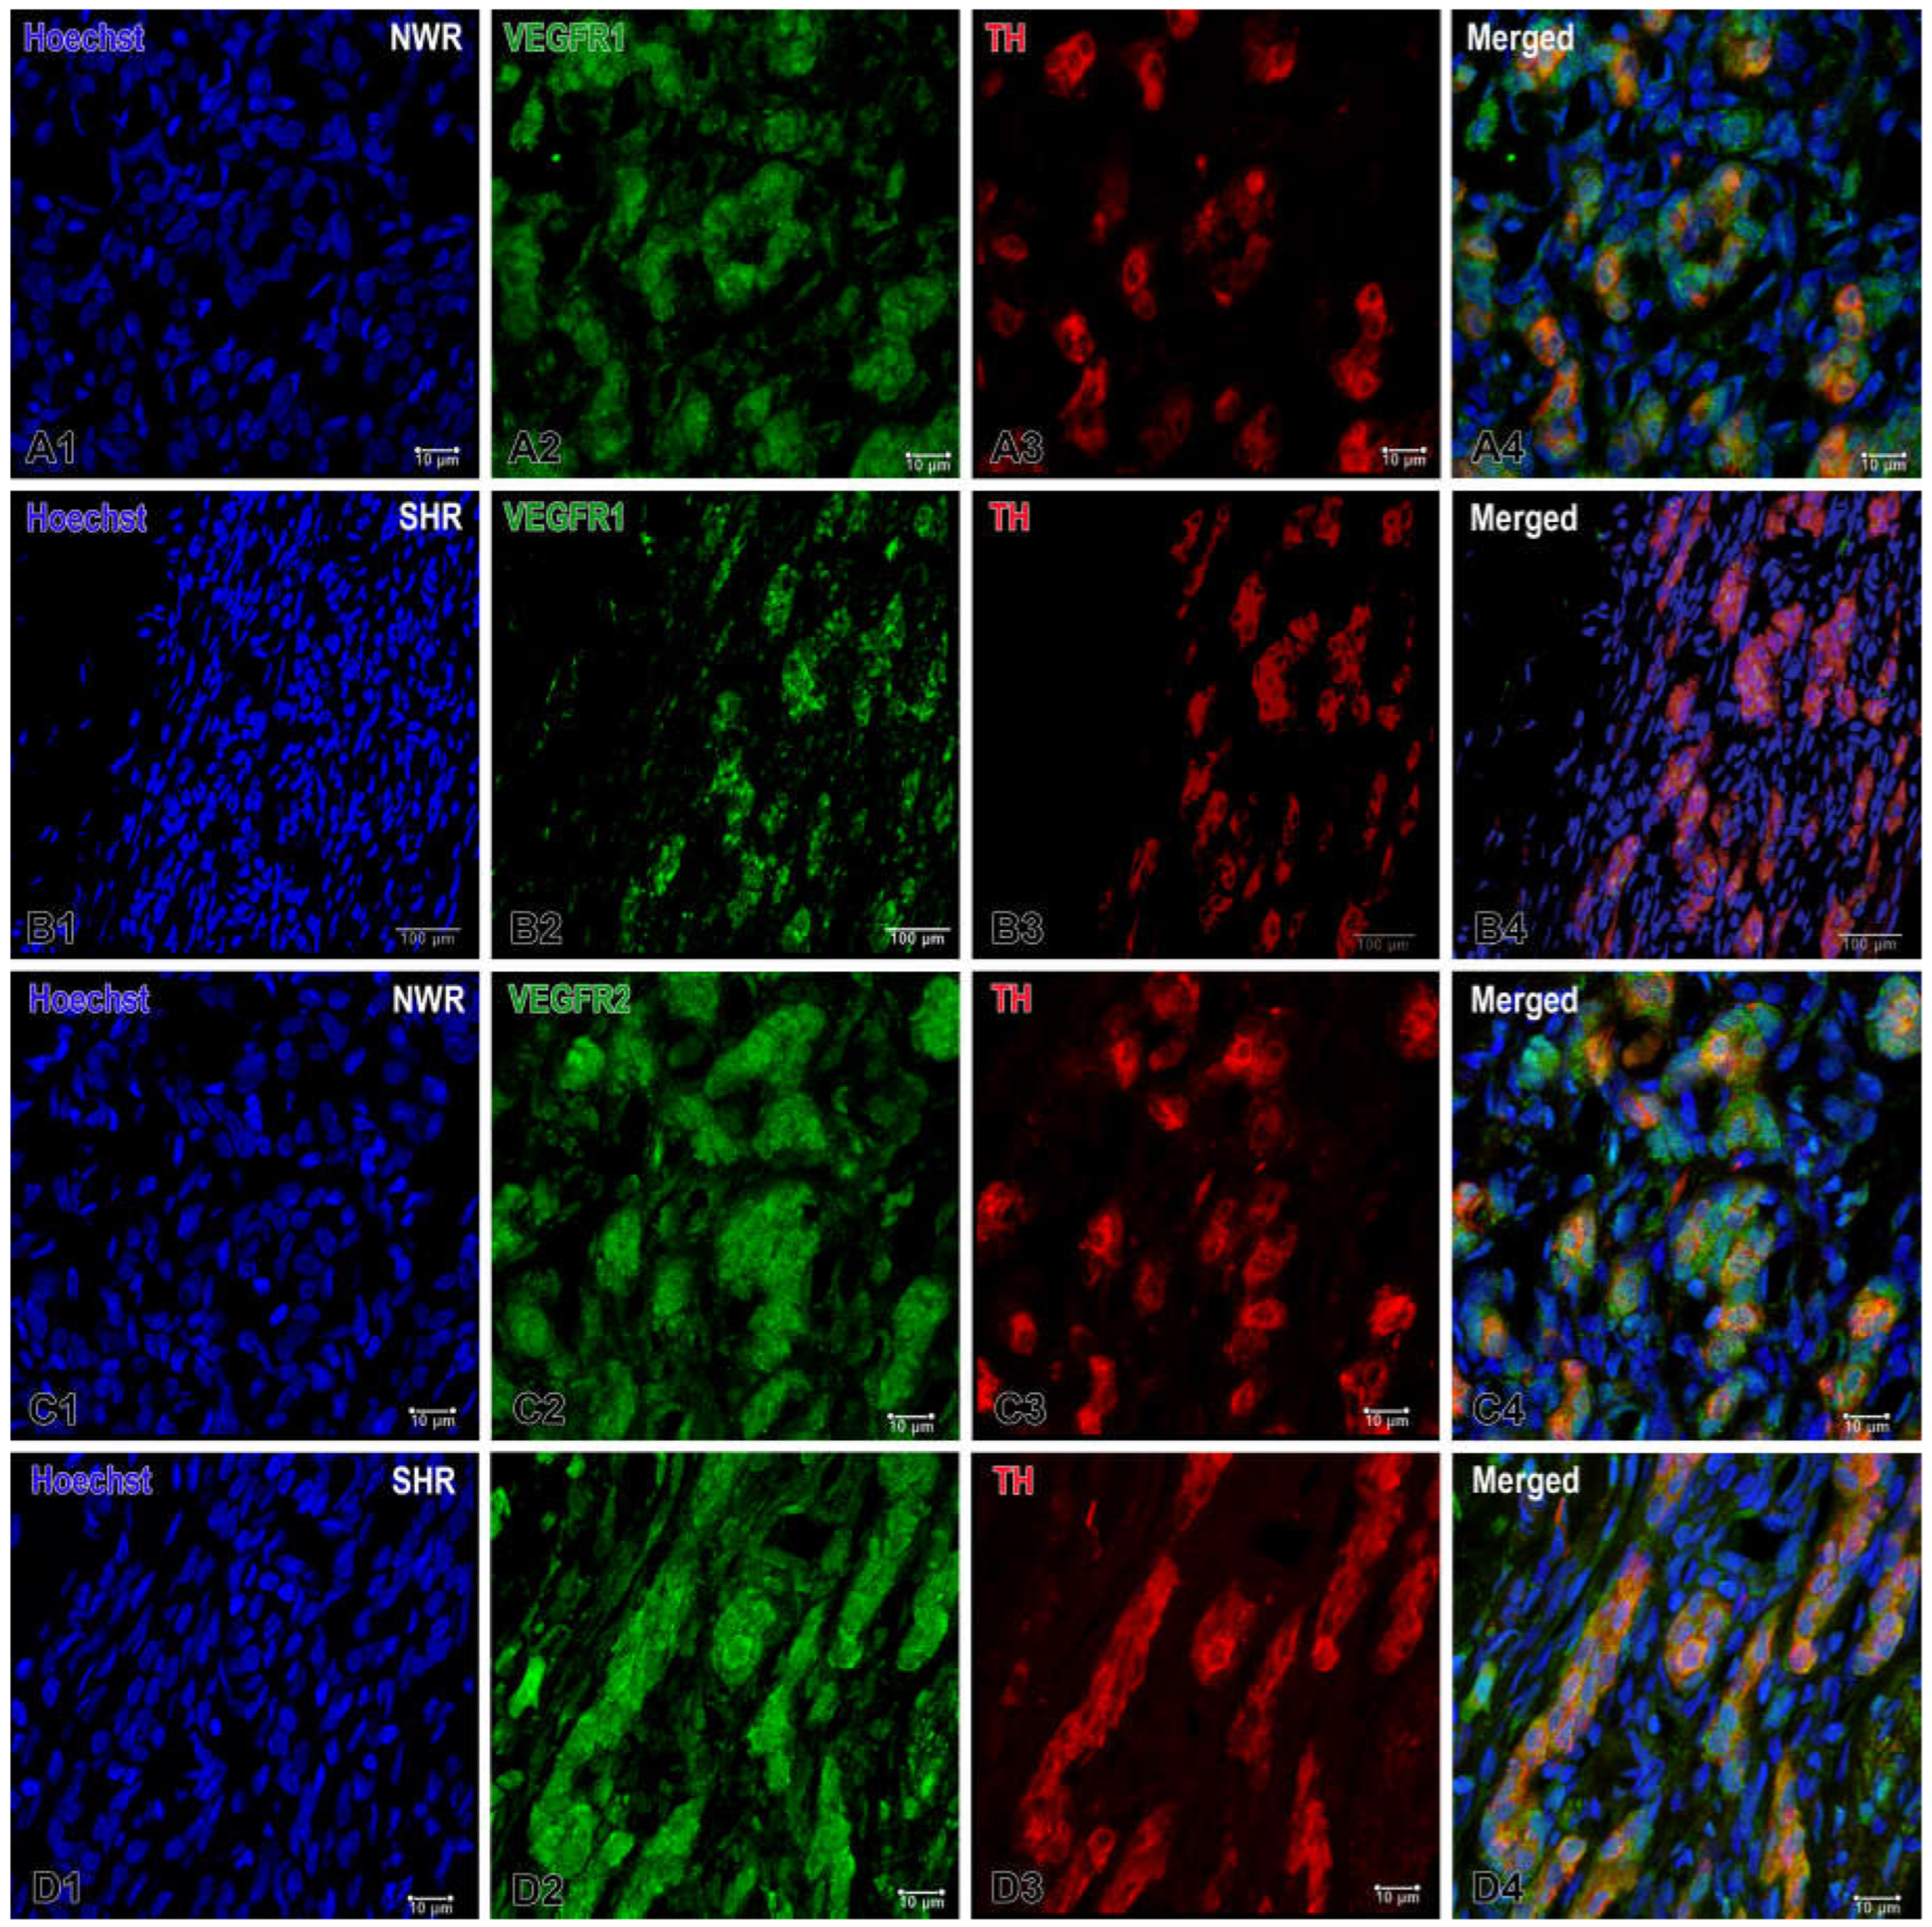
Accordingly, a markedly increased expression of its receptor VEGFR1 was observed in the endothelial cells and some glomus cells of NWRs, while a relatively weaker but still enhanced expression of VEGFR2 was detected in cell clusters of the hypertensive CB compared to that in normotensive rats (
Figure 3). In addition to the apparent expression of VEGFR1 on endothelial cells, a higher expression of this receptor was also seen in glomus cells of the normotensive CB. On the other hand, a slightly higher and statistically significant expression of VEGFR2 was found in glomus cells of SHRs compared to that in the normotensive group.
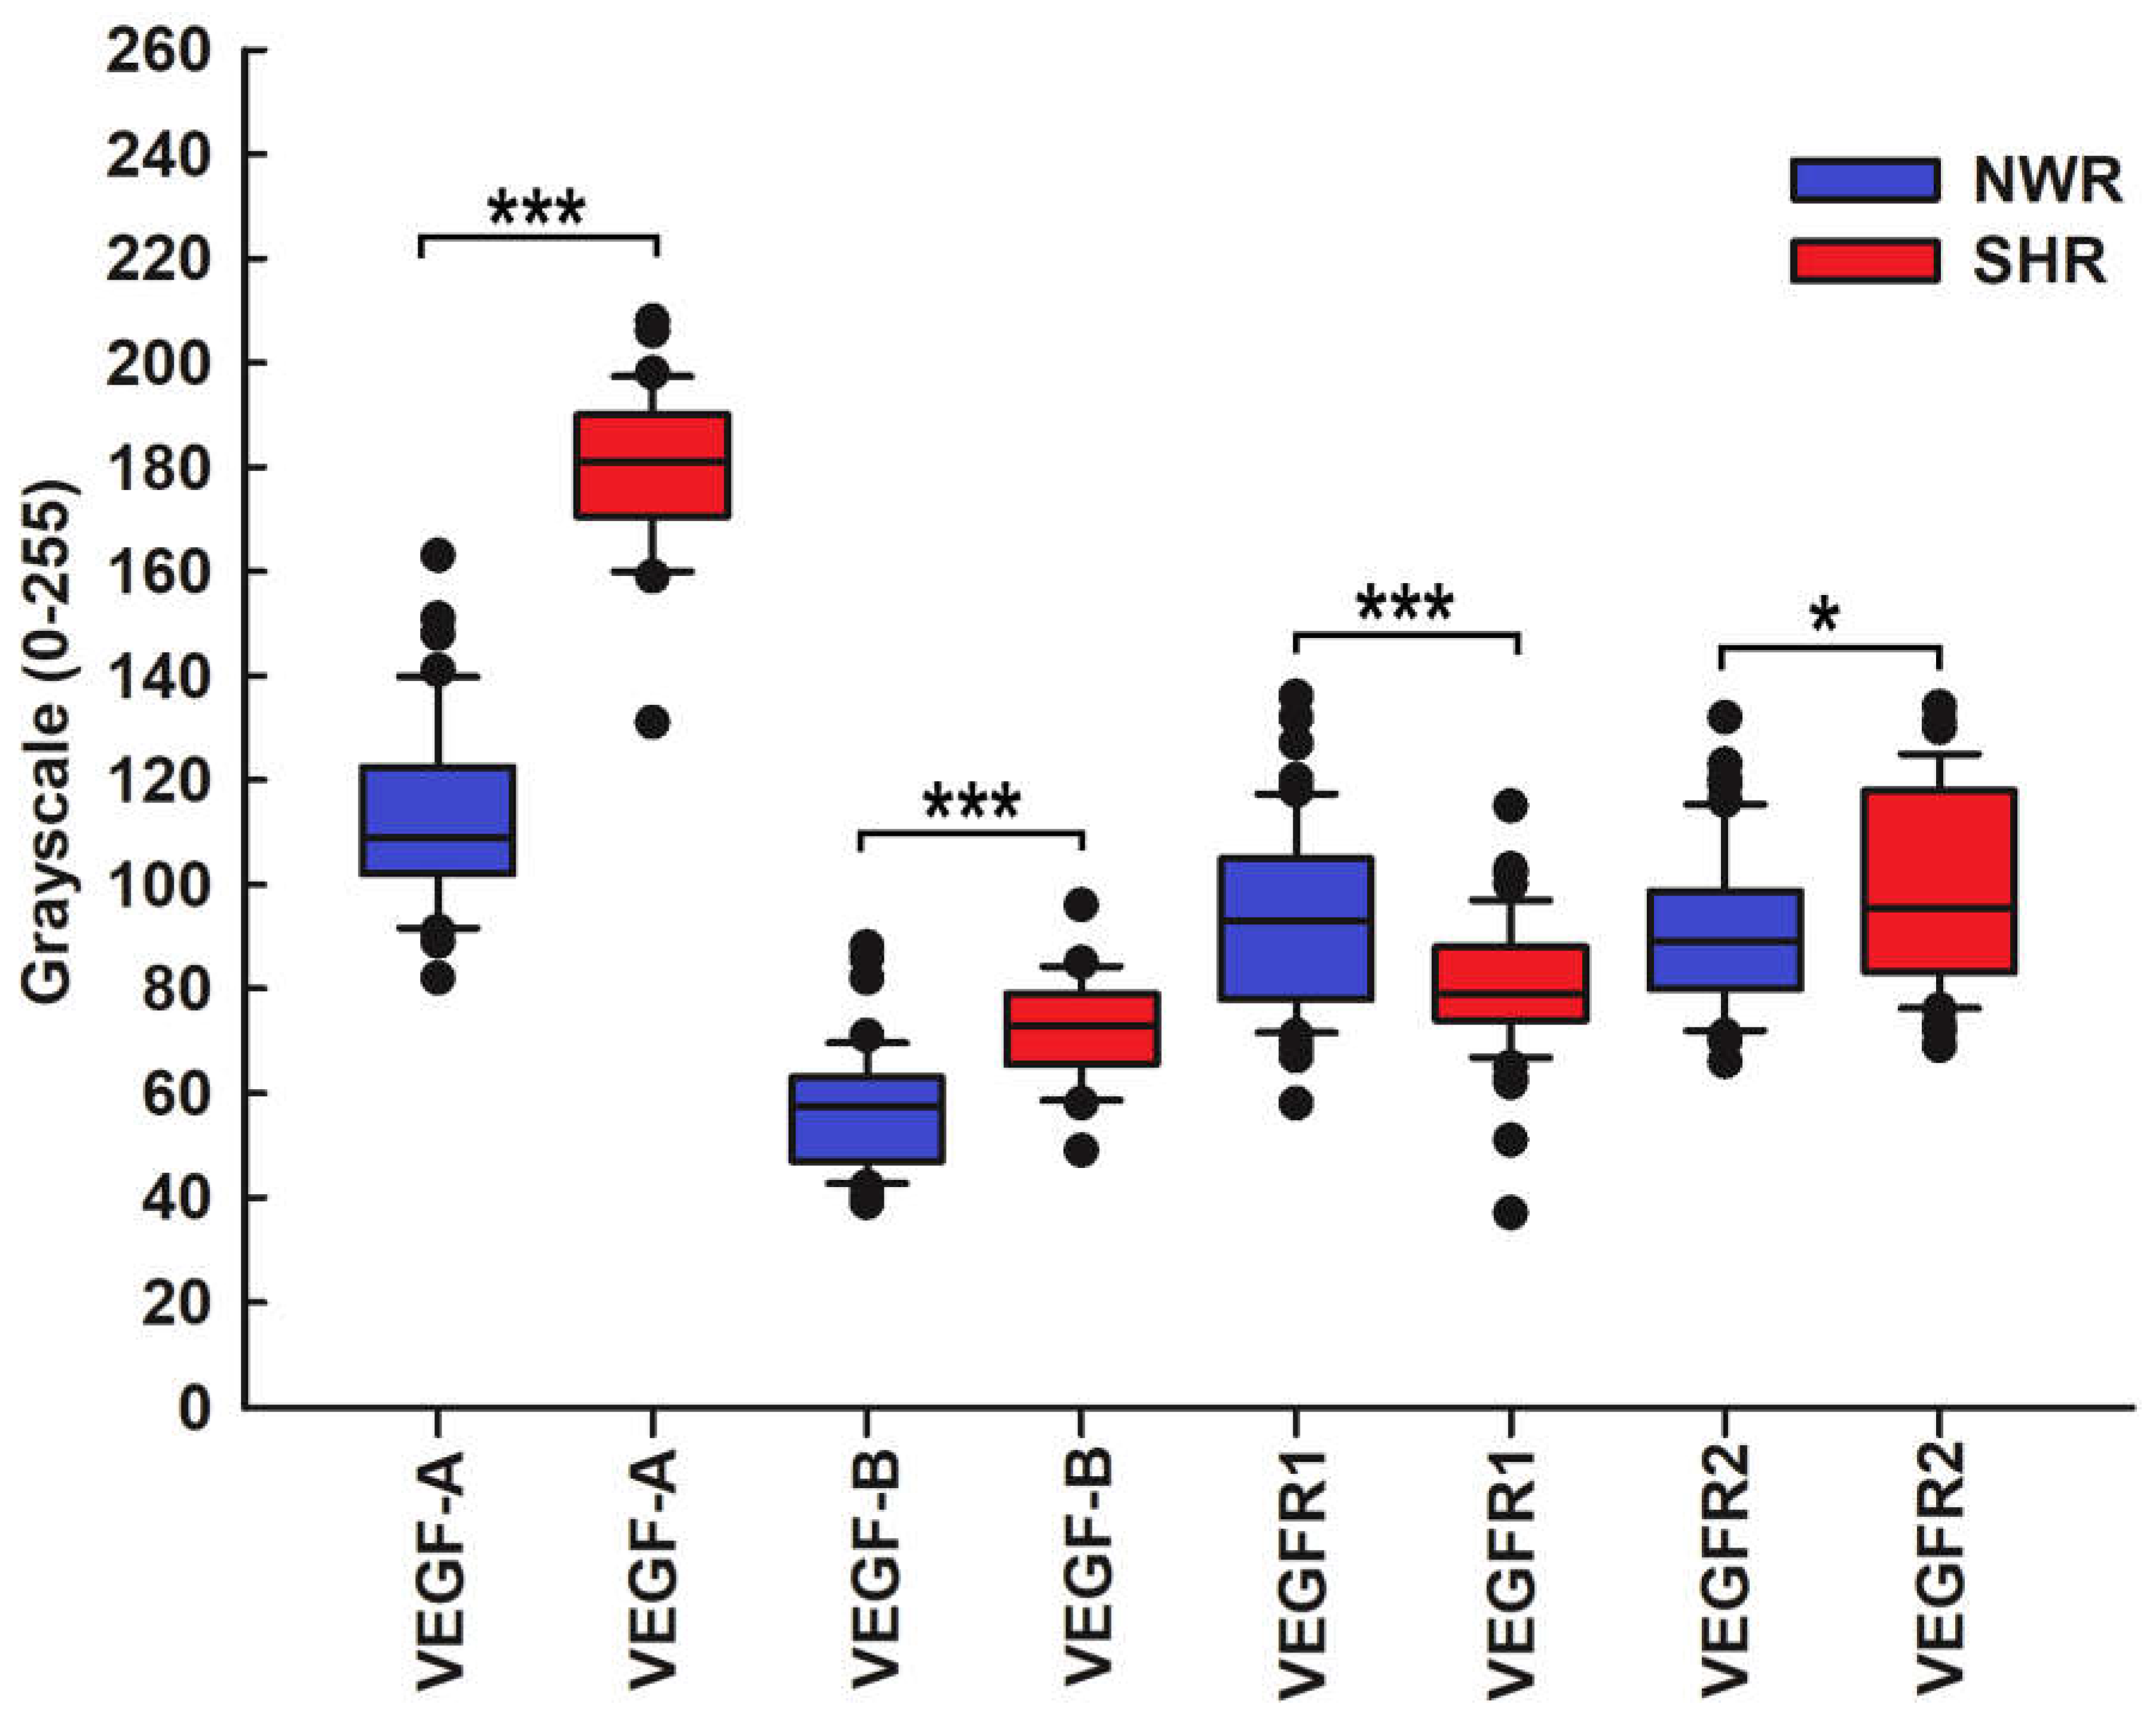
The statistical analysis revealed an altered and significantly increased expression of VEGF-A and VEGF-B and their receptor VEGFR2 in glomus cells of SHRs compared with NWR controls, as highlighted by the double immunofluorescence technique with the glomus cell marker TH. Conversely, VEGFR1 was much less expressed in glomus cells of hypertensive CB compared to age-matched controls (
Figure 4).
2.2. Endothelin
Endothelin-1 (ET-1) is another vasoactive peptide, and it is one of a family of three endothelins that exert their action through two G-protein-coupled transmembrane receptors, ETA and ETB.
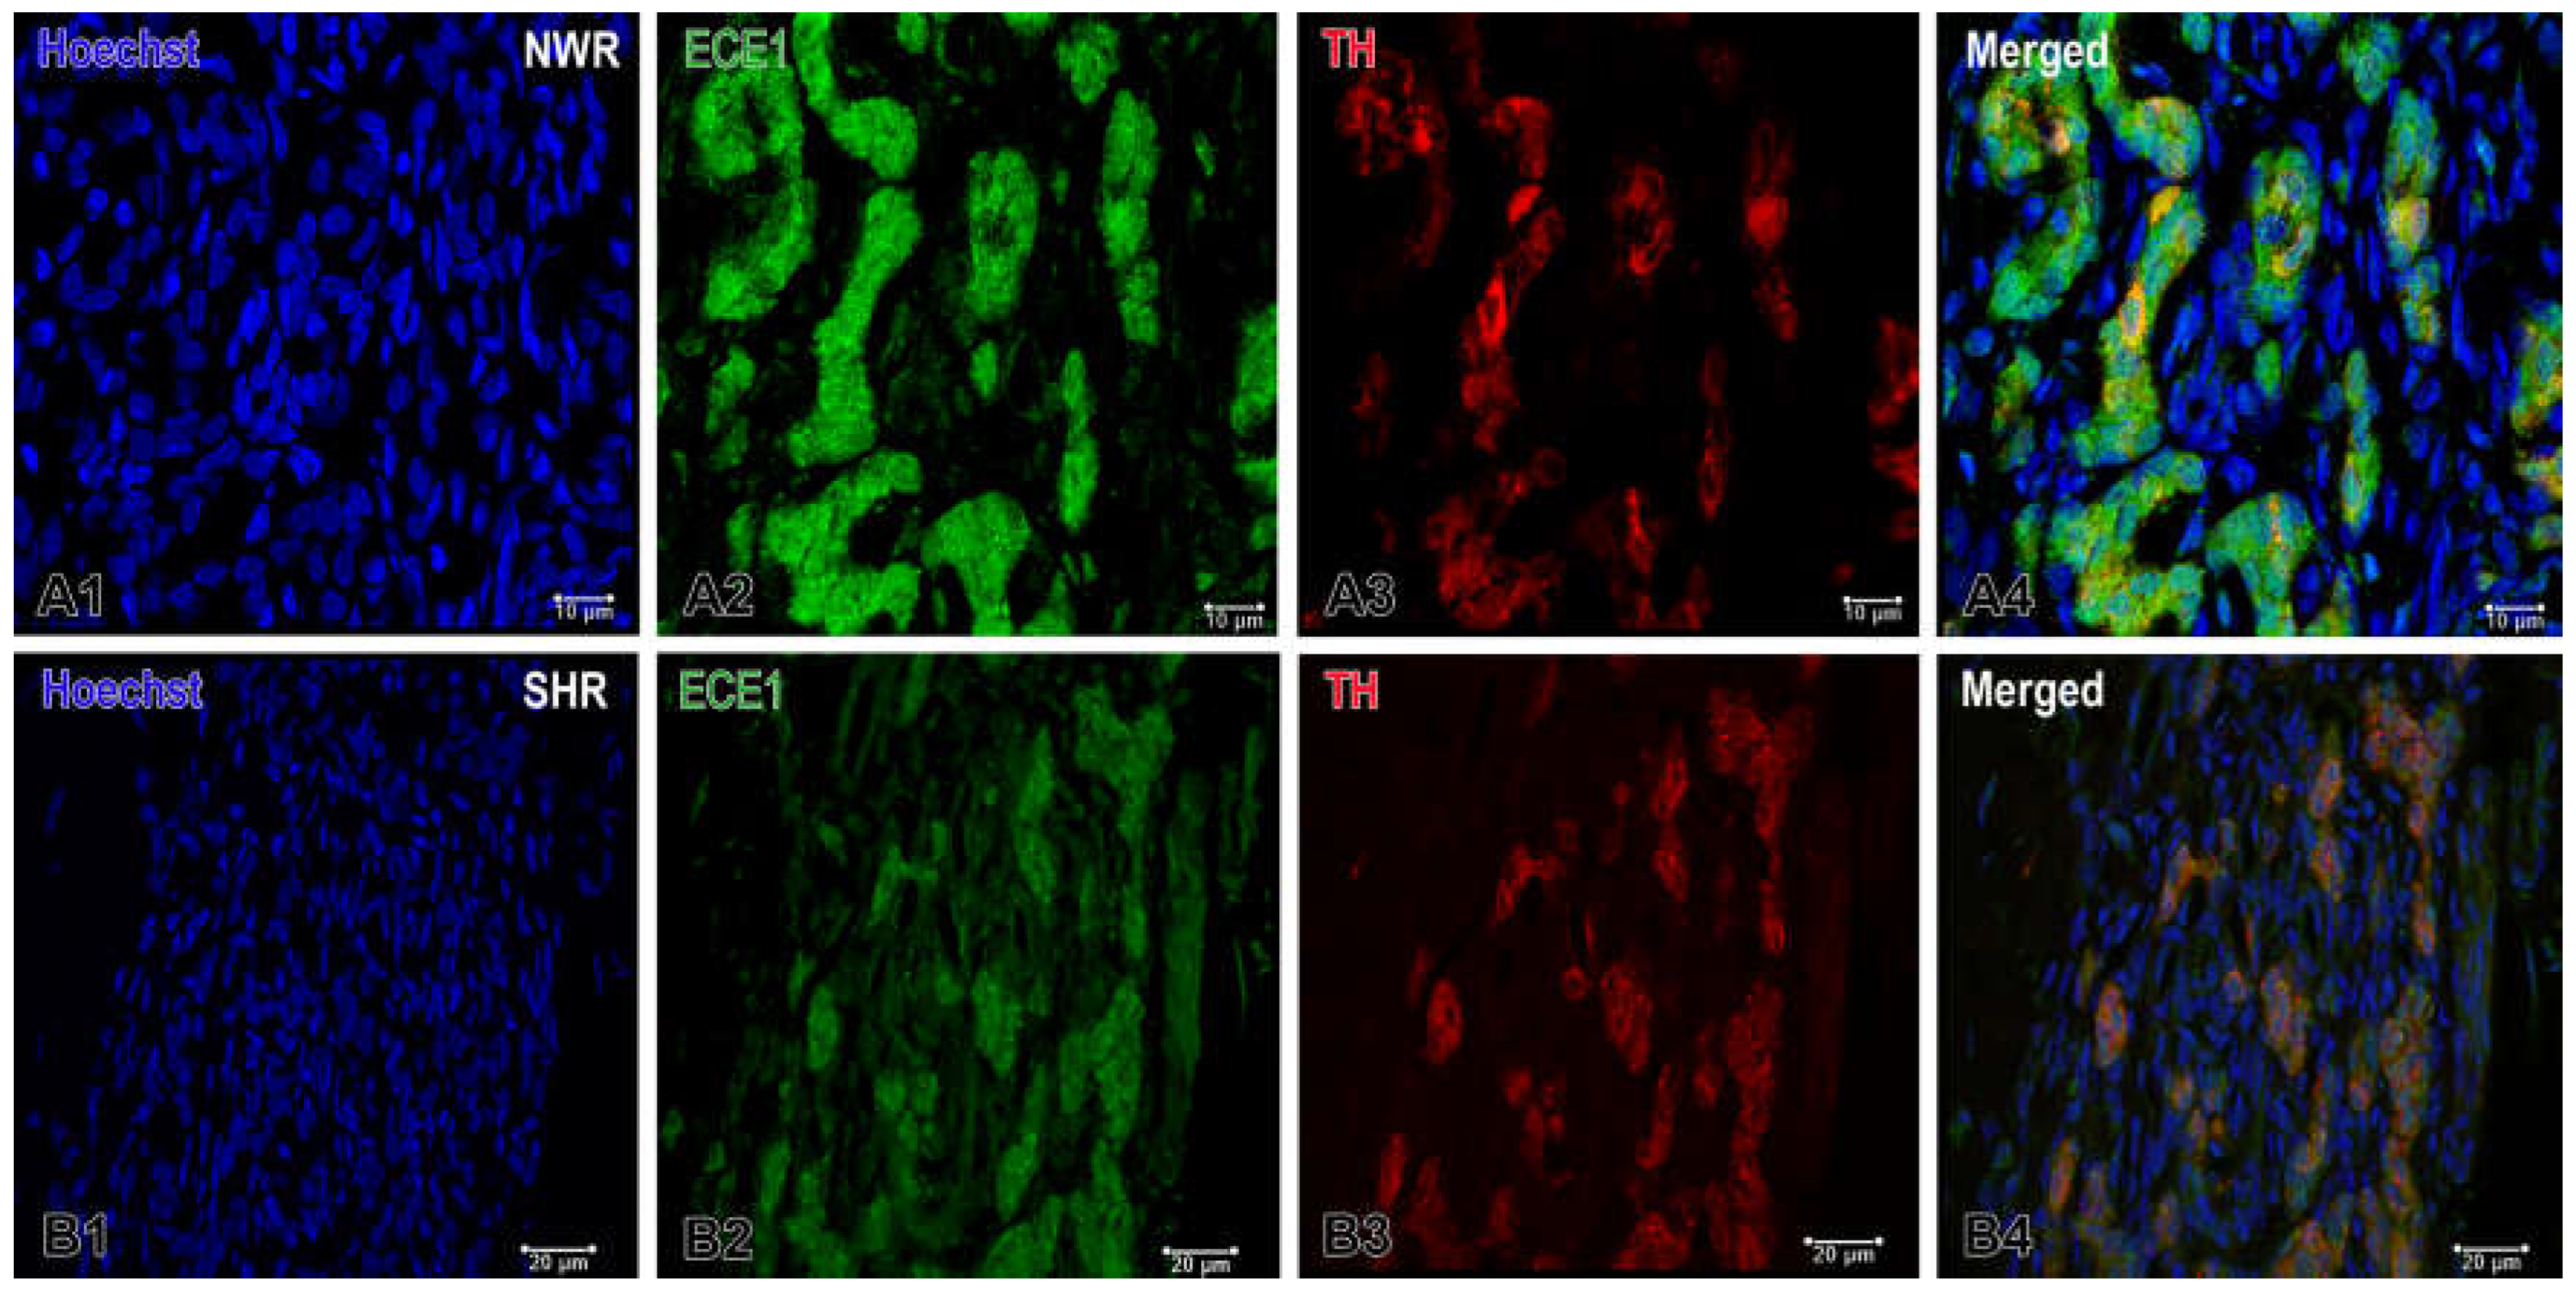
Immunofluorescence staining detected the activity of endothelin-converting enzyme 1 (ECE1), which was high in the endothelial cells and also in some glomus cells in the normotensive CB, while it was either undetectable or expressed at low levels in the latter under hypertensive conditions (
Figure 5).
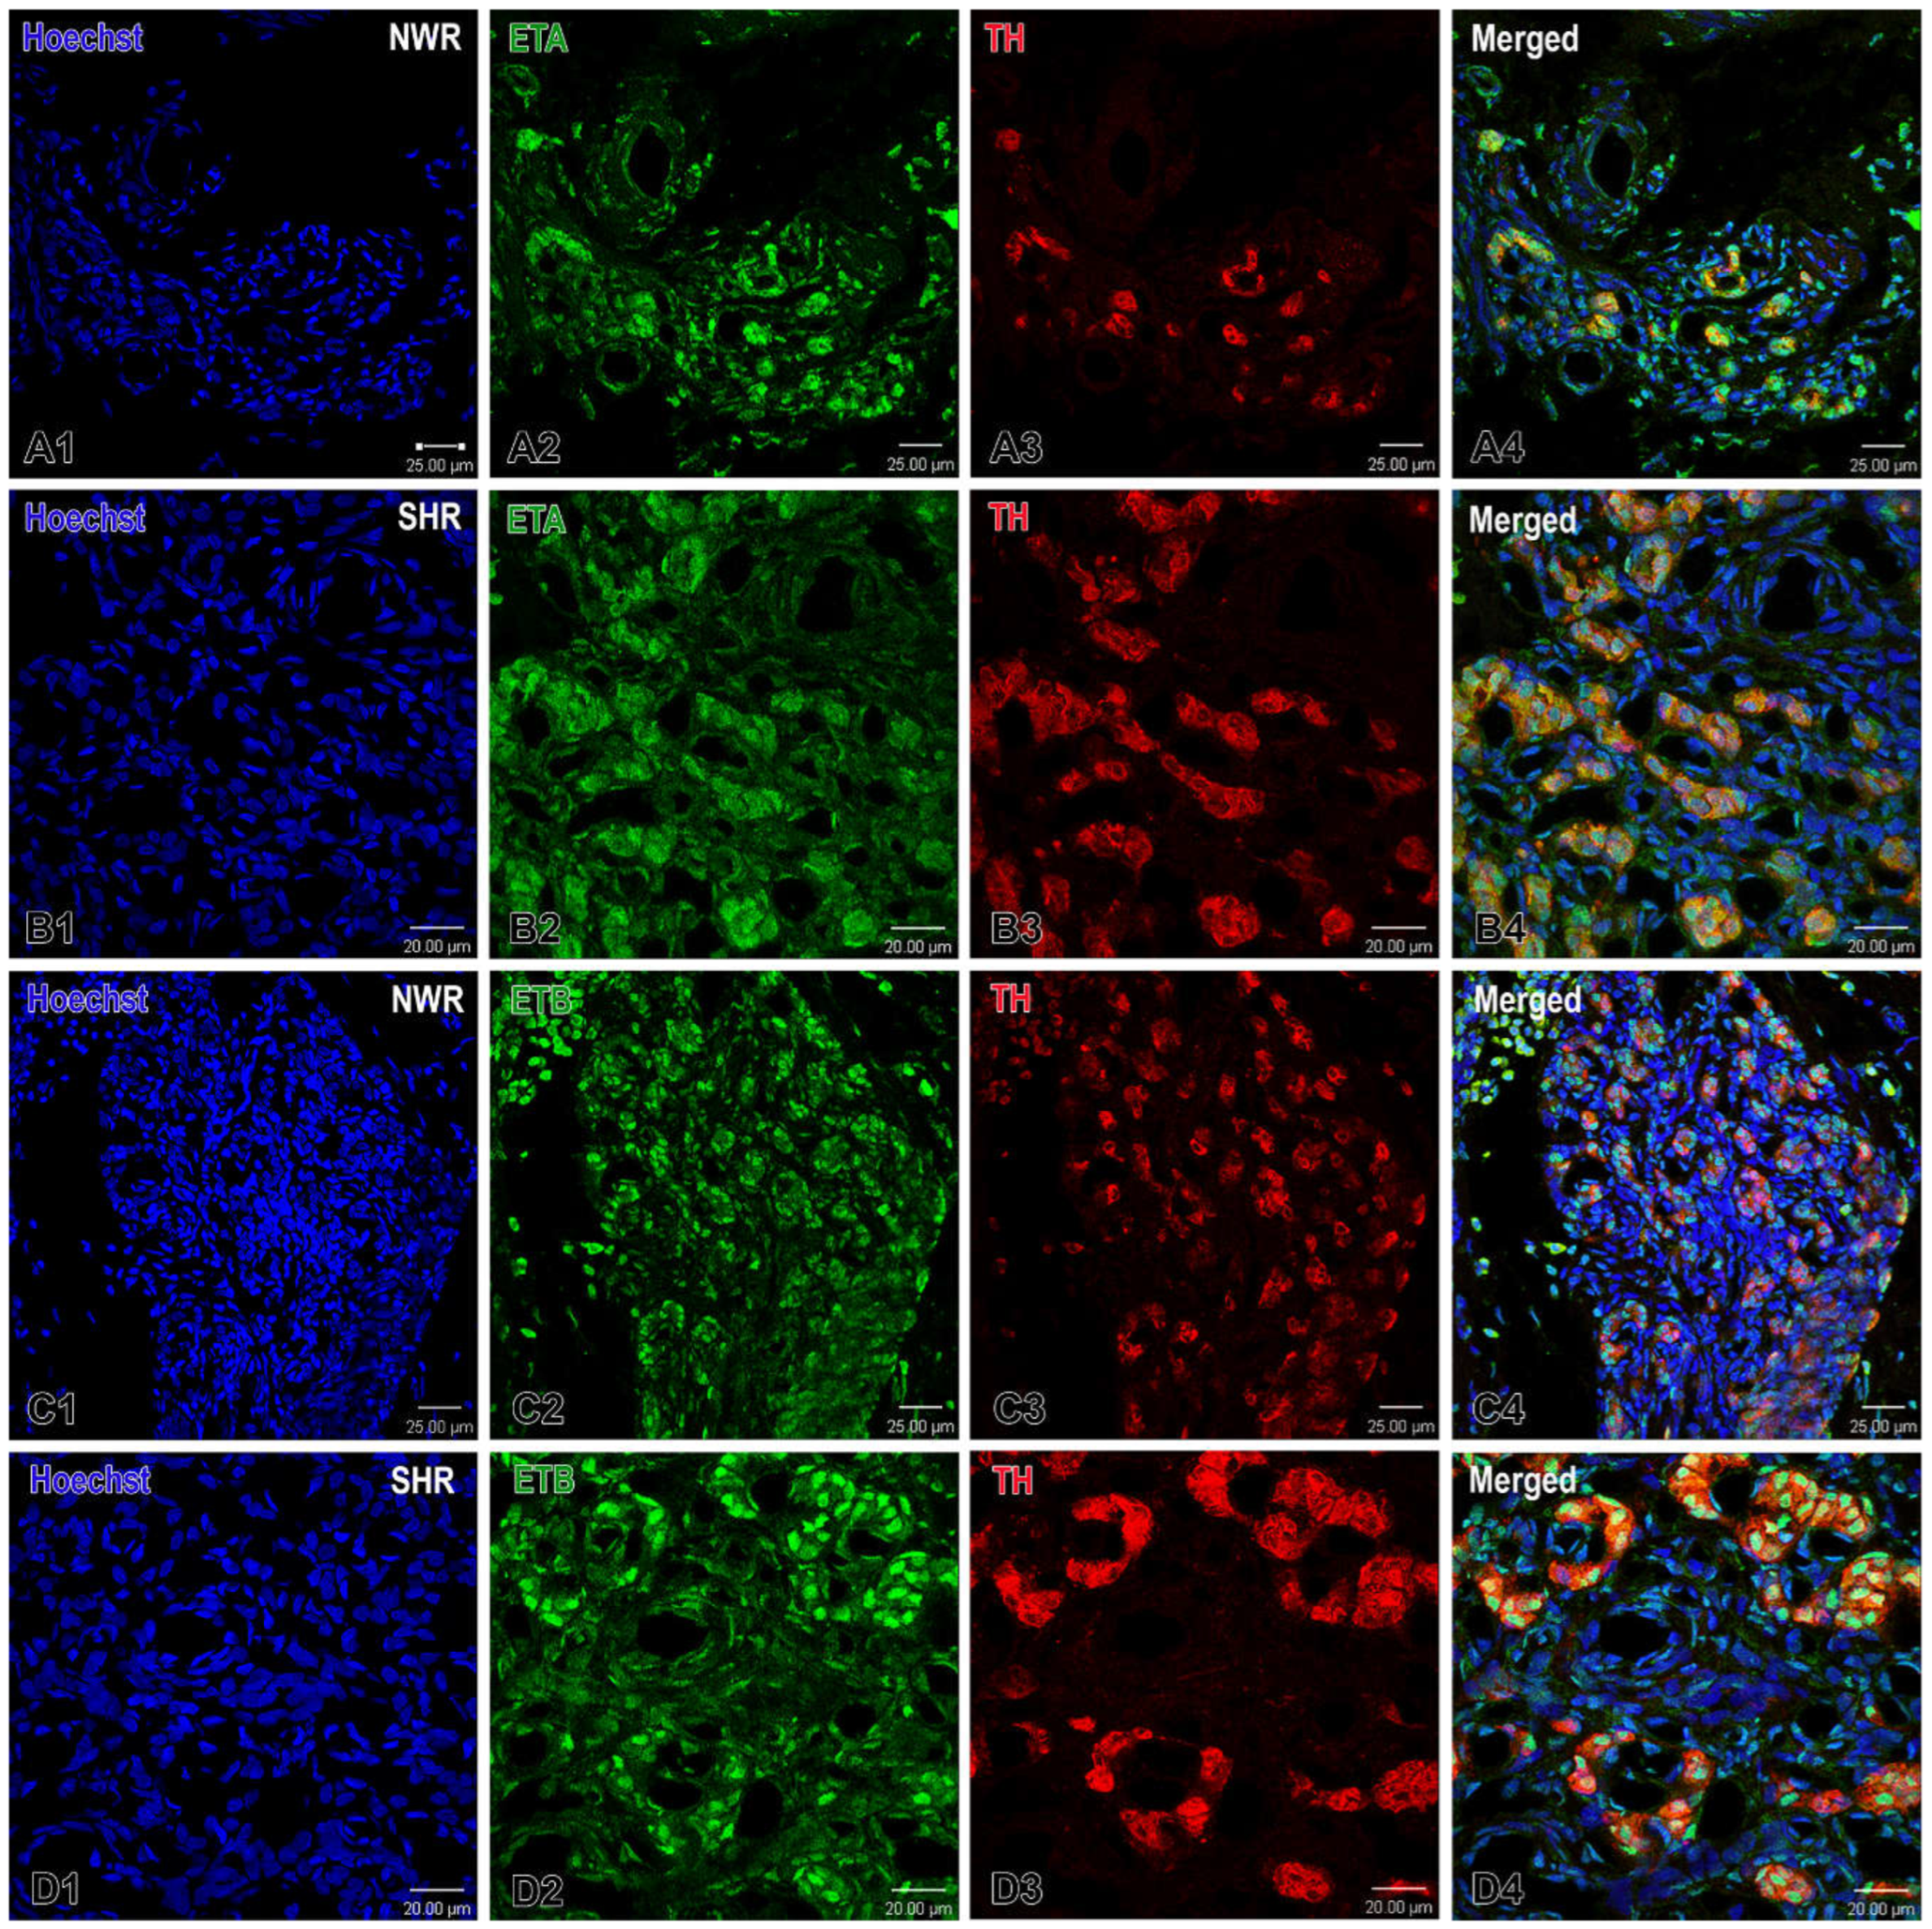
The double immunofluorescence procedure further identified that the immunostaining for its receptor ETA in glomus cells was not significantly different between the two breeds, while the immunoreactivity to the ETB receptor was somewhat higher, predominantly in endothelial cells of CB perilobular blood vessels in hypertensive rats (
Figure 6).
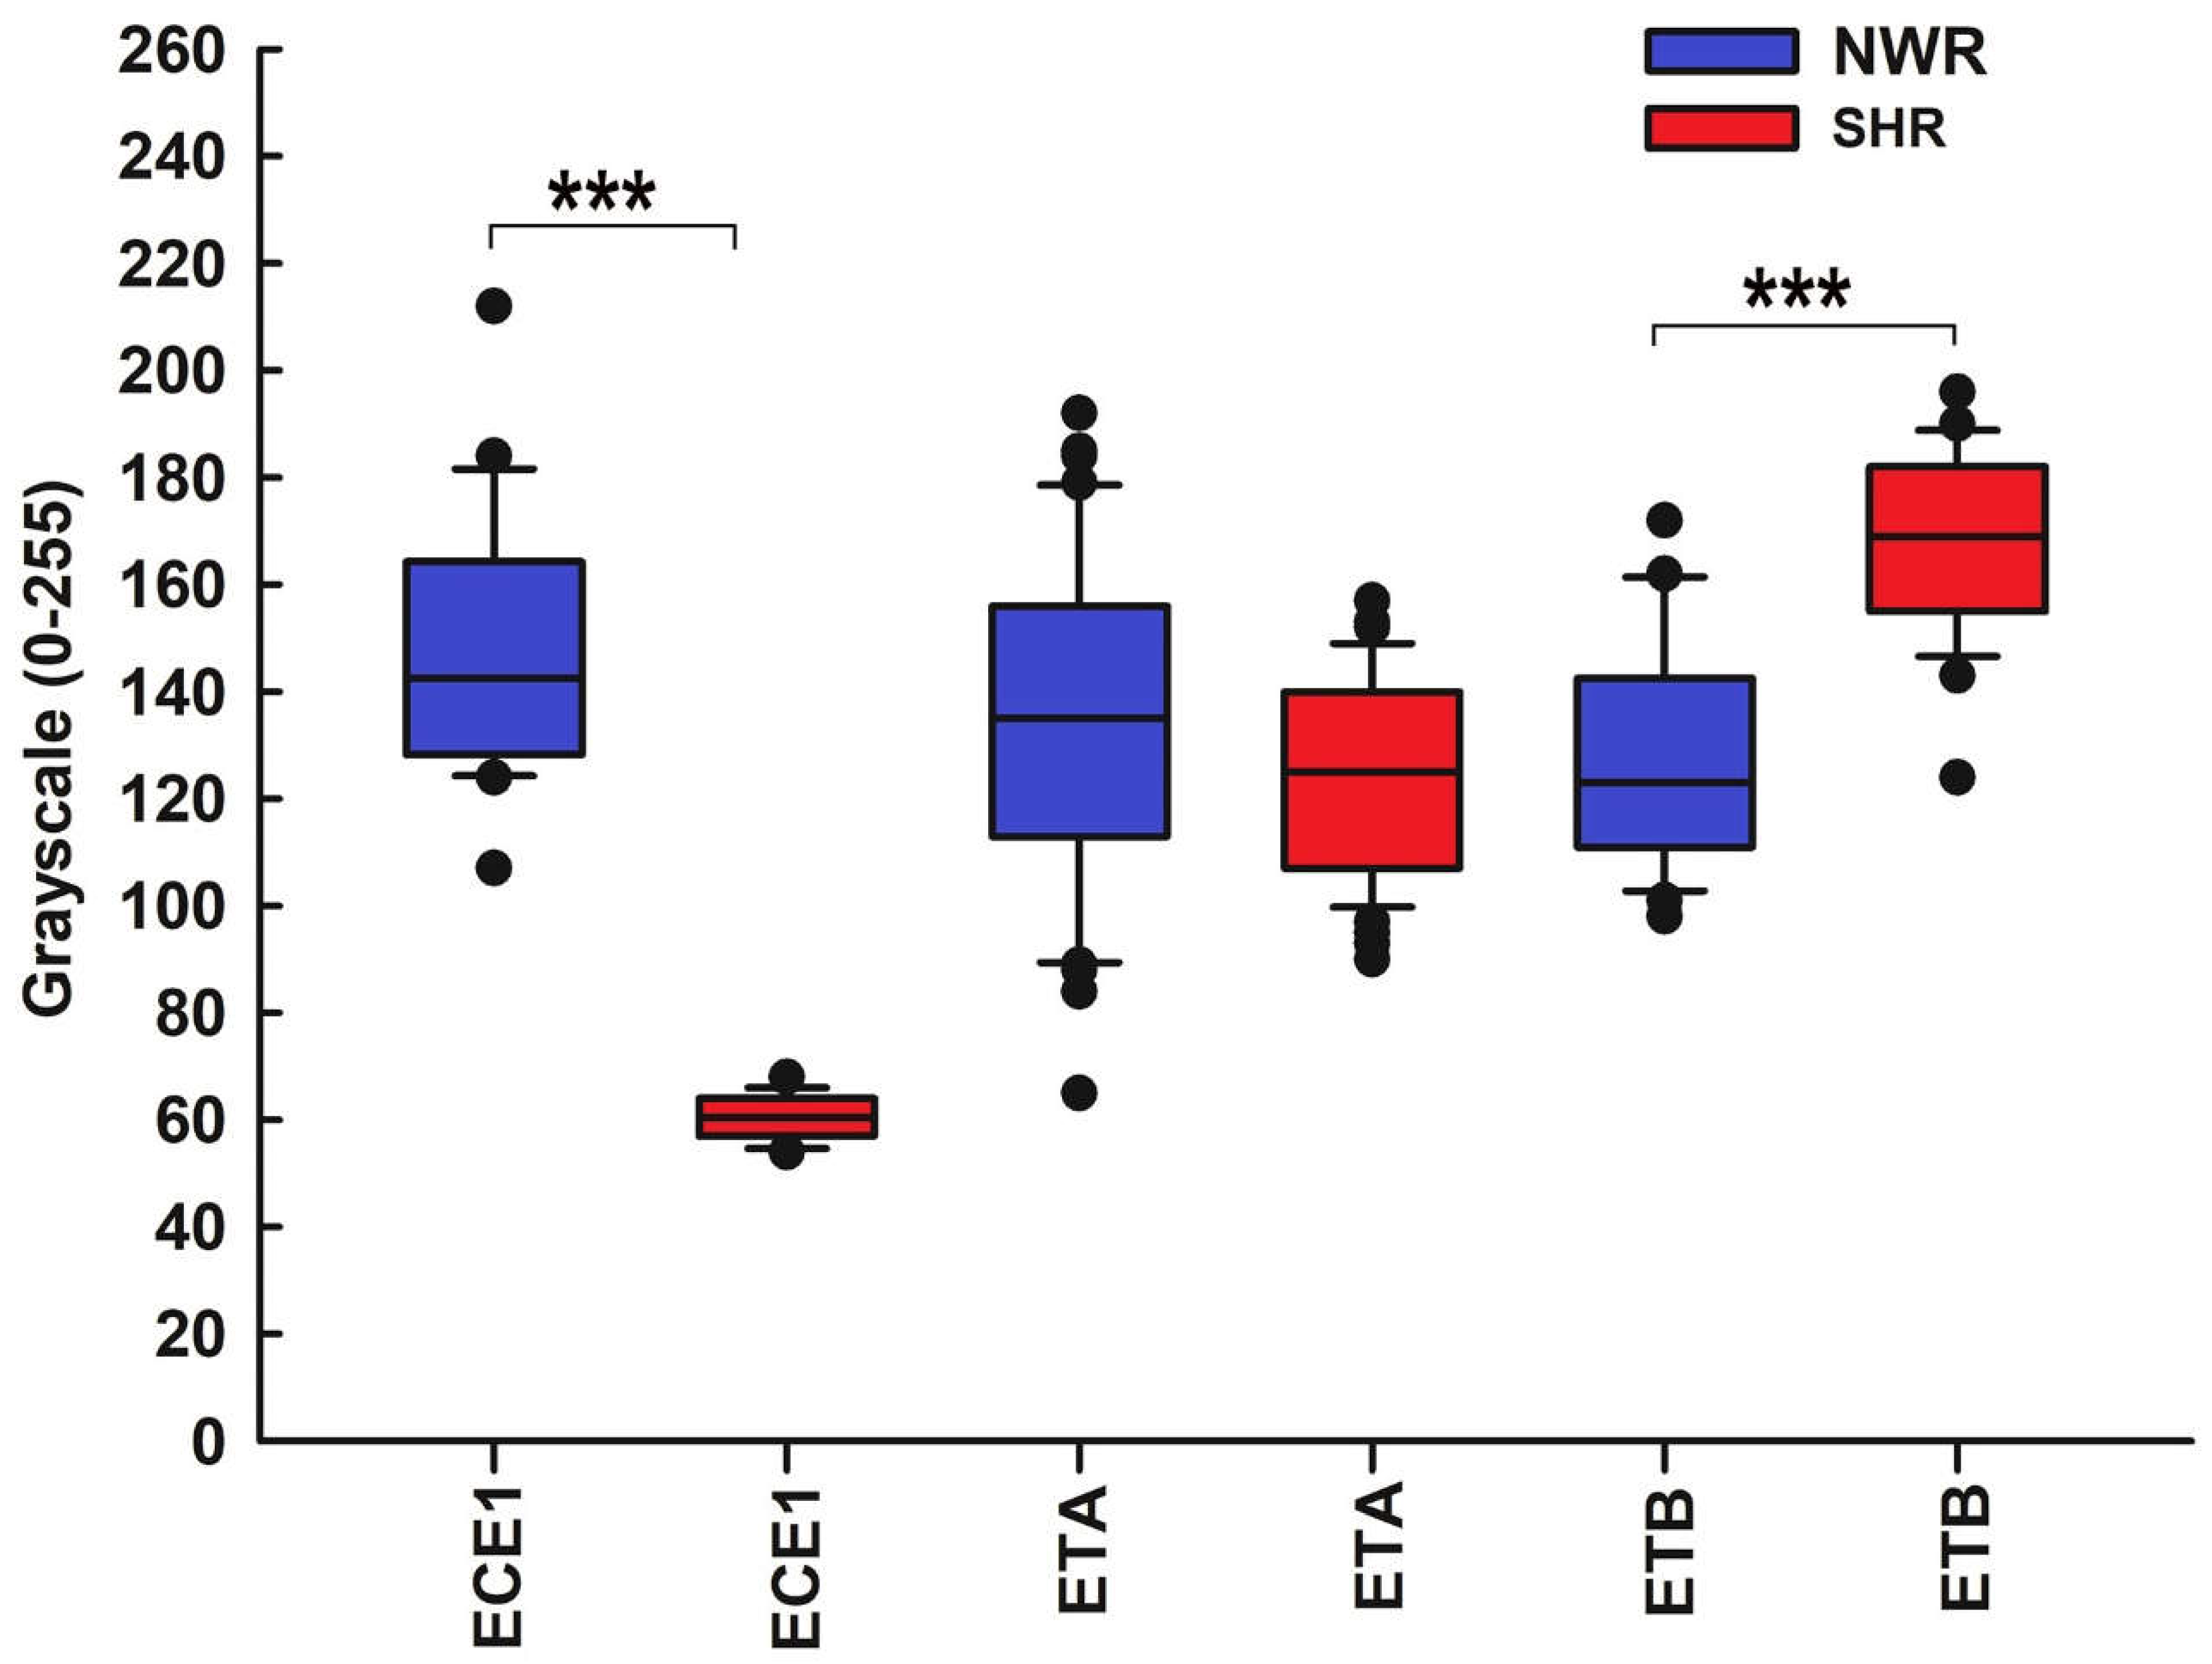
The statistical analysis of ECE1 and ET receptor staining intensity yielded similar results. Specifically, no statistically significant differences in ETA expression in hypertensive versus normotensive CBs were detected, whereas the staining intensity for ECE1 was significantly higher in the immunoreactive cells in the CB of NWR compared to that in SHR. On the contrary, the intensity of immunostaining for ETB was considerably higher in the immunoreactive cells in the hypertensive CB than in the normotensive control CB (
Figure 7).
3. Discussion
Consistent with its ability to sense blood-borne chemicals, the CB is a highly vascularized organ and its intraorgan hemodynamics possibly plays a role in the process of chemoreception. Dysregulation of the CB function and altered oxygen saturation are implicated in the pathophysiology of various human cardiovascular diseases, including hypertension [reviewed in 26,27]. Certainly, much of the available evidence has demonstrated that hypertension induces marked morphological and neurochemical changes within the CB in response to the elevated systemic blood pressure and concomitant hypoxia [for recent reviews, see 22,28–30].
However, most probably the adaptive structural alterations in the CB are caused by another factor rather than hypertension per se because it is unlikely that blood pressure would remain high in a structure whose microvasculature is mostly composed of fenestrated capillaries closely associated with cell clusters [31]. Indeed, it has recently been suggested that these changes in the SHR strain could be ascribed to the increased sympathetic vasomotor tone under hypertensive conditions [32].
The present results show that the two examined vasoactive peptides, VEGF and ET-1, are largely expressed in the CB of both normotensive and hypertensive rats. The expression of VEGF protein and its receptors demonstrates almost identical staining patterns as both VEGF-A and VEGF-B are localized in endothelial cells and a few glomus cells in the normotensive CB and their expression levels as well as VEGFR1 expression are significantly enhanced in the hypertensive CB. Previous studies have immunohistochemically shown an increased expression of VEGF and VEGFR1 by glomus cells in the CB of chronically hypoxic rats [33–35]. Similar upregulation of VEGF has also been reported in cell clusters in a rat model of L-NAME-induced hypertension [36]. It seems that VEGF is markedly distributed throughout glomus cells and blood vessels in the CB and its expression is evidently increased under hypertensive conditions. It is likely that VEGF specifically binds to VEGFR1 on both the glomus and endothelial cells to regulate hyperplasia of the glomus cells and induce endothelial cell proliferation, thus promoting angiogenesis and neovascularization in the hypertensive CB.
ET-1 is a potent vasoconstrictor peptide with a direct angiogenic effect on endothelial and perivascular cells which may also enhance the chemosensory discharge in the CB. ET-1 immunoreactivity has been observed in blood vessels and glomus cells of the normotensive rat CB [37] and, moreover, its expression there has been reported to be considerably upregulated by chronic hypoxia [38,39]. Chen et al. (2002) have further shown that ET-1 may enhance chemosensory activity to hypoxia [38,39] while others have ascribed this effect to local vasoconstriction though these authors do not exclude a paracrine action of the peptide on glomus cells [40,41]. Up-regulation of the ETA receptor after exposure to chronic hypoxia has been reported as well [37–39] while chronic intermittent hypoxia causes an increase of the ETB receptor in glomus cells [41,42]. Our results provide immunohistochemical evidence that hypertension may also induce an upregulation of ET-1 expression by glomus cells and its excitatory effects on chemoreception are mediated by ETB receptors.
Such an upregulated expression of VEGF and ET-1 suggests a paracrine role of these angiogenic peptides in the modulation of CB function and plasticity which could potentially play a pivotal role in cellular adaptation to hypertensive state. As recently suggested, CB hyperexcitability is driven by its own sympathetic innervation [43], and thus the heightened chemosensory discharge causes sympathetic neural activation which in turn could contribute to the development of hypertension [44].
4. Materials and Methods
4.1. Experimental Animals
The experiments were carried out on adult (12-week-old; n = 8) SHRs and age-matched normotensive Wistar rats (NWR; n = 8) of both sexes weighing 220–260 g. In the SHRs systolic blood pressure was above 150 mmHg and diastolic more than 90 mmHg so they met the reference value to classify them as hypertensive, while blood pressure values of the NWR were less than 120/80 mmHg, respectively. All experimental procedures adhered to the ethical guidelines of the EU Directive 2010/63/EU for the protection of animals used for scientific purposes following a standard protocol established by the Bioethical Commission of the Biomedical Research at the Institute of Neurobiology of the Bulgarian Academy of Sciences, and was approved by the Bulgarian Food Safety Agency (Approval Protocol No. 295 of 13 April 2021). All efforts were made to minimize the number of animals used and their suffering.
4.2. Tissue Preparation
The rats were deeply anesthetized with an intraperitoneal injection of sodium thiopental (30 mg/kg, Sigma-Aldrich, Chemie GmbH, Taufkirchen, Germany) and transcardially perfused first with 0.05 M phosphate-buffered saline (PBS), followed by 4% paraformaldehyde (CAS: 30525-89-4, Sigma-Aldrich, Vienna, Austria) in 0.1 M phosphate buffer (PB), pH 7.36. After perfusion, the carotid bifurcations were quickly removed, both CBs were immediately dissected out and tissue samples were postfixed in the same fixative overnight at 4°C. Thereafter, the tissue blocks were washed in tap water, dehydrated, embedded in paraffin, and cut into 6 μm thick sections using a paraffin microtome (Leica RM 2155, Wetzlar, Germany). The first section of each series was stained with hematoxylin and eosin to inspect CB morphology and the remaining sections were used for immunofluorescence.
4.3. Immunofluorescence
All tissue sections from both SHR and NWR rats were passed through the immunofluorescence procedure simultaneously to avoid variations in the immunostaining handling process. Initially they were deparaffinized with xylene and rehydrated in a descending ethanol series, 100%, 95%, 90%, 80%, 70% alcohol and distilled water for 5 min each. After an antigen retrieval in water bath thermostat WB-4MS at a temperature of 95 degrees for 20 min in 0.01 M citrate buffer, pH 6.0, the tissue sections were cooled and washed three times in Tris buffered saline with 0.05% Tween-20 (TTBT), pH 7.6 for 5 min each. Then they were incubated in Super Block (ScyTek Laboratories Inc., Logan, UT, USA) for 5 min at room temperature. After washing three times in TTBS for 5 min each, the sections were incubated with the primary antibodies overnight at 4 ◦C.
Table 1 shows the primary and secondary antibodies used, the appropriate working dilutions and the supplier companies.
After the incubation, the tissue slides were washed in TTBS and incubated with the secondary antibodies: Goat Anti-Mouse IgG (H + L) (Elab Fluor® 594 conjugated) (E-AB-1059, Wuhan Elabscience Biotechnology Co., Ltd., China) and Goat Anti-Rabbit IgG (H + L) (Elab Fluor® 488 conjugated) (E-AB-1055, Wuhan Elabscience Biotechnology Co., Ltd., China) for 1 hour at room temperature. Following three washes in TBS (E-IR-R116, Wuhan Elabscience Biotechnology Co., Ltd., China) 5 min each, the sections were incubated with Hoechst 33342 (sc-391054, Santa Cruz Biotechnology Inc., Dallas, TX, USA) for 10 min, then rinsed three times in TBS for 5 min each. Finally the sections were mounted with FluoreGuard Mounting Medium (Hard Set) (FMH030—ScyTek Laboratories Inc., Logan, UT, USA) and coverslipped. The slides were observed on a Leica TCS SPE confocal microscope (Wetzlar, Germany) equipped with a Leica Application Suite X (LAS X) Microscope Software, Version 3.5.7.23225 (Leica Microsystems GmbH).
4.4. Image Analysis and Statistics
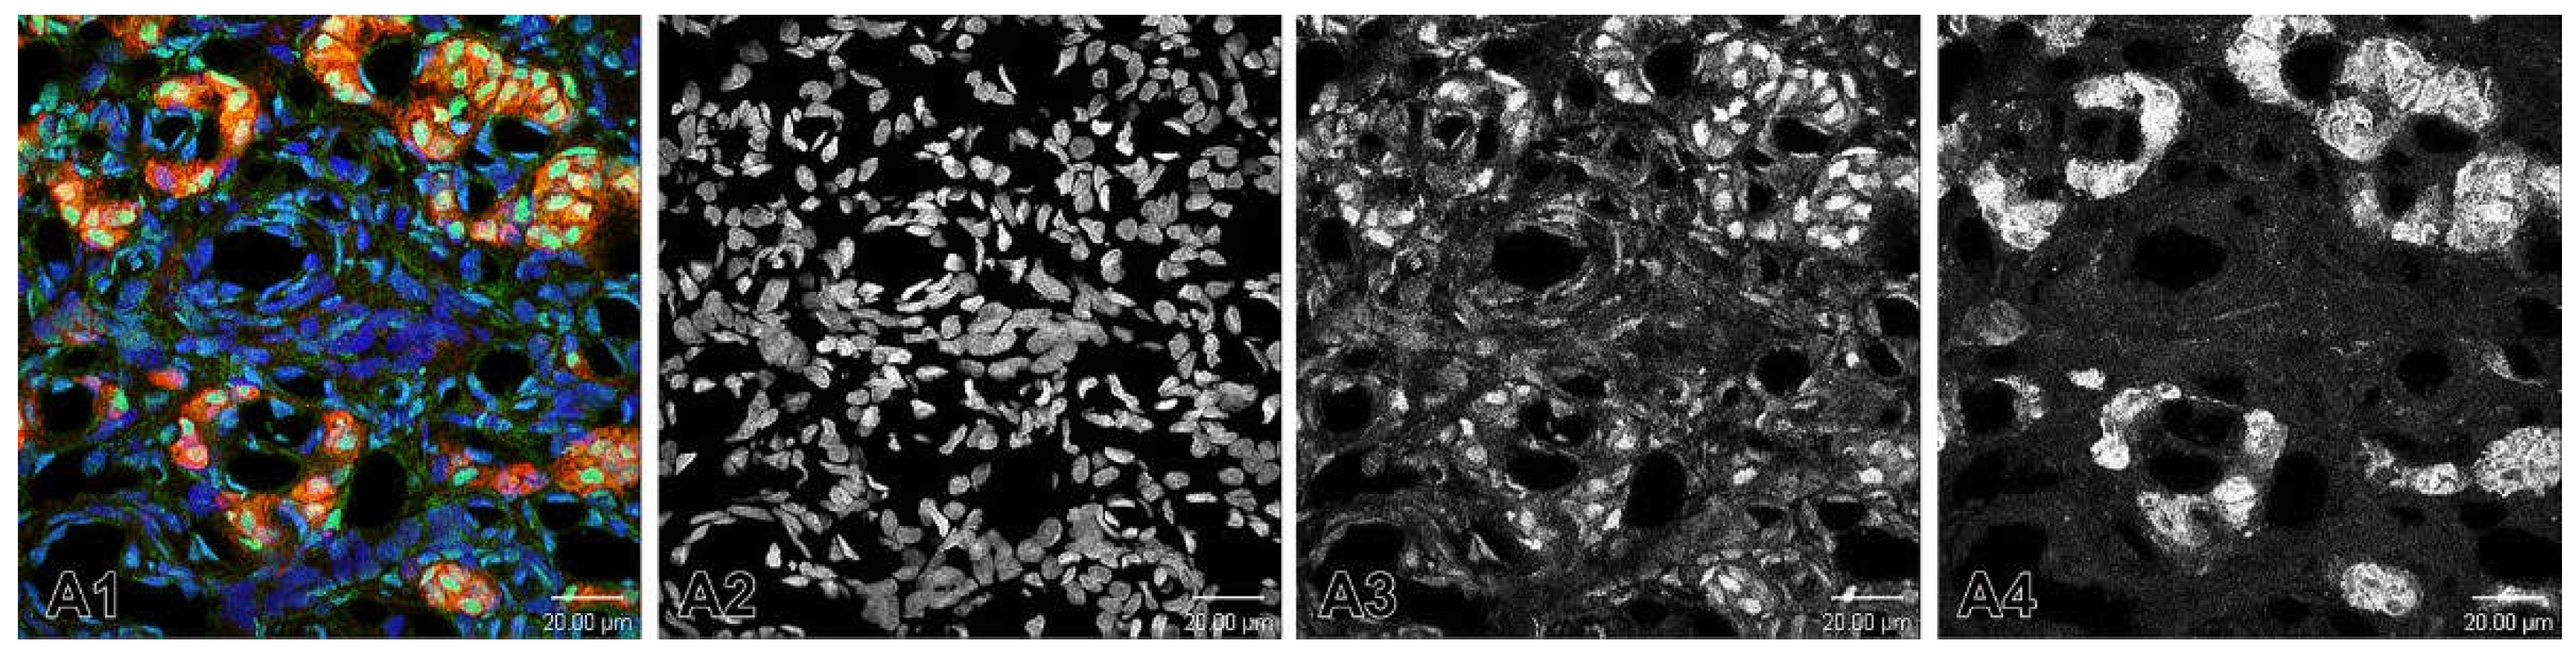
After the reactions, the stained and processed sections were digitalized using a Leica TCS SPE confocal microscope (Wetzlar, Germany) and the images were taken precisely on objective lenses 20x, 40x and 63x. Microphotographs of the immunostained fluorescent tissue sections were converted into grayscale images. We applied two widely used methods for converting fluorescence images to grayscale: Channel Mixer Method (
Figure 8) and Split Channels Method (
Figure 9). In order to deal with the troubleshooting, in the first method we always checked the Monochrome box at the bottom left of the Channel Mixer dialog box before adjusting to red (
Figure 8A4), green (
Figure 8A3) and blue (
Figure 8A2) channels.
In the second method, we used split channels (
Figure 9). Bearing in mind that an image with layers cannot be split into channels, we made sure that the image did not have layers. Thus, if there were layers, we had to merge them and then split the channels.
The grayscale intensity (range 0–255: black = 0, white = 255) was defined and measured using the ImageJ analysis program (National Institutes of Health, Bethesda, MD). The proportion of immunopositive cells in the two experimental groups and their grayscale intensity were given as medians. The data from the statistical analysis and the comparison between the two breeds of animals were displayed as box-and whisker plots. The central line in each box plot represented the median, whereas the lower and upper halves of the box were the 25th and 75th percentiles, respectively. The whiskers show each outlier for the group. The expression of substances was compared using a statistical program for data processing SigmaStat® 11.0 software package (Systat Software, Inc., Berkshire, UK). The expression levels between the two breeds were evaluated by Student's t-test for parametric data distribution or by Mann–Whitney U test to nonparametric data. Differences were considered statistically significant if p-values were <.05.
5. Conclusions
In conclusion, the elevated expression of VEGF and ETB and the downregulation of VEGFR1, VEGFR2 and ECE1 in rat glomus cells of the hypertensive CB suggest a paracrine role of these angiogenic peptides in the modulation of its function and plasticity under hypertensive conditions. Obviously, the altered transmitter phenotype of CB chemoreceptor cells and the upregulated production of angiogenic factors may modulate the chemosensory processing in hypertensive animals which elicits sympathetic hyperactivity, consequently leading to elevated blood pressure. Moreover, since hypertension is known to increase CB vasoconstriction and vascular permeability, their involvement as local vascular remodeling factors in the adaptation to hypertension could also be implied.
Author Contributions
Conceptualization, N.L. and D.A.; methodology, D.A., P.R., D.P. and N.L.; software, M.M.; validation, D.A., P.R.,A.H. and M.M.; investigation, D.A. and P.R.; resources, D.A. and P.R.; data curation, D.A.; writing – original draft preparation, N.L and D.A.; writing – review and editing, N.L. and A.D.; project administration, N.L.; funding acquisition, N.L. and D.A. All authors have read and approved the published version of the manuscript.
Funding
This study was funded by the European Union-NextGenerationEU through the National Recovery and Resilience Plan of the Republic of Bulgaria, project No. BG-RRP-2.004-0004-C01, by the Faculty of Medicine at Trakia University—Stara Zagora (Grant No. 5 /2022) and by the Bulgarian Ministry of Education and Science in the frames of the Bulgarian National Recovery and Resilience Plan, Component "Innovative Bulgaria", Project No. BG-RRP-2.004-0006-C02 "Development of research and innovation at Trakia University in service of health and sustainable well-being".
Institutional Review Board Statement
This study was conducted in accordance with the Declaration of Helsinki, and the experimental design was prepared in full accordance with the European Communities Council Directive 2010/63/E.U. It was approved by the Bioethical Commission of the Biomedical Research at the Institute of Neurobiology of the Bulgarian Academy of Sciences and the Bulgarian Food Safety Agency (Approval Protocol No. 295 of 13 April 2021).
Informed Consent Statement
Not applicable.
Data Availability Statement
All data generated or analyzed during this study are included in this article. Further inquiries can be directed to the corresponding author.
Acknowledgments
The authors wish to thank Mrs. Sabina Mitova for her excellent technical assistance.
Conflicts of Interest
The authors have no conflicts of interest to declare.
References
- Lazarov, N.E.; Atanasova, D.Y. Carotid body: The primary peripheral arterial chemoreceptor. Adv. Anat. Embryol. Cell Biol. 2023, 237, 1–3. [Google Scholar] [CrossRef]
- Atanasova, D.Y.; Iliev, M.E.; Lazarov, N.E. Morphology of the rat carotid body. Biomed. Rev. 2011, 22, 41–55. [Google Scholar] [CrossRef]
- Lazarov, N.E.; Atanasova, D.Y. General morphology of the mammalian carotid body. Adv. Anat. Embryol. Cell Biol. 2023, 237, 13–35. [Google Scholar] [CrossRef]
- González, C.; Almaraz, L.; Obeso, A.; Rigual, R. Carotid body chemoreceptors: from natural stimuli to sensory discharges. Physiol. Rev. 1994, 74, 829–898. [Google Scholar] [CrossRef] [PubMed]
- Pardal, R.; Ortega-Sáenz, P.; Durán, R.; López-Barneo, J. Glia-like stem cells sustain physiologic neurogenesis in the adult mammalian carotid body. Cell 2007, 131, 364–377. [Google Scholar] [CrossRef] [PubMed]
- Sobrino, V.; Annese, V.; Navarro-Guerrero, E.; Platero-Luengo, A.; Pardal, R. The carotid body: a physiologically relevant germinal niche in the adult peripheral nervous system. Cell. Mol. Life Sci. 2019, 76, 1027–1039. [Google Scholar] [CrossRef] [PubMed]
- Ballard, T.; Blakeman, N.; Pallot, D.J.; Al-Neamy, K.A. Quantitative ultrastructural studies of the cat carotid body. I. General stereology of tissue components. Acta Anat. 1982, 113, 47–52. [Google Scholar] [CrossRef] [PubMed]
- McDonald, D.M. Peripheral chemoreceptors. Structure-function relationships of the carotid body. In Lung Biology in Health and Disease. The Regulation of Breathing, 1st. ed.; Hornbein, T.F., Ed.; Dekker: New York, USA, 1981; pp. 105–319. [Google Scholar]
- McDonald, D.M.; Haskell, A. Morphology of connections between arterioles and capillaries in the rat carotid body analysed by reconstructing serial sections. In The Peripheral Arterial Chemoreceptors; Pallot, D.J., Ed.; Croom Helm: London, UK, 1984; pp. 195–206. [Google Scholar]
- Taguchi, T. Blood vascular organization of the rat carotid body: A scanning electron microscopic study of corrosion casts. Arch. Histol. Jpn. 1986, 49, 243–254. [Google Scholar] [CrossRef]
- McDonald, D.M.; Mitchell, R.A. The innervation of glomus cells, ganglion cells and blood vessels in the rat carotid body: A quantitative ultrastructural analysis. J. Neurocytol. 1975, 4, 177–230. [Google Scholar] [CrossRef]
- Verna, A.; Barets, A.; Salat, C. Distribution of sympathetic nerve endings within the rabbit carotid body: a histochemical and ultrastructural study. J. Neurocytol. 1984, 13, 849–865. [Google Scholar] [CrossRef]
- Ichikawa, H. Innervation of the carotid body: Immunohistochemical, denervation, and retrograde tracing studies. Microsc. Res. Tech. 2002, 59, 188–195. [Google Scholar] [CrossRef]
- Biscoe, T.J.; Stehbens, W.E. Ultrastructure of the denervated carotid body. Quart. J. Exp. Physiol. 1967, 52, 31–36. [Google Scholar] [CrossRef]
- Verna, A. The mammalian carotid body: morphological data. In The Carotid Body Chemoreceptors; González, C., Ed.; Landes Bioscience: Austin, USA, 1997; pp. 1–29. [Google Scholar]
- De Castro, F.; Rubio, M. The anatomy and innervation of the blood vessels of the carotid body and the role of chemoreceptive reactions in the autoregulation of the blood flow. In Arterial Chemoreceptors. Proceedings of Wates Symposium; Torrance, R.W., Ed.; Blackwell: Oxford, UK, 1968; pp. 267–278. [Google Scholar]
- Verna, A. Observations on the innervation of the carotid body of the rabbit. In Peripheral Arterial Chemoreceptors; Purves, M.J., Ed.; Cambridge University Press: Oxford, UK, 1975; pp. 75–97. [Google Scholar]
- Campanucci, V.A.; Nurse, C.A. Autonomic innervation of the carotid body: role in efferent inhibition. Respir. Physiol. Neurobiol. 2007, 157, 83–92. [Google Scholar] [CrossRef]
- Schulz, E.; Gori, T.; Münzel, T. Oxidative stress and endothelial dysfunction in hypertension. Hypertens. Res. 2011, 34, 665–673. [Google Scholar] [CrossRef] [PubMed]
- Franco, C.; Sciatti, E.; Favero, G.; Bonomini, F.; Vizzardi, E.; Rezzani, R. Essential hypertension and oxidative stress: Novel future perspectives. Int. J. Mol. Sci. 2022, 23, 14489. [Google Scholar] [CrossRef] [PubMed]
- Atanasova, D.Y.; Lazarov, N.E. Expression of neurotrophic factors and their receptors in the carotid body of spontaneously hypertensive rats. Respir. Physiol. Neurobiol. 2014, 202, 6–15. [Google Scholar] [CrossRef]
- Lazarov, N.E.; Atanasova, D.Y. Structural plasticity of the carotid body. Adv. Anat. Embryol. Cell Biol. 2023, 237, 37–48. [Google Scholar] [CrossRef]
- Atanasova, D.Y.; Dandov, A.D.; Dimitrov, N.D.; Lazarov, N.E. Histochemical and immunohistochemical localization of nitrergic structures in the carotid body of spontaneously hypertensive rats. Acta Histochem. 2020, 122, 151500. [Google Scholar] [CrossRef]
- Porzionato, A.; Macchi, V.; Parenti, A.; De Caro, R. Trophic factors in the carotid body. Int. Rev. Cell Mol. Biol. 2008, 269, 1–58. [Google Scholar] [CrossRef] [PubMed]
- Stocco, E.; Barbon, S.; Tortorella, C.; Macchi, V.; De Caro, R.; Porzionato, A. Growth factors in the carotid body–An update. Int. J. Mol. Sci. 2020, 21, 7267. [Google Scholar] [CrossRef] [PubMed]
- Prabhakar, N.R.; Peng, Y.J. Peripheral chemoreceptors in health and disease. J. Appl. Physiol. 2004, 96, 359–366. [Google Scholar] [CrossRef] [PubMed]
- Ortega-Sáenz, P.; López-Barneo, J. Physiology of the carotid body: from molecules to disease. Annu. Rev. Physiol. 2020, 82, 127–149. [Google Scholar] [CrossRef] [PubMed]
- Habeck, J.O. Peripheral arterial chemoreceptors and hypertension. J. Auton. Nerv. Syst. 1991, 34, 1–7. [Google Scholar] [CrossRef] [PubMed]
- Kumar, P.; Prabhakar, N.R. Peripheral chemoreceptors: function and plasticity of the carotid body. Compr. Physiol. 2012, 2, 141–219. [Google Scholar] [CrossRef] [PubMed]
- Atanasova, D.Y.; Dandov, A.D.; Lazarov, N.E. Neurochemical plasticity of the carotid body in hypertension. Anat. Rec. 2023, 306, 2366–2377. [Google Scholar] [CrossRef] [PubMed]
- McDonald, D.M.; Lurue, D.T. The ultrastructure and connections of blood vessels supplying the rat carotid body and carotid sinus. J. Neurocytol. 1983, 12, 117–153. [Google Scholar] [CrossRef] [PubMed]
- Kato, K.; Wakai, J.; Matsuda, H.; Kusakabe, T.; Yamamoto, Y. Increased total volume and dopamine β-hydroxylase immunoreactivity of carotid body in spontaneously hypertensive rats. Auton. Neurosci. 2012, 169, 49–55. [Google Scholar] [CrossRef] [PubMed]
- Chen, J.; Dinger, B.; Jyung, R.; Stensaas, L.; Fidone, S. Altered expression of vascular endothelial growth factor and FLK-1 receptor in chronically hypoxic rat carotid body. Adv. Exp. Med. Biol. 2003, 536, 583–591. [Google Scholar] [CrossRef]
- Tipoe, G.L.; Fung, M.L. Expression of HIF-1alpha, VEGF and VEGF receptors in the carotid body of chronically hypoxic rat. Respir. Physiol. Neurobiol. 2003, 138, 143–154. [Google Scholar] [CrossRef]
- Del Rio, R.; Muñoz, C.; Arias, P.; Court, F.A.; Moya, E.A.; Iturriaga, R. Chronic intermittent hypoxia-induced vascular enlargement and VEGF upregulation in the rat carotid body is not prevented by antioxidant treatment. Am. J. Physiol. Lung Cell. Mol. Physiol. 2011, 301, L702–L711. [Google Scholar] [CrossRef]
- Felix, A.S.; Rocha, V.N.; Nascimento, A.L.; de Carvalho, J.J. Carotid body remodelling in l-NAME-induced hypertension in the rat. J. Comp. Pathol. 2012, 146, 348–356. [Google Scholar] [CrossRef]
- He, L.; Chen, J.; Dinger, B.; Stensaas, L.; Fidone, S. Endothelin modulates chemoreceptor cell function in mammalian carotid body. Adv. Exp. Med. Biol. 1996, 410, 305–311. [Google Scholar] [CrossRef]
- Chen, J.; He, L.; Dinger, B.; Stensaas, L.; Fidone, S. Role of endothelin and endothelin A-type receptor in adaptation of the carotid body to chronic hypoxia. Am. J. Physiol. Lung Cell. Mol. Physiol. 2002, 282, L1314–L1323. [Google Scholar] [CrossRef] [PubMed]
- Chen, Y.; Tipoe, G.L.; Liong, E.; Leung, S.; Lam, S.Y.; Iwase, R.; Tjong, Y.W.; Fung, M.L. Chronic hypoxia enhances endothelin-1-induced intracellular calcium elevation in rat carotid body chemoreceptors and up-regulates ETA receptor expression. Pflug. Arch: Eur. J. Physiol. 2002, 443, 565–573. [Google Scholar] [CrossRef]
- Rey, S.; Del Rio, R.; Iturriaga, R. Contribution of endothelin-1 to the enhanced carotid body chemosensory responses induced by chronic intermittent hypoxia. Brain Res. 2006, 1086, 152–159. [Google Scholar] [CrossRef]
- Rey, S.; Del Rio, R.; Iturriaga, R. Contribution of endothelin-1 and endothelin A and B receptors to the enhanced carotid body chemosensory responses induced by chronic intermittent hypoxia. Adv. Exp. Med. Biol. 2008, 605, 228–232. [Google Scholar] [CrossRef] [PubMed]
- Rey, S.; Corthorn, J.; Chacon, C.; Iturriaga, R. Expression and immunolocalization of endothelin peptides and its receptors, ETA and ETB, in the carotid body exposed to chronic intermittent hypoxia. J. Histochem. Cytochem. 2007, 55, 167–174. [Google Scholar] [CrossRef] [PubMed]
- Felippe, I.S.A.; Zera, T.; da Silva, M.P.; Moraes, D.J.A.; McBryde, F.; Paton, J.F.R. The sympathetic nervous system exacerbates carotid body sensitivity in hypertension. Cardiovasc. Res. 2023, 119, 316–331. [Google Scholar] [CrossRef] [PubMed]
- Lazarov, N.E.; Atanasova, D.Y. Carotid body dysfunction and mechanisms of disease. Adv. Anat. Embryol. Cell Biol. 2023, 237, 123–138. [Google Scholar] [CrossRef]
Figure 1.
Immunofluorescence images demonstrating VEGF-A expression in the carotid body of normotensive Wistar rats (NWR) and spontaneously hypertensive rats (SHR). Panels A1-A4 show VEGF-immunostained glomus and endothelial cells (green), TH-immunoreactive glomus cells (red) and co-localization of VEGF-A and TH positive cells in confocal dual-color images (orange). The cell nuclei are counterstained with Hoechst (blue). Panels B1-B4 show images of the hypertensive CB. Note the enhanced VEGF-A expression in glomus cells in the merged image (B4). Original magnification ×40, scale bars, 25 µm (A1-A4), 20 µm (B1-B4).
Figure 2.
Representative images of double immunofluorescence staining for VEGF-B (green), TH (red) and Hoechst (blue as a nuclear counterstain) in the normotensive and hypertensive carotid body. (A1-A4) Immunostained sections of the carotid body depicting the expression of VEGF-B in glomus (arrows) and endothelial (arrowhead) cells in normotensive Wistar rats (NWR). A few endothelial cells are immunostained for this protein (A2) and a subset of co-stained glomus cells (orange) are visualized in a merged image (A4). (B1-B4) Representative images of the carotid body in spontaneously hypertensive rats (SHR) showing an increased expression of VEGF-B in glomus cells (B4). Original magnification ×63, scale bars equal 10 µm.
Figure 3.
Representative images of immunofluorescence staining for VEGFR1 (A, B) and VEGFR2 (C, D) in the normotensive and hypertensive carotid body. Double immunofluorescence staining analyzed by confocal laser scanning microscopy demonstrates VEGFR1, VEGFR2 (green), TH (red) and co-localization (orange) of VEGFR1-VEGFR2/TH in overlapping images. Nuclei of the cells are counterstained with Hoechst (blue). Note the highly increased expression for VEGFR1 in the glomus cells of NWR (A4) compared to that in SHR (B4). A slightly increased immunostaining for VEGFR2 is also observed in some glomus cells in SHR (D4) than in the immunostained glomus cells in NWR (C4). Original magnification x40 for (B) and x 63 for (A,C,D), scale bars, 10 µm (A, C, D), 100 µm (B).
Figure 4.
Statistical comparison of the immunostaining intensity for VEGF-A, VEGF-B and VEGF receptors in NWRs (blue boxes) and SHRs (red boxes). Note that immunostaining intensity for the VEGF-A in the chemosensory glomus cells of the SHR was stronger (median, 181 versus 109, p ≤ 0.001) than that observed in NWR rats. An enhanced and statistically significantly increased expression of vascular endothelial growth factor-B (VEGF-B) (median, 73 versus 57.5, p≤ 0.001) and its receptor VEGFR2 (median, 95.5 versus 89, p= 0.036) in glomus cells of SHR compared with NWR controls was also observed, as highlighted by the double labeling technique with their marker tyrosine hydroxylase (TH). Vascular endothelial growth factor receptor 1 (VEGFR1) is much less expressed in glomus cells of hypertensive CB compared to age-matched NWR controls (median, 79 versus 88.5, p≤ 0.001).
Figure 5.
Double immunofluorescence staining of endothelin-converting enzyme 1 (ECE1) in the normotensive (A) and hypertensive (B) carotid body. (A1-A4) Confocal microscope images showing the high enzymatic activity in the endothelial cells and in a few glomus cells in the carotid body of NWR. TH and ECE1 colocalization in glomus cells can be seen in an overlaying image (A4). (B1-B4) ECE1 is weakly expressed only in some glomus cells in the carotid body of SHR. Original magnifications x63 for (A1-A4) and x40 for (B1-B4), scale bars, 10 µm (A), 20 µm (B).
Figure 6.
Confocal images illustrating the expression of endothelin receptors ETA and B (green) in the carotid body of normotensive Wistar rats (NWR) and spontaneously hypertensive rats (SHR). (A1-A4) Note almost unchanged expression for ETA (orange) in the glomus cells of SHR in a merged image (B4) compared to that in NWR (A4). Nuclei of the cells are counterstained with Hoechst (blue). Immunofluorescence staining for TH (red) is used to detect glomus cells. An increased immunostaining for ETB is observed in some glomus cells in SHR (D4) than in the immunopositive glomus cells in NWR (C4). Original magnification x40 for (A,C) and x63 for (B,D), scale bars, equal 25 µm (A,C), 20 µm (B,D).
Figure 7.
Statistical comparison of the immunostaining intensity for ECE1 and ET receptors in NWRs (blue boxes) and SHRs (red boxes). Note that when compared with the control CB, the staining intensity for ECE1 was lower in the immunoreactive cells in the CB of SHR (median, 60.5 versus 142.5, p < 0.001). We were unable to detect statistically significant differences in ETA expression in hypertensive versus normotensive CBs (median, 125 versus 135, p = 0.068). Immunoreactivity for the endothelin receptor type B (ETB) was localized in glomus cells in both the normotensive and hypertensive CB. Compared to the control CB, the staining intensity for ETB was higher in the immunoreactive cells in the CB of SHR (median, 169 versus 123, p < 0.001).
Figure 8.
(A1) A merge image showing the nuclei of the cells that are counterstained with Hoechst (blue). Immunofluorescence staining for TH (red) is used to detect glomus cells. The immunostaining for ETB is observed in some glomus cells in SHR. (A2-A4) Example of the application of Channel Mixer Method and converting fluorescent color to grayscale. The monochrome box was checked before adjusting to blue (A2), green (A3) and red (A4) channels. Original magnification x63, scale check bars, 20 µm.
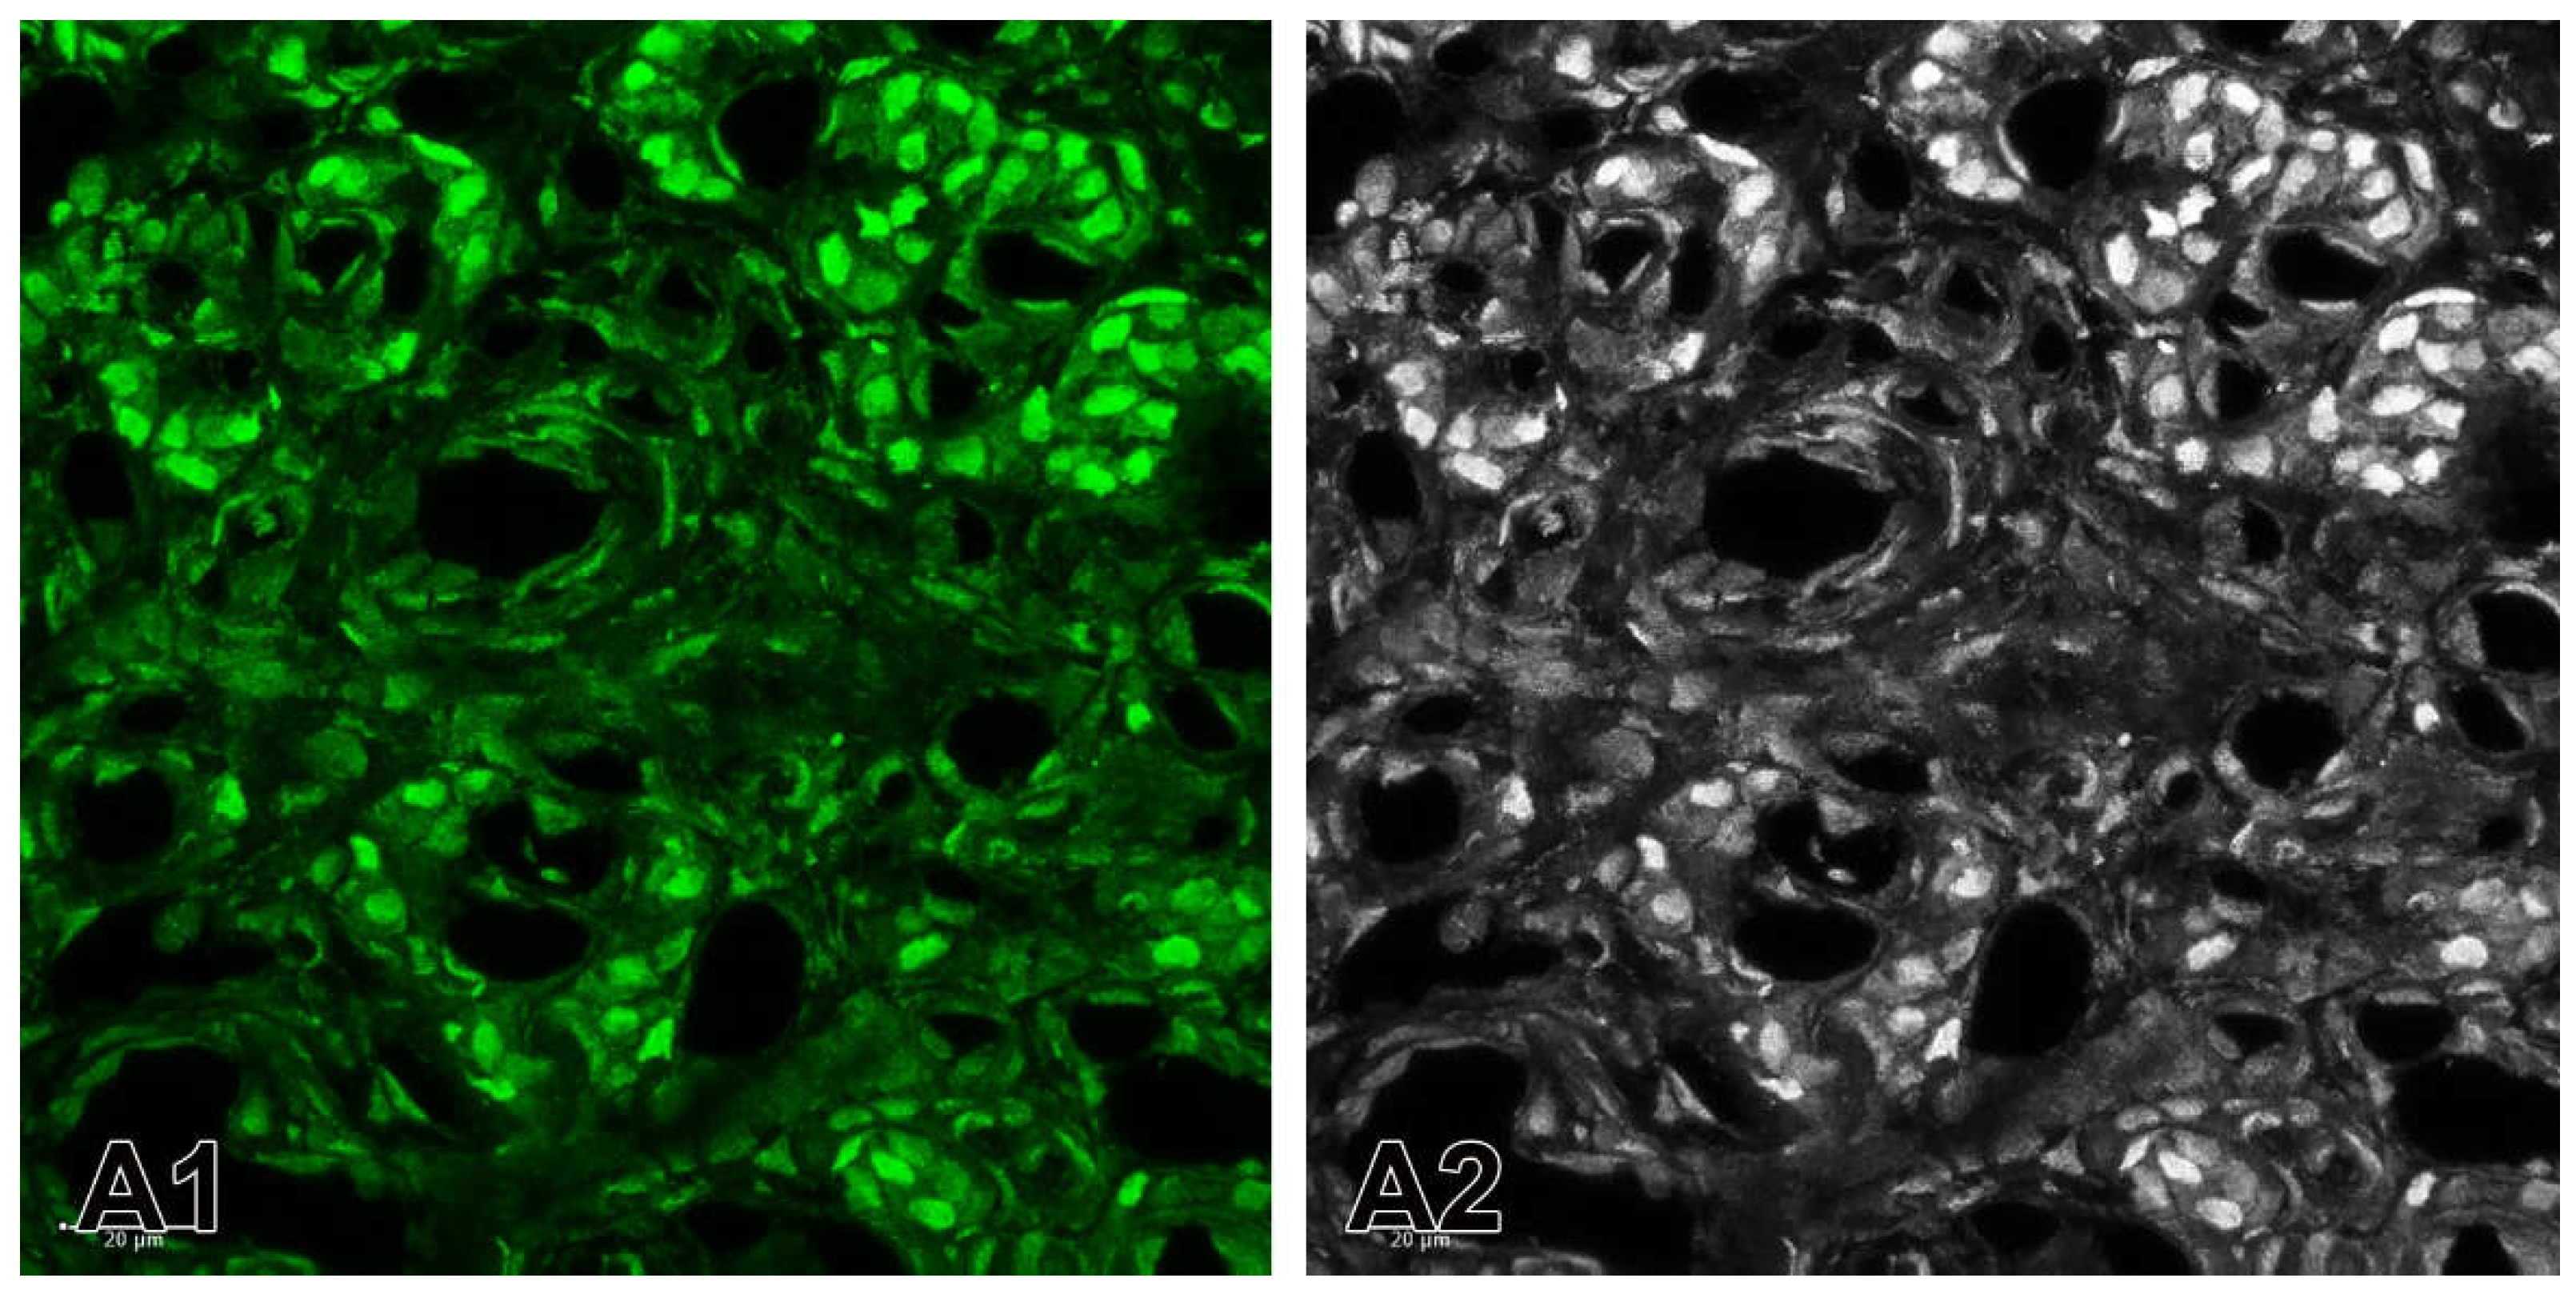
Figure 9.
Example of the application of the split channels method. (A1) The split green channel for the expression of ETB in the carotid body of SHRs. (A2) Converted fluorescent color image to grayscale image. Original magnification x63, scale bars 20 µm.
Figure 9.
Example of the application of the split channels method. (A1) The split green channel for the expression of ETB in the carotid body of SHRs. (A2) Converted fluorescent color image to grayscale image. Original magnification x63, scale bars 20 µm.
Table 1.
List of primary and secondary antibodies used for immunofluorescence.
Table 1.
List of primary and secondary antibodies used for immunofluorescence.
|
Name of antibody
|
Company
(Catalog No.)
|
Mono/
polyclonal
|
Source
|
Dilution for IF
|
|
Vascular endothelial growth factor A (C-1) (VEGF-A)
|
Santa Cruz Biotechnology |
Monoclonal |
Mouse |
1:50 |
|
Vascular endothelial growth factor B (VEGF-B)
|
Elabscience®
(E-AB-65950) |
Polyclonal |
Rabbit |
1:400 |
|
Vascular endothelial growth factor receptor 1 (VEGFR1)
|
Elabscience®
(E-AB-65963) |
Polyclonal |
Rabbit |
1:1000 |
|
Vascular endothelial growth factor receptor 2 (VEGFR2)
|
Elabscience®
(E-AB-63481) |
Polyclonal |
Rabbit |
1:800 |
|
Tyrosine hydroxylase (TH)
|
Elabscience®
(E-AB-70206) |
Monoclonal |
Mouse |
1:800 |
|
Endothelin converting enzyme 1 (ECE1)
|
Elabscience®
(E-AB-14052) |
Polyclonal |
Rabbit |
1:400 |
|
Endothelin receptor type A (ETA)
|
Affinity Biosciences
(DF4923) |
Polyclonal |
Rabbit |
1:100 |
|
Endothelin receptor type B (ETB)
|
Affinity Biosciences
(DF7104) |
Polyclonal |
Rabbit |
1:300 |
|
Goat anti-mouse IgG(H+L) (Elab
Fluor® 594 conjugated)
|
Elabscience®,
(E-AB-1059) |
Polyclonal |
Goat |
1:100 |
|
Goat anti-rabbit IgG (H+L) (Elab Fluor® 488 conjugated)
|
Elabscience®,
(E-AB-1055) |
Polyclonal |
Goat |
1:100 |
|
Disclaimer/Publisher’s Note: The statements, opinions and data contained in all publications are solely those of the individual author(s) and contributor(s) and not of MDPI and/or the editor(s). MDPI and/or the editor(s) disclaim responsibility for any injury to people or property resulting from any ideas, methods, instructions or products referred to in the content. |
© 2024 by the authors. Licensee MDPI, Basel, Switzerland. This article is an open access article distributed under the terms and conditions of the Creative Commons Attribution (CC BY) license (http://creativecommons.org/licenses/by/4.0/).