Submitted:
18 December 2024
Posted:
19 December 2024
You are already at the latest version
Abstract
This paper introduces a novel multimodal framework for economic time series forecasting, integrating textual information with historical price data to enhance predictive accuracy. The proposed method employs a multi-head attention mechanism to dynamically align textual embeddings with temporal price data, capturing previously unrecognized cross-modal dependencies and enhancing the model’s ability to interpret event-driven market dynamics. This enables the framework to model complex market behaviors in a unified and effective manner. Experimental results across multiple financial datasets, including Forex and gold price datasets, demonstrate that incorporating textual information significantly enhances forecasting accuracy. Compared to models relying solely on historical price data, the proposed framework achieves a substantial reduction in Mean Squared Error (MSE) loss, with improvements of up to 13.64%. This highlights the effectiveness of leveraging textual inputs alongside structured time series data in capturing complex market dynamics and improving predictive performance.
Keywords:
economic time series forecasting
; feature engineering
; multimodal data fusion
; deep learning
; data mining
1. Introduction
Time series forecasting is a critical challenge with significant practical implications across various domains, such as economics, energy, weather, traffic monitoring, and healthcare [1,2,3,4]. The field of economics, in particular, has demonstrated a longstanding interest in accurately predicting economic time series data. Financial markets, which inherently generate data in time series form, have been extensively studied over the past decades. The primary goal of these studies has been to uncover deeper insights into market trends. As researchers gain a better understanding of market behaviors, they are increasingly able to develop more effective investment strategies, thereby enhancing financial decision-making processes. However, the efficient market hypothesis (EMH) [5] posits that asset prices reflect all available information, theoretically rendering them unpredictable as new data is instantly assimilated. Despite this, practical forecasting efforts continue to show that financial markets are indeed a combination of efficient and non-efficient markets, suggesting that they are, to some extent, predictable [6,7].
Time series forecasting primarily aims to project future values based on historical data, often exploiting repeating long-term or short-term patterns inherent in the data. Over the years, the field has explored various methodologies to capture these patterns, including linear and nonlinear time series models, and artificial intelligence techniques. However, in the economic field, the characteristics of data present unique challenges that complicate the application of these models. Firstly, financial data are highly volatile and can exhibit extreme value changes, which undermines the assumption of stable patterns over time [8]. Secondly, compared to other types of time series, financial data typically exhibit more complex seasonality and more variable trends [9]. This variability is often exacerbated by sudden and unpredictable events, adding a layer of complexity to the forecasting. These factors make economic forecasting particularly challenging.
Different approaches for economic time series forecasting have been explored, ranging from econometric theory and statistical methodologies to artificial intelligence models. Statistical methods, such as the autoregressive integrated moving average (ARIMA) model [10,11] and the semi-functional partial linear model [12], have also been employed in this field. These models benefit from a solid mathematical foundation and offer strong interpretability [13], but their predictions are often imprecise due to the nonlinear and irregular nature of economic data.
In response to the complexity of economic time series, neural networks and support vector machines (SVM) have demonstrated considerable success in modeling non-linear relationships, offering robust alternatives to traditional linear models [14]. Furthermore, recurrent neural networks (RNNs) and long short-term memory (LSTM) networks have become particularly prevalent due to their ability to effectively extract time dependencies from time series data, thanks to the memory features obtained from their feedback mechanisms [15,16]. More recently, transformer-based models have emerged for this task, employing attention mechanisms capable of learning global context and long-term dependencies, thus enhancing the depth of time series analysis [17,18].
As deep learning expands its application in time series forecasting, the integration of natural language processing (NLP) techniques is increasingly transforming economic predictions. Textual data, available in real-world economic time series forecasting applications, often contains nuanced information that may surpass the insights provided by numerical financial series alone [19]. Recent studies have begun using textual data in economic forecasting models to capture these additional insights. For instance, some models analyze large volumes of financial news to identify sentiments and factual information that may affect investor behavior and market trends [20].
In financial market forecasting, Farimani et al. [21] propose generating sentiment-based features over time and combining them with time-series data to improve predictions. Similarly, Reis Filho et al. [22] focus on agricultural commodity prices, using a low-dimensional representation of domain-specific text data enriched with selected keywords, which addresses issues of high dimensionality and data sparsity, improving forecast accuracy. Baranowski et al. [23] take a different approach, developing a tone shock measure from European Central Bank communications to predict monetary policy decisions. In cryptocurrency forecasting, Erfanian et al. [24] apply machine learning methods such as SVR, OLS, Ensemble learning, and MLP to examine how macroeconomic, microeconomic, technical, and blockchain indicators relate to Bitcoin prices over short and long terms. These studies show how NLP can enhance time series forecasting by integrating textual data with traditional economic indicators.
These studies demonstrate the potential of natural language processing (NLP) to enhance time series forecasting by incorporating textual data alongside traditional economic indicators. However, most existing approaches simplify the complexity of textual data by focusing on specific aspects, such as sentiment polarity, tone, or keyword-based representations, neglecting the rich, nuanced information embedded in the full text. This narrow scope limits their ability to capture the non-linear and qualitative impacts of news and other unstructured data sources. Incorporating comprehensive news content into financial forecasting can enhance datasets by introducing additional contextual information, improving the adaptability and accuracy of predictive models. Such an approach allows models to better reflect real-world dynamics, capturing the multifaceted interactions that drive market behavior. Therefore, a more comprehensive framework is required to address these challenges, leveraging both unstructured textual data and structured time series to establish a robust and realistic forecasting methodology.
This paper introduces a novel approach to economic time series forecasting that integrates textual information directly into the predictive framework as an additional variable. Unlike sentiment-centric methods, this approach fully leverages the richness of textual data, such as economic news and reports, to extract predictive signals absent from numerical data alone. By treating textual data as an extension of time series variables, the proposed method provides a unified framework for modeling the interplay between textual and numerical inputs. The primary contributions of this study are as follows:
(1) Multimodal Attention-Based Integration: The proposed method employs an inverted attention mechanism to directly model interactions between textual data and multivariate time series. By treating text as an additional variable, the model captures intricate relationships between historical price movements and textual information, enabling more accurate and robust economic forecasts.
(2) Seamless Integration of Textual and Numerical Data:: This study utilizes matched historical price and news datasets to construct multimodal datasets. By combining the contextual depth of textual data with the temporal patterns of price data, the proposed method enhances forecasting performance.
(3) Comprehensive Experimental Validation: Extensive experiments on economic datasets demonstrate the effectiveness of the proposed approach. Results highlight the model’s ability to outperform traditional forecasting techniques by leveraging both textual and numerical inputs, offering deeper insights into market dynamics.
Figure 1 compares (b) our multimodal learning method with the existing (a) unimodal approach, demonstrating how this integration enhances the model’s ability to utilize diverse data sources and extract valuable insights, thereby improving the accuracy of time series forecasting.
The remainder of this paper is organized as follows: Section 2 provides a detailed exploration of existing methods in time series forecasting. Section 3 describes the proposed method and outlines the framework in detail. Section 4 discusses the dataset, presents the experimental results, and explores some notable findings. Finally, Section 5 concludes the paper.
2. Related Work
2.1. Time Series Forecasting
Given that time series prediction tasks hold paramount significance in real world applications, many classical approaches have been developed. The study [25] utilizes a hybrid ARIMA model that adopts the Markov process to construct the autoregressive model for iterative sequential forecasting. Nevertheless, the autoregressive process is incapable when handling complex sequences with non-linearity and non-stationarity. Then, machine learning (ML) methods have gained prominence in this field, convolutional neural networks (CNNs) and long short-term memory (LSTM) neural networks, as two typical deep learning models, have attracted significant attention in recent years due to their unique advantages in modeling the long-term time dependency of data characteristics and local adjacent correlation features in time series [26,27]. For example, [28] utilizes a deep long-short-term memory (DLSTM) architecture, enhanced by a genetic algorithm for optimal configuration, improving the forecasting accuracy of petroleum production.
Additionally, transformers have seen widespread adoption for time series analysis, demonstrating substantial advancements across various applications. Transformers leverage the self-attention mechanism to capture long-term dependencies in sequential data, enabling more efficient and accurate predictions [29,30]. For instance, PatchTST [31] introduces a patch-based input structure to reduce the quadratic complexity of attention calculations, improving transformer efficiency.
The iTransformer framework [32] introduces an inverted perspective for multivariate time series modeling, fundamentally redefining how Transformers process sequential data. Unlike traditional Transformer architectures, which treat all variables at a single time step as a single token (temporal token), iTransformer represents each variable’s entire historical sequence as an independent entity called a variate token. Figure 2 illustrates this inverted structure, highlighting how variate tokens and the attention mechanism enable the iTransformer to model multivariate correlations more effectively. This inversion shifts the focus from time-centered embeddings to variable-centered embeddings, aligning the modeling perspective with the inherent structure of time series data, where each variable often reflects a distinct process. By embedding the full sequence of each variable, the attention mechanism naturally captures cross-variable correlations (multivariate correlations), which are essential for understanding complex time series. This design effectively addresses challenges such as misaligned timestamps, limited receptive fields, and semantically sparse temporal tokens, which often weaken the modeling capacity of traditional Transformers for time series data.
While these advancements significantly improve time series forecasting, most methods rely solely on historical time series data, overlooking the potential contributions of external data sources. This limitation poses challenges in domains like economics, where external factors often play a pivotal role in influencing future trends.
2.2. Text-Enhanced Economic Time Series Forecasting
Multimodal learning, which incorporates both time series and textual corpora as input data sources, has generated significant interest for economic time series forecasting. Mostly, the focus has been primarily on sentiment analysis from financial news and social media to predict stock market trends [33]. In [34], a method that estimates social attention to stocks by sentiment analysis and influence modeling was proposed to predict the movement of the financial market. These methods treat the prediction as a classification problem, where the goal is to determine the direction of market movements based on sentiment polarity.
Moreover, when the objective shifts to forecasting specific future values of a time series, the task becomes a regression problem, which is inherently more challenging than simple directional predictions. Significant efforts have been made to enhance the accuracy of such forecasts. For instance, a study enhances stock forecasting by integrating external sentiment indicators derived from online text with traditional stock index series, showing improved accuracy on the Shanghai Stock Exchange Composite Index [35].
[36] introduced the Modality-aware transformer, a novel multimodal transformer-based model that utilizes both textual and numerical data to enhance time series forecasting. The model employs specialized attention mechanisms to focus on the most relevant features across different modalities, resulting in improved prediction accuracy demonstrated through extensive experiments on financial datasets. However, this study primarily relied on sentiment-based text processing, limiting the ability to fully leverage the nuanced information present in unstructured text.
While existing approaches have demonstrated the value of incorporating textual data, they often simplify textual inputs to sentiment polarity or other low-dimensional representations, potentially overlooking critical information. This paper addresses these limitations by proposing a novel framework that directly integrates textual and time series data using language models to extract high-dimensional features from text. Unlike sentiment-based methods, our approach comprehensively models the interactions between text and time series, capturing deeper insights into the factors influencing predictions.
3. Proposed Method
3.1. Problem Definition
The multivariate economic time series forecasting problem can be formulated as follows: Given historical time series data denoted as , where L is the fixed historical window, c is the number of variates, and denotes the value of the variate at time step. The forecasting task aiming to figure out the predicted series , where c denotes the number of variates, is the predicted result of the variate at the time step t, and H denotes the number of forecasting time steps. The ground truth for the time period from to is denoted as .
3.2. Proposed MM-iTransformer Framework
We propose MM-iTransformer, where MM stands for Multimodal, to overcome the limitations of existing time series forecasting models. This framework integrates textual embeddings derived from financial news and numerical embeddings from historical prices, providing a robust cross-modal approach to enhance predictive performance in economic applications (see Figure 3).
FinBERT for Textual Embeddings: To incorporate rich semantic information from financial news, we utilize FinBERT [37], a language model fine-tuned specifically for financial text. Unlike traditional sentiment analysis approaches, FinBERT captures nuanced financial terminology and contextual insights from complete news articles.
Given a set of historical news articles within a historical window of length L, each article , which is composed of word sequence, is processed through FinBERT to obtain its contextualized embedding. Specifically, we extract the [CLS] token’s last hidden state from FinBERT’s output, resulting in a d-dimensional vector that represents the overall context of the news at time t. This process yields a sequence of textual embeddings, as defined in Equation 1.
Each embedding encapsulates the semantic and contextual information of the corresponding news article, effectively capturing critical financial insights that may influence market movements.
Integration with Time Series Data: The core of MM-iTransformer lies in effectively integrating the textual embeddings with the historical time series data. The historical price data are embedded using Inverted Embed of iTransformer. Specifically, we describe these data as , where c is the number of numerical variables (e.g., different financial indicators). Our goal is to learn a function F that maps these inputs to future forecasts, as shown in Equation 2.
Here, represents the predicted future values over a forecast horizon H. To integrate textual and numerical data, we treat the textual embeddings as additional variate tokens, similar to how variables are represented in the inverted perspective of the iTransformer framework. This alignment allows us to leverage the attention mechanism to model cross-modal relationships effectively.
Cross-Attention Mechanism: The combined input consists of both numerical and textual embeddings concatenated along the variate (feature) dimension:
In the cross-attention mechanism, we compute the query (Q), key (K), and value (V) matrices using learned weight matrices, as shown in Equations 4, 5, and 6, respectively.
Here, and are learnable weight matrices for the queries, keys, and values, respectively. These matrices project the input features into appropriate representation spaces for attention computations. Note that and are distinct from the dimension d used for textual embeddings, as they specifically define the sizes of the query, key, and value projections within the attention mechanism:
- : The total number of variates, where c represents the numerical variables, and 1 represents the additional textual variable.
- : The dimensionality of the projected query, key, and value vectors within the attention head h. These dimensions control the representation capacity of the attention mechanism, influencing how relationships between input features (both textual and numerical) are modeled and how information is aggregated into output representations.
The attention scores are computed using the scaled dot-product attention mechanism proposed in [38], which evaluates the relevance between queries and keys. This mechanism enables the model to weigh the importance of each feature (both textual and numerical) when making predictions, effectively capturing cross-modal interactions between financial news and historical price data.
Balanced Contribution of Modalities: To prevent richer textual embeddings from dominating the learning process and overshadowing numerical data, we implement a strategy to balance the contributions of both modalities.
- Selective Incorporation of Textual Data: We include only the most recent news articles in the textual embeddings. Given that the latest news tends to have the most significant impact on future market movements, this approach reduces the noise of older articles and focuses the model on the most relevant information.
- Dimension Alignment: A linear layer is applied to the textual embeddings, adjusting their feature dimension to align with that of the time series embeddings. This ensures that, although the number of variables may differ between modalities, they can be directly concatenated along the variate dimension without any dimensional mismatch.
The combined embeddings are then fed into the MM-iTransformer model, which processes them through multiple layers of attention and feed-forward networks to produce the final forecasts . The details are outlined in Algorithm 1.
| Algorithm 1 Modalities Fusion under the MM-iTransformer Framework |
|
4. Experiment
4.1. Datasets
In the economic domain, despite the abundance of news text and historical pricing data, there is a notable lack of publicly available datasets that directly correlate these two types of information, especially in analyzing the impact of textual news on economic indicators. To validate the ideas presented, we developed two specialized datasets.
The first dataset focuses on gold price forecasting and investigates the interactions between key economic events in major global economies—Canada, Japan, the US, Russia, the European Union and China—and fluctuations in gold prices. This dataset, covering the period from January 2019 to December 2023, captures how economic news from these influential regions impacts the volatile gold market1. The second dataset targets forex forecasting, compiling relevant economic information2 from the US, Britain, Japan, and other developed countries. It includes news on all available indicators, reflecting past economic data3 and volatility assessments, providing a comprehensive view of global forex dynamics.
The original structured data, as illustrated in Table 1, could not be directly utilized due to format incompatibilities with language models, which are primarily designed to process and generate natural language text. Therefore, for both datasets, the construction process involved:
- Data Extraction and Transformation: We extracted raw data from existing public sources, comprising the date of the economic event, the country, event type, and associated economic indicators (actual and previous values).
- Descriptive Text Generation: For each record, detailed descriptive text was generated using a predefined template. This template incorporates the event’s date, name, the current reported indicator value, and its comparison to the previous value. For example, for January 1, 2019, the entry reads: “On 01/01/19, the Caixin Manufacturing PMI for December was reported at 49.70, down from the previous value of 50.20, indicating a decrease of 0.50.” This approach not only provides the numerical data but also emphasizes the significance of the change in indicators.
- Change Calculation: To highlight the importance of fluctuations in economic indicators, we calculated the difference between reported values and previous values, incorporating this variance directly into each event’s textual description.
- Alignment with Historical Prices: We aligned these textual descriptions with corresponding historical price data in the time dimension. For dates on which no event-related text was available, we inserted a placeholder phrase (“no news”) to maintain dataset completeness and temporal continuity.
Ultimately, we developed two datasets tailored to financial market analysis. The first dataset focuses exclusively on gold prices, consisting of 1352 samples. The second dataset encompasses foreign exchange indices from three regions, totaling 2347 samples. Each dataset offers a structured compilation of the relevant financial data paired with detailed economic event descriptions to enhance the analysis of market behaviors and trends.
4.2. Evaluation Metrics
To assess the performance of the forecasting models, we adopt four evaluation metrics: Mean Squared Error (MSE), Root Mean Square Error (RMSE), Mean Absolute Error (MAE), and Mean Absolute Percentage Error (MAPE). MSE focuses on larger prediction errors, making it sensitive to outliers. RMSE provides an interpretable error magnitude by aligning the scale of errors with the original data. MAE offers a balanced view by equally weighting errors of different magnitudes, while MAPE expresses errors as a percentage of the actual values, indicating the average deviation in percentage terms. These metrics are defined as follows:
where and denote the actual and predicted values, respectively, and n is the total number of samples.
4.3. Experimental Settings
The proposed framework is trained using the MSE loss function and optimized with the ADAM [39], initialized with a learning rate of . Considering the small size of our datasets compared to mainstream configurations, we conducted an evaluation using varying prediction horizons days to determine the most practical forecast horizon for economic forecasting. As illustrated in Figure 4, based on the performance metrics and the practical utility of the predictions, we selected the 12-day prediction horizon. The time series historical window was set at 96 days, providing a comprehensive temporal context for generating accurate and actionable forecasts.
As described in Section 3.2, we incorporated only the most recent day’s news as textual input. Aligning textual inputs with the full historical window would produce text embeddings with dimensions far exceeding those of the time series features, creating an imbalance between the two modalities and hindering effective fusion.
4.4. Baselines
To evaluate the effectiveness of the proposed MM-iTransformer, we compare its performance with the baseline iTransformer model. This analysis highlights the added value of incorporating textual information into economic forecasting through our multimodal approach.
In addition to the iTransformer and MM-iTransformer comparison, we employed several classical and baseline methods for further evaluation. First, we used the ARIMA model [40], a well-established approach for time series forecasting, to assess the advantages of transformer-based architectures over traditional statistical models. Additionally, we included the random walk model [41], a widely-used benchmark in financial forecasting, to establish a baseline and quantify the predictive improvements achieved by our proposed MM-iTransformer framework.
4.5. Experimental Results
This study compares the MM-iTransformer framework with the iTransformer, ARIMA, and the Random Walk Model using Forex and Gold-price datasets. We primarily focus on the Mean Squared Error (MSE), as the models are trained using this metric. Additionally, we evaluate their predictive capabilities using Mean Absolute Error (MAE), Root Mean Squared Error (RMSE), and Mean Absolute Percentage Error (MAPE). The results, presented in Table 2, show:
- Comparison between MM-iTransformer and iTransformer: The MM-iTransformer integrates textual data with historical price data and demonstrated superior performance over the iTransformer. On the Forex dataset, it reduced the MSE from 0.022 to 0.019, showing a 13.64% reduction. For the Gold-price dataset, the MSE was reduced from 0.065 to 0.057, a reduction of 12.31%. These results highlight the significant benefits of incorporating textual data into forecasting models, enhancing the MM-iTransformer’s accuracy and robustness.
- Single-variable and Multi-variable Prediction Performance: MM-iTransformer excelled in both single-variable (Gold-price) and multi-variable (Forex) predictions, affirming its capability to utilize textual data effectively. This inclusion provides additional predictive signals, enabling the model to capture market dynamics more accurately than using historical price data alone.
- Comparison with Classical Models: Compared to classical models, both the MM-iTransformer and iTransformer exhibited superior performance, with MM-iTransformer consistently achieving the lowest MSE across datasets. However, the iTransformer did not consistently outperform the Random Walk Model on the Forex dataset, possibly due to difficulties in adapting to abrupt market changes—a scenario where the Random Walk Model, which assumes price continuity, may have an advantage.
In summary, the MM-iTransformer framework marks a significant advancement in economic forecasting by leveraging multimodal data, particularly through the integration of textual information. This study confirms the potential of advanced deep learning techniques to revolutionize financial market predictions by incorporating diverse data types.
Ablation study: To assess the impact of temporally aligned news on prediction accuracy, we conducted an ablation study by randomizing the order of news texts within the time series window. This change disrupts the contextual relevance of the news data, simulating scenarios where financial news is not aligned with historical market prices. By removing this alignment, we could isolate and examine the specific effect of temporal relevance of textual inputs on forecasting performance.
As shown in Table 3, using randomized news texts shows a clear decline in performance compared to temporally aligned news. In the Gold-price dataset, the MSE increases to 0.069, and for the Forex dataset, it increases to 0.021 when random news is used. This indicates that non-contextual, misaligned news does not contribute meaningfully to prediction accuracy and may even reduce it. The observed rise in error rates underscores the critical role of temporal alignment, affirming that relevant, timely news data significantly enhances forecasting accuracy.
Statistical Significance Analysis of Textual Data Integration: To rigorously ascertain the impact of integrating textual data into economic forecasting models, we utilized the Diebold-Mariano (DM) test to statistically evaluate the enhancements observed with the MM-iTransformer compared to the traditional iTransformer. The DM test results are summarized in Table 4, where the DM statistics for both the Gold-price and Forex datasets are presented.
The DM test results show statistically significant improvements in forecasting accuracy when textual data is integrated. Specifically, the Gold-price dataset yielded a DM statistic of 2.030 with a p-value of 0.043, and the Forex dataset exhibited a DM statistic of 3.010 with a p-value of 0.003. These results indicate that the improvements in predictive performance with the MM-iTransformer, which incorporates textual data, are statistically significant compared to the iTransformer, which relies solely on historical price data.
These findings provide statistical evidence that supports the hypothesis that textual integration enhances the ability of forecasting models to capture complex market dynamics more effectively than models relying on time-series data alone. This validation confirms the relevance and efficacy of incorporating textual data into economic forecasting models, reinforcing the value of multimodal approaches in enhancing prediction accuracy.
Analysis of Historical Window Lengths: To assess model performance stability, we experimented with various historical window lengths ranging from 36 to 384 days on the Gold-Price and Forex datasets. The results indicate that shorter windows typically result in lower loss, with a 96-day window yielding optimal performance, as shown in Figure 5. Extending the window beyond 96 days led to increased errors from outdated and less relevant data, which is detrimental for short-term forecasting.
The sizes of our datasets—1352 samples for gold prices and 2347 for Forex—also guided our choice of window length to avoid overfitting. Larger windows risk models memorizing specific data features instead of generalizing from underlying patterns, reducing their effectiveness on unseen data. Furthermore, we did not opt for smaller windows as they could miss significant economic cycles and trends crucial for robust predictions. The chosen 96-day window provides a balanced approach, capturing essential market dynamics without the noise and overfitting associated with longer windows. This balance facilitates efficient learning and reliable forecasting, making it well-suited for our dataset constraints.
Example Forecasting Results:Figure 6 presents a detailed comparison of forecasting outcomes from the MM-iTransformer and iTransformer models applied to Forex datasets. The graphs illustrate a marked improvement in prediction accuracy through the integration of textual data. Specifically, the MM-iTransformer, which incorporates textual inputs alongside historical price data, demonstrates superior alignment with actual market trends and captures future price movements with significantly higher precision compared to the iTransformer, which relies solely on historical price data. This visual representation compellingly demonstrates how integrating relevant textual information can substantially enhance a model’s ability to comprehend and predict market dynamics, leading to more precise forecasts.
5. Conclusion
This study has successfully demonstrated the significant potential of integrating textual data into economic time series forecasting with the proposed MM-iTransformer. We have shown that incorporating textual information markedly enhances forecasting accuracy. Our findings underscore that the inclusion of news text not only aligns with the inherently multimodal nature of economic forecasting but also significantly improves predictive accuracy, as evidenced by the notable reduction in MSE for both the gold price and foreign exchange datasets.
However, we acknowledge certain limitations in this study, particularly concerning the scope and synchronization of the datasets used. While our results validate the utility of textual information for forecasting, the relatively limited scope of our datasets may not fully encompass the diverse and region-specific characteristics of global financial markets. Furthermore, the challenge of aligning textual data with time series data is exacerbated by the scarcity of large, well-structured, and temporally synchronized datasets in the financial sector.
To overcome these limitations, we plan to develop a larger, more comprehensive dataset in future work. This enhanced dataset will aim to better synchronize region-specific and real-time news data with financial time series, providing a more robust basis for evaluating and validating the proposed method. Through these efforts, we hope to further advance the field of multimodal economic forecasting by leveraging a broader spectrum of synchronized data, thereby enriching our understanding and predictive capabilities within this complex domain.
Author Contributions
Conceptualization, S.M. and Q.X.; methodology, S.M.; software, S.M. and Q.X.; validation, S.M., J.C., and Y.A.; formal analysis, J.C. and Y.A.; investigation, S.M.; resources, J.C. and Y.A.; data curation, S.M. and T.T.; writing—original draft preparation, S.M.; writing—review and editing, J.C. and Y.A.; visualization, J.C. and Y.A.; supervision, T.T.; project administration, T.T.; funding acquisition, T.T. All authors have read and agreed to the published version of the manuscript.
Funding
This research received no external funding.
Institutional Review Board Statement
Not applicable.
Informed Consent Statement
Not applicable
Data Availability Statement
The datasets analyzed during the current study are available in publicly accessible repositories. These datasets can be found at the following URLs: https://www.kaggle.com/datasets/devorvant/economic-calendar, https://www.kaggle.com/datasets/brunotly/foreign-exchange-rates-per-dollar-20002019, and https://www.kaggle.com/datasets/fekihmea/the-effect-of-economic-news-on-gold-prices/data.
Conflicts of Interest
The authors declare no conflicts of interest.
Abbreviations
The following abbreviations are used in this manuscript:
| EMH | Efficient Market Hypothesis |
| ARIMA | Autoregressive Integrated Moving Average |
| SVM | Support Vector Machines |
| RNN | Recurrent Neural Network |
| LSTM | Long Short-Term Memory |
| NLP | Natural Language Processing |
| ML | Machine Learning |
| CNN | Convolutional Neural Networks |
| DLSTM | Deep Long Short-Term Memory |
| SVR | Support Vector Regression |
| OLS | Ordinary Least Squares |
| MLP | Multi-Layer Perceptron |
| MAE | Mean Absolute Error |
| MSE | Mean Squared Error |
| RMSE | Root Mean Squared Error |
| MAPE | Mean Absolute Percentage Error |
References
- Kelany, O.; Aly, S.; Ismail, M.A. Deep learning model for financial time series prediction. International conference on innovations in information technology (IIT) 2020, 120–125. [Google Scholar]
- Alghamdi, T.; Mostafi, S.; Abdelkader, G.; Elgazzar, K. A comparative study on traffic modeling techniques for predicting and simulating traffic behavior. Future Internet 2022, 294. [Google Scholar] [CrossRef]
- Ma, K.; Pang, X.; Pang, H.; Lv, C.; Gao, T.; Chen, J.; Huo, X.; Cong, Q.; Jiang, M. A novel method for favorable zone prediction of conventional hydrocarbon accumulations based on RUSBoosted tree machine learning algorithm. Applied Energy 2022, 119983. [Google Scholar] [CrossRef]
- Volkova, S.; Ayton, E.; Porterfield, K.; Corley, C.D. Forecasting influenza-like illness dynamics for military populations using neural networks and social media. PloS one 2017, e0188941. [Google Scholar] [CrossRef] [PubMed]
- Fama, E.F. Efficient capital markets: A review of theory and empirical work. The journal of Finance 1970, 383–417. [Google Scholar] [CrossRef]
- Phan, D.H.B.; Sharma, S.S.; Narayan, P.K. Stock return forecasting: Some new evidence. International Review of Financial Analysis 2015, 40, 38–51. [Google Scholar] [CrossRef]
- Wang, J.J.; Wang, J.Z.; Zhang, Z.G.; Guo, S.P. Stock index forecasting based on a hybrid model. Omega 2012, 758–766. [Google Scholar] [CrossRef]
- Nava, N.; Matteo, T.D.; Aste, T. Financial time series forecasting using empirical mode decomposition and support vector regression. Risks 2018, 7. [Google Scholar] [CrossRef]
- He, H.; Gao, S.; Jin, T.; Sato, S.; Zhang, X. A seasonal-trend decomposition-based dendritic neuron model for financial time series prediction. Applied Soft Computing 2021, 107488. [Google Scholar] [CrossRef]
- Mondal, P.; Shit, L.; Goswami, S. Study of effectiveness of time series modeling (ARIMA) in forecasting stock prices. International Journal of Computer Science, Engineering and Applications 2014, 13. [Google Scholar] [CrossRef]
- Khan, S.; Alghulaiakh, H. ARIMA model for accurate time series stocks forecasting. International Journal of Advanced Computer Science and Applications 2020. [Google Scholar] [CrossRef]
- Aneiros-Perez, G.; Vieu, P. Nonparametric time series prediction: A semi-functional partial linear modeling. Journal of Multivariate Analysis 2008, 834–857. [Google Scholar] [CrossRef]
- Bhardwaj, G.; Swanson, N.R. An empirical investigation of the usefulness of ARFIMA models for predicting macroeconomic and financial time series. Journal of econometrics 2006, 539–578. [Google Scholar] [CrossRef]
- Pai, P.F.; Lin, C.S. A hybrid ARIMA and support vector machines model in stock price forecasting. Omega 2005, 497–505. [Google Scholar] [CrossRef]
- Widiputra, H.; Mailangkay, A.; Gautama, E. Multivariate CNN-LSTM Model for Multiple Parallel Financial Time-Series Prediction. Complexity 2021, 9903518. [Google Scholar] [CrossRef]
- Vidal, A.; Kristjanpoller, W. Gold volatility prediction using a CNN-LSTM approach. Expert Systems with Applications 2020, 113481. [Google Scholar] [CrossRef]
- Zeng, Z.; Kaur, R.; Siddagangappa, S.; Rahimi, S.; Balch, T.; Veloso, M. Financial time series forecasting using cnn and transformer. arXiv 2023, arXiv:2304.04912 2023. [Google Scholar]
- Lezmi, E.; Xu, J. Time series forecasting with transformer models and application to asset management. Available at SSRN 4375798 2023. [Google Scholar] [CrossRef]
- Kloptchenko, A.; Eklund, T.; Karlsson, J.; Back, B.; Vanharanta, H.; Visa, A. Combining data and text mining techniques for analysing financial reports. Intelligent Systems in Accounting, Finance & Management: International Journal 2004, 29–41. [Google Scholar]
- Liapis, C.M.; Karanikola, A.; Kotsiantis, S. Investigating deep stock market forecasting with sentiment analysis. Entropy 2023, 219. [Google Scholar] [CrossRef]
- Farimani, S.A.; Jahan, M.V.; Fard, A.M.; Tabbakh, S.R.K. Investigating the informativeness of technical indicators and news sentiment in financial market price prediction. Knowledge-Based Systems 2022, 108742. [Google Scholar] [CrossRef]
- Reis Filho, I.J.; Marcacini, R.M.; Rezende, S.O. On the enrichment of time series with textual data for forecasting agricultural commodity prices. MethodsX 2022, 101758. [Google Scholar] [CrossRef] [PubMed]
- Baranowski, P.; Bennani, H.; Doryń, W. Do the ECB’s introductory statements help predict monetary policy? Evidence from a tone analysis. European Journal of Political Economy 2021, 101964. [Google Scholar] [CrossRef]
- Erfanian, S.; Zhou, Y.; Razzaq, A.; Abbas, A.; Safeer, A.A.; Li, T. Predicting bitcoin (BTC) price in the context of economic theories: A machine learning approach. Entropy 2022, 1487. [Google Scholar] [CrossRef] [PubMed]
- Alizadeh, M.; Rahimi, S.; Ma, J. A hybrid ARIMA–WNN approach to model vehicle operating behavior and detect unhealthy states. Expert Systems with Applications 2022, 116515. [Google Scholar] [CrossRef]
- Munir, M.; Siddiqui, S.A.; Dengel, A.; Ahmed, S. DeepAnT: A deep learning approach for unsupervised anomaly detection in time series. IEEE Access 2018, 1991–2005. [Google Scholar] [CrossRef]
- Bandara, K.; Bergmeir, C.; Hewamalage, H. LSTM-MSNet: Leveraging forecasts on sets of related time series with multiple seasonal patterns. IEEE transactions on neural networks and learning systems 2020, 1586–1599. [Google Scholar] [CrossRef] [PubMed]
- Sagheer, A.; Kotb, M. Time series forecasting of petroleum production using deep LSTM recurrent networks. Neurocomputing 2019, 203–213. [Google Scholar] [CrossRef]
- Kitaev, N.; Kaiser; Levskaya, A. Reformer: The efficient transformer. arXiv 2020, arXiv:2001.04451 2020. [Google Scholar]
- Wu, H.; Xu, J.; Wang, J.; Long, M. Autoformer: Decomposition transformers with auto-correlation for long-term series forecasting. Advances in neural information processing systems 2021, 22419–22430. [Google Scholar]
- Nie, Y.; Nguyen, N.H.; Sinthong, P.; Kalagnanam, J. A time series is worth 64 words: Long-term forecasting with transformers. arXiv 2022, arXiv:2211.14730 2022, pp. 22419–22430, 22419–22430. [Google Scholar]
- Liu, Y.; Hu, T.; Zhang, H.; Wu, H.; Wang, S.; Ma, L.; Long, M. itransformer: Inverted transformers are effective for time series forecasting. arXiv 2023, arXiv:2310.06625 2023. [Google Scholar]
- Akita, R.; Yoshihara, A.; Matsubara, T.; Uehara, K. Deep learning for stock prediction using numerical and textual information. 2016 IEEE/ACIS 15th International Conference on Computer and Information Science (ICIS), 2016, pp. 1–6.
- Zhang, L.; Zhang, L.; Xiao, K.; Liu, Q. Forecasting price shocks with social attention and sentiment analysis. IEEE/ACM International Conference on Advances in Social Networks Analysis and Mining (ASONAM) 2016, 559–566. [Google Scholar]
- Wang, Y. Stock market forecasting with financial micro-blog based on sentiment and time series analysis. Journal of Shanghai Jiaotong University (Science) 2017, 173–179. [Google Scholar]
- Emami, H.; Dang, X.H.; Shah, Y.; Zerfos, P. Modality-aware Transformer for Time series Forecasting. arXiv 2023, arXiv:2310.01232 2023. [Google Scholar]
- Liu, Z.; Huang, D.; Huang, K.; Li, Z.; Zhao, J. Finbert: A pre-trained financial language representation model for financial text mining. Proceedings of the twenty-ninth international conference on international joint conferences on artificial intelligence, 2021, pp. 4513–4519.
- Vaswani, A. Attention is all you need. Advances in Neural Information Processing Systems 2017. [Google Scholar]
- Kingma, D.P.; Ba, J. Adam: A method for stochastic optimization. arXiv 2014, arXiv:1412.6980 2014. [Google Scholar]
- Box, G.E.; Jenkins, G.M.; Reinsel, G.C.; Ljung, G.M. Time series analysis: forecasting and control; John Wiley & Sons, 2015. [Google Scholar]
- Hull, J.C.; Basu, S. Options, futures, and other derivatives; Pearson Education India, 2016. [Google Scholar]
| 1 | |
| 2 | |
| 3 |
Figure 1.
Time series forecasting framework.
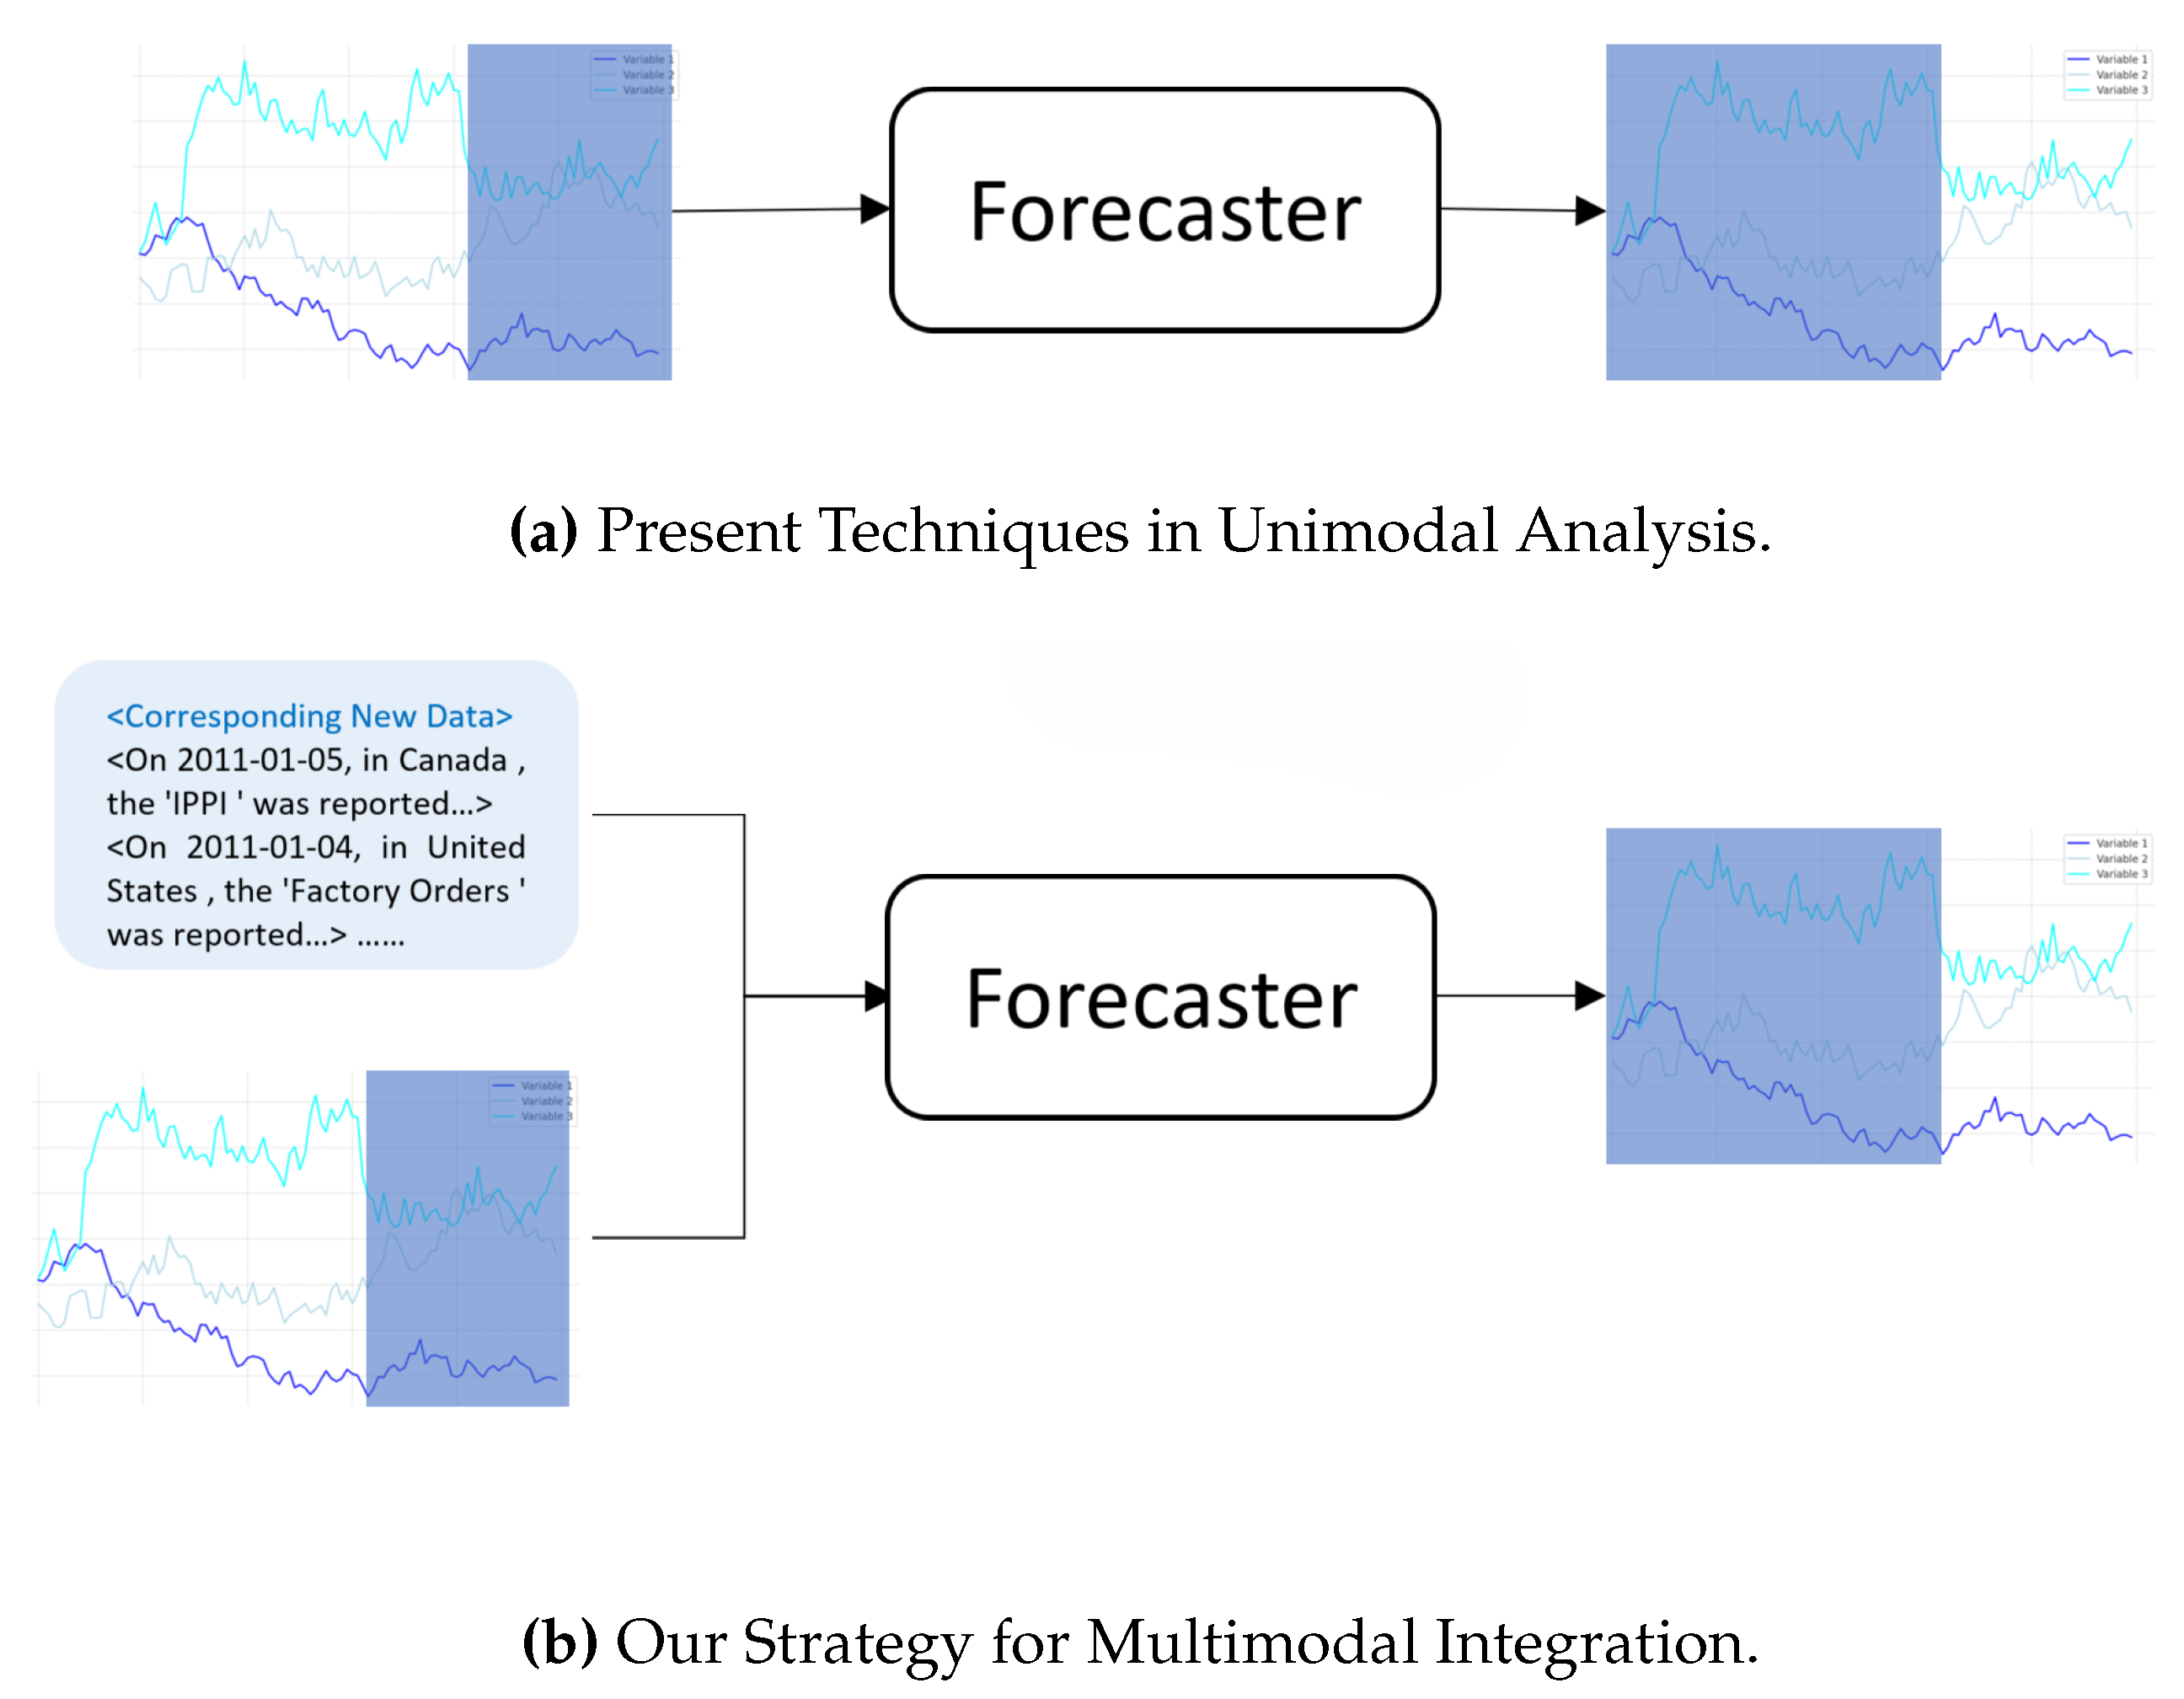
Figure 2.
Comparison of temporal and variate token embedding approaches in vanilla Transformer and iTransformer.
Figure 2.
Comparison of temporal and variate token embedding approaches in vanilla Transformer and iTransformer.
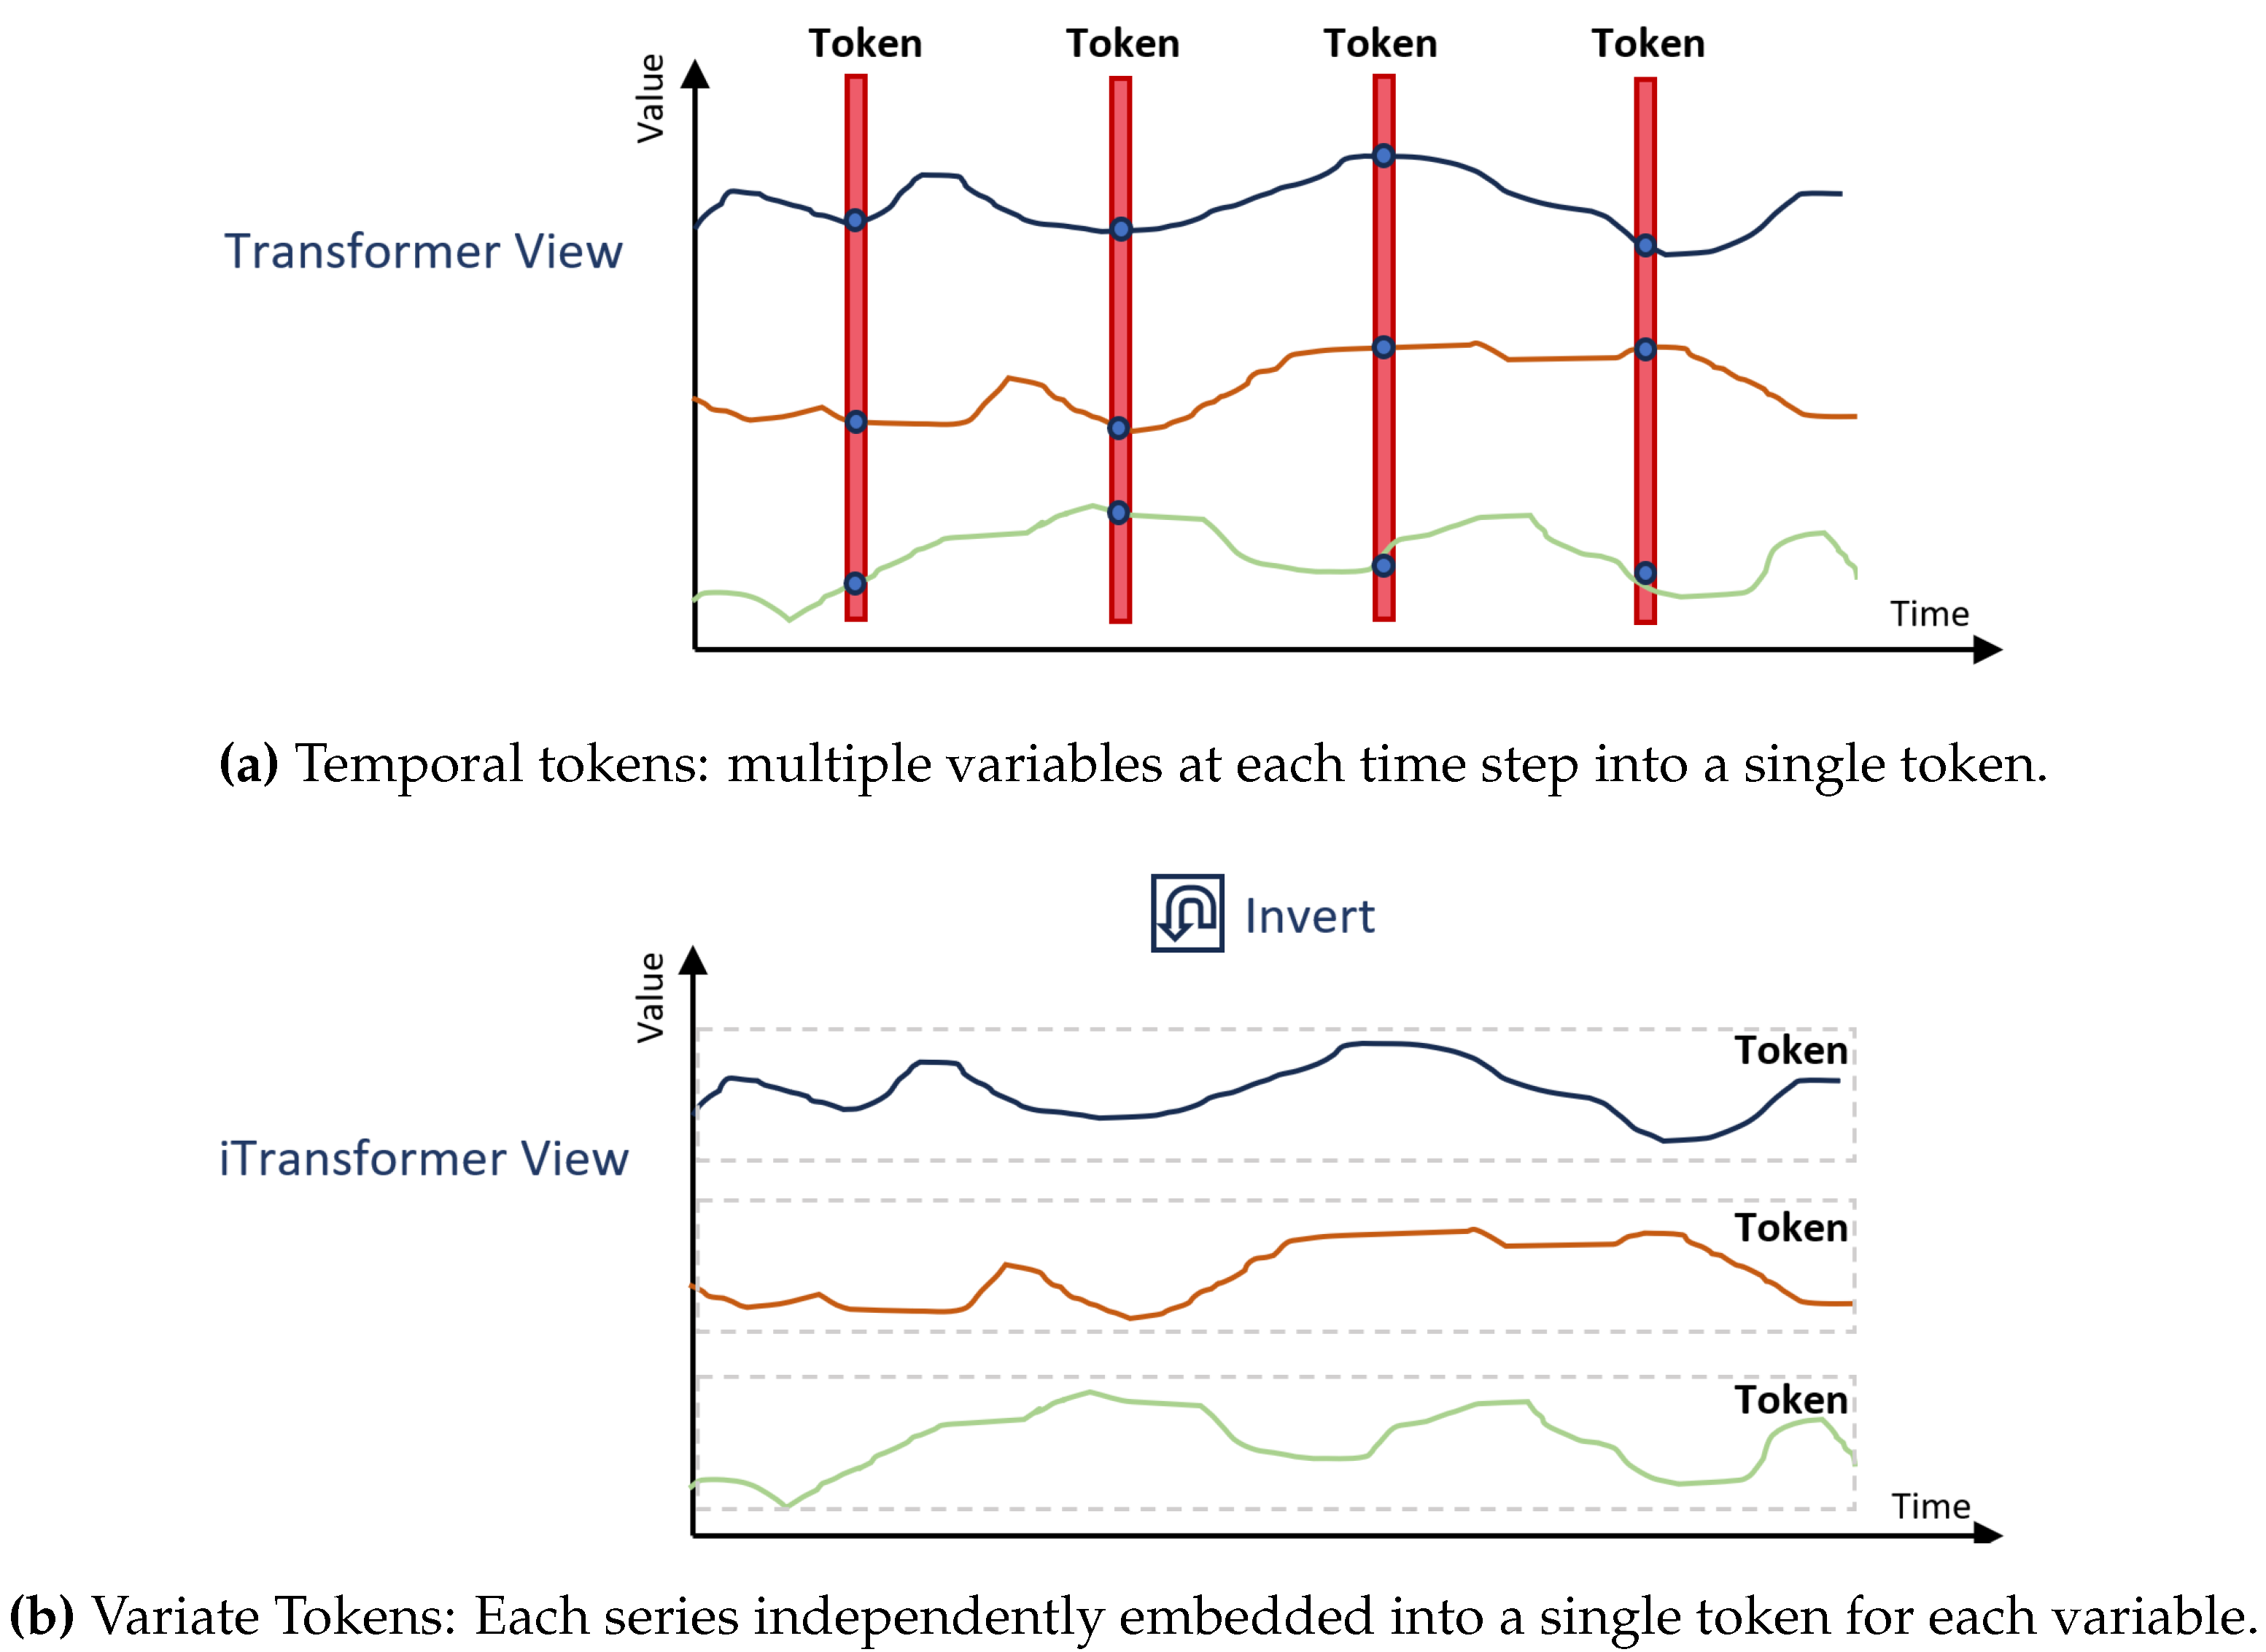
Figure 3.
The Workflow of MM-iTransformer: FinBERT Embed generates textual embeddings, Inverted Embed represents price data as variate tokens, and the Multivariate Correlations Map captures interactions for forecasting.
Figure 3.
The Workflow of MM-iTransformer: FinBERT Embed generates textual embeddings, Inverted Embed represents price data as variate tokens, and the Multivariate Correlations Map captures interactions for forecasting.
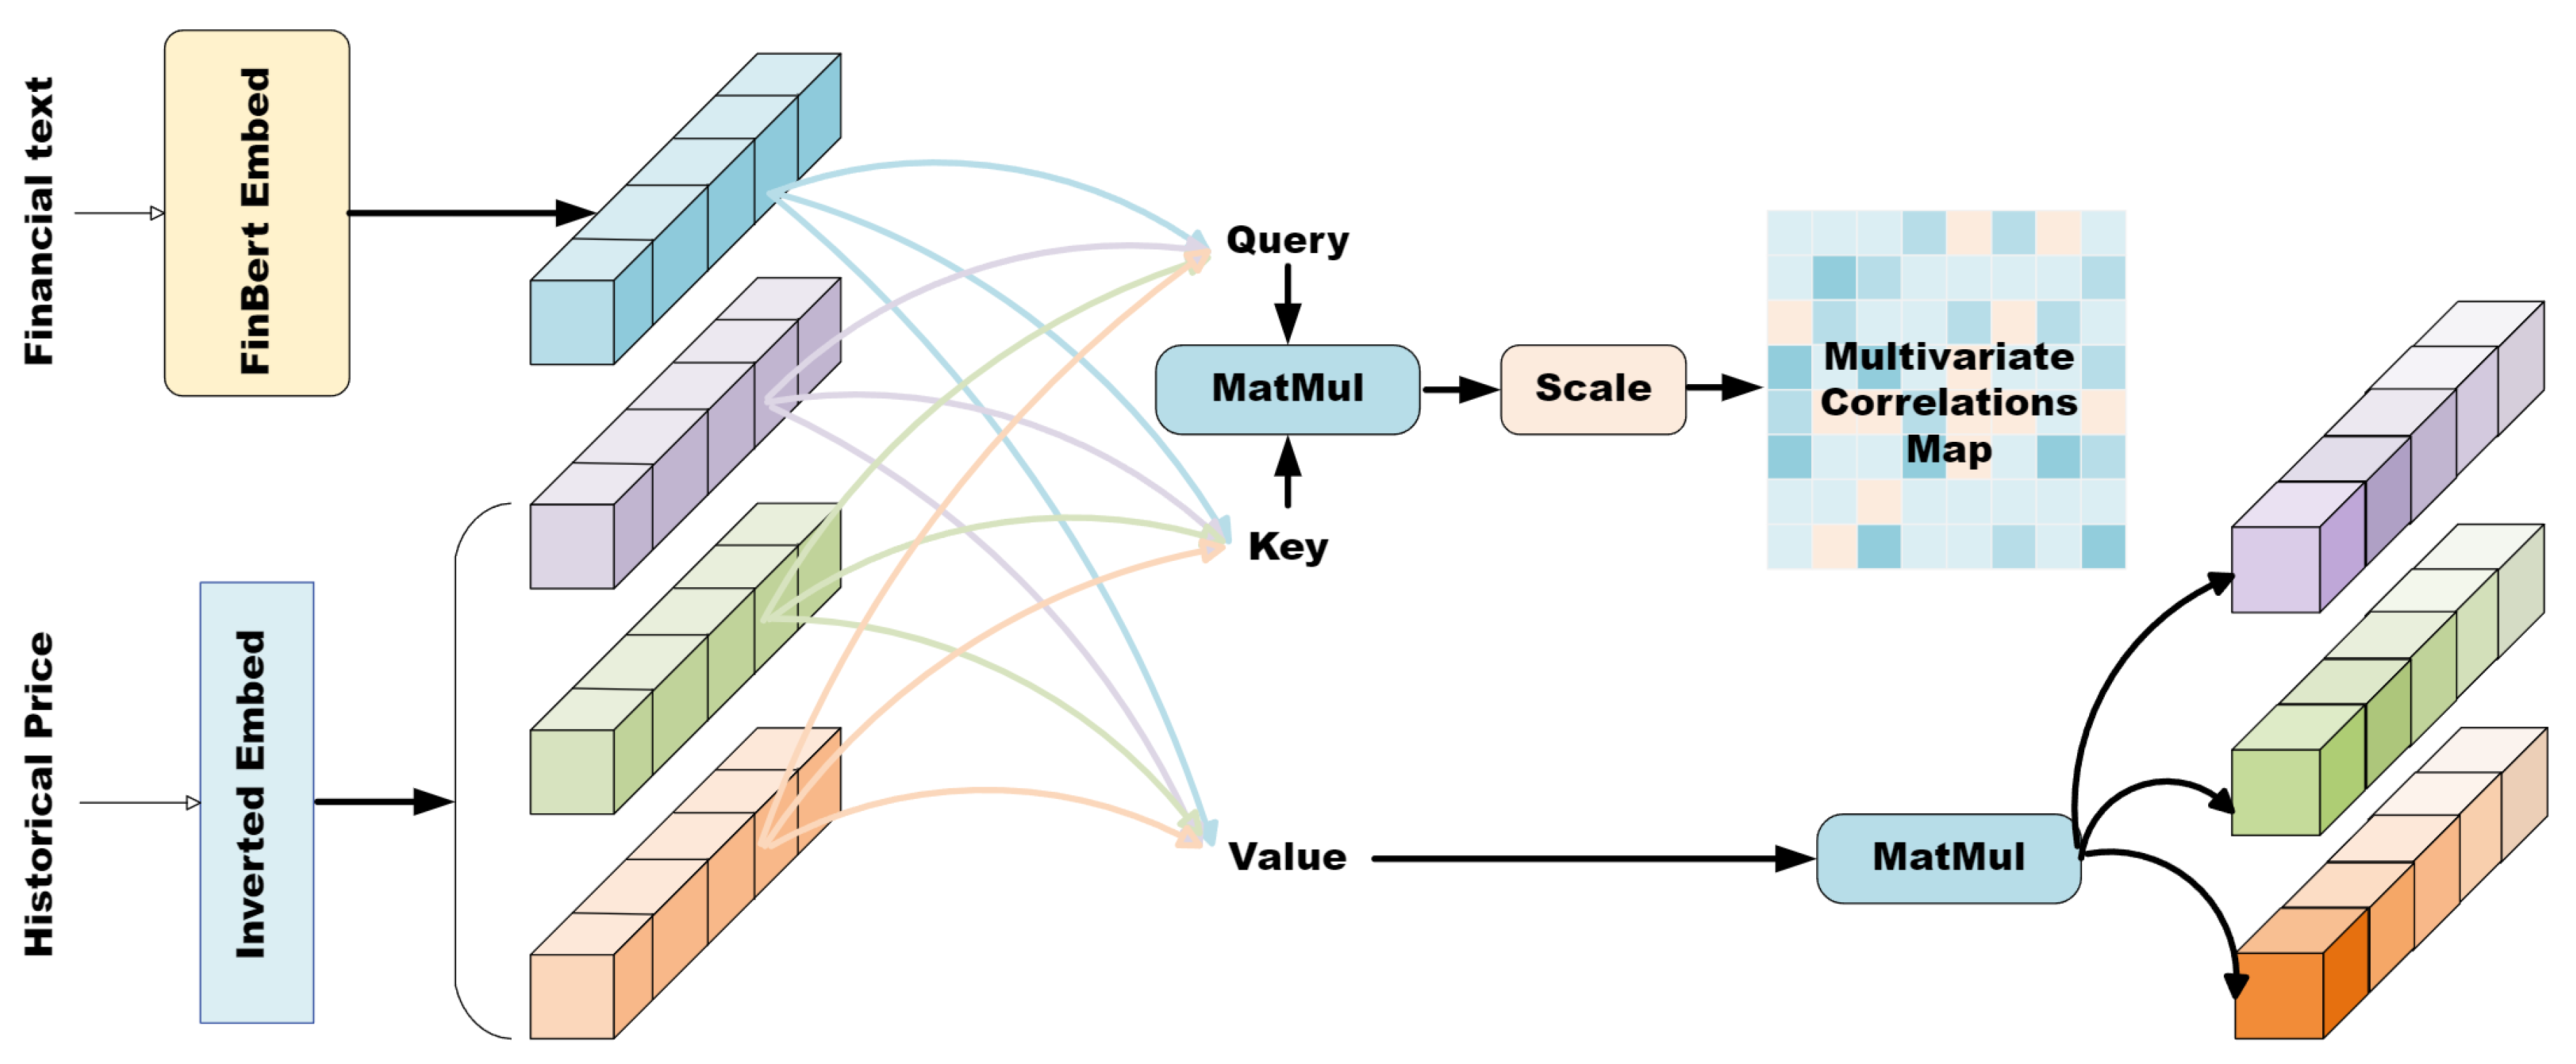
Figure 4.
Using a historical window of days and forecast horizons days for MM-iTransformer.
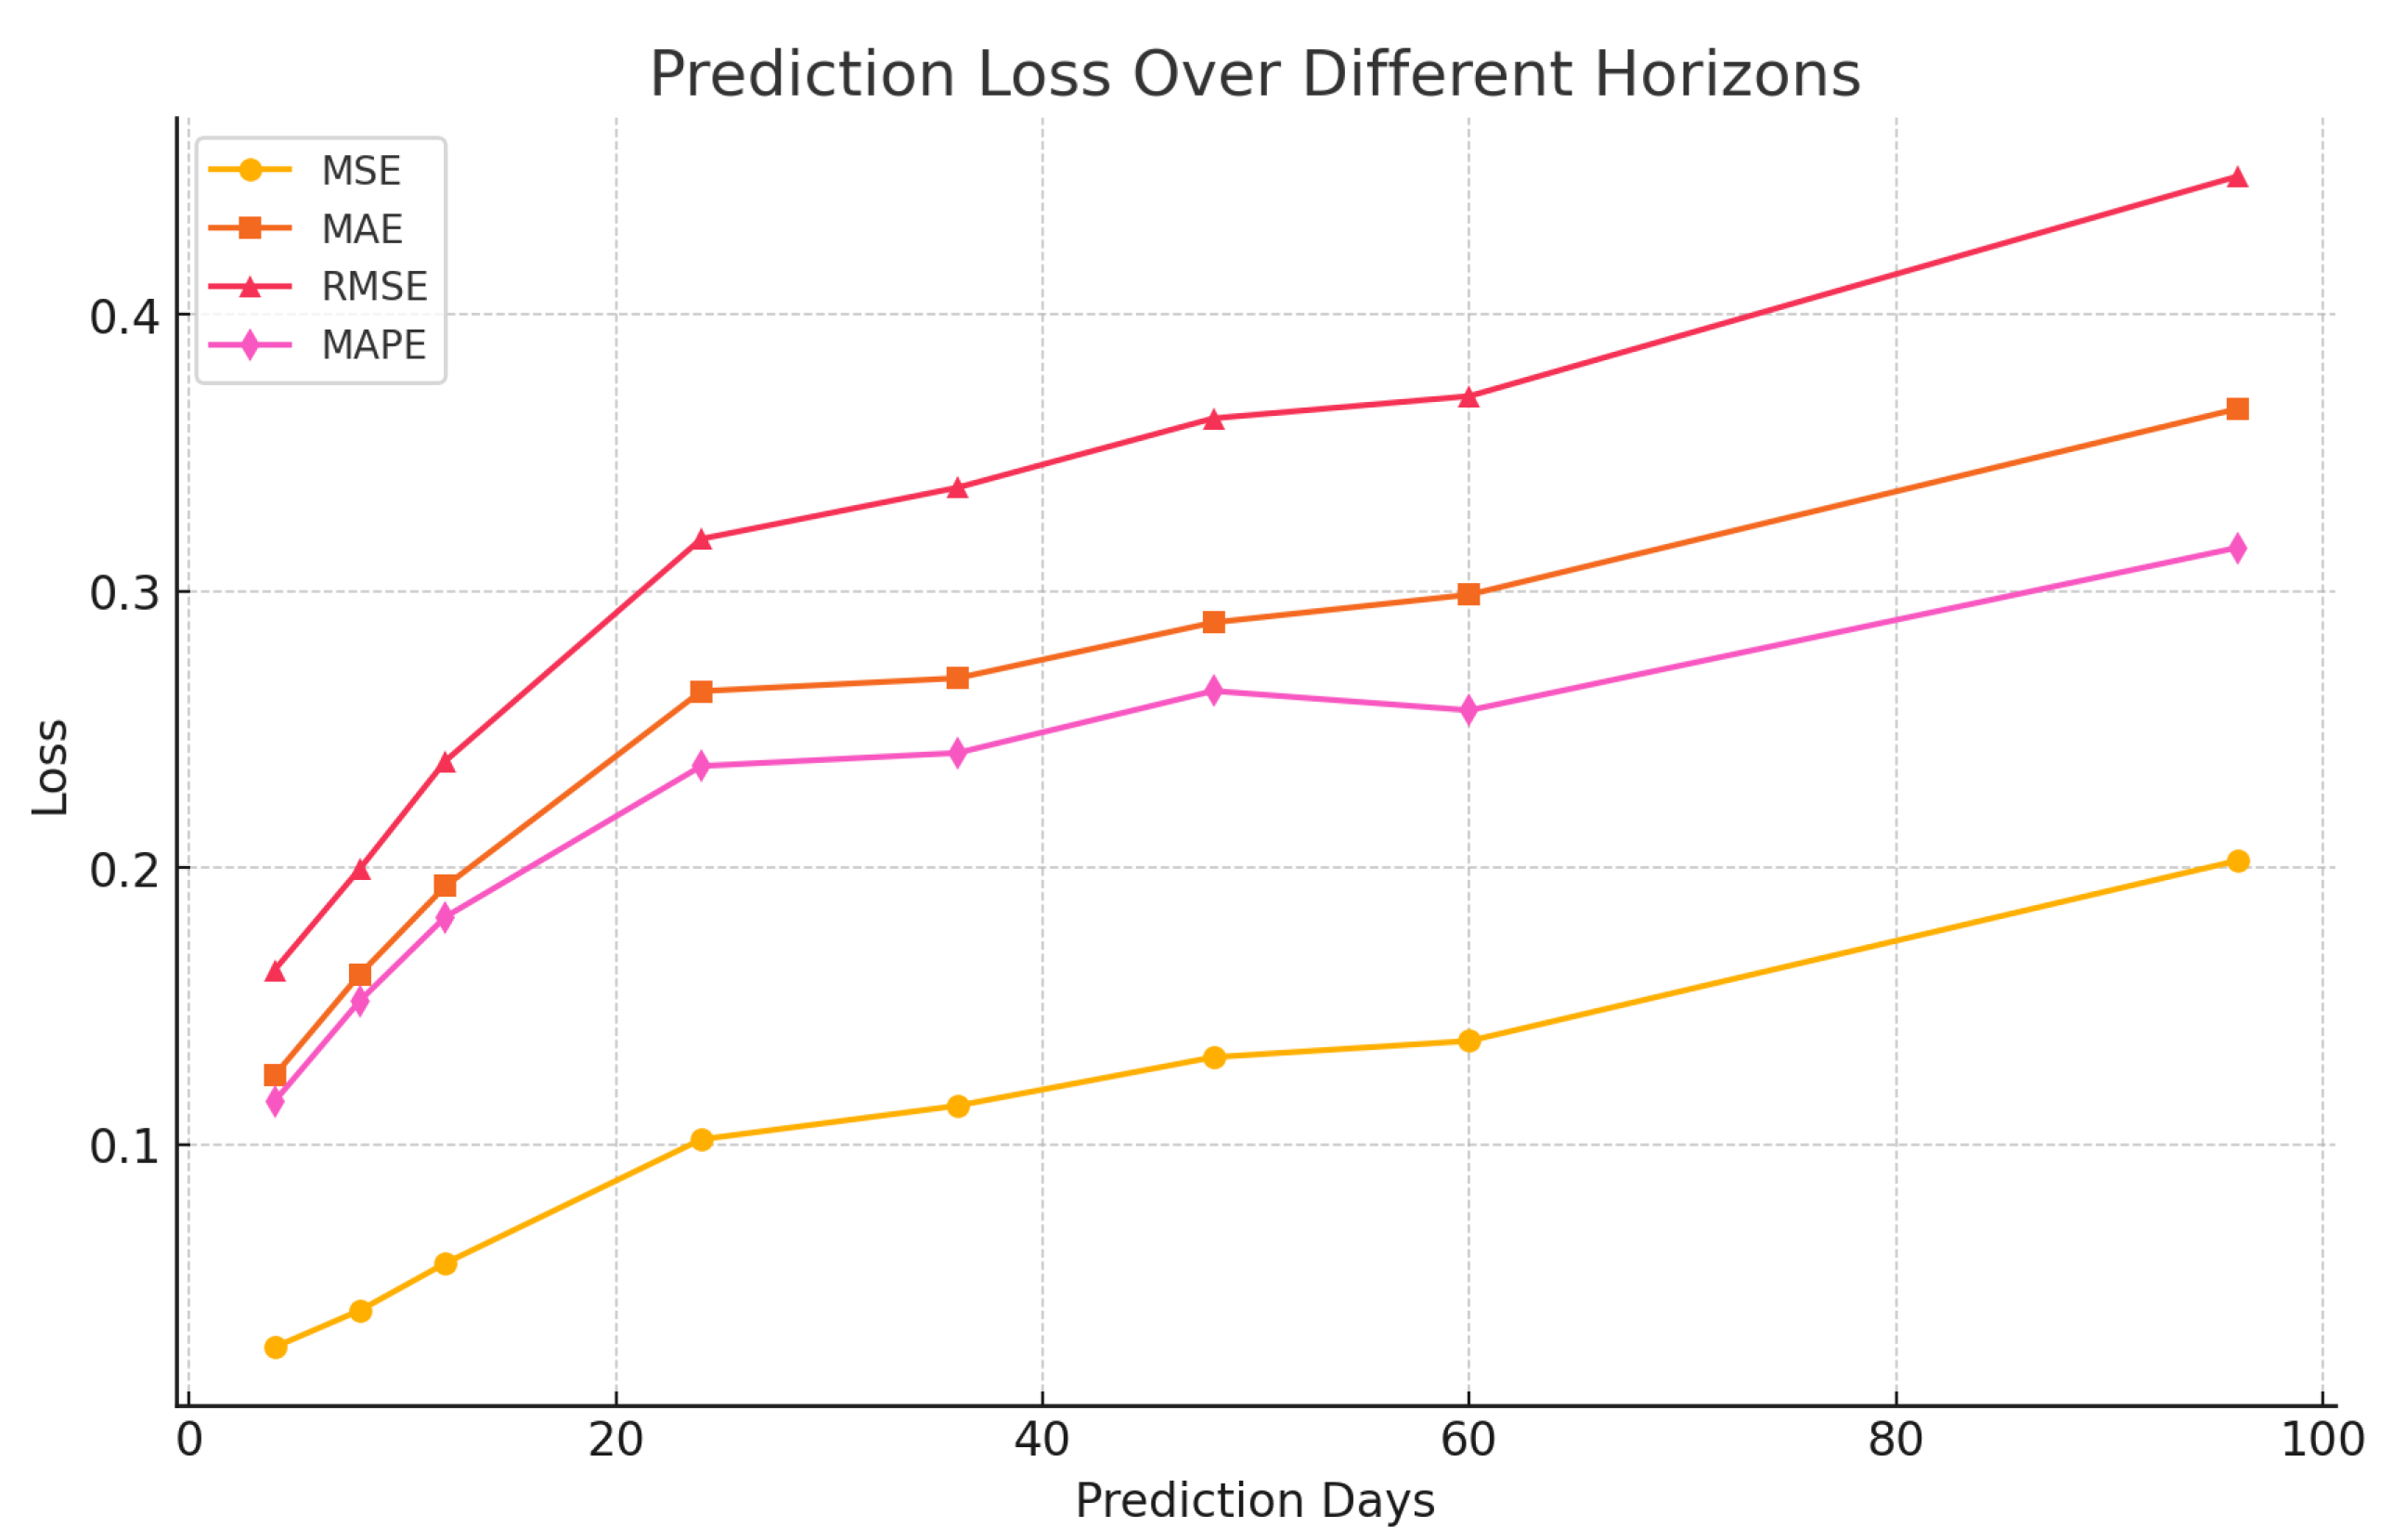
Figure 5.
Comparison of model performance with different historical window lengths () on the Forex and Gold-Price datasets for a 12-day forecast horizon ().
Figure 5.
Comparison of model performance with different historical window lengths () on the Forex and Gold-Price datasets for a 12-day forecast horizon ().
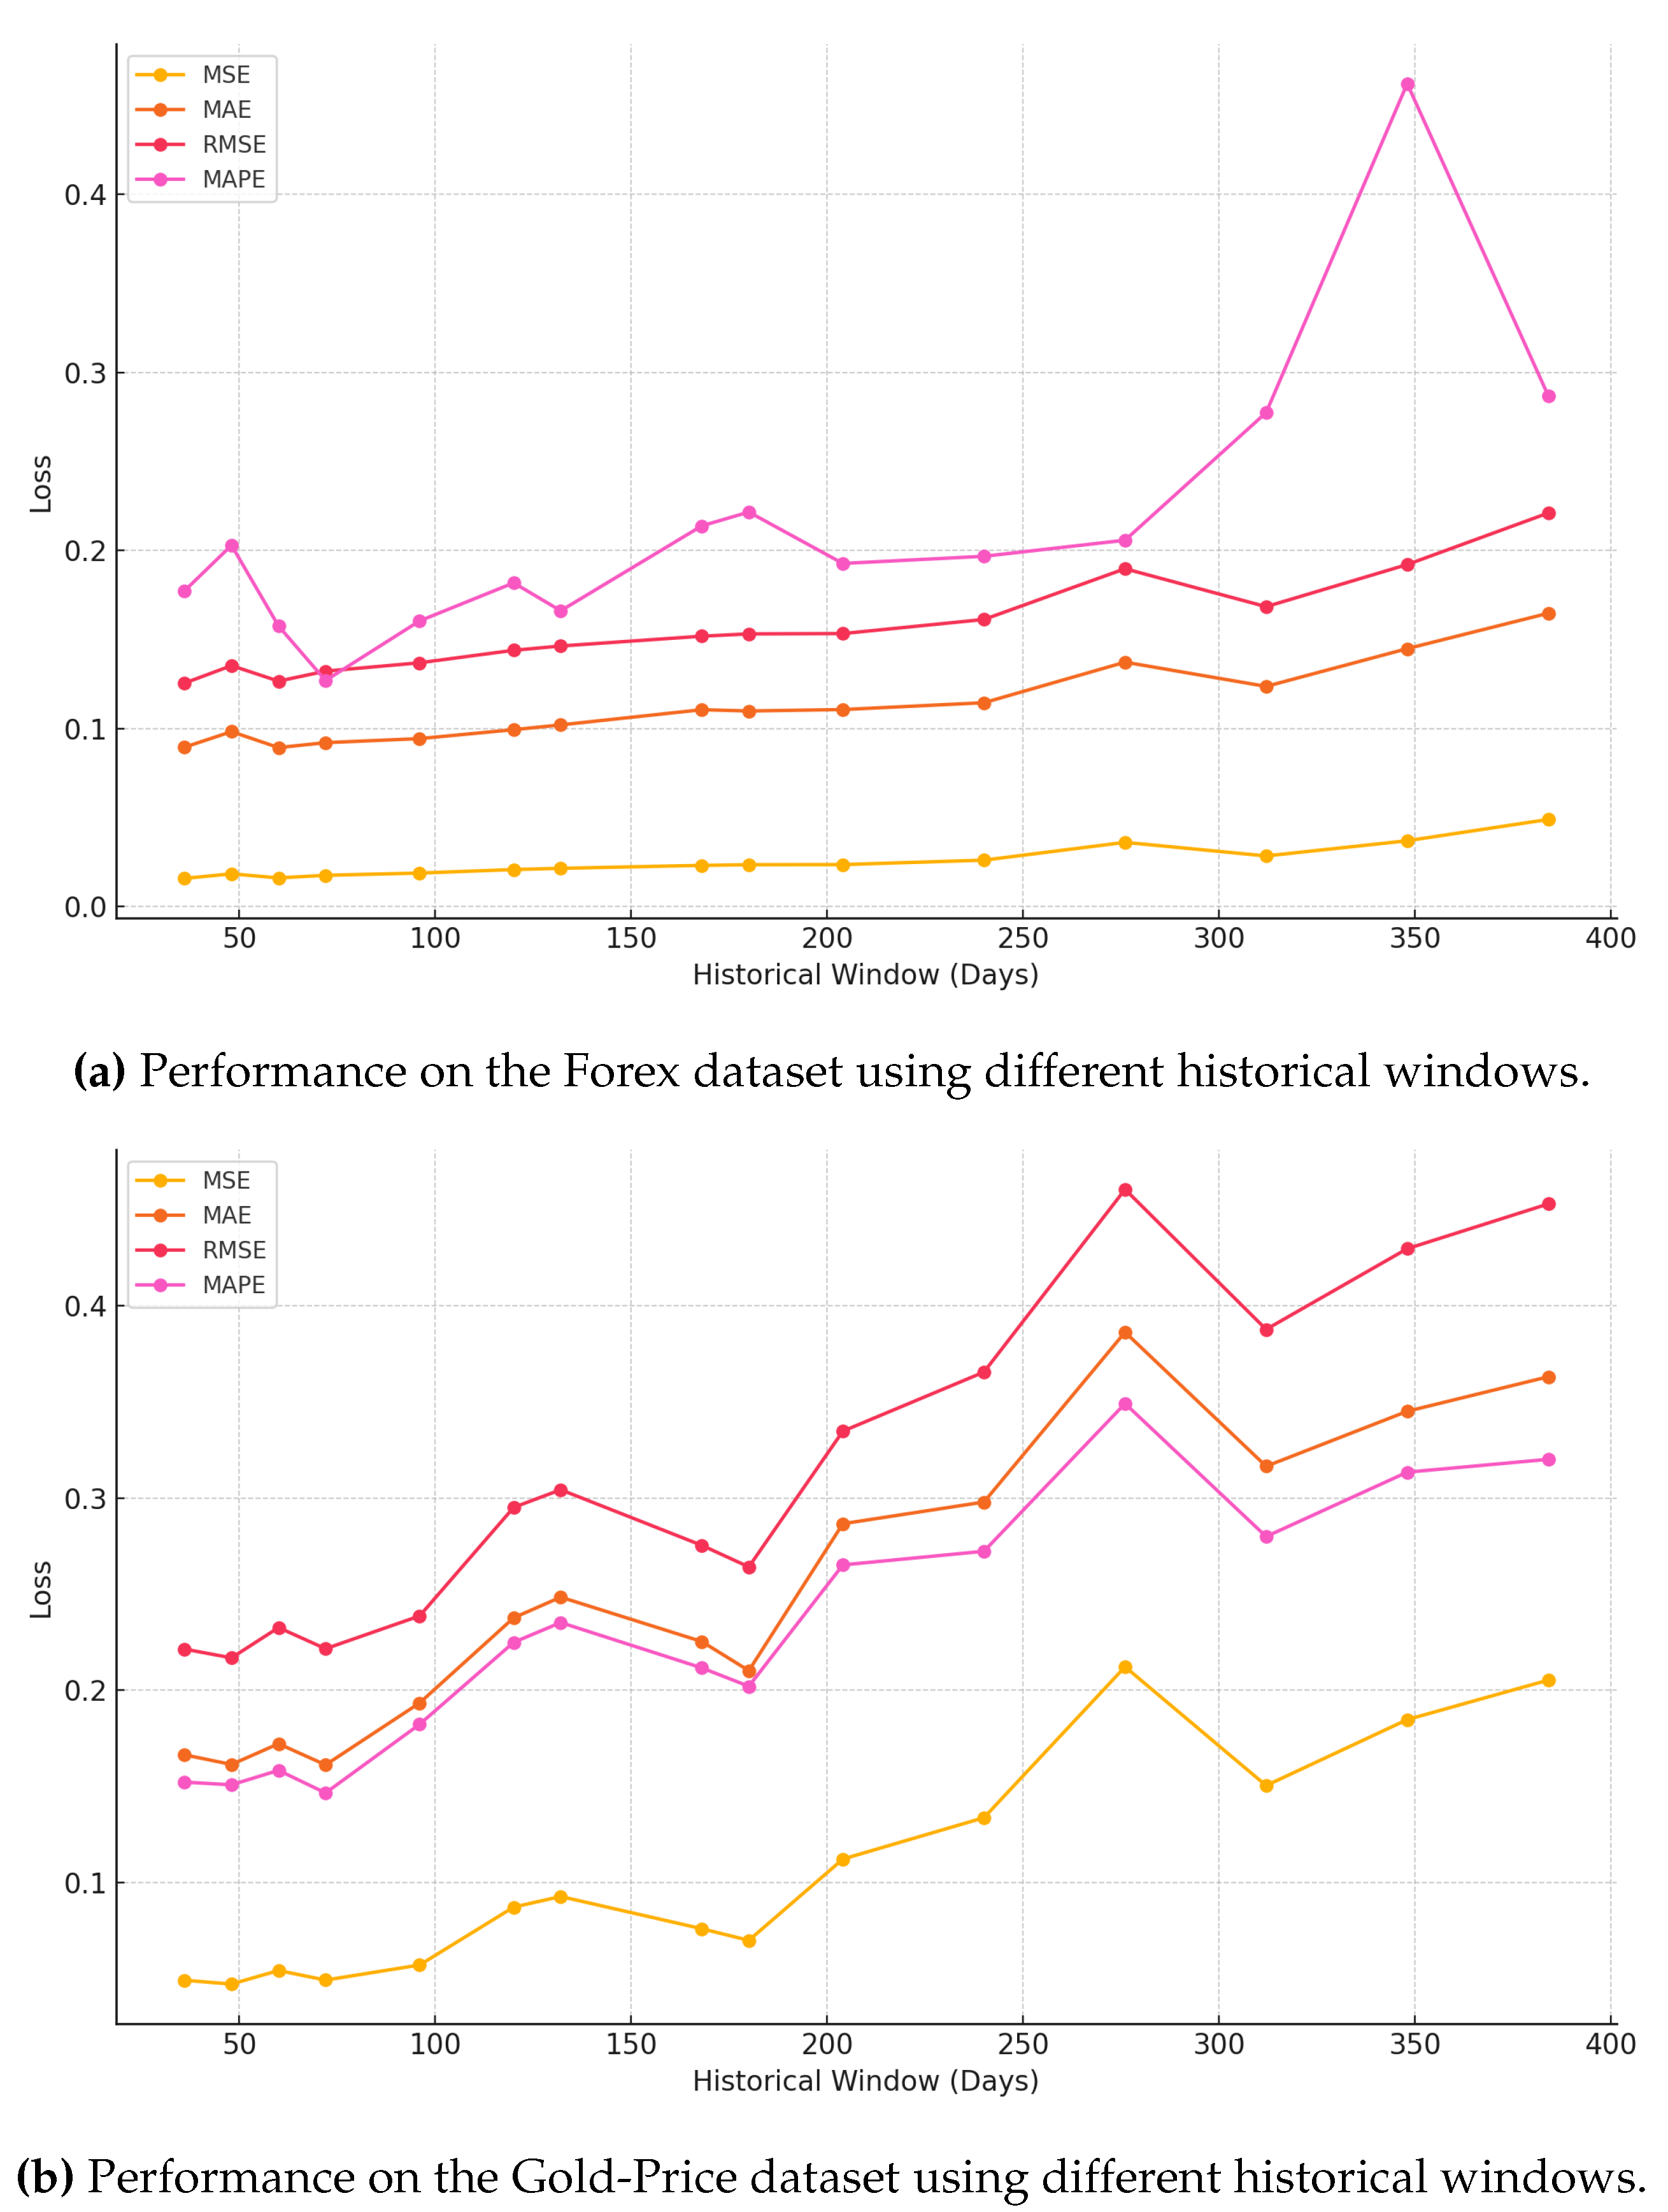
Figure 6.
Comparison of predictions on the Forex dataset with a historical window of 96 and a forecast horizon of 12; the vertical axis represents series values. Figures (a) and (c) showcase predictions from the MM-iTransformer, integrating textual data alongside historical price inputs, while figures (b) and (d) illustrate results from the iTransformer, which utilizes only historical price data.
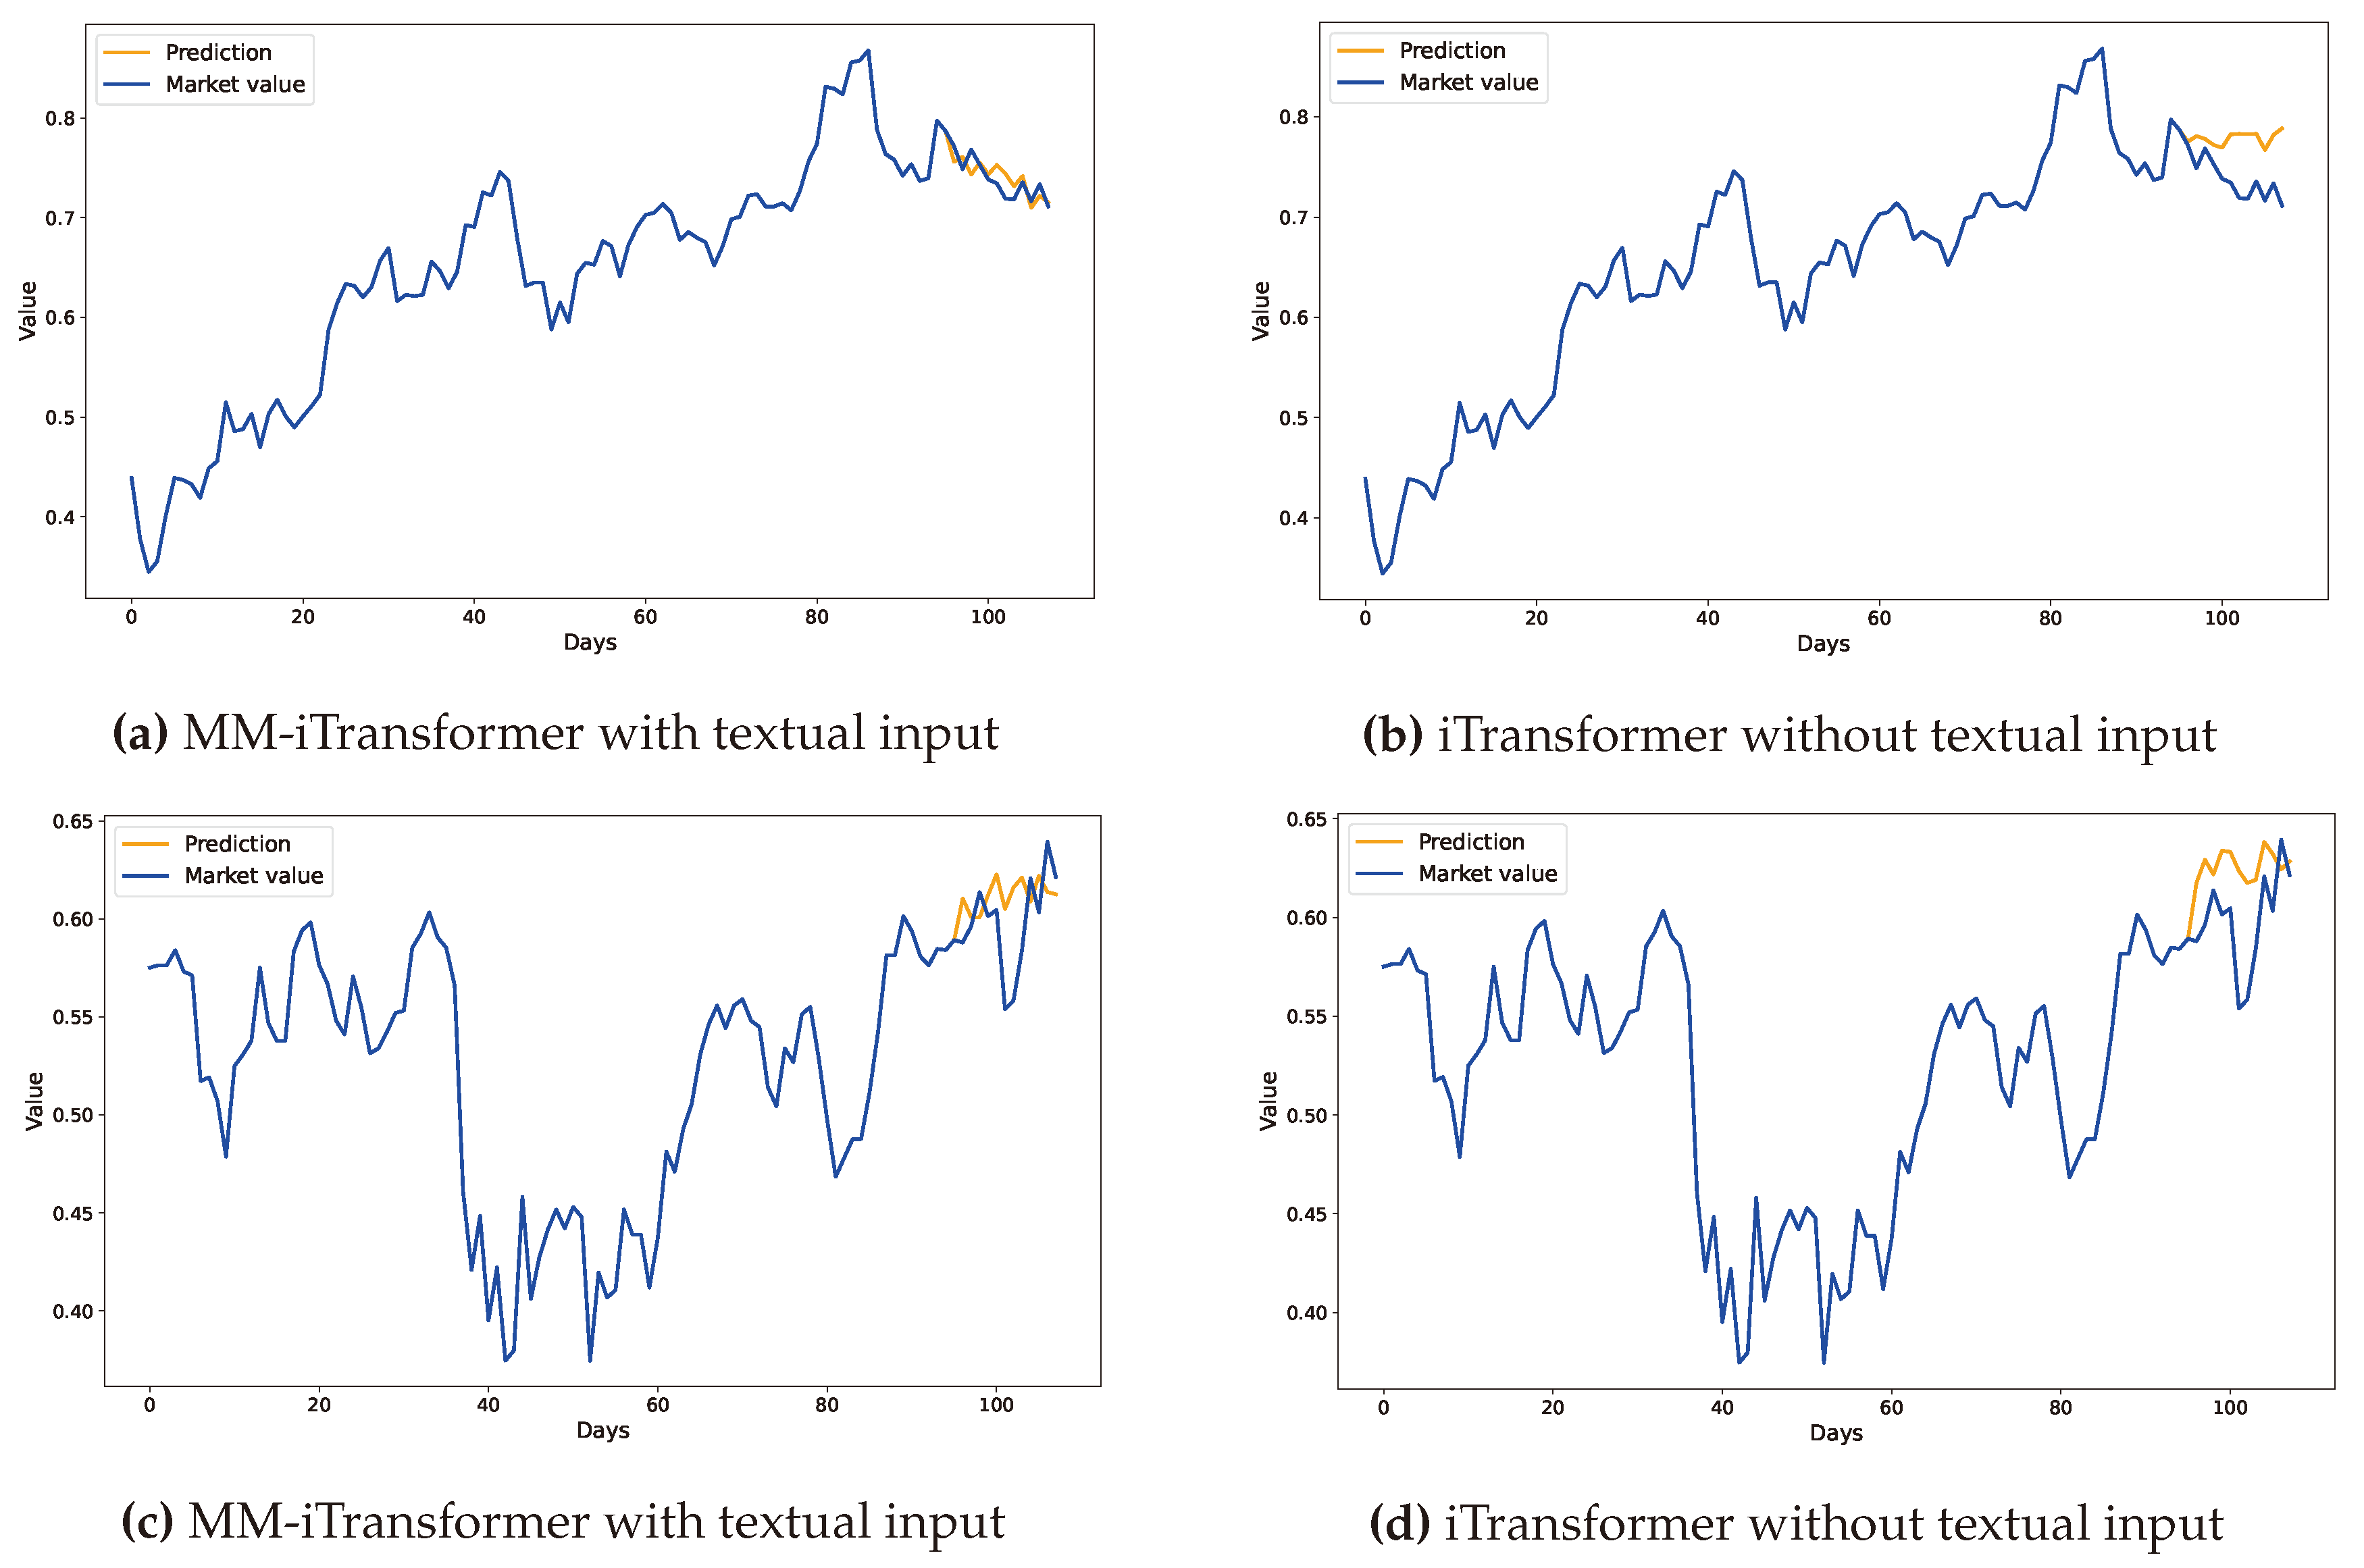

Table 1.
Economic Indicators.
| Day | Country | Event | Current | Previous |
|---|---|---|---|---|
| 01/01/19 | CN | Caixin Manufacturing PMI DEC | 49.7 | 50.2 |
| 01/04/19 | US | Non Farm Payrolls DEC | 312K | 176K |
| 01/07/19 | CA | Ivey PMI s.a DEC | 59.7 | 57.2 |
Table 2.
Performance Comparison of Different Models on Forex and Gold-Price Datasets. The underlined values indicate the best performance.
Table 2.
Performance Comparison of Different Models on Forex and Gold-Price Datasets. The underlined values indicate the best performance.
| Models | Forex | Gold-price | ||||||
|---|---|---|---|---|---|---|---|---|
| MSE | MAE | RMSE | MAPE | MSE | MAE | RMSE | MAPE | |
| MM-iTransformer (Ours) | 0.019 | 0.094 | 0.137 | 0.160% | 0.057 | 0.185 | 0.239 | 0.182% |
| iTransformer [32] | 0.022 | 0.102 | 0.147 | 0.189% | 0.065 | 0.207 | 0.254 | 0.196% |
| ARIMA [40] | 0.030 | 0.092 | 0.174 | 0.859% | 0.105 | 0.279 | 0.325 | 2.786% |
| Random Walk Model [41] | 0.020 | 0.094 | 0.142 | 9.495% | 0.110 | 0.288 | 0.331 | 19.727% |
Table 3.
Ablation Study on the Impact of Textual Data Temporal Alignment on Forecasting Accuracy.
| Forex | Gold-price | |||||||
|---|---|---|---|---|---|---|---|---|
| MSE | MAE | RMSE | MAPE | MSE | MAE | RMSE | MAPE | |
| With random text | 0.021 | 0.099 | 0.146 | 0.201% | 0.069 | 0.215 | 0.263 | 0.205% |
Table 4.
Diebold-Mariano (DM) test results comparing the forecasting performance of MM-iTransformer vs. iTransformer. Significance levels: * p < 0.05, ** p < 0.01.
Table 4.
Diebold-Mariano (DM) test results comparing the forecasting performance of MM-iTransformer vs. iTransformer. Significance levels: * p < 0.05, ** p < 0.01.
| Dataset | DM Test Statistic (P-value) |
|---|---|
| Gold-price | 2.030 (0.043*) |
| Forex | 3.010 (0.003**) |
Disclaimer/Publisher’s Note: The statements, opinions and data contained in all publications are solely those of the individual author(s) and contributor(s) and not of MDPI and/or the editor(s). MDPI and/or the editor(s) disclaim responsibility for any injury to people or property resulting from any ideas, methods, instructions or products referred to in the content. |
© 2024 by the authors. Licensee MDPI, Basel, Switzerland. This article is an open access article distributed under the terms and conditions of the Creative Commons Attribution (CC BY) license (http://creativecommons.org/licenses/by/4.0/).
Copyright: This open access article is published under a Creative Commons CC BY 4.0 license, which permit the free download, distribution, and reuse, provided that the author and preprint are cited in any reuse.


