
Submitted:
18 December 2024
Posted:
20 December 2024
You are already at the latest version
Abstract
This study analyses pedestrian behaviour patterns at unsignalized crossings by using multiple Data-mining approaches, aiming to improve pedestrian safety by understanding the relationship between movement patterns, location, and infrastructure. Utilizing the STATS19 dataset from the UK Department for Transport, applied data analysis techniques, including heatmap visualization, association rule learning, and Principal Component Analysis (PCA) with clustering, to identify high-risk behaviours and provide targeted interventions. Heatmap visualization identifies spatial patterns and high-risk areas, while association rule learning reveals the relationships between pedestrian behaviours and infrastructure elements, highlighting the importance of facility placement and accessibility in encouraging safe crossing. PCA combined with clustering effectively reduces data complexity, revealing key factors that influence pedestrian safety. The findings emphasize the need for appropriate infrastructure, such as strategically placed zebra crossings and central refuges, to guide pedestrian behaviour and reduce accident risks. Underutilized facilities like footbridges and subways require redesign to align with pedestrian preferences. The results of this study offer insights for urban planners to prioritize safety measures and infrastructure improvements that enhance pedestrian safety at unsignalized crossings.
Keywords:
unsignalized crossings
; pedestrian safety
; STATS19
; pedestrian behaviour
; heatmap visualization
; association rule learning
; PCA cluster
; road safety
; safety measures
1. Introduction
Road traffic accidents represent a significant challenge to global public health, affecting millions of lives annually. According to the World Health Organization (WHO), approximately 1.19 million people die each year from road traffic crashes, with low- and middle-income countries accounting for over 93% of global fatalities (WHO, 2023). Addressing this issue requires a comprehensive understanding of the factors contributing to road accidents, including infrastructure effectiveness and pedestrian behaviour. One key area is pedestrian safety at crossings, especially unsignalized ones, which are often high-risk zones. Understanding pedestrian behaviour patterns at these locations is crucial for developing targeted interventions that can reduce accidents, improve safety, and ultimately save lives.
Data-mining approaches help understand and mitigate road safety issues. Systematic analysis of historical road accident data allows for the detailed examination of pedestrian behaviour, particularly at high-risk locations such as crossings. By leveraging data analytics, researchers can identify recurring patterns and risk factors contributing to pedestrian accidents. For instance, detailed studies in developed countries have highlighted how certain behaviours, such as jaywalking or failing to use designated crossings, correlate with higher accident frequencies [1]. This approach allows for a proactive response to road safety challenges, enabling policymakers to implement changes based on evidence rather than intuition [2]. Data-mining analysis is particularly powerful in uncovering hidden insights that may not be immediately apparent, such as how environmental factors, time of day, or road conditions influence pedestrian behaviour [3]. These findings serve as a foundation for designing more effective interventions, such as improved crosswalks, enhanced signage, or modified traffic flow to ensure pedestrian safety.
The International Road Assessment Programme (iRAP) is a key player in the global effort to enhance road safety through infrastructure improvements. iRAP's evaluation tools are used to assess road infrastructure and identify areas where safety can be significantly improved, particularly concerning pedestrian facilities. iRAP's star ratings for roads are a globally recognized benchmark for road safety, and they highlight critical aspects that influence pedestrian risk. iRAP provides valuable insights into how infrastructure elements affect pedestrian behaviour. The absence of appropriate pedestrian facilities, as assessed by iRAP, is often linked to increased risk of accidents. By integrating iRAP's assessment tools, policymakers can identify areas where infrastructure improvements are most urgently needed, directly influencing pedestrian behaviour in ways that reduce accident risk. Effective infrastructure plays a significant role in determining pedestrian movement patterns, and understanding this relationship is crucial for reducing accidents at high-risk locations such as unsignalized crossings.[4]
Unsignalized crossings are often identified as high-risk areas for pedestrian accidents. Unlike signalized crossings, which have dedicated signals to manage traffic flow and pedestrian movement, unsignalized crossings rely largely on the awareness and behaviour of drivers and pedestrians. This lack of control increases the risk of accidents, particularly when drivers fail to yield to pedestrians or when pedestrians underestimate the speed of approaching vehicles. A significant portion of severe pedestrian accidents occurs at unsignalized crossings, where both vehicle speed and pedestrian unpredictability contribute to a hazardous [5]. Pedestrians at unsignalized crossings are more vulnerable due to the absence of clear signals that would otherwise grant them the right of way, leading to confusion and risky behaviour [6]. Understanding pedestrian behaviour patterns at these locations is critical for developing targeted interventions.
The growing complexity of urban environments and the increasing number of road users have heightened the need for sophisticated, Data-mining methods in road safety analysis. Traditional approaches to pedestrian safety often relied on anecdotal evidence or simplistic models that did not account for the diverse factors influencing pedestrian behaviour. Today, advanced analytical techniques such as association rule learning, clustering, and principal component analysis (PCA) are used to delve deeper into historical crash data and extract meaningful patterns. These methods enable the identification of underlying factors that contribute to accidents at unsignalized crossings, providing a more nuanced understanding of the risks involved. Association rule learning can uncover relationships between pedestrian behaviour and specific environmental conditions. Meanwhile, PCA helps reduce the complexity of large datasets, making it easier to visualize and understand key factors affecting pedestrian safety. These Data-mining techniques offer a comprehensive approach that combines multiple to develop targeted strategies for preventing accidents.
The primary focus of this research is to analyse pedestrian behaviour patterns at unsignalized crossings using Data-mining techniques. This study aims to understand how pedestrian movement, location, and the presence of infrastructure influence accident risk. The remainder of this paper is organized as follows: section 2 outlines the methodology for identifying pedestrian behaviour patterns using historical crash data. Section 3 describes the methodology employed in this study, including data collection, a brief description of the analytical models and the integration of analytical techniques. Section 4 presents the results of the analytical models and the comparative analysis results, followed by a discussion in Section 5 to demonstrate the impact of the proposed methodology on the analysis of pedestrian behaviour patterns in practice. Finally, Section 6 provides concluding remarks and suggests directions for future research in determining the effectiveness of pedestrian behaviour patterns on road safety.
2. Related Work
Pedestrian safety at unsignalized crossings remains a critical concern, prompting extensive research into pedestrian behaviour patterns and their interactions with crossings facilities. Historical accident data has been instrumental in this exploration, with various optimization models employed to analyse and visualize risk factors. Heatmaps have been effective in visualizing spatial distributions of pedestrian accidents, aiding in the identification of high-risk zones and informing targeted interventions [7]. A GIS-based pedestrian accident analysis in Delhi demonstrated how spatial visualization techniques can guide infrastructural improvements in urban settings [8].
Association rule learning has been applied to uncover complex relationships between pedestrian behaviours and environmental factors. Trend mining using association rules on fatal pedestrian crashes at unsignalized crossings revealed significant patterns associated with crossing behaviours and intersection characteristics [9]. This approach facilitates the identification of critical risk factors that may not be evident through traditional statistical methods. An integrated text mining and meta-analysis approach also investigated pedestrian violation behaviours, providing a comprehensive understanding of factors influencing pedestrian compliance and safety [10].
Clustering and principal component analysis (PCA) techniques have been instrumental in segmenting pedestrian behaviours and identifying underlying risk patterns. A study utilizing clustering methods investigated clusters and injuries in pedestrian crashes using GIS, categorizing accidents based on common characteristics [11]. Similarly, a novel integrated model under fuzzy environments supported pedestrian safety studies by employing PCA to manage complex datasets and enhance interpretability [12]. Pedestrian behaviour analysis at unsignalized crossings has also utilized clustering to inform targeted safety measures [13].
Innovative strategies integrating these analytical tools have emerged to address pedestrian safety challenges at unsignalized crossings. Vision-based approaches utilize data mining techniques on surveillance footage to conduct potential pedestrian risk analysis, enabling real-time monitoring of pedestrian-vehicle interactions and facilitating proactive safety interventions [14]. Evaluating pedestrian-vehicle interaction dynamics at T-unsignalized crossings through a proactive safety analysis can inform the design of safer unsignalized crossings [15].
Simulation modelling has proven valuable in assessing the effectiveness of safety interventions. Simulation modelling was applied to improve pedestrian safety at unsignalized crosswalks, examining the impact of infrastructural changes.[16] A study using a traffic conflicts technique to assess pedestrian safety at traffic signals demonstrated how simulation models can predict potential conflicts and guide preventative measures [17]. Additionally, modelling pedestrian crossing behaviour based on road traffic and human factors provided insights into behavioural responses to different traffic conditions [18].
Applications of these models have significantly influenced urban planning and policy. Characterization of pedestrian accidents and examination of infrastructure measures informed policy decisions regarding crosswalk placements and traffic calming measures [19]. Exploring the link between the built environment, pedestrian activity, and collision occurrence at unsignalized crossings emphasized the role of urban design in promoting pedestrian safety [20]. Mapping patterns of pedestrian fatal accidents provided valuable data for policymakers to address high-risk areas [21].
Studies focusing on pedestrian perception and behaviour have contributed to a deeper understanding of safety issues. A comparative study of safe and unsafe unsignalized crossings from the viewpoint of pedestrian behaviour and perception highlighted the importance of user experience in assessing intersection safety [22]. Observational studies examined road-rule violations at high-incident unsignalized crossings, providing insights into human behaviour and its impact on pedestrian injury risk [23].
Unsupervised learning algorithms have been applied to investigate crash patterns. Pedestrian crash patterns at high-speed unsignalized crossings and road segments were explored, providing novel insights into accident characteristics without prior labelling of data [24]. Additionally, the historical context of traffic and pedestrians in the modern city underscores the evolution of pedestrian safety concerns and the need for adaptive strategies [25].
Challenges and gaps persist, particularly in data limitations and methodological constraints. The variability in pedestrian behaviour across different demographics and regions complicates the generalization of predictive models. The association between roadway intersection characteristics and pedestrian crash risk varies, necessitating localized studies [26]. Sheykhfard reviewed different perspectives of vehicle-pedestrian conflicts and crashes discussed passive and active analysis approaches, underscoring the necessity for comprehensive data collection [27].
Emerging opportunities involve integrating advanced technologies and interdisciplinary approaches. The use of IoT devices and AI algorithms facilitates real-time data collection and dynamic modelling. A systems-based approach to investigate unsafe pedestrian behaviour at level crossings suggested that incorporating systems thinking can enhance safety analyses [28].
Comprehensive analysis of pedestrian behaviour at unsignalized crossings using historical data and advanced models has deepened understanding of risks, informed safety strategies, and highlighted emerging technologies and interdisciplinary approaches to address challenges and enhance urban pedestrian safety.
3. Methodology
This study introduces three distinct methods used to analyse pedestrian behaviour at unsignalized crossings: heatmap visualization, association rule learning, and Principal Component Analysis (PCA) combined with clustering. Each of these methods provides unique insights into pedestrian behaviour patterns and risk factors, allowing for a comprehensive exploration of pedestrian safety issues [29].
The following sections provide a detailed explanation of the characteristics of each method and their roles in analysing crash data. Heatmap visualization is employed to identify spatial patterns and high-risk areas, association rule learning uncovers latent relationships between behaviours and environmental factors, and PCA with clustering is used to reduce data complexity while grouping similar behaviour patterns for further analysis.
This study aims to use these methods within an integrated analytical framework to better understand pedestrian safety at unsignalized crossings. The overall purpose is to leverage the complementary strengths of each method to provide Data-mining insights that can inform targeted interventions and enhance pedestrian safety. Figure 1 illustrates how each model was applied to analyse pedestrian behaviour at Unsignalized crossings.
3.1. Data Collection
The data utilized in this study originates from the STATS19 road safety data, collected and maintained by the UK Department for Transport. This dataset comprises detailed records of road accidents reported to the police across Great Britain, covering the years 2018 to 2022. The STATS19 data is widely regarded as one of the most comprehensive sources of road traffic accident information, encompassing various aspects such as the circumstances of personal injury collisions, the types of vehicles involved, and the resulting casualties.
3.1.1. Study Dataset
For this study, an extracted subset of the STATS19 data specifically focusing on pedestrian accidents at unsignalized crossings was considered. The dataset includes records from 2018 to 2022, providing a reasonable sample for analysis.[30] Key elements of the dataset include:
- Accident Details: Information about the date, time, and location of the accident, as well as the road conditions, weather, and lighting at the time of the incident.
- Casualty Information: Details about the individuals involved in the accident, including age, gender, injury severity, and whether they were pedestrians, cyclists, or vehicle occupants.
3.1.2. Data Limitations
The STATS19 dataset, accessible via the UK Government's data portal, supports road safety research while maintaining ethical standards and individual privacy. Despite limitations such as underreporting of minor incidents and variability in police report accuracy, STATS19 remains crucial for understanding road safety trends. This study leverages the dataset to provide insights into pedestrian safety at unsignalized crossings, aiding infrastructure improvements.[31]
3.2. Data Preprocessing
Data preprocessing was crucial for ensuring the dataset's readiness for machine learning. The study filtered the STATS19 dataset to focus only on accidents at unsignalized crossings, excluding entries involving signalized crossings or controlled junctions. This filtering step provided a precise dataset directly aligned with the research focus. Cleaning involved addressing missing values through median imputation for numerical data and most frequent value imputation for categorical data. Standardization of numerical features (mean of 0, standard deviation of 1) and binary encoding of categorical variables prepared the data for analysis.
After cleaning and encoding, the pre-processed dataset was integrated into the analysis pipeline. Consistency checks verified a uniform data structure, and transformations were validated to maintain the dataset’s integrity. This preprocessing ensured the robustness of the dataset for model training and evaluation, supporting accurate analysis of pedestrian injury severity and identifying key factors affecting safety at unsignalized crossings.
3.3. Models
3.3.1. Heatmap Analysis
The basic principle of heat map analysis lies in the use of colour intensity to convey accident concentrations for various pedestrian locations and facility types. The analysis involves constructing a data matrix, calculating likelihood values to quantify the frequency of accidents, and visualising these values through colour-coded intensities. The heat maps generated highlight specific areas of higher risk, revealing the interaction between pedestrian behaviour and infrastructure.
As noted by Netek et al. [32], heat maps are a versatile GIS-based method that provides intuitive and visually comprehensible representations of spatial data, making them particularly useful for traffic safety analysis. Heat map analysis was used to visually represent the spatial distribution of pedestrian accidents across different locations and associated facilities. The accident data is organised into a matrix format where rows represent pedestrian locations or behavioural patterns and columns represent different facility types. Each pixel value in the matrix corresponds to the normalised frequency of accidents for a particular combination of location and facility point type. The intensity of each cell represents the density of accidents and allows for a clear description of high-risk areas. Heat maps provide an effective visualisation of data patterns and help to identify high-risk areas that require targeted intervention.
3.3.2. Association Rule Learning
Association rule learning is applied to identify latent patterns and weigh optimal solutions through an aggregation method. This process employs a rule-based model using "if …, then …" decision rules to reveal relationships between pedestrian behaviours and associated facilities, thereby providing Data-mining insights to inform targeted safety interventions. The Apriori algorithm is used to generate frequent itemsets and derive association rules, which helps uncover significant associations. To evaluate the robustness and significance of these rules, key metrics such as support, confidence, and lift are used. Feng et al.[33] pointed out the effectively reveals hidden correlations within multi-attribute traffic data and supports the extraction of actionable insights through rule-based patterns. Analysing pedestrian location and movement behaviour can lead to better traffic facility layouts, ultimately improving safety and efficiency.
As an unsupervised learning method, association rules do not require pre-labelled data, which makes them suitable for exploratory data analysis. They effectively discover frequently occurring patterns in datasets, providing valuable insights for decision-making. Moreover, association rules are versatile, being applicable to various types of data, and help in evaluating the strength of relationships using metrics like support, confidence, and lift. High support, confidence, and lift reveal strong patterns, suggest prevalent associations, and indicate significant relationships that can be leveraged in practice. The aggregation of lift values across road attributes and countermeasures provides a measure of risk, where higher lift values signify increased risk levels that require targeted interventions. This data-mining approach helps assess the impact of these associations on road safety, guiding policy decisions, infrastructure improvements, and intervention planning to enhance pedestrian safety at unsignalized crossings. The following formula demonstrates the strength of the association between rules:
where Number of transactions containing X: A set of items representing the associated factors and Total number of records: Represents the number of all analysed data
where A represents pedestrian movement/location factors and B represents pedestrian facility condition factors
where A represents pedestrian movement/location factors and B represents pedestrian facility condition factors
3.3.3. PCA and Clustering Analysis
PCA and clustering were employed to reduce the complexity of the dataset while retaining essential information, enabling the identification of distinct patterns and relationships in pedestrian behaviours at unsignalized crossings. Clustering and PCA dimensionality reduction are powerful tools for data analysis, capable of retaining the most important information while reducing data complexity. This is particularly useful for discovering patterns and relationships within the data, especially when dealing with high-dimensional data. Ding and He [34] demonstrated that principal components are the continuous solutions to the discrete cluster membership indicators for K-means clustering, highlighting the close relationship between PCA and K-means clustering in data analysis.
The Principal Component Analysis (PCA) process involved reducing the dataset to its most significant components, retaining the first two principal components that explained the majority of the variance.
where X represents the original data and W is the matrix of eigenvectors and Z is the transformed data in the reduced space.
This dimensionality reduction facilitated visualization in a two-dimensional space while preserving critical information, making it easier to recognize patterns and relationships.
Subsequently, the K-Means clustering algorithm was applied to the dimensionally reduced data to group pedestrian behaviours into distinct clusters. The objective function of K-Means clustering is to minimize the sum of squared distances between data points and the centroid of their respective clusters:
where is the objective function and is the number of clusters and represents the data points within cluster and represents the centroid of cluster
Each cluster represented a combination of pedestrian behaviours and associated facilities, revealing common accident scenarios and high-risk behaviour groups. Visualizations such as boxplots and scatterplots were employed to illustrate the characteristics of each cluster, providing insights into how different behaviour patterns are distributed spatially. This clustering approach enabled the identification of groups with similar accident characteristics, providing valuable insights into potential safety interventions. By simplifying the dataset, PCA also enhanced the interpretability of clustering results, supporting effective intervention planning to improve pedestrian safety at unsignalized crossings.
4. Results
4.1. Heatmap Analysis
The heatmap analysis in Figure 2 reveals distinct pedestrian behaviours in relation to physical crossing facilities. In areas with no crossing facilities, pedestrian movements are typically categorized as 'unknown or other,' implying that individuals cross at random points, which could pose increased safety risks. Conversely, pedestrian phasing at zebra crossings shows a higher association with controlled pedestrian behaviour, with individuals primarily using the designated crossing points correctly. Specifically, zebra crossings show a strong correlation with Locations (In carriageway, crossing within zig-zag lines at crossing approach, In carriageway, crossing within zig-zag lines at crossing exit, In carriageway, crossing elsewhere within 50m of pedestrian crossing) suggesting proper adherence to marked pedestrian paths. However, some locations still display a preference for crossing at non-official points, possibly reflecting impatience or a desire to minimize walking distances.
Pedestrian behaviours at central refuges, footbridges, and subways are also noteworthy. The significant use of central refuges indicates that they play a critical role in enhancing pedestrian safety, especially in wider roads or complex junctions. The heatmap shows that while safety islands are effective in guiding pedestrians towards safer crossing options, the footbridges or subways associated with these islands are underutilized, suggesting potential challenges with accessibility, convenience, or even lack of awareness. Additionally, the moderate use of locations without nearby crossing facilities highlights a gap between pedestrian needs and the existing infrastructure, emphasizing the need for better alignment between pedestrian flow and facility placement.
Further analysis indicates that well-marked facilities like zebra crossings have a strong positive impact, reinforcing their effectiveness in encouraging safe crossing behaviours. The data suggest that zebra crossings are well-aligned with pedestrian expectations, which leads to a high level of compliance. On the other hand, facilities such as pedestrian phasing at unsignalized crossings show a weaker correlation with their intended use, potentially indicating design flaws or a need for improved signage and pedestrian education. These findings underline the importance of reassessing facility placements to better accommodate pedestrian desire lines and natural traffic flow, ultimately enhancing road safety and convenience for pedestrians.
The heatmap analysis in Figure 3 presented here provides a visualization overview of pedestrian movement in relation to physical crossing facilities. This analysis revolves around understanding how pedestrians interact with various types of infrastructure, which range from zebra crossings to footbridges or subways, across different movement scenarios. The matrix highlights the interactions between specific pedestrian movements—such as crossing from the driver's offside or walking along the carriageway—and corresponding facilities. Key findings indicate notable variations in facility utilization depending on the type of movement, which reveals significant differences in pedestrian preferences and behaviour patterns. This analysis not only underscores the complex dynamics at unsignalized crossings but also points toward critical areas where infrastructure may not be serving its intended purpose effectively.
An examination of pedestrian behaviour within different crossing facilities sheds light on usage trends and potential design shortcomings. For instance, pedestrian movement involving a zebra crossing appears frequently in the data, which suggests a high rate of utilization and perceived safety. However, facilities like footbridges or subways see comparatively less movement across different scenarios, indicating a preference for at-grade crossings even when grade-separated alternatives are available. This may imply that pedestrians are less willing to take the effort required for elevation changes, reflecting behaviour that prioritizes convenience over other factors such as safety. The movement categories, ranging from simple offside or nearside crossings to more complicated scenarios involving obstructions like parked vehicles, further reveal how visibility and perceived safety influence pedestrian choices. The fact that crossings obscured by parked vehicles still see considerable use hints at a discrepancy between infrastructure planning and real-world pedestrian behaviour, potentially indicating a lack of suitable and safe alternatives.
The findings from the heatmap analysis emphasize several insights regarding the interaction between crossing facilities and pedestrian behaviour. One major observation is the apparent gap between infrastructure design and pedestrian preference, particularly with facilities such as footbridges and subways, which seem to be underutilized despite their potential safety benefits. This behaviour can be attributed to inconvenience, additional travel time, or even poor positioning of these facilities. It raises the question of whether current pedestrian infrastructure adequately addresses user needs or if adjustments are necessary to increase compliance and safety. The underutilization of key safety features implies a need to re-evaluate existing infrastructure with a focus on pedestrian convenience and accessibility. Moreover, the significant usage of zebra crossings and central refuges, even in contexts with limited visibility, suggests a reliance on at-grade crossings that may expose pedestrians to heightened risk. Based on these observations, revisiting the design and placement of current facilities to better align them with pedestrian preferences and natural movement patterns. Such a reassessment could enhance both usability and safety, ultimately encouraging safer pedestrian behaviours while reducing potential conflicts with vehicular traffic.
4.2. Association Rule Analysis
4.2.1. Relationship Between Pedestrian Location and Crossing Facility
Table 1 presents the results of association rule mining, showing the antecedents and consequences of pedestrian crossing behaviour as well as metrics such as support, confidence and lift. Figure 4 shows the five rules with the highest support, confidence and lift, highlighting key patterns in crossing facilities and pedestrian behaviour.
Nearly half of pedestrians (support: 0.474886) choose to cross the road at locations without physical crossing facilities within 50 meters. This behaviour highlights the need for installing appropriate crossing facilities in such areas to enhance pedestrian safety.
Pedestrian behaviour on carriageways reflects a lack of nearby physical crossing facilities, indicating significant safety concerns. When pedestrians are on the carriageway without attempting to cross, the confidence of 0.910448 suggests that there are rarely crossing facilities within 50 meters. Furthermore, pedestrians crossing at locations without designated facilities show a confidence of 0.899534, underscoring the prevalence of this risky behaviour. Similarly, those walking on footways or verges also lack nearby physical crossing facilities (confidence: 0.851382), pointing to a pressing need for infrastructure improvements in these areas. Pedestrians staying in the middle of the carriageway without a safety refuge (confidence: 0.818671) represent a particularly dangerous behaviour that requires immediate intervention, such as the installation of safe zones or appropriate crossing facilities. On the other hand, pedestrians do frequently utilize zebra crossings, as indicated by a confidence of 0.801111 for those crossing at pedestrian crossings. This suggests that zebra crossings are commonly used but highlights the need to study their placement and ensure they are accessible at key locations to enhance pedestrian habits and overall safety.
There is a strong association between certain pedestrian behaviours and the existing infrastructure. The lift value of 9.596281 suggests that pedestrians staying on central islands or reservations are commonly found in areas with only central refuge facilities, highlighting that while these facilities are present, they may be insufficient for complete safety. Similarly, a lift value of 5.706664 indicates a strong association between zebra crossings and pedestrian crossing behaviour, emphasizing the importance of ensuring that the placement of zebra crossings is strategic and convenient for pedestrians.
High pedestrian accident rates are prevalent on sidewalks or roadside areas, particularly where there are no crossing facilities within 50 meters. This points to the need for prioritize the installation of crossing facilities, such as zebra crossings or subways, in the design of sidewalks and roadside areas to mitigate accidents and improve pedestrian safety. The frequent occurrence of pedestrians crossing at informal locations highlights the lack of adequate crossing facilities in these areas. Should evaluate high-frequency crossing points and implement suitable crossing facilities to reduce the incidence of pedestrians crossing arbitrarily and thus decrease accident risks.
When pedestrians walk on the carriageway without attempting to cross, the risk of accidents is heightened. This indicates a need to add central refuge islands or more pedestrian crossings to provide pedestrians with safe areas for waiting and crossing, ultimately reducing the risk of accidents. The risk of accidents remains high when pedestrians are in the centre of the carriageway without refuge facilities. Governments and transportation departments should prioritize the installation of central refuge islands or other protective infrastructure in these high-risk areas to enhance pedestrian safety and minimize the likelihood of accidents. Although central refuge islands offer some degree of safety for pedestrians, accidents can still occur, particularly in the absence of additional control measures. Should consider implementing further safety measures, such as warning signs, to bolster pedestrian protection in these areas and reduce accident rates.
These association rules collectively underscore the critical role of infrastructure planning, policy development, and education in improving traffic safety. Practical measures derived from these insights can optimize traffic facilities and management, leading to enhanced pedestrian safety levels. Table 2 shows all association rules about pedestrian location and pedestrian facilities.
4.2.2. Relationship Between Pedestrian Movement and Crossing Facility
The Table 3 shows the association rules between pedestrian movement and pedestrian facilities and their corresponding antecedents, consequences, and metrics such as support, confidence, and lift. Figure 5 shows the distribution of these metrics, providing insight into the frequency and variability of rule strength.
A significant number of pedestrians choose to crossroads at locations without physical crossing facilities, whether approaching from the driver’s nearside or offside, as indicated by high support values. This suggests that these areas are common crossing points, potentially due to convenience, even in the absence of safe crossing infrastructure. The lack of physical facilities at these frequent crossing locations indicates that they may be prone to accidents, representing critical safety concerns. To address this issue and improve pedestrian safety, it is essential to install appropriate crossing facilities at these commonly used locations, thereby mitigating risks and ensuring safer road-crossing options for pedestrians.
Pedestrians walking along the carriageway without physical crossing facilities within 50 meters are often in highly dangerous situations, whether they are walking with their backs to traffic, facing oncoming vehicles, or even stationary while standing or playing on the road. Walking with their backs to the traffic makes it impossible for pedestrians to see approaching vehicles, increasing the risk of accidents. This clearly indicates the urgent need to improve pedestrian pathway facilities along roadsides to provide a safer environment. Even when pedestrians walk facing traffic, where they have a clearer view of oncoming vehicles, they still face significant danger due to the absence of proper infrastructure, pointing to a need for enhanced roadside pathways and protective facilities. Furthermore, when pedestrians are stationary on the carriageway, this behaviour is particularly dangerous, especially in areas lacking crossing facilities. This highlights the necessity for both the construction of appropriate pedestrian facilities and improved safety education programs to discourage such behaviours and promote safer practices.
Despite the presence of infrastructure such as footbridges or subways, pedestrians often choose to cross the road from the driver's offside, suggesting that the utilization rate of these facilities is low. This due to factors such as perceived inconvenience or concerns about safety, indicating the need for further investigation into the design and accessibility of these facilities. Additionally, pedestrians walking along the carriageway with their backs to the traffic, in areas without physical crossing facilities within 50 meters, face significantly increased risks. The high lift value associated with this behaviour emphasizes the need for targeted interventions to improve pedestrian safety, such as the construction of dedicated pathways and awareness campaigns. Furthermore, there is a concerning trend of pedestrians remaining stationary on the carriageway, even when zebra crossings are available nearby. This suggests possible issues with the design or placement of zebra crossings, or it may reflect unsafe pedestrian behaviour. Addressing these issues will require both design improvements to make zebra crossings more accessible and appealing, as well as educational efforts to encourage pedestrians to use these safer options.
When pedestrians cross the road from the driver’s nearside, there are typically no physical crossing facilities within 50 meters. This implies that pedestrians may have to cross the road under unsafe conditions, which increases their risk of accidents. To mitigate these risks, it is crucial to add crossing facilities in these areas, thereby providing safer crossing options and improving overall pedestrian safety. Pedestrians crossing from the driver’s offside similarly encounter the absence of physical crossing facilities within 50 meters. The lack of proper infrastructure in these locations forces pedestrians to cross the road without adequate safety measures, emphasizing the necessity of installing crossing facilities in these high-risk areas to reduce potential accidents and ensure safer crossings.
Pedestrians walking along the carriageway with their backs to traffic, especially when there are no physical crossing facilities nearby, face a highly dangerous situation, as they are unable to see oncoming vehicles. This behaviour significantly elevates the risk of accidents and highlights the importance of installing both crossing facilities and dedicated pedestrian pathways along the road. Such improvements could reduce hazardous behaviours and enhance pedestrian safety.
In areas with footbridges or subways, pedestrians are often still observed crossing the road from the driver’s offside, indicating that these facilities are not used effectively. This highlights the importance of designing and placing crossing infrastructure in a way that encourages pedestrians to use them. A reasonable layout, where footbridges or subways are convenient and safe, can help promote their use, reducing unsafe crossing behaviour. Near zebra crossings, pedestrians sometimes remain stationary in the carriageway rather than using the crossing facility. This behaviour suggests that either the zebra crossing placement is not optimal, or there is insufficient guidance to direct pedestrians towards using it. By optimizing the design and placement of zebra crossings and providing appropriate guidance, pedestrian behaviour can be improved, resulting in a safer environment for road users. Table 4 shows all association rules about pedestrian location and pedestrian facilities.
4.3. Clustering and PCA Dimensionality Reduction Analysis
4.3.1. Relationship Between Pedestrian Location and Crossing Facility
Table 5 shows the loading coefficients of pedestrian location and pedestrian facilities on the two principal components (PC1 and PC2) of the principal component analysis (PCA). The weights of the different features in the principal components reflect their contribution to each principal component, helping to explain the main sources of variation in the data. The Figure 6 displays the distribution of PC1 and PC2. For PC1, a prominent peak around -1 suggests most data points fall within this range. For PC2, two peaks around 1 and -1.5 indicate that data points are concentrated within these areas. Additionally, the distribution suggests a pattern of clustering in these areas, which could be further analysed for underlying causes. The varying concentration highlights the need to examine pedestrian crossing facilities and their influence on movement.
The Figure 7 presents clustering results using data after PCA dimensionality reduction. The X-axis represents the first principal component (Principal Component 1), capturing the largest variance in the original dataset, while the Y-axis represents the second principal component (Principal Component 2), capturing the second-largest variance and providing additional insights into pedestrian behaviour. The different colours represent different cluster labels, and points of the same colour are generally grouped together, indicating effective clustering after PCA. The separation of clusters suggests that PCA has successfully reduced dimensionality while retaining key patterns in the data. Additionally, the visual grouping highlights areas with distinct pedestrian behaviours, aiding in the identification of areas needing intervention. These clustering results can guide urban planners in optimizing pedestrian safety and crossing facilities based on behaviour patterns.
The Figure 8 shows the box plots for Principal Component 1 (PC1) and Principal Component 2 (PC2) across different clusters. For PC1, Cluster 1 has higher values, while Clusters 0 and 2 have lower values. For PC2, Cluster 1 has a wide distribution with some outliers, Cluster 2 has a lower concentration with a smaller spread, and Cluster 0 is concentrated in the mid-range with some outliers.
This Table 6 provides statistical summaries such as mean, standard deviation, minimum, and quartiles for the clustering results after PCA. The detailed statistics help in understanding the distribution and spread of the principal components within each cluster, allowing for better characterization of the different pedestrian crossing behaviours. These metrics can guide the evaluation of areas where safety improvements are most needed, particularly in regions with high variability or extreme values. Additionally, identifying the central tendency and dispersion of data within clusters supports targeted interventions to address specific pedestrian safety concerns.
High PC1 values indicate areas with a high density of crossing facilities, such as zebra crossings or footbridges, which offer pedestrians safer options. These areas are generally well-planned, prioritizing pedestrian needs and ensuring safe crossing opportunities. Low PC1 values, on the other hand, suggest a lack of crossing facilities, which increases crossing risks for pedestrians. In such areas, pedestrians are more likely to cross at undesignated points, leading to higher exposure to traffic risks and a greater likelihood of accidents.
High PC2 values indicate areas with high pedestrian flow, often resulting in more instances of random crossings, especially in places without adequate crossing infrastructure. These areas might have bustling activity, such as markets or transport hubs, where pedestrian movement is less predictable. Low PC2 values suggest lower pedestrian flow, characterized by more orderly behaviour, usually restricted to sidewalks or designated crossing points. In these areas, pedestrian movement is more controlled, and the infrastructure may be sufficient to guide safe crossing behaviours. Such orderly movement reflects well-managed pedestrian facilities and lower risks of pedestrian-vehicle conflicts.
Cluster 0 has lower PC1 and higher PC2 values, indicating a lack of crossing facilities and high pedestrian flow. These areas require more crossing facilities to improve safety, alongside enhanced pedestrian education. The absence of physical infrastructure like zebra crossings or pedestrian islands means that pedestrians in these areas are exposed to significant risks. Additionally, the high pedestrian flow suggests these locations are frequently used, making it even more critical to implement immediate safety interventions. Educational programs should focus on safe crossing practices and increasing awareness of traffic dangers to reduce accidents.
Cluster 1 has higher PC1 values, indicating well-developed crossing facilities such as zebra crossings and central refuges. Despite the organized facilities, random pedestrian crossing behaviours still occur, suggesting the need for additional safety measures like barriers. These barriers could help channel pedestrian movement towards designated crossings, thereby reducing the instances of unsafe crossing behaviour. Moreover, additional signage and visual cues can be implemented to further reinforce the use of proper crossing points. Public awareness campaigns aimed at promoting adherence to designated facilities could also contribute to enhancing safety in these areas.
Cluster 2 has moderate PC1 values and lower PC2 values, suggesting these areas have basic crossing facilities, and pedestrian behaviour is more regulated. Improvements in awareness and facility enhancements can further improve safety. The existing infrastructure appears to meet the basic needs of pedestrians, but there is still room for upgrading these facilities to ensure higher safety standards. Adding more visible crossing points and ensuring the maintenance of existing infrastructure can enhance safety and comfort for pedestrians. Furthermore, targeted educational efforts could help reinforce the importance of using available facilities and adhering to safe crossing behaviours, thereby reducing potential risks.
4.3.2. Relationship Between Pedestrian Movement and Crossing Facility
The Table 7 shows the loading values of pedestrian movement and pedestrian facilities on the two principal components (PC1 and PC2) in Principal Component Analysis (PCA). This Figure 9 displays histograms of PC1 and PC2 distributions. PC1 is concentrated between -1 and 0, with peaks around these values, indicating that a significant portion of the data points are clustered in this range. This pattern suggests the presence of common characteristics among the data points contributing to PC1. PC2 has multiple peaks around -1, 0, and 1, indicating a varied spread, which implies more complex underlying behaviours. The multiple peaks in PC2 suggest different types of pedestrian behaviours or conditions influencing their movement. Understanding these variations can help in identifying specific areas where pedestrian management strategies may need to be adjusted to cater to diverse movement patterns. Additionally, the distributions provide insights into which principal components contribute most to variations in pedestrian behaviour, aiding in the targeted improvement of crossing facilities.
The Figure 10 shows the distribution of data points along PC1 and PC2 after clustering. The points form a number of groups, indicating effective clustering and setting the stage for subsequent analyses. The separation of data points suggests inherent patterns in pedestrian movement, which can be leveraged to identify distinct behaviours or conditions. By understanding these natural groupings, designers can better address specific pedestrian needs and improve safety measures. Additionally, this visualization highlights areas where existing infrastructure may either facilitate or hinder pedestrian movement, offering insights for targeted interventions. The distinct group formations also indicate that different regions may require unique management strategies to enhance pedestrian safety and efficiency.
The Figure 11 and Table 8 demonstrate the distribution of the first two principal components (PC1 and PC2) across distinct clusters. The visual and numerical data highlight significant variations in median, interquartile range, and outlier presence among Clusters 0, 1, and 2. These differences suggest unique characteristics and behaviours within each cluster, reflecting distinct underlying factors that contribute to pedestrian safety behaviour in the studied context. The clustering analysis effectively captures heterogeneity in the dataset, as evidenced by the separation along PC1 and PC2 dimensions.
High PC1 values represent areas with well-developed traffic management and safety facilities, such as designated crossings and pedestrian refuges, indicating safer environments for pedestrians. These areas are characterized by organized infrastructure that supports safe pedestrian movement and minimizes the risk of conflicts with vehicles. In contrast, low PC1 values represent hazardous areas with minimal infrastructure, where the absence of adequate crossing facilities forces pedestrians to take risks, leading to a higher likelihood of accidents. These areas lack proper safety measures, making pedestrian-vehicle interactions more dangerous.
High PC2 values represent pedestrian behaviours involving less direct interaction with vehicles, typically found in environments with well-separated pedestrian pathways. These areas provide safer alternatives that reduce the need for pedestrians to share space with vehicles. Low PC2 values, on the other hand, indicate more direct interactions with vehicles, suggesting riskier pedestrian behaviours such as crossing roads at undesignated points or walking along the carriageway. Such behaviours are often a result of insufficient pedestrian infrastructure, leading to increased exposure to traffic hazards and a greater risk of accidents.
Cluster 0 areas lack physical crossing facilities, leading pedestrians to adopt risky crossing methods. Pedestrians often crossroads at undesignated locations, significantly increasing the risk of accidents due to inadequate safety measures. However, there is some use of safe facilities like footbridges, which indicates a potential area for further infrastructure expansion. Improving crossing facilities, such as adding zebra crossings, would significantly enhance safety in these high-risk areas. Moreover, public education campaigns focusing on safe road-crossing practices are crucial to mitigate the risks posed by current behaviours.
Cluster 1 has well-developed traffic management and pedestrian safety facilities, resulting in safer, more orderly pedestrian behaviours. These facilities, including zebra crossings, central refuges, and pedestrian lights, help guide pedestrian movement effectively, minimizing conflicts with vehicles. Despite the presence of these organized facilities, there are still instances of random crossings, which suggest that additional measures, such as barriers or pedestrian fencing, could further improve adherence to designated crossings. Implementing more visible signage and community awareness programs may also help reinforce safer pedestrian behaviours in these areas.
Cluster 2 areas have moderate crossing facilities, resulting in regulated pedestrian behaviour and lower pedestrian flow, reflecting good management but with room for facility improvement. The existing infrastructure includes basic crossing points that meet minimum requirements, but enhancements such as improved lighting, clearer markings, and additional pedestrian refuges could further elevate safety standards. Additionally, targeted interventions, like educational workshops on traffic rules and safe pedestrian habits, could bolster safety awareness. Investing in maintenance and upgrades of current facilities will ensure their continued effectiveness and increase pedestrian comfort, thereby fostering safer walking environments.
Based on the analysis of Clusters 0, 1, and 2, the following comprehensive practical significances can be summarized: Necessity of Traffic Management and Pedestrian Safety Facilities Cluster 0 highlights the risks associated with a lack of physical crossing facilities, while Cluster 1 shows the positive effects of well-developed facilities. Cluster 2 suggests that moderate facilities can maintain orderliness but still require improvement. Diversity of Pedestrian Behaviour and Its Management Cluster 0 exhibits disorderly pedestrian behaviour, Cluster 1 shows generally orderly behaviour despite diversity, and Cluster 2 reflects regulated behaviour in low-traffic areas. Targeted Improvement Recommendations Cluster 0 requires significant enhancements in crossing facilities, Cluster 1 should optimize management to accommodate diverse behaviours, and Cluster 2 can benefit from increased safety awareness and facility improvements. Optimized Resource Allocation Resource allocation should prioritize enhancing facilities in Cluster 0, optimizing management in Cluster 1, and focusing on education and facility enhancements in Cluster 2.
5. Discussion
5.1. Models
The heatmap analysis effectively identified high-risk areas by visualizing the spatial distribution of pedestrian accidents. By employing a matrix representation, it was possible to highlight specific combinations of locations and crossing facilities where pedestrian risk is elevated. For example, zebra crossings were identified as well-aligned with pedestrian behaviours, leading to higher compliance rates. In contrast, underutilized infrastructures like footbridges and subways suggested that convenience and accessibility are significant determinants of pedestrian choices. These findings emphasize that well-placed and visible pedestrian infrastructure can significantly influence safety and compliance.
Association rule learning provided a deeper understanding of the underlying patterns between pedestrian behaviours and their surrounding environments. The association rules extracted relationships such as the high-risk behaviours associated with the absence of nearby crossing facilities, and the preference for zebra crossings. The high-confidence rules indicated that most pedestrians do not have access to nearby facilities, resulting in unsafe crossing practices. The significant association between infrastructure placement and pedestrian compliance underscores the necessity for careful facility planning and optimization to enhance road safety.
PCA, in combination with clustering, helped reduce the complexity of the data while revealing underlying groupings of pedestrian behaviours. By retaining key principle components that explained the most variance in the dataset, PCA enabled the visualization of the most impactful features. The clustering approach revealed distinct pedestrian behaviour groups, highlighting similarities and differences across various unsignalized crossings. These clusters allowed for targeted analysis of high-risk behaviours and their associated infrastructural contexts. The integration of PCA and clustering was essential in simplifying the dataset and supporting a structured analysis of the diverse behaviour patterns observed.
5.2. Engineering Findings Implications
The relationship between pedestrian behaviour and infrastructure design highlights critical opportunities for improving safety, with clear evidence supporting the role of specific interventions. Zebra crossings and central refuges emerge as pivotal elements in fostering pedestrian compliance and reducing accidents. [35] Heatmap analyses consistently show that these facilities, when conveniently located, significantly enhance safety by guiding pedestrians toward designated crossing points. Zebra crossings, with their high visibility, serve as effective psychological cues, encouraging compliance even in busy traffic environments. Similarly, central refuges reduce crossing distances, providing pedestrians with safe havens in the middle of wide or high-speed roads, thereby mitigating risks. These findings underscore the importance of thoughtful placement and integration of such facilities in areas with high pedestrian flow or increased vehicular traffic. By aligning infrastructure design with pedestrian movement patterns, planners can achieve substantial safety gains, particularly in urban environments [36].
On the other hand, grade-separated crossings, such as footbridges and subways, often fail to achieve their intended safety benefits due to poor design and placement. While these structures offer potential safety advantages by separating pedestrian and vehicle flows, their underutilization highlights a disconnect between design intentions and user behaviour.[37] Additionally, integrating these features with surrounding pedestrian networks ensures a seamless experience, encouraging compliance and reducing risk exposure [38].
The absence of nearby crossing facilities poses another significant safety challenge, as shown by association rule analysis. Areas lacking formal crossings within a 50-meter radius frequently experience higher pedestrian accident rates, often due to risky behaviours like crossing at undesignated locations. This issue underscores the urgent need for targeted interventions in high-risk areas. By analysing pedestrian flow and informal crossing patterns, urban planners can identify critical gaps in infrastructure and implement solutions. These interventions not only enhance safety but also align with pedestrian preferences, reducing the prevalence of unsafe behaviours while fostering a culture of compliance. Such data-driven approaches enable planners to prioritize resources effectively, focusing on locations where interventions yield the highest safety benefits [39].
Advanced analytical techniques like PCA and clustering further enrich the understanding of pedestrian behaviours and safety dynamics, enabling a more nuanced and data-driven approach to infrastructure planning. PCA reduces the complexity of multidimensional datasets, retaining the most influential features while allowing planners to focus on critical variables. When combined with clustering, these techniques reveal distinct patterns of pedestrian behaviour and infrastructure effectiveness across various contexts. For instance, Cluster 0 represents areas with a lack of crossing facilities, exhibiting high-risk pedestrian behaviours and urgent need for infrastructural interventions. In contrast, Cluster 1, characterized by developed facilities but diverse compliance levels, suggests opportunities for optimization through better management and enhanced guidance. Cluster 2 highlights areas with moderate risk and regulated behaviour, indicating the value of continued infrastructure improvements and educational initiatives. By leveraging these insights, planners can classify crossings into safety profiles, enabling the development of tailored interventions that address specific risks. Moreover, clustering supports the systematic deployment of safety measures, allowing regions with similar risk profiles to benefit from comparable solutions, thereby streamlining resource allocation and maximizing safety outcomes.
5.3. Challenges and Limitations
The study faced several challenges and limitations, particularly in data quality and generalizability. The primary dataset, STATS19, though comprehensive, relies on police-reported incidents, which may lead to biases due to underreporting of minor accidents or inconsistencies in report quality. The lack of consistent data for near-miss incidents, which could provide valuable insights into potential risk scenarios, further limits the analysis. As a result, the conclusions drawn may not fully represent all pedestrian safety concerns, particularly those related to unreported minor incidents or non-collision safety hazards.
Methodologically, the clustering approach used in conjunction with PCA has limitations in the interpretability of clusters. While PCA effectively reduces data dimensionality, the transformation can sometimes obscure the specific features that contribute to each cluster's formation. This complexity makes it challenging to translate clustering results directly into actionable infrastructural changes. A more interpretable dimensionality reduction technique, or combining PCA with domain-specific insights, could improve the practical utility of the clustering results.
Another significant challenge was the variability in pedestrian behaviour across different demographic and geographic contexts. The behaviours observed at unsignalized crossings in one urban area may not generalize to other regions with different cultural norms or infrastructural layouts. This variability necessitates caution when attempting to apply the findings universally. Localized studies that consider regional characteristics of pedestrian movement and infrastructure usage would be necessary to validate the broader applicability of the proposed interventions.
Finally, there were computational challenges related to handling the high-dimensional dataset. The need for significant preprocessing to clean and prepare the data for analysis was time intensive. Missing data, particularly for certain infrastructural attributes, required imputation, which may introduce biases into the results. Addressing these computational challenges through automated preprocessing tools and improved data collection protocols could enhance the reliability of future studies.
6. Conclusions
This study utilized heatmap analysis, association rule learning, and PCA with clustering to analyse pedestrian safety at unsignalized crossings. Each method provided unique insights into pedestrian behaviours and their interactions with infrastructure. The heatmap analysis highlighted high-risk areas, while association rule learning uncovered significant relationships between behaviours and facility availability. PCA and clustering facilitated a deeper understanding of behaviour patterns by reducing data complexity and identifying distinct groups.
The engineering findings underscore the importance of strategically placed pedestrian facilities, to enhance compliance and safety. Underutilized facilities like footbridges need design improvements to better align with pedestrian preferences. Challenges in data quality, interpretability, and generalizability were identified, indicating the need for localized studies and enhanced data collection efforts. Future work should focus on improving infrastructure accessibility, optimizing facility placement, and employing advanced data analysis techniques to support effective pedestrian safety interventions.
Author Contributions
Shengqi Liu: Writing–review & editing, Writing–original draft, Visualization, Validation, Software, Methodology, Investigation, Formal analysis, Data curation, Conceptualization. Harry Evdorides: Writing – review & editing, Supervision.
Funding
Not applicable.
Institutional Review Board Statement
Not applicable.
Informed Consent Statement
Not applicable.
Data Availability Statement
The data presented in this study are available on request from the corresponding author.
Acknowledgments
Not applicable.
Conflicts of Interest
The authors declare that they have no known competing financial interests or personal relationships that could have appeared to influence the work reported in this paper.
References
- Shiwakoti, Nirajan, Richard Tay, and Peter Stasinopoulos. "Development, testing, and evaluation of road safety poster to reduce jaywalking behaviour at intersections." Cognition, Technology & Work 22 (2020): 389-397.Author 1, A.; Author 2, B. Title of the chapter. In Book Title, 2nd ed.; Editor 1, A., Editor 2, B., Eds.; Publisher: Publisher Location, Country, 2007; Volume 3, pp. 154–196.
- Mukherjee, Deotima, and Pritam Saha. "Walking behaviour and safety of pedestrians at different types of facilities: a review of recent research and future research needs." SN Social Sciences 2.5 (2022): 76. [CrossRef]
- John, Vijay, et al. "Visible and thermal camera-based jaywalking estimation using a hierarchical deep learning framework." Proceedings of the Asian Conference on Computer Vision. 2020.
- International Road Assessment Programme. iRAP Star Rating and Investment Plan Manual[J]. 2021.
- Canale, Sascia, Natalia Distefano, and Salvatore Leonardi. "Comparative analysis of pedestrian accidents risk at unsignalized intersections." The Baltic Journal of Road and Bridge Engineering 10.4 (2015): 283-292. [CrossRef]
- Arhin, Stephen A., and Adam Gatiba. "Predicting crash injury severity at unsignalized intersections using support vector machines and naïve Bayes classifiers." Transportation safety and environment 2.2 (2020): 120-132. [CrossRef]
- Haleem, Kirolos, Priyanka Alluri, and Albert Gan. "Analyzing pedestrian crash injury severity at signalized and non-signalized locations." Accident Analysis & Prevention 81 (2015): 14-23. [CrossRef]
- Rankavat, Shalini, and G. E. E. T. A. M. Tiwari. "Pedestrian accident analysis in Delhi using GIS." Journal of the Eastern Asia Society for Transportation Studies 10 (2013): 1446-1457.
- Das, Subasish, et al. "Fatal pedestrian crashes at intersections: Trend mining using association rules." Accident Analysis & Prevention 160 (2021): 106306. [CrossRef]
- Ghomi, Haniyeh, and Mohamed Hussein. "An integrated text mining, literature review, and meta-analysis approach to investigate pedestrian violation behaviours." Accident Analysis & Prevention 173 (2022): 106712. [CrossRef]
- Hu, Lin, et al. "Investigation of clusters and injuries in pedestrian crashes using GIS in Changsha, China." Safety science 127 (2020): 104710. [CrossRef]
- Ivanović, Biljana, et al. "A Novel Integrated Model under Fuzzy Environments as Support for Determining the Behaviour of Pedestrians at Unsignalized Pedestrian Crossings." Mathematical Problems in Engineering 2022.1 (2022): 8118952.
- Varsha, Thakkellapati Charitha, et al. "Pedestrian behaviour analysis at intersection in Vijayawada for road user safety and infrastructure design." IOP Conference Series: Earth and Environmental Science. Vol. 1280. No. 1. IOP Publishing, 2023. [CrossRef]
- Noh, Byeongjoon, et al. "Vision-based potential pedestrian risk analysis on unsignalized crosswalk using data mining techniques." Applied Sciences 10.3 (2020): 1057. [CrossRef]
- Kathuria, Ankit, and Perumal Vedagiri. "Evaluating pedestrian vehicle interaction dynamics at un-signalized intersections: A proactive approach for safety analysis." Accident Analysis & Prevention 134 (2020): 105316. [CrossRef]
- Makarova, Irina, et al. "Simulation modeling in improving pedestrians’ safety at non-signalized crosswalks." Transport problems 11 (2016). [CrossRef]
- Gårder, Per. "Pedestrian safety at traffic signals: a study carried out with the help of a traffic conflicts technique." Accident Analysis & Prevention 21.5 (1989): 435-444. [CrossRef]
- Khalid, Nurul Shakila, et al. "MODEL OF PEDESTRIAN CROSSING BEHAVIOUR BASED ON ROAD TRAFFIC AND HUMAN FACTORS: A CASE STUDY OF MALAYSIA’S SHAH ALAM CITY." PLANNING MALAYSIA 21 (2023). [CrossRef]
- Gitelman, Victoria, et al. "Characterization of pedestrian accidents and an examination of infrastructure measures to improve pedestrian safety in Israel." Accident Analysis & Prevention 44.1 (2012): 63-73. [CrossRef]
- Miranda-Moreno, Luis F., Patrick Morency, and Ahmed M. El-Geneidy. "The link between built environment, pedestrian activity and pedestrian–vehicle collision occurrence at signalized intersections." Accident Analysis & Prevention 43.5 (2011): 1624-1634.
- Prato, Carlo Giacomo, Victoria Gitelman, and Shlomo Bekhor. "Mapping patterns of pedestrian fatal accidents in Israel." Accident Analysis & Prevention 44.1 (2012): 56-62. [CrossRef]
- Mukherjee, Dipanjan, and Sudeshna Mitra. "A comparative study of safe and unsafe signalized intersections from the view point of pedestrian behaviour and perception." Accident Analysis & Prevention 132 (2019): 105218.
- Cinnamon, Jonathan, Nadine Schuurman, and S. Morad Hameed. "Pedestrian injury and human behaviour: observing road-rule violations at high-incident intersections." PloS one 6.6 (2011): e21063. [CrossRef]
- Hossain, Ahmed, et al. "Investigating pedestrian crash patterns at high-speed intersection and road segments: Findings from the unsupervised learning algorithm." International Journal of Transportation Science and Technology 14 (2024): 186-201. [CrossRef]
- Short, John Rennie, and Luis Mauricio Pinet-Peralta. "No accident: Traffic and pedestrians in the modern city." Mobilities 5.1 (2010): 41-59. [CrossRef]
- Schneider, Robert J., et al. "Association between roadway intersection characteristics and pedestrian crash risk in Alameda County, California." Transportation Research Record 2198.1 (2010): 41-51. [CrossRef]
- Sheykhfard, Abbas, et al. "Review and assessment of different perspectives of vehicle-pedestrian conflicts and crashes: Passive and active analysis approaches." Journal of traffic and transportation engineering (English edition) 8.5 (2021): 681-702. [CrossRef]
- Stefanova, Teodora, et al. "Systems-based approach to investigate unsafe pedestrian behaviour at level crossings." Accident Analysis & Prevention 81 (2015): 167-186. [CrossRef]
- Singh D, Das P, Ghosh I. Prediction of pedestrian crossing behaviour at unsignalized intersections using machine learning algorithms: analysis and comparison[J]. Journal on Multimodal User Interfaces, 2024: 1-18.
- Department for Transport. Road Traffic Accident Data in Great Britain (STATS19)[DB/OL]. https://www.data.gov.uk/dataset/cb7ae6f0-4be6-4935-9277-47e5ce24a11f.
- Henry Small. Road Casualties: Comparing Police Data (STATS19) with Other Sources of Information [R]. Welsh Government, 2012.
- Netek R, Pour T, Slezakova R. Implementation of heat maps in geographical information system–exploratory study on traffic accident data[J]. Open Geosciences, 2018, 10(1): 367-384.
- Feng M, Zheng J, Ren J, et al. Association rule mining for road traffic accident analysis: A case study from UK[C]//Advances in Brain Inspired Cognitive Systems: 10th International Conference, BICS 2019, Guangzhou, China, July 13–14, 2019, Proceedings 10. Springer International Publishing, 2020: 520-529.
- Ding C, He X. K-means clustering via principal component analysis[C]//Proceedings of the twenty-first international conference on Machine learning. 2004: 29.
- National Academies of Sciences, Engineering, and Medicine. A Guide for Reducing Collisions Involving Pedestrians[J]. 2004.
- Caltrans. Pedestrian Safety Countermeasures Toolbox. California Department of Transportation, June 2019.
- Alluri P, Kadeha C, Wu W, et al. Guidelines for installing pedestrian treatments at midblock locations[J]. 2020.
- Blackburn L, Zegeer C V, Brookshire K. Guide for improving pedestrian safety at uncontrolled crossing locations[R]. United States. Federal Highway Administration. Office of Safety, 2018.
- Blackburn L, Zegeer C V, Brookshire K. Field Guide for Selecting Countermeasures at Uncontrolled Pedestrian Crossing Locations[R]. United States. Federal Highway Administration. Office of Safety, 2018.
Figure 1.
Process of overall methodology.
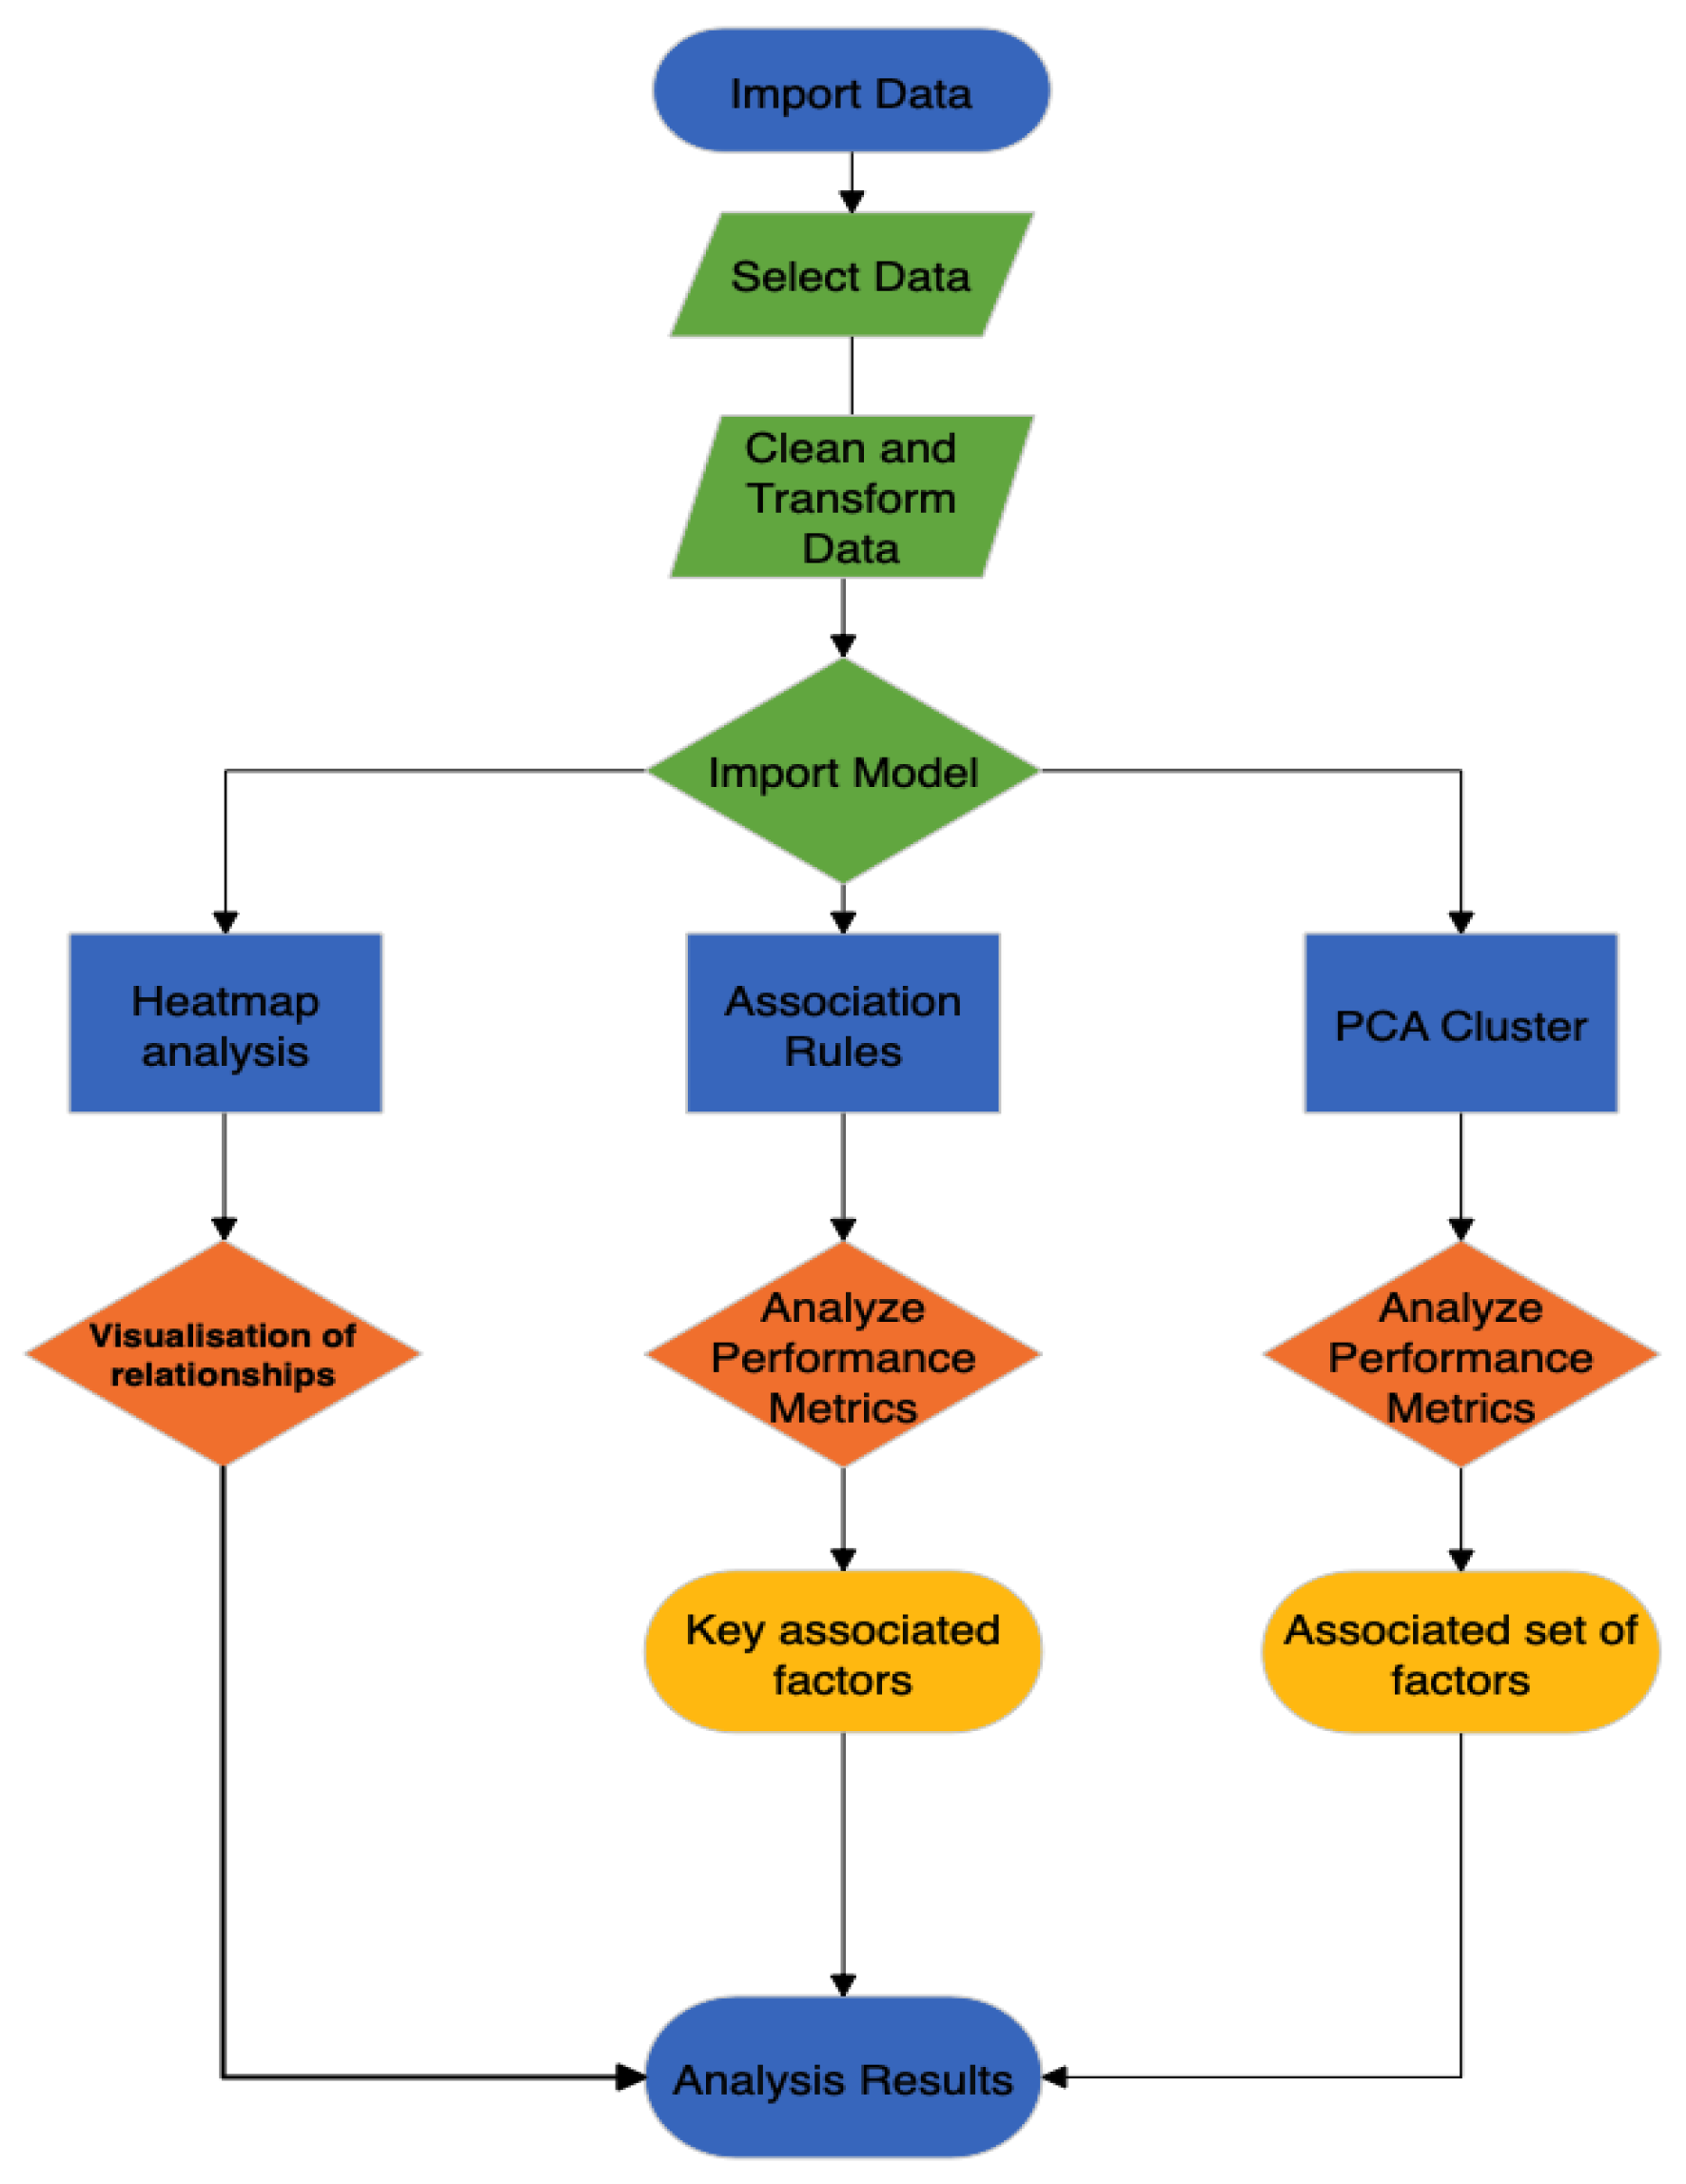
Figure 2.
Heatmap (pedestrian facilities/pedestrian location).
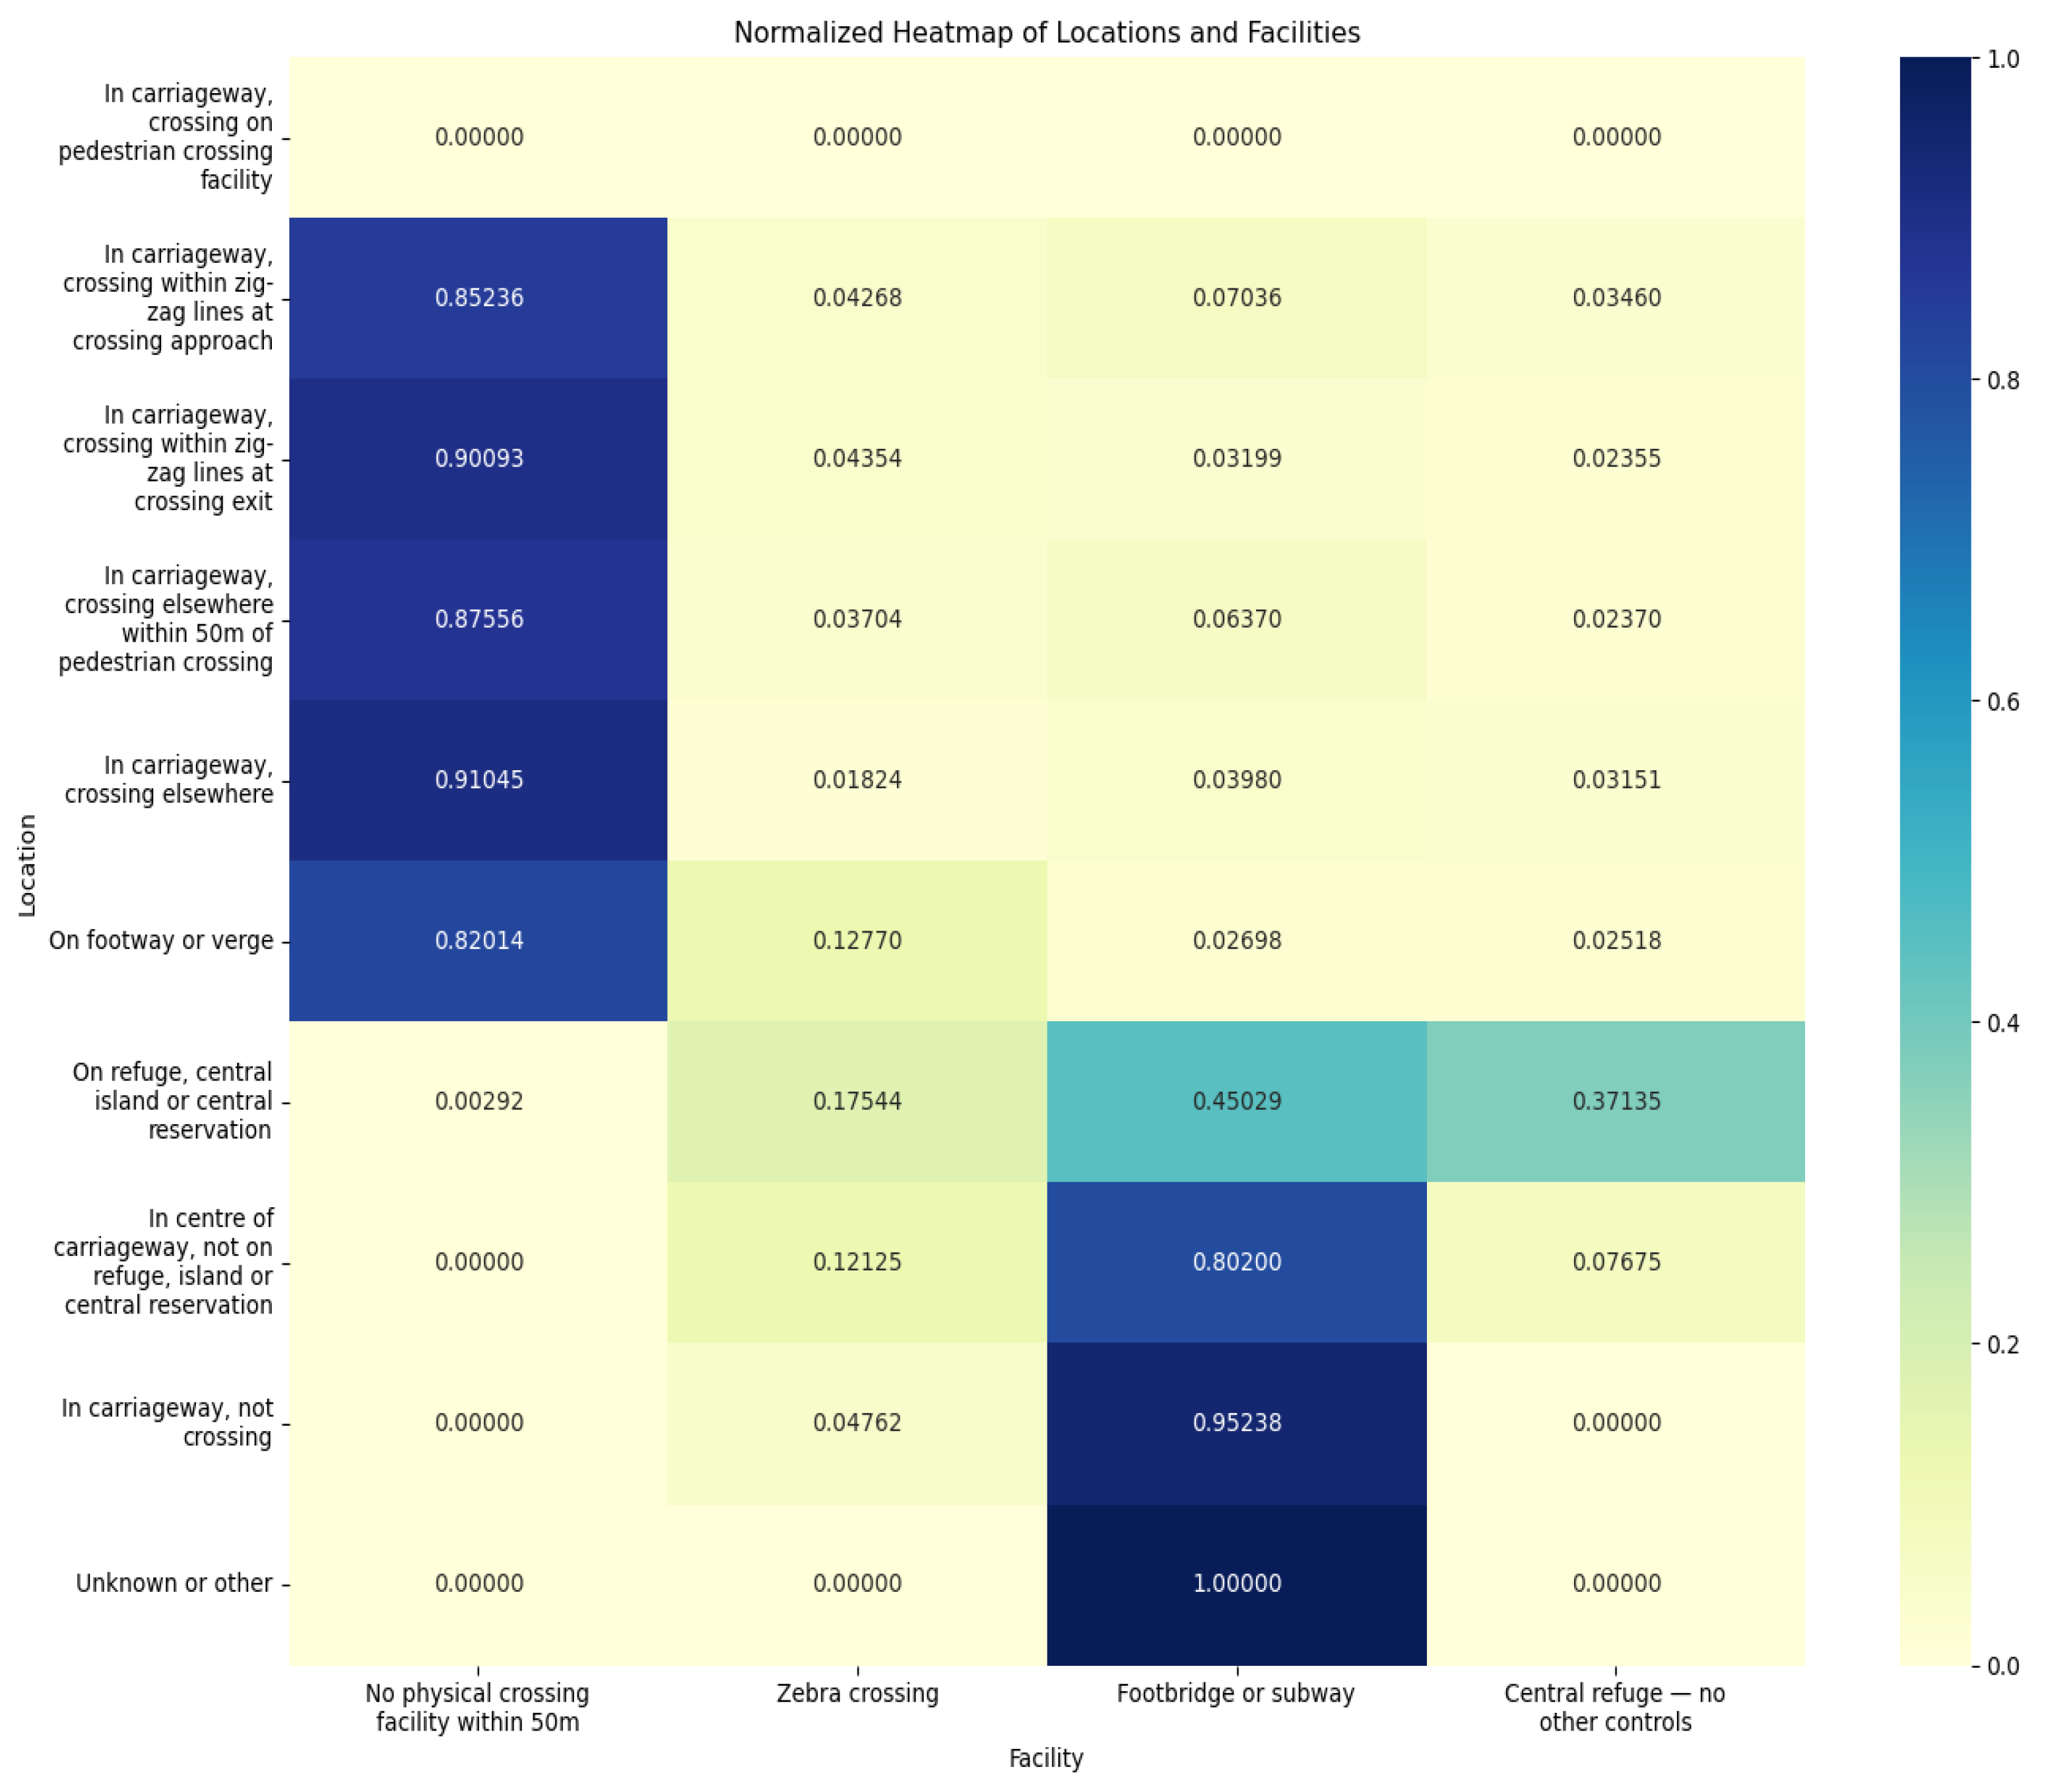
Figure 3.
Heatmap (pedestrian facilities/pedestrian movement).
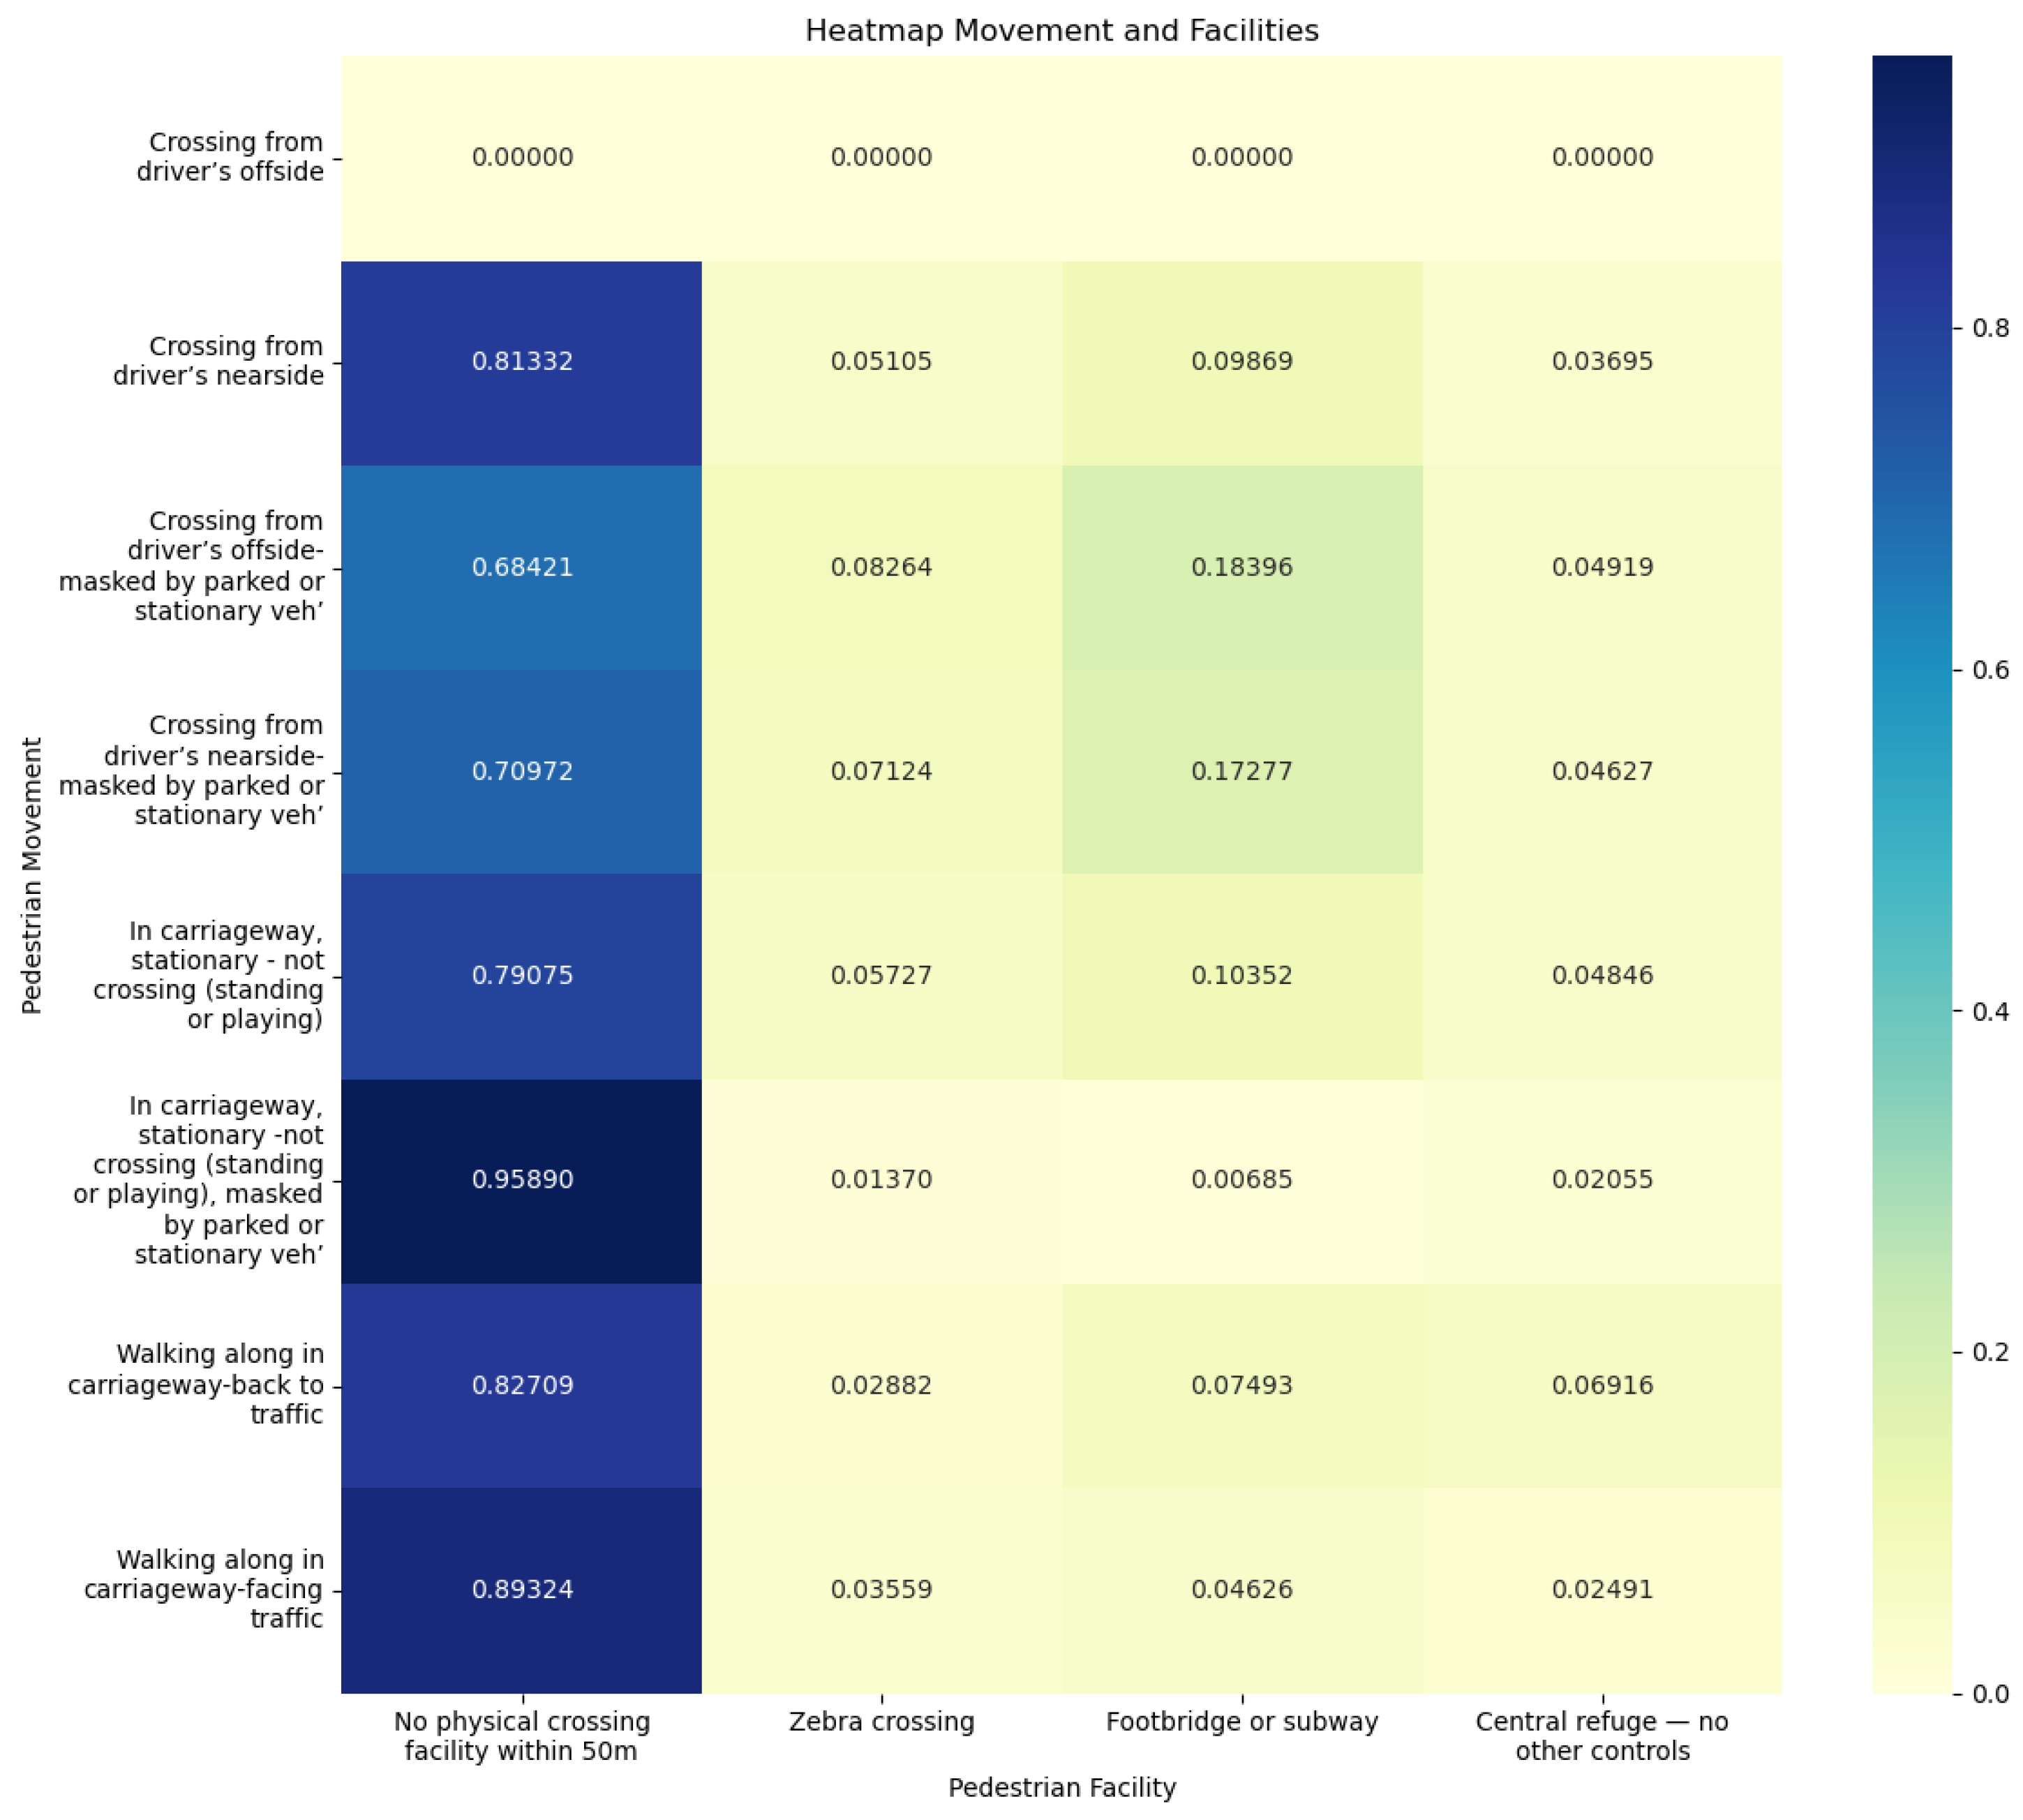
Figure 4.
Distribution of High Support, High Confidence, and High Lift.
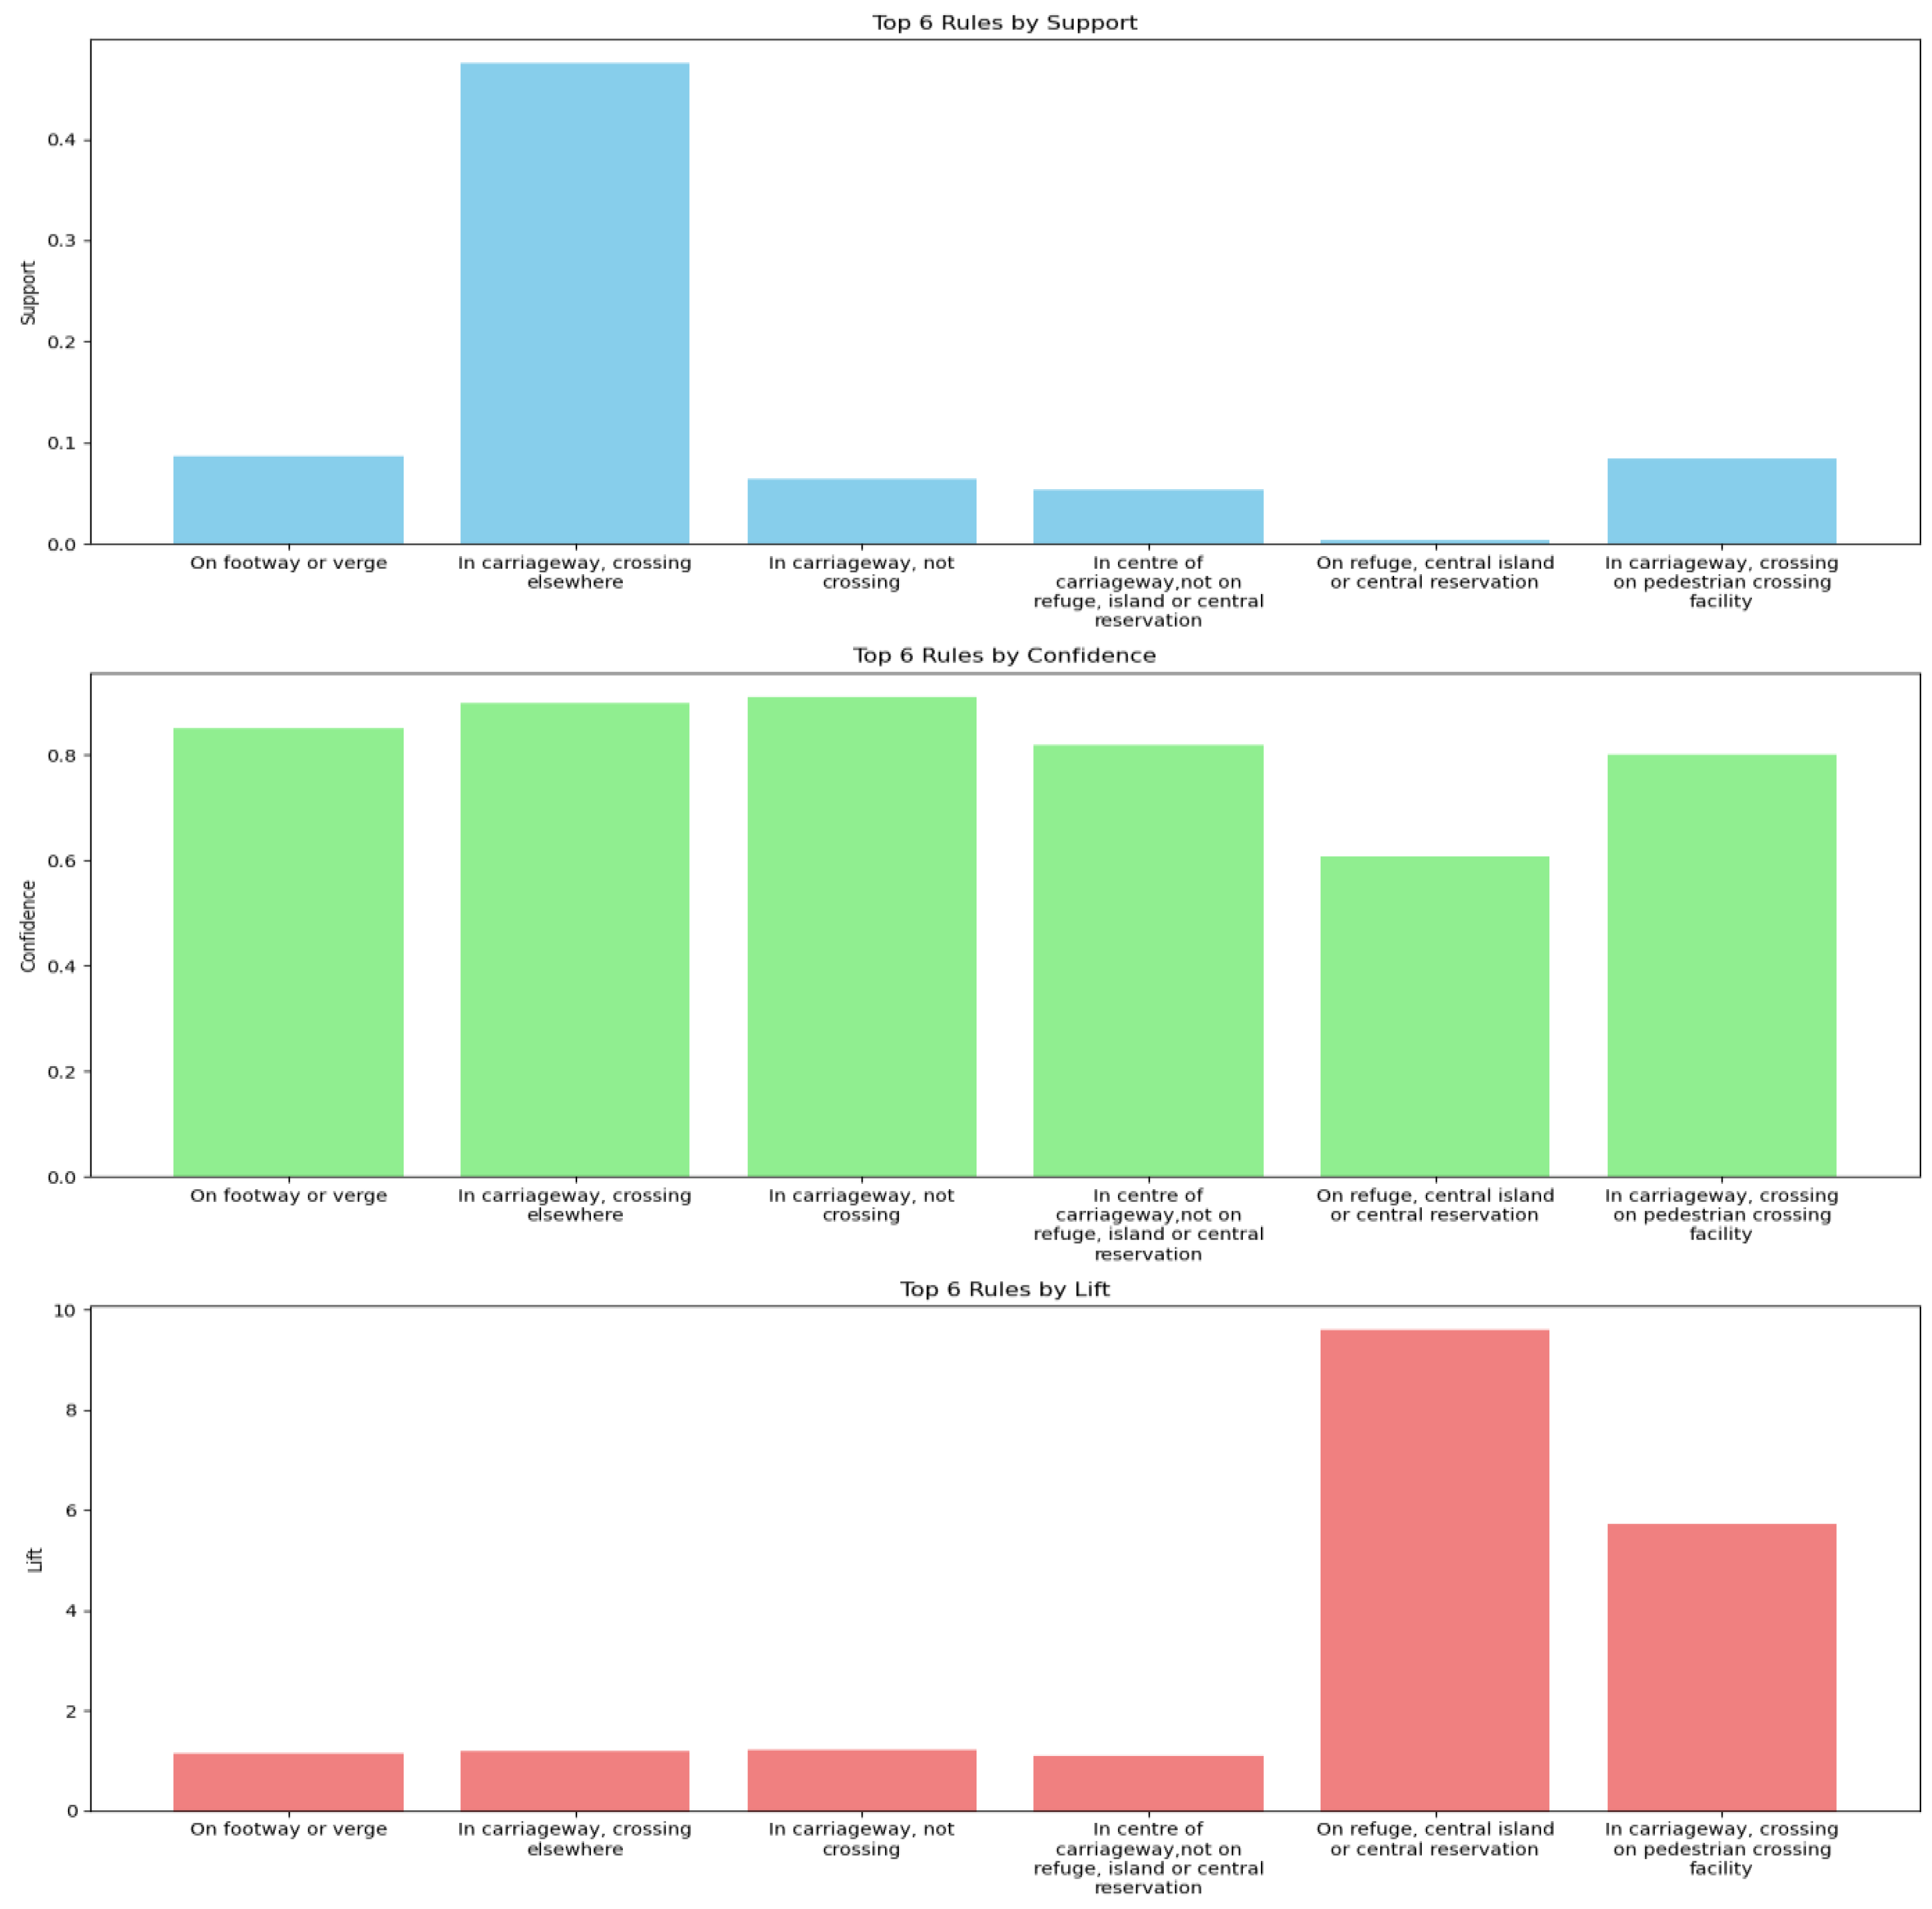
Figure 5.
Distribution of High Support, High Confidence, and High Lift.
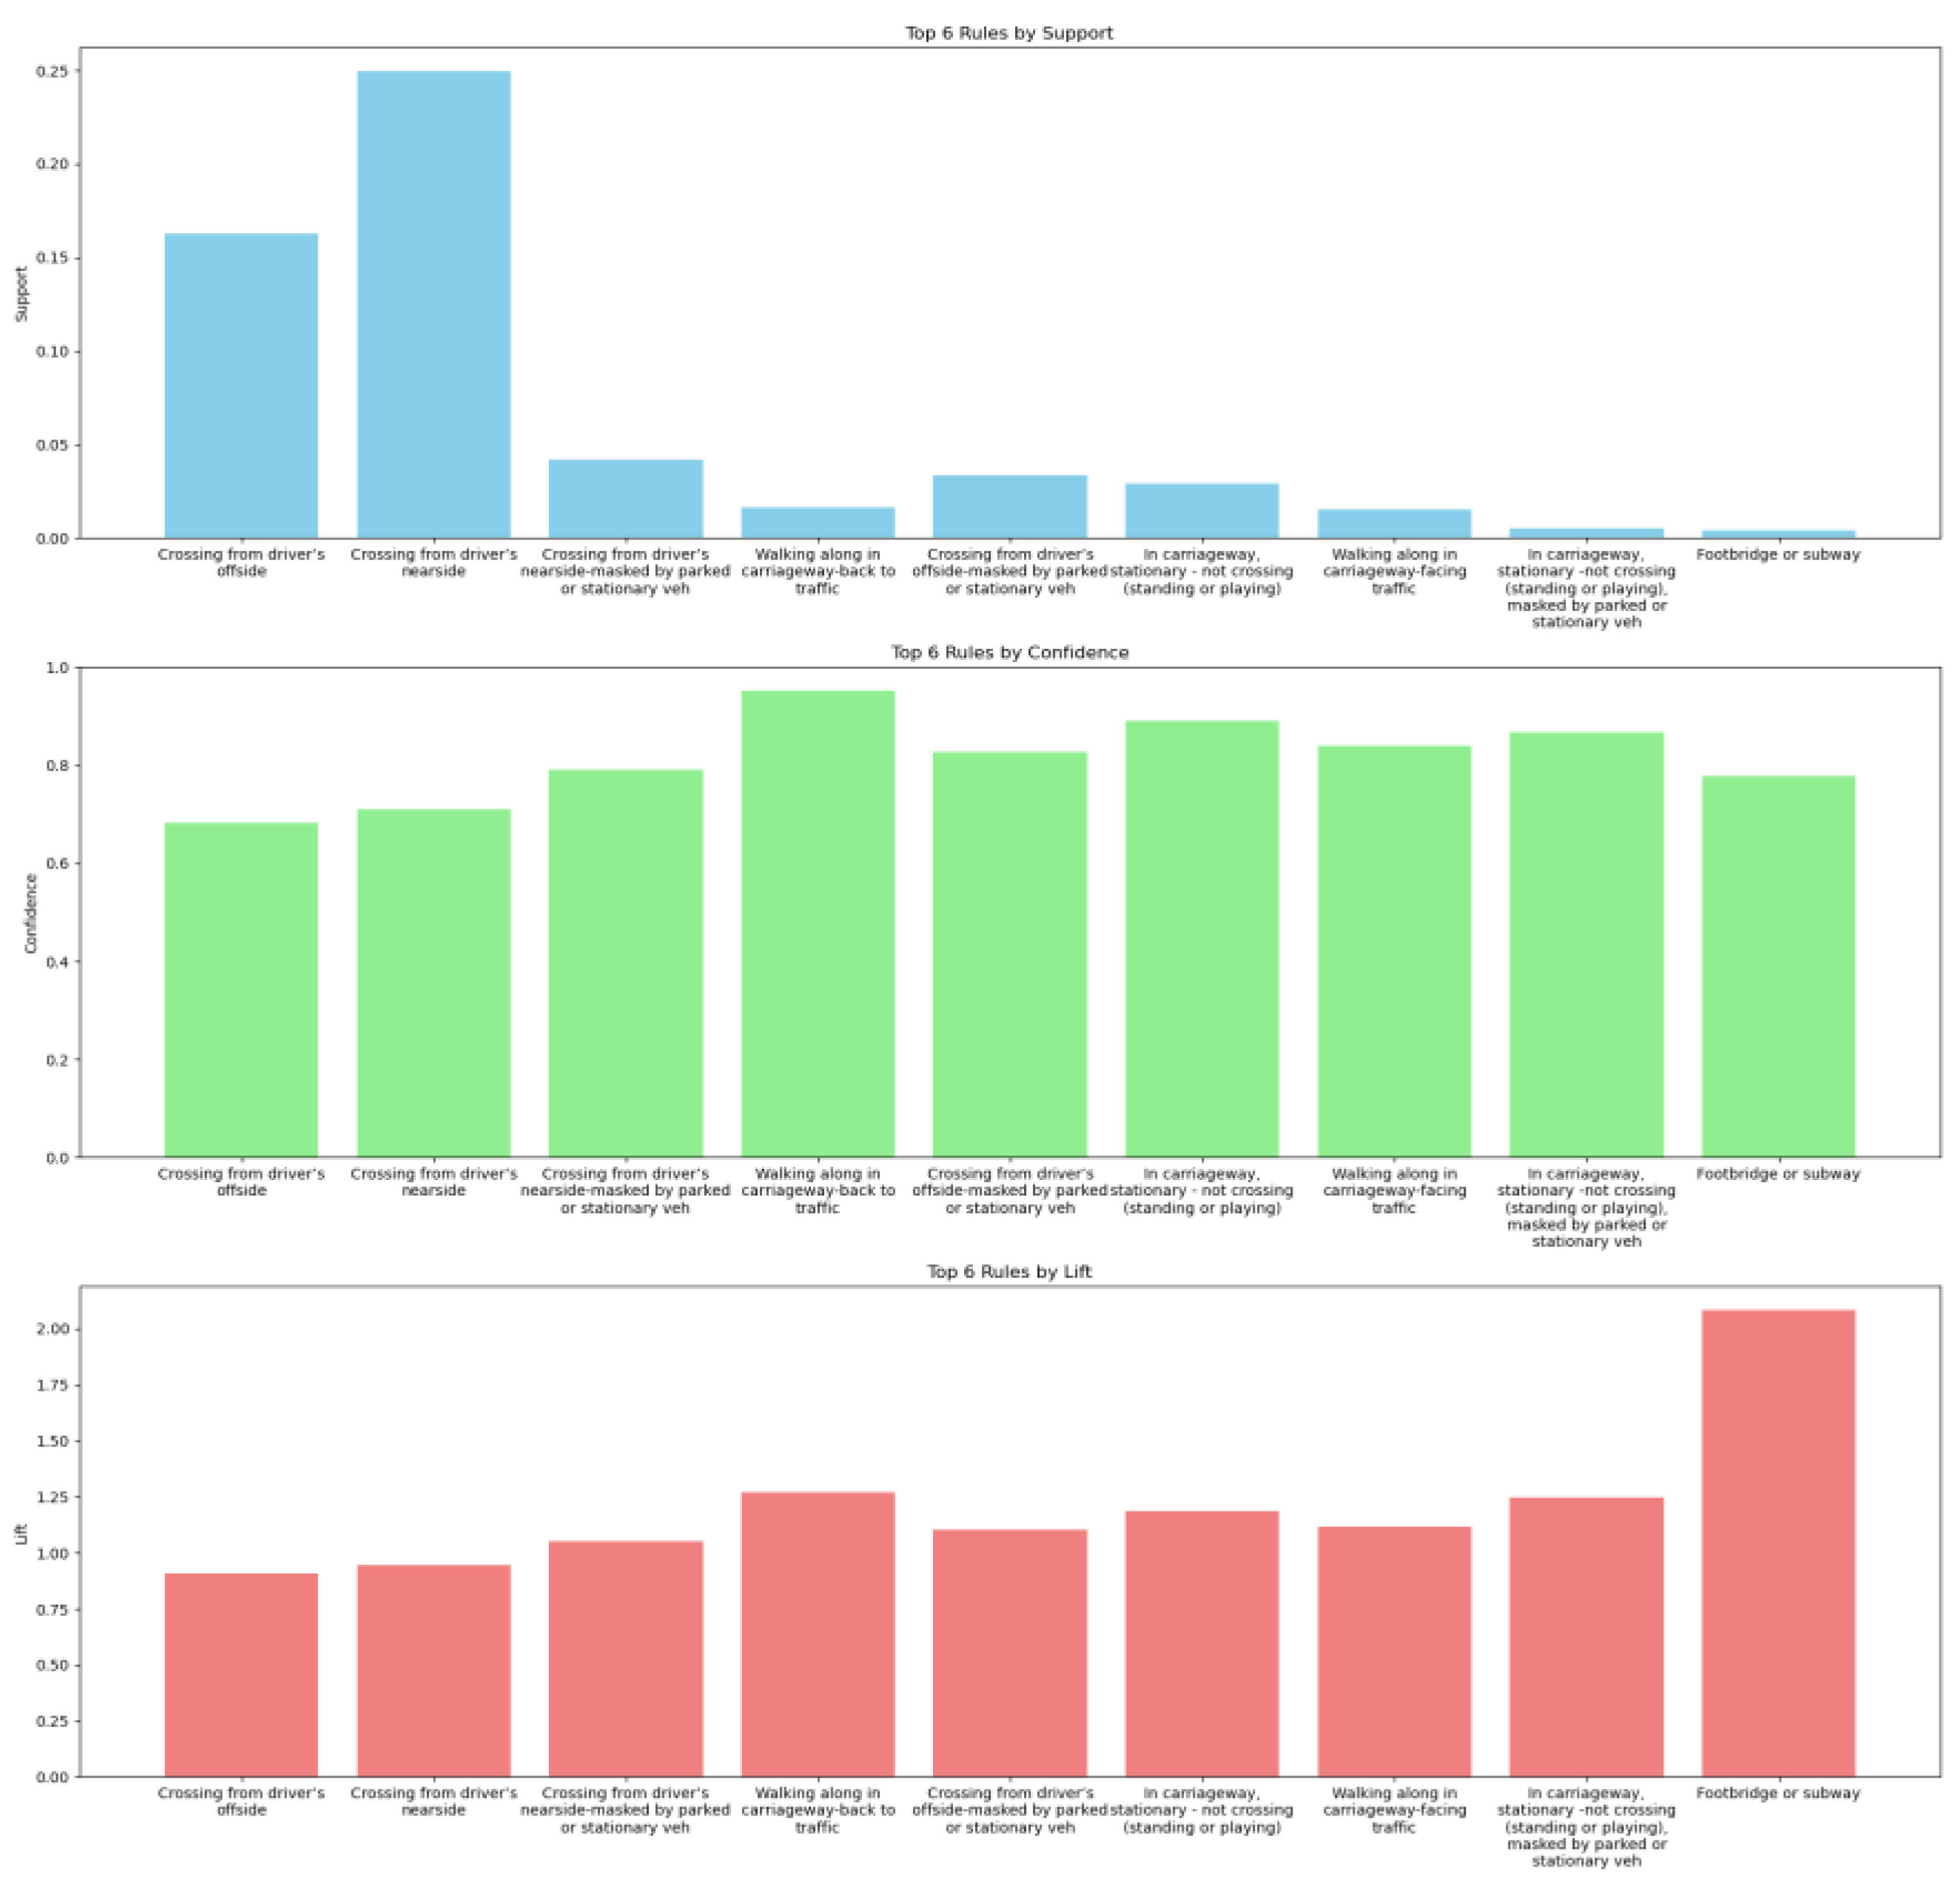
Figure 6.
Pedestrian Location Distribution of Principal Components.
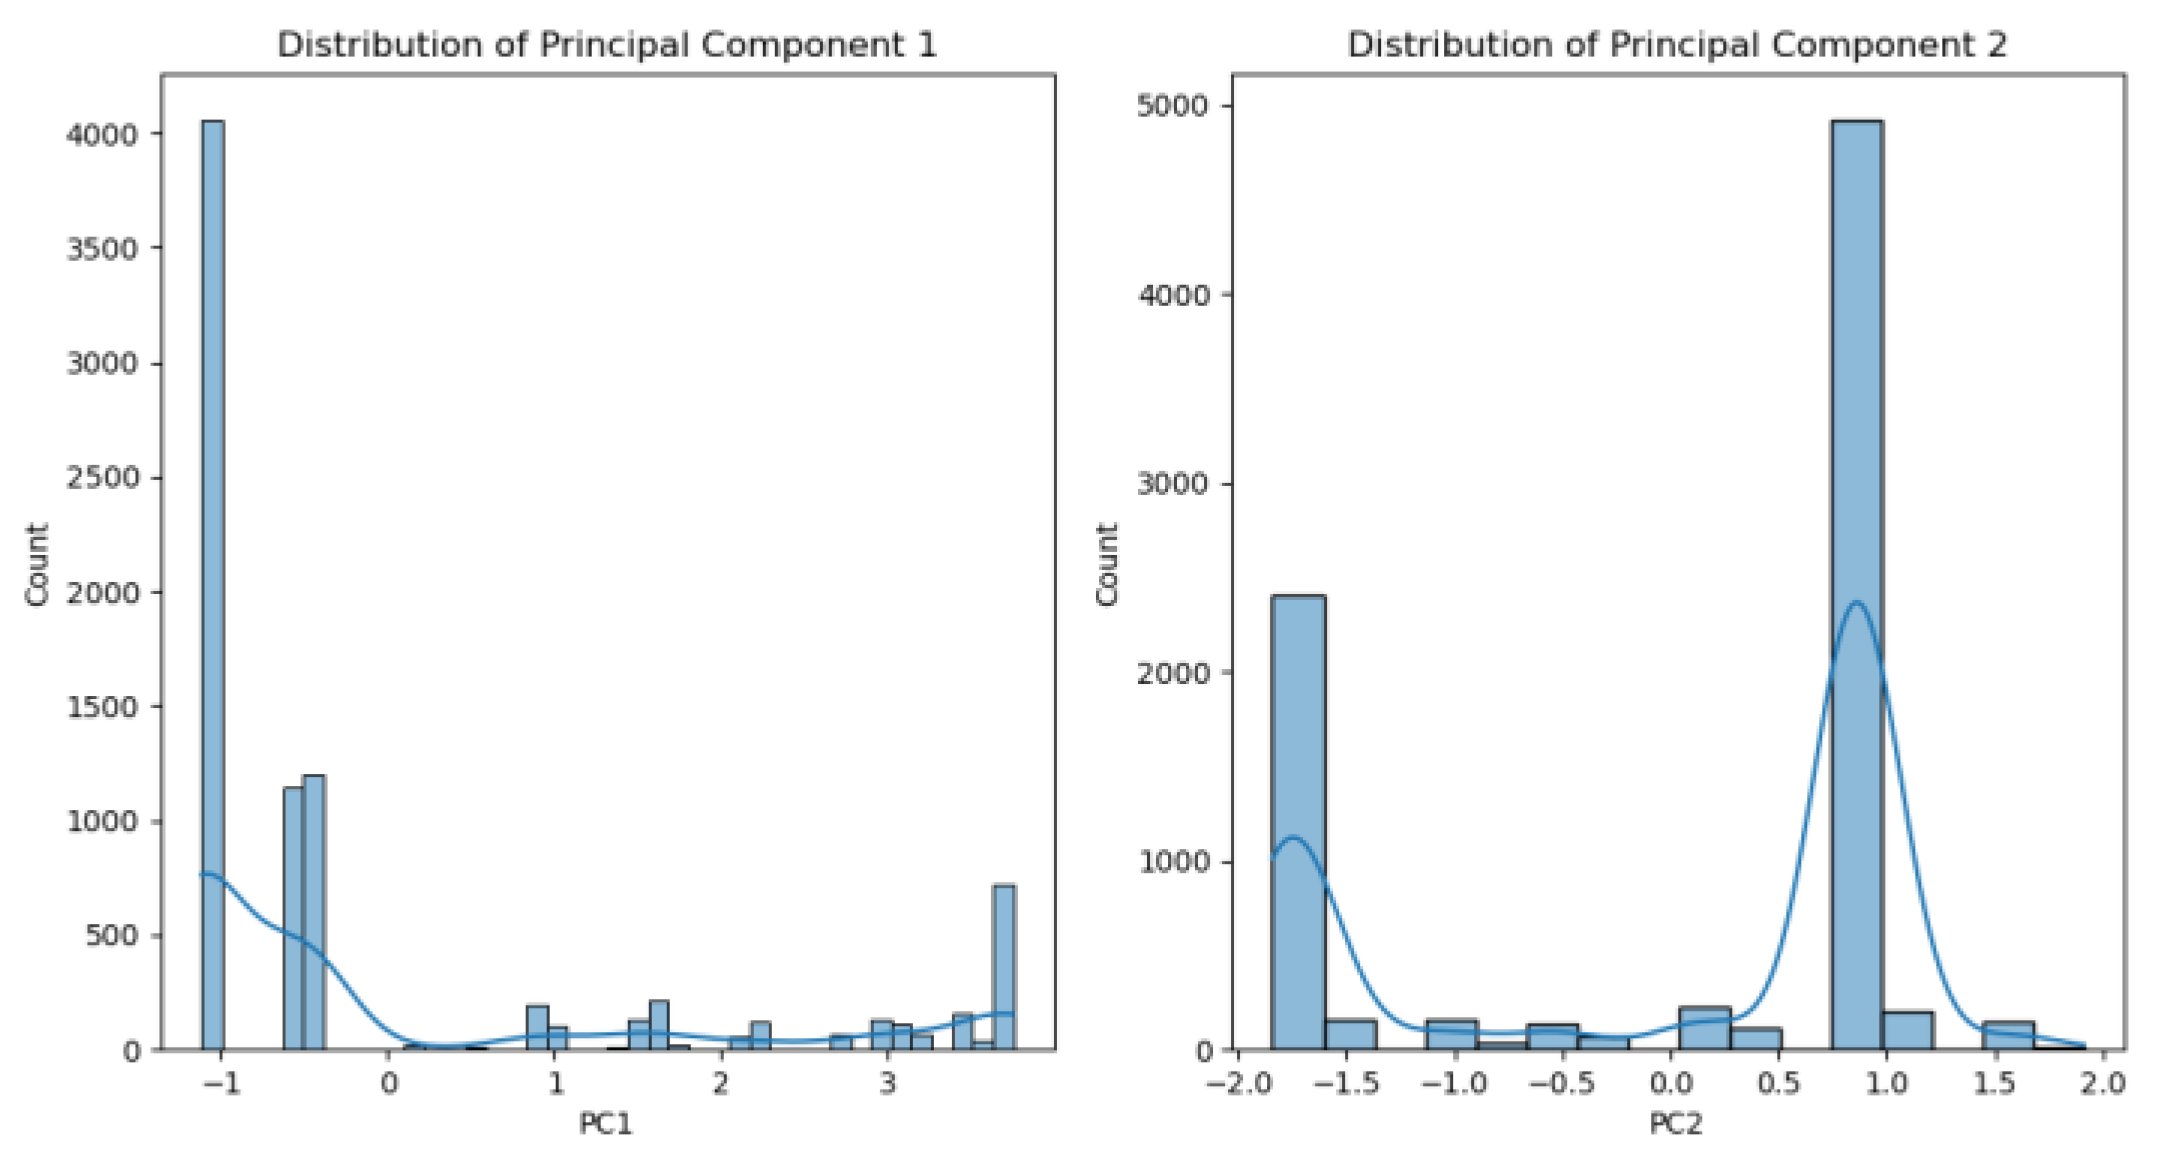
Figure 7.
Pedestrian Location Clustering after PCA.
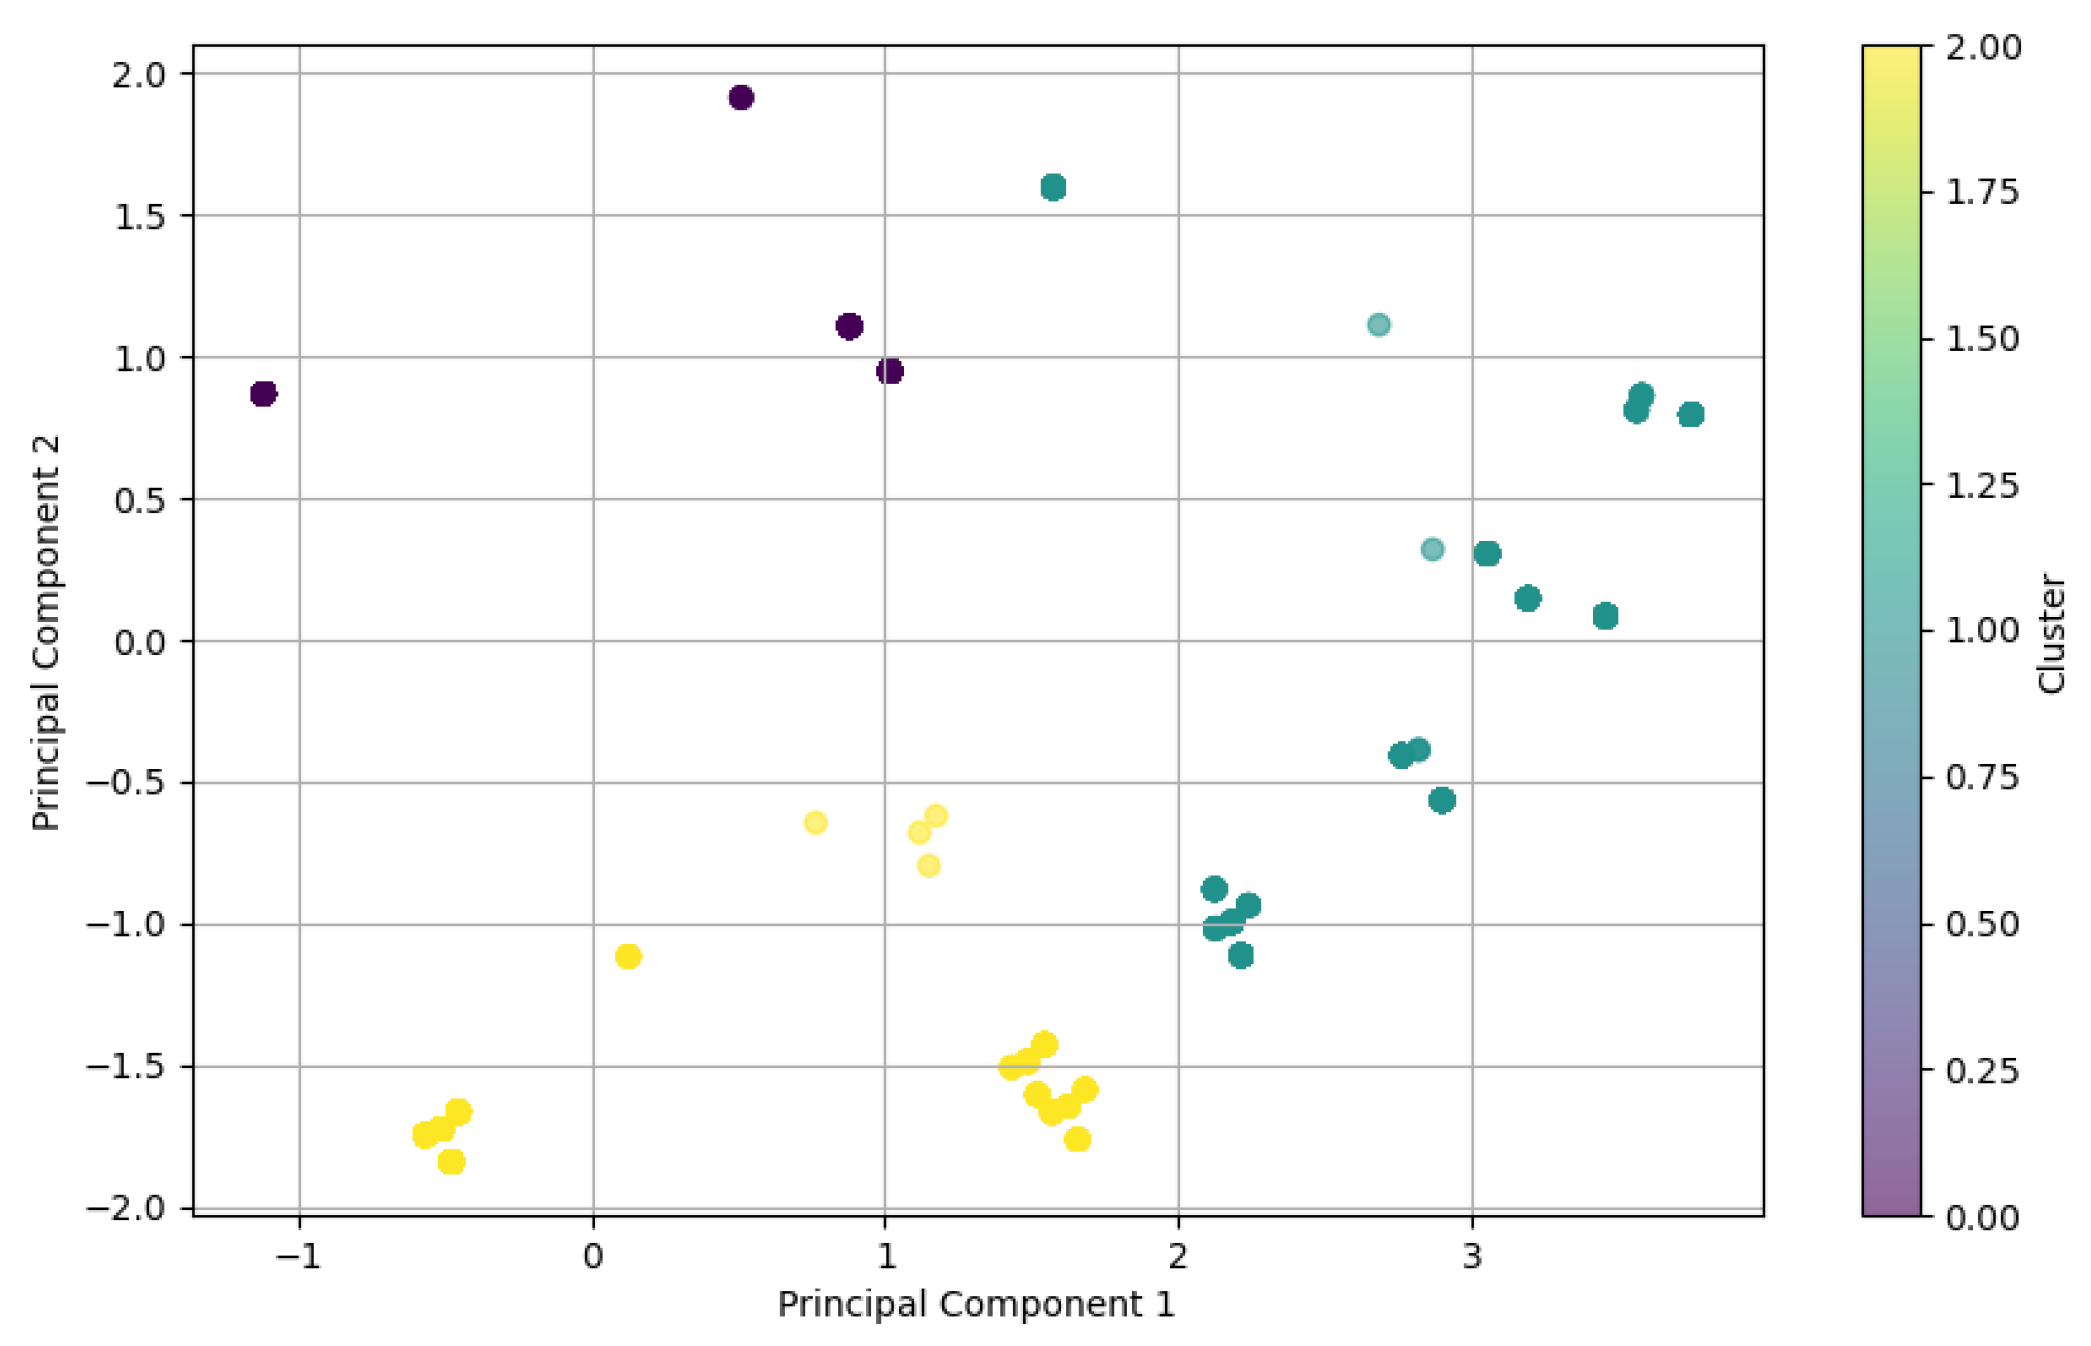
Figure 8.
Pedestrian Location Boxplot of PC1 and PC2 by Cluster.
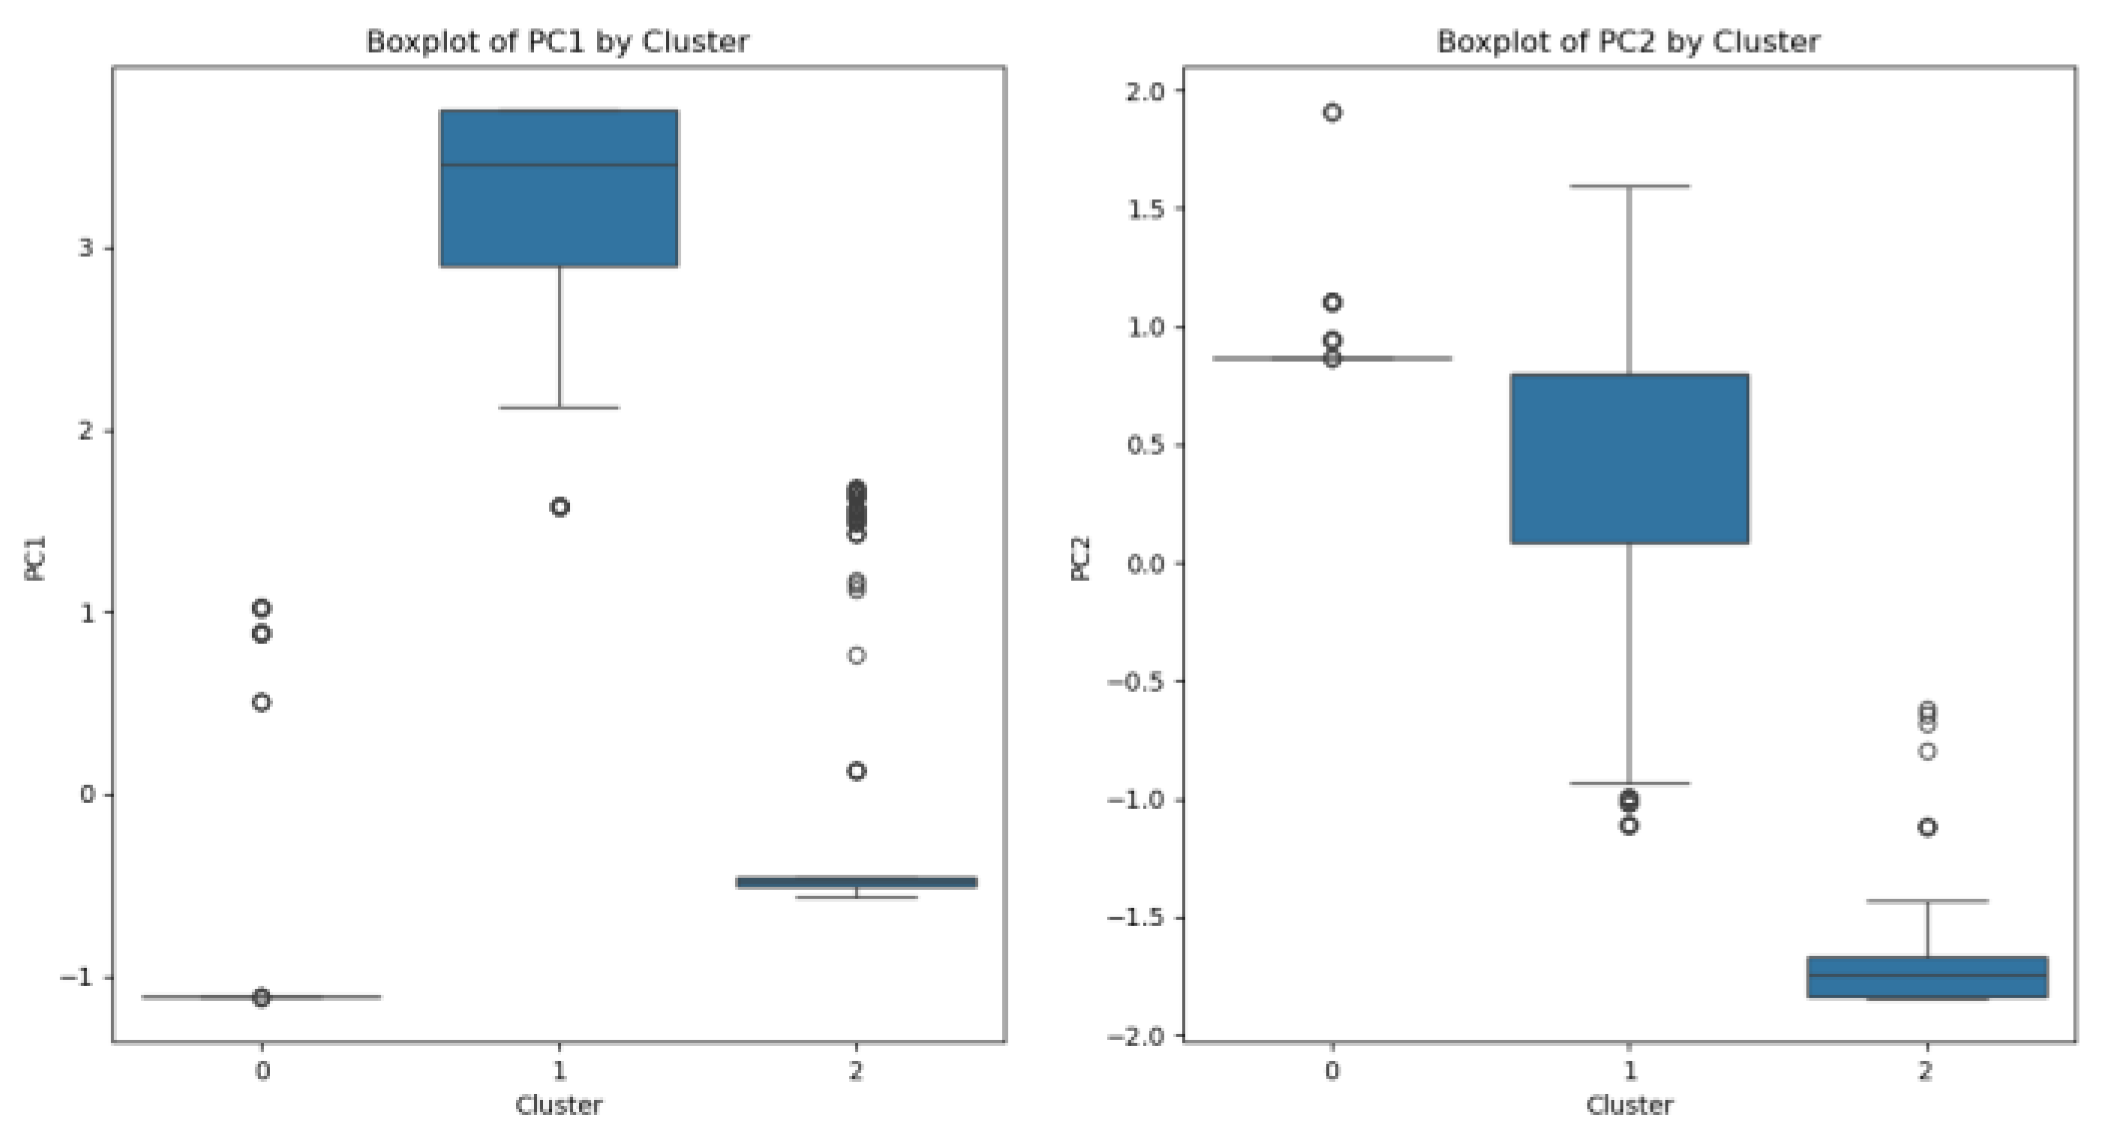
Figure 9.
Pedestrian Location Distribution of Principal Components.
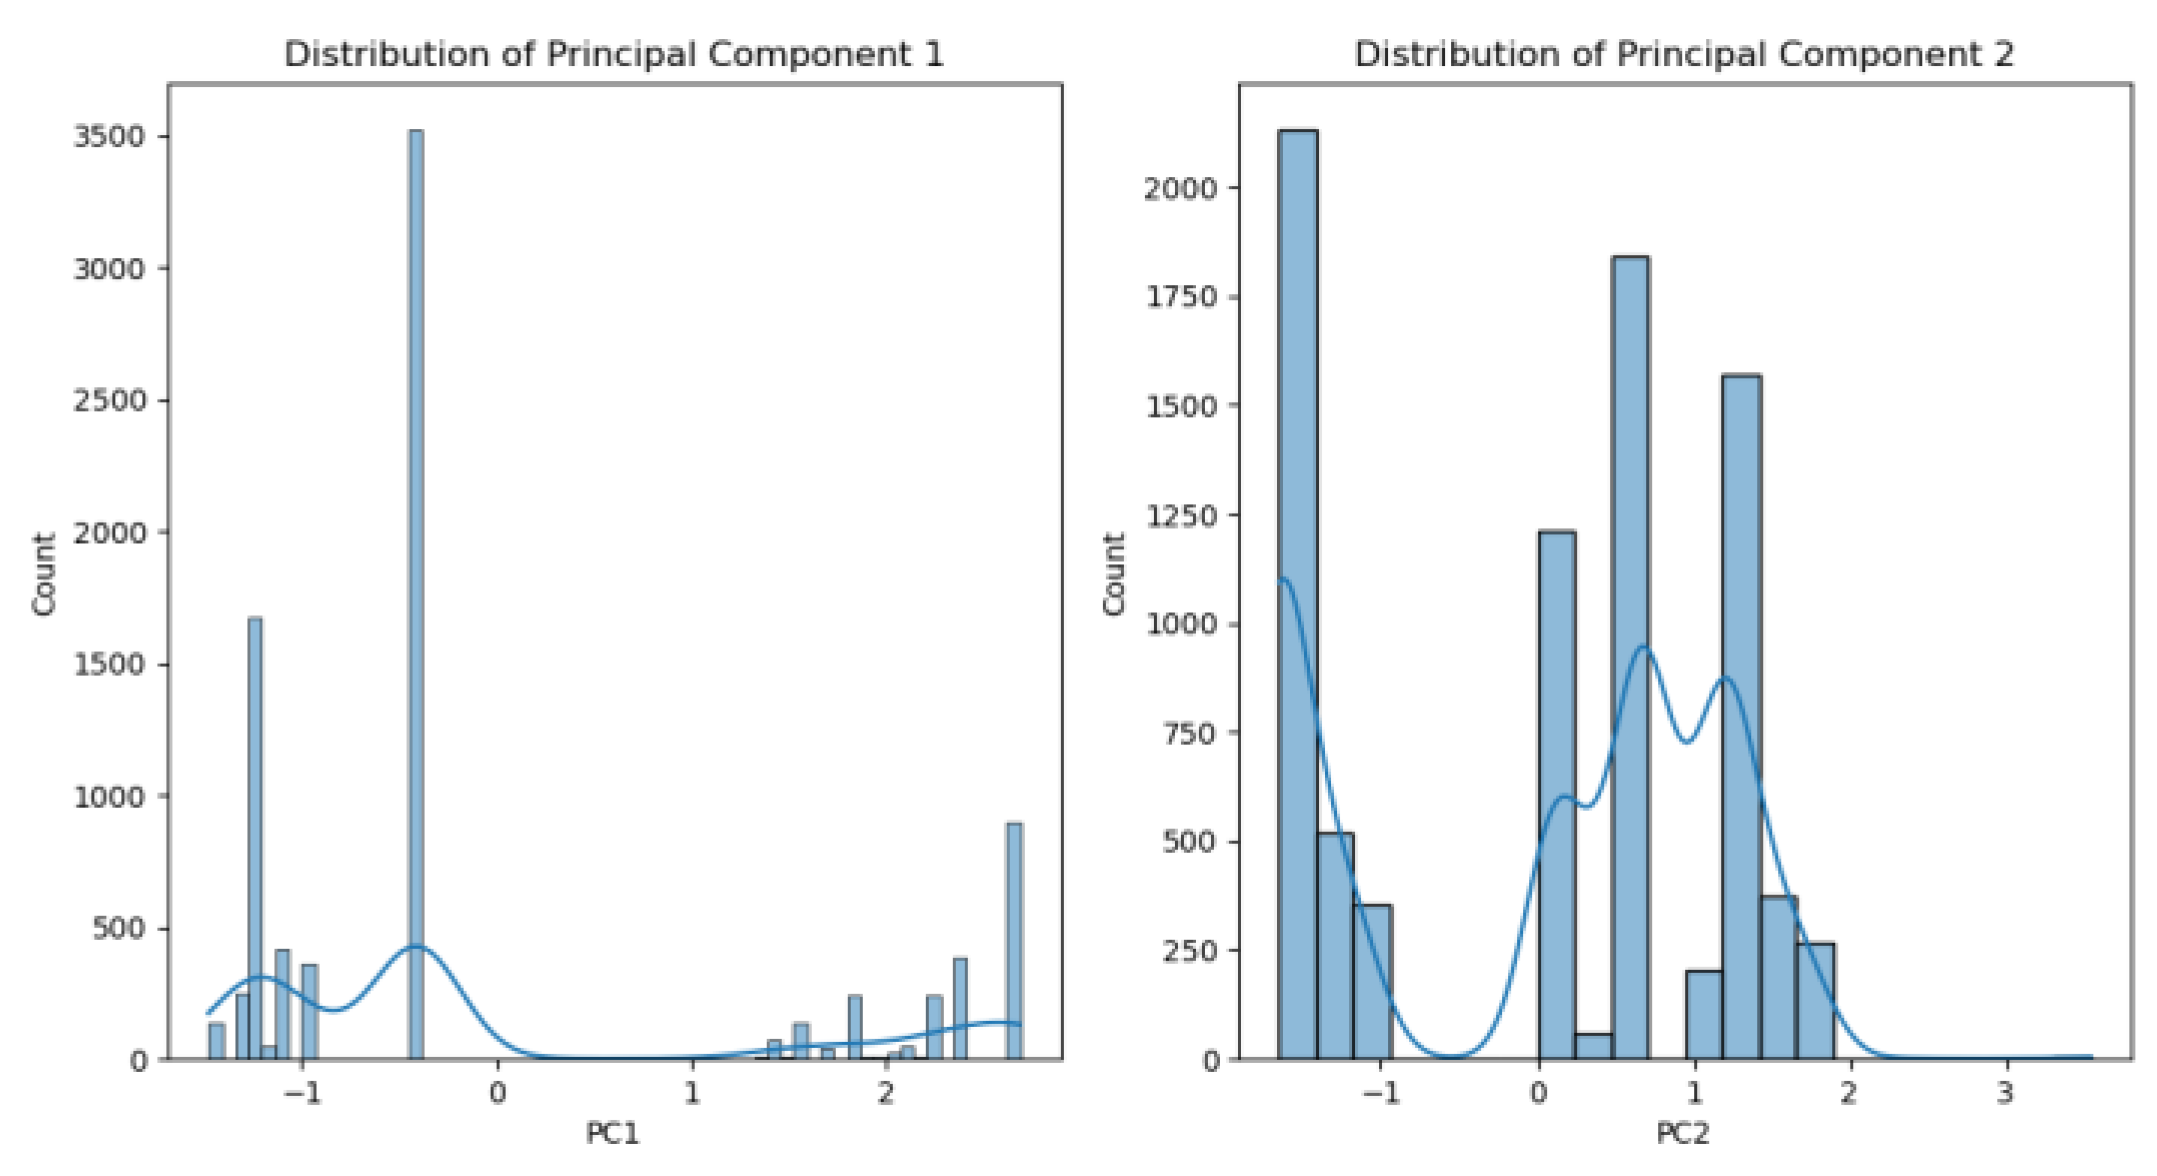
Figure 10.
Pedestrian Movement Clustering after PCA.
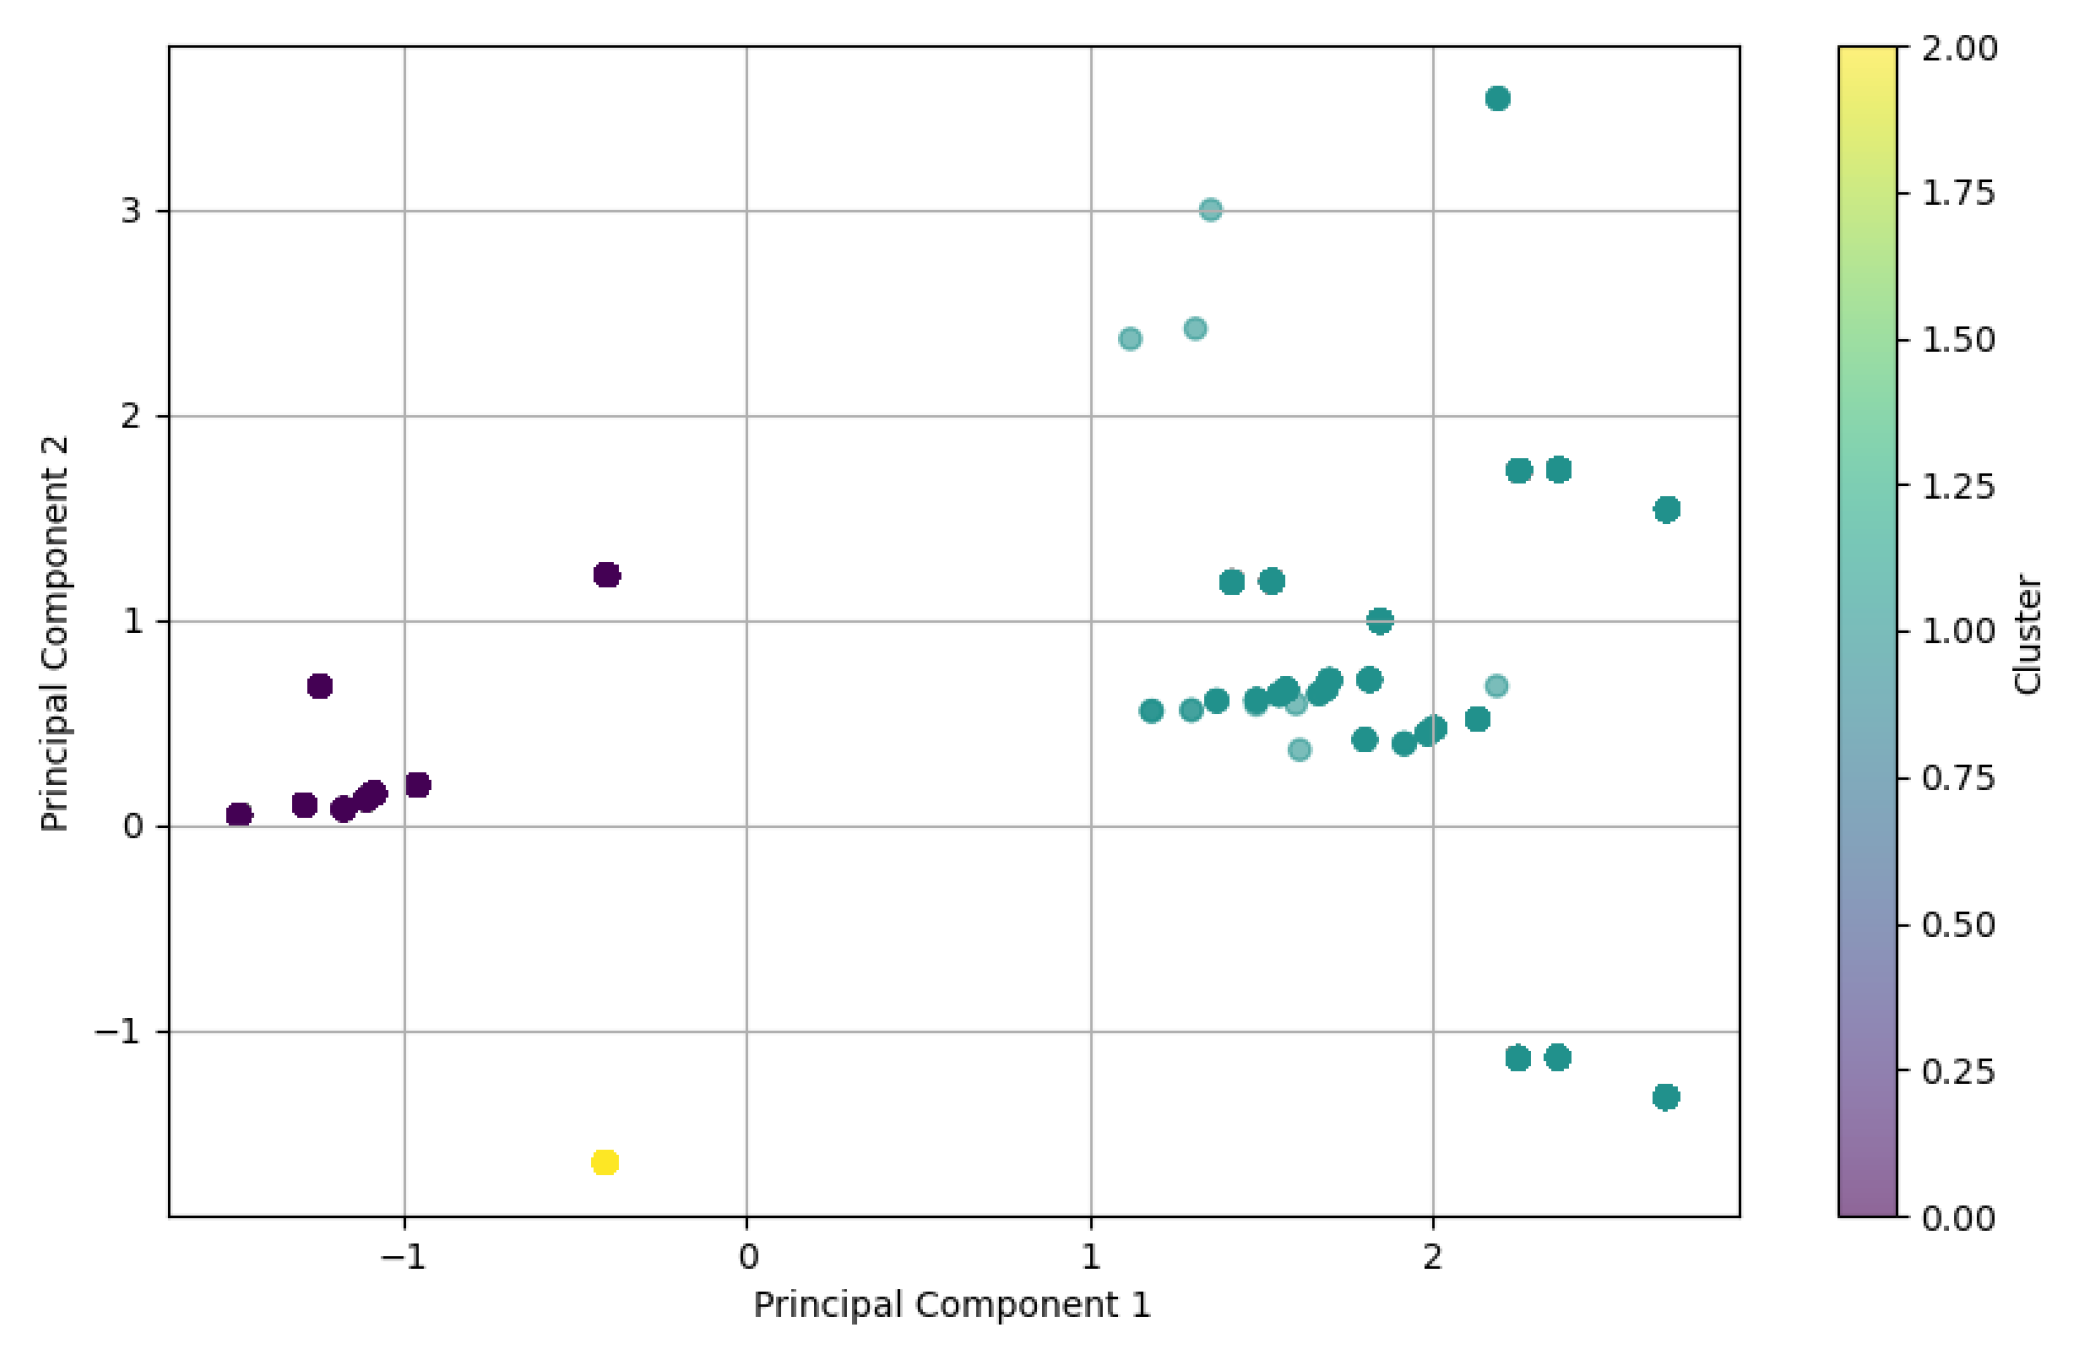
Figure 11.
Pedestrian Location Boxplot of PC1 and PC2 by Cluster.
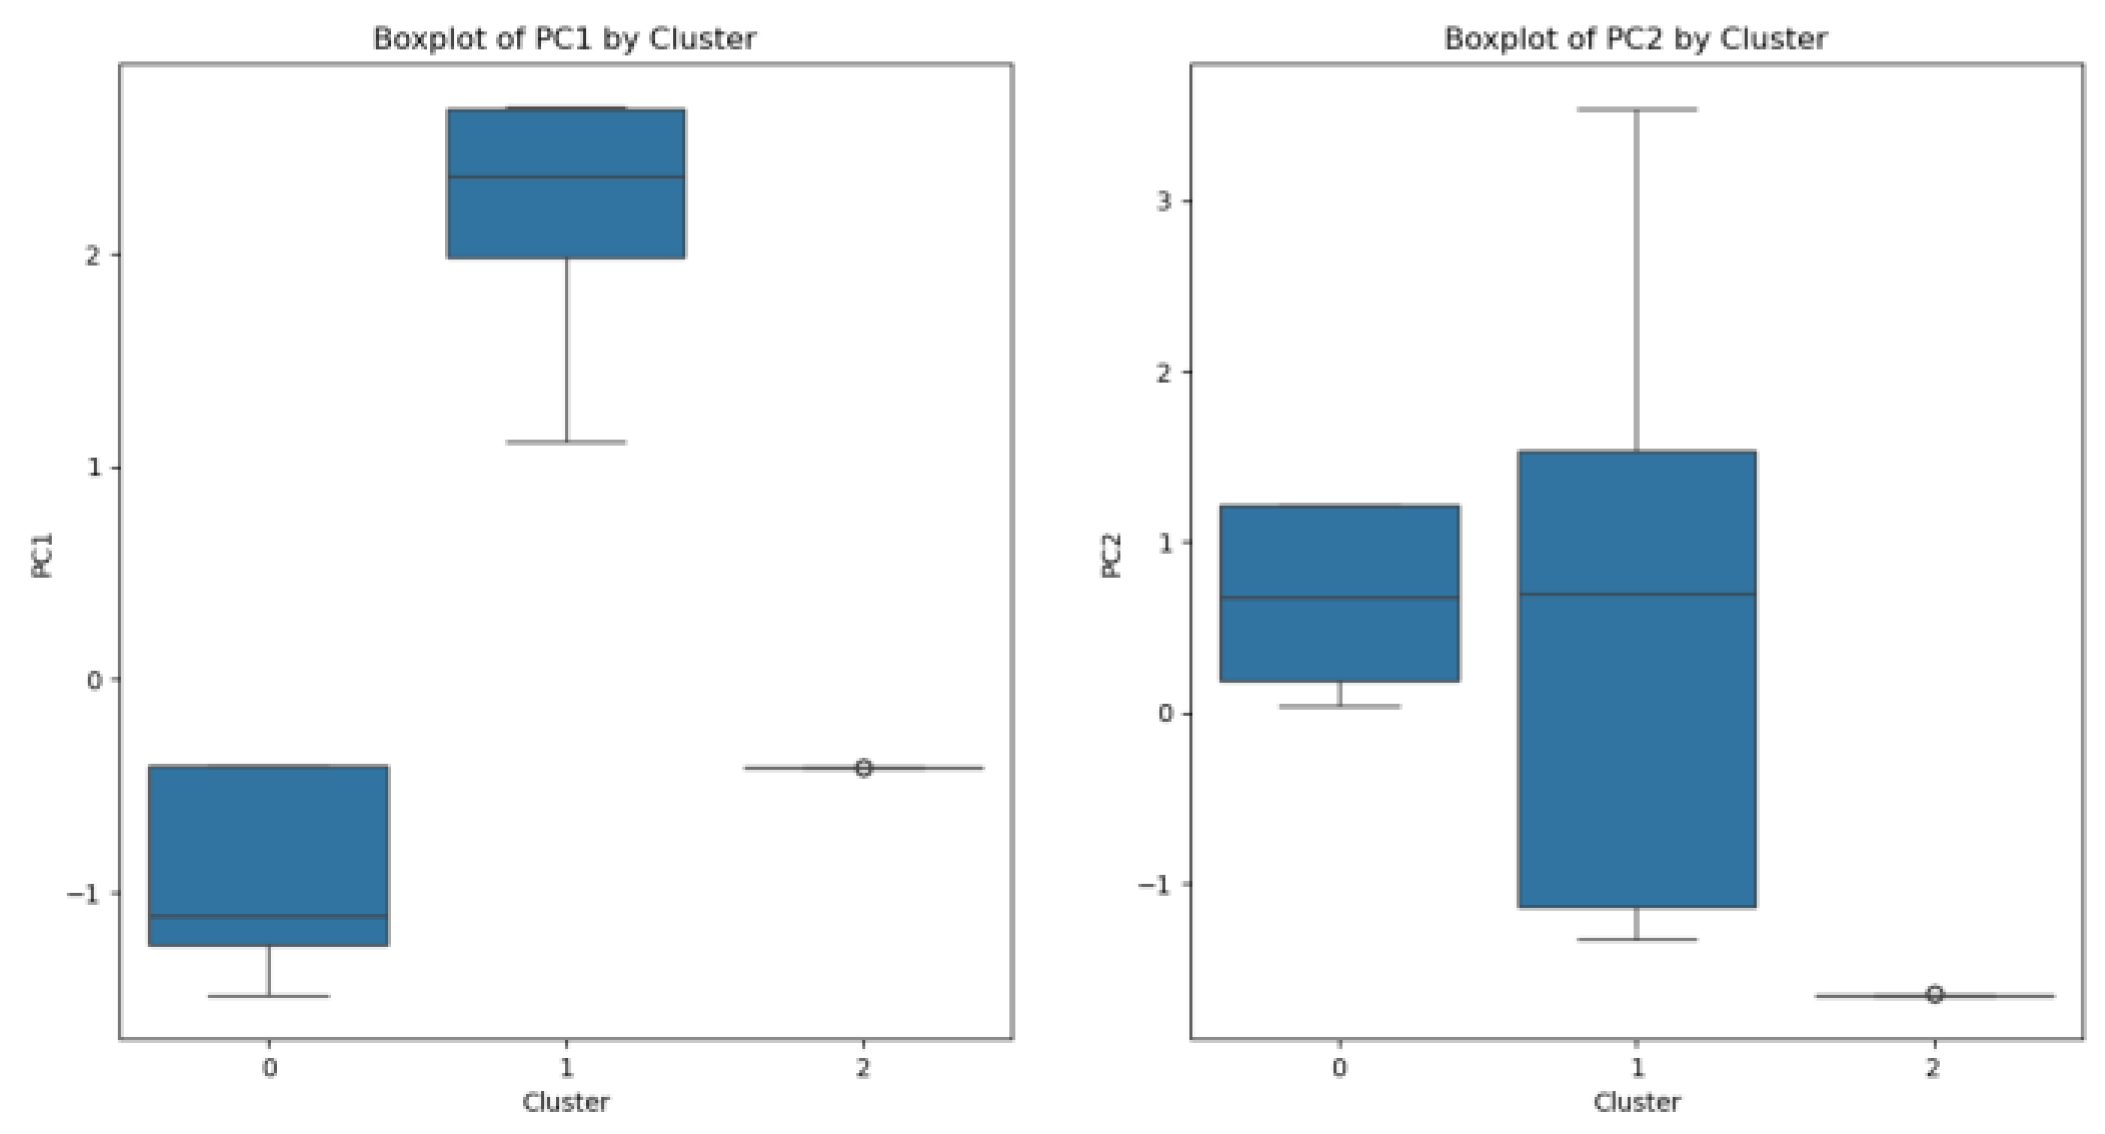

Table 1.
Location Association Rule Results.
| Antecedents | Consequents | Support | Confidence | Lift |
| On footway or verge | No physical crossing facility within 50m | 0.08652 | 0.85138 | 1.13460 |
| In carriageway, crossing elsewhere | No physical crossing facility within 50m | 0.47489 | 0.89953 | 1.19877 |
| In carriageway, not crossing | No physical crossing facility within 50m | 0.06428 | 0.91045 | 1.21331 |
| In centre of carriageway, not on refuge, island or central reservation | No physical crossing facility within 50m | 0.05339 | 0.81867 | 1.09101 |
| On refuge, central island or central reservation | Central refuge — no other controls | 0.00363 | 0.60784 | 9.59628 |
| In carriageway, crossing on pedestrian crossing facility | Zebra crossing | 0.08442 | 0.80111 | 5.70666 |
Table 2.
Location Association Rules.
| Association Rules | |
| 1 | Walking on a footway or verge with no crossing facility within 50 meters |
| 2 | Crossing the road away from a designated facility with no crossing point within 50 meters |
| 3 | Standing or walking in the carriageway without crossing with no crossing facility nearby |
| 4 | Positioned in the centre of the carriageway not on a refuge island or central reservation with no crossing facility nearby |
| 5 | Located on a refuge central island or central reservation with no additional crossing controls present |
| 6 | Crossing the road using a zebra crossing |
Table 3.
Movement Association Rule Results.
| Antecedents | Consequents | Support | Confidence | Lift |
| Crossing from driver’s offside | No physical crossing facility within 50m | 0.162861 | 0.681863 | 0.908689 |
| Crossing from driver’s nearside | No physical crossing facility within 50m | 0.249619 | 0.709484 | 0.945499 |
| Crossing from driver’s nearside-masked by parked or stationary veh | No physical crossing facility within 50m | 0.042033 | 0.790749 | 1.053797 |
| Walking along in carriageway-back to traffic | No physical crossing facility within 50m | 0.016392 | 0.952381 | 1.269197 |
| Crossing from driver’s offside-masked by parked or stationary veh | No physical crossing facility within 50m | 0.033603 | 0.827089 | 1.102227 |
| In carriageway, stationary - not crossing (standing or playing) | No physical crossing facility within 50m | 0.029388 | 0.890071 | 1.186159 |
| Walking along in carriageway-facing traffic | No physical crossing facility within 50m | 0.015221 | 0.838710 | 1.117712 |
| In carriageway, stationary -not crossing (standing or playing), masked by parked or stationary veh | No physical crossing facility within 50m | 0.005386 | 0.867925 | 1.156646 |
| In carriageway, stationary -not crossing (standing or playing), masked by parked or stationary veh | Zebra crossing | 0.002889 | 0.714286 | 1.247657 |
| Footbridge or subway | Crossing from driver’s offside | 0.004044 | 0.777778 | 2.084107 |
Table 4.
Movement Association Rules.
| Association Rules | |
| 1 | Crossing from the driver’s offside without a physical crossing facility within 50 meters. |
| 2 | Crossing from the driver’s nearside without a physical crossing facility within 50 meters. |
| 3 | Crossing from the driver’s nearside masked by parked or stationary vehicles without a physical crossing facility within 50 meters. |
| 4 | Walking along the carriageway with back to traffic without a physical crossing facility within 50 meters. |
| 5 | Crossing from the driver’s offside masked by parked or stationary vehicles without a physical crossing facility within 50 meters. |
| 6 | Stationary in the carriageway without crossing without a physical crossing facility within 50 meters. |
| 7 | Walking along the carriageway facing traffic without a physical crossing facility within 50 meters. |
| 8 | Stationary in the carriageway masked by parked or stationary vehicles without crossing without a physical crossing facility within 50 meters. |
| 9 | Stationary in the carriageway masked by parked or stationary vehicles near a zebra crossing without crossing. |
| 10 | Using a footbridge or subway crossing from the driver’s offside. |
Table 5.
Pedestrian Location Feature and PCA Results.
| Feature | PC1 | PC2 |
| No physical crossing facility within 50m | -0.5644 | -0.11262 |
| Central refuge — no other controls | 0.168697 | -0.00534 |
| Zebra crossing | 0.481838 | 0.163248 |
| Footbridge or subway | 0.011598 | 0.028101 |
| On footway or verge | -0.01569 | -0.41538 |
| In carriageway, crossing elsewhere | -0.3452 | 0.666283 |
| Unknown or other | -0.02271 | -0.3396 |
| In carriageway, not crossing | -0.03574 | -0.32776 |
| In centre of carriageway, not on refuge, island or central reservation | -0.00665 | -0.29594 |
| In carriageway, crossing elsewhere within 50m of pedestrian crossing | 0.233285 | -0.03531 |
| In carriageway, crossing on pedestrian crossing facility | 0.454867 | 0.163054 |
| In carriageway, crossing within zig-zag lines at crossing approach | 0.064136 | 0.027047 |
| In carriageway, crossing within zig-zag lines at crossing exit | 0.053095 | 0.024167 |
| On refuge, central island or central reservation | 0.042538 | -0.05011 |
Table 6.
Pedestrian Location Clustering PCA Analysis Results.
| PC1 | PC2 | Cluster | Metric |
| -0.972744 | 0.882438 | 0 | mean |
| 0.522678 | 0.065959 | 0 | std |
| -1.116843 | 0.867784 | 0 | min |
| -1.116843 | 0.867784 | 0 | 25% |
| -1.116843 | 0.867784 | 0 | 50% |
| -1.116843 | 0.867784 | 0 | 75% |
| 1.017503 | 1.911298 | 0 | max |
| 3.169682 | 0.384904 | 1 | mean |
| 0.715592 | 0.731849 | 1 | std |
| 1.574415 | -1.10051 | 1 | min |
| 2.898762 | 0.08434 | 1 | 25% |
| 3.455674 | 0.793215 | 1 | 50% |
| 3.747259 | 0.793215 | 1 | 75% |
| 3.747259 | 1.609099 | 1 | max |
| -0.316384 | -1.73189 | 2 | mean |
| 0.584429 | 0.111304 | 2 | std |
| -0.564879 | -1.84182 | 2 | min |
| -0.509484 | -1.84182 | 2 | 25% |
| -0.477307 | -1.746 | 2 | 50% |
| -0.452288 | -1.66543 | 2 | 75% |
| 1.682057 | -0.62191 | 2 | max |
Table 7.
Pedestrian Movement Feature and PCA Results.
| Feature | PC1 | PC2 |
| No physical crossing facility within 50m | 0.689002 | -0.09848 |
| Central refuge — no other controls | 0.28858 | 0.069384 |
| Zebra crossing | 0.521246 | 0.03178 |
| Footbridge or subway | 0.036105 | 0.075158 |
| Unknown or other | -0.204043| | 0.293523 |
| Crossing from driver's offside | 0.153411 | 0.524336 |
| Crossing from driver's nearside | 0.170211 | -0.7813 |
| Crossing from driver's nearside-masked by parked or stationary veh' | -0.043232 | 0.046138 |
| Walking along in carriageway-back to traffic | -0.092563 | 0.007407 |
| Crossing from driver's offside-masked by parked or stationary veh' | -0.063034 | 0.031957 |
| In carriageway, stationary - not crossing (standing or playing) | -0.093271 | 0.019059 |
| Walking along in carriageway-facing traffic | -0.04541 | 0.018285 |
| In carriageway, stationary -not crossing (standing or playing), masked by parked or stationary veh' | -0.03198 | 0.006841 |
Table 8.
Pedestrian Movement Clustering PCA Analysis Results.
| PC1 | PC2 | Cluster | Metric |
| 4271 | 4277 | 0 | count |
| -0.94289 | 0.698326 | 0 | mean |
| 0.384822 | 0.423203 | 0 | std |
| 1.478717 | 0.045516 | 0 | min |
| 1.244116 | 0.194221 | 0 | 25% |
| -1.10719 | 0.674902 | 0 | 50% |
| -0.40721 | 1.2183 | 0 | 75% |
| 0.407206 | 1.2183 | 0 | max |
| 2132 | 2132 | 1 | count |
| 2.302096 | 0.246608 | 1 | mean |
| 0.41409 | 1.293902 | 1 | std |
| 1.119994 | -1.32849 | 1 | min |
| 1.985292 | -1.13874 | 1 | 25% |
| 2.366177 | 0.702998 | 1 | 50% |
| 2.68191 | 1.537329 | 1 | 75% |
| 2.685279 | 3.541469 | 1 | max |
| 2132 | 2132 | 2 | count |
| 0.410574 | -1.64752 | 2 | mean |
| 5.80E-15 | 7.11E-15 | 2 | std |
| 0.410574 | -1.64752 | 2 | min |
| -0.41057 | -1.64752 | 2 | 25% |
| -0.41057 | -1.64752 | 2 | 50% |
| -0.41057 | -1.64752 | 2 | 75% |
| -0.41057 | -1.64752 | 2 | max |
Disclaimer/Publisher’s Note: The statements, opinions and data contained in all publications are solely those of the individual author(s) and contributor(s) and not of MDPI and/or the editor(s). MDPI and/or the editor(s) disclaim responsibility for any injury to people or property resulting from any ideas, methods, instructions or products referred to in the content. |
© 2024 by the authors. Licensee MDPI, Basel, Switzerland. This article is an open access article distributed under the terms and conditions of the Creative Commons Attribution (CC BY) license (http://creativecommons.org/licenses/by/4.0/).
Copyright: This open access article is published under a Creative Commons CC BY 4.0 license, which permit the free download, distribution, and reuse, provided that the author and preprint are cited in any reuse.


