
Submitted:
17 December 2024
Posted:
18 December 2024
You are already at the latest version
Abstract
Rock bolting in underground environments is used for different fundamental reasons, including suspending potentially loosened blocks, clamping small wedges together, inducing a protective pressure arch along the contour of excavated voids to improve the self-supporting capacity of the ground, and providing a passive pressure in integrated support systems. In this study, we describe a testing procedure that was developed to investigate the grouted annulus of a rock bolt using a low-cost investigation method. This diagnostic technique was based on the dynamic response of the system, where mechanical vibrations were induced within the rock bolt and the response was recorded by using geophones/accelerometers on the protruding element of the bolt (the collar and head). The collected signal was then processed to estimate the spectral response, and the amplitude spectrum was analyzed to detect the resonance frequencies. A 3D finite element model of the rock bolt and grouting was established to simulate the quality of the coupling by varying the mechanical properties of the grouting. The model response for the studied geometry of the rock bolt suggested that a poor quality of grouting was usually associated with flexural modes of vibration with a low resonance frequency. Good-quality grouting was associated with a frequency higher than 1400 Hz, where the axial vibration was mainly excited. Our analyses referred to short rock bolts, which are usually adopted in small tunnels. The interpretation of the experimental measurements assumed that the spectral response was significantly affected by the quality of the grouting, as demonstrated by the modeling procedure. The resonance frequency was compared with the results of the model simulation. The method was used to test the quality of rock bolts in a small experimental tunnel carved from andesite rock in Chile. Low-cost shock sensors (piezoelectric geophones) with low sensitivity but a wide frequency band were used, and triaxial sensors were tested in a laboratory for the further development of the research activity. The main research outcome was the development of a reliable method to model the dynamic response of rock bolts in mines or for experimental applications in tunnels.
Keywords:
rock bolts
; grouting
; modal analysis
; support system
; anchoring
1. Foreword
Rock reinforcement and rock support can be achieved by bolting. This is an essential part of every tunnelling project or slope excavation because it operates in different manners to improve the stability of the tunnel structure or the slope.
Rock bolts are usually steel rods that are installed into a rock mass to provide geotechnical support and are an essential part of any underground operation. Rock bolts can meet a variety of geological conditions as well as the requirements necessary for reliable ground support systems in underground mines or tunnels.
Rock bolts in underground excavations serve different essential functions, including suspending potentially loosened blocks, clamping small wedges together, inducing a protective pressure arch along the contour of excavated voids to improve the self-supporting capacity of the ground, and providing a passive pressure in integrated support systems. The poor design or incorrect installation of any form of support in any underground mine introduces adverse risks to the mining environment [1]
The aim of our study was to explore and test low-cost investigation methods to ascertain the quality of the anchoring couplings of rock bolts to tunnel rock, adopting non-invasive testing methods based on the dynamic response of the system.
Several non-destructive testing methods have been developed for industrial practice. Current technologies are primarily based on ultrasonic methods, guided ultrasonic methods [2,3], acoustic emissions, electromagnetic techniques, or impulse-based methods using a pneumatic or solenoid device, e.g., GRANIT [4] (Starkey et al., 2001). Detailed analyses and a comparison of state-of the-art technology are necessary to determine the best available solution, considering the complexity of monitoring under severe logistical conditions such as in mines and tunnels. Field experiments have been performed to measure the dynamic response of rock bolts to blasts in nearby drifts [5] (Tannant et al., 1995).
The widely adopted methods are based on the analysis of sonic and ultrasonic waveforms generated at the head of the rock bolts and recorded using appropriate equipment (accelerometers, ultrasonic transducers, etc.). The majority of those methods are based on the propagation of guided waves into the rod steel and the detection of the echo or reflection at the end of the bolt.
An ultrasonic device called the “Boltometer” was developed in Sweden in the late 1970s, wherein compression and flexural elastic waves are transferred to the bolt rebar via a piezoelectric device to ascertain the dynamic characteristics of the anchoring type. Another similar technique proposed for the inspection of rock bolts in hard rock applications is a pulse echo test in which an ultrasonic device is clamped onto the protruding end of the bolt. A short-duration toneburst is used to excite a guided wave in the rock bolt rebar. This burst is then reflected from the bolt end and major defects. The usable range of the detectable length in the pulse echo test is affected by the dispersion of the signal from the bolt into the surrounding rock mass.
One technique that has been available since 1997 is GRANIT (Ground Anchorage Testing System), which operates by applying a small-amplitude impulse at the protruding end of the bar. The system is readily deployable and does not need the end of the bolt to be prepared, unlike certain ultrasound methods. The dynamic response obtained after installation, measured by means of an accelerometer, is compared with any subsequent results to indicate any changes in response.
The starting point of any research should be an analysis of state-of-the-art technology that is easy to use in tunnel conditions, based on the dynamic response of the rock bolts to a degree of mechanical excitation, as well as observations of the response/behavior of the system using appropriate geophones/accelerometers. A focus on standard and advanced technology to record and analyze the response should be applied. In this study, we used modal analysis procedures based on impact excitation to produce a comparison of experimental and theoretical modal models.
Another focus should be on the analysis of the dynamic response of rock bolts by observing and modeling the resonance frequency of the vibration of the system. We adopted a simple method where an artificial impulse was generated on the protruding part of the rock bolt and the natural frequencies of the vibration of the system were detected using a geophone/accelerometer (on the bolt head).
We produced 3D finite element model of the rock bolt and grouting, and we simulated the quality of the coupling by varying the mechanical properties of the grouting. The analysis was limited to short rock bolts, which are usually used in small-section tunnels. A method to test the quality of a series of rock bolts in a small-section tunnel composed of andesite rock in Chile was applied, which adopted low-cost shock sensors (piezoelectric geophones) with low sensitivity but a wide frequency band. The interpretation of the experimental data assumed that the spectral response was affected by the quality of the grouting. The resonance frequencies were then compared with the results of the model simulation.
2. Materials and Methods
2.1. Rock Bolts
Rock bolting is a reliable aspect of support systems. Significant advantages arise from variabilities in parameters such as the length of the bolts used to span the voids, the density of the bolts versus the joint spacing, and the distribution of bolts regarding joint persistence and block volume distribution. The behavior of the rock mass (rigid, plastic, squeezing, raveling, etc.) determines the demand capacity for bolting in terms of its passive contribution to support and stability or convergence control.
Anchoring can also provide different solutions when distributed along the whole length (cemented with grout or resin), when mechanically forced against the borehole contour at the end of the bar (expansion shells and wedges or nuts), by the application of frictional contact (between the steel and the borehole contour), or by a combination of these techniques. This feature is relevant because it depends on the dominant local rock mass structure and stiffness. For brevity, mechanical anchoring is suitable for a good rock mass with few joints, whereas distributed anchoring is suitable for a fractured rock mass or mixed ground.
The effectiveness of bolting also depends on the contouring technique used during excavation and on the geostructural properties [6,7]. A plastic or damaged and de-stressed annulus can be formed around the tunnel contour even after the installation of bolts, and a reduced confinement can be observed for a certain depth of rebar originating from the bolt head inside the rock. These conditions can induce lower stiffness along the interface between the rock and the grout annulus.
Fully grouted bolts require the complete and homogeneous distribution of cemented grout (with injections via micropipes) or filling with resin (a mixture of cartridges during rebar installation). The continuity of the annulus and the symmetry of the rebar position in the borehole section are preliminary conditions for good performance-quality testing and bolt pull-out performance. Field testing has determined that an incorrect order of the insertion of resin capsules into support holes and a poor orientation of the holes can induce a reduction in retaining performance by the anchor if it is not fully grouted [8].
The design of single bolts considers at least three different verifications. The first is the steel section strength at tensile action points and the other two are related to the interface behavior at the shear along the rock–grout (external interface) and grout–rebar (inner interface) contacts. The performance from a geomechanical point of view depends on the surface-roughness profile of the rebar, the quality and consistency of the grout, the roughness of the borehole contour, and the eventual presence of water or coatings of clay. Consequently, even if geophysical testing detects the regular and continuous filling and contact of grout with the rebar and borehole contour, different values during pull-out testing can be measured.
Checking these geometrical and operative parameters is important to assess the efficiency of each single installation.
If wedge-forming joints are crossed by the bolt rebar, the final part of the rebar effectively works as an anchor, whereas the near-surface part of the bolt rebar works to transfer the load of the wedge to the anchoring part. These different static roles induce different shear stress orientations along the interfaces without affecting the results of geophysical testing.
Performance testing usually comprises a pull-out test where a tensile action is directly applied to the head of the bolts. Transversal loading can be added separately or during the process (Figure 1).
An acceptance threshold level for the available tensile strength can be indicated for engineering purposes. Water circulation, vibrations, corrosion, and the aging of grout or resin can induce trends in the monitored parameters of the long-term performance for both static and dynamic methods.
2.2. Experimental Setup
The Experimental Mine of the Adolfo Ibañez University is an underground teaching and research facility in the proximity of the city of Rancagua, Chile. It was excavated from an andesite rock mass and is quite fractured near the surface but progressively improves along the axis of the tunnel. Figure 2 shows a representation of the discontinuities measured on site and an interpretation of the main sets of discontinuities. Table 1 shows the dip and the dip direction of the surveyed joint sets.
Figure 3 shows the most critical wedges formed by the intersection of the above-mentioned joint sets and the tunnel.
The parameters of the intact rock and the main classifications of the rock mass are reported in Table 2.
Figure 4 shows a view of the tunnel from the entrance. The tunnel is supported by a system of steel mesh, rock bolts, and shotcrete. The steel mesh is 10 cm × 10 cm. The rock bolts are helicoidal bars that are 1.4 m long with a diameter of 20 mm and are anchored to the surface with resin as well as a steel plate and nut. These are installed above the steel mesh to support it and enable it to function. The shotcrete, albeit irregularly distributed (as seen in Figure ), has a rough thickness of approximately 10 cm. Figure 5 shows the pattern of the bolts as a cross-section. Figure 6 shows a 3D scan of the terminated tunnel.
2.3. Measurements
A promising technique is based on the modal analysis of rock bolts. The principle of this method considers the main frequencies of resonance induced by mechanical excitation on the protruding part of the rock bolt. The vibration is recorded by an accelerometer located close to the source (Figure 7). The collected signal is then processed to estimate the spectral response, and the main peaks of the amplitude spectrum are then detected. The interpretation assumes that the spectral response is significantly affected by the quality of the grouting.
The result of the experimental activity requires accurate data processing to detect the main resonance frequencies. The observed resonance frequencies are then compared with the results of the model simulation. Consequently, our research involved the development of a reliable method to model the theoretical response of rock bolts to simulate the dynamic response obtained during the experimental activity.
2.4. Instrumentation
Vibrations were collected using a NI-DAQ 6210 data-logger linked to a PC (Figure 8) with LabView 2019 software (National Instruments 11500 N Mopac Expwy - Austin, TX 78759-3504 - US). A sampling frequency of 5000 Hz and a time window of 2 s were adopted. The amplitude scale ranged from -10 V to 10 V.
Low-cost sensors were adopted (piezoelectric analog shock sensors), characterized by low sensitivity (5 mV/g) but with a wide bandwidth (from 10 Hz to 10 kHz). This guaranteed good detection accuracy because the main resonant frequencies reflected the response of the system.
The preliminary tests using low-cost sensors were performed at Escuela Mine in Chancon (Rancagua), which is the mine of the UAI. Each rock bolt was characterized by a steel rod 140 cm in length with a diameter of 2.2 cm.
Measurements of vibration were performed on several rock bolts of the mine by exciting them with a Schmidt hammer and observing the vibration using shock sensors located on the head of the rock bolt. Shots were repeated at least five times for each tested bolt. A calibration test was performed on a free bar 1.4 m in length with a diameter of 0.022 m by exciting the protruding part of the bar five times and the bottom part of the bar five times.
2.5. Data Processing
A vibration analysis estimates vibration levels and investigates patterns in vibration signals. It is commonly conducted directly on the time waveforms of the vibration signal as well as on the frequency spectrum, which is obtained by applying the Fourier transform to the time waveform. We primarily focused on the analysis of the amplitude spectrum to detect the resonance frequencies of the system.
The preliminary data processing involved time-windowing of shot events to extract the useful part of the signal, a frequency analysis of each single windowed event, and the analysis and detection of the main frequencies of resonance.
The data acquisition was performed by collecting at least five shots for each rock bolt. All the responses were collected in the same recording, which lasted 2 s. The data processing involved splitting the record into several sub-records (windowing) of the same length (1024 samples), where each sub-record separated the response of a single shot. Consequently, several responses for each rock bolt were available for the subsequent frequency domain analysis, where the records had the same number of samples.
The application of a detrend filter was necessary to remove the DC-shift from the original records. The mean or a best-fit line (in the least-squares sense) were subtracted from the original data before the windowing was performed. Removing the trend from the data enabled us to focus the analysis on the fluctuations in the data of the trend. In a specific case, a systematic shift was noticed as the result of sensor drift, probably because of the sensitivity of the devices (sensor sand cables) to external electromagnetic noise. This shift did not impact on the final quality of the recorded vibration because it was coherently removed using detrend filtering.
The spectral analysis of vibration is the process of transforming a signal from the time domain to the frequency domain. We performed a spectral analysis using a fast Fourier transform (FFT) to calculate a spectrum from the time waveform. FFT converts a signal from the time domain into the frequency domain, where the calculation can break down a signal into all its frequencies. The signal is then analyzed to determine any substantial frequencies originating from each single record. A peak in the frequency signal is associated with the likely mode of vibration.
2.6. Simple Analytical Model
The frequency of the resonance of a bar can be qualitatively related to the degree of mechanical coupling with the surrounding rocks and can indicate the quality of the grouting. A higher frequency of natural resonance indicates a good quality of grouting, whereas a lower frequency could be related to a poor coupling.
A simple model of the behavior of rock bolts was considered to model the response by assuming the following:
This procedure provided a preliminary analysis of the behavior of the rock bolts under the condition of extremely poor grouting.
The natural frequency depends upon the density and elasticity of the material from which the bars are formulated. The amplitudes for the higher modes are much smaller than the fundamentals.
2.7. FEM Modeling
A finite element model (FEM) was adopted to simulate the dynamic response of the rock bolts to a pulse excitation applied to the protruding head. The model considered both the mechanical properties of the steel rod and the properties of the grouting.
To calculate the dynamic response of the bolt, we applied the finite element model to overcome the main limitations of the previous and simplified analysis where the bolt was simulated using simple beam elements. These elements were not appropriate to describe grouted rock bolts because they did not consider the stiffness of the grout.
A 3D finite element analysis (FEA) of the rock bolt and grouting was performed to simulate the dynamic response of the system. The typical FEA workflow included importing or creating the geometry of the rock bolt and grouting, generating the mesh, defining the physics of problems with a load, defining the boundary and initial conditions, and solving and visualizing the results.
2.8. Geometry
The geometry of the system was simulated using a 3D sketch (Figure 12) of a rock bolt 0.02 m in diameter and 1.4 m in length and an anchor/bearing plate located 0.2 m from the top external head of the rod. The rod was simulated as a perfect cylinder with a flat external surface; this did not properly simulate the coupling of the true rugged surface of the real bolt, so we accounted for this in the boundary conditions. The grouting was simulated as another cylinder 0.1 m in diameter and 1.2 m in length.
2.9. Meshing
The meshing of the elements was performed using a regular tetrahedron in which all four faces were equilateral triangles, all faces were the same size and shape (congruent), and all edges were the same length. A general course mesh was adopted with a refinement of the meshing to more effectively fit the geometry of the small steel rod (the internal cylinder). The maximum size of the tetrahedron accounted for the expected minimum wavelength.
The expected wavelength, associated with the propagation of compressional waves (P-wave) within the steel rod, was at a higher frequency than we wanted to capture (2000 Hz).
The P-wave velocity within a confined steel rod is obtained from the following equation:
where E is Young’s modulus (200 GPa) and d is the density (7800 kg/m3).
To properly simulate a maximum frequency of 2000 Hz, the associated wavelength is as follows:
Surface waves are also generated by the impact of the hammer on the rod; they mainly propagate as a guided wave at the interface between the steel rod and the grouting with a velocity that is related to the mechanical properties of the steel rod and the grouting itself. For simplicity, we assumed that the surface wave velocity was 0.9 times the velocity of the shear wave propagating within the rod.
For a steel rod with a Poisson’s ratio of 0.3, the S-wave velocity is approximately 3000 m/s and the surface wave velocity is approximately 2700 m/s. For poor grouting, the surface wave velocity could be reduced to 2500 m/s; the associated wavelength for a frequency of 2000 Hz is approximately 1 m. The dynamic response of a vibration at the frequency of a few kHz can be properly modelled using meshing of approximately 0.1 m, and it can be comparable to consider 10 mesh for each wavelength. This did not represent a critical issue for our FEM model (Figure 13), where the maximum size of the mesh was approximately 0.05 m.
2.10. Physics of the Problem
Structural analyses can predict how components behave under loading, vibration, and other physical effects. This helps with the design of robust mechanical components by validating designs using simulations and reducing the need for physical testing. The structural model adopted herein allowed us to perform a linear static analysis, a transient analysis, and modal and frequency response analyses. A typical programmatic workflow for solving a structural problem includes the following steps:
- Assign the structural properties of the material, including Young’s modulus, Poisson’s ratio, and mass density.
- Specify a damping model and its values for a dynamic problem.
- Specify boundary loads and constraints.
- Specify the initial displacement and input for a dynamic problem.
- Solve the problem and plot results such as displacement, velocity, acceleration, stress, strain, von Mises stress, principal stress and strain, and frequency response.
The structural properties of the material were assigned according to the following typical values listed in the literature:
Steel rod:
- Young’s modulus: 200 GPa;
- Poisson’s ratio: 0.3;
- Density: 7850 kg/m3;
- Damping factor: 0.1.
Resin (good quality):
- Young’s modulus: 5 GPa;
- Poisson’s ratio: 0.3;
- Density: 2000 kg/m3;
- Damping factor: 0.03.
2.11. Boundary Conditions
The problem was modeled using a displacement-based model, and we imposed Dirichlet boundary conditions for the displacement of the structure. For the source on the top of the protruding element of the rock bolt, we assumed that the main displacement acted along the same axis as the impact of the hammer (z-axis). The bottom surface could have had displacements different from zero along the z-axis but the displacement along the lateral surface of the grouting was assumed to be equal to zero. This was consistent with the assumption that most of the energy propagated within the steel rod and on the surface between the rod and the grouting.
2.12. Computation
A sensitivity analysis of the system was performed by changing the mechanical properties of the grouting (including the Young’s modulus, Poisson’s ratio, and mass density) to simulate the different quality of the grouting itself. Poor grouting was related to low Young’s modulus values, whereas good-quality grouting was simulated using the “optimum” properties of cement/mortar.
The model solved the associated structural mechanical problem for the main modal mode and higher modes, and then solved the frequency domain problem to estimate the amplitude spectrum of the response of the rock bolt.
Table 4 provides the main assumptions for the rock bolts and grouting properties based on the different scenarios of the simulation using FEM.
3. Results
The data processing involved the detection of the main peaks of the amplitude spectrum for each experiment as a final step. We obtained the peaks of each shot for the observed rock bolts; in a few cases, the poor quality of the record did not allow a suitable analysis of the spectrum or a good detection of the peaks. The data are reported in Table 5. The analysis was limited to the detection of the main frequency; occasionally, we detected a second frequency peak.
This preliminary evaluation allowed us to check the quality of grouting. If the axial vibration was dominant with respect to flexural modes, the grouting and rock bolt were deemed to be working properly. In low-quality grouting, the flexural modes of vibration tended to be predominant with respect to the axial vibration. We noticed the following observations:
- A few rock bolts had a resonance frequency with values around up to 1600 Hz. These were mainly associated with the main axial vibration and were considered to be potentially good coupling.
- Resonance frequencies lower than 100 Hz were mainly associated with flexural modes of vibration in the rock bolts and indicated poor-quality grouting.
The FEM modal analysis assumed the same excitation source in terms of the frequency content and intensity. We noted the following main considerations:
- In the case of poor-quality grouting, the spectrum displayed two main peaks. One was at a frequency lower than 20 Hz; the other, which was more “energetic”, was at a frequency around 320 Hz.
- In the case of intermediate-quality grouting, the amplitude spectrum first showed a peak, also more energetic, at a frequency around 40 Hz and then a second, less relevant, peak at a frequency around 337 Hz.
- In the case of good-quality grouting, only one peak was detected at a frequency of 126 Hz.
The simulation revealed significant differences in terms of the amplitude and frequency content of the recorded vibration signal, with a good correlation between the behavior of the resonance frequencies with respect to the quality of the grouting.
4. Discussion
An investigation of the different causes and mechanisms of the poor anchorage quality of rock bolts was out of the scope of this research; it can be argued that inappropriate control of the grouting preparation and injection processes, the leakage of grouting because of fractures in rocks along the borehole, or an insufficient length of bolts could be the main factors resulting in poor-quality anchorage. In this scenario, the development of an easy-to-use investigation method to estimate the quality of rock bolts remains a matter of debate. Wave-propagation-based methods are widely used for non-destructive tests of rock bolts because of their low cost and low complexity as well as their application in complex logistical conditions. In this study, we used a method based on a modal analysis that appeared to be extremely robust and suitable for the accurate analysis of the rock bolt response.
Modal analyses require an accurate interpretation based on a comparison of the spectral response of the experimental record with the synthetic modeled response. It is necessary to build a theoretical modal model of a rock bolt as well as different cases of grouting weaknesses or discontinuity could be modeled. The results of a theoretical modal analysis performed using a validated FE model could constitute a reference base for unknown cases where correlation and comparison techniques could be adopted to validate the model response.
Methods based on an analysis of reflection events are promising but they are affected by certain drawbacks; direct waves and multiple reflections can mask weak reflection events from grout defects and the bolt end when only one sensor is adopted. [9] focused on a stress wave reflection non-destructive test method for rock bolts using a two-sensor acquisition method. They defined the integrated instantaneous phase difference (IIPD) as an index that could characterize any estimated instantaneous phase difference at the sensors. The method appeared to be promising, but the uncertainty associated with the data processing remained a concern because of the complexity in the accurate detection of the reflected wave arrivals at the two sensors. The accurate and automatic identification of the arrival times of effective reflected waves is challenging.
The modal method does not require the adoption of high sonic or ultrasonic frequencies as in the reflection methods where the wavelength of the waveform should be in the order of few centimeters to ensure the desired spatial resolution.
Our results agreed with the results achieved by [10], where finite element models of the rock bolt–resin–rock mass allowed a classification of the method based on an analysis of natural frequencies as a suitable method to identify cases of discontinuity (regions with a lack of bonding). Our field investigation was limited to rock bolts that were 1.4 m in length; as in the study of Staniek [10], longer rock bolts were not investigated. The usage was restricted to short steel rock bolts, although these are used not only in mining but also in building engineering.
The source properties were not investigated in detail, but the adoption of the Schmidt hammer device ensured a good-quality signal with good repeatability and stability in the frequency response. The released energy was enough to guarantee the propagation of a good-quality signal at a very high frequency (higher than 2 kHz). This represented a good approximation of the upper limit of the required frequency band in the field investigation as the axial resonance frequency was observed to be around 1600–1800 Hz.
The piezoelectric sensors adopted for the test in Rancagua mine had already been successfully adopted in other mining activities [11] Although they are mainly used as shock sensors (characterized by low sensitivity), they offer good performance (e.g., a wide frequency band) at a low cost and with a reduced size (more or less the size of a penny). The system is improperly protected for operation in severe conditions (such as mines), and it requires additional improvements in subsequent research. The suitability of new fiber-optic sensor technology (FBG) is currently being explored as an alternative method to monitor seismic effects with a high added value. The main advantages of this system are anti-electromagnetic interference, a small size, a high multiplexing capability, a high resolution (an increase in sensitivity and a decrease in noise), a large bandwidth, and temperature stability. The fabrication, packaging, and capability of the interrogation system to accommodate a greater number of sensors along the same fiber-optic line is a cost-effective solution to minimize expenses.
The main disadvantages of the adoption of FBG in monitoring rock bolts relate to the following:
- the technology does not offer robust solutions for small-sized accelerometers, which MEM technology can offer;
- the application of fiber-optic technology in tunnels/mines in complex logistical conditions could be challenging as fiber is sensitive to dusty and dirty environments. The weakness of the fiber itself may also present a challenge from a mechanical point of view;
- generally speaking, fiber-optic technology continues to retain many operational drawbacks with respect to standard accelerometers; the latter is easily managed in remote scenarios, offering an optimum solution in many tunnel/mine situations.
5. Conclusions
Fully resinated rock bolts exhibit and maintain their anchoring capacity with time if the annulus between the borehole contour and the steel rebar is regularly filled and the curing of the grout has reached its structural standard.
The connections between the rock bolt and the rock mass along the anchor borehole contour and at the plate significantly influence the measured dynamic strains in the rock bolt. The connections at the interface between the bolt, resin, and rock also impose complicated boundary conditions on the vibrational behavior of the rock bolt.
Checking the performance of the bolt is essential, and both direct and non-invasive techniques can be adopted. The method discussed in this study allows for certain default conditions because the influencing parameters can lead to a large number of different boundary conditions.
In summary, the following results and improvements were obtained:
- We acquired advanced comprehension of the suitability of modal analyses for the low-cost assessment of the grouting of rock bolts.
- We developed a tool to model the dynamic response of rock bolts in a MATLAB/Live Script environment; this procedure could be adopted for educational and research purposes.
- An analysis of the performance of low-cost sensors for modal and frequency responses of rock bolts was performed. The amplitude and frequency content of the recorded vibration signal were in correlation with the behavior of the resonance frequencies when referring to the quality of the grouting.
- The development of new sensors should be implemented for the adoption of fiber-optic technology in mining and tunnelling.
- We provided validation of a non-invasive technique when controlled conditions of the grout quality and injection process are known; this could be used for the direct pull-out testing of different rock types at different curing and aging times after installation.
Future work will focus on testing the quality of resins by sacrificing a few resin capsules from each delivery before using the contents underground. The curing of the grouted annulus after installation on site will also be evaluated using pull-out testing of the anchors and estimations of grout loss due to leakage along rock joints.
Author Contributions
Conceptualization, J.S. and A.G..; methodology, J.S. and A.G.; software, A.G. and C.O..; validation, A.G., C.O. and J.S.; formal analysis, A.G. and C.O.; investigation, J.S., A.G. and C.O.; resources, J.S. and A.G.; data curation, A.G., C.O. and J.S.; writing—original draft preparation, J.S., A.G. and C.O.; writing—review and editing, J.S., A.G. and C.O..; visualization, J.S., A.G. and C.O..; supervision, J.S., A.G. and C.O.; project administration, J.S.; funding acquisition, J.S. All authors have read and agreed to the published version of the manuscript.”
Funding
Funding was provide by the following grants: “ENERBLAST: Energy in Blasting and Comminution,” Politecnico di Torino:“Joint Project for the internationalization of Research” program. “Mine-Plant School Project” IDI 30487869-0, Regional government of VI Region, Chile. BLASTEST, FONDECYT 11200114. “REMIND: Renewable Energy for Water Treatment and Reuse in Mining Industry” Horizon 2020 Research and Innovation Staff Exchange (RISE) Project — Marie Skłodowska-Curie Actions, H2020-MSCA-RISE-2018 (GA 823948).
Conflicts of Interest
The authors declare no conflict of interest
References
- Henning, P.; Ferreira, P. In-stope bolting for a safer working environment. J. South. Afr. Inst. Min. Metall. 2010, 110, 47–51, ISSN 2411-9717. [Google Scholar]
- Beard, M.D.; Lowe, M.J.S. Non-destructive testing of rock bolts using ultrasonic waves. Int. J. Rock Mech. Min. Sci. 2003, 40, 527–536. [Google Scholar] [CrossRef]
- Remington, P.J. Experimental and theoretical Studies of Vibrating Systems. In Encyclopedia of Acoustics; John Wiley & Sons: New York, NY, USA, 1997; Volume 2, Chapter 63, pp. 715–734. [Google Scholar]
- Starkey, A.; Ivanovic, A.; Neilson, R.D.; Rodger, A.A. The integrity testing of ground anchorages using Granit. In Proceedings of the 20th International Conference on Ground Control in Mining, Morgantown, WV, USA, 7–9 August 2001. [Google Scholar]
- Tannant, D.D.; Brummer, R.K.; Yi, X. Rockbolt Behaviour Under Dynamic Loading: Field Tests and Modelling. Int. J. Rock Mech. Min. Sci. 1995, 32, 537–550. [Google Scholar] [CrossRef]
- Cardu, M.; Godio, A.; Oggeri, C.; Seccatore, J. The influence of rock mass fracturing on splitting and contour blasts. Geomech. Geoengin. 2022, 17, 822–833. [Google Scholar] [CrossRef]
- Costamagna, E.; Oggeri, C.; Vinai, R. Damage and contour quality in rock excavations for quarrying and tunnelling: Assessment for properties and solutions for stability. IOP Conf. Ser. Earth Environ. Sci. 2021, 833, 012137. [Google Scholar] [CrossRef]
- Maepa, T.G.; Zvarivadza, T. Installation of resin-grouted rockbolts in hard rock mining: Challenges and solutions for improved safety. J. S. Afr. Inst. Min. Metall. 2017, 117, 329–336. [Google Scholar] [CrossRef]
- Liu, L.; Li, S.; Jiang, X.; Tao, F. A new two-sensor non-destructive testing method of grouted rock bolts. Constr. Build. Mater. 2022, 317, 125919. [Google Scholar] [CrossRef]
- Staniek, A. Quality Assessment of Installed Rock Bolts. In Mining Technology; IntechOpen: London, UK, 2021. [Google Scholar] [CrossRef]
- Godio, A.; Seccatore, J. Measuring the Reduction of the Confinement along the Evolution of a Burn Cut. Appl. Sci. 2019, 9, 5013. [Google Scholar] [CrossRef]
Figure 1.
Example of installation with annular cells for tensile loading and a radial cell for transversal loading measurements. Left: during preparation; right: ready for testing.
Figure 1.
Example of installation with annular cells for tensile loading and a radial cell for transversal loading measurements. Left: during preparation; right: ready for testing.
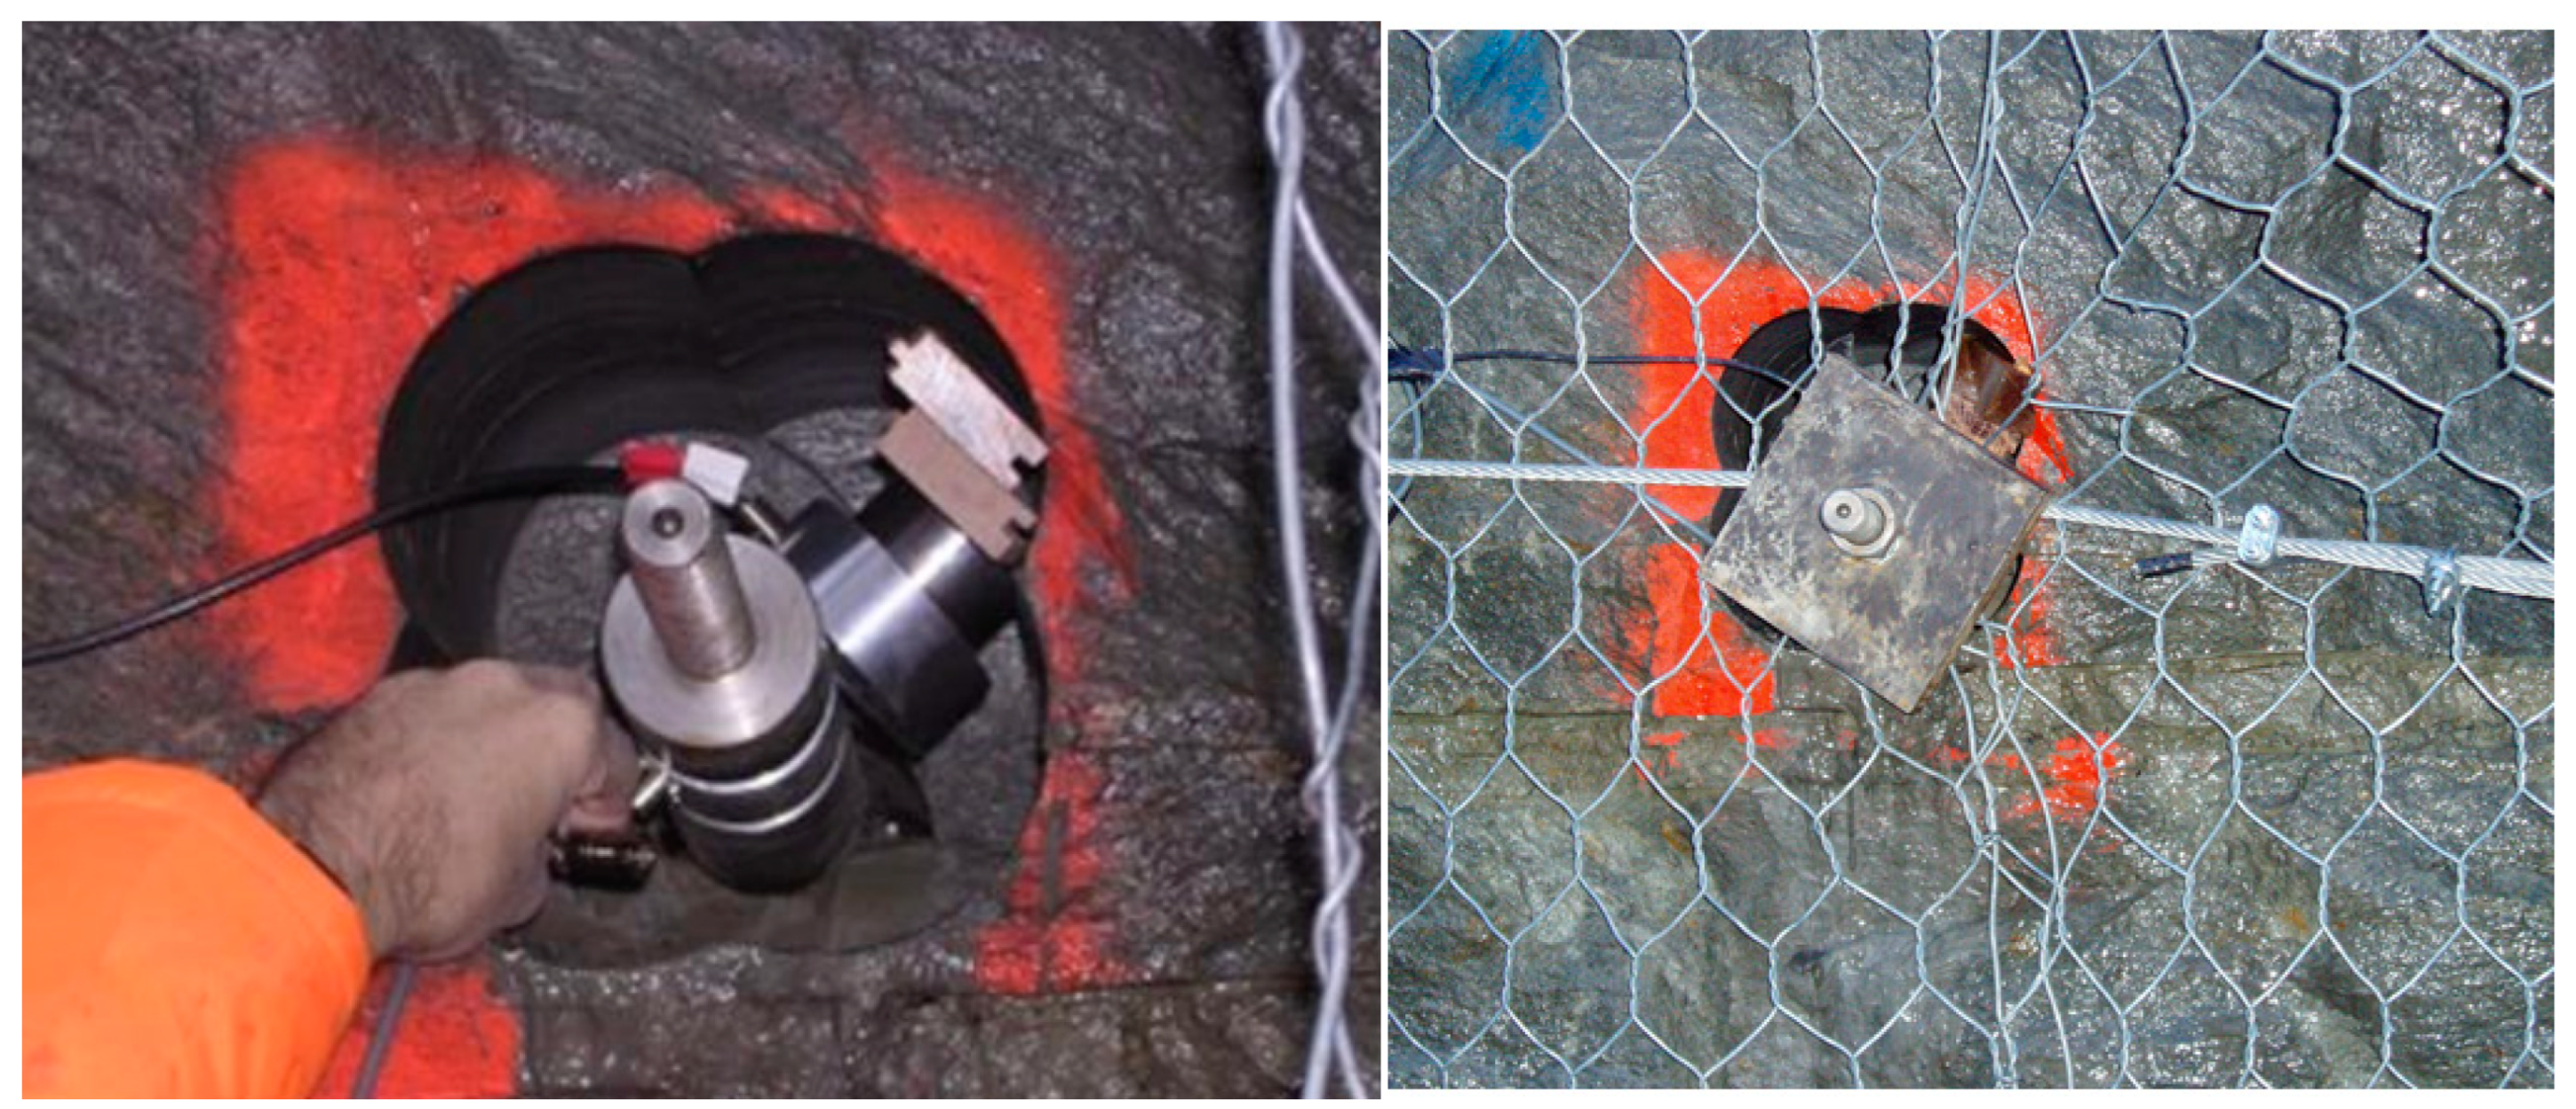
Figure 2.
Stereonet of the main joint systems for the experimental section of the tunnel.
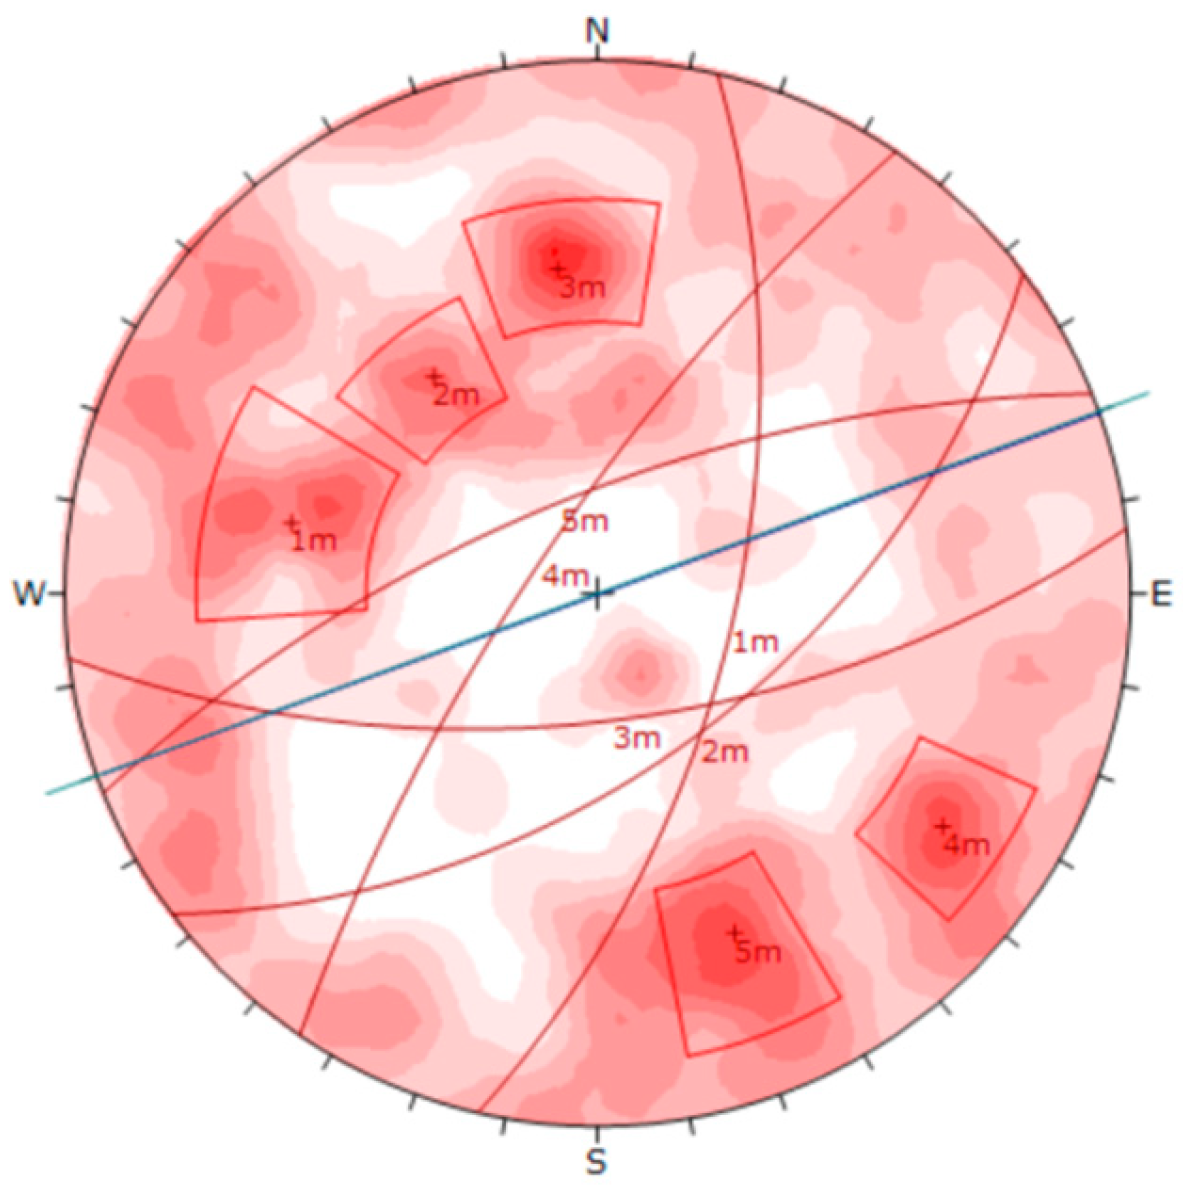
Figure 3.
Most critical wedges (UnWedge code provided by RocScience).
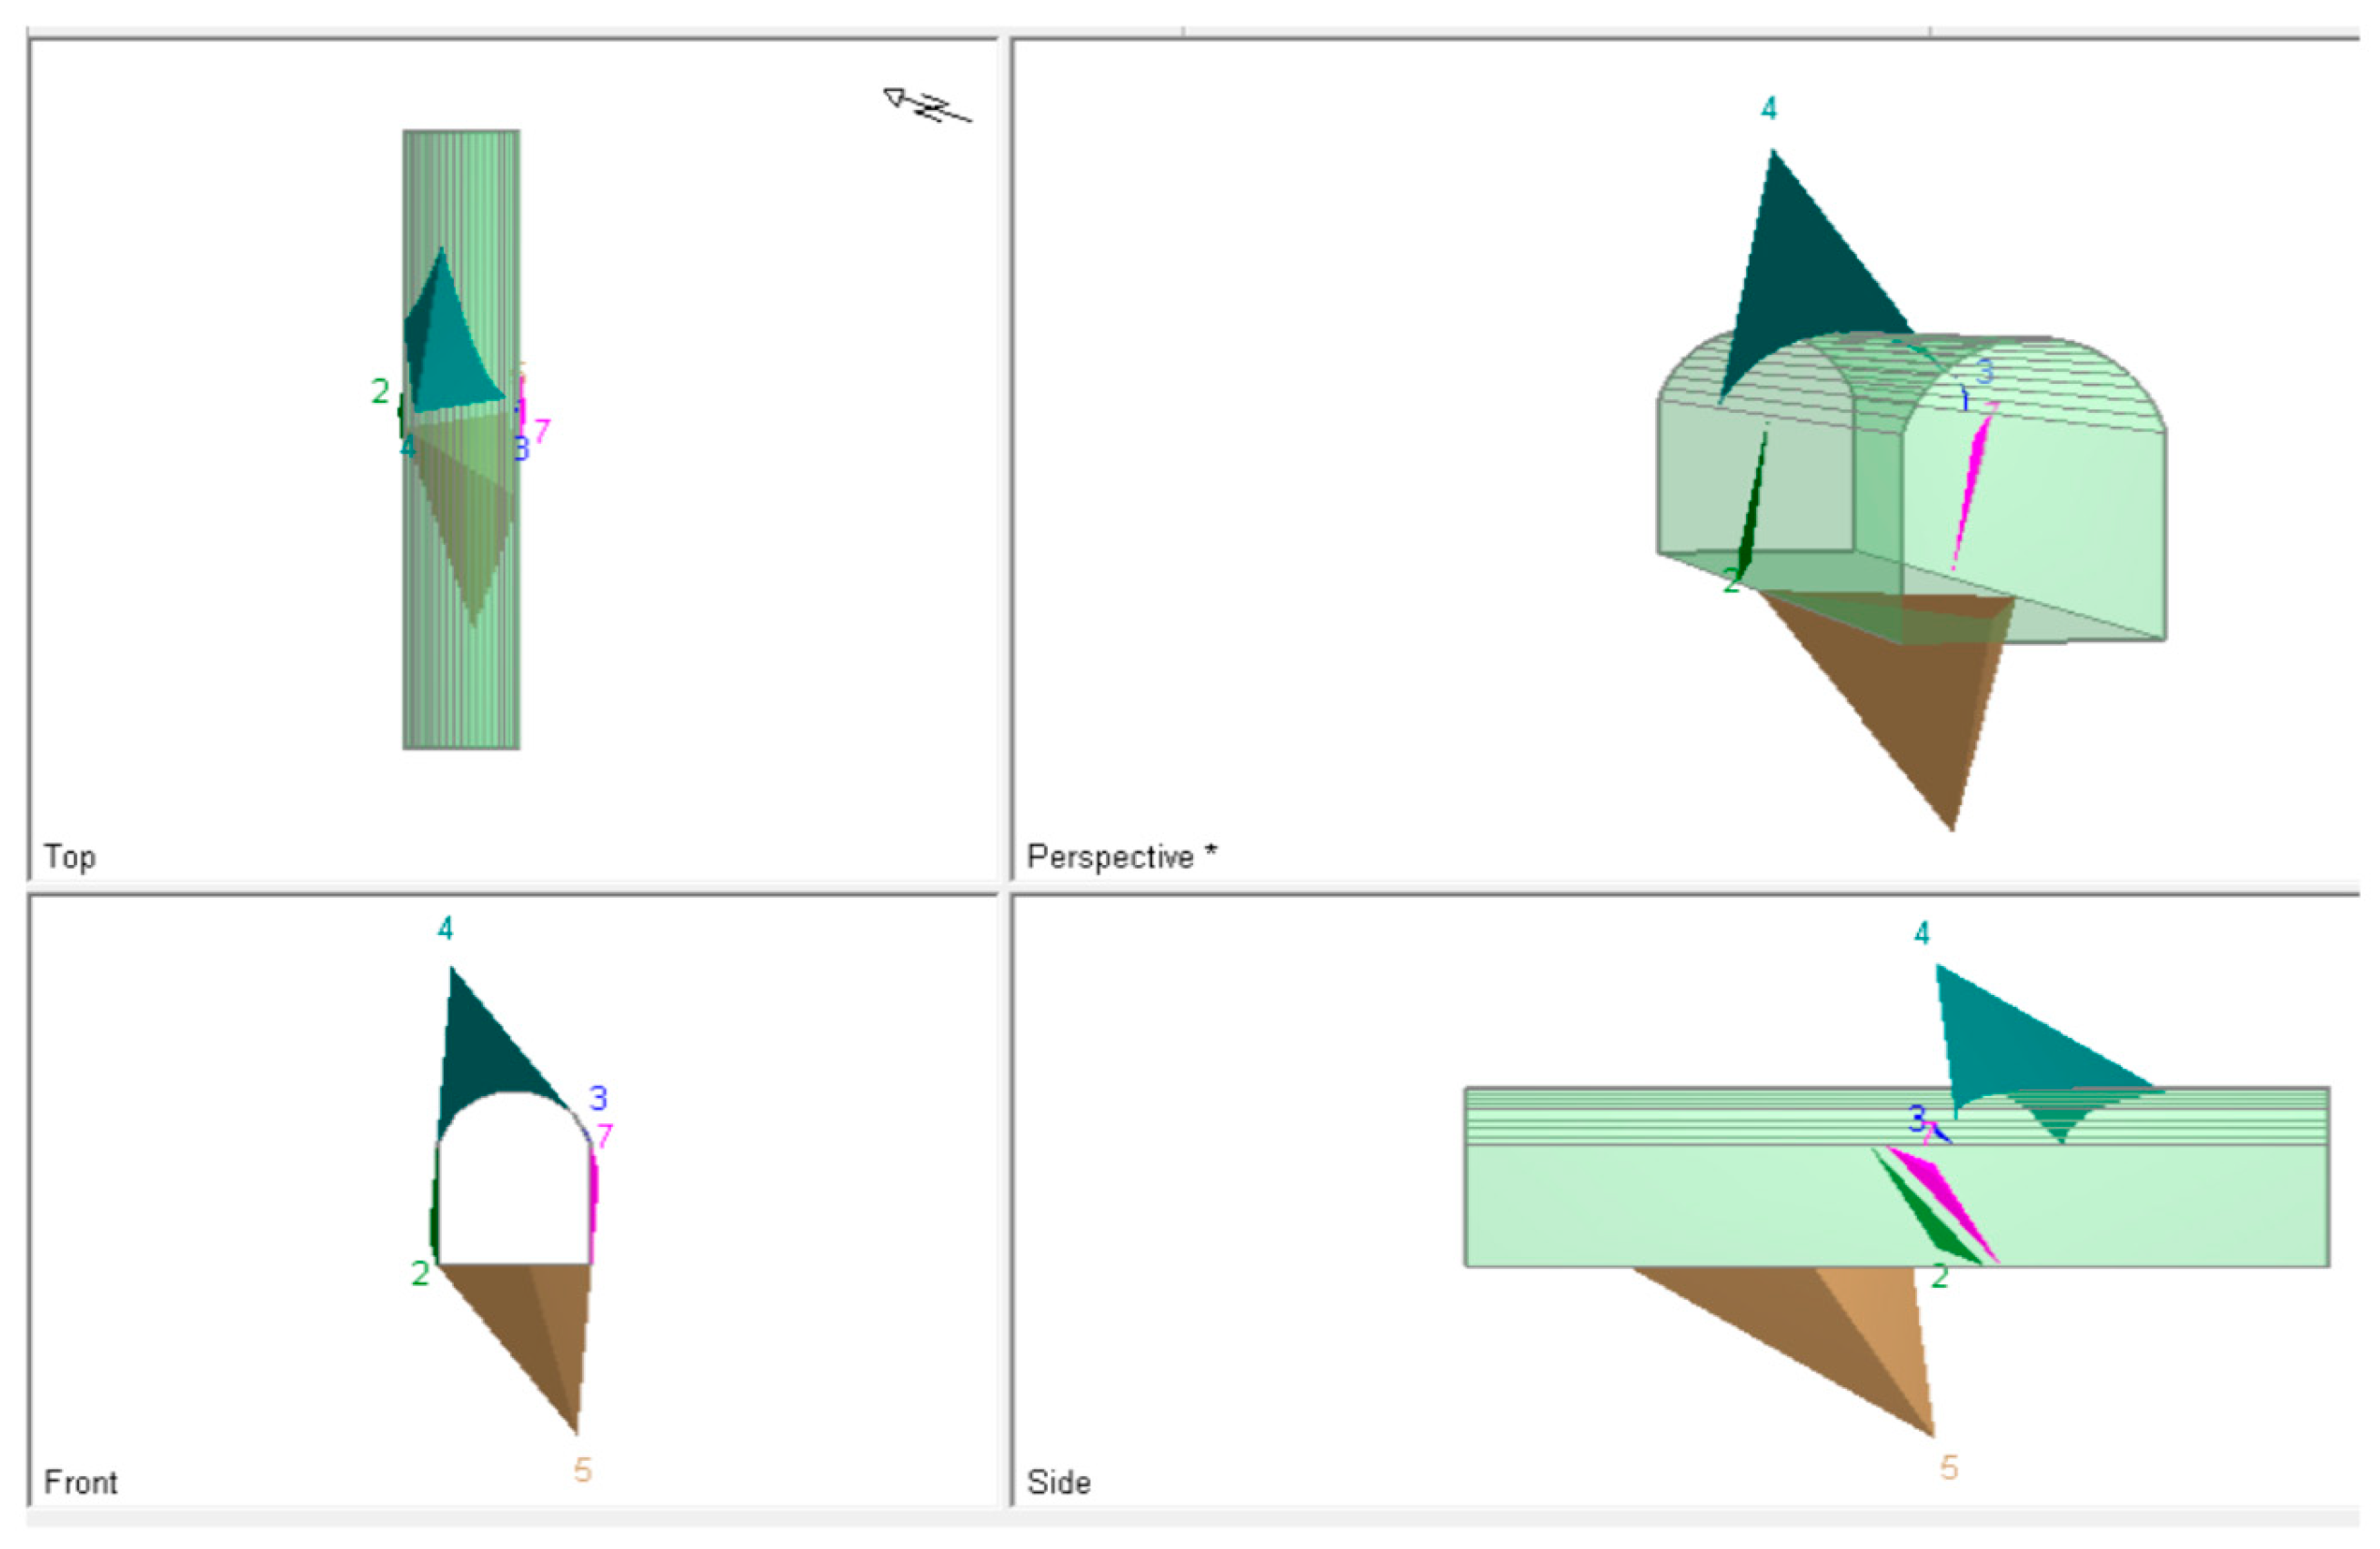
Figure 4.
Inside view of the tunnel. The heads of the rock bolts are clearly visible on the vault of the tunnel.
Figure 4.
Inside view of the tunnel. The heads of the rock bolts are clearly visible on the vault of the tunnel.
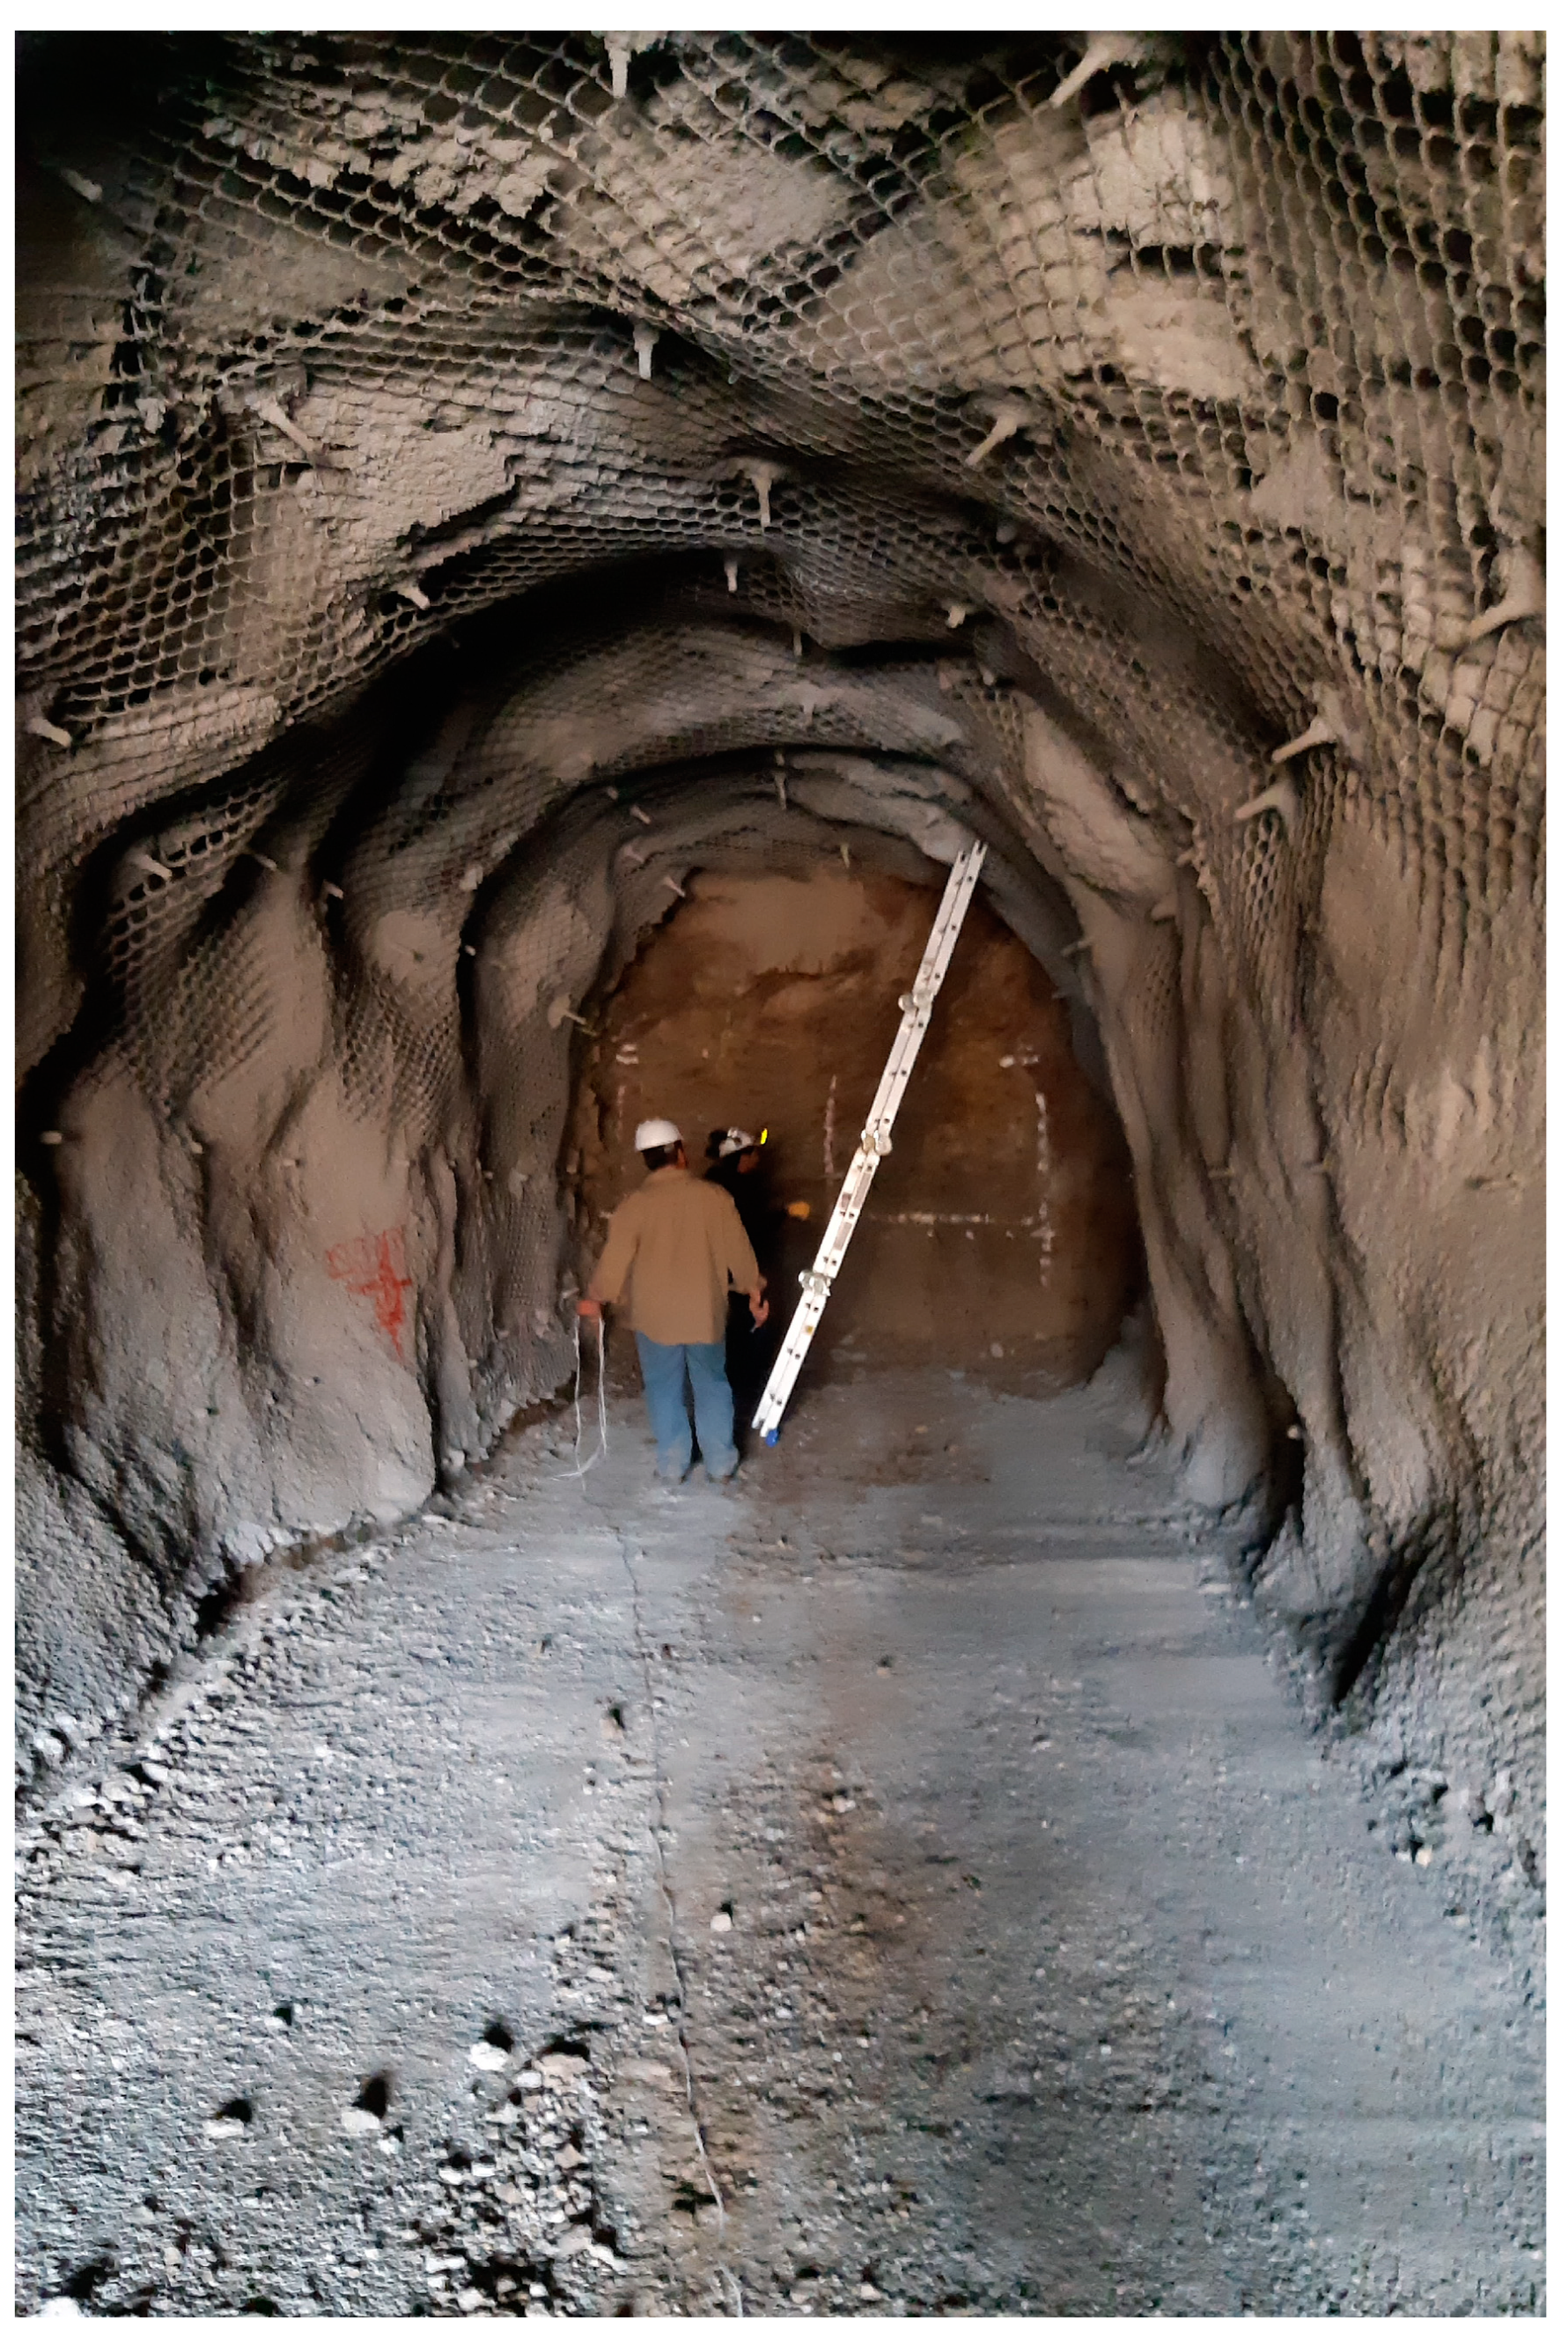
Figure 5.
Installation pattern of the rock bolts (units in m).
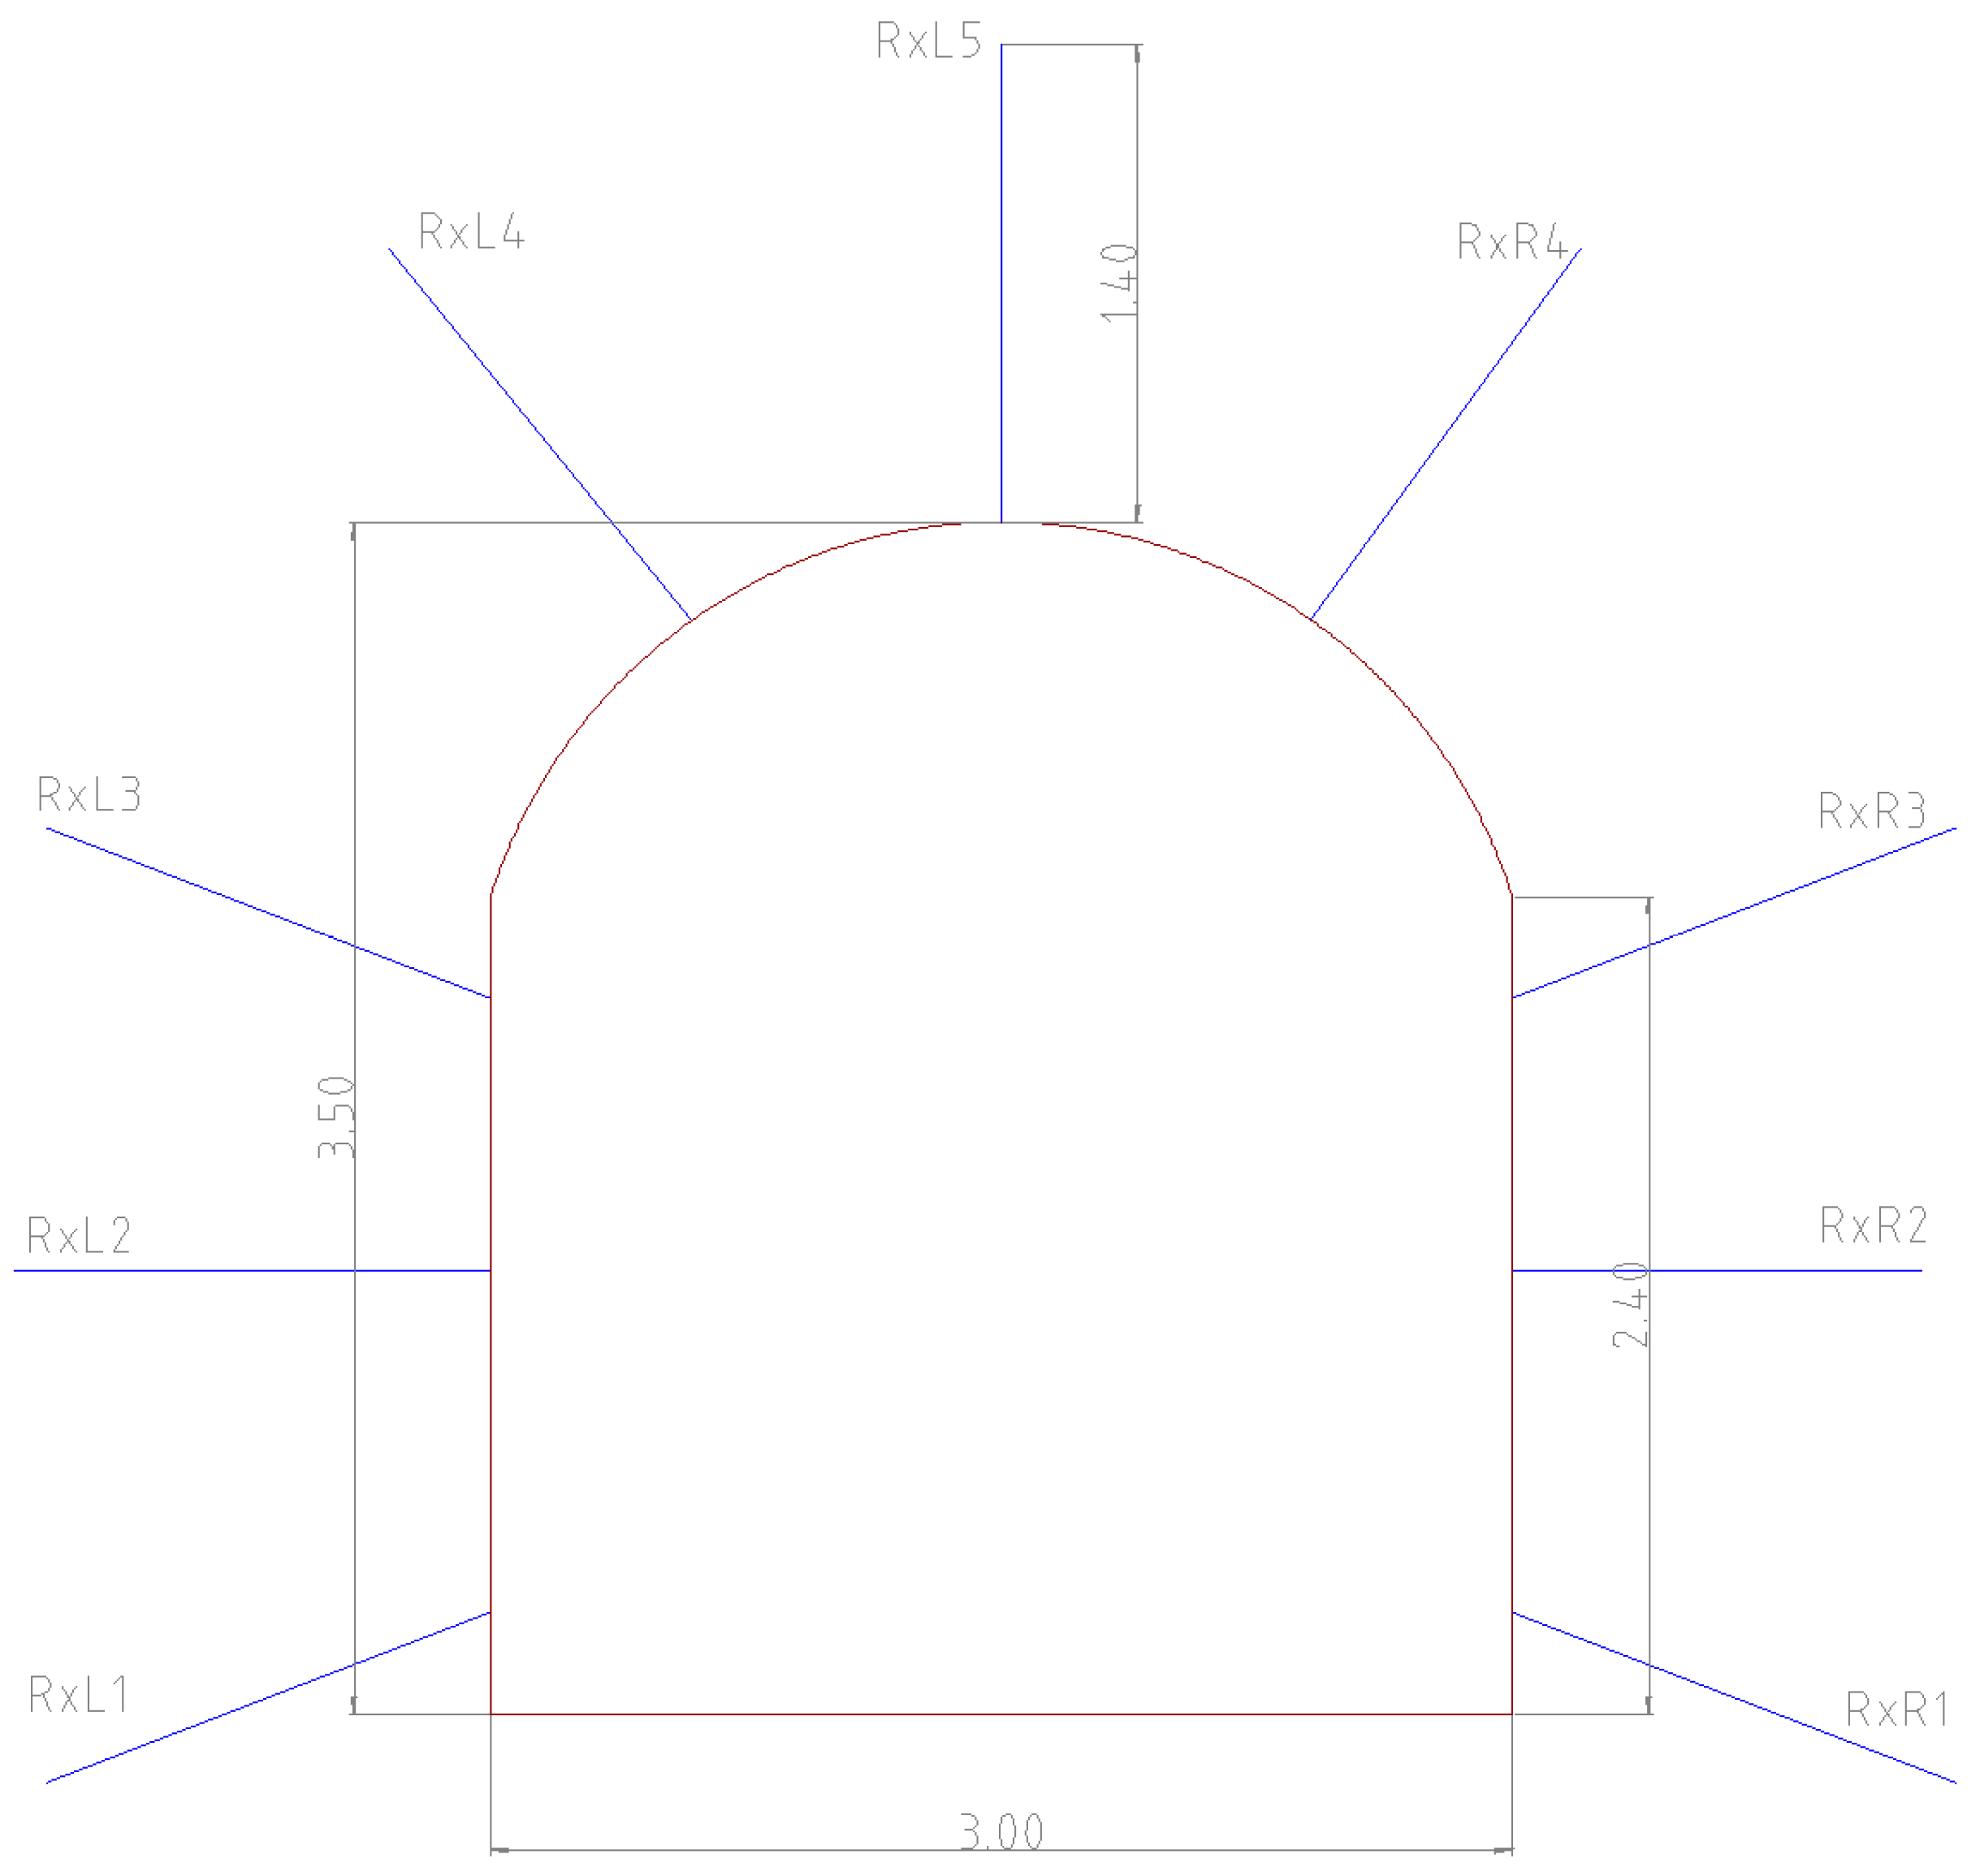
Figure 6.
A 3D view of the tunnel.
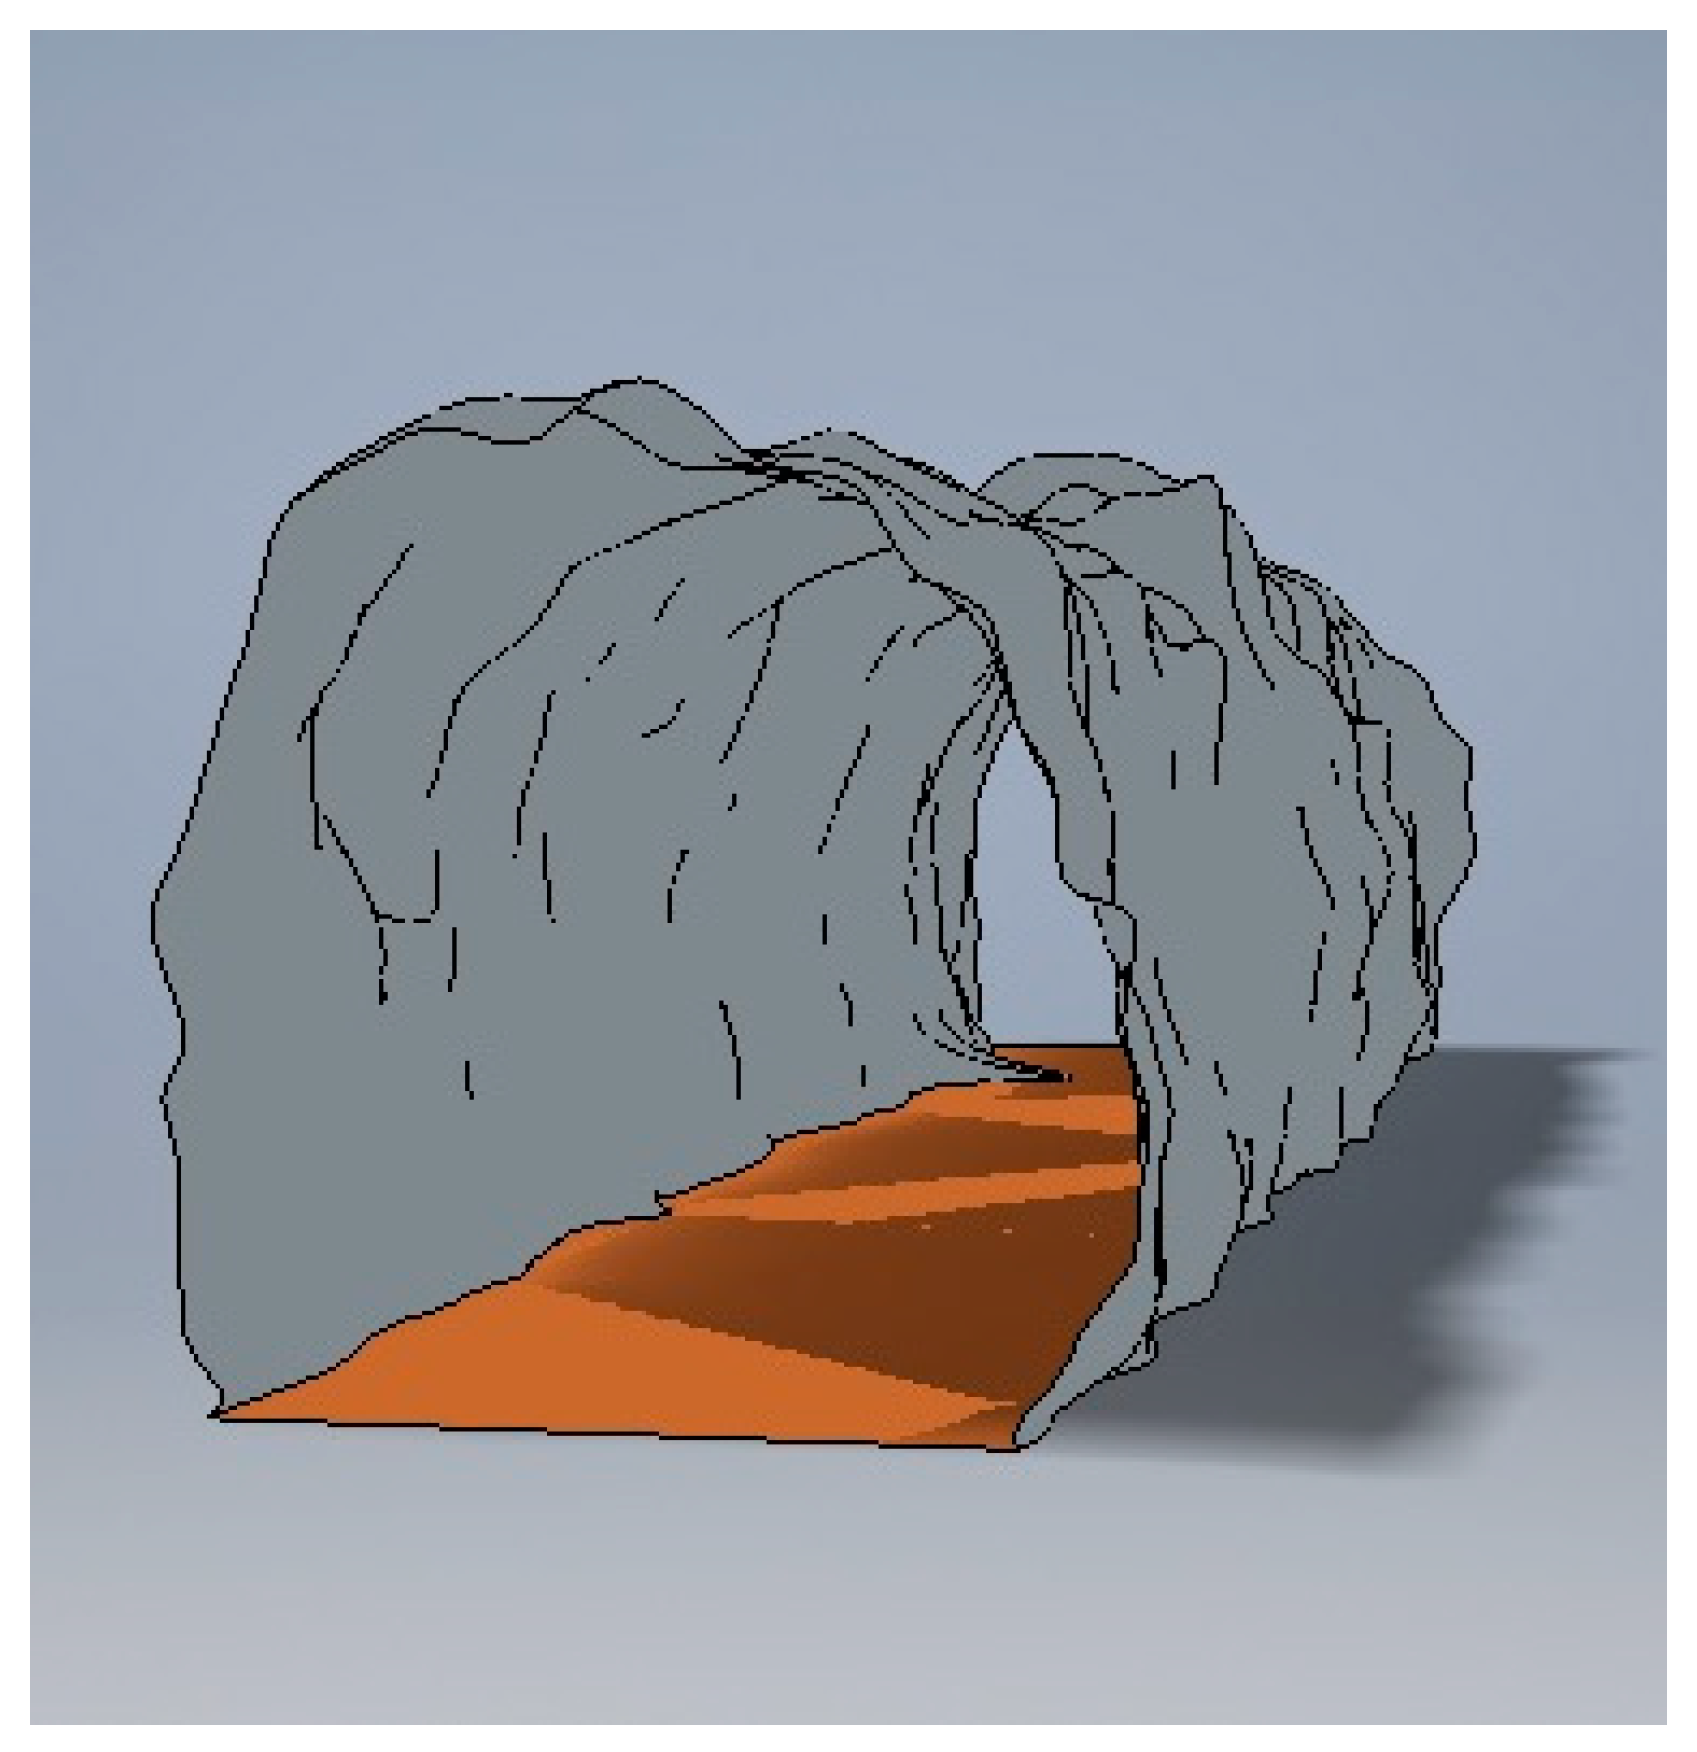
Figure 7.
Example of a testing method using accelerometers anchored to the protruding head of the rock bolt (A). A hammer is used to excite a mechanical impact on the head (B); the vibration is then transferred (C) and recorded on a computer.
Figure 7.
Example of a testing method using accelerometers anchored to the protruding head of the rock bolt (A). A hammer is used to excite a mechanical impact on the head (B); the vibration is then transferred (C) and recorded on a computer.

Figure 8.
The rugged PC used for the field test and the NI-DAQ card used for the data acquisition.
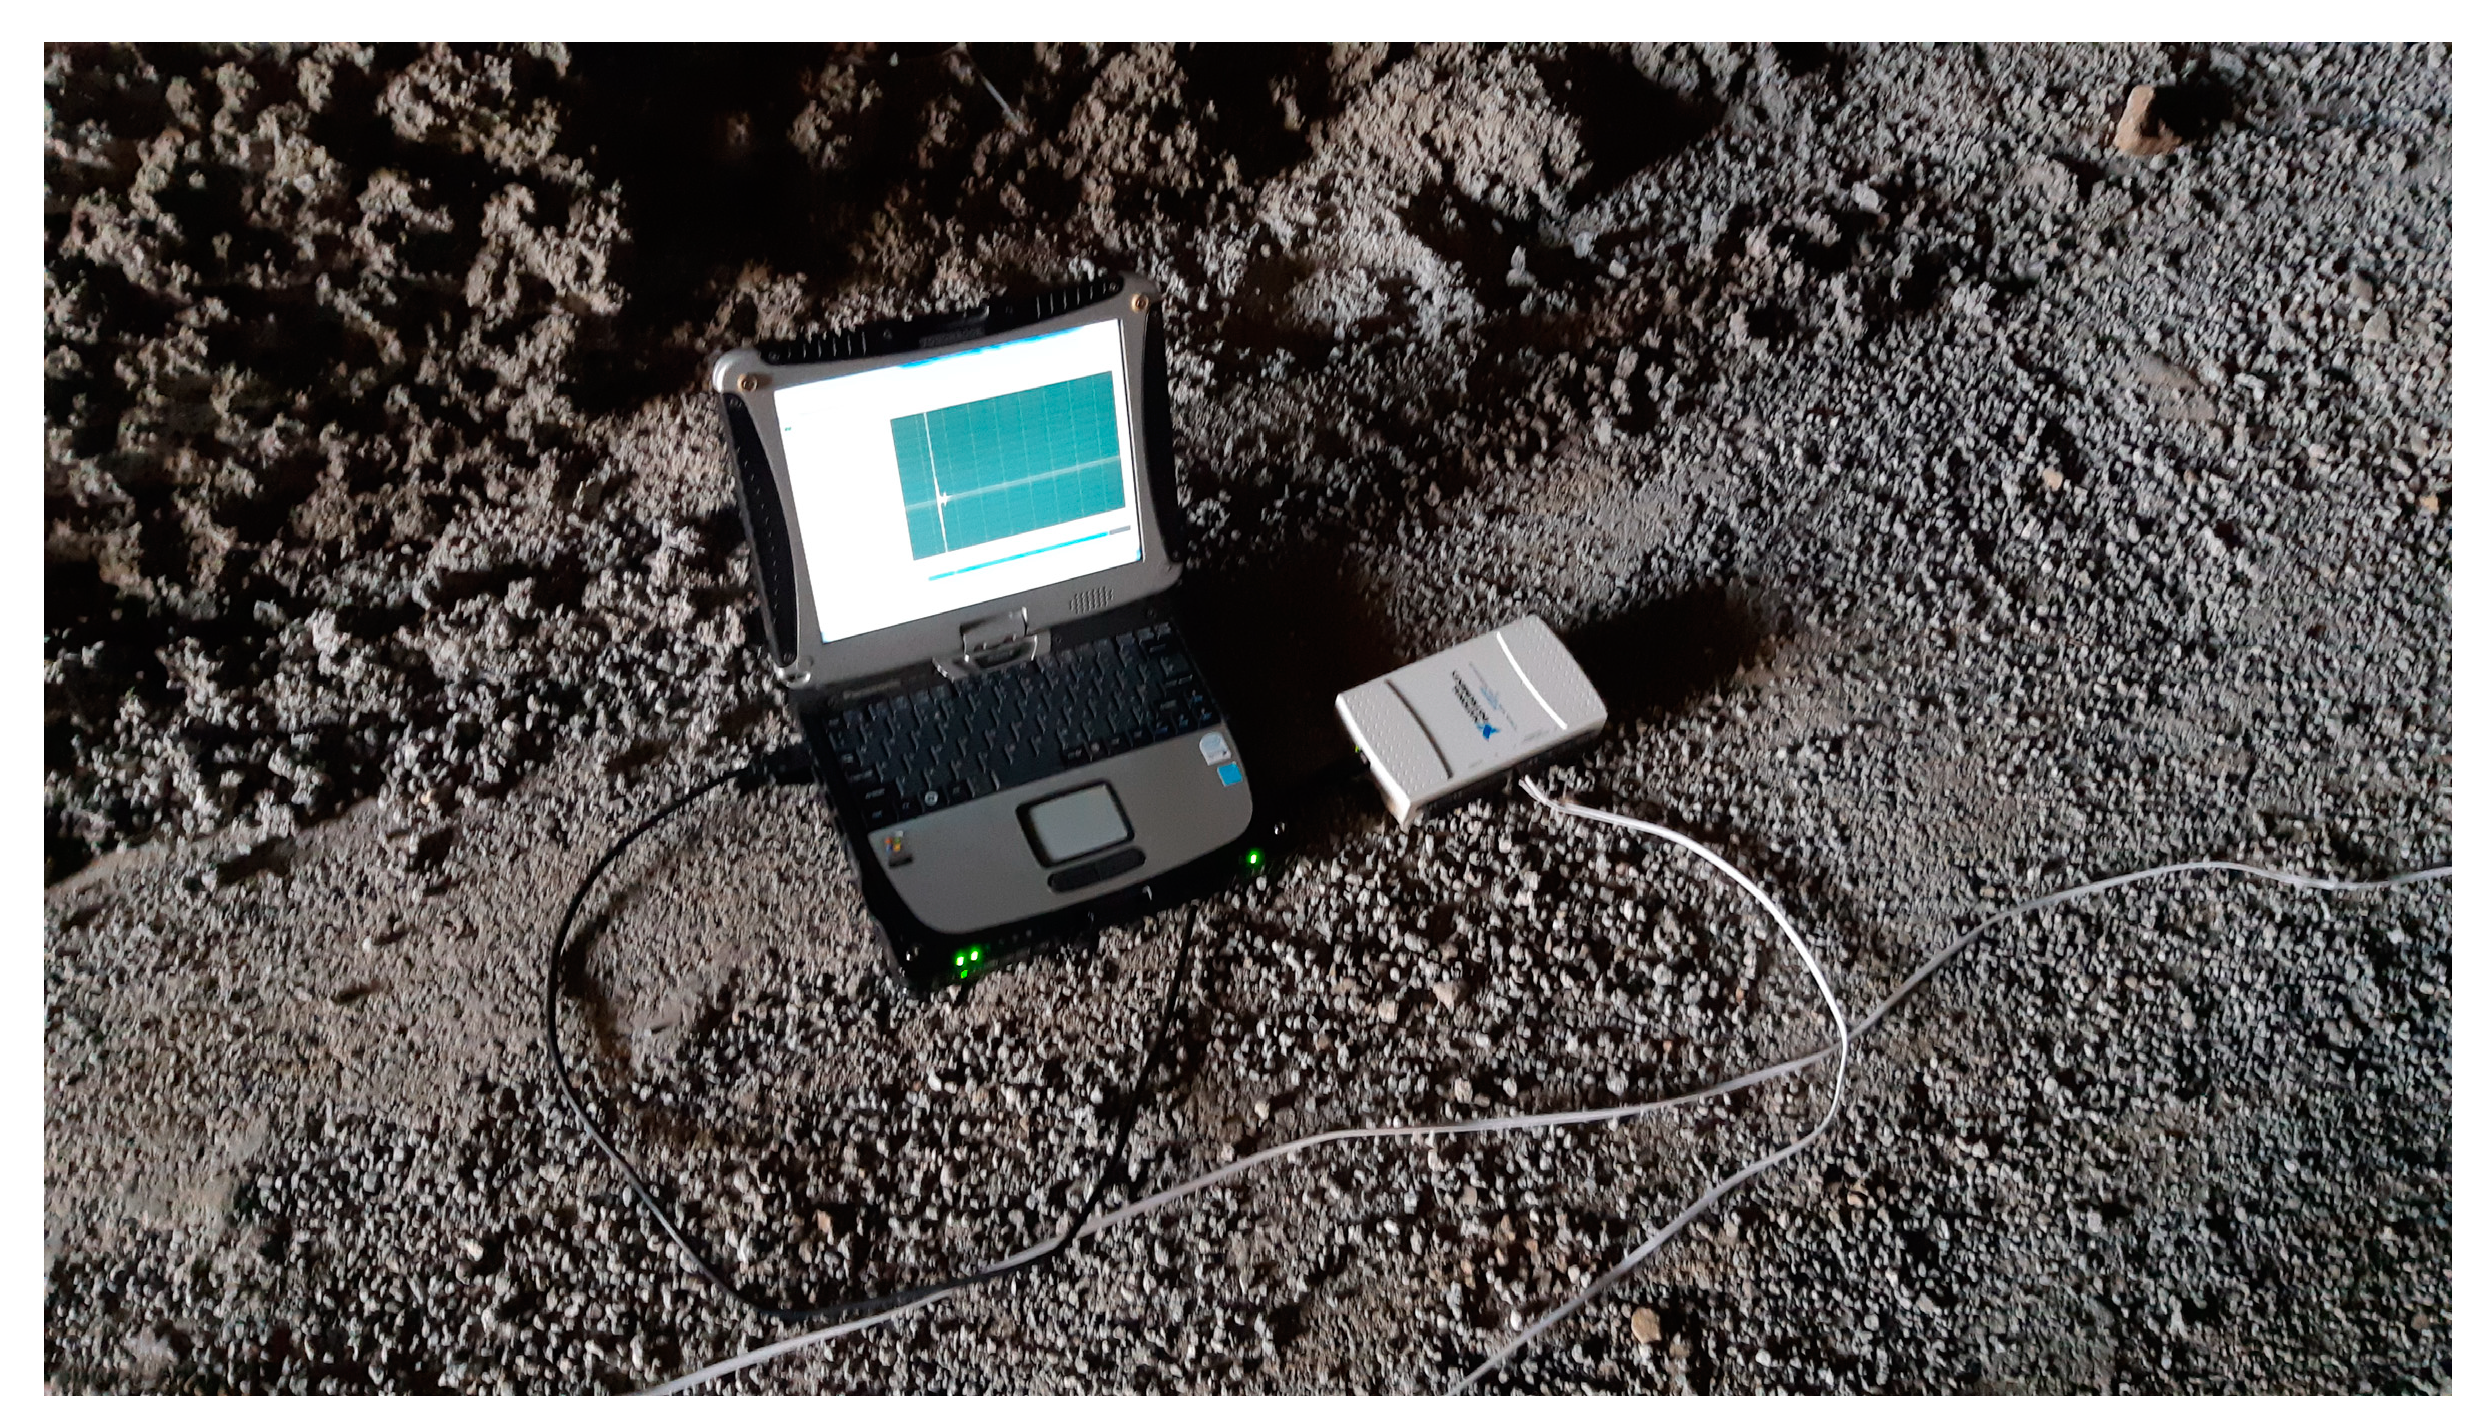
Figure 9.
Example of main resonant frequency (f1) and upper mode of natural frequency for a clamped bar.
Figure 9.
Example of main resonant frequency (f1) and upper mode of natural frequency for a clamped bar.
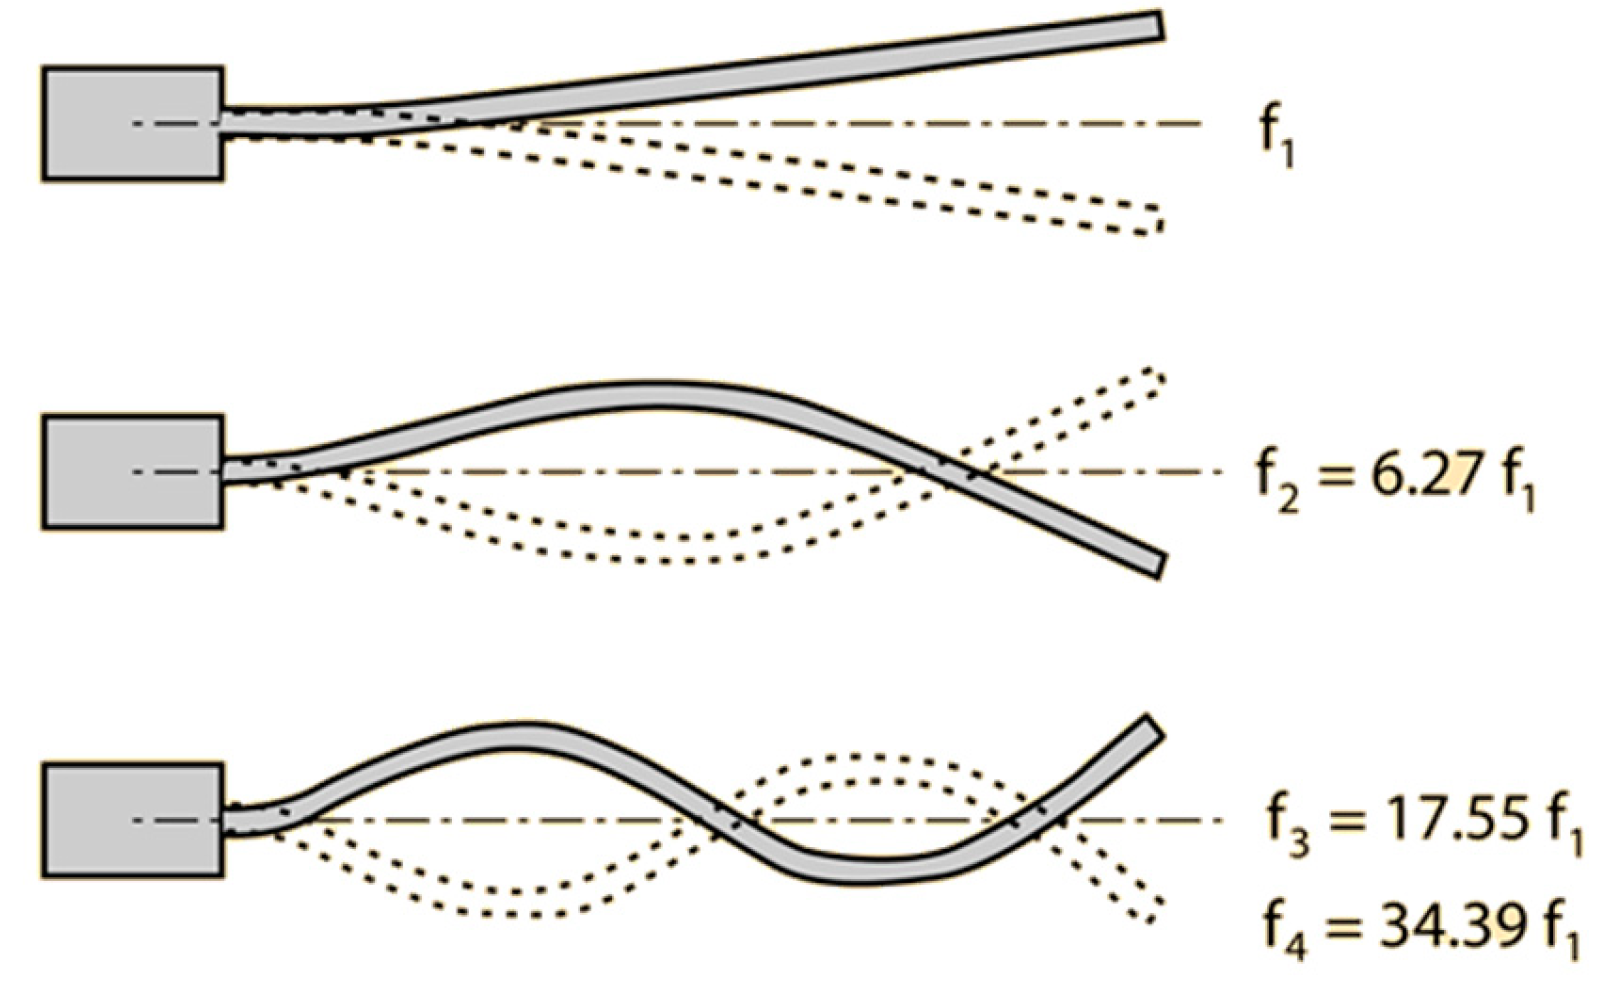
Figure 10.
Example of main resonant frequency (f1) and upper mode of natural frequency for a free bar.
Figure 10.
Example of main resonant frequency (f1) and upper mode of natural frequency for a free bar.
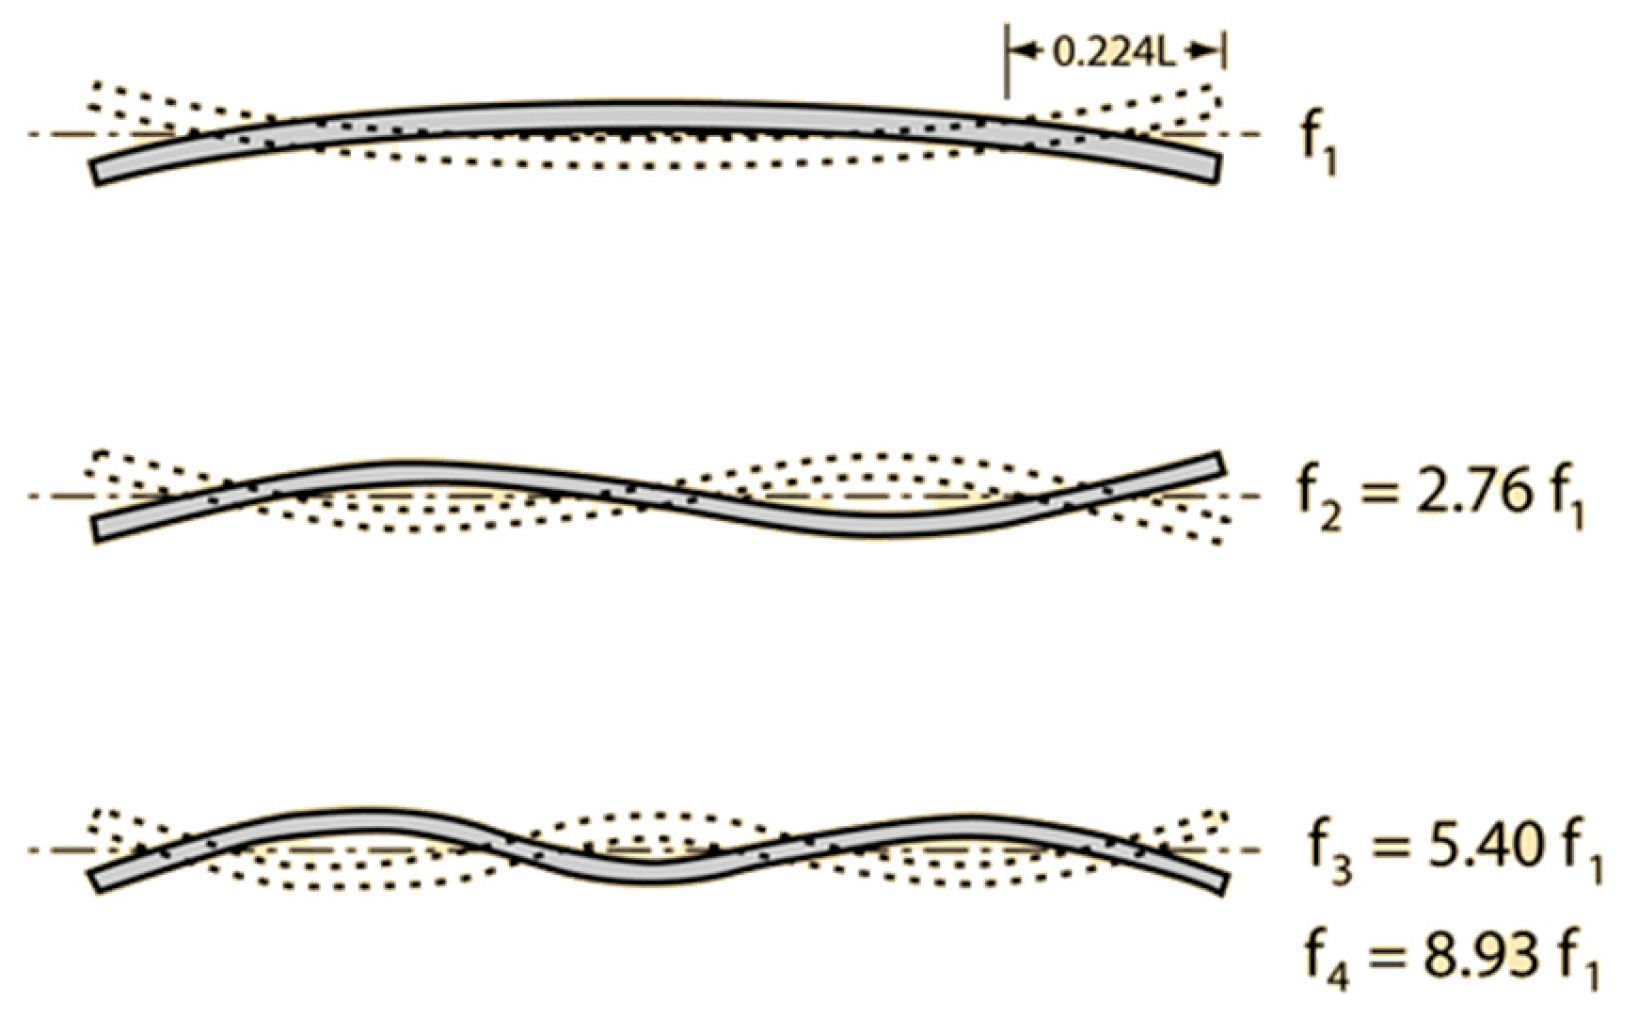
Figure 11.
Basic definitions and formulas used to estimate the natural frequency of a rod bar.

Figure 12.
Scheme of the model of the rock bolt adopted for the FEM simulation: (left) rock bolt; (right) head of the rock bolt and grouting.
Figure 12.
Scheme of the model of the rock bolt adopted for the FEM simulation: (left) rock bolt; (right) head of the rock bolt and grouting.
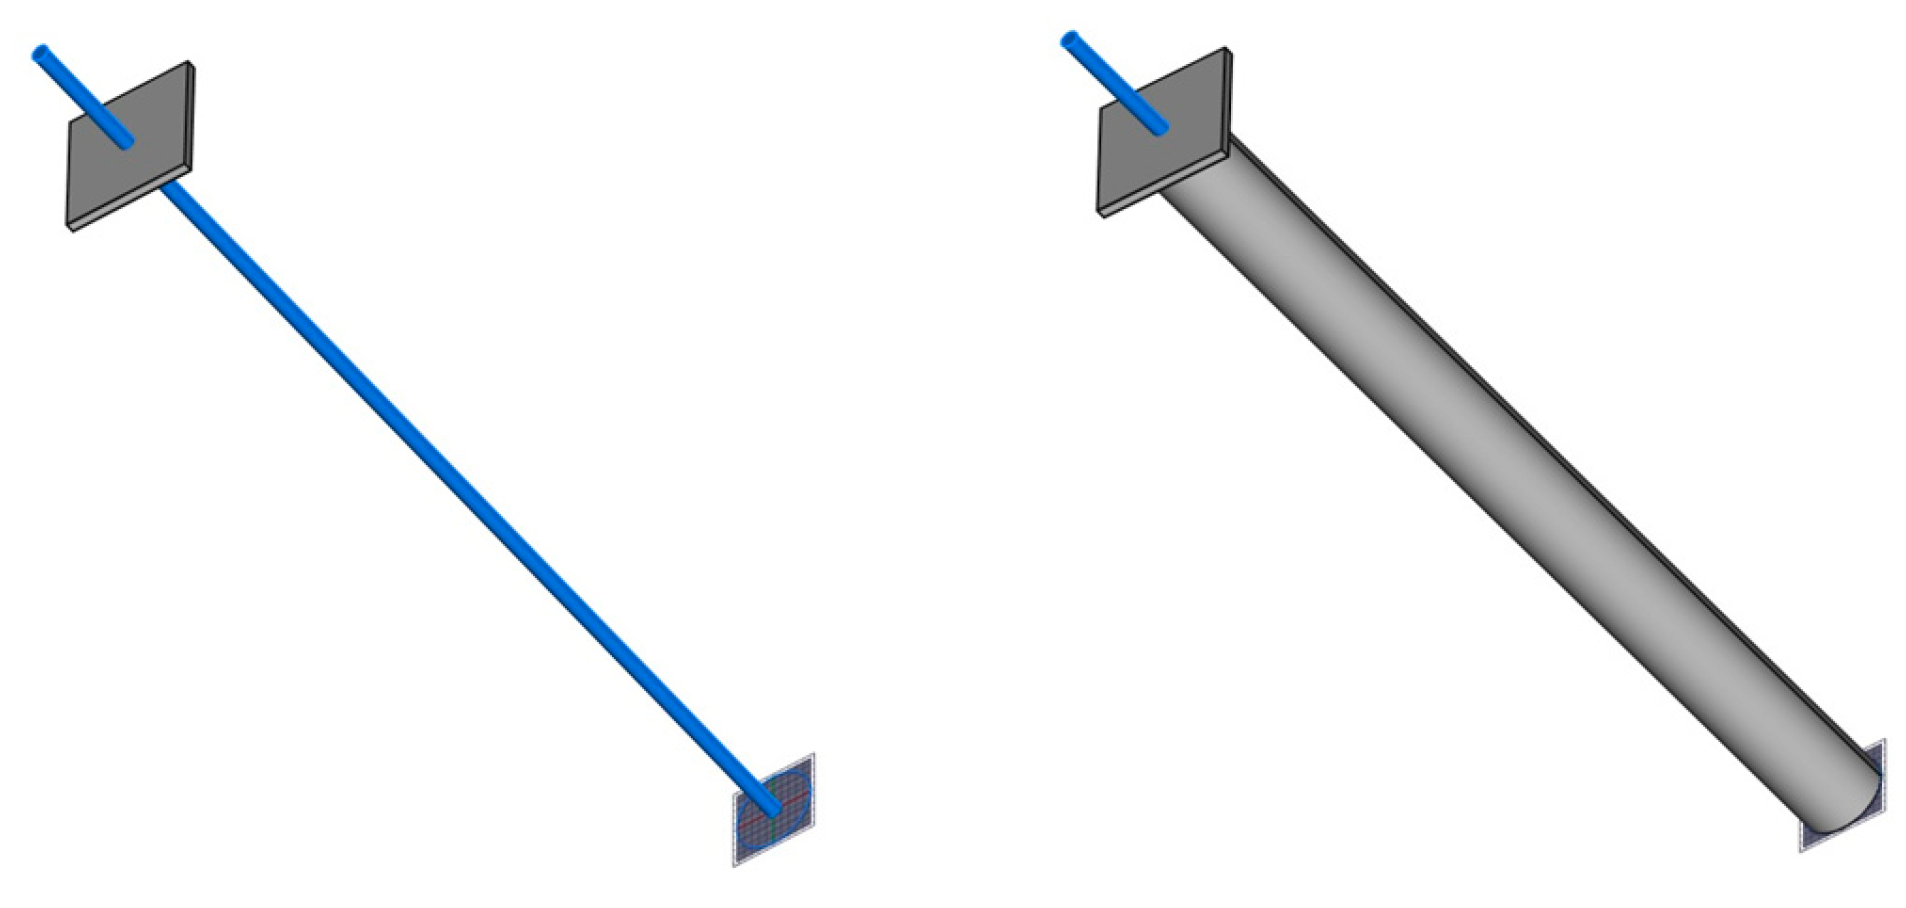
Figure 13.
Sketch of the rock bolt and grouting with tetrahedral meshing element for the finite analysis model.
Figure 13.
Sketch of the rock bolt and grouting with tetrahedral meshing element for the finite analysis model.
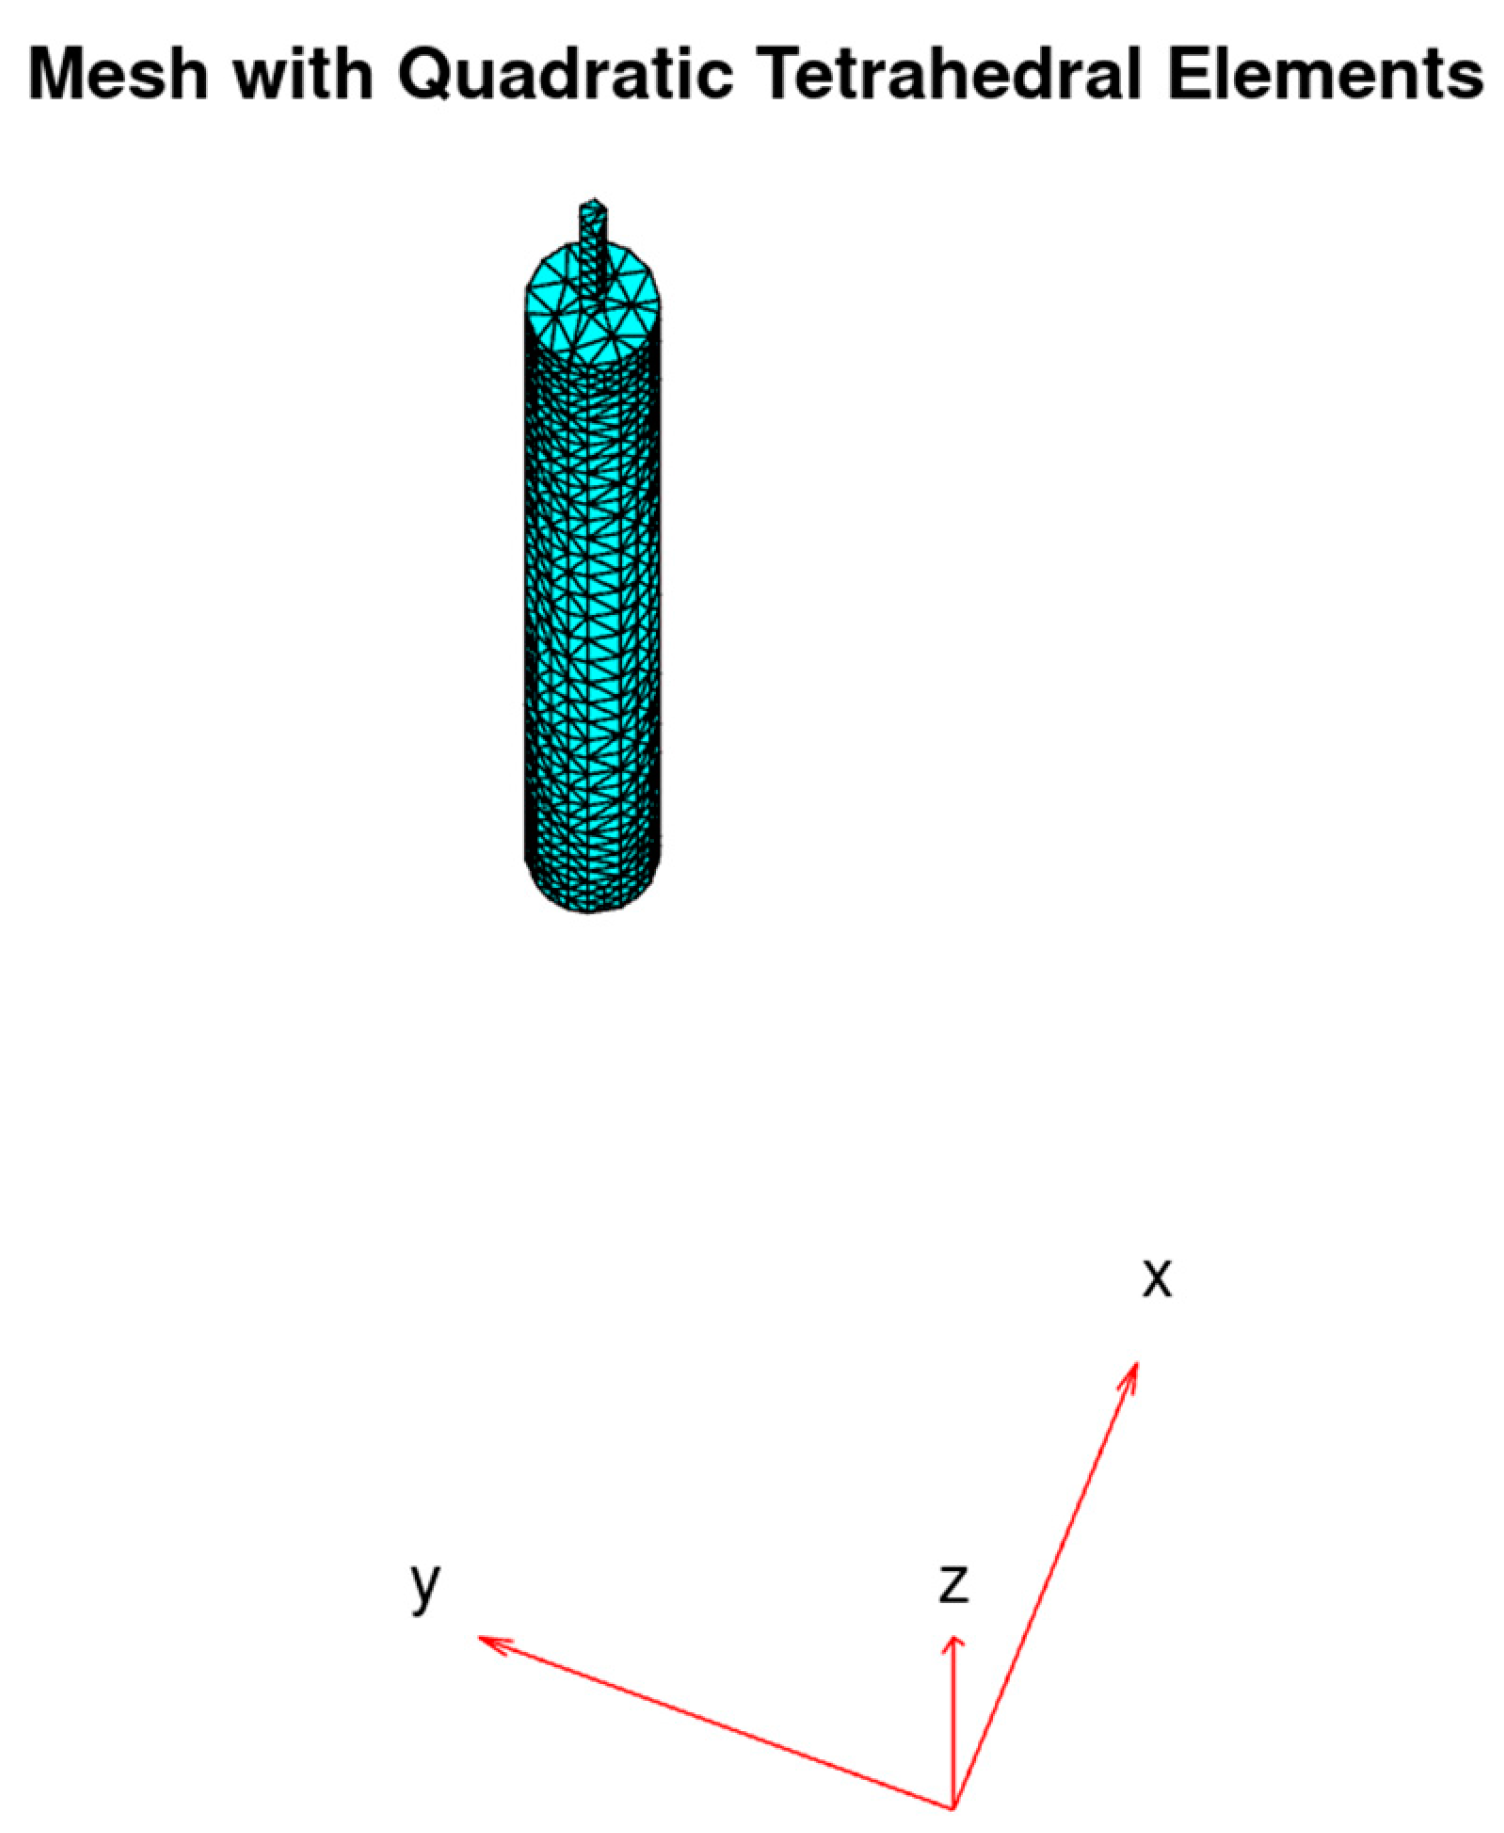
Figure 14.
Amplitude spectrum for poor grouting conditions (see Table 4).
Figure 14.
Amplitude spectrum for poor grouting conditions (see Table 4).
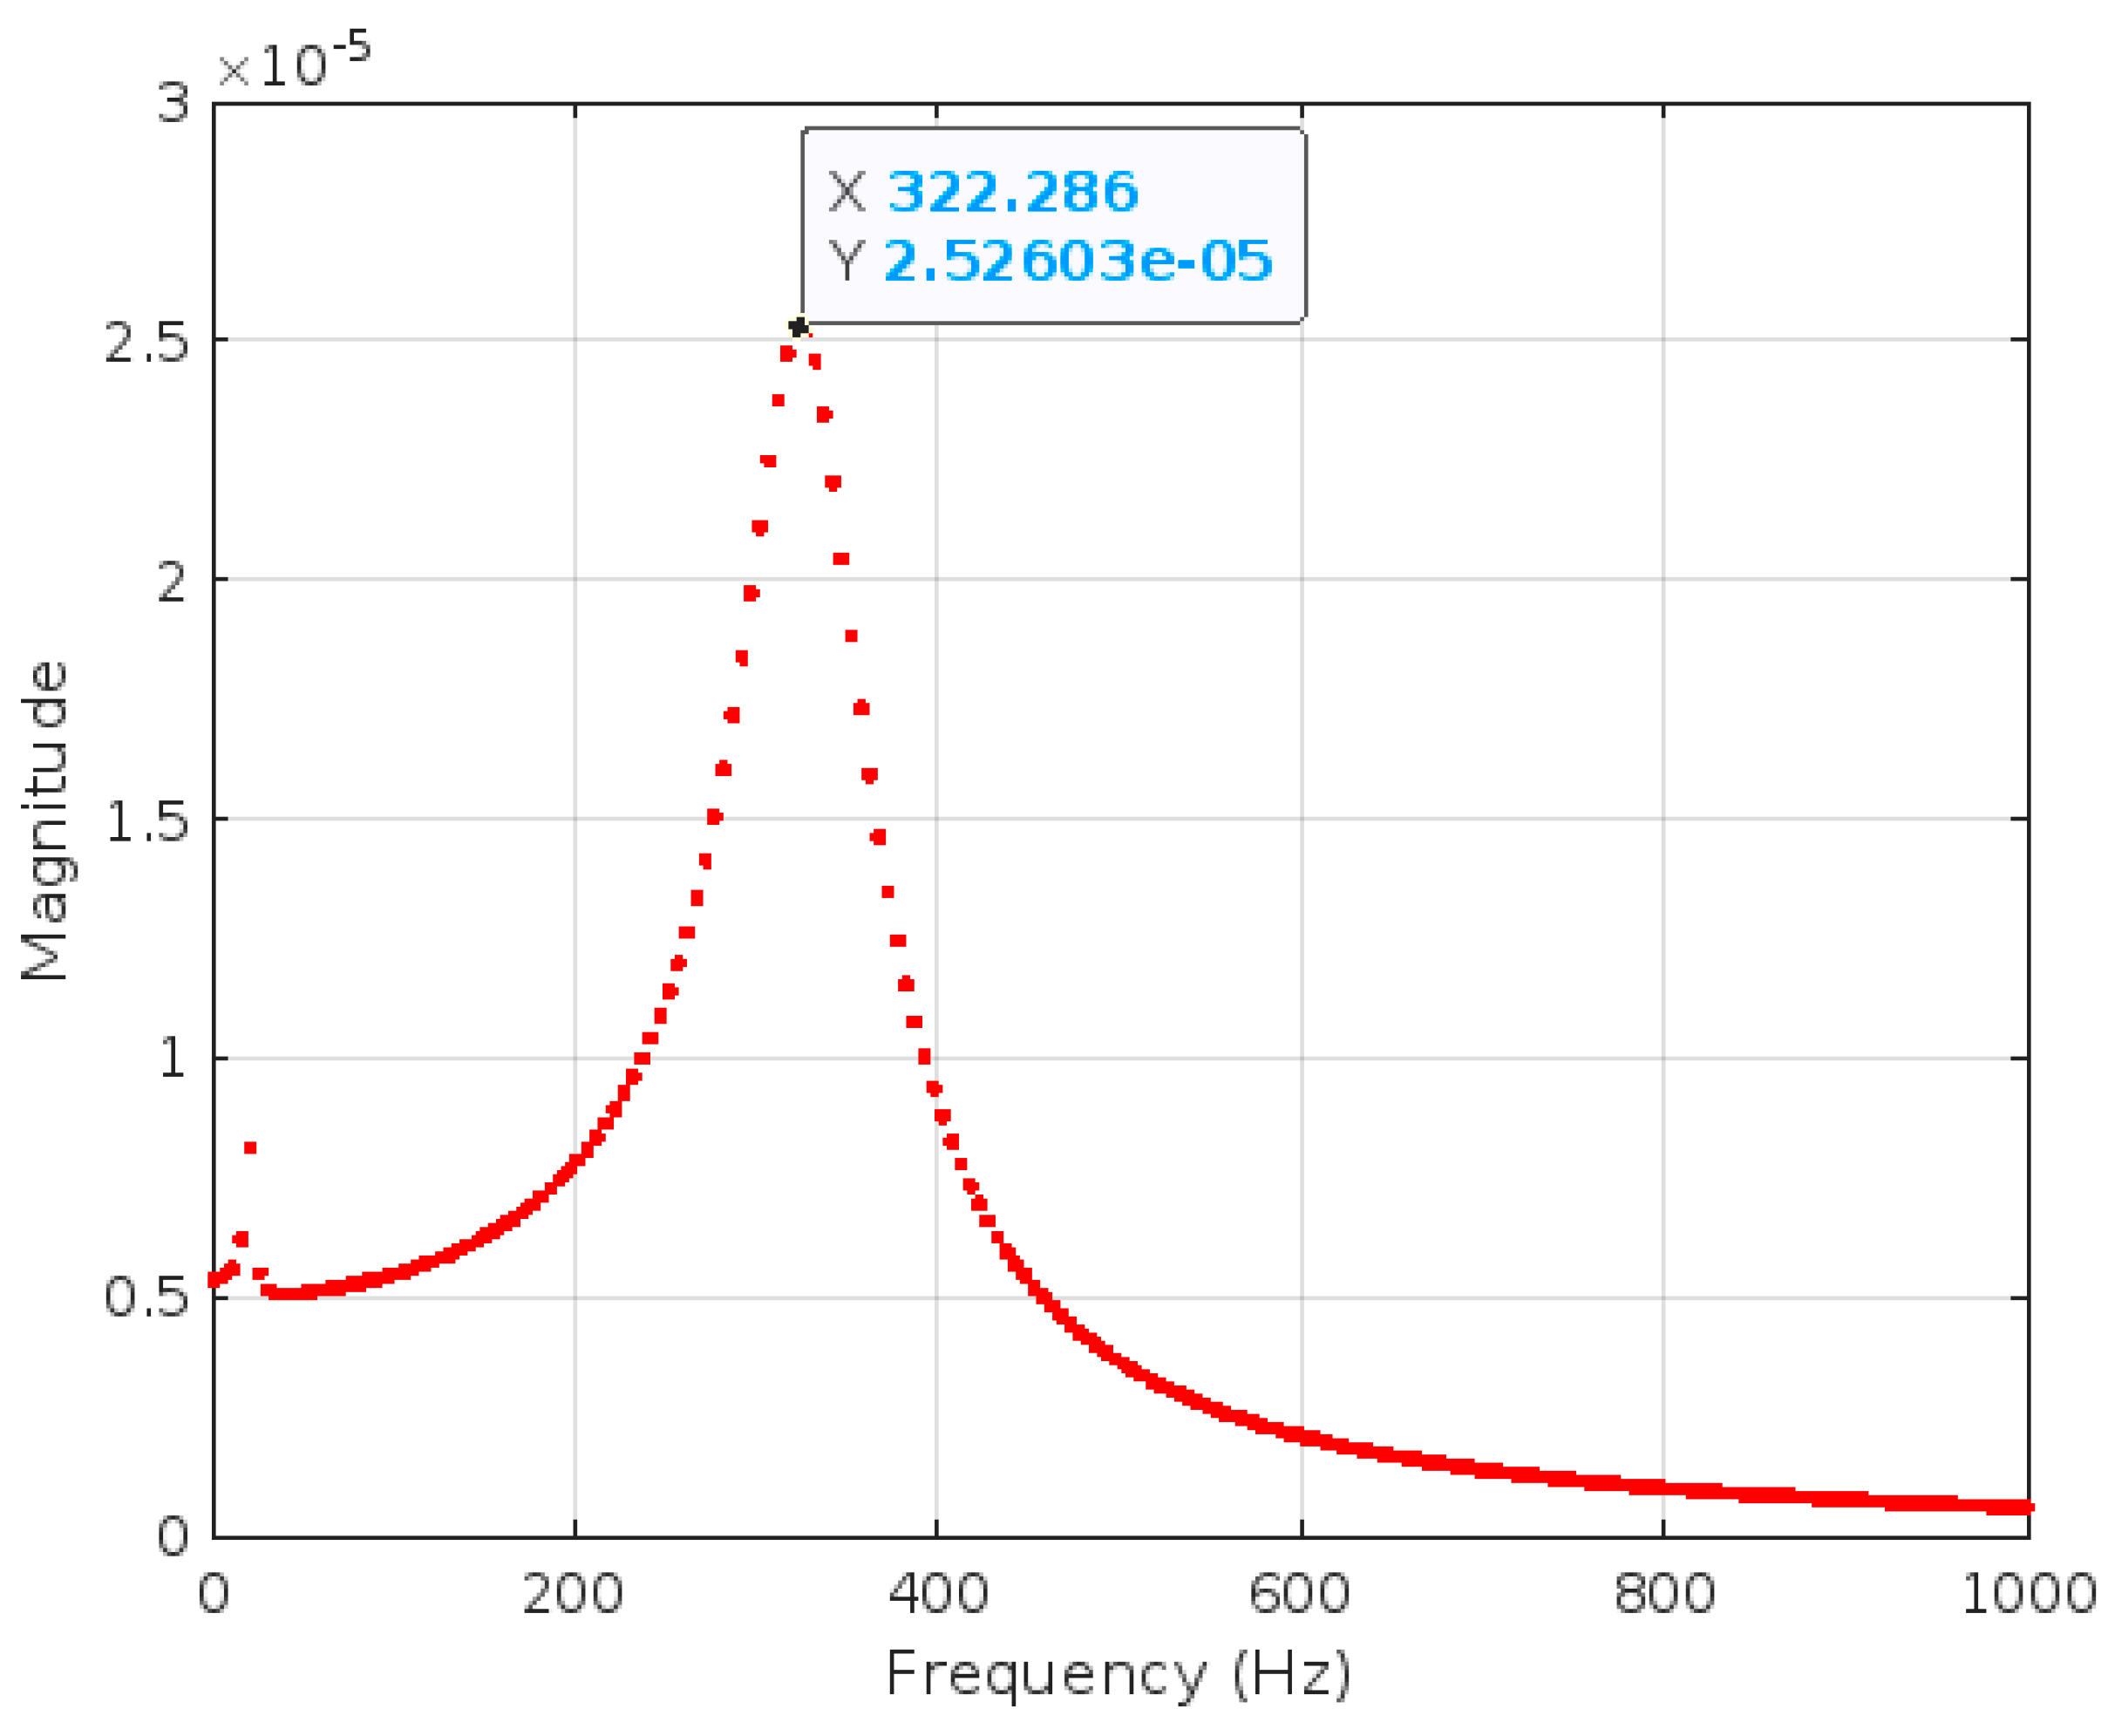
Figure 15.
Amplitude spectrum for intermediate grouting conditions (see Table 4).
Figure 15.
Amplitude spectrum for intermediate grouting conditions (see Table 4).
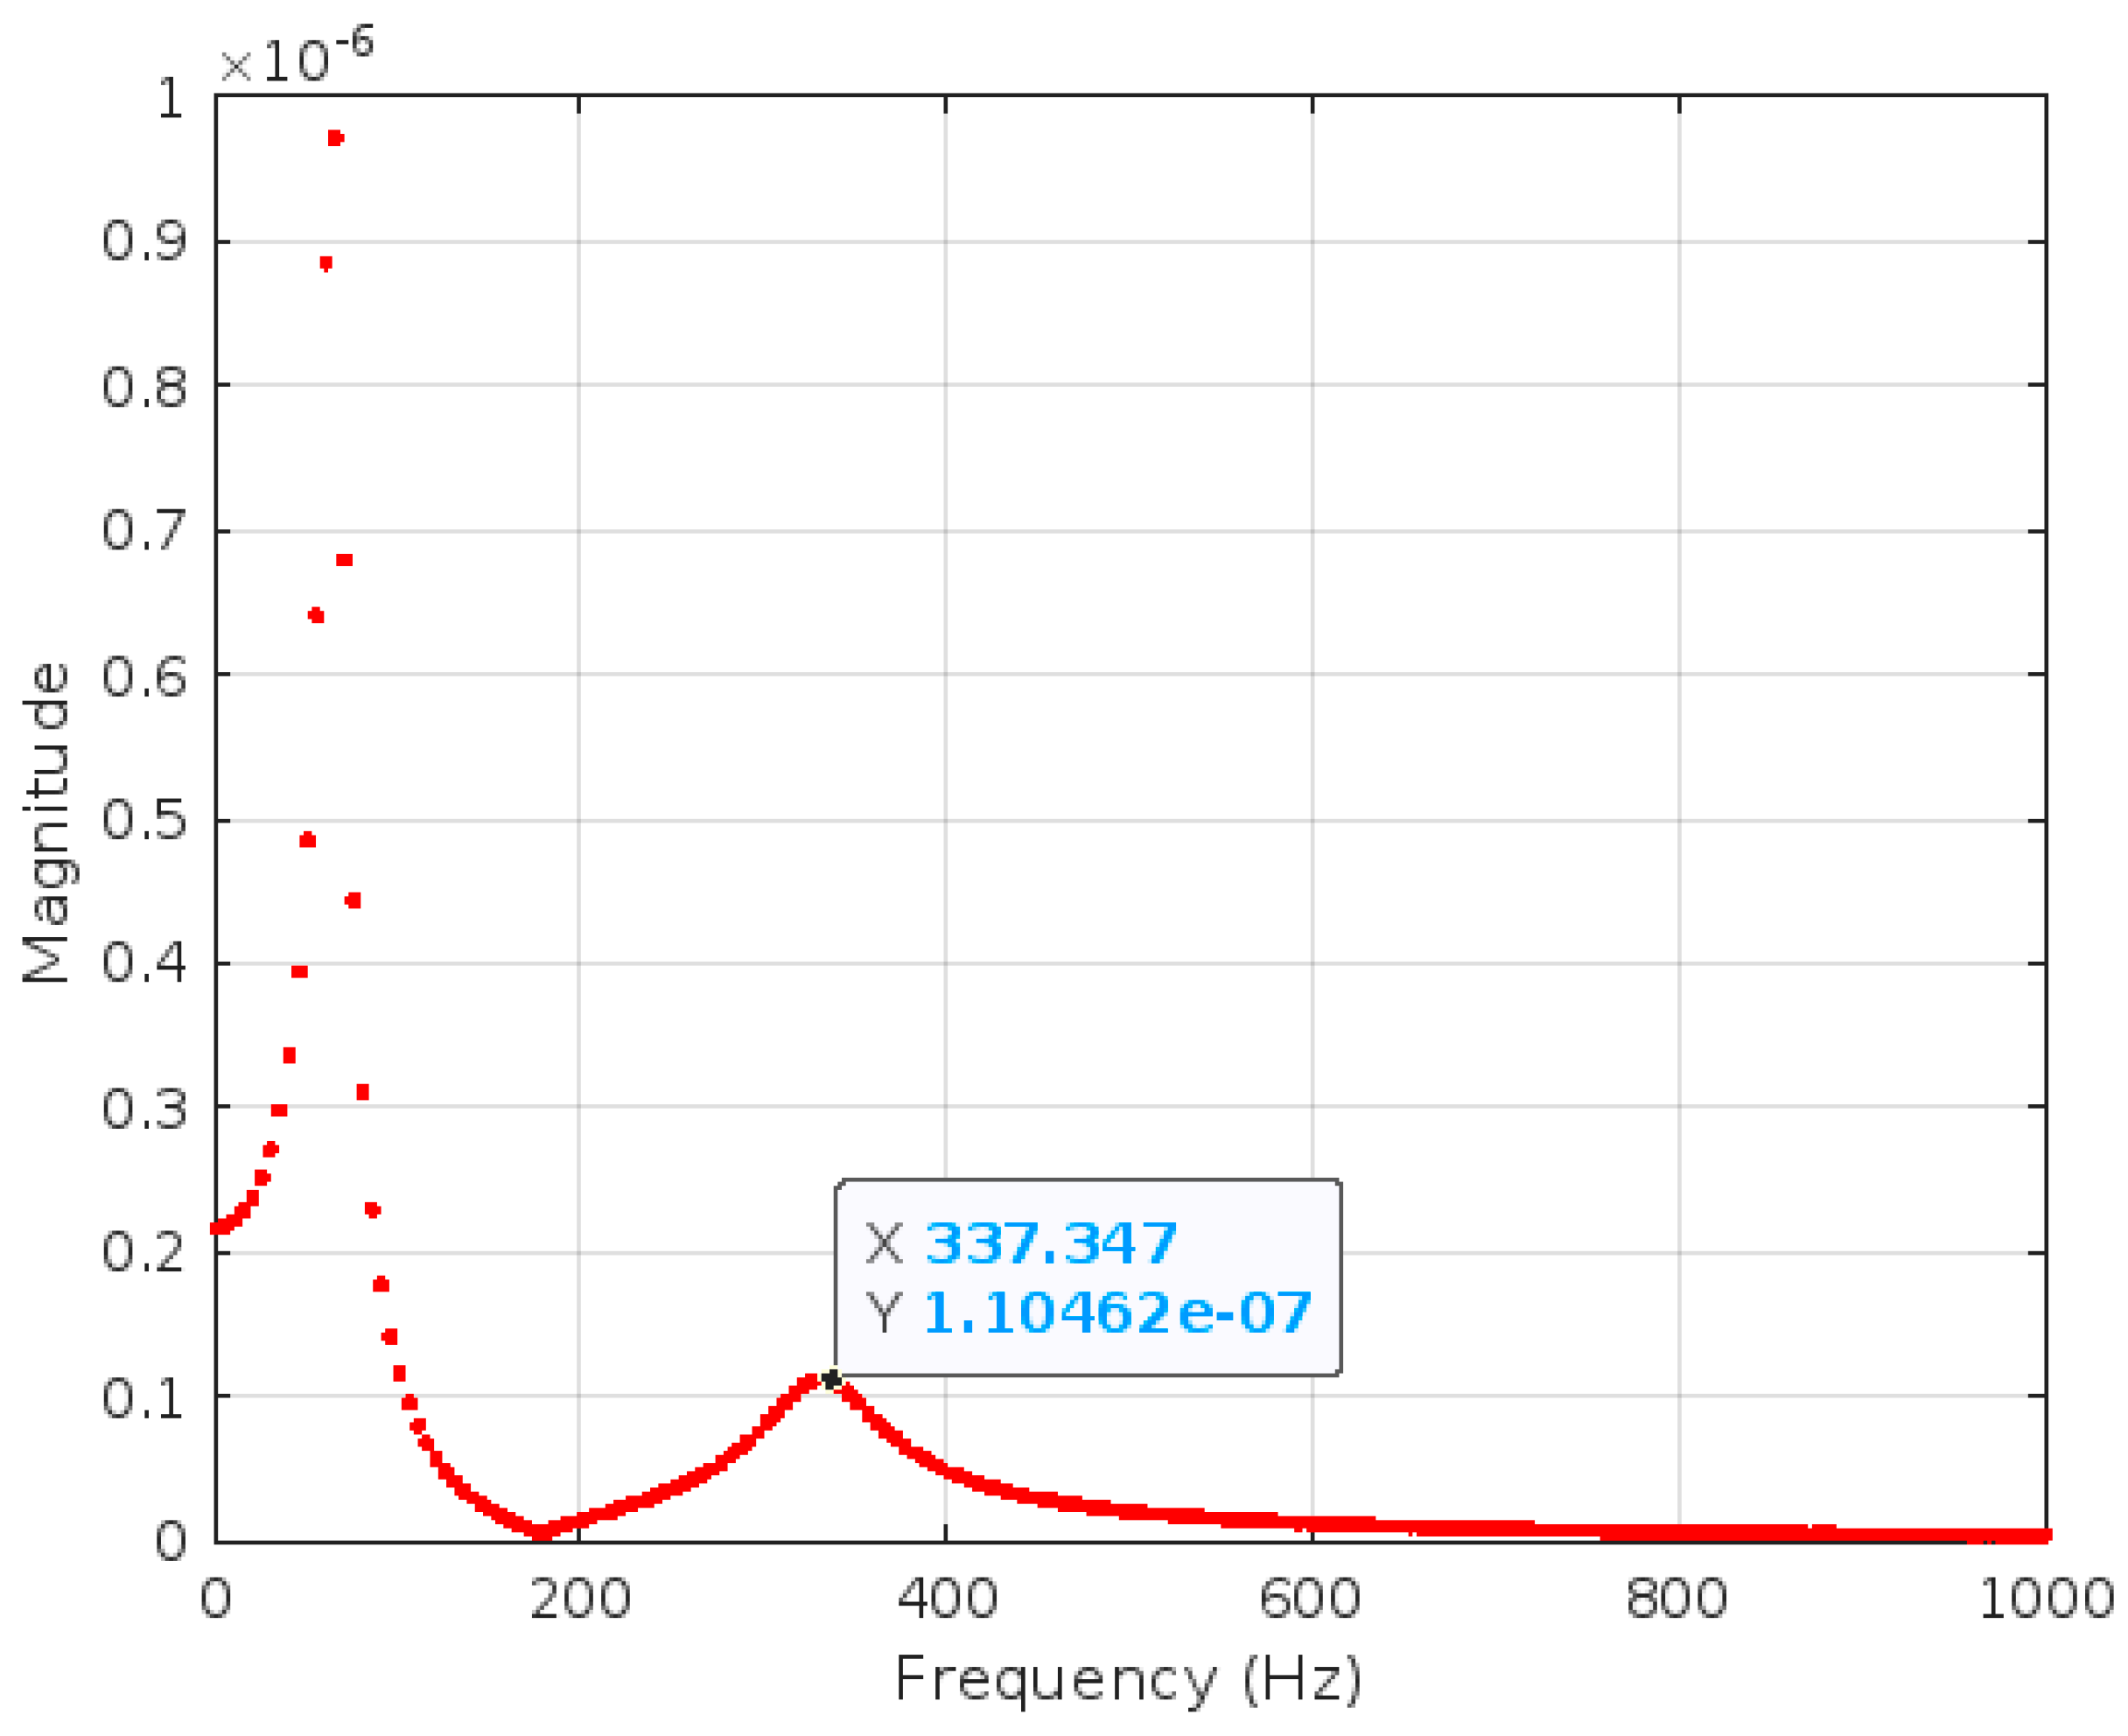
Figure 16.
Amplitude spectrum for good grouting conditions (see Table 4).
Figure 16.
Amplitude spectrum for good grouting conditions (see Table 4).
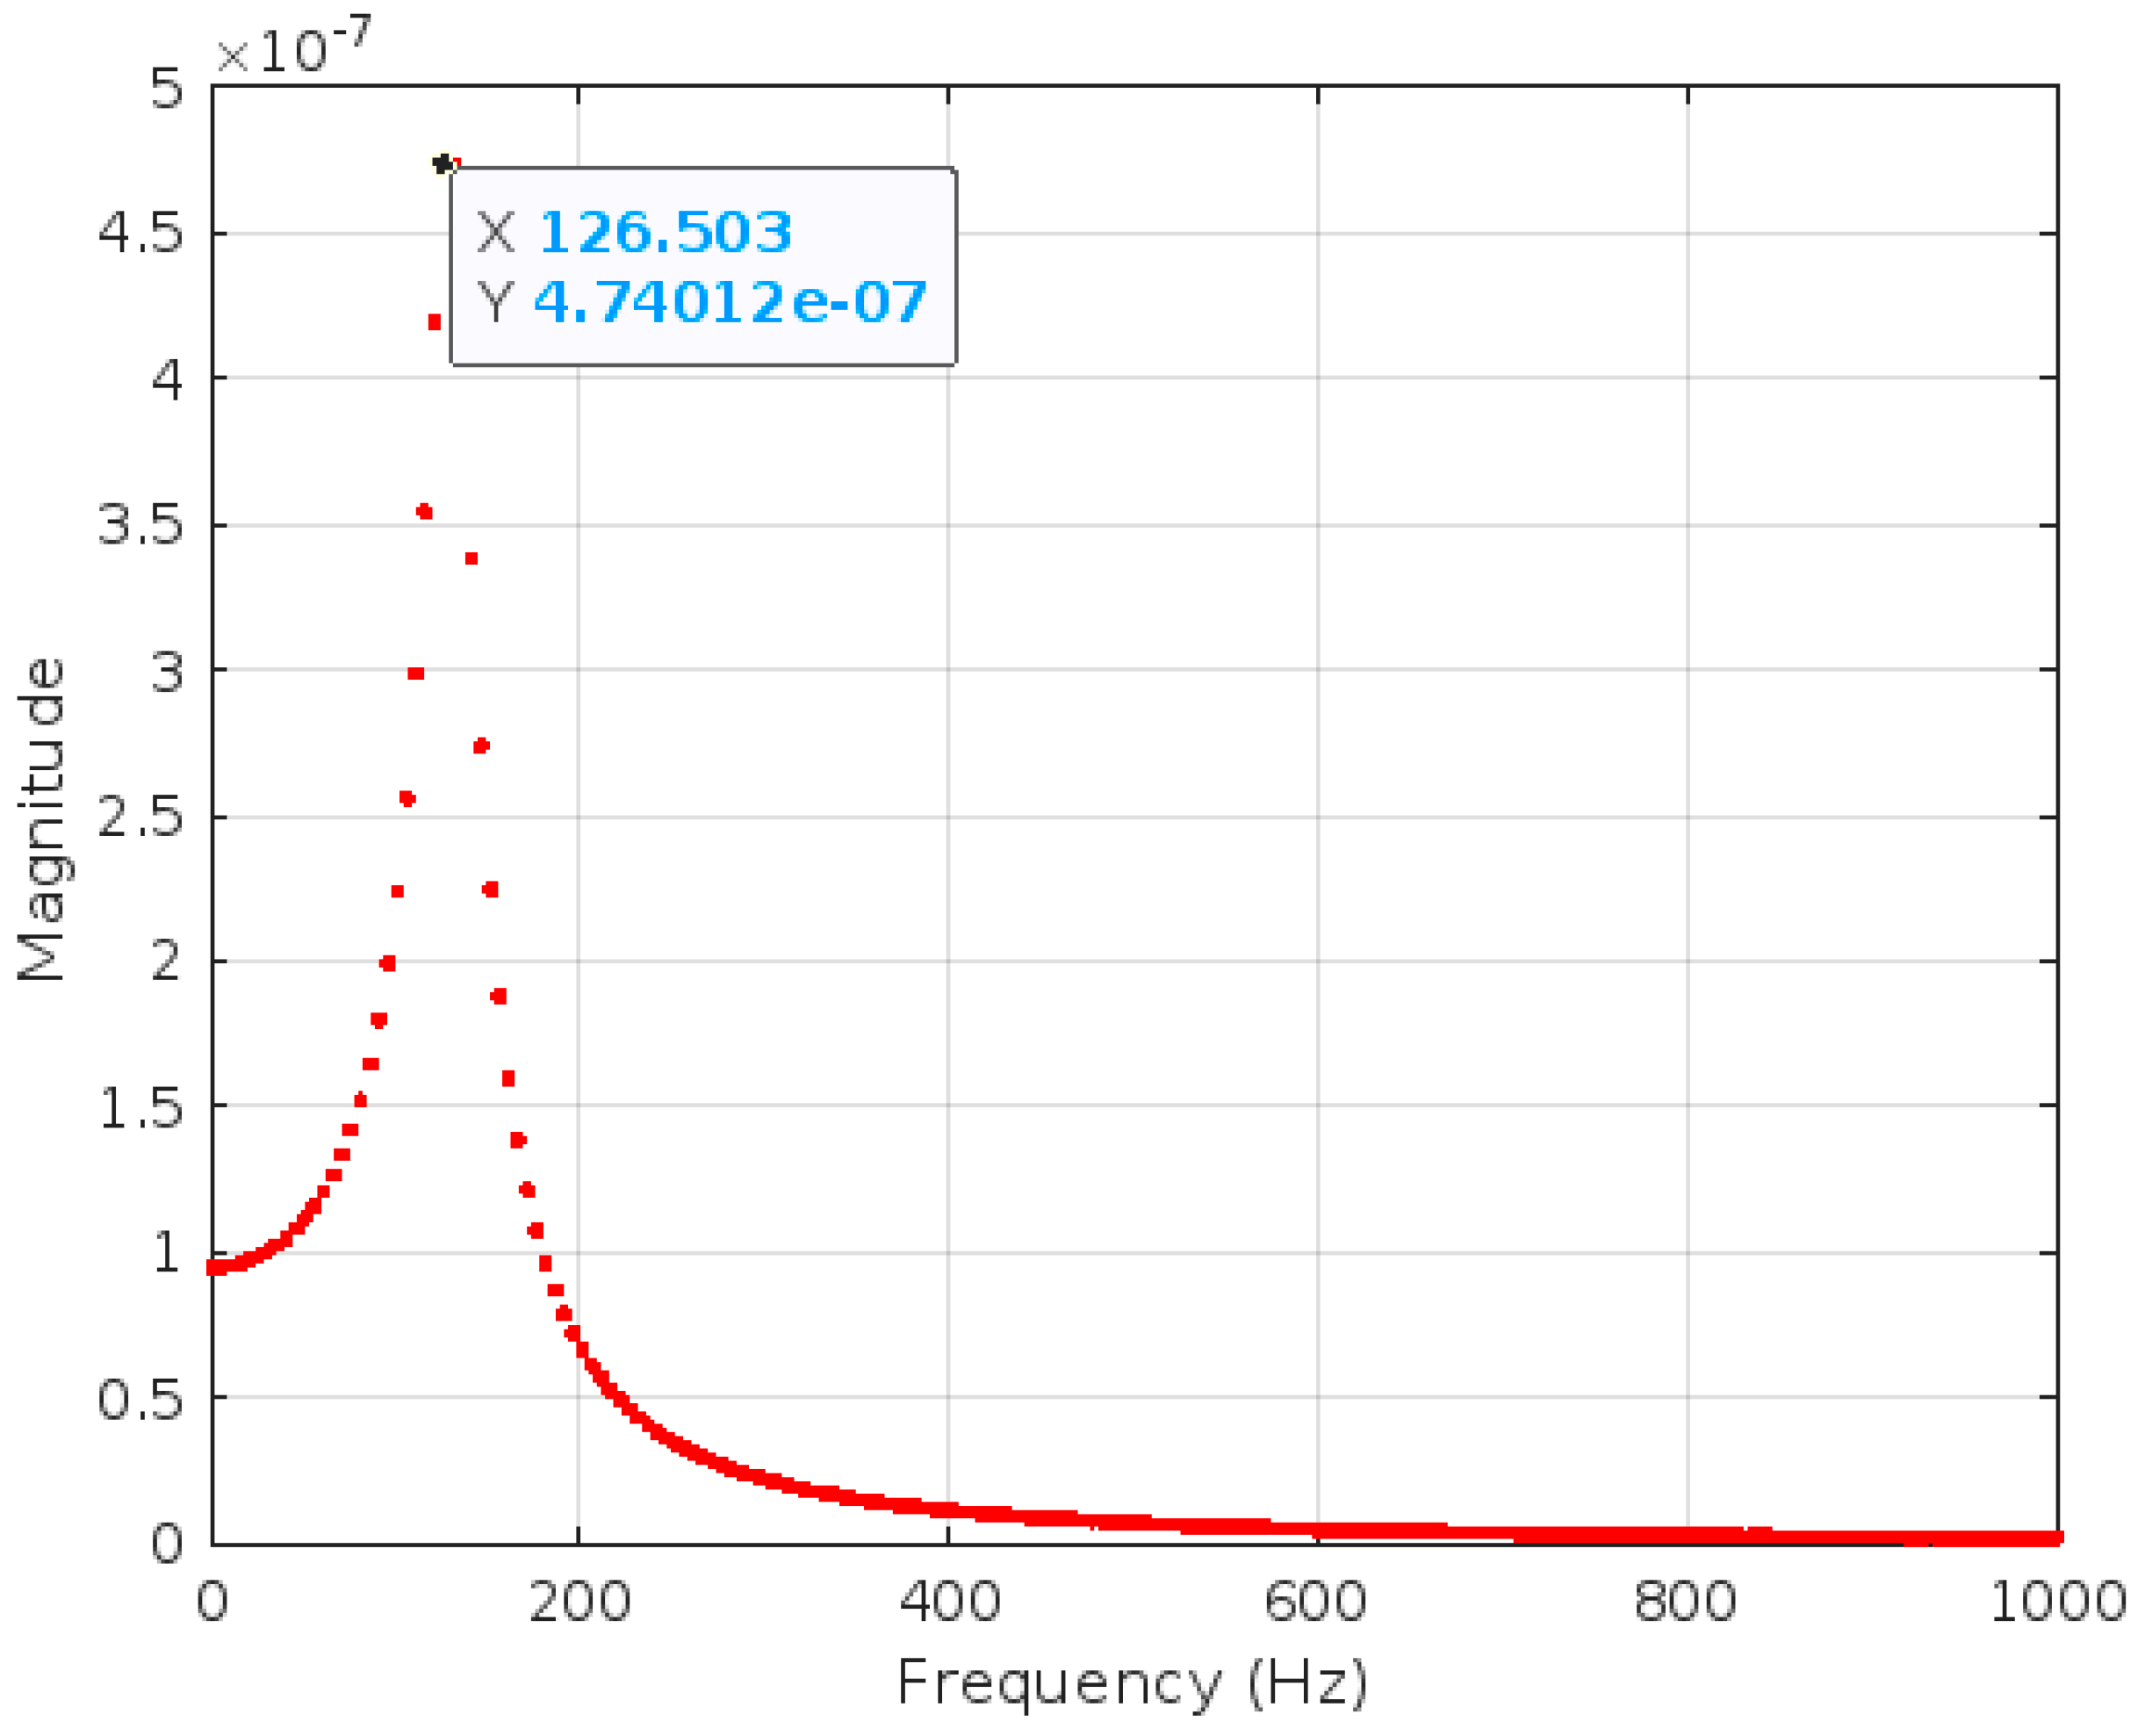

Table 1.
Dip and dip direction of the joints.
| Set | Dip | Dip Direction |
|---|---|---|
| K1 | 63 | 102 |
| K2 | 52 | 141 |
| K3 | 64 | 173 |
| K4 | 79 | 306 |
| K5 | 74 | 339 |
Table 2.
Geomechanical properties of the rock mass.
| Parameter | Value | Unit |
|---|---|---|
| Density | 2.51 | t/m3 |
| Uniaxial compressive strength (UCS) | 72 | MPa |
| Young’s elastic modulus | 2 | GPa |
| Rock mass rating (RMR) | 45 | - |
| Rock mass quality (Q) | 2 | - |
| Geological Strength Index (GSI) | 40 | - |
Table 3.
Resonance frequencies for a clamped rod and free rod, based on a steel rod 0.022 m in diameter and 1.4 m in length.
Table 3.
Resonance frequencies for a clamped rod and free rod, based on a steel rod 0.022 m in diameter and 1.4 m in length.
| f1 (Hz) | f2 | f3 | f4 | f5 | f6 | f7 | f8 | f9 | f10 | |
|---|---|---|---|---|---|---|---|---|---|---|
| Clamped rod | 5.86 | 52.7 | 146.5 | 287.2 | 474.8 | 709.2 | 990.6 | 1318 | 1694 | 2116 |
| Free rod | 52.5 | 145.9 | 286.0 | 472.8 | 706.3 | 986.5 | 1313 | 1687 | 2107 | 2574 |
Table 4.
Mechanical properties of the grouting in different simulation scenarios.
| Mechanical Properties | Scenario 1: Poor Grouting |
Scenario 2: Intermediate Grouting |
Scenario 3: Good Grouting |
|---|---|---|---|
| Young’s modulus (GPa) | 1 | 3 1 | 5 2 |
| Poisson’s ratio (-) | 0.3 | 0.3 | 0.3 |
| Mass density (kg/m3) | 2000 | 2000 | 2200 |
| Damping factor | 0.03 | 0.03 | 0.03 |
1 Average value between 1 and 5; 2 from HILTI-Chile (https://www.hilti.cl/medias/sys_master/documents/h73/ha8/9485948125214/Informacion-tecnica-ASSET-DOC-LOC-6852425.pdf (accessed on 13/12/2024)).
Table 5.
Resonance frequency detected for each experiment. * Indicates the only one of the serie with high frequency values, an anomalous behavior within the data set
Table 5.
Resonance frequency detected for each experiment. * Indicates the only one of the serie with high frequency values, an anomalous behavior within the data set
| Rock Bolt | Signal | f1 (Hz) | f2 (Hz) | Notes |
|---|---|---|---|---|
| R2R2 | 250 | 600 | ||
| R15L2 | sig1 | 20 | 270 | |
| sig2 | < 10 | - | ||
| sig3 | 470 | 700 | Poor-quality record | |
| sig4 | 30 | - | ||
| sig5 | 30 | - | ||
| R21L2 | sig1 | 1600 | - | |
| sig2 | 1500 | - | ||
| sig3 | 1400 | - | ||
| sig4 | 1600 | - | ||
| sig5 | 1400 | - | ||
| R21L4 | sig1 | 390 | 1050 | |
| sig2 | 420 | - | ||
| Sig3 * | 1000 | 1500 | ||
| sig4 | 330 | 570 | ||
| sig5 | 390 | - |
Disclaimer/Publisher’s Note: The statements, opinions and data contained in all publications are solely those of the individual author(s) and contributor(s) and not of MDPI and/or the editor(s). MDPI and/or the editor(s) disclaim responsibility for any injury to people or property resulting from any ideas, methods, instructions or products referred to in the content. |
© 2024 by the authors. Licensee MDPI, Basel, Switzerland. This article is an open access article distributed under the terms and conditions of the Creative Commons Attribution (CC BY) license (http://creativecommons.org/licenses/by/4.0/).
Copyright: This open access article is published under a Creative Commons CC BY 4.0 license, which permit the free download, distribution, and reuse, provided that the author and preprint are cited in any reuse.


