
Submitted:
16 December 2024
Posted:
18 December 2024
You are already at the latest version
Abstract
Increasing wood usage from sustainably managed forests is vital for reducing environmental footprints and combating climate change. This study conducted a cradle-to-gate life cycle assessment (LCA) for hardwood lumber in New Brunswick, Canada, evaluating environmental impacts from raw material extraction to the point where lumber exited the mill as rough green, the primary input for manufacturing secondary hardwood products. Data on annual production, material flow, and energy use for hardwood harvesting and sawmills in 2022 were gathered through survey questionnaires and on-site visits to one forestry company and two hardwood plants. A mass allocation approach was used for the product (lumber) and by-products. The life cycle inventory (LCI) was developed in SimaPro software, and the life cycle impact assessment (LCIA) was conducted using the North American TRACI method to quantify impact categories, including Global Warming Potentials. The Cumulative Energy Demand (CED) method analyzed total energy consumption. The study found rough green hardwood lumber production emitted approximately 41 kgCO2eq/m³ (excluding biogenic carbon storage), with manufacturing accounting for 42% of total emissions. Manufacturing consumed nearly twice the energy of harvesting. The carbon stored in lumber was 975 CO2 eq/m³, 24 times greater than its cradle-to-gate emissions, highlighting its significant environmental benefit.
Keywords:
1. Introduction
2. Materials and Methods
2.1. Goal and Scope of LCA
2.1.1. Functional Unit
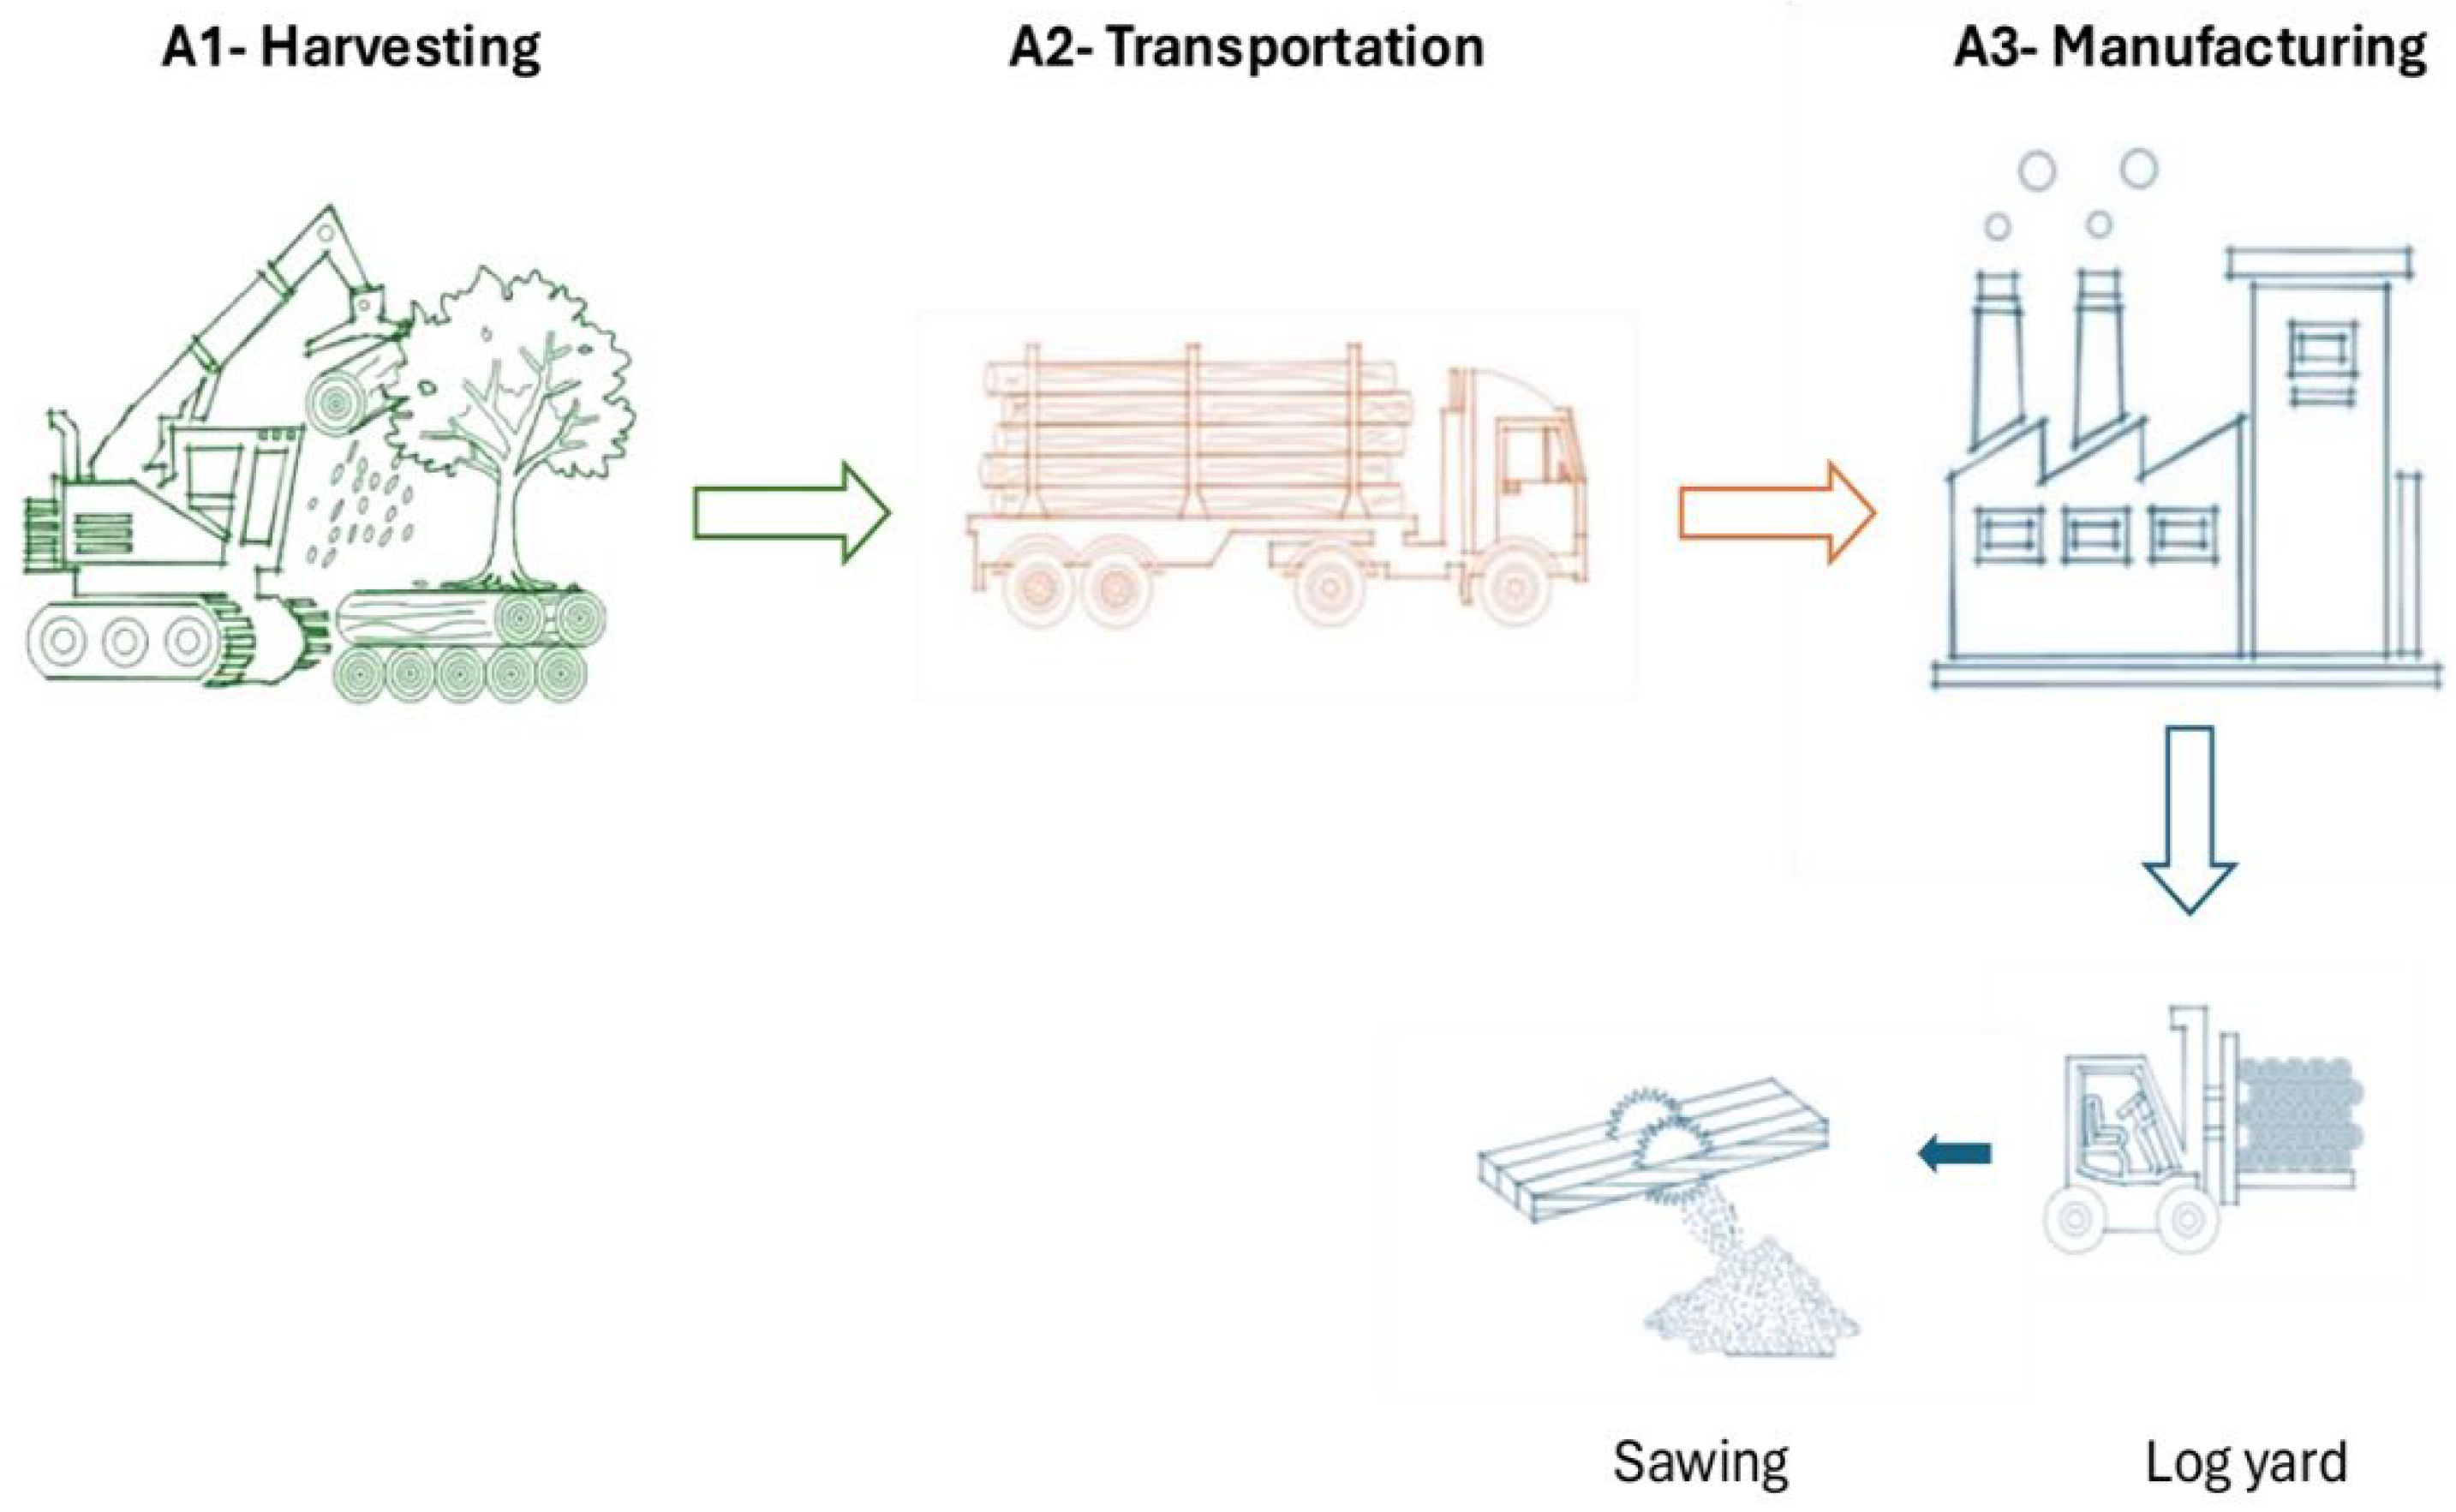
2.1.2. System Boundary
2.2. Life Cycle Inventory (Data Collection and Calculations)
2.2.1. Resource Extraction
2.2.2. Transport of Raw Materials from the Extraction Site to the Sawmill
2.2.3. Product Manufacturing Process
2.2.4. Species, Moisture Content, and Specific Gravity of the Woods Examined
2.2.5. Lumber Manufacturing Mass Balance and Conversion Efficiencies
2.2.6. Gate-to-Gate Energy and Material Input/Output
2.2.7. Log yard
2.2.8. Sawing (Production of Rough Green Lumber)
2.2.9. Secondary Data Sources
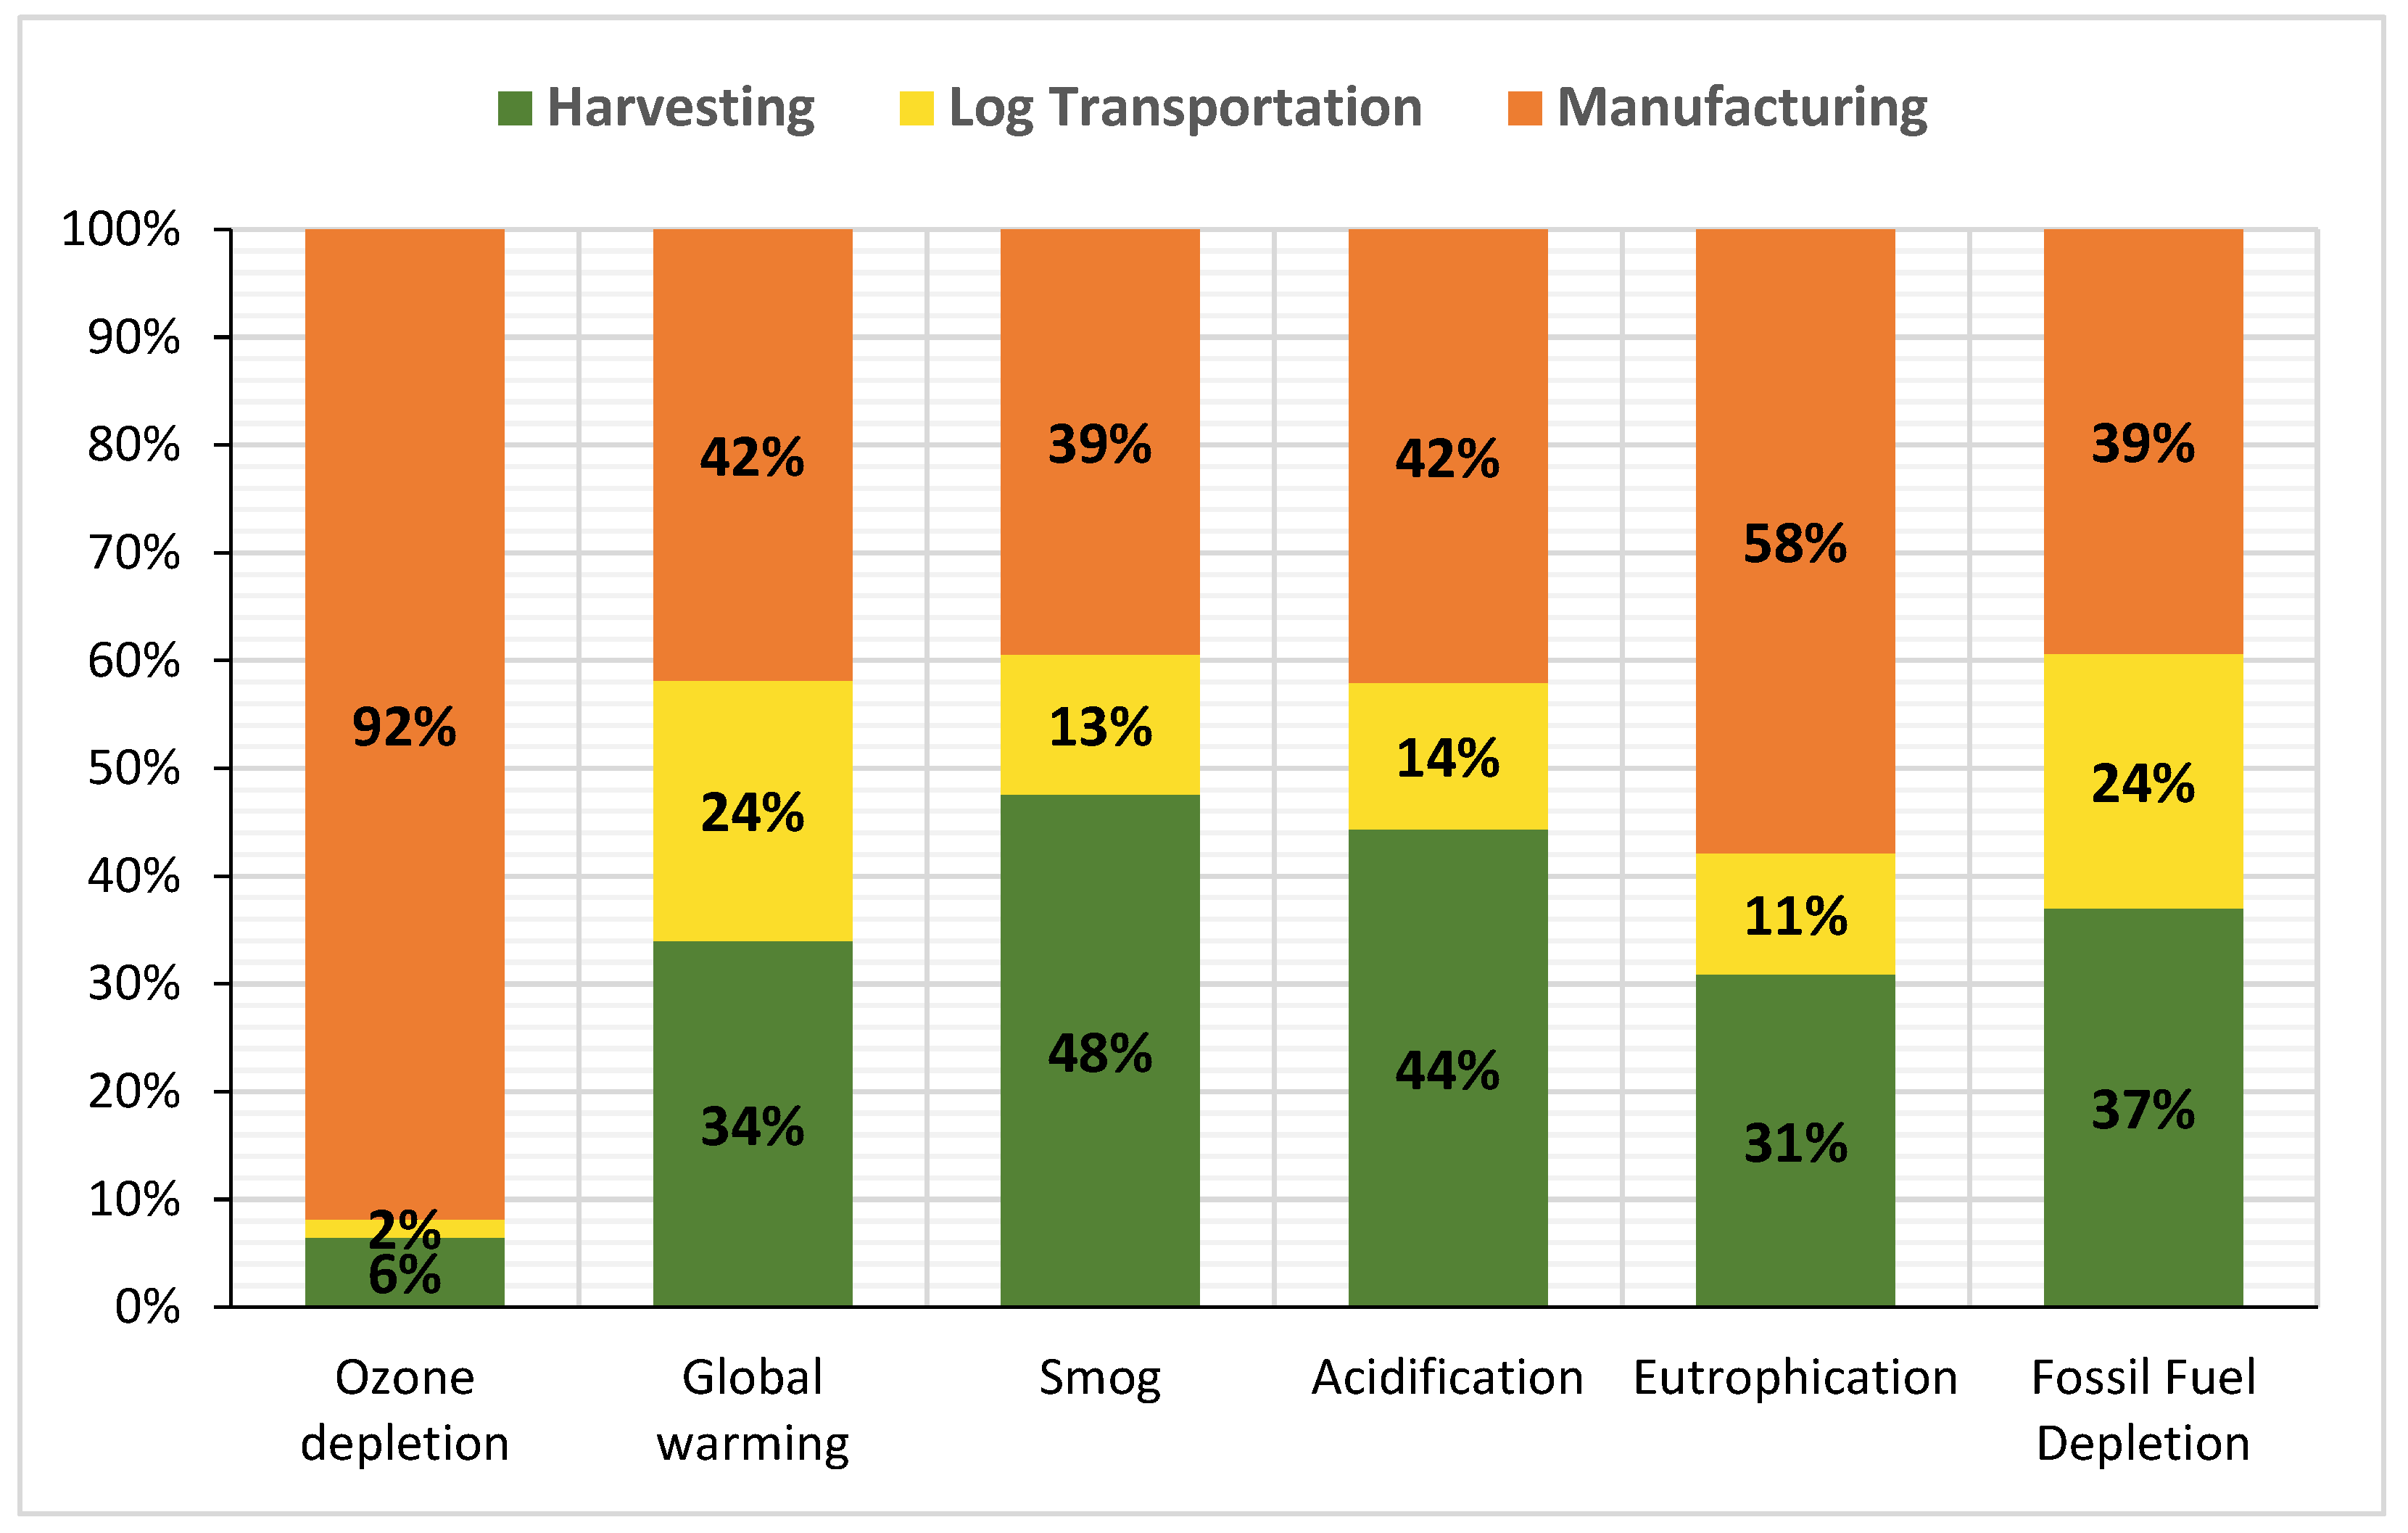
3. Life Cycle Impact Assessment (LCIA)

| Environmental Indicator | Unit | Total | A1 | A2 | A3 | |
|---|---|---|---|---|---|---|
| Impact Category | Global Warming | kg CO2 eq | 40.67 | 13.82 | 9.84 | 17.01 |
| Acidification | kg SO2 eq | 0.40 | 0.18 | 0.054 | 0.17 | |
| Eutrophication | kg N eq | 0.045 | 0.014 | 0.005 | 0.026 | |
| Smog | kg O3 eq | 12.07 | 5.74 | 1.57 | 4.76 | |
| Ozone Depletion | kg CFC-11 eq | 9.88E-07 | 6.42E-08 | 1.64E-08 | 9.08E-07 | |
| Fossil Fuel Depletion | MJ surplus | 73.71 | 27.28 | 17.43 | 29.00 | |
| Energy Consumption | Total primary energy | MJ | 736.08 | 207.75 | 132.69 | 395.64 |
| Non-renewable fossil | MJ | 583.66 | 204.74 | 130.79 | 248.13 | |
| Non-renewable nuclear | MJ | 141.32 | 2.82 | 1.78 | 136.71 | |
| Renewable biomass | MJ | 5.09 | 0.074 | 0.045 | 4.98 | |
| Renewables (solar, wind, hydro, geothermal, and biomass) | MJ | 6.00 | 0.11 | 0.063 | 5.83 |
4. Biogenic Carbon
5. Variation and Sensitivity Analysis
6. Discussion
| Impact Category | Unit | Rough green Hardwood Lumber, NB | Rough green Softwood Lumber, NB | Percent change |
|---|---|---|---|---|
| Global warming potential | kg CO2 eq | 40.67 | 26.48 | 54% |
| Acidification | kg SO2 eq | 0.40 | 0.24 | 63% |
| Eutrophication potential | kg N eq | 0.04 | 0.03 | 40% |
| Smog potential | kg O3 eq | 12.07 | 7.16 | 68% |
| Ozone depletion potential | kg CFC11e | 9.88E-07 | 8.99E-07 | 10% |
| Total primary energy | MJ | 736.07 | 520.38 | 41% |
| Non-renewable fossil | MJ | 583.66 | 376.17 | 55% |
| Non-renewable nuclear | MJ | 141.31 | 133.67 | 6% |
| Renewable biomass | MJ | 5.09 | 4.75 | 5% |
| Renewables (solar, wind, hydro, geothermal, and biomass) | MJ | 6.00 | 5.70 | 5% |
7. Conclusions
- The manufacturing stage accounted for 54% of total primary energy consumption and had the highest GWP impact at 42%, with most electricity at mill sites sourced off-site, relying 98% on non-renewable energy and only 2% on renewable sources.
- Harvesting and transportation contributed approximately 28% and 18%, respectively, to the overall energy consumption.
- The higher manufacturing energy consumption and GWP in hardwood production compared to softwood were primarily attributed to the greater electrical energy required for sawing hardwood and its lower lumber yield.
- Rough green hardwood lumber stored 24 times more carbon than its cradle-to-gate CO2 eq emissions released.
Data Availability Statement
Acknowledgments
Conflicts of Interest
References
- Gong, M. (Ed.) Engineered Wood Products for Construction. IntechOpen, 2022. [Google Scholar] [CrossRef]
- Hubbard, S.; Bergman, R.; Sahoo, K. A Life Cycle Assessment of Hardwood Lumber Production in the Northeast and Northcentral United States. 2020. [Google Scholar] [CrossRef]
- Gu, H.; Nepal, P.; Arvanitis, M.; Alderman, D. Carbon Impacts of Engineered Wood Products in Construction. IntechOpen, 2022. [Google Scholar] [CrossRef]
- Government of New Brunswick. Climate Change Act. 2018. https://laws.gnb.ca/en/pdf/as/2018,%20C.11.pdf.
- United Nations. Take Urgent Action to Combat Climate Change and Its Impacts. 2023. https://sdgs.un.org/goals/goal13#progress_and_info.
- Government of New Brunswick. Transitioning to a Low-Carbon Economy: New Brunswick’s Climate Change Action Plan. Government of New Brunswick, 2016. https://www2.gnb.ca/content/dam/gnb/Departments/env/pdf/Climate-Climatiques/TransitioningToALowCarbonEconomy.pdf.
- Puettmann, M.; Bergman, R.; Hubbard, S.; Johnson, L.; Lippke, B.; Oneil, E.; Wagner, F. Cradle-to-Gate Life-Cycle Inventory of US Wood Products Production: CORRIM Phase I and Phase II Products. Wood and Fiber Science 2010, 42. [Google Scholar]
- Kutnar, A.; Hill, C. Life Cycle Assessment—Opportunities for Forest Products Sector. BioProducts Business 2017, 2, 52–64. [Google Scholar]
- ISO 14040; Environmental Management - Life Cycle Assessment - Principles and Framework. International Organization for Standardization: Geneva, Switzerland, 2006.
- ISO 14044; Environmental Management - Life Cycle Assessment - Requirements and Guidelines. International Organization for Standardization: Geneva, Switzerland, 2006.
- Puettmann, M.; Pierobon, F.; Ganguly, I.; Gu, H.; Chen, C.; Liang, S.; Jones, S.; Maples, I.; Wishnie, M. Comparative LCAs of Conventional and Mass Timber Buildings in Regions with Potential for Mass Timber Penetration. Sustainability 2021, 13, 13987. [Google Scholar] [CrossRef]
- Bergman, R.D.; Bowe, S.A. Environmental Impact of Producing Hardwood Lumber Using Life-Cycle Inventory. Wood and Fiber Science 2008, 40, 448–458. [Google Scholar]
- Mahalle, L. A Cradle-to-Gate Life Cycle Assessment of Canadian Hardwood Lumber. FPInnovations. 2010. [Google Scholar]
- LTS. DATASMART Life Cycle Inventory. 2023. https://longtrailsustainability.com/software/datasmart-life-cycle-inventory/(accessed on 2023).
- Fonseca, M.A. The Measurement of Roundwood: Methodologies and Conversion Ratios. 2005. [Google Scholar]
- ASTM D143-22; Standard Test Methods for Small Clear Specimens of Timber. ASTM International: West Conshohocken, PA, 2023. https://www.astm.org/standards/d143/.
- Athena Sustainable Materials Institute. A Cradle-to-Gate Life Cycle Assessment of Eastern Canadian Surfaced Dry Softwood Lumber. 2018. https://www.athenasmi.org/wp-content/uploads/2018/07/CtG-LCA-of-Eastern-Canadian-Surfaced-Dry-Softwood-Lumber.pdf.
- PRé Sustainability B.V. SimaPro (Version 9.6) [Computer software]; PRé Sustainability, 2024. https://simapro.com.
- Bare, J.C. TRACI 2.0: The Tool for the Reduction and Assessment of Chemical and Other Environmental Impacts 2.0. Clean Technologies and Environmental Policy, 2011.
- Frischknecht, R.; Jungbluth, N.; Althaus, H.J.; Doka, G.; Dones, R.; Hischier, R.; Hellweg, S.; Humbert, S.; Margni, M.; Nemecek, T.; Spielmann, M. Implementation of Life Cycle Impact Assessment Methods: Data v2.0. ecoinvent Report No. 3. Swiss Centre for Life Cycle Inventories: Dübendorf, Switzerland, 2007. [Google Scholar]
- Bergman, R.; Puettmann, M.; Taylor, A.; Skog, K.E. The Carbon Impacts of Wood Products. Forest Products Journal 2014, 64, 220–231. [Google Scholar] [CrossRef]
- Zahabi, N.; Gong, M.; Gu, H.; Blackadar, J. Case Study on the Cradle-to-Gate Life Cycle Assessment of Softwood Lumber Production in New Brunswick, Canada. Journal of Sustainable Forestry. under review.
- Gu, C.; Gu, H.; Gong, M.; Blackadar, J. A Case Study on the Impact of Transportation of Mass Timber Products on the Cradle-to-Gate LCA Results for an Institutional Building. Recent Progress in Materials 2022, 4, 1. [Google Scholar] [CrossRef]
| Resource | Inputs | Unit | Amount per m3 of roundwood |
|---|---|---|---|
| Energy | Diesel fuel | Litre | 3.69 |
| Gasoline | Litre | 0.70 | |
| Propane | Litre | 0.01 | |
| Ancillary Materials | Hydraulic fluid | Litre | 0.054 |
| Motor oil | Litre | 0.02 | |
| Greases | Kg | 0.0017 | |
| Antifreeze | Litre | 0.0014 |
| Amount | Unit | Allocation | ||
|---|---|---|---|---|
| Output | Log at mill (including bark) | 1 | m3 | 100% |
| Input | Log at forest road (including bark) | 1 | m3 | - |
| Transport, combination truck | 104 | tkm | - |
| Species | Contribution | MC | Green SG |
|---|---|---|---|
| Birch | 50% | 65% | 0.530 |
| Maple | 32% | 58% | 0.594 |
| Aspen | 17% | 89% | 0.421 |
| Weight average | 67% | 0.532 | |
| Material type | Sawing process | |
|---|---|---|
| Input (kg) | Output (kg) | |
| Logs | 1336.4 | |
| Green chips | 692.5 | |
| Sawdust | 111.9 | |
| Bark | 124.7 | 124.7 |
| Rough green lumber | 532 | |
| Total OD Mass | 1461.1 | 1461.1 |
| Amount | Unit | Allocation | ||
|---|---|---|---|---|
| Output | Log at log yard (Including Bark) | 1 | m3 | 100% |
| Input | Log at mill (Including Bark) | 1 | m3 | |
| Gasoline | 0.02 | L | ||
| Diesel | 3.03 | L | ||
| Hydraulic fluid | 0.04 | L | ||
| Motor oils | 0.0074 | L | ||
| Grease | 0.00077 | kg | ||
| Antifreeze | 0.00094 | L | ||
| Electricity | 0.143 | Kwh |
| Amount | Unit | Allocation | ||
|---|---|---|---|---|
| Output | Rough green lumber | 1 | m3 | 36% |
| Green Chips | 692.50 | kg | 47% | |
| Sawdust | 111.9 | kg | 8% | |
| Bark | 124.67 | kg | 9% | |
| Input | Roundwood | 2.75 | m3 | |
| Gasoline | 0.00513 | L | ||
| Diesel | 0.814 | L | ||
| Hydraulic fluid | 0.0373 | L | ||
| Grease | 0.00372 | kg | ||
| Electricity | 61.44 | Kwh | ||
| Lubricant fluid | 0.437 | L | ||
| Plastic strapping | 0.116 | kg |
| Data | LCI Data Source | Geography | Year |
|---|---|---|---|
| Diesel | US EI 2.2 (Datasmart2023): Diesel, combusted in Industrial equipment NREL/US U | North America | 2018 |
| Gasoline | US EI 2.2 (Datasmart2023): gasoline, combusted in industrial equipment/US | North America | 2018 |
| Propane | US EI 2.2 (Datasmart2023): Liquefied petroleum gas, combusted in industrial boiler/US | North America | 2018 |
| Electricity | Electricity mix, New Brunswick/CA U | Canada | 2018 |
| Hydraulic fluid, Lubricant oil | US EI 2.2 (Datasmart2023):Lubricating oil, at plant/US - US-EI U | North America | 2018 |
| Motor oil, Greases | US EI 2.2 (Datasmart2023): Diesel, at refinery/l NREL /US | North America | 2018 |
| Antifreeze | US EI 2.2 (Datasmart2023): ethylene glycol, at plant/US - US-EI U | North America | 2018 |
| Plastic strap | US EI 2.2 (Datasmart2023): Polyethylene, HDPE, granulate, at plant/ US- US-EI U | North America | 2018 |
| Trucking | US EI 2.2 (Datasmart2023): Transport, combination truck, Diesel powered NREL/US U | North America | 2018 |
| Inventory Parameter | Units | Weighted Average | Std. deviation | Min | Max | Mean |
|---|---|---|---|---|---|---|
| Electricity (A3 input) | kWh | 61.44 | 33.03 | 39.61 | 86.32 | 62.96 |
| CLR (A3 input) | m3 rough green lumber/m3 log | 0.36 | 0.21 | 0.26 | 0.56 | 0.41 |
| Impact Category | Unit | Baseline results | Electricity | CLR | ||
|---|---|---|---|---|---|---|
| -54% | +54% | -58% | +58% | |||
| Global warming potential | kg CO2 eq | 40.67 | -9% | 8% | -11% | 11% |
| Acidification | kg SO2 eq | 0.40 | -4% | 4% | -7% | 7% |
| Eutrophication potential | kg N eq | 0.045 | -18% | 18% | -21% | 21% |
| Smog potential | kg O3 eq | 12.07 | -1% | 1% | -4% | 4% |
| Ozone depletion potential | kg CFC11e | 9.88E-07 | -40% | 40% | -49% | 49% |
| Total primary energy | MJ | 736.08 | -17% | 16% | -19% | 19% |
| Non-renewable fossil | MJ | 583.66 | -8% | 7% | -11% | 11% |
| Non-renewable nuclear | MJ | 141.32 | -51% | 51% | -52% | 52% |
| Renewable biomass | MJ | 5.09 | -19% | 19% | -53% | 53% |
| Renewables (solar, wind, hydro, geothermal, and biomass) | MJ | 6.00 | -51% | 51% | -53% | 53% |
| Resource Extraction Stage | Per m3 of lumber | Softwood | Hardwood |
| Ancillary materials (Hydraulic fluid, motor oil, Grease) | Almost the same | Almost the same | |
| Energy | |||
| Diesel fuel (L) | 2.94 | 3.69 | |
| Gasoline (L) | 0.14 | 0.70 | |
| Propane (L) | 0.02 | 0.01 | |
| Transportation | 67 tkm | 104 tkm | |
| Log yard and Sawing Stage | Sawing yield (log/m3 lumber) | 1.97 | 2.75 |
| Energy | |||
| Gasoline (L) | 0.013 | 0.025 | |
| Diesel (L) | 1.72 | 3.84 | |
| Electricity (Kwh) | 47.25 | 61.58 | |
| Ancillary materials | |||
| Hydraulic fluid, Lubricant oil (L) | 0.23 | 0.51 | |
| Grease (Kg) | 0.0014 | 0.0045 | |
| Motor Oil (L) | 0.0063 | 0.0074 | |
| Antifreeze (L) | 0.00033 | 0.00094 |
Disclaimer/Publisher’s Note: The statements, opinions and data contained in all publications are solely those of the individual author(s) and contributor(s) and not of MDPI and/or the editor(s). MDPI and/or the editor(s) disclaim responsibility for any injury to people or property resulting from any ideas, methods, instructions or products referred to in the content. |
© 2024 by the authors. Licensee MDPI, Basel, Switzerland. This article is an open access article distributed under the terms and conditions of the Creative Commons Attribution (CC BY) license (http://creativecommons.org/licenses/by/4.0/).


