
Submitted:
17 December 2024
Posted:
18 December 2024
You are already at the latest version
Abstract
Catalytically active nanomaterials, or nanozymes, have gained significant attention as alternatives to natural enzymes due to their low cost, ease of preparation, and enhanced stability. Because of easy preparation, excellent biocompatibility, and unique optoelectronic properties, gold nanoparticles (AuNPs) have attracted increasing attention in many fields, including nanozymes. In this work, we demonstrated the applicability of β-CD-AuNPs as enzyme mimics for different substances, including TMB and DA. We found that β-CD-AuNPs can catalyze the H2O2-mediated oxidation of DA. The dopamine signal-off sensor was developed by taking advantage of the peroxidase-like activity of β-CD-AuNPs towards TMB and DA, where both TMB and DA may compete for the binding sites with β-CD-AuNPs. As a result, the presence of dopamine can be detected even through the naked eye (up to a concentration of 3.75 µM) and using a spectrophotometer (up to a concentration of 1.0 µM) by monitoring the disappearance of the blue color of the oxidized form of TMB in the presence of dopamine. Furthermore, dopamine can also be detected in equal concentrations of common interferences, including ascorbic acid and uric acid. Given the versatility of cyclodextrin to host large number of analyte molecules, we envision the similar principle can be applied for the detection of other analyte molecules of biological, medical and environmental significance.
Keywords:
Functionalized Gold nanoparticles
; β-Cyclodextrin
; Dopamine
; Nanozyme
; Colorimetric assay
; Sensor
1. Introduction
Catalytically active nanomaterials (nanozymes) are emerging as one of the most promising substitutes for native enzymes, sparking enormous research interest [1]. Their inherent superiorities over natural enzymes, including ease of synthesis, low costs, long storage time, and better stability, have positioned them as ideal catalysts for mimicking the catalytic function of natural enzymes [2,3]. This potential has led to the rapid discovery, development, and application of novel and highly active nanozymes, making it a lively field of research.
Significant research efforts are being directed into the development of nanozyme catalysts that mimic horseradish peroxidase, HRP, or other peroxidases, among other enzyme mimetics [4,5].HRP's efficient catalysis of oxidation reactions has made it a highly sensitive detection tool in various assays, including ELISA, immunohistochemistry, and Western blotting. The broad interest in HRP-mimicking catalysts lies in their potential to serve as substitutes for the native enzyme in a wide range of applications, from (bio)sensing and immunoassay to imaging, disease diagnosis, cancer therapy, and environmental monitoring, sparking intrigue about their diverse potential [3,6,7]. Nanomaterials such as metal[8,9] and metal oxide nanoparticles[10], graphene[11], carbon dots[12], carbon nitrides[12] etc., have been explored for their unique peroxidase-mimetic catalytic activities.
Because of easy preparation, excellent biocompatibility, and their unique optoelectronic properties, gold nanoparticles (AuNPs) have attracted increasing attention in many fields. Historically, gold atoms were considered inert, but most recently, both supported AuNPs and unsupported colloidal AuNPs have attracted more attention as catalysts and have shown enzyme-mimicking activities, including peroxidase mimetics [13,14,15]. Jv et al. first reported the peroxidase-mimicking activity of AuNPs on cysteine-functionalized positively charged gold nanoparticles (Cys-AuNPs)[16]. They found that the catalytic activity of citrate-coated AuNPs is lower than that of Cys-AuNPs. This shows that surface functionalities may play a critical role besides the obvious active sites of AuNPs, as demonstrated in Liu et al.'s [17] work. Lin and Chen's groups[18] compared the naked, amino-modified, and citrate-modified AuNPs and found that "naked" AuNPs exhibited superior catalytic activity compared to the other AuNPs. The gold atoms on the surface of AuNPs might contribute to their catalytic activity. When TMB was selected as the substrate, citrate-modified nanozymes exhibited higher peroxidase-like activity than amino-modified AuNPs. This phenomenon was reversed when choosing ABTS as the substrate, indicating the crucial role of both catalyst and substrate and their charge characteristics in defining peroxidase-mimicking activity.
Peroxidase-like activity has recently been reported in β-CD functionalized AuNPs[19] for H2O2 catalyzed oxidation of 3,3′,5,5′-Tetramethylbenzidine (TMB). The peroxidase-mimetics activity was much higher compared to the citrate-coated AuNPs, even though the size of the citrate-coated AuNPs (~ 13 nm) was much smaller compared to β-CD-AuNPs (~ 20 nm). The superior peroxidase-like activity was attributed to the synergistic effects of CD molecules and Au particles. Here, we first simplified the synthesis of β-CD-AuNPs by reducing the synthesis time of β-CD-AuNPs by more than 50% (less than half an hour instead of over an hour). We then demonstrated the general applicability of β-CD-AuNPs as enzyme mimics not only for TMB but also for other substrates, such as OPD and DA. We found that β-CD-AuNPs can also catalyze the H2O2-mediated oxidation of OPD and DA. By taking the advantage of the peroxidase-like activity of β-CD-AuNPs towards TMB and DA, a signal-off the dopamine sensor was developed.
Dopamine (DA) is a crucial neurotransmitter in the nervous system, with implications for various disorders such as Parkinson's disease, dementia, and schizophrenia. Detecting DA is essential for understanding its roles in neurobiology and disease diagnosis[20]. Therefore, developing a simple, cost-effective, and highly sensitive method to detect dopamine is paramount. While various sophisticated techniques, such as electrochemical strategies, chemiluminescence, chromatography, capillary electrophoresis, and spectroscopic approaches, have been successfully employed for dopamine determination, most require expensive equipment and complex operations[21]. In contrast, the colorimetric assay presents a promising solution, offering theoretical and technical simplicity. While colorimetric detection of DA has been achieved based on surface plasmon resonance of AuNPs[22,23], this work utilizes the peroxidase-mimicking activity of β-CD-AuNPs. The peroxidase-mimicking activity of various nanomaterials and inhibition of dopamine have been recently exploited for the detection of dopamine using colorimetric[24,25,26] or fluorometric methods[26,27].
In this work, we report the design of a novel colorimetric sensor for dopamine detection based on the peroxidase-like activity of β-CD-AuNPs. By utilizing the β-CD onto the surface of AuNPs, we aim to enhance the selective interaction between dopamine and the β-CD-AuNPs. We demonstrated that β-CD-AuNPs catalyze the oxidation of dopamine to aminochrome by H2O2, most likely due to the increase in the local concentration of dopamine at the surface of heterogeneous catalysts. We have developed a colorimetric signal-off dopamine sensor based on the competition between dopamine and TMB for possible binding sites at the surface of the β-CD-AuNPs. As a result, the presence of dopamine can be detected even through the naked eye (upto concentration of 3.75 µM) and using spectrophotometer (upto concentration of 3.75 µM) by monitoring the disappearance of the blue color of the oxidized form of TMB in the presence of dopamine. Furthermore, dopamine can also be detected in the presence of equal concentration of common interferences including ascorbic acid and uric acid.
2. Results and Discussion
2.1. Synthesis and Characterization of β-CD-AuNPs
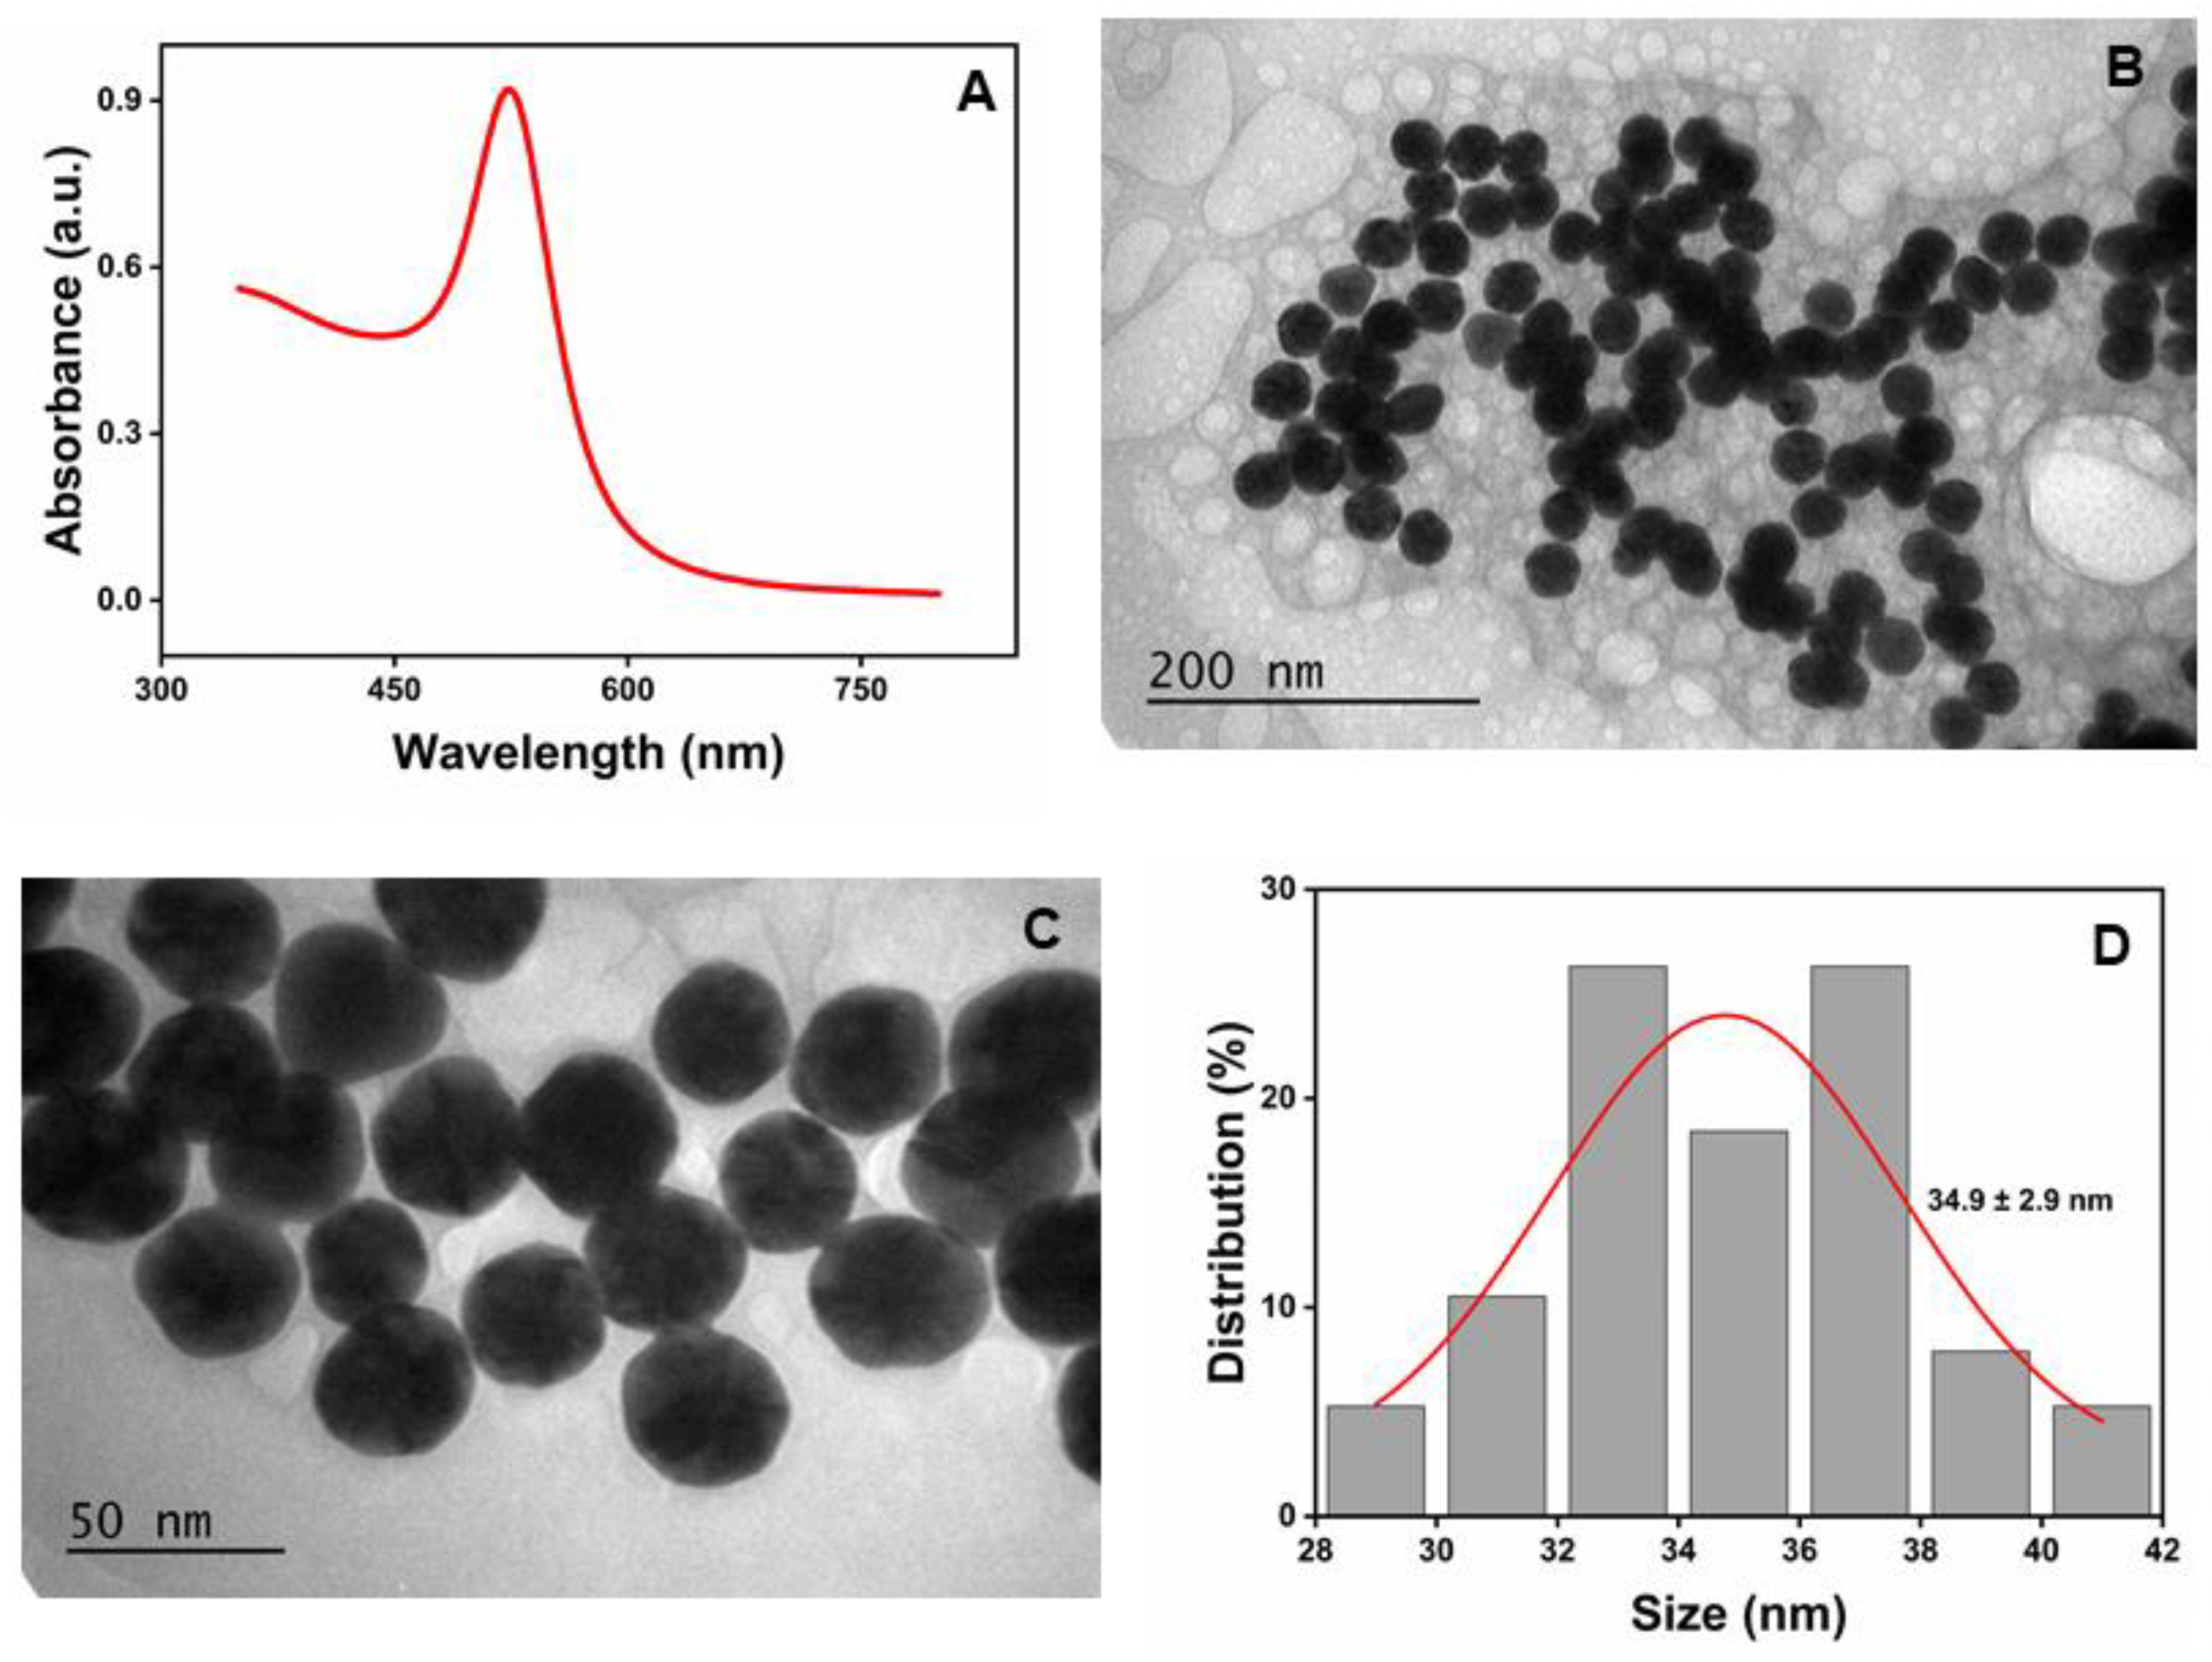
As previously reported[19], β-CD-AuNPs were prepared using β-CD as a reducing and stabilizing agent, with slight modification. β-CDs were added to the boiling solution of gold salt (in 10 mM sodium phosphate buffer at pH 7.0) instead of gradual heating to reduce the Au3+ into Au0. This straightforward addition of a reducing agent in the boiling solution of gold salt instead of gradually heating the mixture of gold salt and reducing agent reduces the time for the synthesis of β-CD (less than half an hour instead of over an hour). The reduction process leads to nucleation, growth, and formation of AuNPs. Figure 1A shows the characteristic absorption spectra of the synthesized β-CD-AuNPs, with a sharp SPR band at 524 nm, indicating the typical features of gold nanosphere. The size of the AuNPs was estimated as ~35 nm based on the absorbance ratio at SPR and 450 nm (1.925), as described in the literature[28]. The concentration of the as-prepared AuNPs was estimated as 0.28 nM using absorption data and a molar absorption coefficient of 3.21×10 9 M-1cm-1 as described in the same reference. Figure 1B and Figure 1C show the high-resolution transmission electron microscopy (TEM) images of the β-CD- AuNPs with different magnifications. TEM revealed the spherical/quasi-spherical shape of β-CD-AuNPs. The size of the AuNPs is 34.9 ± 2.9 nm with a very narrow distribution, as shown in Figure 1D. The size was estimated from TEM images in the ImageJ software.
Figure 1.
Synthesized β-CD-AuNPs: A. UV-Vis spectroscopy showing a characteristic peak at 524 nm. B and C. TEM image of the β-CD-AuNPs with different magnifications and D. Histogram showing the size distribution of the synthesized β-CD-AuNPs (n=38). .
Figure 1.
Synthesized β-CD-AuNPs: A. UV-Vis spectroscopy showing a characteristic peak at 524 nm. B and C. TEM image of the β-CD-AuNPs with different magnifications and D. Histogram showing the size distribution of the synthesized β-CD-AuNPs (n=38). .
Fourier transform infrared (FT-IR) spectroscopy and X-ray photoelectron spectroscopy (XPS) were used to confirm the presence of beta-cyclodextrin(β-CD) at the surface of the AuNPs. The comparison of the FT-IR spectra of double-purified and dried AuNPs with the pure β-CD-powder, as shown in Figure 2A, shows similar profiles of -OH at ~ 3354 cm-1 and C-O groups at ~ 1100 cm-1, indicating that beta-cyclodextrins are retained at the surface of the β-CD.
Figure 2.
β-CD at the surface of the AuNPs: A. Comparison of Fourier transform infrared (FT-IR) spectra of purified β-CD-capped AuNPs (red) with pure β-CD powder (black) B. X-ray photoelectron spectroscopy (XPS) scan survey of a wide region showing all the elements present in double-purified AuNPs C. High-resolution core level XPS scan of oxygen and D. High-resolution core level XPS scan of carbon. .
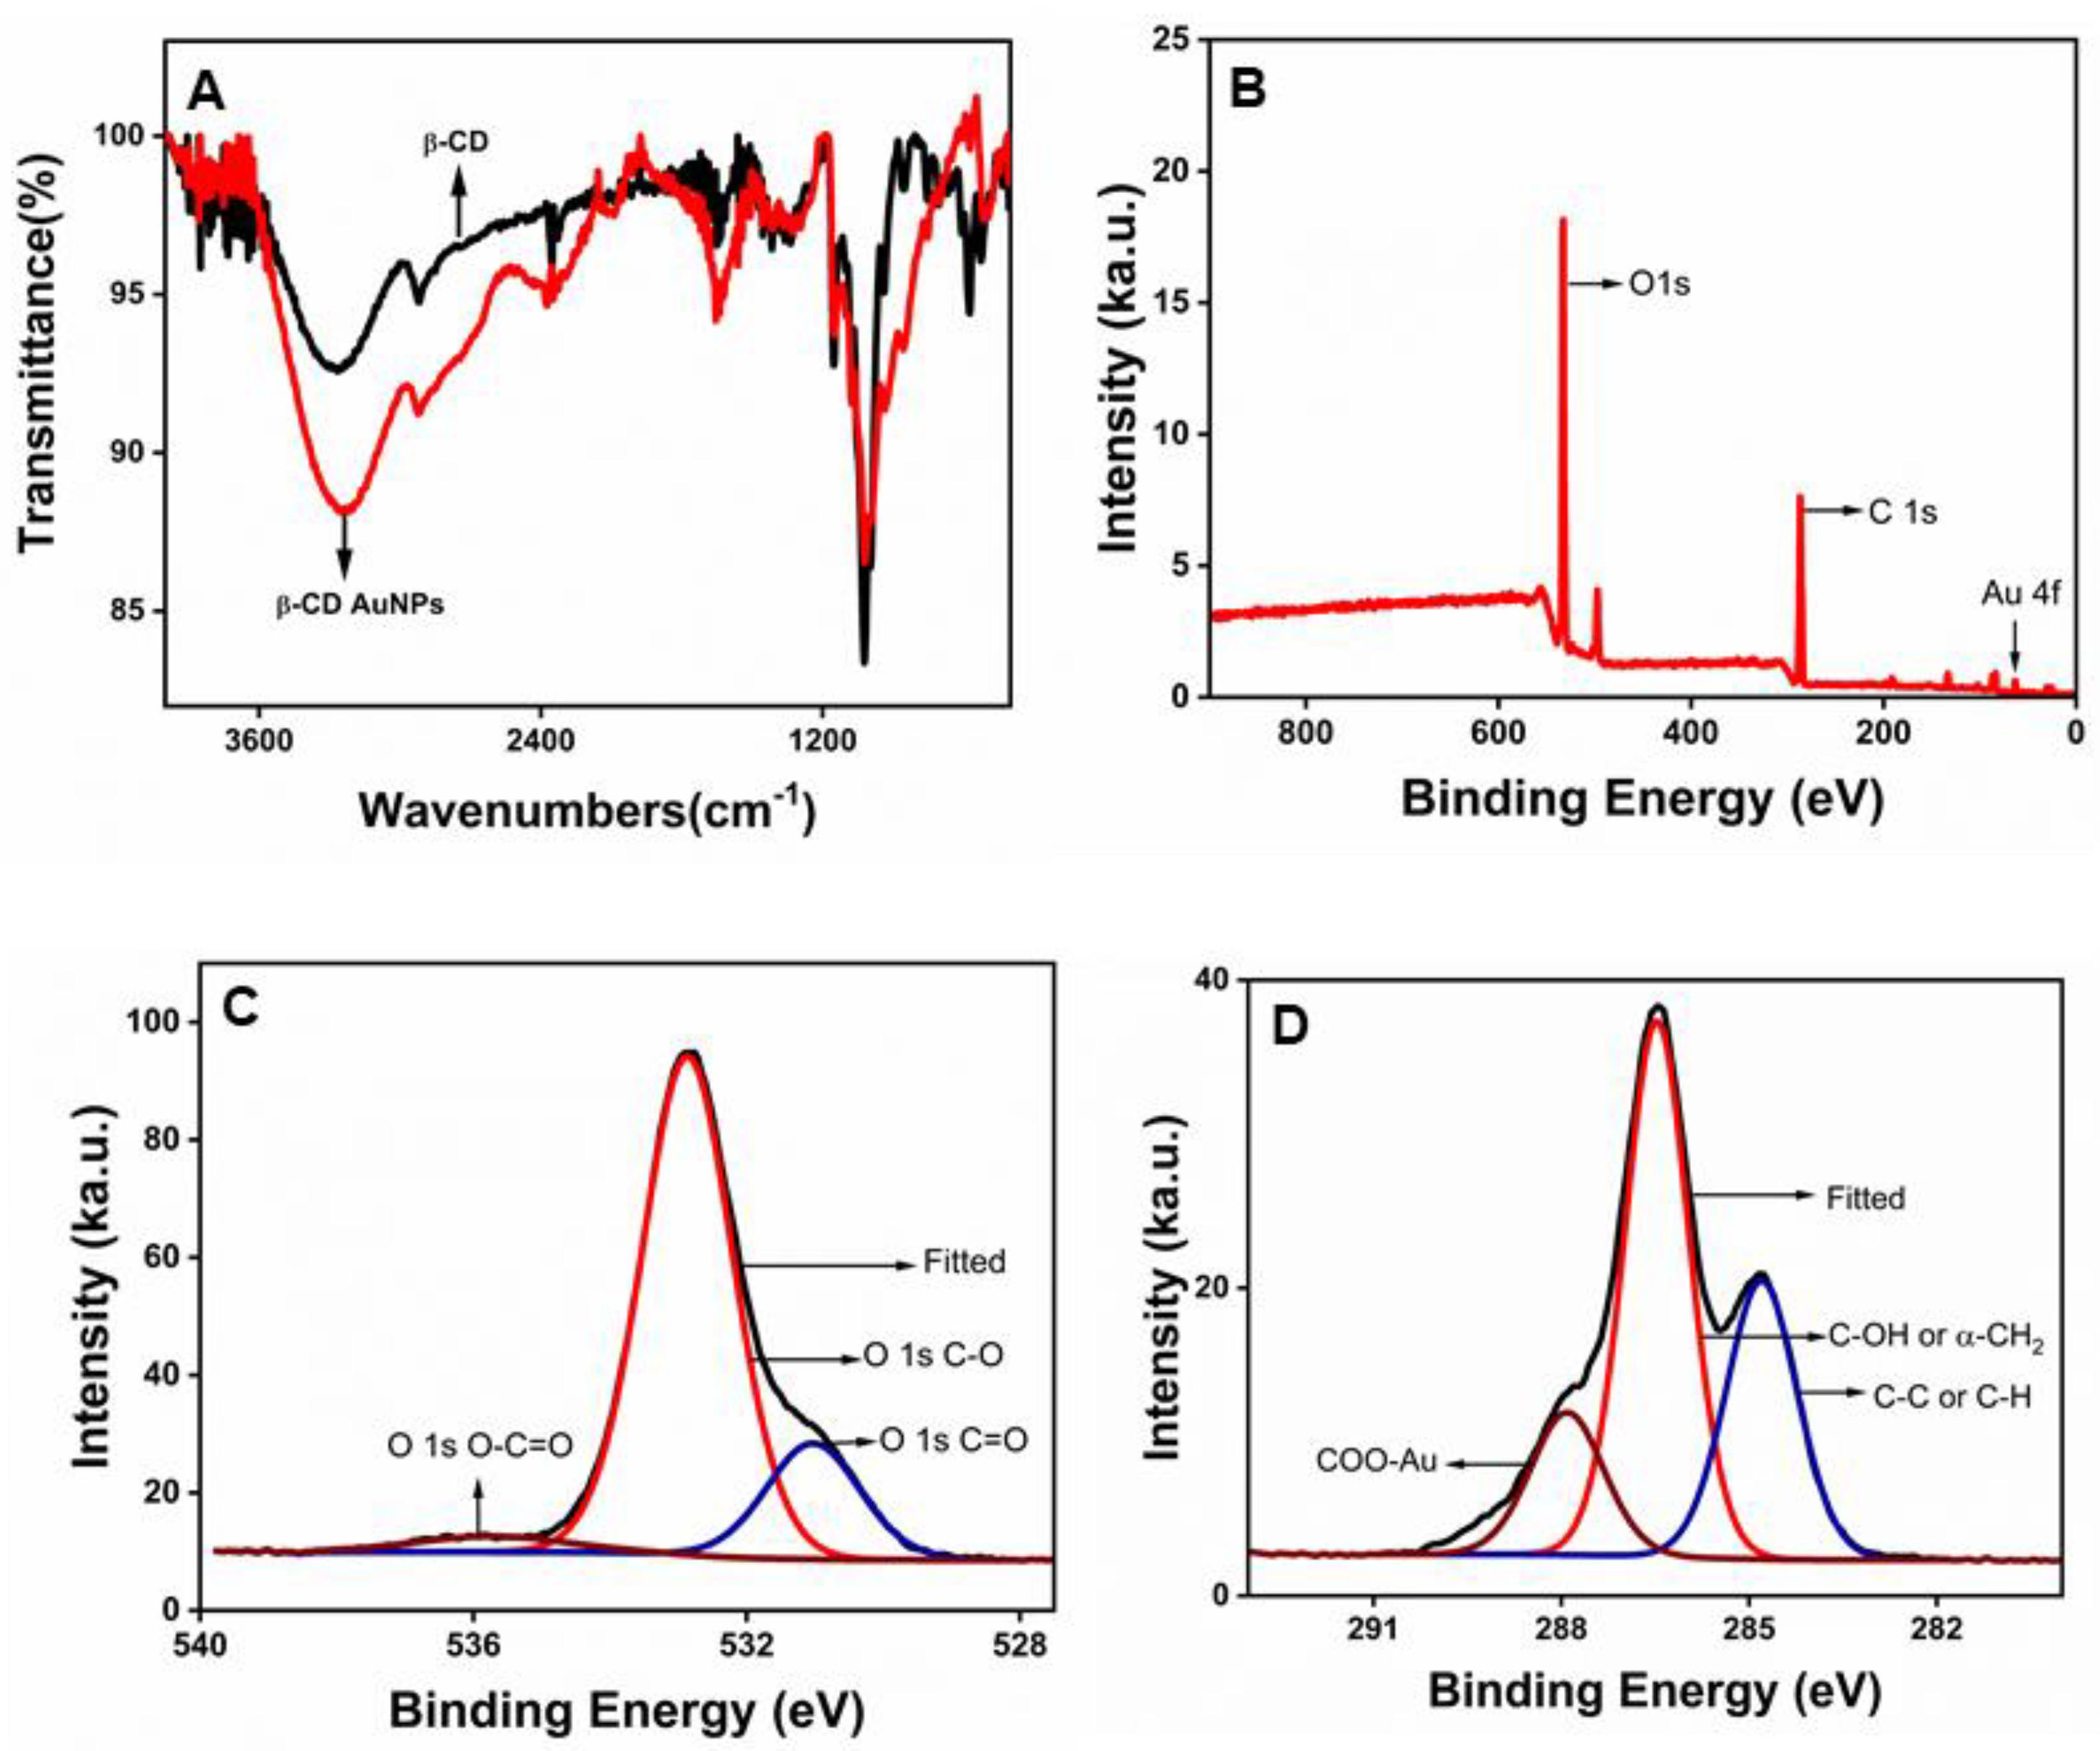
X-ray photoelectron spectroscopy (XPS) was further used to probe the surface chemistry of AuNPs. The binding energy (BE) of electrons of an atom provides information about the binding and coordination of the functional groups as it is sensitive to the local electronic state of adjacent atoms. A wide region survey and high-resolution core-level scans of all elements were recorded and calibrated with the C1s 284.8ev as the reference peak. Figure 2B shows a wide-region survey scan showing the presence of Au, C, and O in the sample containing double-purified AuNPs. The high-resolution spectra of the oxygen were further obtained, as shown in Figure 2C. The deconvoluted O 1s spectrum consists of three distinct binding energies at 531.02, 532.87, and 535.73 eV, attributed to C=O, C-O, and O-C=O, respectively[29]. The deconvoluted C 1s spectrum consists of four distinct binding energies at 284.8, 286.47, 287.91, and 289.26 eV, which are attributed to adventitious carbons (C-C or C-H), the hydroxyl (C−OH) and/or the α-carbons (CH2), the coordinated carboxylates (COO-Au), and free carboxyl moieties (COOH or COO−), respectively[30,31].
2.3. Investigation of Peroxidase-Mimicking Activity of β-CD-AuNPs Using TMB as a Substrate
We first tested the peroxidase-like activity of β-CD-AuNPs using commonly used peroxidase substrate 3,3’,5,5’-tetramethylbenzidine (TMB) in the presence of H2O2.TMB was chosen due to its higher sensitivity, lowest potential carcinogenicity, better color purity of the colorimetric product, and reasonable stability of the oxidation product as compared to other chromogens[32]. Peroxidases oxidize TMB, a colorless compound, into a blue-colored complex in the presence of H2O2.
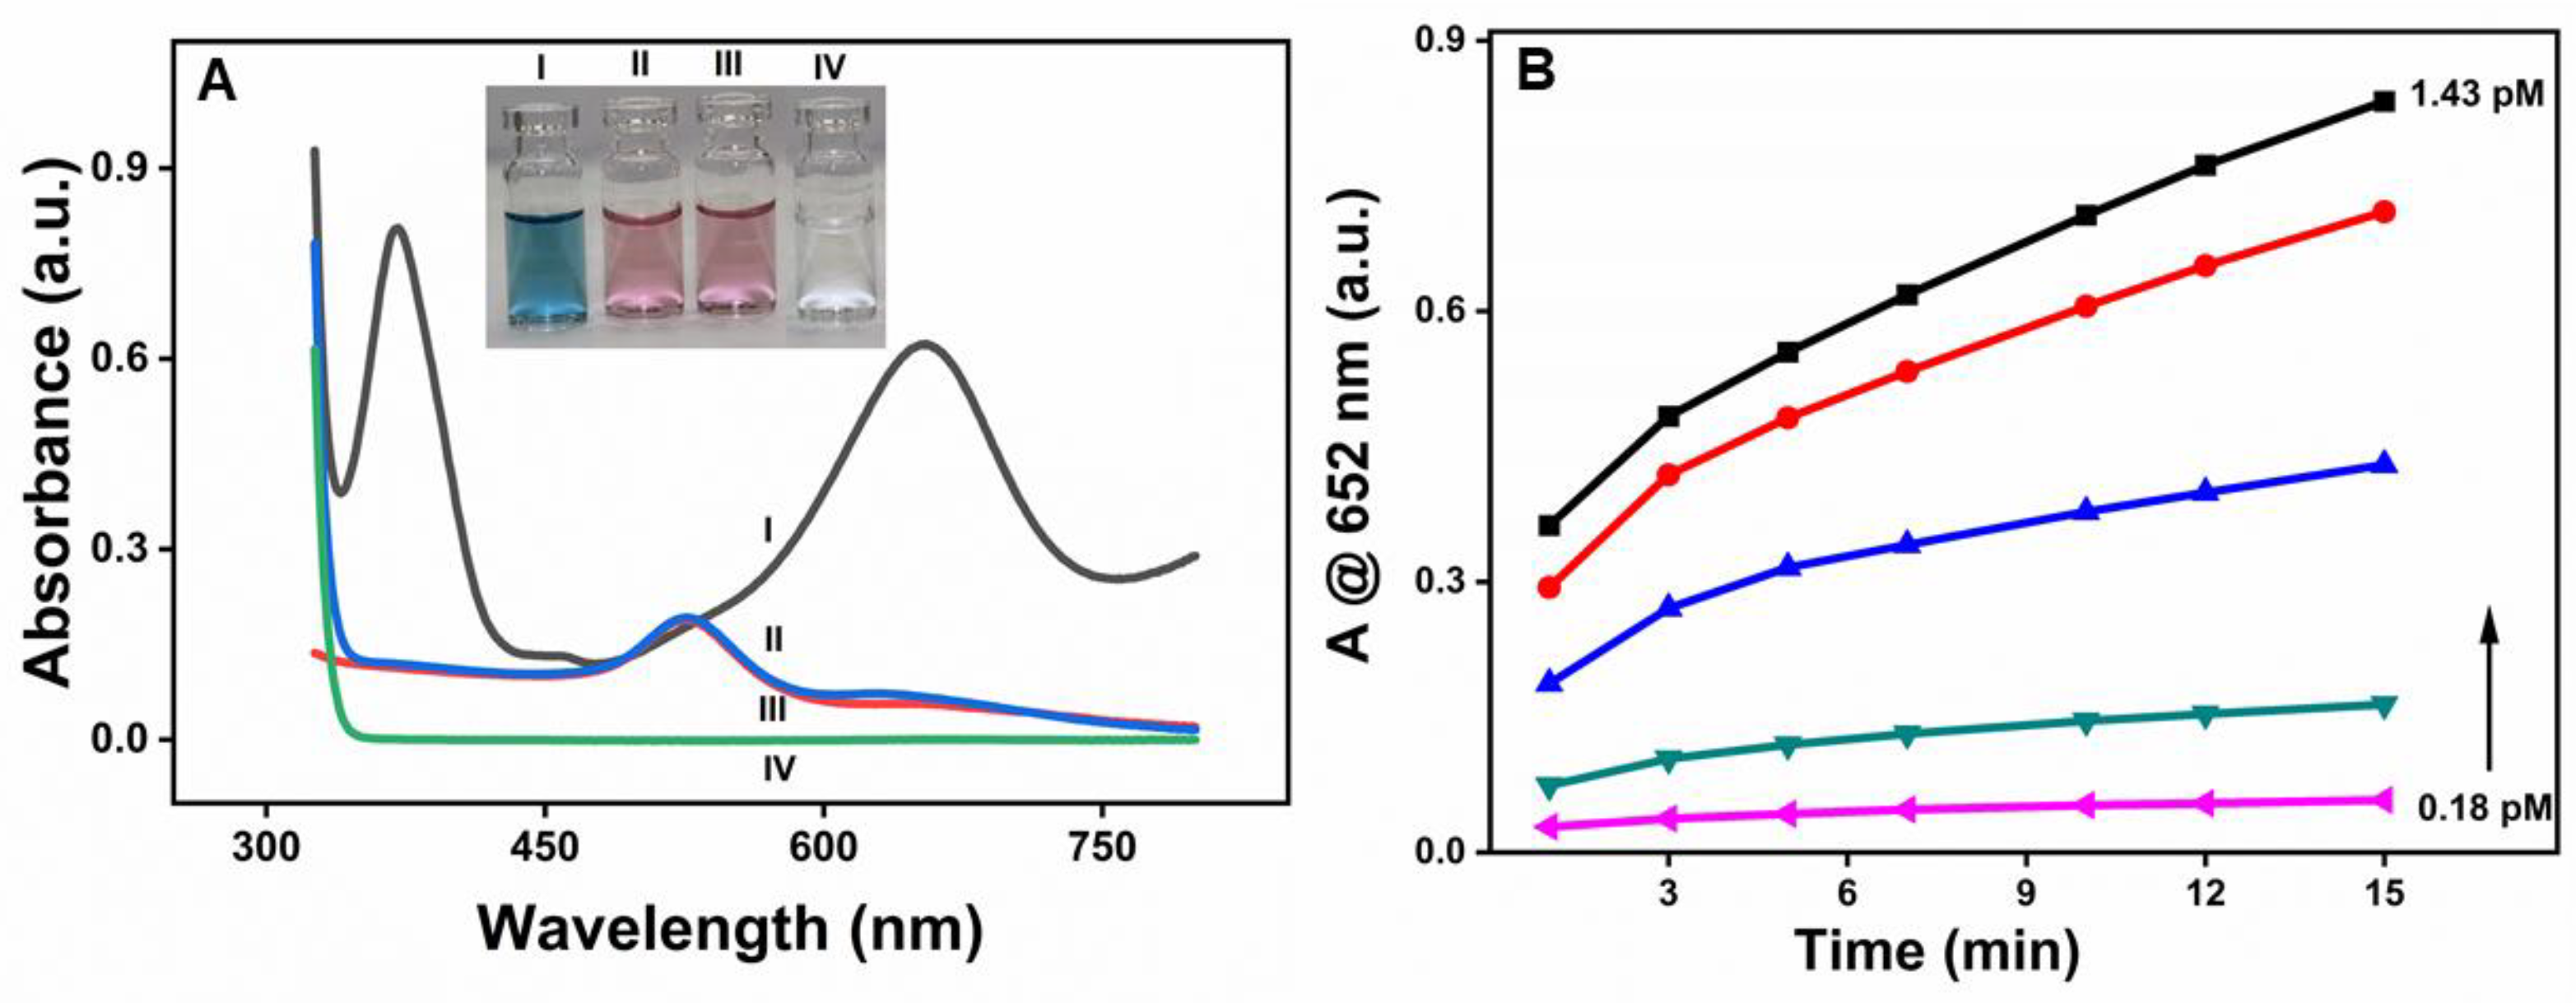
As shown in Figure 3A, β-CD-AuNPs oxidize TMB in the presence of H2O2, as prominent absorption peaks appeared at 370 nm and 652 nm upon the addition of β-CD-AuNPs to the TMB-H2O2 system due to the oxidation of TMB (Curve I). However, no such peak was obtained without adding β-CD-AuNPs (Curve IV). Similarly, the oxidation peaks of TMB are absent in both the samples containing gold nanoparticles in the presence of H2O2 only (Curve II) and in the presence of TMB only (Curve III). The observation shows that β-CD-AuNPs can oxidize TMB in the presence of H2O2 like the natural horseradish peroxidase enzyme. The spectral change can also be monitored through the naked eye, thanks to the blue color of the oxidized form of TMB, as shown in the photograph as shown in the inset of Figure 3A. The color change can easily be differentiated from other control samples – from left to right – blue color of the reaction mixture of TMB + H2O2 + β-CD-AuNPs, No color for the reaction mixture of TMB + H2O2, the faint red color for the reaction mixtures of β-CD-AuNPs + H2O2 or β-CD-AuNPs + TMB. Furthermore, Figure 3B shows that oxidation of TMB increases with the increase in concentration of the gold nanoparticles and with the reaction time, confirming the role of β-CD-AuNPs on oxidation of TMB. The formation of more products as time increases shows that the dynamic process of TMB oxidation by β-CD-AuNPs.
Figure 3.
Peroxidase-like activity of β-CD-AuNPs for the oxidation of TMB. A. UV-vis spectrum of the reaction mixture TMB-H2O2 containing β-CD-AuNPs and other control samples. Inset: Photographs showing the color of the reaction mixture of the TMB-H2O2 system containing β-CD-AuNPs and other control samples are shown in the inset. Reaction conditions: 100 ul of 6x concentrated AuNPs (final concentration of 0.72 pM), 12 uL of 20 mM TMB (final concentration of 0.1 mM), 24 uL of 1M H2O2 (final concentration of 10 mM) in a reaction mixture containing 10 mM of sodium acetate buffer pH 5.0 and reaction time of 10 minutes B. Evolution of the color change in the TMB-H2O2 system as observed by the increase in absorbance at 652 nm as a function of time from 1 minute to 15 minutes and as a function of final concentration of β-CD-AuNPs from 0.18 pm, 0.36 pm, 0.54 pm,0.72 pm and 1.43 pm respectively.
2.4. Applicability of β-CD-AuNPs as Peroxidase Mimetics-OPD as a Substrate
Although the TMB-H2O2 system is widely used to detect peroxidase-like activity, it has been reported that it will be premature to consider any reagent or nanoparticle that changes TMB color in the presence of H2O2 as a peroxidase-like enzyme or nanozyme[33] as TMB can be oxidized by many other common redox reaction systems, such as solutions containing Fe3+ or Cu2+. Therefore, we also tested β-CD-AuNPs with other peroxidase substrates such as O-Phenylenediamine (OPD) and dopamine (DA) to confirm the peroxidase-like activity and to make it generally applicable peroxidase-mimetics.
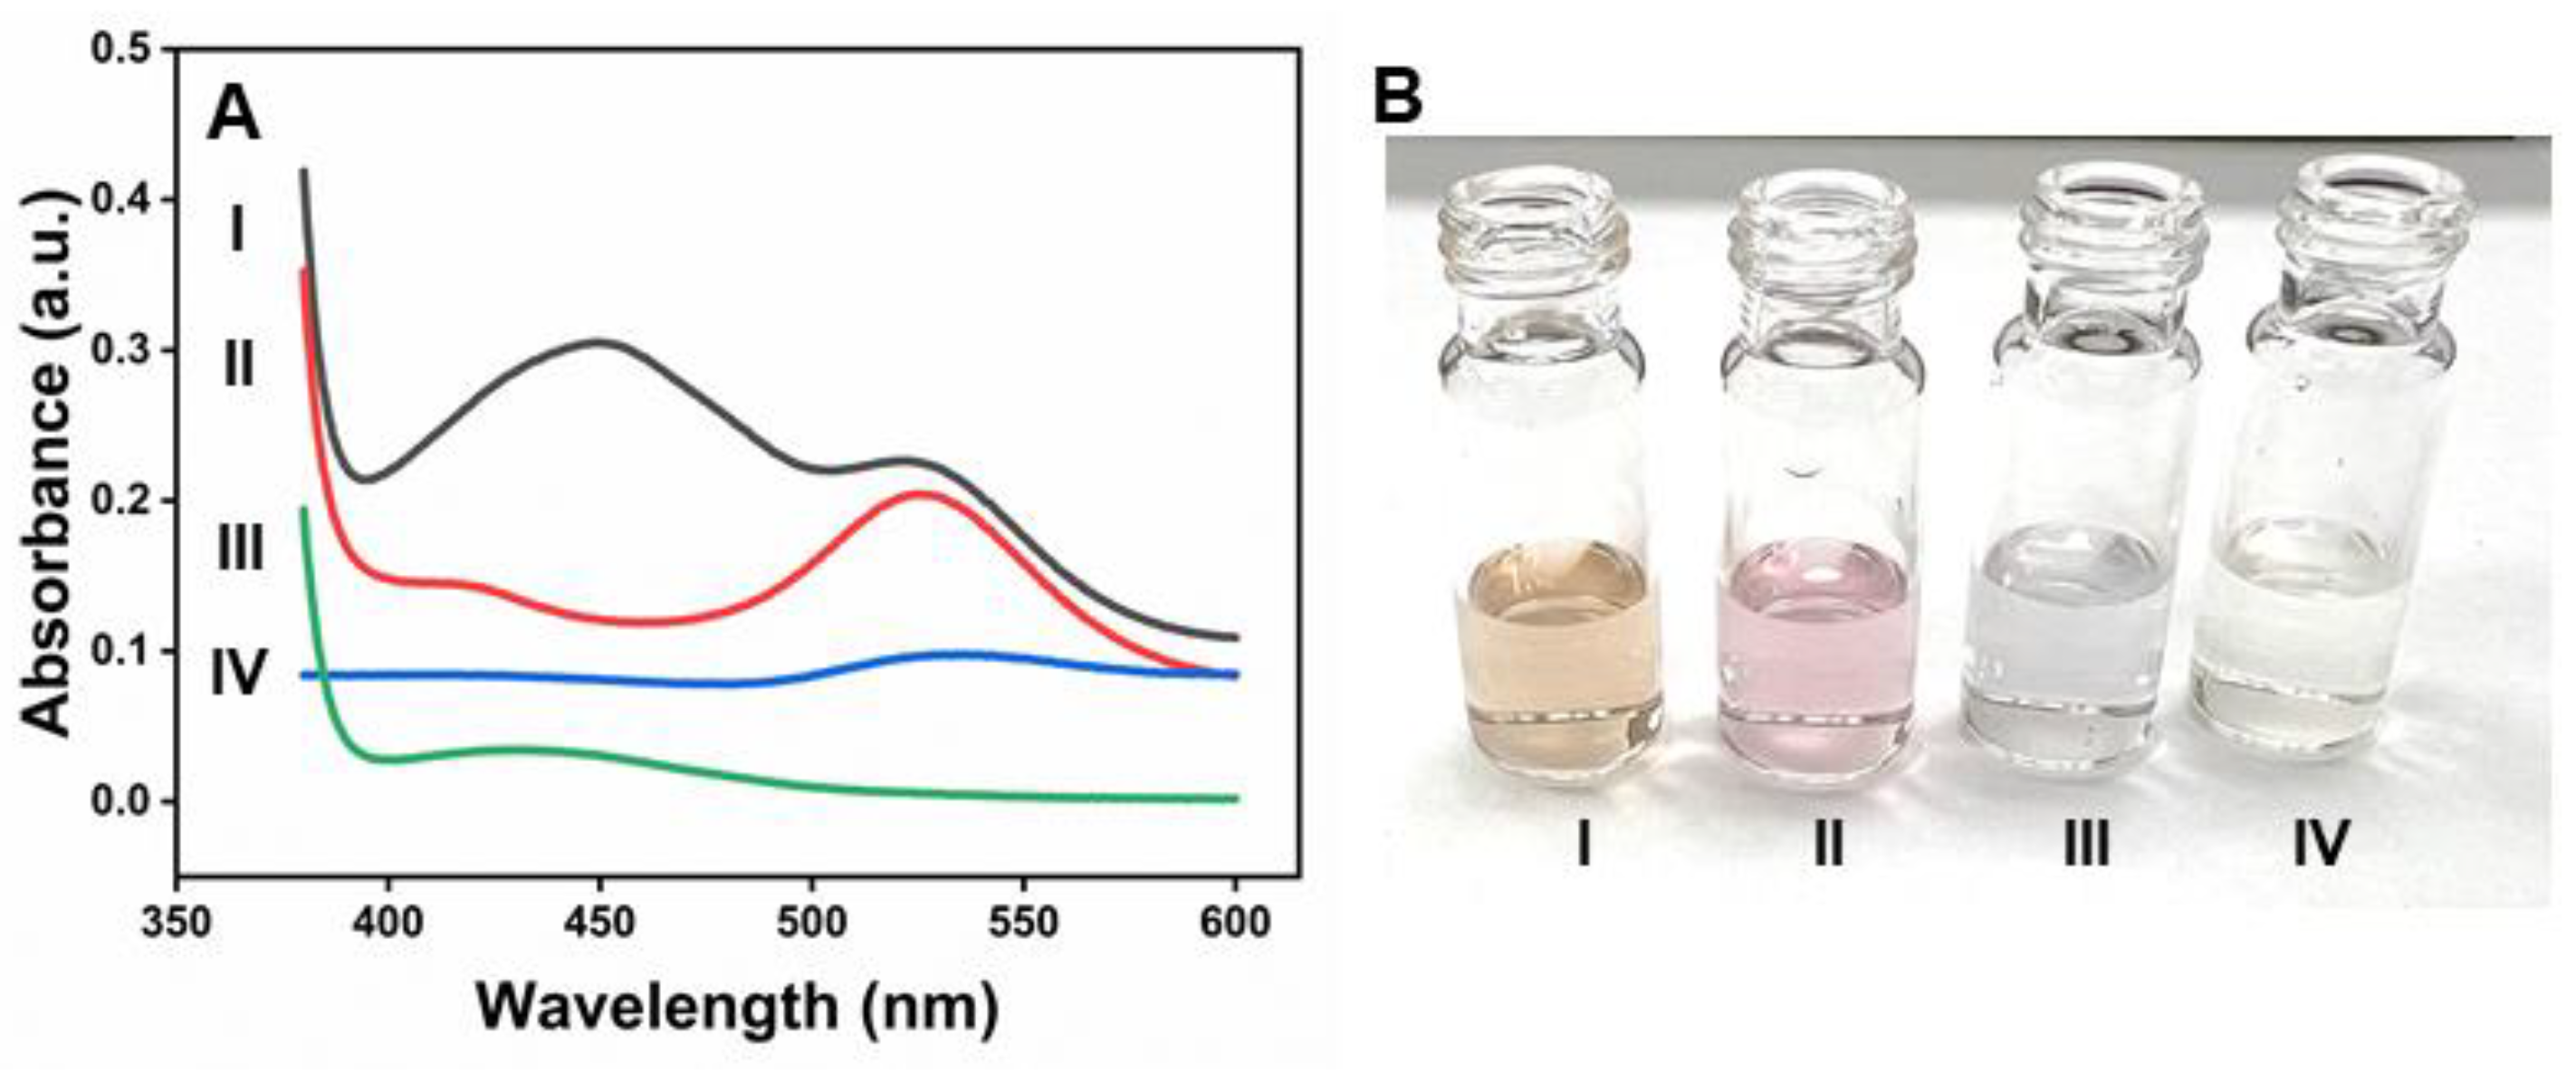
Figure 4A shows that prominent absorption peaks at 450 nm appeared upon the addition of β-CD-AuNPs to the OPD-H2O2 system due to the oxidation of OPD (Curve I). The naked eye can also monitor the spectral change, thanks to the yellowish color of the oxidized form of OPD- 2,3-diaminophenazine (DAP), as shown in the photograph of Figure 4B-I. However, no such peak or color change was observed without adding β-CD-AuNPs (Curve IV and Figure 4B-IV). Similarly, the oxidation peaks of DAP are absent in both the samples containing gold nanoparticles in the presence of H2O2 only (Curve II) and in the presence of OPD only (Curve III). Furthermore, it is important to note that β-CD-AuNPs are stable in H2O2, as shown in curve II, indicating that H2O2 alone does not destabilize β-CD-AuNPs. The color of β-CD-AuNPs also remains intact, as shown in Figure 4B-II. However, β-CD-AuNPs aggregates in the presence of OPD in the absence of H2O2 without undergoing oxidation. The color of β-CD-AuNPs changes into blue due to aggregation, as shown in Figure 4B-III. This observation indicates that β-CD-AuNPs can oxidize OPD in H2O2 like the natural horseradish peroxidase enzyme.
Figure 4.
Peroxidase-like activity of β-CD-AuNPs for the oxidation of OPD. A. UV-vis spectrum of the reaction mixture OPD-H2O2 containing β-CD-AuNPs and other control samples. B. Photographs showing the color of the reaction mixture of the OPD-H2O2 system containing β-CD-AuNPs and other control samples. For both figure A and B, I – mixture of OPD+ H2O2 + β-CD-AuNPs, II – mixture of H2O2 + β-CD-AuNPs, III – mixture of OPD + β-CD-AuNPs and IV – mixture of OPD + β-CD-AuNPs. Reaction conditions: 100 ul of 6x concentrated AuNPs (final concentration of 0.72 pM), 24 uL of 100 mM OPD (final concentration of 1 mM), 24 uL of 10 M H2O2 (final concentration of 100 mM) in a reaction mixture containing 10 mM of sodium acetate buffer pH 5.0 and reaction time of 60 minutes.
2.5. Applicability of β-CD-AuNPs as Peroxidase Mimetics-DA as a Substrate
The fact that HRP oxidizes dopamine in the presence of H2O2 [34] suggests that the β-CD-AuNPs could, similarly, act as a catalyst for this oxidation reaction of DA into aminochrome. Indeed, we find that β-CD-AuNPs can catalyze the oxidation of DA to aminochrome in the presence of H2O2. Figure 5A shows that prominent absorption peaks at 480 nm appeared upon the addition of β-CD-AuNPs to the DA-H2O2 system due to the oxidation of DA (Curve I). The spectral change can also be monitored through the naked eye, thanks to the brownish-orange color of the oxidized form of DA- amino chrome or possibly polymerized form, as shown in the photograph of Figure 5B-I. However, no such peak or color change was observed without adding β-CD-AuNPs (Curve IV and Figure 5B-IV). Similarly, the oxidation peaks of aminochrome are absent in both the samples containing gold nanoparticles in the presence of H2O2 only (Curve II) and in the presence of DA only (Curve III). Furthermore, it is important to note that β-CD-AuNPs are stable in H2O2, as shown in curve II, indicating that H2O2 alone does not destabilize β-CD-AuNPs. The color of β-CD-AuNPs also remains intact, as shown in Figure 5B-II. However, as reported previously, β-CD-AuNPs aggregate in the presence of DA and in the absence of H2O2 without undergoing oxidation [22]. The color of β-CD-AuNPs changes into blue due to aggregation, as shown in Figure 5B-III. This observation indicates that β-CD-AuNPs can oxidize DA in H2O2, like the natural horseradish peroxidase enzyme.
Figure 5.
Peroxidase-like activity of β-CD-AuNPs for the oxidation of DA. A. UV-vis spectrum of the reaction mixture DA-H2O2 containing β-CD-AuNPs and other control samples. B. Photographs showing the color of the reaction mixture of the DA-H2O2 system containing β-CD-AuNPs and other control samples. For both figure A and B, I – mixture of DA+ H2O2 + β-CD-AuNPs, II – mixture of H2O2 + β-CD-AuNPs, III – mixture of DA + β-CD-AuNPs and IV – mixture of DA + β-CD-AuNPs Reaction conditions: 100 ul of 6x concentrated AuNPs (final concentration of 0.72 pM), 7.4 uLof 100 mM DA (final concentration of 0.3 mM), 24 uL of 10 M H2O2 (final concentration of 100 mM) in a reaction mixture containing 10 mM of sodium acetate buffer pH 5.0 and reaction time of 60 minutes. C. Evolution of the color change in the DA-H2O2 system as observed by the increase in absorbance at 480 nm as a function of time from 1 minute to 60 minutes and D. the change in absorbance at 480 nm as a function of different concentrations of dopamine.
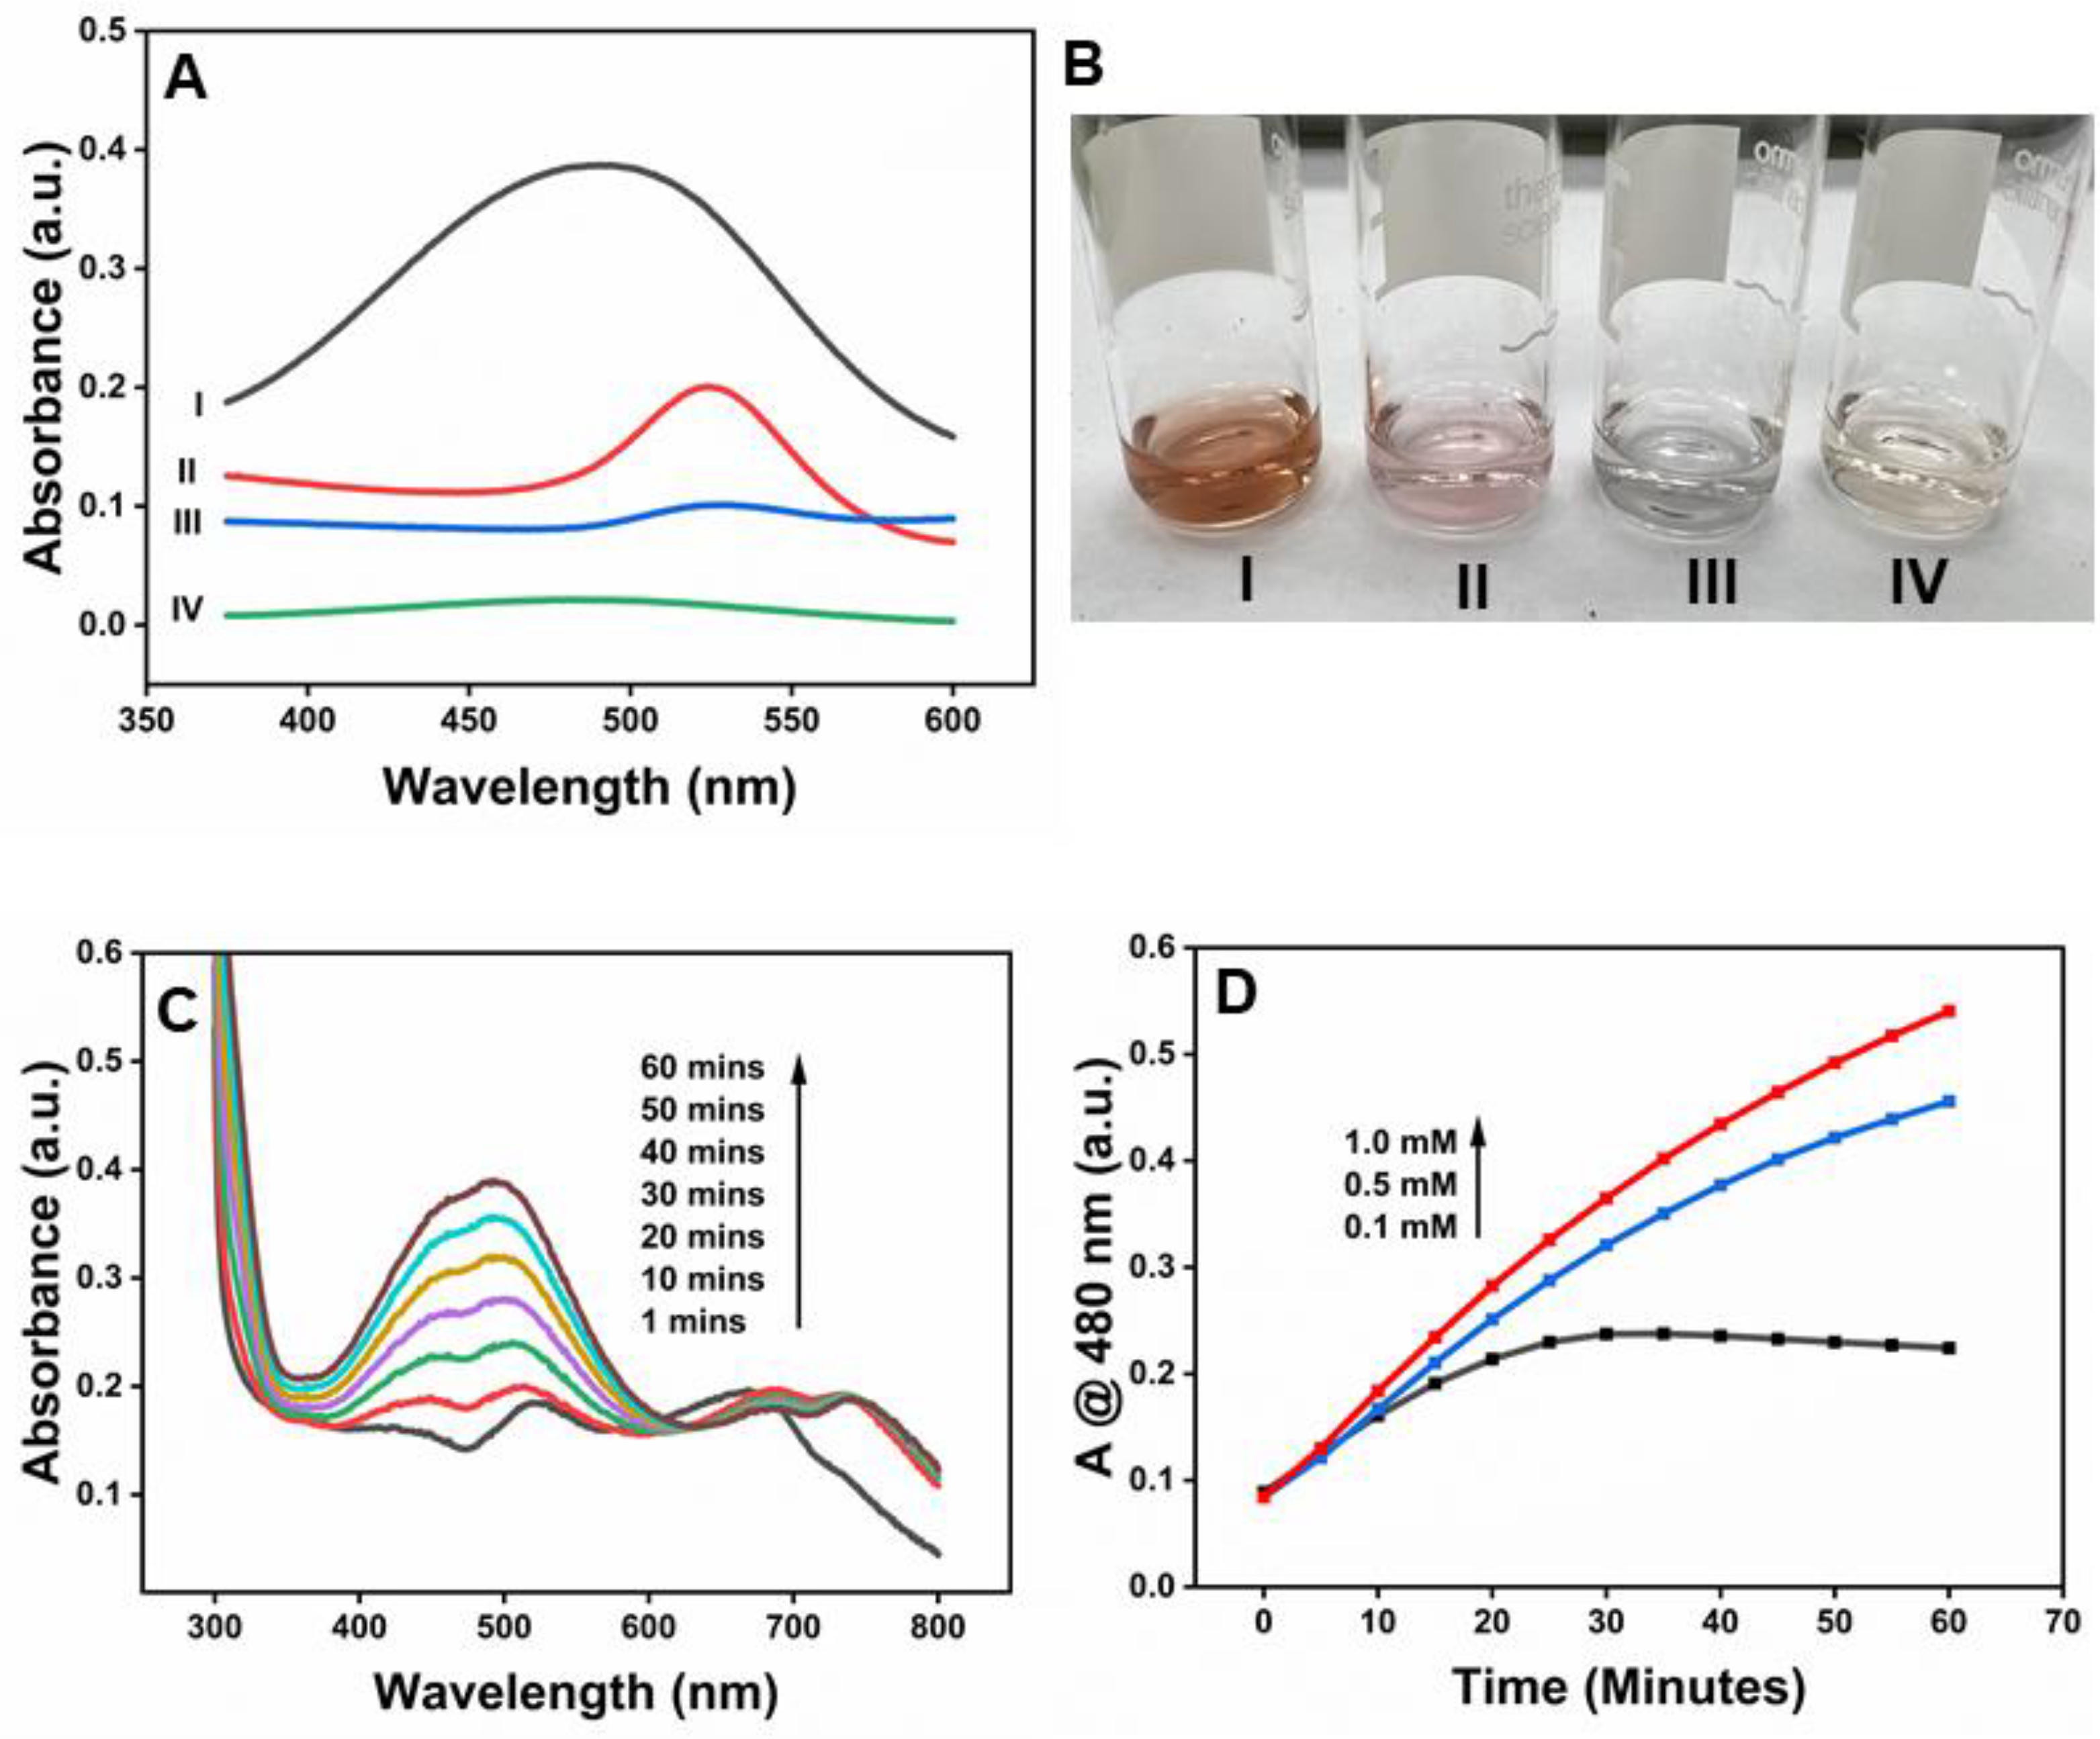
Figure 5C shows the evolution of the peak at 480 nm upon the addition of β-CD-AuNPs to the DA-H2O2 system due to the oxidation of DA. Immediately after the addition of β-CD-AuNPs (at around 1-minute reaction time) in the DA-H2O2 system, β-CD-AuNPs undergo aggregation, as indicated by the appearance of a peak at around 670 nm. However, with the increase in the reaction time, the peak shifts from ~670 nm to ~690 nm, indicating the formation of the bigger size of the nanocluster. The formation of a bigger nanocluster coincides with the appearance of an aminochrome peak at around 480 nm, indicating the two dynamic processes of β-CD-AuNPs. Interestingly, as the reaction time increases, the peak at 480 nm increases due to the formation of more aminochrome, but the peak at 690 nm decreases. The decrease in intensity at 690 nm is smaller than the increase in peak at 480 nm. It is unclear how the oxidation of dopamine impacts the aggregation state of the β-CD-AuNPs. The detailed mechanism is currently being investigated in the lab.
Figure 5D shows the concentration-dependent oxidation of DA in the presence of a fixed concentration of β-CD-AuNPs as a function of time. At a lower concentration of DA (0.1 mM), absorbance at 480 nm increases with an increase in the reaction time and gets saturated at around 25 minutes. At higher concentrations of 0.5 mM and 1 mM, the absorbance increases with an increase in reaction time of up to 60 minutes. As the concentration of DA increases from 0.1 mM to 1 mM, the rate of formation of aminochrome increases, as indicated by the larger slope. These facts indicate the signal is, in fact, due to oxidation of DA by β-CD-AuNPs.
2.6. Detection of Dopamine
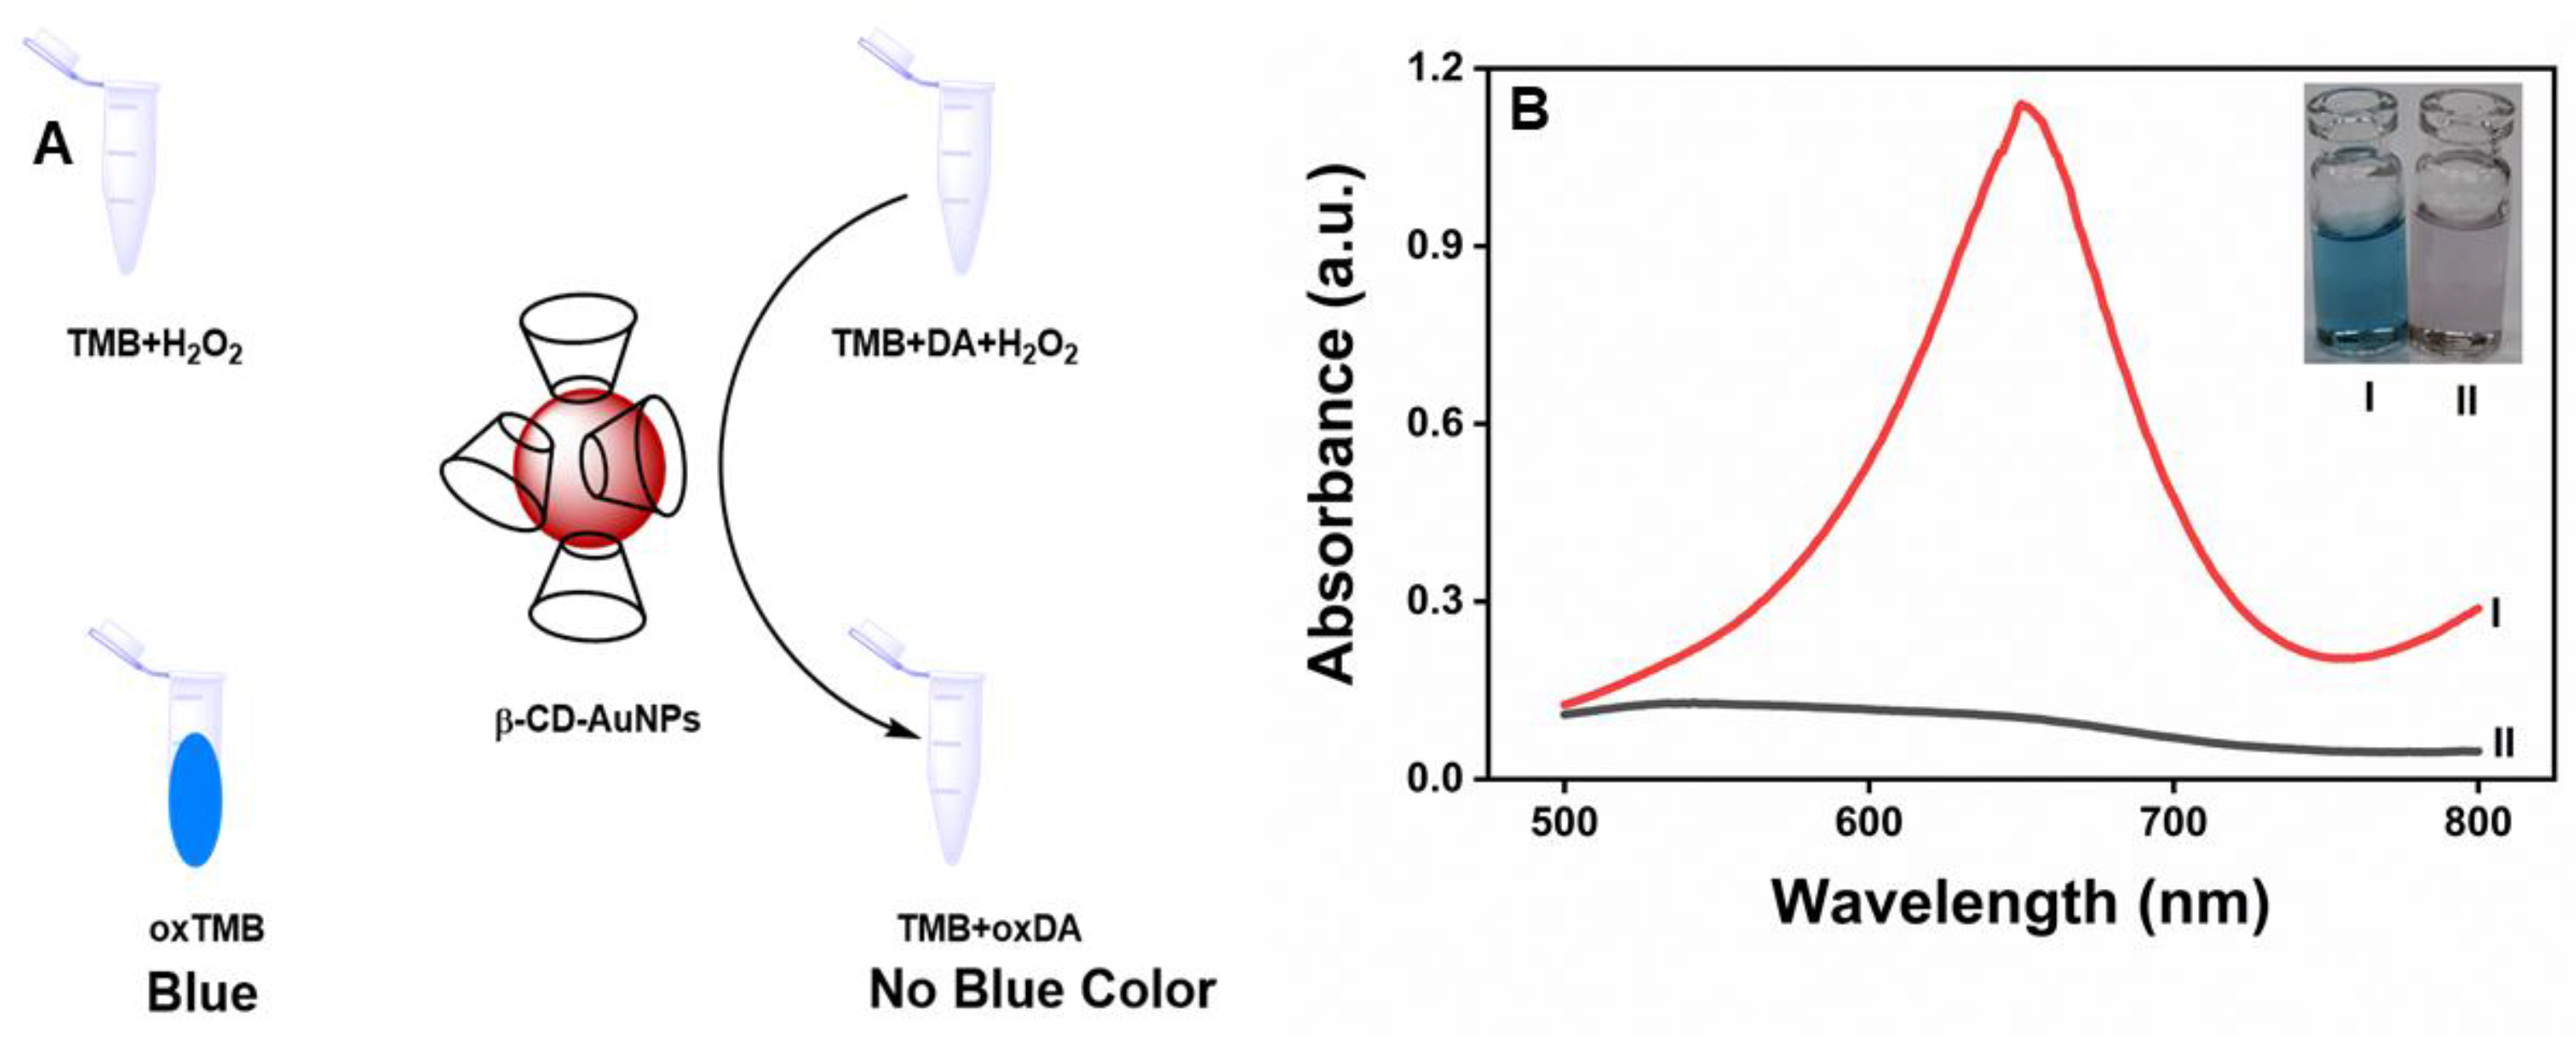
From the above results, it is clear that β-CD-AuNP can oxidize TMB into a blue-colored product and DA into amino chrome in a concentration-dependent manner. Therefore, it is likely that DA and TMB compete for the binding sites with β-CD-AuNPs. We found that the blue color of oxidized TMB reverses upon the addition of dopamine. Based on the reversal of the color of the TMB, we have developed a new dopamine sensor, as depicted in Figure 6A. We found that absorbance at 652 nm, due to oxidation of TMB in the presence of H2O2 and β-CD-AuNPs, increases with increase in time and gets saturated. Upon addition of 100 µM dopamine, however, the blue color disappears, as observed visually in the inset of Figure 6B, and spectroscopically through the collapse of the peak at 652 nm, as shown in Figure 6B.
Figure 6.
The disappearance of blue color of the oxidized-TMB upon addition of 100 µM dopamine - A. scheme showing the absorbance profile of the TMB- H2O2-β-CD-AuNPs system collapses upon addition of the dopamine. B. Visible spectra of TMB-H2O2-β-CD-AuNPs system before and after addition of the dopamine. Reaction conditions: 100 ul of 6x concentrated AuNPs (final concentration of 0.72 pM), 12 uLof 20 mM TMB (final concentration of 0.1 mM), 24 uL of 10 M H2O2 (final concentration of 100 mM) and reaction time of 15 minutes in a reaction mixture containing 10 mM of sodium acetate buffer pH 5.0.
To maximize the detection window for the detection of dopamine, we optimize the different factors such as buffer pH, H2O2 concentration, TMB concentration, and reaction time. We first explored the dependence of pH values on the TMB- H2O2 system by measuring the absorbance at 652 nm in 10 mM acetate buffer at a fixed concentration of the TMB, H2O2and the reaction time. The difference in absorbance at 652 nm in the presence and absence of hydrogen peroxide was used to find the optimum pH for the H2O2-mediated color development process as in the natural HRP. The activity increases with an increase in pH from 3.5 to 5.0, provides the maximum absorbance difference of 0.38 at pH 5.0, and decreases again with an increase in pH to 5.5. The activity was not tested in alkaline and neutral mediums as the acidic medium is necessary for the oxidation of TMB, and H2O2 is known to degrade in an alkaline medium[35]. Therefore, pH 5.0 was used as an optimum buffer pH. The concentration of H2O2 has a huge impact on the formation of the color in the TMB- H2O2 system; we found that absorbance increases with an increase in H2O2 and gets saturated at about 100 mM. We found that the absorbance increases with an increase in TMB concentration in the 0.1 to 0.4 mM range. However, non-specific color formation increases with an increase in concentration of the TMB. Therefore, a relatively lower concentration of the TMB was used throughout the experiment. Finally, the reaction time was optimized, and the absorbance of the TMB- H2O2 system increased with an increase in the reaction time and got saturated at about 15 minutes. Therefore, 15 minutes is considered the optimum reaction time.
2.7. Calibration Curve for the Detection of Dopamine
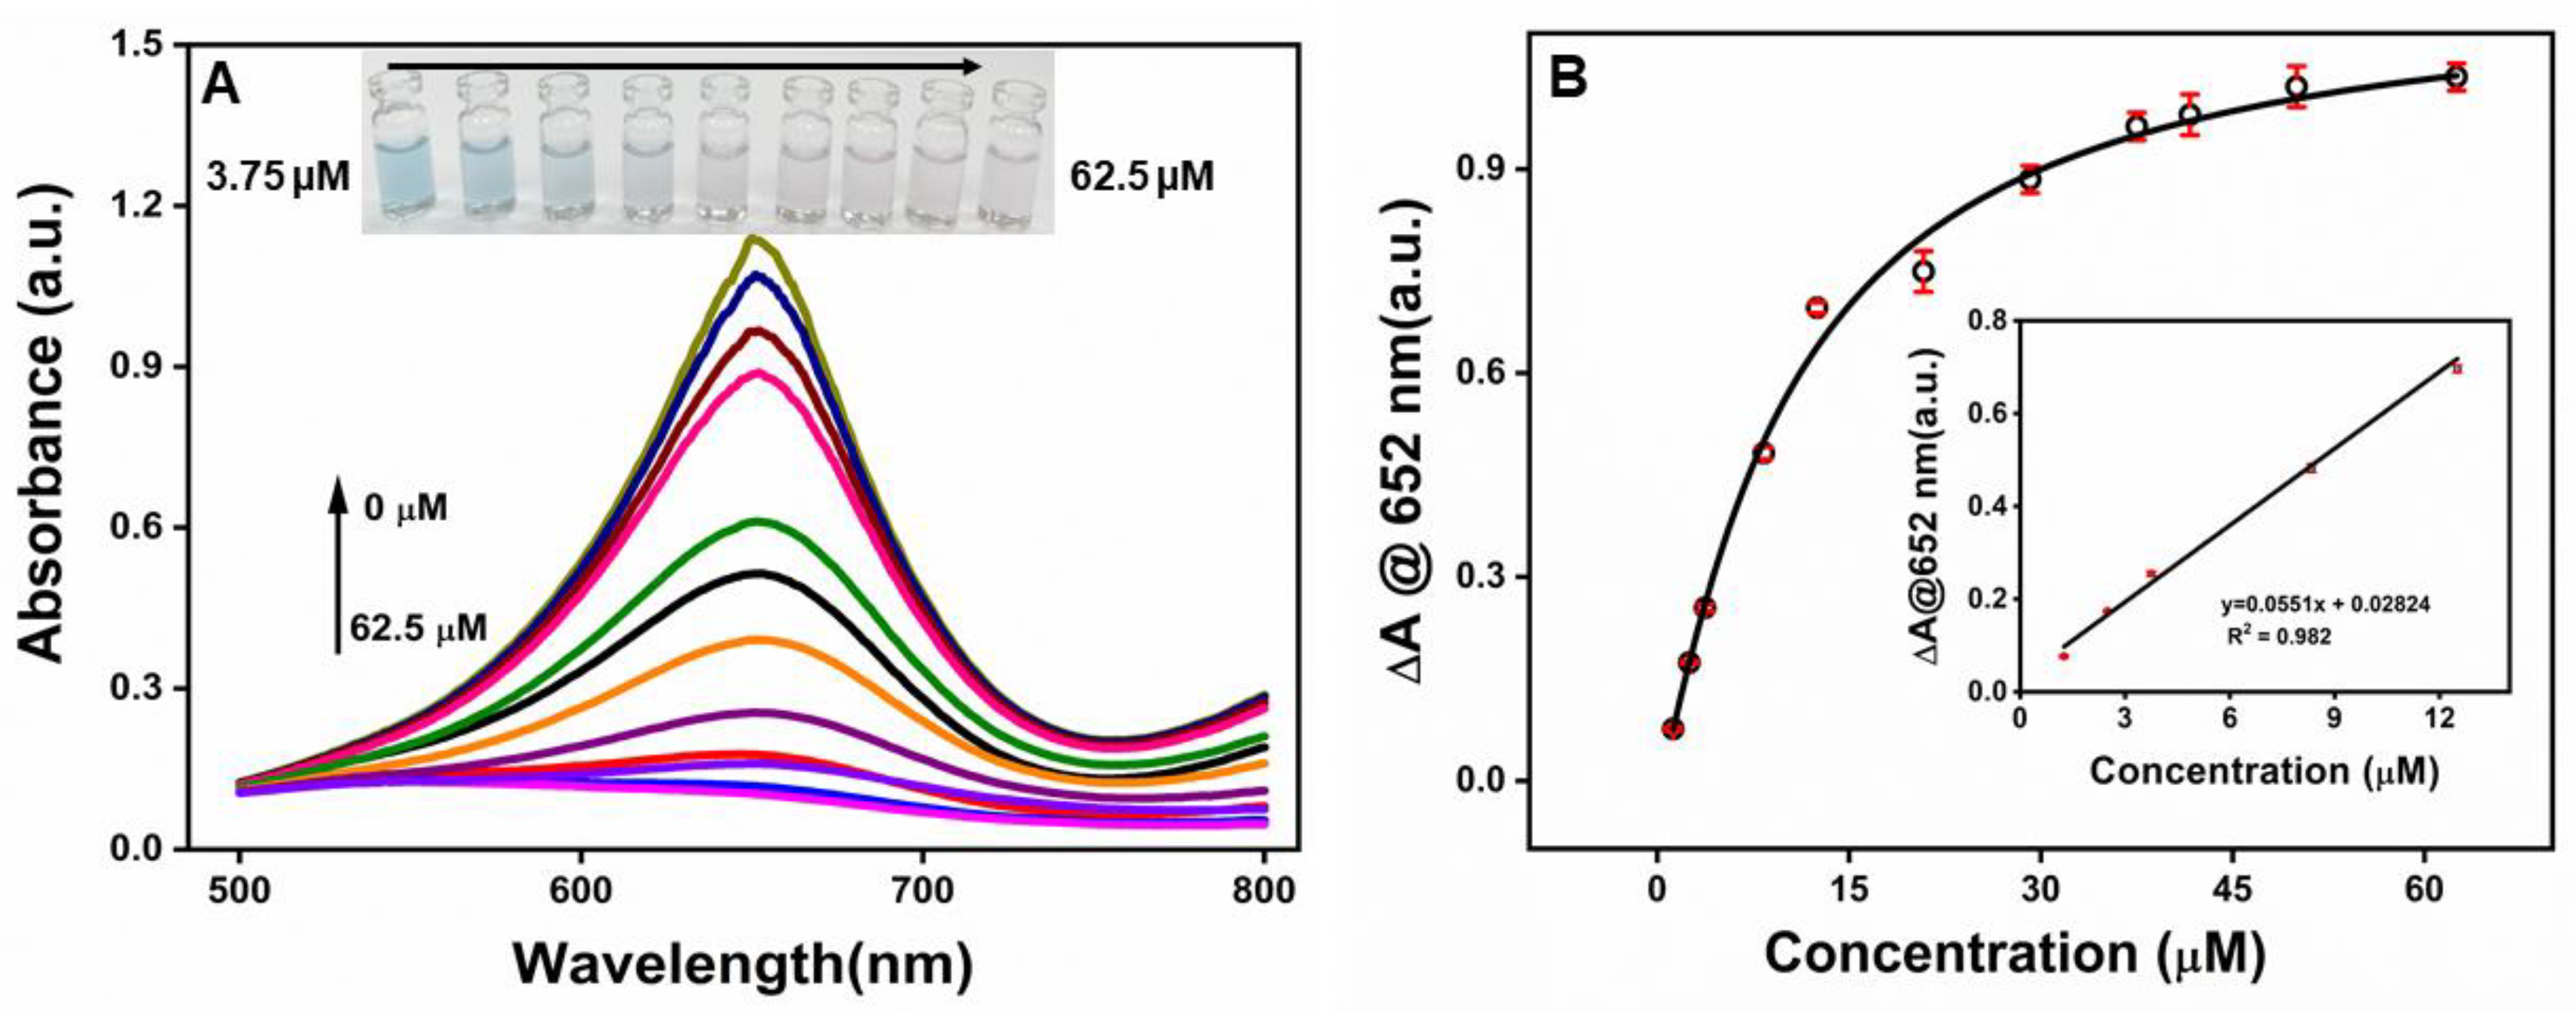
Optimized conditions were used to detect dopamine. Figure 7A shows the visible spectrum of β-CD-AuNPs −TMB-H2O2 system at different concentrations of dopamine. The absorbance at 652 nm gradually decreases with an increase in the dopamine concentration from 0−62.5 μM of DA. A precise color changes from blue to light blue and eventually colorless could be differentiated by the naked eye along with the increase of DA concentration from 3.75 μM to 62.5 μM as shown in the photographs in Figure 7A inset. Figure 7B shows the change in absorbance (ΔA) at 652 nm as a function of dopamine concentration. The value of ΔA increases with an increase in dopamine concentration from 1.25 μM to 62.5 μM. However, it starts to get saturated at a concentration of 37.5 uM. The inset of Figure 7B, shows the linear response of the absorbance over the concentration range of 1.25 −12.5 μM of DA. The limit of detection was found to be 1.08 μM based on S/N ratio of 3.
Figure 7.
A. Typical absorption spectra of the β-CD-AuNPs −TMB−H2O2 system in the presence of DA at various concentrations. From top to bottom, 0, 1.25, 2.5, 3.75, 8.34,12.5,20.8,29.1,37.5,41.67,50.0 and 62.5 µM. Inset-Photographs of the β-CD-AuNPs −TMB−H2O2 system in the presence of different amounts of DA that can visualized through naked eye. B. Plots of the change in absorbance (ΔA) at 652 nm as a function of DA concentration. Inset is the linear calibration plot for DA detection.
Although a lower limit of detection has been achieved[26,36,37] in the previously reported colorimetric sensor based on peroxidase-like activity of nanomaterial, they usually take a longer incubation time than the current method. Further understanding the peroxidase-like activity of β-CD-AuNPs, specially the role of the -OH groups, will enhance the detection limit. Compared to the previous peroxidases, which are limited to a specific analyte, our method could potentially be used for detecting other analytes due to the presence of cyclodextrin, which can form an inclusion compounds with many analytes[38].
2.8. Specificity of the Assay for the Detection of Dopamine
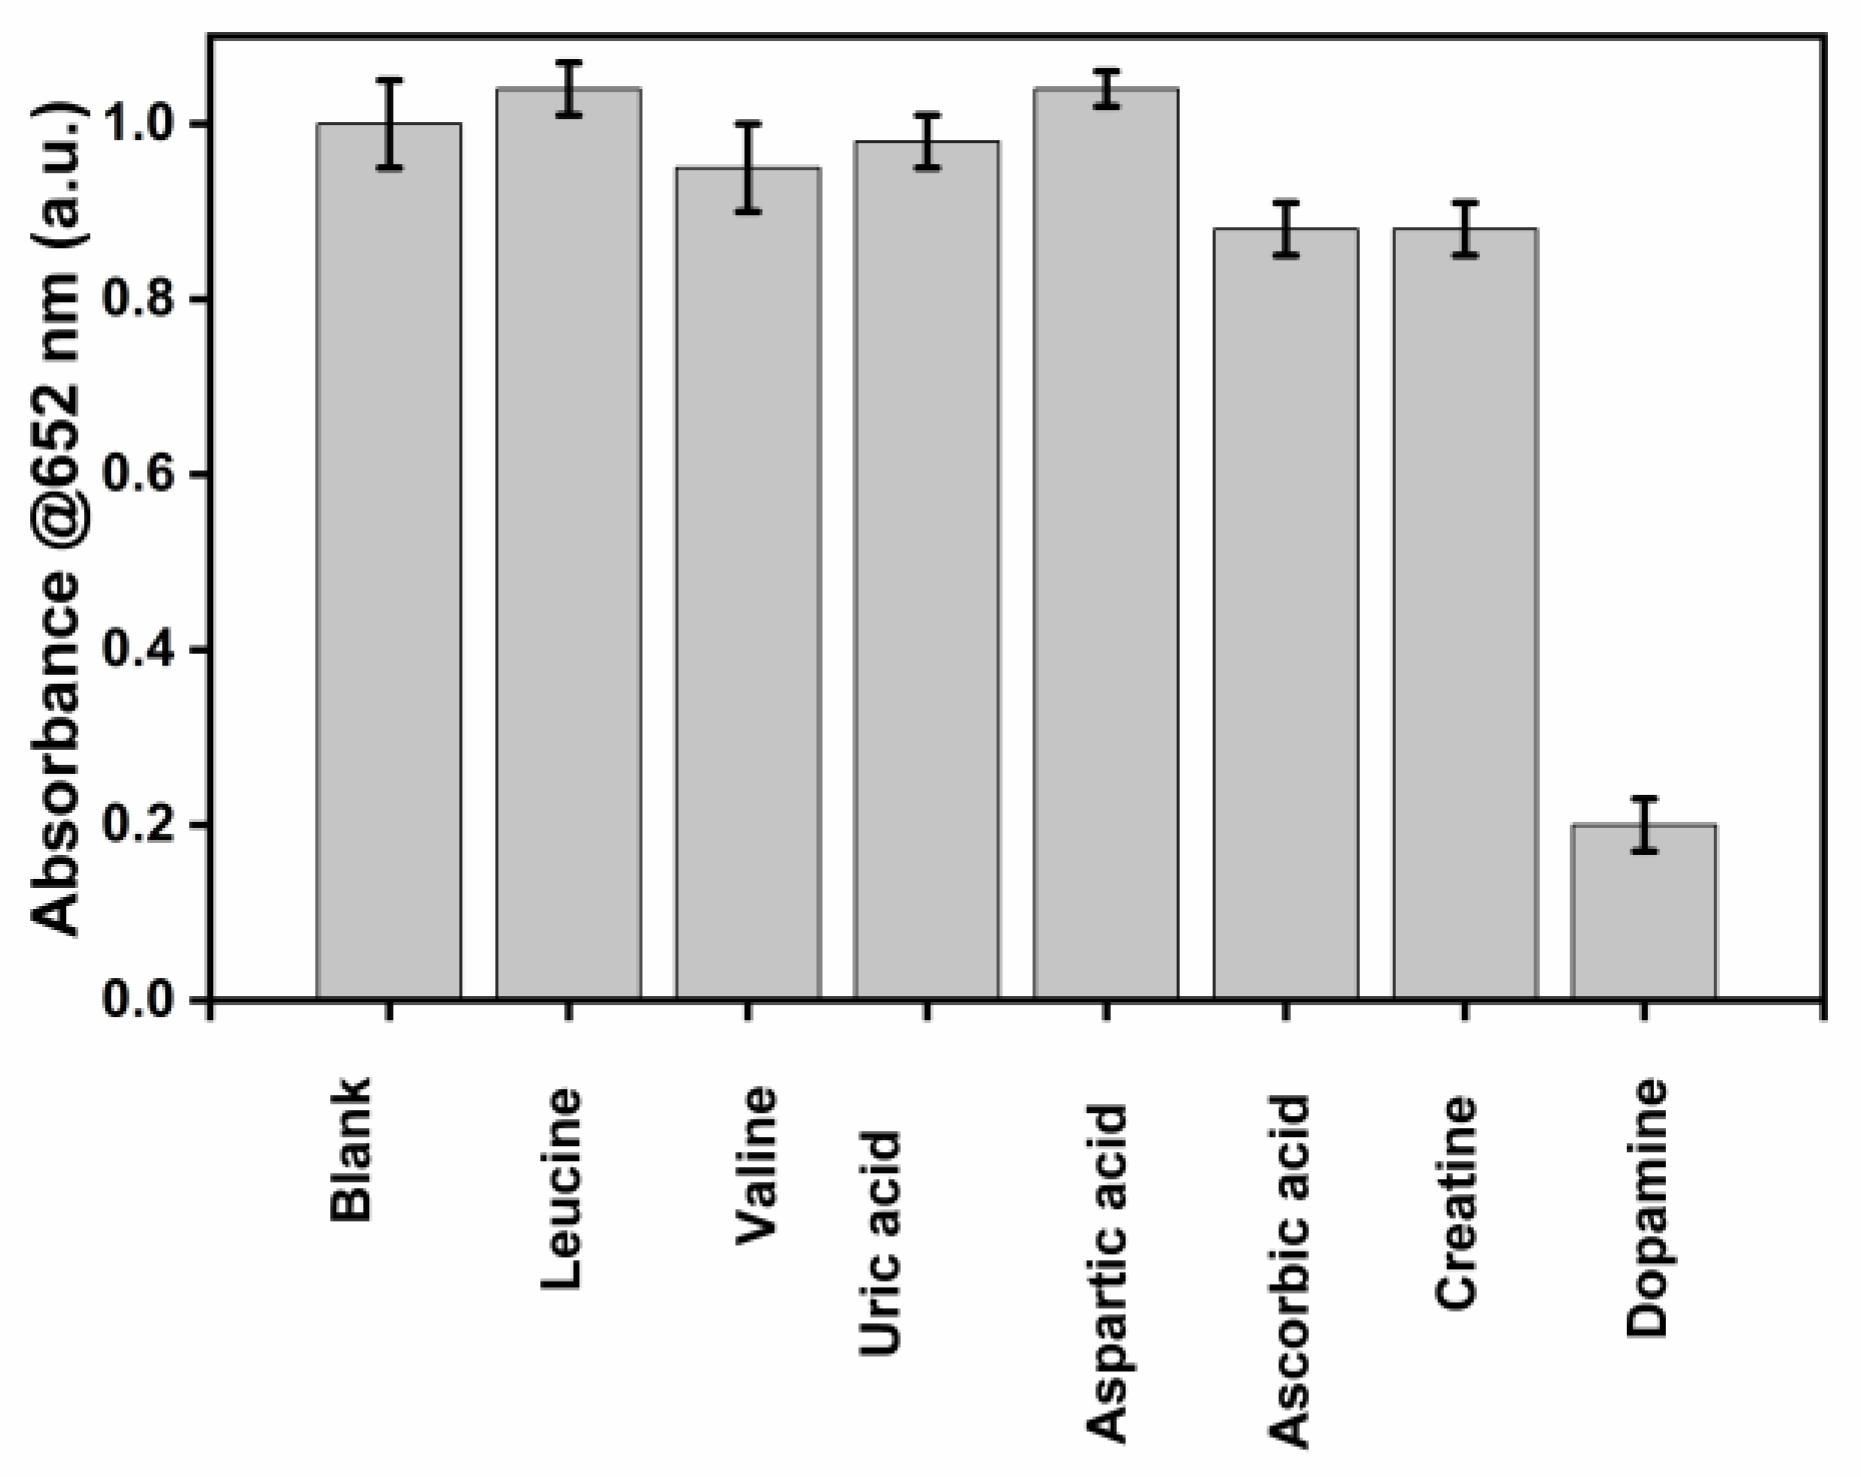
To evaluate the selectivity of this detection platform, possible interfering substances, including Leucine, Valine, Uric acid, Aspartic acid, Ascorbic acid, and Creatine, were tested, and the absorbance at 652 nm was recorded.
As shown in Figure 8, the TMB-H2O2 system shows higher absorbance at 650 nm due to the formation of the blue-colored complex. The absorbance decreases sharply even in the presence of 10 µM DA, showing that DA inhibits the formation of the blue color of the TMB- β-CD AuNPs system. At the same time, other substances with the same concentration cannot affect the catalytic activity of β-CD AuNPs compared with the blank sample with a slightly less than 8 % decrease in absorbance for the ascorbic acid and Creatine. We believe a further understanding of the peroxidase-like activity of β-CD-AuNPs, especially understanding the binding sites of TMB and DA, will further enhance the specificity of the detection of dopamine.
Figure 8.
Selectivity of this detection platform for DA assay. From left to right: blank, Leucine, Valine, Uric acid, Aspartic acid, Ascorbic acid, Creatine and Dopamine. Reaction conditions with final concentration of TMB as 0.1 mM, H2O2 as 100 mM, AuNPs as 0.72 pM, and dopamine or interferences of 10 µM in 10 mM of sodium acetate buffer pH 5.0 with the total reaction time of 30 minutes (15 minutes for the TMB color formation and 15 minutes for the reaction with DA or interferences).
4. Materials and Methods
4.1. Chemicals and Materials
Gold salt, beta-cyclodextrin, phosphate buffer pH 7.0, acetate buffer pH 5.0, hydrogen peroxide, OPD, DA, valine, uric acid, threonine, aspartic acid, lysine, isoleucine, leucine, cysteine, creatinine was purchased from thermo chemicals, USA. HPLC grade Ultrapure water was used in all experiments. All the chemicals were of analytical grad and used as received without further purification.
4.2. Synthesis of β-CD-AuNPs
Before synthesizing the gold nanoparticle solution, all glassware was incubated overnight in aqua regia (mixture of HNO3 and HCl in 3:1 v/v ratio) overnight, washed with tap water, and finally with distilled, deionized (DI) water. β-CD was used as both a reducing and stabilizing agent. DI water (70 mL) was mixed with phosphate buffer (10 mL, 0.1M, pH 7.0) and 0.1 M HAuCl4.3H2O (0.2 mL in DI water) in a round bottom flask under vigorous stirring. Then, 10 mM aqueous solution of β-cyclodextrin (20 mL in DI water) solution was rapidly added into the mixture with continuous stirring to reduce Au3+ species to form gold nanoparticles. The solution changed into red within 5 minutes of the addition of the beta-cyclodextrin. Once the solution changed to red, it was kept boiling for another 15 min and then cooled to room temperature. The wine-red solution of AuNPs was purified, concentrated and stored at 4 °C in refrigerator for further use.
4.3. Purification and Concentration of β-CD-AuNPs
Purified and concentrated AuNPs were used throughout the experiment unless it stated otherwise. AuNP particles are precipitated by centrifugation for 10 min (10000 r/min) and re-dispersed in DI water. The precipitation-re-dispersion cycle was repeated twice. The final re-dispersion was done in a way that the solution is 6× concentrated than the original sample.
4.4. Characterization of β-CD-AuNPs
4.4.1. UV-Vis Spectroscopy: The optical properties of β-CD-AuNPs were analyzed using a Cary 50 UV-Vis spectrophotometer (Agilent Technologies, USA). The absorbance spectra were recorded in the range of 300-800 nm range using a 3 mL quartz cuvette.4.4.2. Transmission Electron Microscopy (TEM): The TEM imaging data was acquired with a JEOL JEM-1400 TEM operated at 120kV. TEM sample was prepared following standard protocol-diluting the AuNP containing liquid to a proper concentration, ultrasonic bating, vortexing and applying to holy carbon film supported 300 mesh Cu grids.4.4.3. X-ray photoelectron spectroscopy (XPS): The XPS measurement was performed using a ScientaOmicron ESCA 2SR X-ray Photoelectron Spectroscope System equipped with a flood source charge neutralizer. The Au Nanoparticles (AuNPs) containing liquid sample was first dried on an Al foil and then the Al foil covered with dried AuNPs was fixed on the sample stage with double-sided Carbon tape. The sample was then loaded into the load lock and pumped until the vacuum was below 5×10⁻⁷mBar before it was transferred into the sample analysis chamber. The analysis was carried out with a Mono Al Kα x-ray source (1486.6 eV) at the power of 450W, and the pressure in the analysis chamber was maintained below 7×10⁻⁹mBar. A wide region survey scan and high-resolution core level scans of all elements were recorded and calibrated with the C1s 284.8ev as the reference peak. Pass Energy and step size used for survey scan were 50eV and 0.1eV respectively while the pass energy and step size used for region scans were 30eV and 0.05 eV respectively. The core level spectra were deconvoluted to obtain chemical state information.4.4.4. Fourier-Transform Infrared Spectroscopy (FTIR): FTIR analysis was conducted to confirm the functionalization of AuNPs with β-CD. The spectra were recorded using a Brucker model alpha platinum-ATR spectrometer. The spectra were measured from 400 to 4000 cm−1 with 4 cm−1 resolution using 32 accumulated scans.
4.4. Assessment of Peroxidase-like Activity of β-CD AuNPs
The peroxidase-like activity of β-CD AuNPs was evaluated by the classical chromogenic reaction of TMB and OPD in the presence of H2O2. In a typical assay, 2364 µL of acetate buffer solution (0.01 M, pH 5.0), 12.0 uL of TMB (20 mM stock in DMSO),24.0 uL of H2O2, (1 M stock) and 100 μL of 6x concentrated AuNPs was sequentially added directly in the cuvette. The reaction mixture was well mixed several times and let it react fifteen minutes at room temperature. The absorbance spectra or absorbance at 652 nm was then recorded using a Cary 50 UV-Vis spectrophotometer. For the kinetic assay, measurements were carried out in time course mode by monitoring the absorbance change at 652 nm for TMB. The OPD assay also followed the same procedure except for the TMB is replaced by OPD, typical reaction time of 60 minutes and absorbance was monitored at 450 nm.
4.5. Dopamine Oxidation Studies
In a typical reaction, 2340 µL of acetate buffer solution (0.01 M, pH 5.0), 12 μL dopamine (100 mM), 24.0 μL H2O2 (10 M stock) and 100 μL of 6× concentrated β-CD AuNPs was added directly in the cuvette, mixed and incubated at room temperature for 60 min. The absorbance spectra or absorbance at 480 nm was then recorded using a Cary 50 UV-Vis spectrophotometer.
2.5. Dopamine Assay
In a typical assay, 2364 µL of acetate buffer solution (0.01 M, pH 5.0), 12 μL TMB (20 mM), 24.0 μL H2O2 (10 M stock) and 100 μL of 6× concentrated β-CD AuNPs was added directly in the cuvette, mixed and incubated at room temperature for 15 min. To this, 24 μL of dopamine solution (10 mM stock) was added and reacted it for 15 minutes more before measuring the absorbances or taking the photographs. The absorbance spectra or absorbance at 480 nm was then recorded using a Cary 50 UV-Vis spectrophotometer.
For the calibration curves, the same procedure is followed by preparing the different stock solutions to match the require concentration. For the selectivity experiments 24 uL of either dopamine or other interferences are added using 1 mM stocks.
5. Conclusions
In conclusion, we have explored the peroxidase-like activity of the β-CD AuNPs in different substances, including TMB and DA. We have developed a colorimetric signal-off dopamine sensor based on the competition between dopamine and TMB for possible binding sites at the surface of the β-CD-AuNPs. As a result, the presence of dopamine can be detected even through the naked eye (up to a concentration of 3.75 µM) and using a spectrophotometer (up to a concentration of 1.0 µM) by monitoring the disappearance of the blue color of the oxidized form of TMB in the presence of dopamine. Furthermore, dopamine can also be detected in equal concentrations of common interferences, including ascorbic and uric acid. Further understanding the peroxidase-like activity of β-CD-AuNPs will enhance the sensor's detection limit and specificity. Compared to the previous peroxidase mimetics nanozymes, which are limited to a specific analyte, our method could be used for detecting other analytes due to the presence of cyclodextrin, which can form an inclusion of compounds with a large number of analytes.
Author Contributions
Conceptualization, J.P. and K.B.; methodology, S.A., H.S. and J.P.; validation, S.A., H.S. and J.P.; formal analysis, S.A., H.S., K.B. and J.P.; investigation, S.P., H.S. and J.P.; resources, J.P.; data curation, J.P.; writing—original draft preparation, S.P.; writing—review and editing, J.P. and K.B.; visualization, J.P.; supervision, and K.B.; project administration, J.P and K.B..; funding acquisition, J.P. All authors have read and agreed to the published version of the manuscript.”
Funding
This work was partially funded in part by the NSF EPSCoR program under OIA-1946231, and the Louisiana Board of Regents’s LAMDA seed funding track 3. The use of experimental facilities at the LSU Shared Instrumentation Facility (SIF), a part of the Louisiana Core User Facilities (CUF), is acknowledged.
Data Availability Statement
The original contributions presented in the study are included in the article/Supplementary Materials; further inquiries can be directed to the corresponding authors.
Acknowledgments
Authors acknowledge the support from University of Colorado Colorado Springs (UCCS) under Undergraduate Research Academy (URA) 2023 and from McNeese State University under endowed professorship in science #5, 2024.
Conflicts of Interest
The authors declare no conflicts of interest.
References
- Y. Lin, J. Ren, and X. Qu, “Catalytically active nanomaterials: A promising candidate for artificial enzymes,” Acc Chem Res, vol. 47, no. 4, pp. 1097–1105, Apr. 2014. [CrossRef]
- M. Zandieh and J. Liu, “Nanozymes: Definition, Activity, and Mechanisms,” Advanced Materials, vol. 36, no. 10, Mar. 2024. [CrossRef]
- Y. Huang, J. Ren, and X. Qu, “Nanozymes: Classification, Catalytic Mechanisms, Activity Regulation, and Applications,” Mar. 27, 2019, American Chemical Society. [CrossRef]
- J. Kosman and B. Juskowiak, “Peroxidase-mimicking DNAzymes for biosensing applications: A review,” Anal Chim Acta, vol. 707, no. 1–2, pp. 7–17, Nov. 2011. [CrossRef]
- F. K. de Oliveira, L. O. Santos, and J. G. Buffon, “Mechanism of action, sources, and application of peroxidases,” May 01, 2021, Elsevier Ltd. [CrossRef]
- T. Phan-Xuan, B. Breitung, and L. A. Dailey, “Nanozymes for biomedical applications: Multi-metallic systems may improve activity but at the cost of higher toxicity?,” Wiley Interdiscip Rev Nanomed Nanobiotechnol, vol. 16, no. 4, Jul. 2024. [CrossRef]
- J. Lou-Franco, B. Das, C. Elliott, and C. Cao, “Gold Nanozymes: From Concept to Biomedical Applications,” Jan. 01, 2021, Springer Science and Business Media B.V. [CrossRef]
- P. Y. Wang, W. J. Wang, and W. P. Li, “Serine-Modified Au@Cu2O Core-Shell Nanoparticles for Catalysis-Mediated Colorimetric Detection of Small Molecules,” ACS Appl Nano Mater, vol. 6, no. 17, pp. 15651–15662, Sep. 2023. [CrossRef]
- L. Sun et al., “Ultrasmall Pt Nanozymes Immobilized on Spherical Polyelectrolyte Brushes with Robust Peroxidase-like Activity for Highly Sensitive Detection of Cysteine,” Langmuir, vol. 38, no. 42, pp. 12915–12923, Oct. 2022. [CrossRef]
- L. He et al., “Ru(III)-Based Metal-Organic Gels: Intrinsic Horseradish and NADH Peroxidase-Mimicking Nanozyme,” ACS Appl Mater Interfaces, vol. 11, no. 32, pp. 29158–29166, Aug. 2019. [CrossRef]
- S. Wang et al., “Mimicking Horseradish Peroxidase and NADH Peroxidase by Heterogeneous Cu2+-Modified Graphene Oxide Nanoparticles,” Nano Lett, vol. 17, no. 3, pp. 2043–2048, Mar. 2017. [CrossRef]
- M. Vázquez-González et al., “Mimicking Horseradish Peroxidase Functions Using Cu2+-Modified Carbon Nitride Nanoparticles or Cu2+-Modified Carbon Dots as Heterogeneous Catalysts,” ACS Nano, vol. 11, no. 3, pp. 3247–3253, Mar. 2017. [CrossRef]
- M. Comotti, C. Della Pina, R. Matarrese, and M. Rossi, “The catalytic activity of ‘naked’ gold particles,” Angewandte Chemie - International Edition, vol. 43, no. 43, pp. 5812–5815, Nov. 2004. [CrossRef]
- Y. Lin, J. Ren, and X. Qu, “Nano-gold as artificial enzymes: Hidden talents,” Advanced Materials, vol. 26, no. 25, pp. 4200–4217, Jul. 2014. [CrossRef]
- W. Luo et al., “Self-catalyzed, self-limiting growth of glucose oxidase-mimicking gold nanoparticles,” ACS Nano, vol. 4, no. 12, pp. 7451–7458, Dec. 2010. [CrossRef]
- Y. Jv, B. Li, and R. Cao, “Positively-charged gold nanoparticles as peroxidiase mimic and their application in hydrogen peroxide and glucose detection,” Chemical Communications, vol. 46, no. 42, pp. 8017–8019, Nov. 2010. [CrossRef]
- C. P. Liu, K. C. Chen, C. F. Su, P. Y. Yu, and P. W. Lee, “Revealing the active site of gold nanoparticles for the peroxidase-like activity: The determination of surface accessibility,” Catalysts, vol. 9, no. 6, Jun. 2019. [CrossRef]
- S. Wang, W. Chen, A. L. Liu, L. Hong, H. H. Deng, and X. H. Lin, “Comparison of the peroxidase-like activity of unmodified, amino-modified, and citrate-capped gold nanoparticles,” ChemPhysChem, vol. 13, no. 5, pp. 1199–1204, Apr. 2012. [CrossRef]
- Y. Zhao, Y. Huang, H. Zhu, Q. Zhu, and Y. Xia, “Three-in-One: Sensing, Self-Assembly, and Cascade Catalysis of Cyclodextrin Modified Gold Nanoparticles,” J Am Chem Soc, vol. 138, no. 51, pp. 16645–16654, Dec. 2016. [CrossRef]
- R. Franco, I. Reyes-Resina, and G. Navarro, “Dopamine in health and disease: Much more than a neurotransmitter,” Feb. 01, 2021, MDPI AG. [CrossRef]
- M. Tsunoda, “Recent advances in methods for the analysis of catecholamines and their metabolites,” Anal Bioanal Chem, vol. 386, no. 3, pp. 506–514, Oct. 2006. [CrossRef]
- D. Wen et al., “Simple and Sensitive Colorimetric Detection of Dopamine Based on Assembly of Cyclodextrin-Modified Au Nanoparticles,” Small, vol. 12, no. 18, pp. 20 May 2439; 16. [CrossRef]
- H. Su, B. Sun, L. Chen, Z. Xu, and S. Ai, “Colorimetric sensing of dopamine based on the aggregation of gold nanoparticles induced by copper ions,” Analytical Methods, vol. 4, no. 12, pp. 3981–3986, Dec. 2012. [CrossRef]
- H. Wang, W. Fu, Y. Chen, F. Xue, and G. Shan, “ZIF-67-derived Co3O4 hollow nanocage with efficient peroxidase mimicking characteristic for sensitive colorimetric biosensing of dopamine,” Spectrochim Acta A Mol Biomol Spectrosc, vol. 246, Feb. 2021. [CrossRef]
- J. Zhu et al., “Hollow copper sulfide nanocubes as multifunctional nanozymes for colorimetric detection of dopamine and electrochemical detection of glucose,” Biosens Bioelectron, vol. 141, Sep. 2019. [CrossRef]
- J. Y. Yue, L. P. Song, Y. T. Wang, P. Yang, Y. Ma, and B. Tang, “Fluorescence/Colorimetry/Smartphone Triple-Mode Sensing of Dopamine by a COF-Based Peroxidase-Mimic Platform,” Anal Chem, vol. 94, no. 41, pp. 14419–14425, Oct. 2022. [CrossRef]
- F. N. Wu, J. Zhu, G. J. Weng, J. J. Li, and J. W. Zhao, “Tyrosine-Decorated Gold Nanoclusters Chelated Cerium(III) for Fluorescence Detection of Dopamine,” ACS Appl Nano Mater, vol. 4, no. 12, pp. 13501–13509, Dec. 2021. [CrossRef]
- W. Haiss, N. T. K. Thanh, J. Aveyard, and D. G. Fernig, “Determination of size and concentration of gold nanoparticles from UV-Vis spectra,” Anal Chem, vol. 79, no. 11, pp. 4215–4221, Jun. 2007. [CrossRef]
- S. Hu, A. Trinchi, P. Atkin, and I. Cole, “Tunable photoluminescence across the entire visible spectrum from carbon dots excited by white light,” Angewandte Chemie - International Edition, vol. 54, no. 10, pp. 2970–2974, Mar. 2015. [CrossRef]
- A. Mazzaglia et al., “Supramolecular colloidal systems of gold nanoparticles/amphiphilic cyclodextrin: A FE-SEM and XPS investigation of nanostructures assembled onto solid surface,” Journal of Physical Chemistry C, vol. 113, no. 29, pp. 12772–12777, Jul. 2009. [CrossRef]
- V. Chandra, J. Park, Y. Chun, J. W. Lee, I. C. Hwang, and K. S. Kim, “Water-dispersible magnetite-reduced graphene oxide composites for arsenic removal,” ACS Nano, vol. 4, no. 7, pp. 3979–3986, Jul. 2010. [CrossRef]
- X. Zhang, Q. Yang, Y. Lang, X. Jiang, and P. Wu, “Rationale of 3,3′,5,5′-Tetramethylbenzidine as the Chromogenic Substrate in Colorimetric Analysis,” Anal Chem, vol. 92, no. 18, pp. 12400–12406, Sep. 2020. [CrossRef]
- H. Wei et al., “Nanozymes: A clear definition with fuzzy edges,” Nano Today, vol. 40, p. 101269, Oct. 2021. [CrossRef]
- D. Tarasek et al., “Oxidation of dobutamine and dopamine by horseradish peroxidase,” J Mol Struct, vol. 1252, p. 132169, Mar. 2022. [CrossRef]
- A. Ohlweiler and J. O. Meditsch, “The decomposition of hydrogen peroxide in alkaline solution,” Anal Chim Acta, vol. 69, no. 1, pp. 228–230, Mar. 1974. [CrossRef]
- V. Sudha et al., “Ultrasensitive Dopamine Detection at Co3O4-Anchored N-Doped Hollow Mesoporous Carbon Nanospheres,” ACS Appl Nano Mater, vol. 6, no. 14, pp. 13013–13026, Jul. 2023. [CrossRef]
- J. Wang, Y. Hu, Q. Zhou, L. Hu, W. Fu, and Y. Wang, “Peroxidase-like Activity of Metal-Organic Framework [Cu(PDA)(DMF)] and Its Application for Colorimetric Detection of Dopamine,” ACS Appl Mater Interfaces, vol. 11, no. 47, pp. 44466–44473, Nov. 2019. [CrossRef]
- L. Wickstrom, P. He, E. Gallicchio, and R. M. Levy, “Large scale affinity calculations of cyclodextrin host-guest complexes: Understanding the role of reorganization in the molecular recognition process,” J Chem Theory Comput, vol. 9, no. 7, pp. 3136–3150, Jul. 2013. [CrossRef]
Disclaimer/Publisher’s Note: The statements, opinions and data contained in all publications are solely those of the individual author(s) and contributor(s) and not of MDPI and/or the editor(s). MDPI and/or the editor(s) disclaim responsibility for any injury to people or property resulting from any ideas, methods, instructions or products referred to in the content. |
© 2024 by the authors. Licensee MDPI, Basel, Switzerland. This article is an open access article distributed under the terms and conditions of the Creative Commons Attribution (CC BY) license (http://creativecommons.org/licenses/by/4.0/).
Copyright: This open access article is published under a Creative Commons CC BY 4.0 license, which permit the free download, distribution, and reuse, provided that the author and preprint are cited in any reuse.


