
Submitted:
16 December 2024
Posted:
18 December 2024
You are already at the latest version
Abstract
This study introduces a new method for nowcasting UV Index maps within the framework of the Austrian Solar UV Measurement Network. The primary objective is to improve public health measures by providing timely and area-wide UV Index values. The UV Index maps are based on clear-sky calculations using data from the Copernicus Atmosphere Monitoring Service. Cloud effects are integrated using cloud modification factors determined from Meteosat Second Generation satellite imagery. To assess the representativeness of the calculated UV Index maps, the corresponding pixel values are compared to ground-based measurements of the year 2022 of 27 sites located in Germany, Austria and Switzerland (DACH region). A source of uncertainty in the comparison arises from the different measurement methods. Ground-based measurements reflect the UV Index in the immediate vicinity of the measurement device whereas the satellite-derived UV Index maps represent mean values over pixel-sized areas. For clear-sky conditions the most significant discrepancies occur at high-altitude sites with near-permanent snow cover, where surface albedo is not adequately represented by the satellite’s mean values. For all-sky conditions, cloudiness introduces additional uncertainties across all locations. Ground-based measurements can detect rapidly changing sun obstruction, whereas satellite-derived cloud information represents a single average value per pixel, lacking the resolution to identify sub-pixel variations. This effect is most prominent for sites located in complex terrain due to cloud climatology. This study emphasizes the potential of satellite data to inform public health initiatives, highlighting that the spatial representation of UV Index values from satellite data is a valuable complement to ground-based measurements.
Keywords:
UV Index
; ground-based measurements
; radiative transfer model
; satellite data
; cloud modification factor
; surface albedo
1. Introduction
Solar ultraviolet (UV) radiation affects human health differently depending on the level of exposure. UV radiation is the primary driver of vitamin D synthesis in the skin [1,2], which has positive effects on human health. Among other things, vitamin D supports musculoskeletal health and beneficially modulates the systemic immune response [3]. As vitamin D can also be obtained through supplementation, exposure to solar radiation should be limited due to its harmful effects, such as sunburn (erythema), eye damage (photokeratitis, cataract), and an increased risk of skin cancer [4,5].
With the discovery of the Antarctic ozone hole in 1985, growing concerns about rising ultraviolet radiation levels on the Earth’s surface led to the establishment of monitoring networks. In addition to changes in atmospheric ozone concentration, changes in cloud cover, aerosols, and surface albedo can significantly influence the UV radiation at the ground. These factors are impacted by climate change, and there are numerous interactions and feedback reactions between them and climate change [6,7,8]. A current data and trend analysis of UV measurement series in Dortmund and Uccle shows a statistically significant increase in ground-level UV radiation since 1997 and 1991, respectively, with the evaluation of influencing factors suggesting that changes in cloud cover are a main reason for this increase at these two locations [9].
Although ground-based measurements provide the actual radiation levels on the Earth’s surface, their spatial range of validity is confined to the surroundings of the measurement station since local conditions of surface albedo as well as atmospheric conditions of cloud cover, ozone and aerosol amount have a strong impact on the measured radiation. An advantage of satellite-based imagery is its ability to provide extensive geographic coverage. However, their acquisition is not continuous, and the representativeness of the resulting data depends on the spatial, spectral and radiometric resolution of the measurement device onboard the satellite. Moreover, with this technique, it is not possible to measure the UV radiation at the Earth’s surface directly, but there are methods of combining radiative transfer modelling with satellite data to calculate UV maps [10,11,12,13,14].
In this study, we present a straightforward method for generating UV Index maps (UVI, see definition in [15]) by combining clear-sky model calculations with cloud modification factors (CMF) derived from satellite imagery to account for the impact of cloud cover on the UV Index. Nowadays this method is in routine use in the framework of the Austrian Solar UV Measurement Network to calculate UV Index maps of Europe every 15 minutes.
2. Materials and Methods
The following sections detail the ground-based measurements used to evaluate the representativeness of the satellite-derived UV Index maps, describe the clear-sky model along with its input parameters, and outline the method for estimating the cloud modification factor. Additionally, the process of generating the UV Index maps is presented.
2.1. Ground-Based Measurements
To compare the satellite-derived UV Index maps with ground-based measurements, UV Index data measured at 25 sites (see Figure 1) located in Germany (16 stations) and Austria (9 stations) were selected from the German Solar UV Monitoring Network and the Austrian Solar UV Measurement Network, respectively. In addition, data from two Swiss stations provided to the Austrian Solar UV Measurement Network by the Physical Meteorological Observatory in Davos (PMOD/WRC), is used for the comparison.
Reliability of the data, coverage of the year 2022 and a measurement repeat cycle of at least 10 minutes were the criteria for selection. The sites cover rural and urban areas from the sea in the North of Germany to the alpine region in the South, covering different altitudes. Most of the stations (19) are located below 900 m a.s.l., five of them are at intermediate altitudes from 900 m a.s.l. to 1600 m a.s.l. and three high alpine stations are located in the Alps above 2500 m a.s.l..
For the measurements predominantly broadband devices are utilized (see Table 1), which are either sglux ERYCA broadband radiometer (site acronyms with 4 letters, Germany) or Solar Light Model 501 (site acronyms with 3 letters, Austria and Switzerland). At seven sites of the German Solar UV Monitoring Network spectral measurements are performed with mostly BTS2048-UV-S-WP spectroradiometers (site acronyms with 2 letters except for DO) and a Bentham DTM300 double monochromator at Dortmund (DO) (see site description in [9]).
The measurement devices of the German Solar UV Monitoring Network are usually calibrated once a year with uncertainties of for the spectral devices, and for the broadband radiometers, respectively. The Austrian Solar Light detectors are calibrated once a year with an uncertainty of [16] and also PMOD/WRC is performing calibrations every year with a calibration uncertainty of according to the calibration certificates. All calibrations are traceable to the SI-Units via Physikalisch-Technische Bundesanstalt (PTB).
The UV Index measurements were homogenized to 10 minute mean values and then interpolated to match the timeline of satellite cloud information, which is available every 15 minutes. Since the calculation of the CMF is associated with significant uncertainties for low solar elevations and to limit the effect of the horizon on ground-based measurements, further analysis is conducted with data from solar elevations of 20° and higher. While for the four most southern sites 20° solar elevation is reached even around winter solstice at noon, this is not the case for more northern stations. The effect of the limitation in solar elevation is increasing with latitude leading to data from January, November and December of 2022 being ignored for further analysis for the most northern stations TODO and ZIRC. Most of the stations provide data covering the whole year leading to 9.000 up to 10.500 data points (10 minute means) per station for the analysis, with significant data gaps only for WFJ (gap from 2022-08-17 to 2022-12-01) and LI (gap from 2022-01-01 2022-04-06) reducing the number of data points to approximately 7700 for both stations.
2.1.1. Filtering of Ground-Based Measurements
The satellite-derived UV Index maps depend on two factors: clear-sky model calculations for each pixel and the derived CMF to incorporate the effect of cloudiness. So, first clear-sky model calculations are compared to ground-based UV Index data gathered under clear-sky conditions.
To filter the measurements for clear-sky conditions, the idea is to take advantage of the smooth behaviour of the UV Index in the course of a cloudless day and the magnitude of the measurements being close to the clear-sky model calculation. If the standard deviation of three consecutive ratios of measurement to clear-sky model value within a rolling window is less than 0.03 and each ratio exceeds 0.7, then these data points are considered to represent cloud-free conditions.
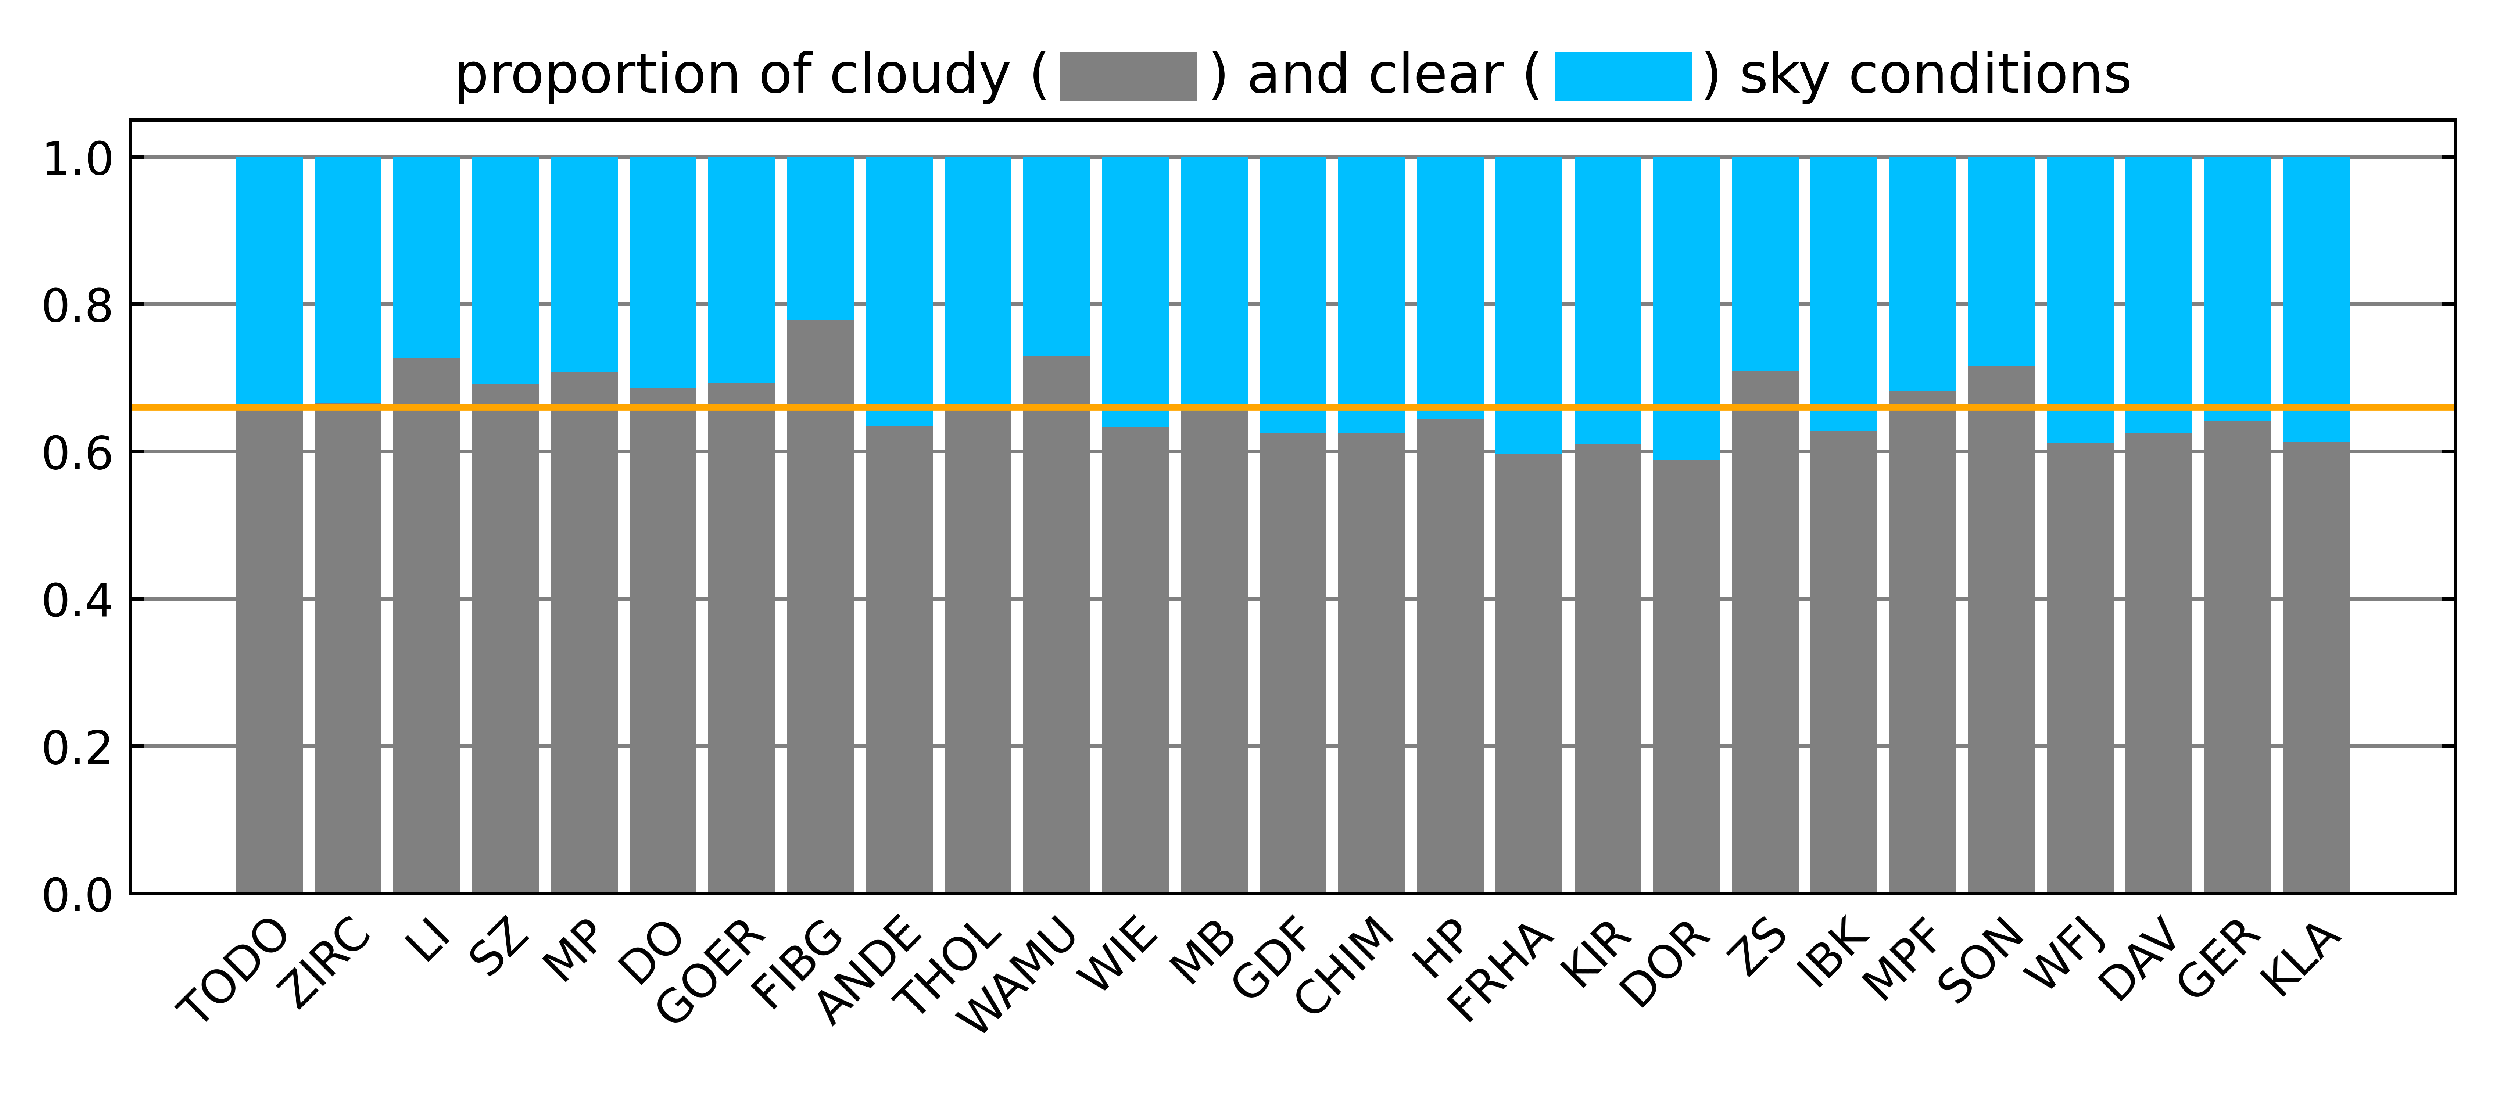
With this filtering method between 59% and 78% of ground-based data per site is found to represent cloudy conditions with an average of 66% across all stations. The proportion for most of the stations is close to this average (see Appendix A). The largest portion of cloudy measurements is found at FIBG with 78%, whereas the lowest amount of clouds is found at DOR (59%) closely followed by FRHA with 60%.
2.2. Clear-Sky Model
A lookup table of erythemal irradiance at the surface for clear-sky conditions () was pre-calculated with the sdisort solver of the radiative transfer model libRadtran [17,18]. The entries of are solar elevation, height above sea level (m a.s.l.), total column ozone, surface albedo and Angstrom . The grid points (see Table 2) of were chosen so that the discrepancy between an interpolated and calculated value is less than 1%. The eccentricity of the Earth’s orbit is taken into account by a separate multiplication factor as found in the libRadtran source code.
For the operational nowcasting system of the Austrian Solar UV Measurement Network clear-sky UV Index maps for the desired area are extracted from by providing day-to-day forecasts of ozone, albedo and aerosol optical depth (AOD at 340 nm) from the Copernicus Atmospheric Monitoring Service (CAMS) global model forecast [19] with a resolution of 0.4° (approximately 29 km × 44 km), where Angstrom is calculated from the AOD with Angstrom = 1.4.
The broadband albedo product of CAMS (forecast surface albedo) covers the wavelength range from UV to near-infrared [20]. However, this broad coverage makes it a general estimate and less specific for the UV surface albedo required as input for . According to [21], spectral surface albedo measurements from 335 nm to 772 nm for various natural surfaces (e.g. grasslands, deciduous forests, and deserts) indicate an increase in surface albedo with rising wavelength, starting from low values around 0.05 in the UV. In comparison, during the summer of 2022 (May to October), over 90% of CAMS broadband surface albedo values across all sites range between 0.1 and 0.2, indicating an overestimation of surface albedo in the UV range.
Under winter conditions, the CAMS broadband surface albedo analysed for all site pixels in the year 2022 does not exceed 0.58, even at high-altitude stations with a lot of snow cover. This is partly due to the CAMS albedo value representing a mean value over a rather big pixel area (about 29 km × 44 km). Especially for high-altitude sites, the corresponding CAMS pixel areas encompass a highly variable topography from low valley altitudes to mountain tops with non-uniform snow cover. Additionally, the alpine region is largely forested, and these forests typically lose their snow cover soon after snowfall reducing the satellite-measured surface albedo. The discrepancy between the local surface albedo influencing the ground-based measurements and the satellite-measured surface albedo due to the aforementioned geographical factors is strongly dependent on the exact location of the site in the CAMS pixel and the local surroundings.
Moreover, the broadband nature of the CAMS surface albedo product leads to an underestimation of UV surface albedo across all sites. Ground-based surface albedo measurements conducted in Greenland under snow and ice conditions show significantly higher UV albedo values, ranging from 0.65 (aged snow) to 0.85 (fresh snow), with albedo decreasing as wavelength increases [21]. Additional research [22,23,24] indicates that surface albedo for snow-covered areas in the UV varies between 0.6 and 0.95, depending on snow type (e.g., fresh, old, wet, or dry). This demonstrates that local UV albedo, especially in winter with snow cover, can be higher than the satellite-derived broadband estimate.
To address the discrepancy between broadband and UV surface albedo, CAMS surface albedo values below 0.2 (summer cut-off) were adjusted to 0.05, and those above 0.2 were increased by 30%, capping the maximum UV surface albedo at 0.75 for high-altitude stations. This is a simple approach that does not take into account site-specific geographical factors, resulting in higher uncertainties in surface albedo estimates for high-altitude locations. Reducing these uncertainties would require the application of individual correction factors tailored to each site, which could be derived through detailed 3-dimensional modelling specific to the characteristics of each location.
For the spatial distribution of the altitude a.s.l. the digital elevation model GTOPO30 [25] with a resolution of 30 arc seconds (approximately 920 m × 600 m) is used and the solar elevation is calculated to match the timing of satellite cloud information from the SEVIRI instrument onboard the Meteosat Second Generation (MSG) satellite.
The aforementioned method for operational UV Index map nowcasting was adapted for the retrospective analysis with data from 2022 presented in this manuscript. Instead of CAMS total column ozone predictions, we employed measured total column ozone from NASA’s Ozone Monitoring Instrument (OMI, Total Column Daily L3) [26] with a resolution of 0.25° (approximately 18 × 28 km for the DACH region) as input to , as these measured ozone data were also used in the calibration of the ground-based measurements of the Austrian and Swiss stations. Moreover, this reduces the uncertainties associated with forecasted data compared to measured ones. An analysis of both ozone data sets for the site pixels shows, that on average the OMI data are about 4 DU lower than CAMS values where 65% of all data agree within DU and 93% are within DU. In rare cases, larger differences of up to 99 DU have been found in the comparison for the year 2022.
2.3. Cloud Modification Factor
To account for cloud cover, a cloud modification factor (CMF) is applied, representing the reduction in transmitted radiation due to cloud reflection. The CMF ranges from 0 to 1, where a value of 0 indicates an overcast scenario (no radiation reaches the surface), and 1 represents clear-sky conditions (no cloud impact). The UV Index for all-sky conditions () including clouds is defined as the product of CMF and the clear-sky UV Index ():
Our approach for computing the for nowcasting UV maps, integrates data from the MSG satellite, the CAMS broadband forecast albedo and a predefined lookup table ().
MSG is the operational geostationary weather satellite of the European meteorological satellite program, equipped with the Spinning Enhanced Visible and Infrared Imager (SEVIRI) instrument. For the calculation, the visible spectral channel VIS0.6 µm (central wavelength 635 nm, wavelength range 560 nm - 710 nm) is used, which measures the top-of-atmosphere (TOA) radiance. This measurement provides information about the amount of radiation reflected by clouds and surface albedo. The temporal resolution is 15 min for a full disc scan and the spatial resolution is 3 km × 3 km at the sub-satellite point [27,28]. Additionally, we obtain the Cloud Mask product from EUMETCast-Europe, which describes the scene (clear-sky or cloud) on a pixel level, with the same resolution [29].
The satellite data and CAMS albedo data are resampled onto a regular latitude-longitude grid with 0.05° resolution, for the selected DACH region (longitude 5.2°E - 17.2°E, latitude 45.2°N - 55.2°N). For resampling satellite data, the nearest neighbour resampling from the pyresample package within the SatPy library is used [30], and for CAMS albedo data, the scipy RegularGridInterpolator with linear interpolation is applied [31]. This process results in a grid of 200 × 240 pixels, with a spatial resolution of approximately 4 km×6 km.
The is determined for each pixel, with the Cloud Mask indicating if a calculation is required. If the Cloud Mask marks a pixel as cloudy, is computed; otherwise, it is set to one, indicating clear-sky conditions.
For the estimation of for a cloudy pixel, the minimum and maximum TOA radiance at 635 nm ( and ) are derived from the . The considers geometrical factors (distance Sun-Earth, solar zenith and azimuth angle, satellite viewing angle) and surface albedo. The was generated using the libRadtran radiative transfer model (version 2.0.5) [17,18] with the DISORT solver [32], the standard atmosphere afglus (U.S. Standard) [33], the extraterrestrial spectrum (atlas plus modtran) and the default aerosol model [34].
The maximum TOA radiance () is then calculated with an albedo of 1, simulating maximum reflectance, which resembles the effect of thick clouds. In this scenario, can be set to 0. The minimum TOA reflectance () corresponds to surface albedo under clear-sky conditions and is calculated using the CAMS broadband forecast albedo. In this clear-sky scenario, can be set to 1.0.
Based on these boundary conditions, a linear interpolation between the two points (, 1) and (, 0) is performed (detailed information see Appendix B). As illustrated in Figure 2 the measured TOA radiance for the pixel is then used to compute the value from the linear fit as:
2.4. UV Index Map Generation
For the generation of the final UV Index maps , first a clear-sky UV Index map is generated from the lookup table using total column ozone data — either measurements from OMI for retrospective analyses or CAMS forecasts for nowcasting — alongside surface albedo and aerosol forecasts from CAMS as inputs. Details about the preprocessing steps of CAMS data necessary to obtain Angstrom as well as surface albedo estimates valid for the UV wavelength range are discussed in Section 2.2. Once all input data for are available, clear-sky UV Index maps can be calculated for the entire day ahead. After receiving MSG SEVIRI images every 15 minutes, the cloud modification factor map () is calculated and, by a simple multiplication with , transformed into the final UV Index map .
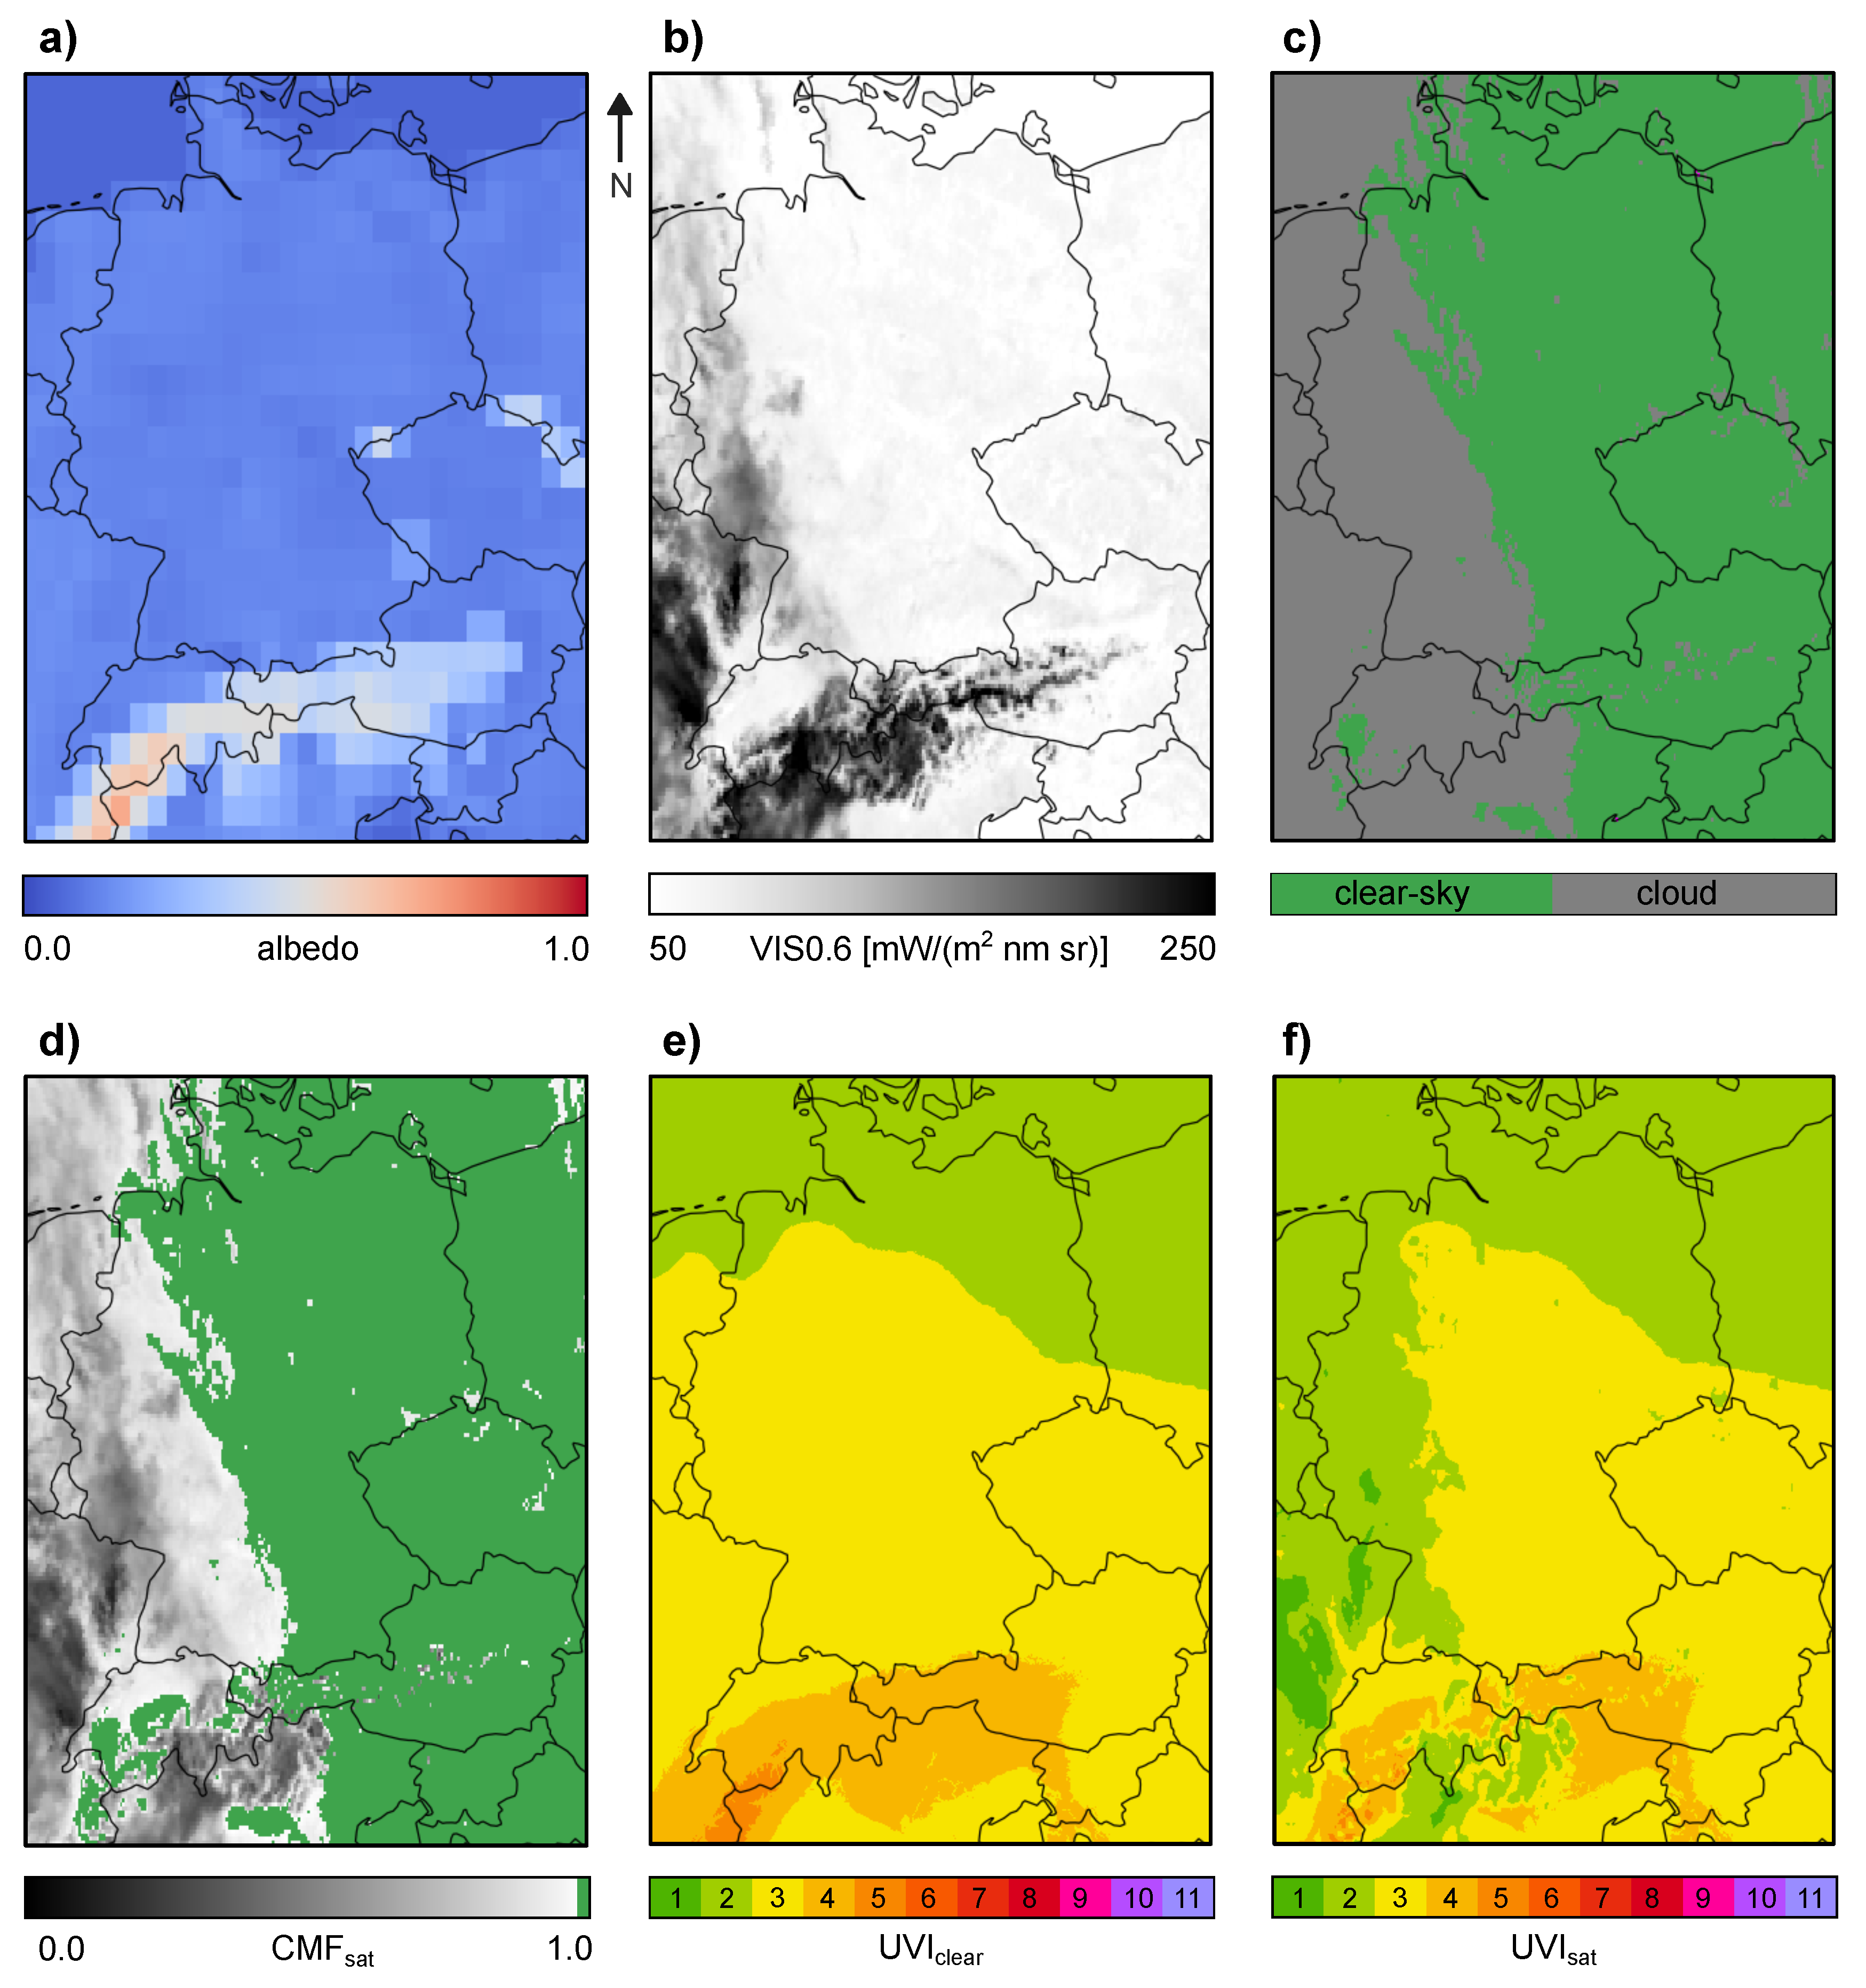
In Figure 3 an example of the data involved in the determination of the final UV Index map for a summer day at noon (2022-06-24 at 12:00 pm UTC) is depicted. The input data from CAMS forecast albedo (a) is homogeneously low in summer. A cloud formation covering most of the DACH region dominates the MSG VIS0.6 µm channel (b) and the Cloud Mask (c), which leads to reduced values in the cloud-covered areas (d). The calculated clear-sky map (e) and the final UV Index map (f) are displayed following the colour coding for UV Index presentations defined by WHO/WMO [15]. For the DACH area the UV Index typically reaches levels between 6 and 11 at noon in summer for clear-sky conditions, where the highest values (UVI 11) can be found at high altitudes in the alpine region. The substantial effect of clouds reducing the UV radiation reaching the Earth’s surface can be seen in the final UV Index map (f).
A second example for winter conditions can be found in Appendix C, where the increase in surface albedo especially in the alpine region due to snow cover can be seen nicely.
3. Results
Ground-based UV Index measurements of 27 sites in the DACH area are compared to the corresponding satellite-derived UV Index map pixel values. Although satellite-derived and ground-measured UV Index values specify the same physical quantity, their spatial and temporal scopes are different. The satellite-derived map value represents an average over the pixel for a certain point in time. In contrast, ground-based UVI measurements are strongly dependent on the actual cloud situation (especially for broken cloud conditions) and on localized surface albedo and they are often averaged over time. Moreover, nearby obstacles or the horizon (especially in mountainous areas) have an impact on the ground measurements.
For the statistical analyses, the homogenized ground measurements (10 minute averages) from 2022 were temporally interpolated to align with the acquisition schedule of MSG satellite data, which is used to assess cloud cover. The ground-based data is then compared to corresponding values from the satellite-derived UV Index maps () by selecting the pixels that encompass the ground station locations.
The greatest temporally variable influence of all atmospheric parameters on the UV Index is cloud cover. So, for the following analysis the dataset is divided into values measured and calculated under clear-sky conditions and those under cloudy conditions using the filtering method outlined in Section 2.1.1.
3.1. Comparison of Ground-Based Measurements and Satellite-Derived UV Index Maps for Clear-Sky Conditions
When comparing satellite-derived and ground-measured UV Index data for clear-sky conditions, there can be discrepancies due to the uncertainties in the ground-based measurements (calibration uncertainties) or the radiative transfer model calculations (LUT) used to determine the clear-sky UV Index maps. The latter are strongly dependent on the quality of the model input parameters used and their ability to represent the local conditions influencing the ground-based measurements. Moreover, uncertainties arise from the filtering method used to identify data points corresponding to cloud-free conditions.
For the statistical evaluation shown in Figure 4, the ratio of measured to calculated UV Index () is derived for each point in time and then grouped in solar elevation bands with a width of 10° starting at 20° solar elevation. For each subset the median value (black dot), 25% and 75% percentiles (black) and 5% and 95% percentiles (grey) are depicted.
In general the results of the spectral measurements in Germany (two-letter site acronyms) show the best agreement between measurement and model with almost no dependency on solar elevation. The ratio of most broadband data from Germany (four-letter acronyms) and from Austria and Switzerland (three-letter acronyms) exhibit a solar elevation dependency. Median values are lower for lower solar elevations where data gathered in and around winter dominate the statistics, whereas the agreement is better for higher solar elevations (summer data). This dependency is not apparent in the median values from the northernmost sites TODO and ZIRC, but becomes increasingly pronounced when examining the southern sites. As previously mentioned in Section 2.1, data from November, December, and January 2022 were excluded from the statistical evaluation of these two sites due to the low solar elevations in winter, which did not meet the 20° cut-off.
To determine whether the observed decrease in the ratio of ground-measured to satellite-derived UV Index values with decreasing solar elevation is related to the broadband measurements, comparisons were conducted. Broadband measurements from DAV and KIR were evaluated against spectrally resolved measurements obtained using a double-monochromator Brewer instrument (MKIII B163) at DAV and a Bentham double-monochromator (DTM300) at KIR. The results demonstrate strong agreement between the broadband and spectrally resolved measurements, with no indication of solar elevation affecting the accuracy of the broadband measurements.
The sites in the South are located predominantly in the alpine region with much more pronounced topography compared to the North. Here, especially in winter, the impact of small-scale snow cover on the ground-based measurements is significant, but can not be taken into account due to the coarse resolution of the CAMS albedo forecast. To eliminate the impact of winter albedo data on the statistics, all data points with a corresponding CAMS broadband surface albedo higher than 0.2 (summer cut-off) were excluded leading to the new statistics presented in Figure 4 with median, 5% and 95% percentiles in blue. The blue statistics correspond to the same solar elevation bands as the black statistics but are slightly offset to the right in Figure 4 to enhance clarity.
For the northern stations, CAMS predicts little to no snow cover, except for FIBG, which is situated at a higher altitude (1215 m a.s.l.) compared to most other German sites. For the alpine stations in the South the statistics improve, especially for the high mountain stations SON, WFJ and DAV but not for the high mountain station ZS.
Discrepancies between satellite-derived and ground-measured UV Index arise from uncertainties in the calibration of the ground-based measurements (see Section 2.1) and from the clear-sky model calculations, with the latter primarily due to uncertainties in input parameters. CAMS albedo and AOD parameters are not only forecasted data but also need to be adapted to better fit for UV Index calculations (see Section 2.2). Moreover, changing atmospheric conditions for aerosol and ozone during the course of a day are not taken into account, as only one input value per day is used in the calculations. The same applies to surface albedo which can change during a day due to snowfall or snow melt. Therefore, significant discrepancies may occur on individual days, but no systematic effect is anticipated in the data comparison over the course of the year 2022.
To reduce uncertainties in the comparison between ground-measured and satellite-derived UV Index values due to the impact of the horizon on ground-based measurements, data corresponding to solar elevations below 20° are omitted in the analysis. Nevertheless, an uneven horizon reduces the diffuse radiation measured by the detector for all solar elevations. This effect is strongest for low solar elevations as in this regime the proportion of diffuse radiation is higher than for larger solar elevations. The horizon-dependent reduction of the diffuse radiation cannot be detected by satellite imagery leading to discrepancies between ground-based and satellite-derived UV Index values. On top of that, a major issue is the comparison of ground measurements that are sensitive to very local conditions with UV Index maps based on satellite imagery resulting in mean values valid for pixel-sized areas (discussion see Section 4).
Although the results shown in Figure 4 are less favourable, particularly for the lower solar elevation bands, the absolute difference between the satellite-derived and ground-measured UV Index is small as can be seen in Appendix D.
3.2. Comparison of to
Next we discuss cloudiness which has a great impact on ground-based UV Index measurements. While clouds typically reduce solar radiation at the ground, broken cloud formations can sometimes enhance UV radiation at the Earth’s surface due to backscattering [35,36]. Such cloud structures can not be adequately represented by which is a mean value over a pixel with the size of approximately 4 km×6 km. Moreover, is limited to 1, so enhancements of UV radiation can not be reproduced. For broken cloud conditions and in mountainous areas the cloud situation affecting the ground-based measurements is changing rapidly with time. Such short-time changes can not be captured by satellite data which provides snapshots every 15 minutes.
In Figure 5 scatter plots of ground-measured cloud modification factors ( / ) to satellite-derived are shown for all sites and all-sky conditions. The correlation of both quantities is between 0.8 and 0.9 for the lower altitude sites and lower for the high altitude sites ZS (0.68), SON (0.57), WFJ (0.69) and DAV (0.78).
The uncertainties of arise partly from the calibration uncertainties of the ground-based measurements (see Section 2.1) and the stability of the measurement devices. Additionally, the limitations of satellite-derived input data (especially albedo) to adequately represent local conditions result in clear-sky UV Index data that capture the conditions at the ground only to a certain extent.
The low representativeness of albedo also affects the calculation, where erroneously high albedo means that the interval between the minimum () and maximum () irradiance shrinks, leading to higher uncertainties in the CMF (Equation (2)). Also, for higher albedo values the method of modelling with a linear fit becomes less accurate as described in Appendix B.
Under broken cloud conditions, discrepancies between satellite-derived and ground-based cloud modification factors can become more pronounced. Significant differences arise when gaps in cloud cover allow direct solar radiation to reach the detector, while satellite imagery interprets the scene as a uniform cloud layer, thereby underestimating . Conversely, small clouds blocking the sun from the detector but being undetected by satellite imagery also lead to increased differences. Due to the pixel averaging small scale or inhomogeneous clouds cannot be resolved by the satellite, leading to poor skill in detection of broken cloud conditions as well [37]. The discrepancy between the concept of highly localized point measurements and satellite-derived mean values over pixel-sized areas is most pronounced for high-altitude locations with complex, rapidly changing cloud climatology leading to the low correlation found for these sites.
3.3. Comparison of Ground-Based Measurements and Satellite-Derived UV Index Data for all-Sky Conditions
When assessing the concordance between satellite-derived and ground-measured UV Index values across all-sky conditions (both clear and cloudy), the uncertainty is considerably influenced by the climatology of cloudiness. As illustrated in Appendix A the proportion of measurements with and without cloud cover is about 66% across all sites throughout the year 2022. Most stations are close to this average. Therefore the impact of cloudiness on the statistics for all-sky conditions is very similar for all sites except for FIBG (see discussion later in this section).
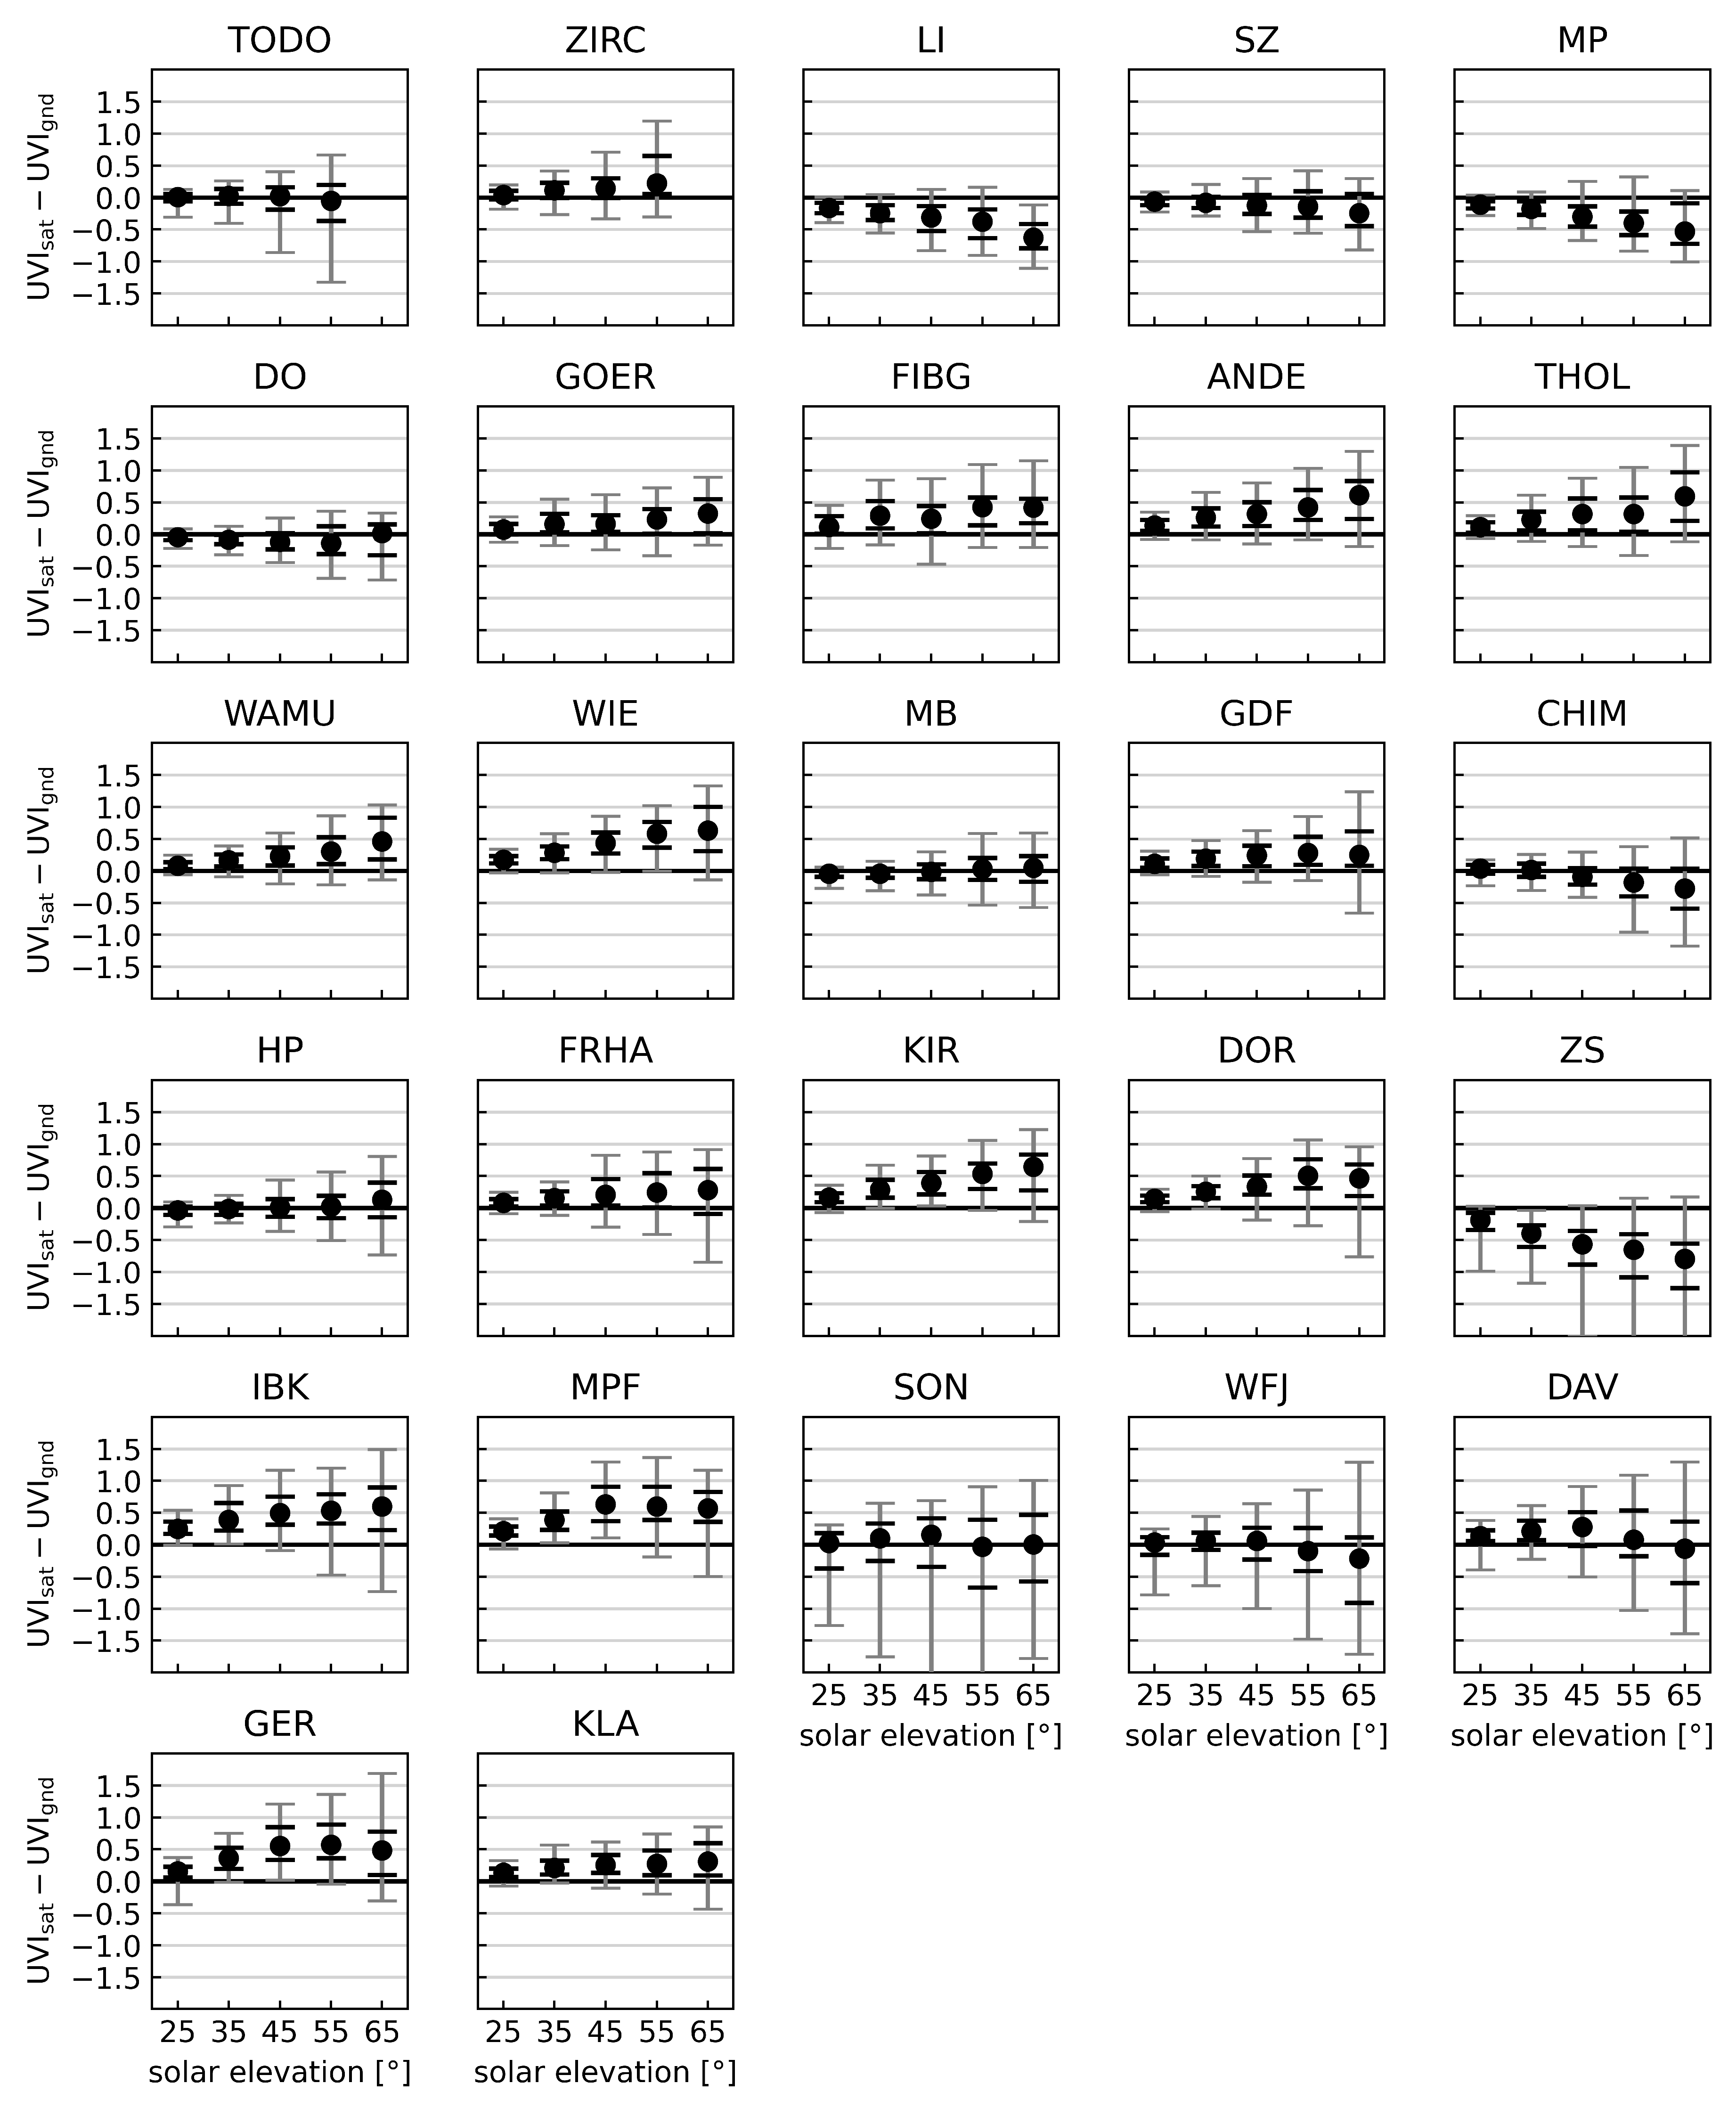
In Figure 6 the median value (black dots), 5% and 95% (grey) and 25% and 75% (black) percentiles of the difference of satellite-derived to ground-measured UV Index () evaluated for 10° wide solar elevation bands is depicted for all sites and all-sky conditions.
Naturally, the differences are small for low solar elevations since the UV Index values are also small under these conditions. The differences get higher with higher solar elevations and for most sites the satellite-derived UV Index is overestimating the ground-based measurement as displayed in Table 3 (mean difference). The most pronounced underestimation is found for ZS, where the satellite-derived values are on average 0.54 UVI (see Table 3) smaller than the ground measurements for clear-sky conditions. This can be explained by an underestimation of surface albedo by the CAMS model input as discussed in Section 4.
The interquartile range (25th–75th percentiles) and the 90% range (5th–95th percentiles) increase with the altitude of the site, with the highest ranges for SON (3109 m a.s.l.), but also the results for FIBG, ZS, DAV, WFJ and GER (all situated between 1215 m.a.s.l. and 2660 m a.s.l.) are increased compared to the lower altitude sites.
To analyse the overall performance of the satellite-derived UV Index the mean values of and the percentage of satellite-derived data within UVI (U0.5) and within UVI (U1.0) compared to the ground-based measurement is given in Table 3 for clear-sky and all-sky conditions. On average the satellite-derived UV Index maps do overestimate the ground-based UV Index by some tenth except for some stations in the North (TODO, LI, SZ, MP, DO) and the high mountain station ZS in the South. In general, the results in Table 3 deteriorate from North to South for both clear-sky and all-sky conditions with the worst percentages found for the high mountain stations ZS and SON.
For clear-sky conditions more than 95% of data are well within U1.0 for most sites except for some in the South with the minimum percentages found for ZS (86.3%) and SON (85.9%). The percentages drop for U0.5 (clear-sky) and show more spread from North to South with the lowest value for ZS of 59%.
The all-sky statistics are significantly impacted by uncertainties associated with cloudiness affecting the UV Index. The results for U1.0 are about 93% for the northern stations (except for FIBG) and drop to lower values in the South with the lowest values again for ZS (75.7%) and SON (74.8%). Also for U0.5, ZS and SON show the lowest percentages with 51.1% (ZS) and 52.9% (SON) and again the results are better for the more northern stations.
The results of FIBG for all-sky conditions are remarkable. The stations GOER, FIBG and ANDE are close in latitude, so their data cover the same period of the year due to the 20° cut-off in solar elevation. GOER and ANDE are located at low altitudes (238 m and 76 m a.s.l) whereas FIBG is situated at a low mountain range at 1215 m a.s.l.. All three sites show very similar results for the comparison of ground-based to satellite-derived clear-sky UV Index (see Figure 4) and consequently their results for U0.5 and U1.0 for clear-sky conditions are also close together. However, this is not true for the percentages for all-sky conditions in Table 3. Here, the results of FIBG are about 10% lower than those from the other two stations. This is due to the greater impact of cloudiness on the statistics of FIBG with 78% cloudy measurements compared to GOER with 69% and ANDE with only 63% of measurements with cloudy conditions. Moreover, the correlation coefficient of to is slightly lower for FIBG (0.82) than for ANDE (0.85) and GOER (0.87) adding to the decrease in U0.5 and U1.0 for the FIBG data set.
4. Discussion
For comprehensive and area-wide information on health-relevant UV Index values or erythemal irradiance, satellite-based calculations are indispensable. Satellite data provide the significant advantage of covering extensive areas, enabling the creation of UV Index maps. Depending on the application of the data or the scientific questions to be answered, the averaging of the data over pixel-sized areas can be beneficial. However, this comes with limitations, such as the loss of small-scale variations within the pixel area. Moreover, satellite imagery is capturing data for single points in time (snapshots).
When comparing satellite-derived and ground-measured UV Index for clear-sky conditions, discrepancies can occur for various reasons. There are uncertainties in both datasets, for example in case of ground-based measurements due to calibration uncertainties or stability issues of the detectors between calibrations. The accuracy of the satellite-derived UV Index values, which are mainly determined by radiative transfer model calculations, strongly depends on the quality of the model input parameters used and their ability to represent the local conditions influencing the ground-based measurements. Moreover, uncertainties of the satellite products (SEVIRI visible channel VIS0.6 µm and the Cloud Mask) used for the CMF calculation reduce the accuracy of the satellite-derived UV Index maps for cloudy conditions. As a result, the resolution of satellite data used to calculate UV Index maps becomes a significant factor when comparing satellite-derived and ground-measured UV Index values.
In Figure 7 map sections for all measurement sites (red dot) with the location and size of the respective pixels used in the UV Index map generation process are depicted. The input data for the clear-sky LUT from CAMS (surface albedo and AOD) have a resolution of 0.4° (approximately 29 km×44 km) (orange). In contrast, OMI total column ozone data offer a finer resolution of 0.25° (approximately 18 km×28 km) (green). Satellite data from MSG are used to calculate the cloud modification factor with a resolution of 0.05° (approximately 4 km×6 km) (blue).
The topography (grey shading in Figure 7) becomes increasingly pronounced as latitude decreases. In the North, the stations TODO (5 m a.s.l.) and ZIRC (30 m a.s.l.) which are located in the coastal region of the Baltic Sea, have relatively flat terrain. Southwards, the landscape rises significantly in the alpine region, where the highest station (SON) is located at an altitude of 3106 m a.s.l..
Some measurement sites are situated so closely that they fall within the same pixel: FRHA in Germany and DOR in Austria share the same CAMS pixel (marked with *). Additionally, DAV and WFJ in Switzerland are close enough to share not only the CAMS pixel but also the smaller OMI pixel (marked with **).
Ground-based UV Index measurements are significantly affected by local conditions such as surface albedo and atmospheric conditions like cloudiness. Consequently, modelling UV Index data from satellite imagery to accurately reflect ground-based measurements poses significant challenges, particularly in complex terrain. This process relies on input parameters that accurately represent the local environment, which is not a strong suit of satellite data due to its inherent limitations in capturing small-scale cloudiness and localized features like surface albedo.
Especially the surface albedo needed for the simulation of the alpine stations when parts of the terrain are covered by snow cannot be accurately represented by a mean value over a rather large CAMS pixel size. For example, for the stations IBK and KIR situated in the Inn Valley at much lower altitudes than the average CAMS pixel altitude covering high mountain areas, the surface albedo value is overestimated leading to median values in the ratio of ground-measured to satellite-derived UV Index for clear-sky conditions below 0.9 (see Figure 4) which is well outside the uncertainty of the detector calibrations (±7%). When omitting the data points corresponding to higher surface albedos (snow cover) the results improve (black versus blue statistics in Figure 4).
The CAMS pixel corresponding to the high-altitude station ZS encompasses a roughly equal mix of mountainous and lower-altitude regions near the edge of the Alps. This composition leads to an underestimation of surface albedo, which in turn results in low values for at this station. Consequently, the median ratio of ground-measured to satellite-derived UV Index values shown in Figure 4 is notably high, around 1.1 for ZS. When omitting the data points corresponding to high CAMS surface albedo values (blue statistics) the underestimation becomes evident because there are no data omitted for higher solar elevation bands (no blue statistics for solar elevations of 50° and higher) suggesting that there is no snow cover outside the winter season. However, this observation is not realistic for the high-altitude station ZS (altitude 2660 m a.s.l.), which is situated in the Alps below the summit of Mount Zugspitze and above a seasonal snowfield. A comparison of the CAMS broadband surface albedo data for ZS and HP (Hohenpeissenberg, located at 977 m a.s.l. in the Alpine foothills to the north-east of ZS) further underscores this discrepancy. Despite the substantial altitude difference, the CAMS data show nearly identical snow-free periods: April 5 to December 10, 2022, for HP and April 10 to November 21, 2022, for ZS. Moreover, unlike to the other high-mountain sites, no improvement is observed in the comparison of black and blue statistics for ZS. This is because a significantly larger number of data points should be classified as winter data, and thus should be excluded for the determination of the blue statistics.
The result for WFJ in Figure 4 (black and blue statistics) is slightly better than those for DAV, suggesting that the CAMS surface albedo (same CAMS pixel for both sites) is better suited to describe the situation for the station WFJ located at an altitude of 2540 m a.s.l.. As shown in Figure 7, the CAMS pixel covers high mountain terrain with almost no lower altitude areas and is therefore overestimating the surface albedo for Davos (DAV) located in the valley at 1610 m a.s.l.. Also, the measurement site’s location in the valley results in a horizon that reduces the amount of diffuse radiation reaching the detector. When assuming isotropic radiation, this horizon effect has been quantified for DAV as a 5.4% reduction in diffuse radiation. This reduction is more pronounced at lower solar elevations, where diffuse radiation constitutes a larger proportion of the total radiation compared to higher solar elevations. Since the horizon effect is not accounted for in the calculation of the UV Index maps, overestimates ground-based measurements across all solar elevations, with the discrepancy being most significant at lower solar elevations (see blue statistics in Figure 4).
Both effects lead to a mean overestimation of the differences between satellite-derived and ground-based UV Index for clear-sky conditions for DAV of 0.15 UVI compared to WFJ with a slight underestimation of -0.08 UVI (see Table 3). This shows, that in fact a site-specific adaption (depending on topography) of the CAMS broadband surface albedo to the UV wavelength range (see Section 2.2) as well as the consideration of the site-specific horizon effect would be necessary to reduce the discrepancies between ground-measured and satellite-derived UV Index values.
When cloudy conditions are included in the analysis, additional uncertainties arise from two main sources: the determination of the cloud modification factor (CMF) through the linear fitting process and the limitations of satellite data (resolution approximately 4 km×6 km) in detecting small-scale clouds. The impact of the latter depends on the cloud situation. For an overcast sky the limitations due to the satellite pixel resolution are less distinct than for broken cloud conditions over less pronounced terrain and become even more impactful when the cloud situation at high altitude sites is considered. Here, the rugged terrain leads to localized cloud dynamics with rapidly changing cloud conditions that cannot be resolved spatially or temporally by satellite imagery. This leads to a significant decrease in the percentages of U0.5 and U1.0 for the all-sky case compared to the clear-sky values for the sites in the Alps, especially for the high mountain stations ZS, SON and WFJ, but also for DAV, GER and FIBG (not in the Alps but on a low mountain range in Germany) and to a lesser extent to all other (low altitude) sites (see Table 3).
The best agreement between ground-based and satellite-derived UV Index data is observed at the stations MB and SZ, which are both located at low altitudes and in relatively flat terrain. According to the CAMS broadband surface albedo there were hardly any snow events at these two stations in the year 2022. At both sites spectral measurements with low calibration uncertainties () are performed and in the comparison between ground-based and satellite-derived UV Index data for clear-sky conditions no dependency on solar elevation is found (see Figure 4). Also, the correlation between and is high with 0.9 at MB and 0.88 at SZ (see Figure 5) leading to the highest percentages for U0.5 (83.9% for MB and 84.6% for SZ ) and U1.0 (95.7% for MB and 95.5% for SZ) for all-sky conditions (see Table 3).
5. Conclusions
In this study, the method of nowcasting UV index maps for Europe as used within the Austrian Solar UV Measurement Network is presented. To nowcast the UV Index maps, first clear-sky UV Index maps are retrieved from a pre-calculated lookup table (LUT) of erythemally weighted UV radiation by employing forecasted data of total column ozone, surface albedo and aerosol optical depths from the CAMS global model forecast. To incorporate the effects of clouds in the model, a cloud modification factor map is derived from SEVIRI imagery, which is recorded every 15 minutes onboard the MSG satellites. With this method nowcasted UV Index maps are calculated every 15 minutes and published timely on the website www.uv-index.at together with ground-based measurements to increase awareness and improve public health measures [38].
The separation of the UV index into a clear-sky model and the cloud contribution in the form of a modification factor is widely employed [10,11,13,14,39,40], because clouds introduce the highest variability in UV index [41], whereas the clear-sky UV index can be predicted very well with radiative transfer models if information on total column ozone, aerosol, and surface albedo is available in sufficient quality.
By comparing ground-based measurements of 27 stations in the area of Germany, Austria and Switzerland to the corresponding map pixel values the representativeness of the satellite-derived UV Index maps is assessed. For the comparison, ground-based data from the year 2022 are employed and the satellite-derived UV Index maps are generated in retrospect by using measured total column ozone data from OMI instead of forecasted ozone values from CAMS.
The analysis of the percentages of UVI differences (satellite-derived minus ground-measured UVI) being within UVI (U0.5) and UVI (U1.0) (see Table 3) for clear-sky conditions show a North-South gradient with better agreement for the northern stations. This is attributed to the less complex topography compared to the alpine region in the South. On one hand, UV Index measurements at the Earth’s surface are highly influenced by local factors such as surface albedo and cloudiness. On the other hand, the calculated UV Index maps are derived from satellite imagery, which is constrained by its resolution and cannot capture small-scale conditions accurately. The CAMS surface albedo data average over 29 km×44 km sized pixels and therefore cannot resolve the surface albedo situation in mountainous areas with small-scale snow cover (see Figure 7).
When considering cloudy conditions the uncertainty of the CMF determination due to the linear fitting as well as the poor skill in detecting small-scale clouds with satellite imagery (4 km×6 km pixel size) is added, leading to lower percentages in U0.5 and U1.0 for all sites compared to the clear-sky case. This effect of cloudiness and especially broken clouds on the statistics is most pronounced for the high mountain stations and decreases with site altitude.
In conclusion, satellite-derived UV Index maps provide area-wide data that enable the deduction of effective protective measures, as recommended by the World Health Organization (WHO, [15]). These maps complement ground-based measurements effectively, with high accuracy especially for regions with low to moderate altitudes and increased uncertainties for high altitudes. Since ground-based measurements of the UV Index are restricted locally in their validity, the next step is to explore potential synergies between ground-based measurements and satellite-derived maps. The objective is to investigate opportunities for combining ground-based measurements with satellite-derived maps, thereby benefiting from the high accuracy of ground measurements alongside the extensive coverage provided by satellite data. Additionally, integrating data from the Meteosat Third Generation (MTG) satellites, once available, into the CMF calculations is anticipated to reduce uncertainties. This improvement stems from the enhanced spatial and temporal resolution of the MTG satellite imagery, allowing for a more detailed representation of cloudy conditions.
Author Contributions
Conceptualization, B.K., R.G., A.K., V.S., J.S. and S.L.; Data curation, B.K., S.L., J.G., G.H. and R.G.; Formal analysis, B.K. and R.G.; Funding acquisition, A.K.; Investigation, B.K., R.G., V.S. and M.S.; Methodology, B.K., R.G., A.K., V.S. and M.S.; Software, B.K., R.G., V.S. and M.S.; Supervision, A.K.; Validation, B.K., R.G., V.S., M.S., J.S., S.L., J.G., G.H. and A.K.; Visualization, B.K., R.G. and V.S., Writing–original draft preparation, B.K. and R.G.; Writing – review and editing, B.K., R.G., V.S., M.S., J.S., S.L. and A.K.
Funding
The project "Measurement and Analysis of Solar UV Radiation in Austria" (Austrian Solar UV Measurement Network) is supported by a grant from the Federal Ministry for Climate Action, Environment, Energy, Mobility, Innovation and Technology (BMK).
Data Availability Statement
The measurements of the Austrian Solar UV Measurement Network are available on request as of the publishing date. Recent UV index time series and current maps of Europe can be viewed at www.uv-index.at.
Acknowledgments
The authors thank Mario Blumthaler for valuable discussions and suggestions on all aspects of the study. The authors thank the Meteorological Observatories Lindenberg and Hohenpeissenberg of the German National Meteorological Service (DWD) for providing ground measurements of the stations Lindenberg and Hohenpeissenberg, the Federal Institute for Occupational Safety and Health (BAuA) for providing ground measurements of the station Dortmund and the Leibniz Institute for Tropospheric Research (TROPOS) for providing ground measurements of the station Melpitz. This publication uses Copernicus Atmosphere Monitoring Service Information [2023]; neither the European Commission nor ECMWF is responsible for any use that may be made of the information it contains.
Conflicts of Interest
The authors declare no conflicts of interest. The funders had no role in the design of the study; in the collection, analyses, or interpretation of data; in the writing of the manuscript; or in the decision to publish the results.
Abbreviations
The following abbreviations are used in this manuscript:
| AOD | Aerosol Optical Depth |
| CAMS | Copernicus Atmospheric Monitoring Service |
| CMF | Cloud Modification Factor |
| DACH | Germany, Austria and Switzerland |
| LUT | Lookup Table |
| MSG | Meteosat Second Generation satellites |
| MTG | Meteosat Third Generation satellites |
| OMI | NASA’s Ozone Monitoring Instrument |
| PMOD/WRC | Physical Meteorological Observatory in Davos / World Radiation Center |
| PTB | Physikalisch-Technische Bundesanstalt |
| TOA | Top Of Atmosphere |
| UV | Ultraviolet |
| UVI | UV Index |
Appendix A. Proportion of Measurements Taken Under Cloudy Versus Clear-Sky Conditions
Figure A1.
The proportion of measurements representing clear and cloudy conditions for each site (from North to South). The orange line indicates the mean proportion at 66%. The largest portion of cloudy measurements is found at FIBG with 78%, whereas the lowest amount of clouds is found at DOR with 59% closely followed by FRHA with 60%.
Appendix B. Analysis of Linear Fitting in the CMF sat Calculation
The choice of using a linear fitting within the calculation in this publication is based on simulations using the libRadtran model for various cloud scenarios [17,18].
We simulated the TOA radiance at 635 nm, corresponding to the MSG visible channel VIS0.6 µm, alongside the surface-level radiation at 300 nm. The 635 nm wavelength is highly sensitive to the reflectance of clouds and surface albedo, while the 300 nm represents the UV radiation reaching the surface. Below, we analyse the relationship between these two parameters under varying cloud and surface albedo scenarios.
First, we examined the relationship for a homogeneous water cloud layer and varying surface albedo. The cloud layer was defined between 2 km and 3 km altitude, with a droplet radius of 10 µm and a liquid water content (LWC) ranging from 0.0 to 3 . A clear-sky condition is represented by an LWC of zero. The is then calculated as the ratio of the 300 nm radiance under cloudy conditions to that under clear-sky conditions. Thus, the is derived as the ratio of the surface radiance at 300 nm for various LWCs to the clear-sky radiance value (LWC equals 0). Figure A2 a) shows the TOA radiance at 635 nm plotted against the at the surface for solar zenith angles (SZA) of 30°, 45°, and 60°, with surface albedo ranging from 0.1 to 0.9 (in 0.1 increments). For surface albedos below 0.5, the relation can be approximated as linear.
To further validate, we extended the analysis to various water cloud configurations (Table A1 (# 1 - 5)) with a fixed surface albedo of 0.1 (see Figure A2 b)). The results confirm the robustness of the linear relationship across different cloud thicknesses and droplet compositions. This demonstrates that for homogeneous water clouds, regardless of their specific cloud composition, the linear relationship between 635 nm TOA radiance and remains consistent.
In Figure A2 c) the same analysis is performed for ice clouds (Table A1 (# 6 - 8)). Here, the linear relationship is less applicable, whereas a quadratic fit provides a better approximation.
Our analysis indicates that the linear relationship holds well for surface albedos below 0.5, specifically in scenarios involving water clouds. Based on CAMS broadband surface albedo data from 2022, 97% of the broadband surface albedo values for the selected DACH region are below 0.4.
However, in high-albedo environments (high-altitude, snow-covered regions) or in the presence of ice clouds, this model becomes less accurate, and alternative approaches such as a quadratic fit may be considered if cloud-type data is available as demonstrated in e.g. Jesus et al. [13].
Figure A2.
a) Simulation of a homogenous cloud layer and varying surface albedo between 0.1 and 0.9 in 0.1 steps, for SZAs 30°, 45° and 60°. Linear fits have been added. b) Simulation results of several water clouds (see Table A1), for the same SZAs and a fixed surface albedo of 0.1. Linear fits have been added. c) Simulation result of several ice clouds (see Table A1), for the same SZAs and a fixed surface albedo of 0.1. Quadratic fittings have been added.
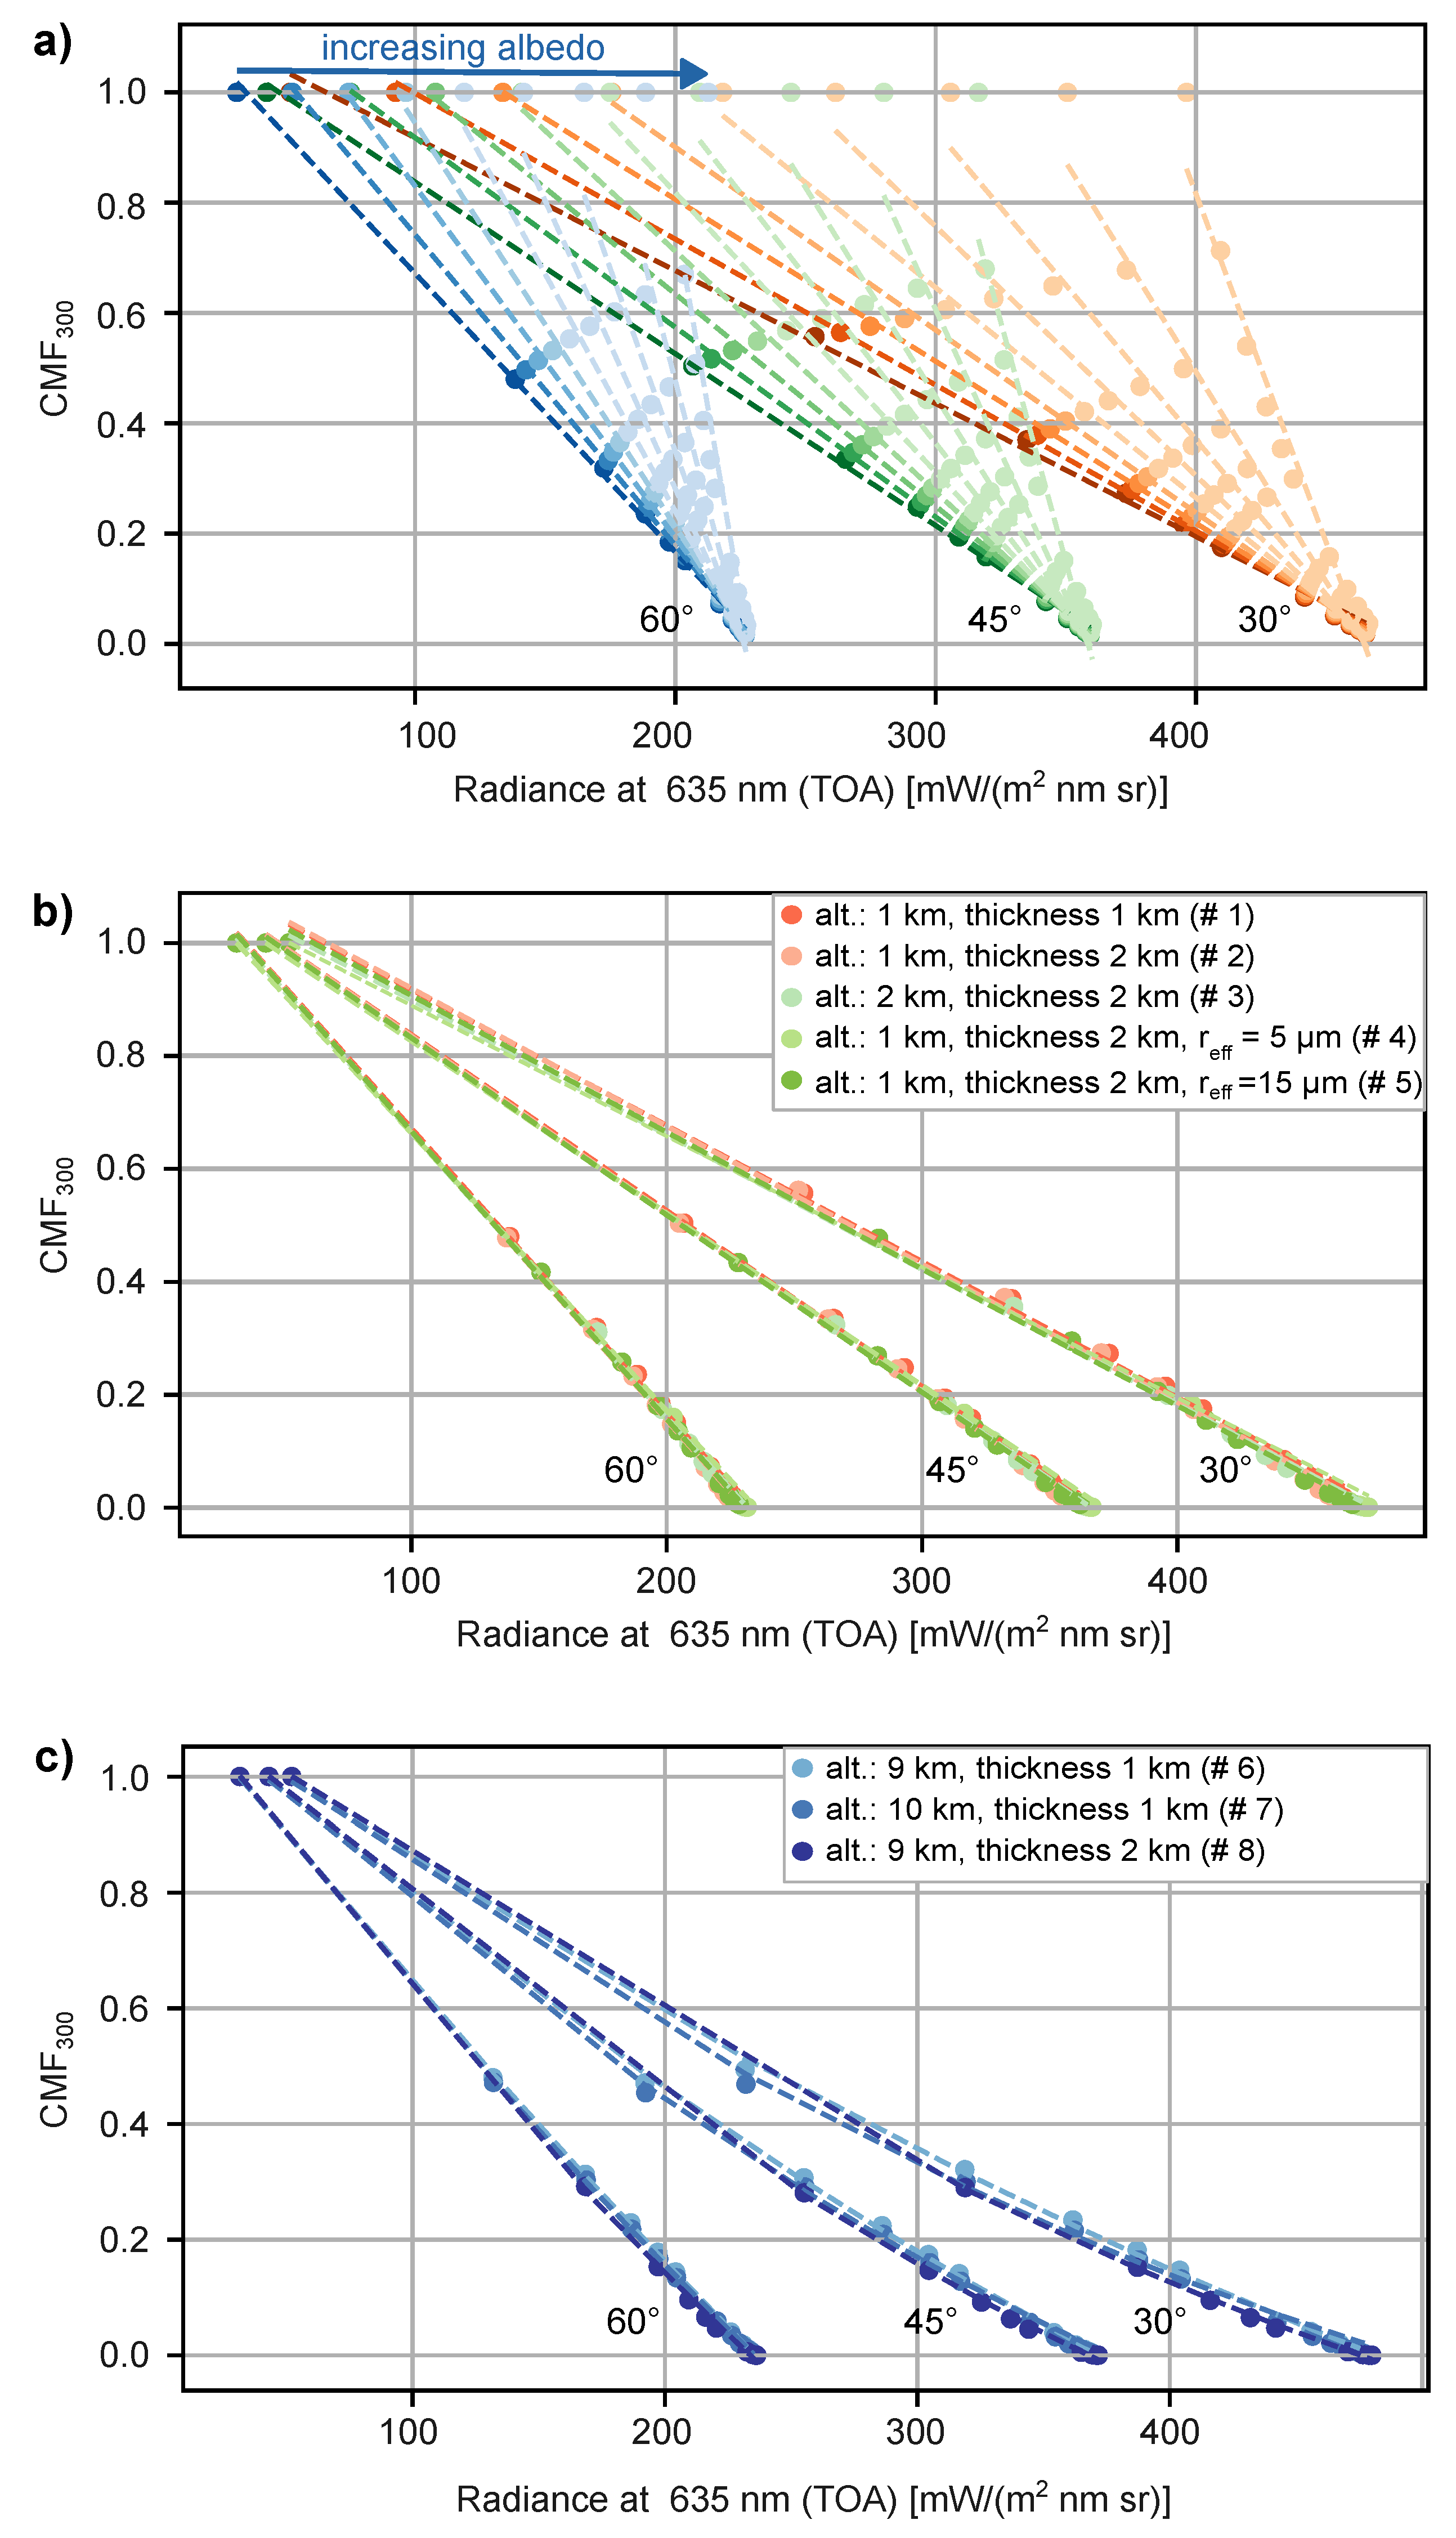

Table A1.
Overview of the different cloud scenarios used for the simulations.
| # | Type | Altitude | Thickness | Droplet Radius | Liquid / Ice Water Content |
|---|---|---|---|---|---|
| 1 | Water Cloud | 1 km | 1 km | 10 µm | (0 - 3) |
| 2 | Water Cloud | 2 km | 1 km | 10 µm | (0 - 3) |
| 3 | Water Cloud | 2 km | 2 km | 10 µm | (0 - 3) |
| 4 | Water Cloud | 2 km | 2 km | 5 µm | (0 - 3) |
| 5 | Water Cloud | 2 km | 2 km | 15 µm | (0 - 3) |
| 6 | Ice Cloud | 9 km | 1 km | 20 µm | (0 - 4.5) |
| 7 | Ice Cloud | 10 km | 1 km | 20 µm | (0 - 4.5) |
| 8 | Ice Cloud | 9 km | 2 km | 20 µm | (0 - 4.5) |
Appendix C. UVI Nowcasting Map Example for 2022-03-12
Figure A3.
Example for the UVI nowcasting map, calculated for 2022-03-12 at 12:00 pm (UTC) for the DACH region (longitude 5.2°E - 17.2°E, latitude 45.2°N - 55.2°N). In a) - c) the input data are shown, where a) is the CAMS forecast surface albedo, b) is the MSG VIS0.6 µm channel and c) is the Cloud Mask. The calculated and maps are displayed in sub-figures d) and e), respectively. The final UV Index map considering clouds is shown in f).
Appendix D. Differences of Satellite-Derived and Ground-Measured UVI Data for Clear-Sky Conditions
Figure A4.
Median (black dot), 5% and 95% (grey) and 25% and 75% (black) percentiles of the difference of satellite-derived to ground-based UV Index data () evaluated for 10° wide solar elevation bands for all 27 sites (from North to South) and for clear-sky conditions.
Figure A4.
Median (black dot), 5% and 95% (grey) and 25% and 75% (black) percentiles of the difference of satellite-derived to ground-based UV Index data () evaluated for 10° wide solar elevation bands for all 27 sites (from North to South) and for clear-sky conditions.
References
- Webb, A.R.; Engelsen, O. Calculated Ultraviolet Exposure Levels for a Healthy Vitamin D Status. Photochem. Photobiol 2006, 82, 1697–703. [Google Scholar] [CrossRef]
- Webb, A.R.; Kift, R.; Berry, J.L.; Rhodes, L.E. The Vitamin D Debate: Translating Controlled Experiments into Reality for Human Sun Exposure Times. Photochem. Photobiol 2011, 87, 741–745. [Google Scholar] [CrossRef]
- Madronich, S.; Bernhard, G.; Neale, P.; Heikkilä, A.; Andersen, M.; Andrady, A.; Aucamp, P.; Bais, A.; Banaszak, A.; Barnes, P.; et al. Continuing benefits of the Montreal Protocol and protection of the stratospheric ozone layer for human health and the environment. Photochem. Photobiol. Sci. 2024, 23. [Google Scholar] [CrossRef]
- Lucas, R.; McMichael, T.; Smith, W.; Armstrong, B. Solar Ultraviolet Radiation: Global burden of disease from solar ultraviolet radiation. WHO Environmental Burden of Disease Series 2006, 13. [Google Scholar]
- Juzeniene, A.; Brekke, P.; Dahlback, A.; Andersson-Engels, S.; Reichrath, J.; Moan, K.; Holick, M.F.; Grant, W.B.; Moan, J. Solar radiation and human health. Reports on Progress in Physics 2011, 74, 066701. [Google Scholar] [CrossRef]
- Bais, A.F.; Bernhard, G.; McKenzie, R.L.; Aucamp, P.J.; Young, P.J.; Ilyas, M.; Jöckel, P.; Deushi, M. Ozone–climate interactions and effects on solar ultraviolet radiation. Photochem. Photobiol. Sci. 2019, 18, 602–640. [Google Scholar] [CrossRef] [PubMed]
- Bornman, J.F.; Barnes, P.W.; Robson, T.M.; Robinson, S.A.; Jansen, M.A.K.; Ballaré, C.L.; Flint, S.D. Linkages between stratospheric ozone, UV radiation and climate change and their implications for terrestrial ecosystems. Photochem. Photobiol. Sci. 2019, 18, 681–716. [Google Scholar] [CrossRef] [PubMed]
- Bernhard, G.H.; Neale, R.E.; Barnes, P.W.; Neale, P.J.; Zepp, R.G.; Wilson, S.R.; Andrady, A.L.; Bais, A.F.; McKenzie, R.L.; Aucamp, P.J.; et al. Environmental effects of stratospheric ozone depletion, UV radiation and interactions with climate change: UNEP Environmental Effects Assessment Panel, update 2019. Photochem. Photobiol. Sci. 2020, 19, 542–584. [Google Scholar] [CrossRef] [PubMed]
- Lorenz, S.; Heinzl, F.; Bauer, S.; Janßen, M.; De Bock, V.; Mangold, A.; Scholz-Kreisel, P.; Weiskopf, D. Increasing solar UV radiation in Dortmund, Germany: data and trend analyses and comparison to Uccle, Belgium. Photochem. Photobiol. Sci. 2024, 23, 2173–2199. [Google Scholar] [CrossRef]
- Verdebout, J. A method to generate surface UV radiation maps over Europe using GOME, Meteosat, and ancillary geophysical data. J. Geophy. Res. 2000, 105, 5049–5058. [Google Scholar] [CrossRef]
- Schallhart, B.; Blumthaler, M.; Schreder, J.; Verdebout, J. A method to generate near real time UV-Index maps of Austria. Atmospheric Chemistry and Physics 2008, 8, 7483–7491. [Google Scholar] [CrossRef]
- Kosmopoulos, P.G.; Kazadzis, S.; Schmalwieser, A.W.; Raptis, P.I.; Papachristopoulou, K.; Fountoulakis, I.; Masoom, A.; Bais, A.F.; Bilbao, J.; Blumthaler, M.; et al. Real-time UV index retrieval in Europe using Earth observation-based techniques: system description and quality assessment. Atmospheric Measurement Techniques 2021, 14, 5657–5699. [Google Scholar] [CrossRef]
- Jesus, H.; Coelho Costa, S.; Ceballos, J.; Corrêa, M. Cloud modification factor parametrization for solar UV based on the GOES satellite: Validation using ground-based measurements in São Paulo city, Brazil. Atmospheric Environment 2023, 309, 119942. [Google Scholar] [CrossRef]
- Papachristopoulou, K.; Fountoulakis, I.; Bais, A.F.; Psiloglou, B.E.; Papadimitriou, N.; Raptis, I.P.; Kazantzidis, A.; Kontoes, C.; Hatzaki, M.; Kazadzis, S. Effects of clouds and aerosols on downwelling surface solar irradiance nowcasting and short-term forecasting. Atmospheric Measurement Techniques 2024, 17, 1851–1877. [Google Scholar] [CrossRef]
- WHO/WMO. Global solar UV index: a practical guide; World Health Organization, 2002. A joint recommendation of the World Health Organization, World Meteorological Organization, United Nations Environment Programme, and the International Commission on Non-Ionizing Radiation Protection.
- Blumthaler, M. Quality assurance and quality control methodologies used within the Austrian UV monitoring network. Radiation Protection Dosimetry 2004, 111, 359–362. [Google Scholar] [CrossRef]
- Mayer, B.; Kylling, A. Technical note: The libRadtran software package for radiative transfer calculations - description and examples of use. Atmospheric Chemistry and Physics 2005, 5, 1855–1877. [Google Scholar] [CrossRef]
- Emde, C.; Buras-Schnell, R.; Kylling, A.; Mayer, B.; Gasteiger, J.; Hamann, U.; Kylling, J.; Richter, B.; Pause, C.; Dowling, T.; et al. The libRadtran software package for radiative transfer calculations (version 2.0.1). Geoscientific Model Development 2016, 9, 1647–1672. [Google Scholar] [CrossRef]
- CAMS. CAMS global atmospheric composition forecasts. https://ads.atmosphere.copernicus.eu/cdsapp#!/dataset/cams-global-atmospheric-composition-forecasts?tab=overview, 2021. Last accessed 2022/12/12.
- Hogan, R. Radiation Quantities in the ECMWF model and MARS, 2015.
- Koelemeijer, R.B.A.; de Haan, J.F.; Stammes, P. A database of spectral surface reflectivity in the range 335–772 nm derived from 5.5 years of GOME observations. J. Geophys. Res. 2003, 108, 4070. [Google Scholar] [CrossRef]
- Blumthaler, M.; Ambach, W. Solar UVB Albedo of Various Surfaces. Photochem. Photobiol 1988, 48, 85–88. [Google Scholar] [CrossRef] [PubMed]
- Sliney, D.H. Physical Factors in Cataractogenesis: Ambient Ultraviolet Radiation and Temperature. Investig. Ophthalmol. Vis. Sci. 1986, 27, 781–790. [Google Scholar]
- Heisler, G.M.; Grant, R.H. Ultraviolet radiation in urban ecosystems with consideration of effects on human health. Urban Ecosyst. 2000, 4, 193–229. [Google Scholar] [CrossRef]
- Gesch, D.B.; Verdin, K.L.; Greenlee, S.K. New land surface digital elevation model covers the Earth. Eos, Trans. AGU 1999, 80, 69–70. [Google Scholar] [CrossRef]
- de Vries, J.; Voors, R.; Dirksen, R.; Dobber, M. In-orbit performance of the ozone monitoring instrument. In Proceedings of the Sensors, Systems, and Next-Generation Satellites IX; Meynart, R.; Neeck, S.P.; Shimoda, H., Eds. International Society for Optics and Photonics, SPIE, 2005, Vol. 5978, p. 59780T. [CrossRef]
- EUMETSAT. MSG Level 1.5 Image Data Format Description. EUMETSAT, 2017. Doc.No. EUM/MSG/ICD/105, Issue v8 e-signed.
- Schmetz, J.; Pili, P.; Tjemkes, S.; Just, D.; Kerkmann, J.; Rota, S.; Ratier, A. An Introduction to Meteosat Second Generation (MSG). Bulletin of the American Meteorological Society 2002, 83, 977–992. [Google Scholar] [CrossRef]
- EUMETSAT. MSG Meteorological Products Extraction Facility Algorithm Specification Document. EUMETSAT, 2015. Doc.No. EUM/MSG/SPE/022, Issue v7B e-signed.
- Pyresample developers. https://pyresample.readthedocs.io/en/latest/concepts/resampling.html, 2013–2024. last accessed: 2024/11/14.
- SciPy developers. https://docs.scipy.org/doc/scipy/index.html, 2008–2024. last accessed: 2024/11/14.
- Stamnes, K.; Tsay, S.C.; Wiscombe, W.; Jayaweera, K. Numerically stable algorithm for discrete-ordinate-method radiative transfer in multiple scattering and emitting layered media. Appl. Opt. 1988, 27, 2502–2509. [Google Scholar] [CrossRef] [PubMed]
- Anderson, G.P.; Clough, S.A.; Kneizys, F.X.; Chetwynd, J.H.; Shettle, E.P. AFGL Atmospheric Constituent Profiles (0-120 km). Technical Report 86-0110, Air Force Geophysics Laboratory (U.S.), Optical Physics Division, Hanscom AFB, MA, 1986. Environmental Research Papers (U.S. Air Force Geophysics Laboratory); No. 954.
- Shettle, E.P. Models of Aerosols, Clouds, and Precipitation for Atmospheric Propagation Studies. AGARD Conference Proceedings 1989, No.454.
- Pfister, G.; McKenzie, R.L.; Liley, J.B.; Thomas, A.; Forgan, B.W.; Long, C.N. Cloud Coverage Based on All-Sky Imaging and Its Impact on Surface Solar Irradiance. Journal of Applied Meteorology and Climatology 2003, 42, 1421–1434. [Google Scholar] [CrossRef]
- Calbó, J.; Pagès, D.; González, J.A. Empirical studies of cloud effects on UV radiation: A review. Reviews of Geophysics 2005, 43. [Google Scholar] [CrossRef]
- Werkmeister, A.; Lockhoff, M.; Schrempf, M.; Tohsing, K.; Liley, B.; Seckmeyer, G. Comparing satellite- to ground-based automated and manual cloud coverage observations – a case study. Atmospheric Measurement Techniques 2015, 8, 2001–2015. [Google Scholar] [CrossRef]
- Heckman, C.J.; Liang, K.; Riley, M. Awareness, understanding, use, and impact of the UV index: A systematic review of over two decades of international research. Preventive Medicine 2019, 123, 71–83. [Google Scholar] [CrossRef]
- Chubarova, N.; Feister, U.; Kaurola, J.; Kazantzidis, A.; Krzycin, J.; Lindfors, A.; den Outer, P.N.; Slaper, H. Staiger, H.; J., V.; Walker, D. Long term changes and climatology of UV radiation over Europe. Cost action 726 – final scientific report, Publications Office of the European Union, 2012.
- Lakkala, K.; Kujanpää, J.; Brogniez, C.; Henriot, N.; Arola, A.; Aun, M.; Auriol, F.; Bais, A.F.; Bernhard, G.; De Bock, V.; et al. Validation of the TROPOspheric Monitoring Instrument (TROPOMI) surface UV radiation product. Atmospheric Measurement Techniques 2020, 13, 6999–7024. [Google Scholar] [CrossRef]
- He, H.; Fioletov, V.E.; Tarasick, D.W.; Mathews, T.W.; Long, C. Validation of Environment Canada and NOAA UV Index Forecasts with Brewer Measurements from Canada. Journal of Applied Meteorology and Climatology 2013, 52, 1477–1489. [Google Scholar] [CrossRef]
Figure 1.
Locations of the measurement sites in Germany, Austria and Switzerland with the topography indicated by grey shading and marker colours referring to the site altitude.
Figure 1.
Locations of the measurement sites in Germany, Austria and Switzerland with the topography indicated by grey shading and marker colours referring to the site altitude.
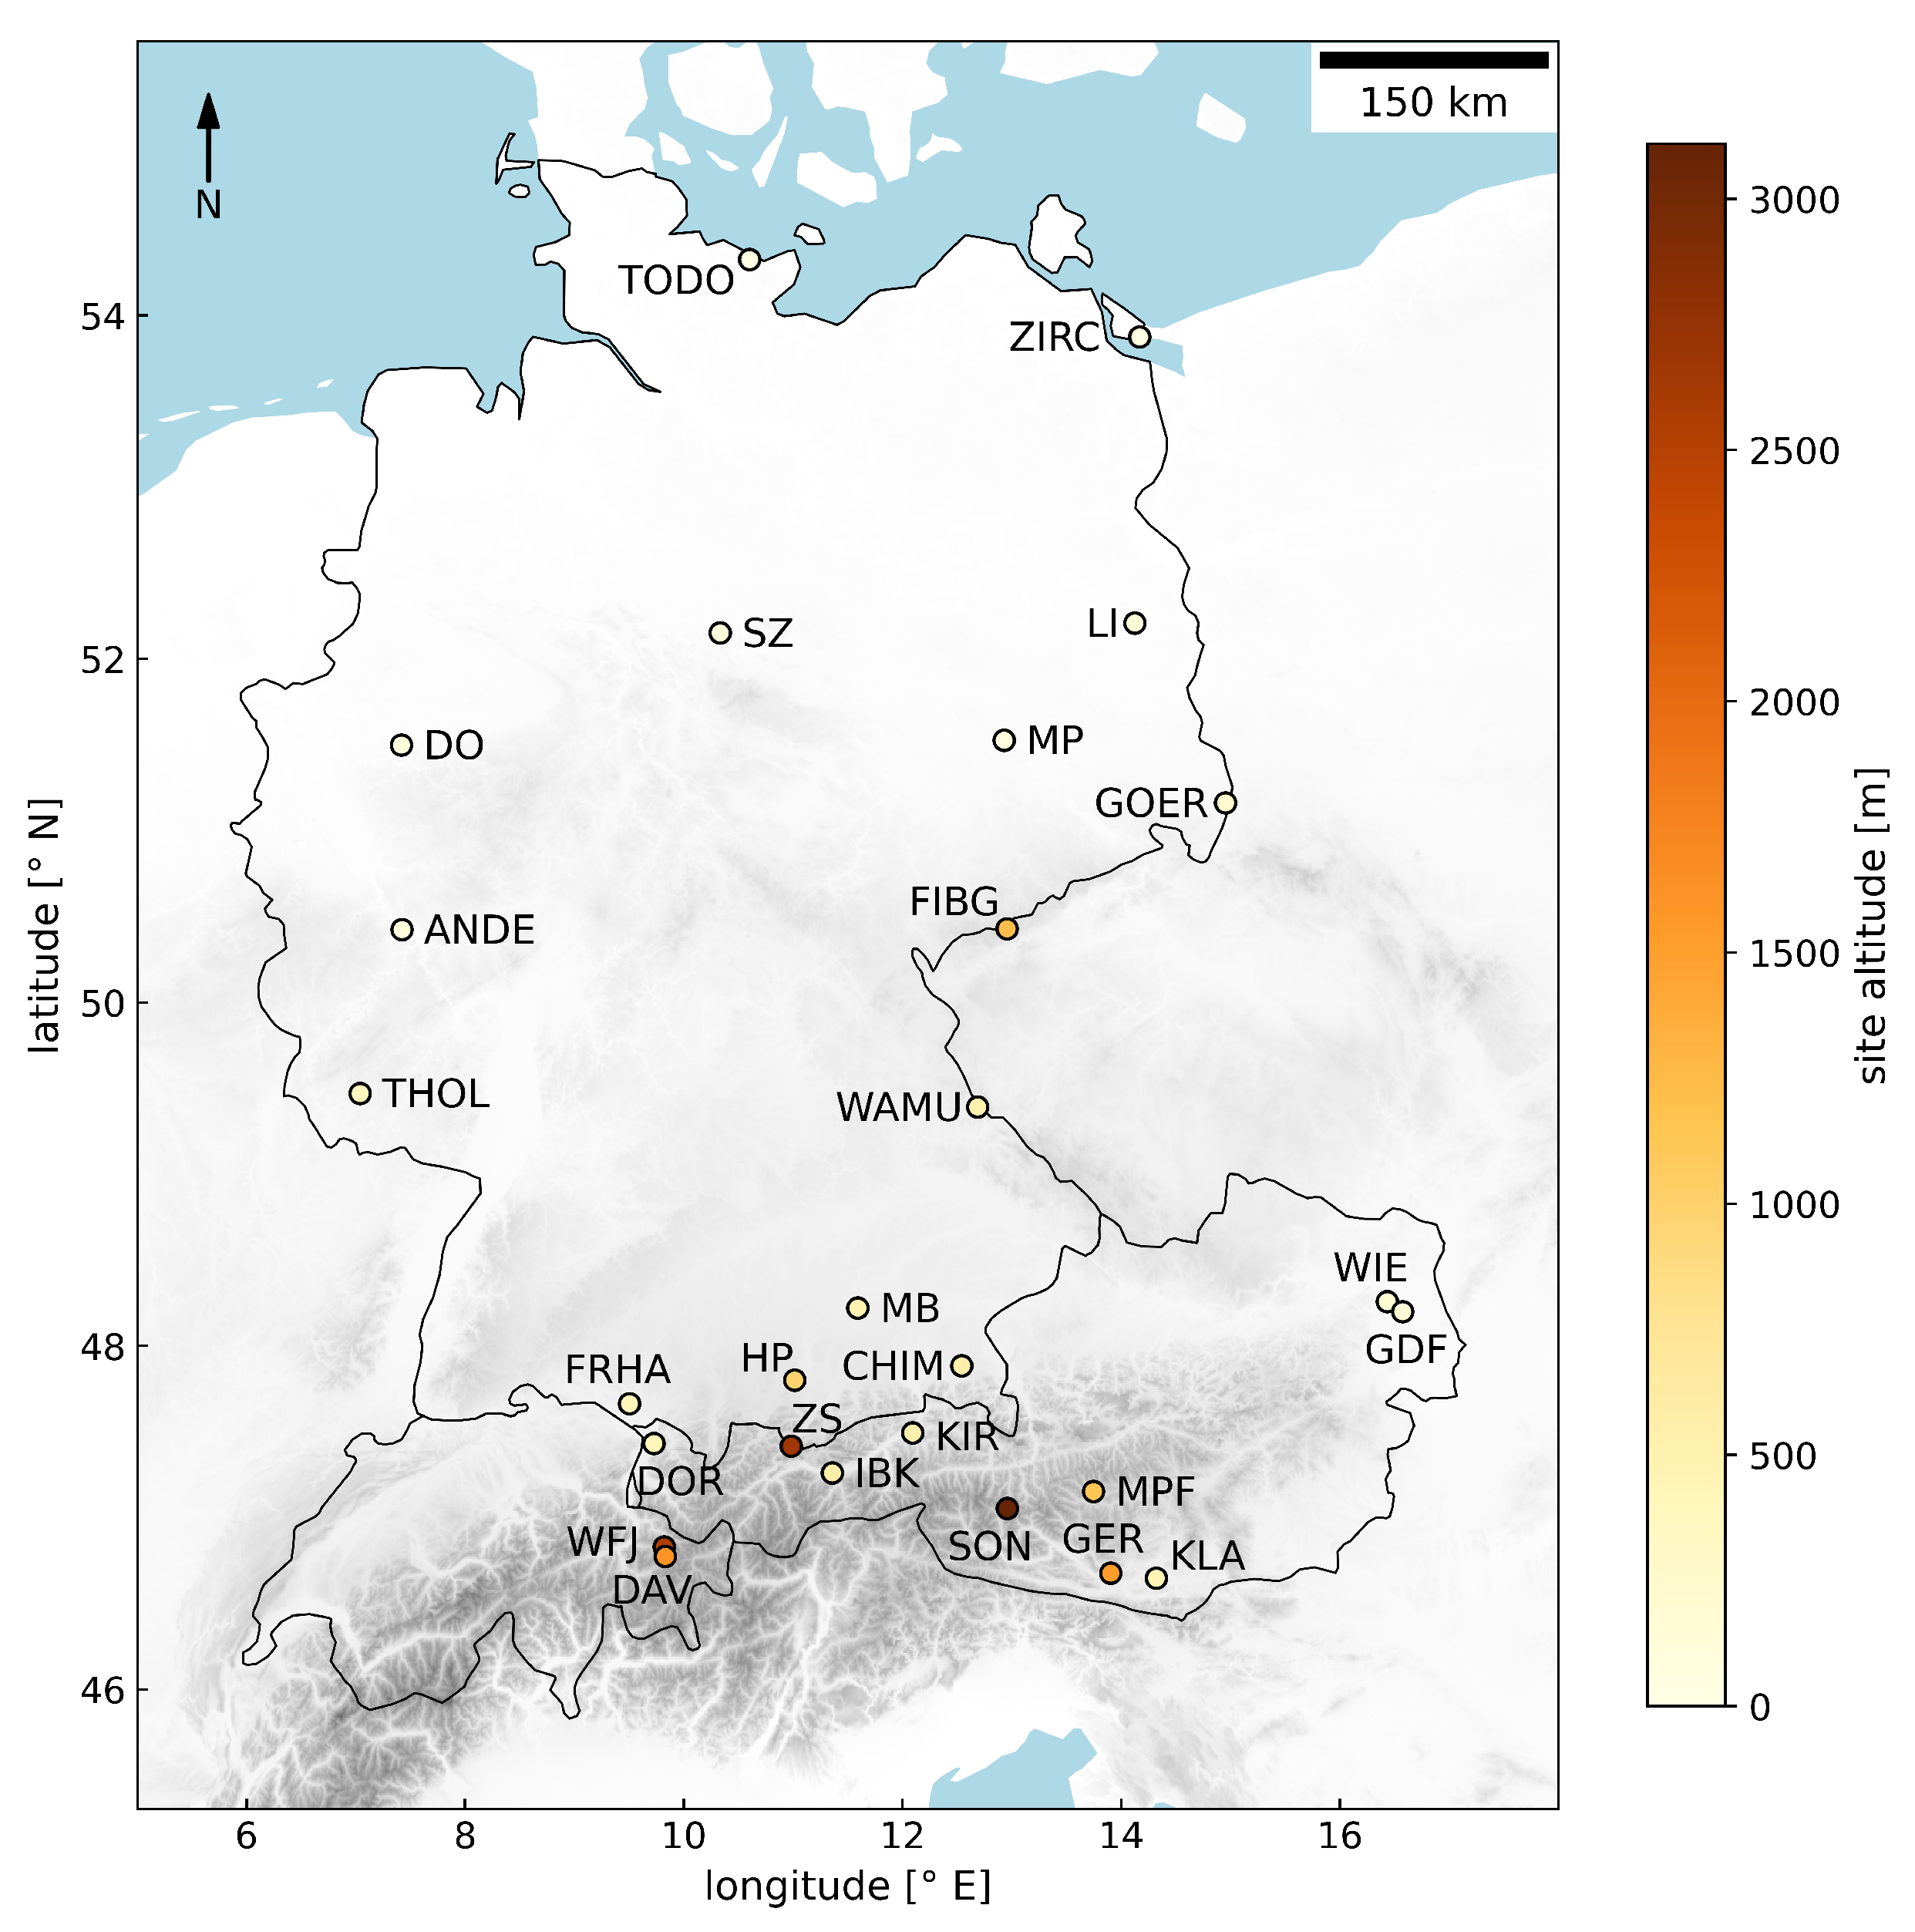
Figure 2.
The minimum () and maximum TOA radiance () for each cloudy pixel and geometry are calculated. Using the measured radiance from the MSG satellite every 15 minutes, the cloud modification factor is determined by a linear interpolation.
Figure 2.
The minimum () and maximum TOA radiance () for each cloudy pixel and geometry are calculated. Using the measured radiance from the MSG satellite every 15 minutes, the cloud modification factor is determined by a linear interpolation.
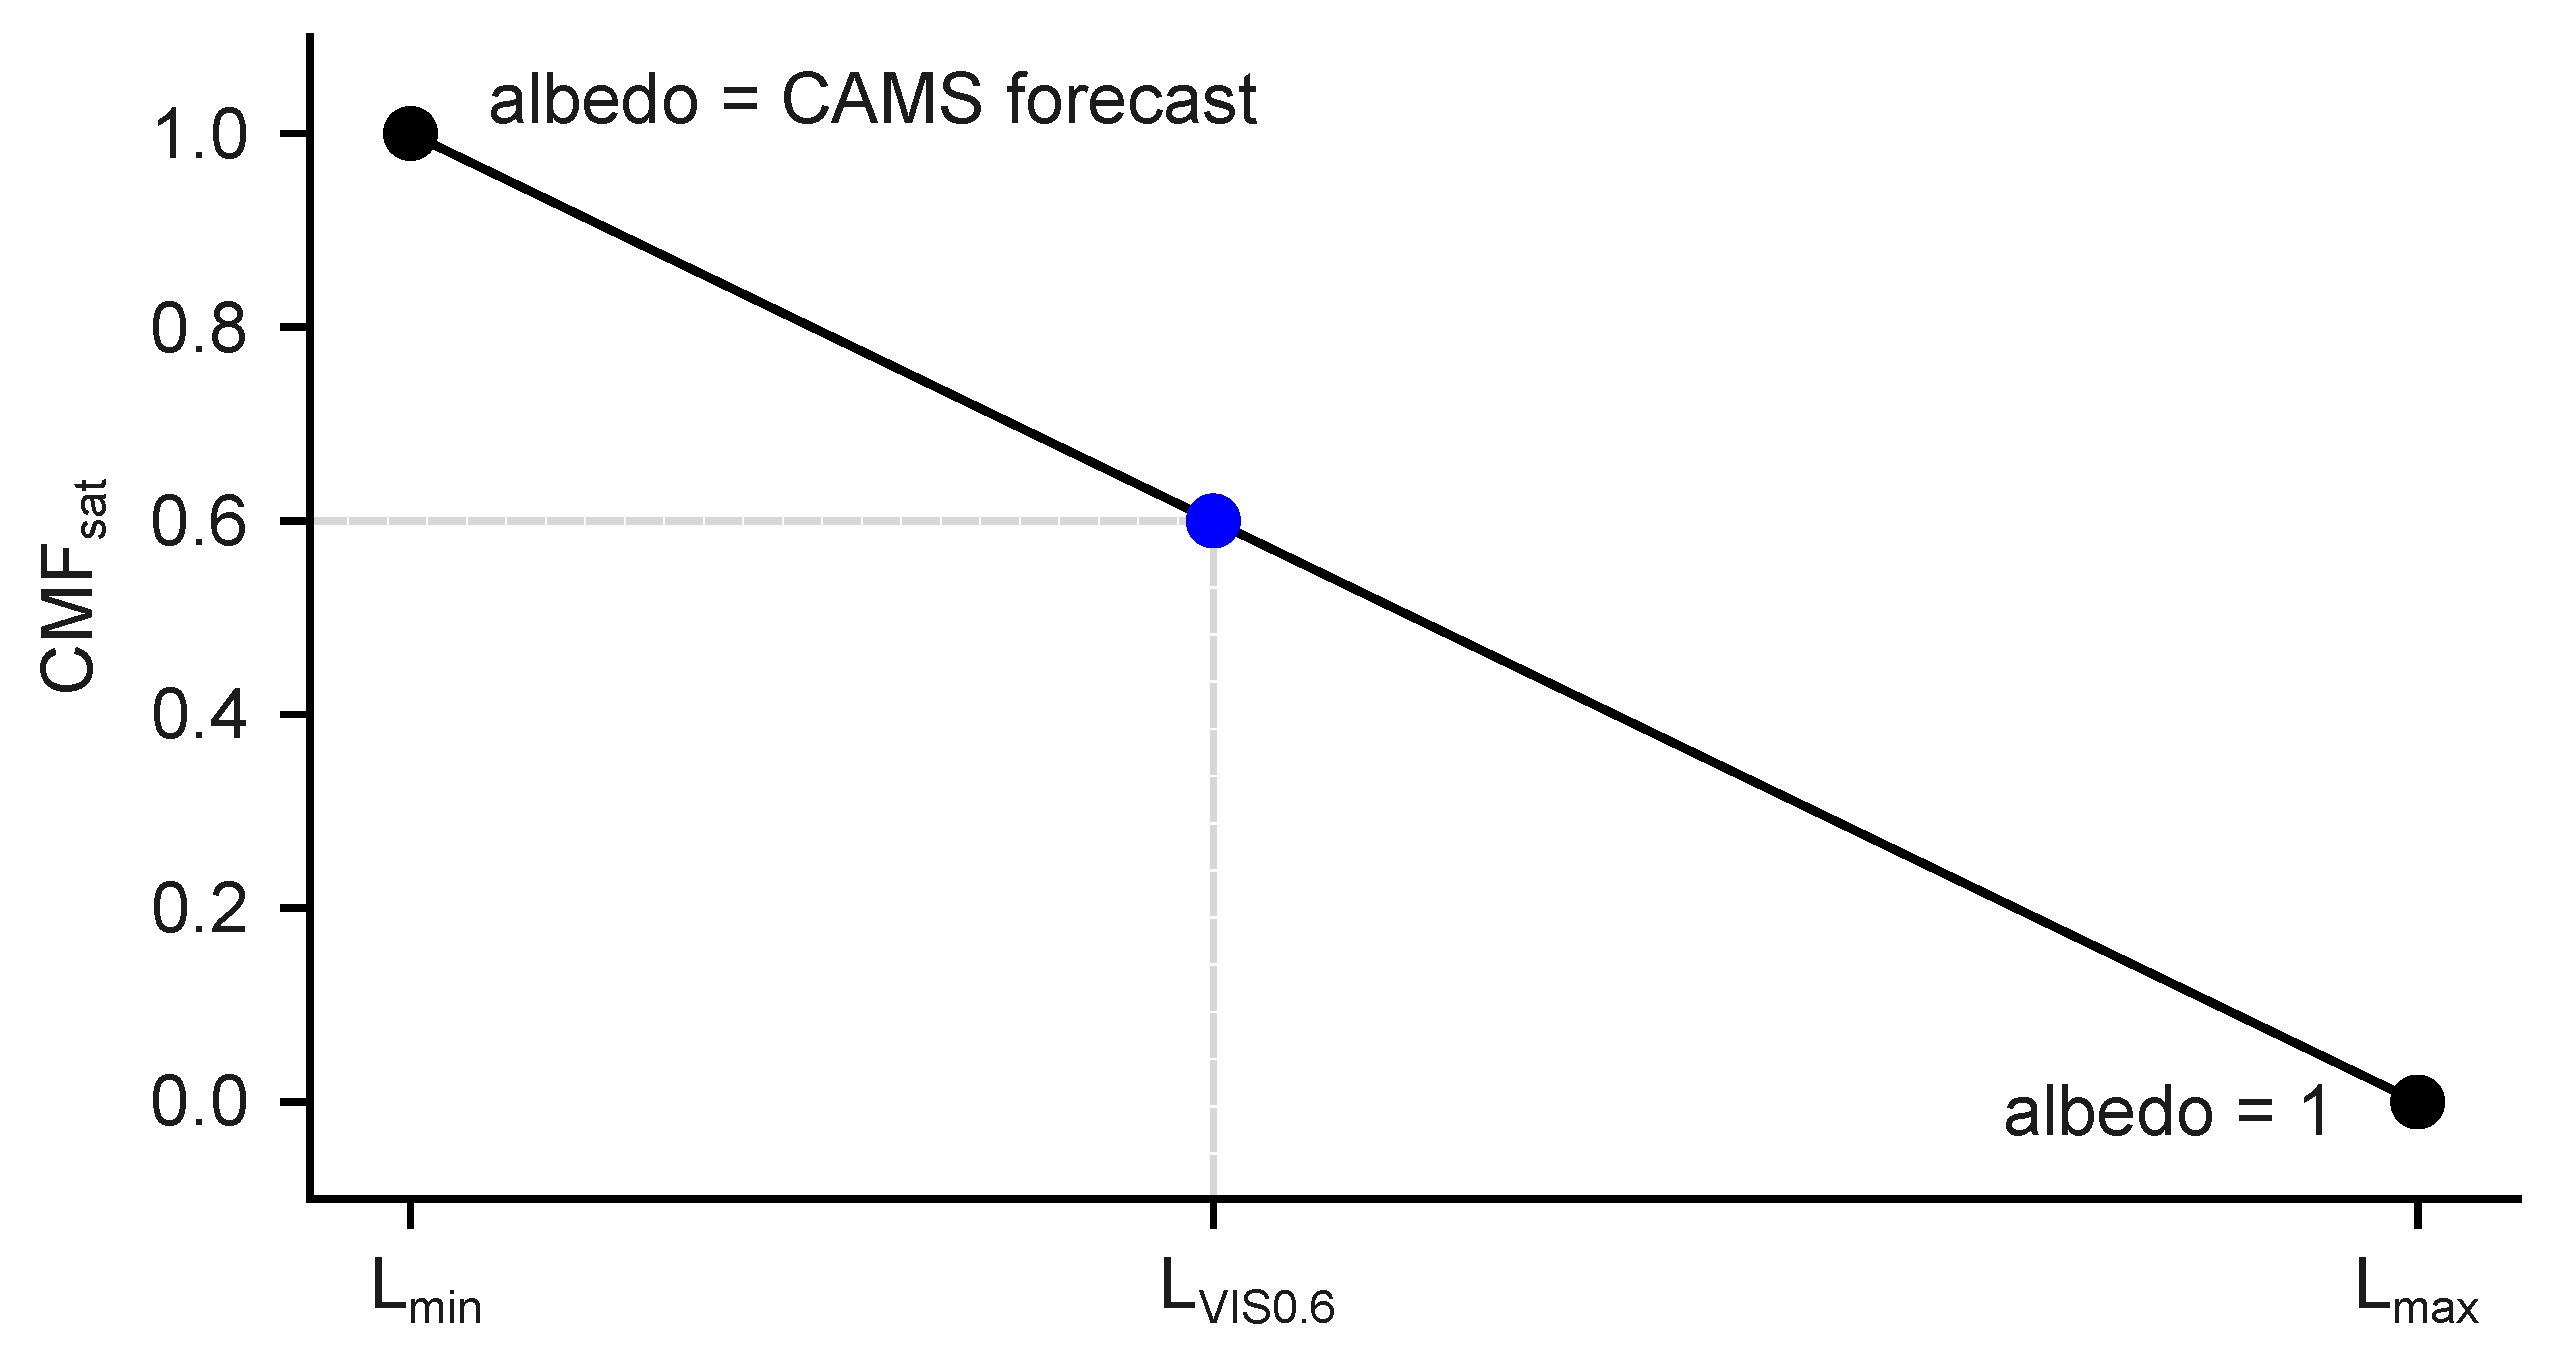
Figure 3.
Example for the UVI nowcasting map, calculated for 2022-06-24 at 12:00 pm (UTC) for the DACH region (longitude 5.2°E - 17.2°E, latitude 45.2°N - 55.2°N). In a) - c) the input data are shown, where a) is the CAMS forecast surface albedo, b) is the MSG VIS0.6 µm channel and c) is the Cloud Mask. The calculated and maps are displayed in sub-figures d) and e), respectively. The final UV Index map considering clouds is shown in f). A second example for winter conditions is provided in Appendix C.
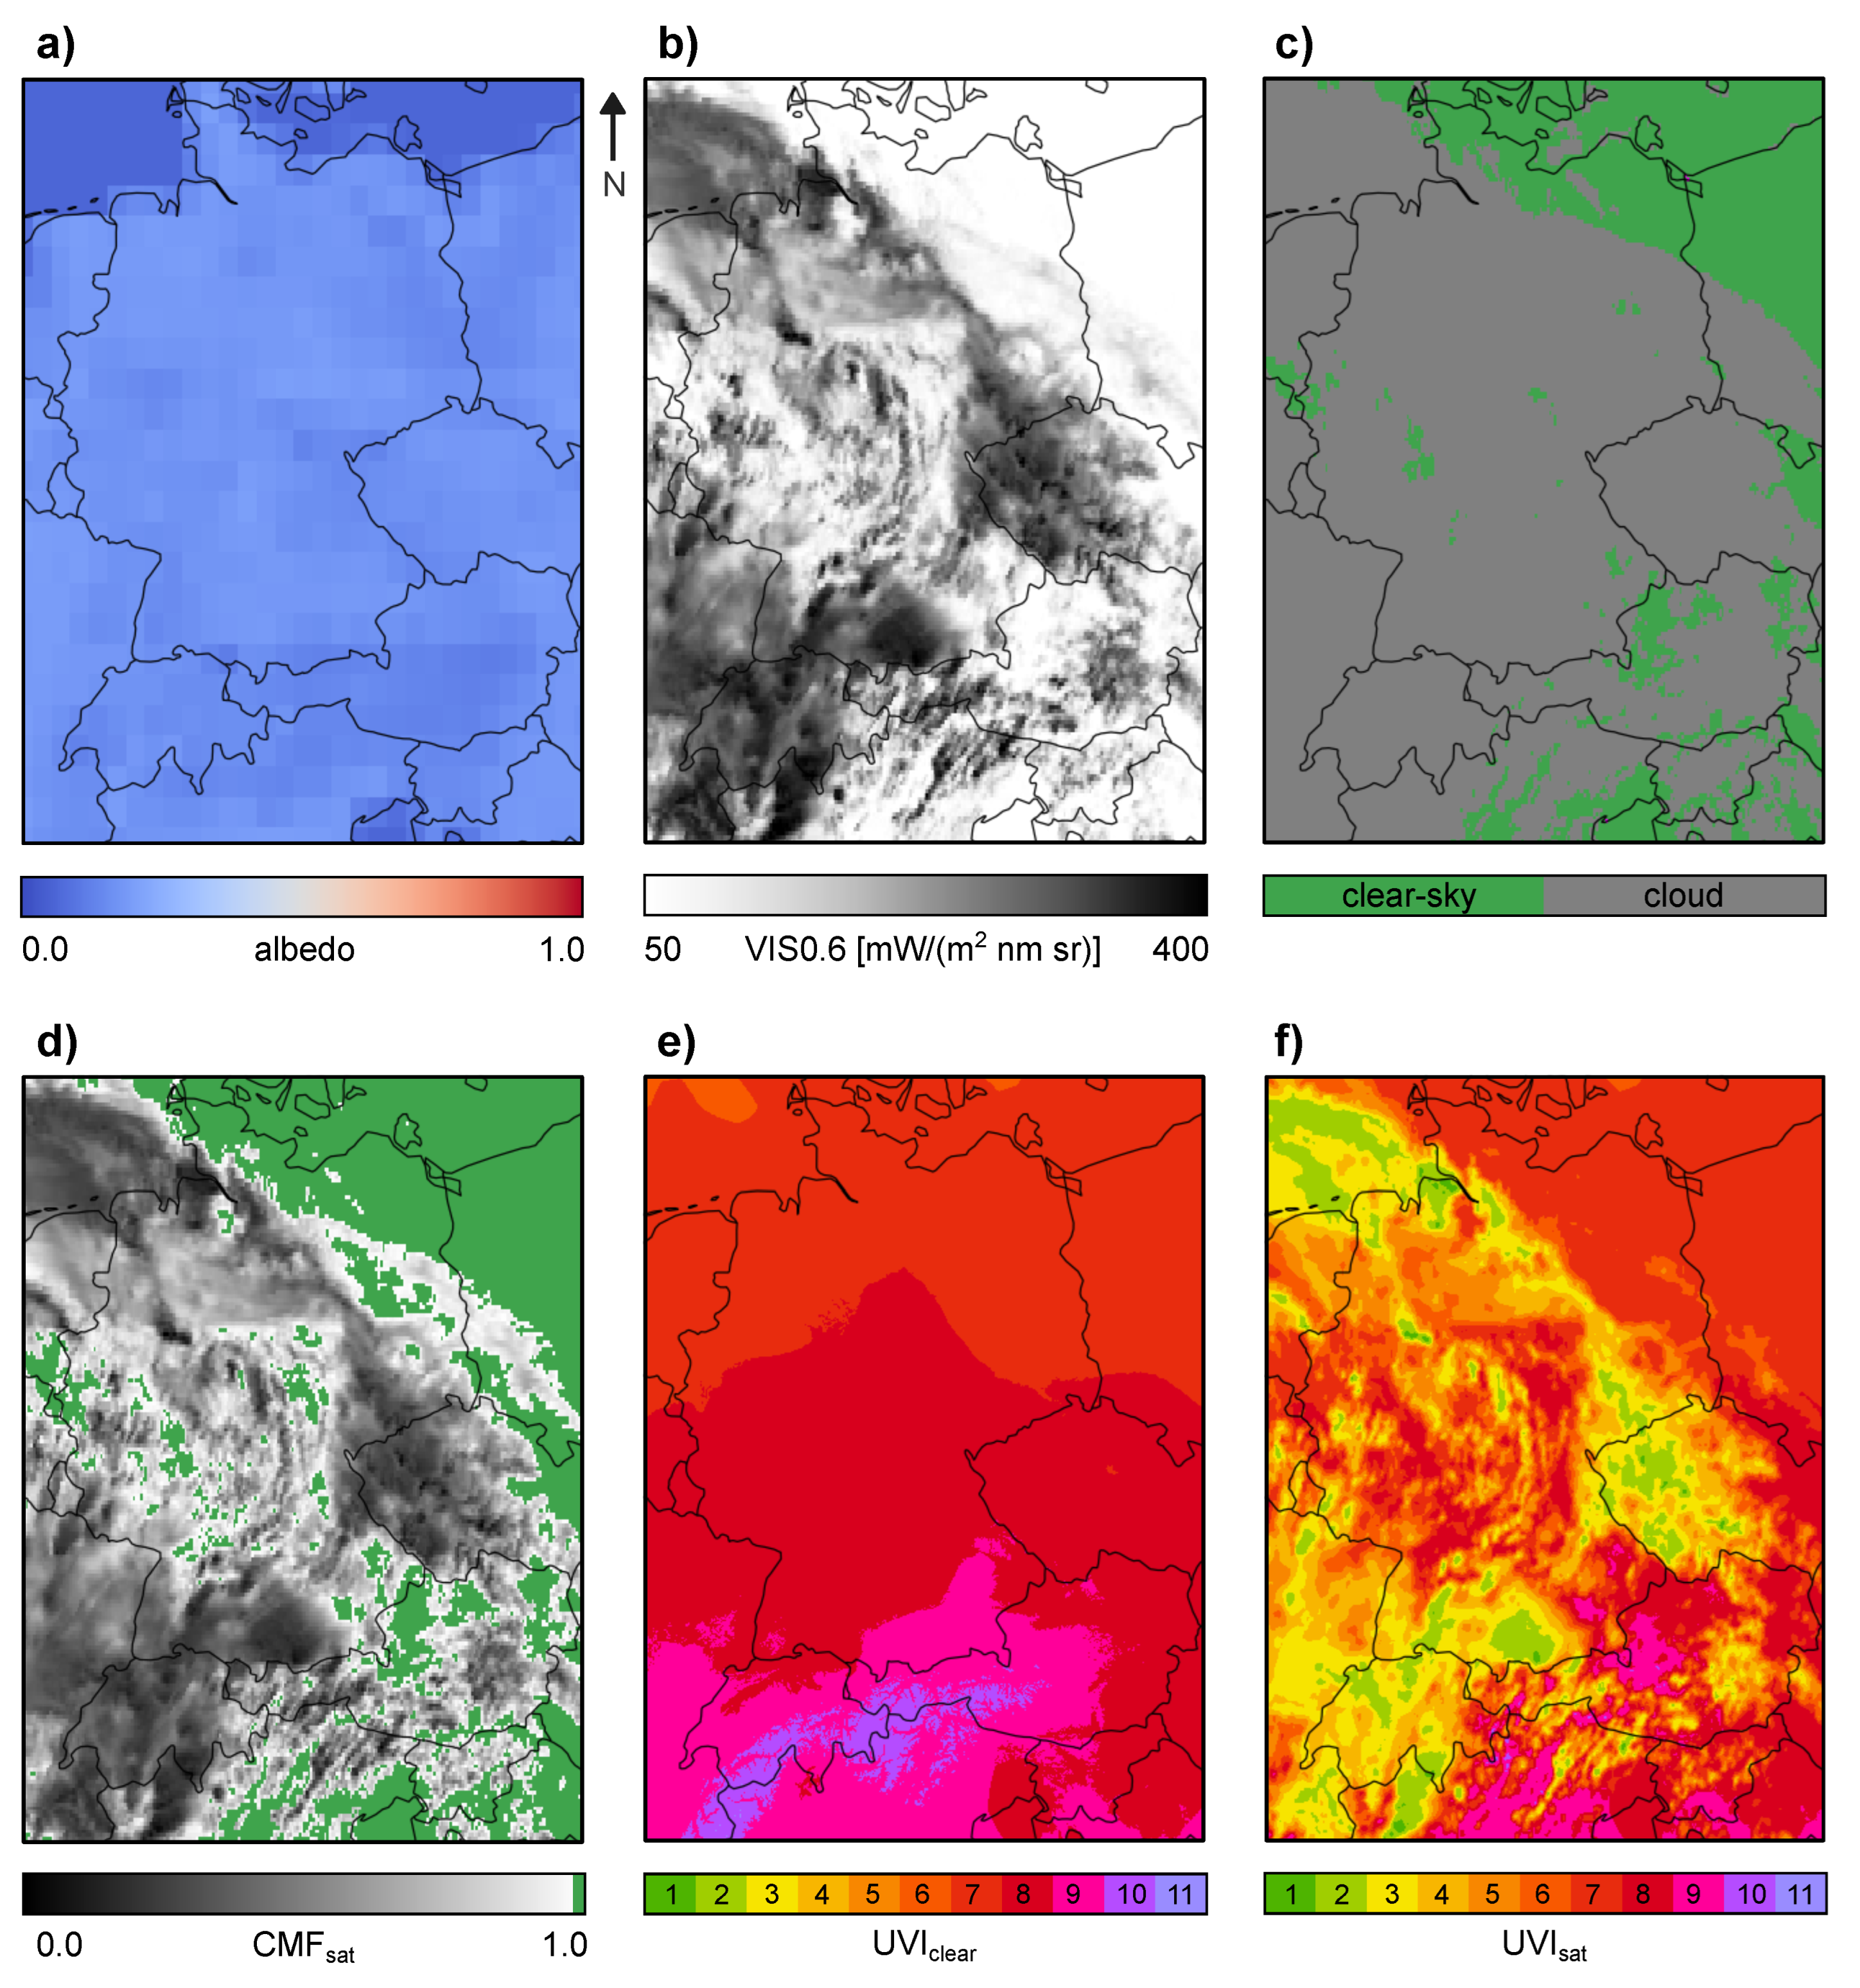
Figure 4.
Median (black dot), 5% and 95% (grey) and 25% and 75% (black) percentiles of the ratio of ground-measured to satellite-derived UV Index data () evaluated for 10° wide solar elevation bands for all 27 sites (from North to South) and for clear-sky conditions. The median, 5th percentile, and 95th percentile values, shown in blue (and shifted to the right for better visibility), are calculated after excluding data points associated with winter albedo conditions.
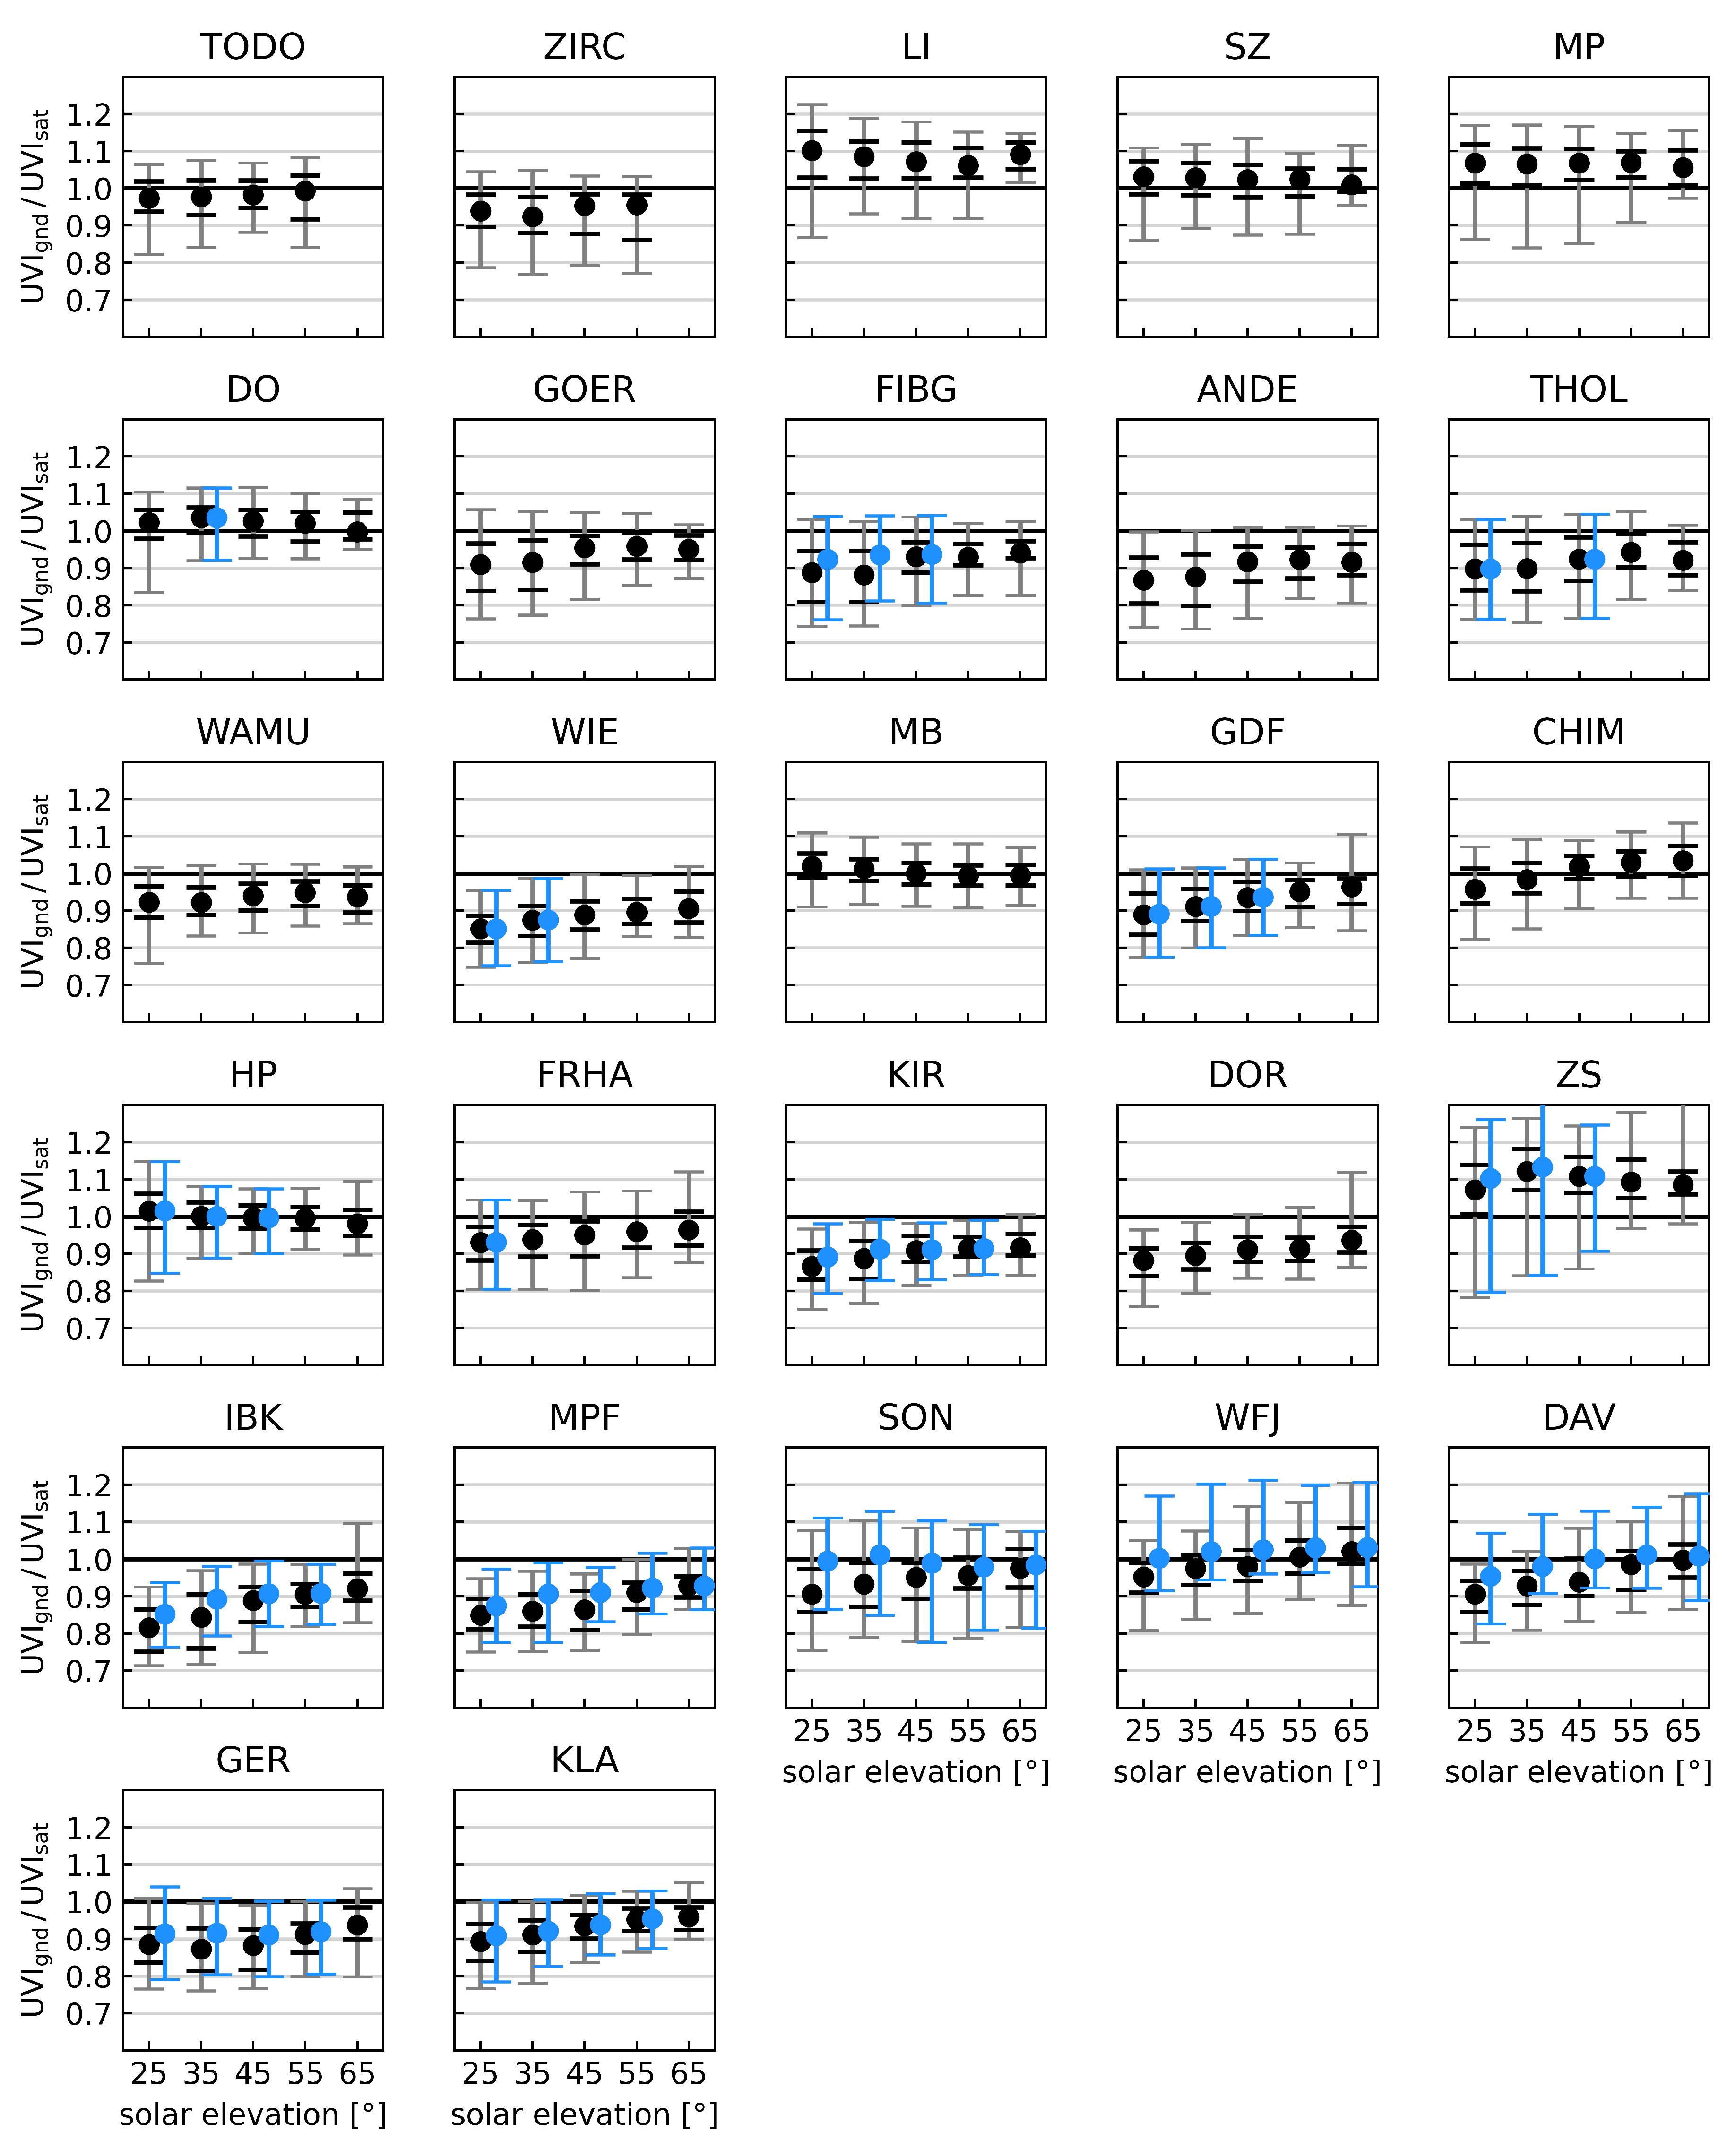
Figure 5.
Scatter plot of to for all stations (from North to South) and all-sky conditions.
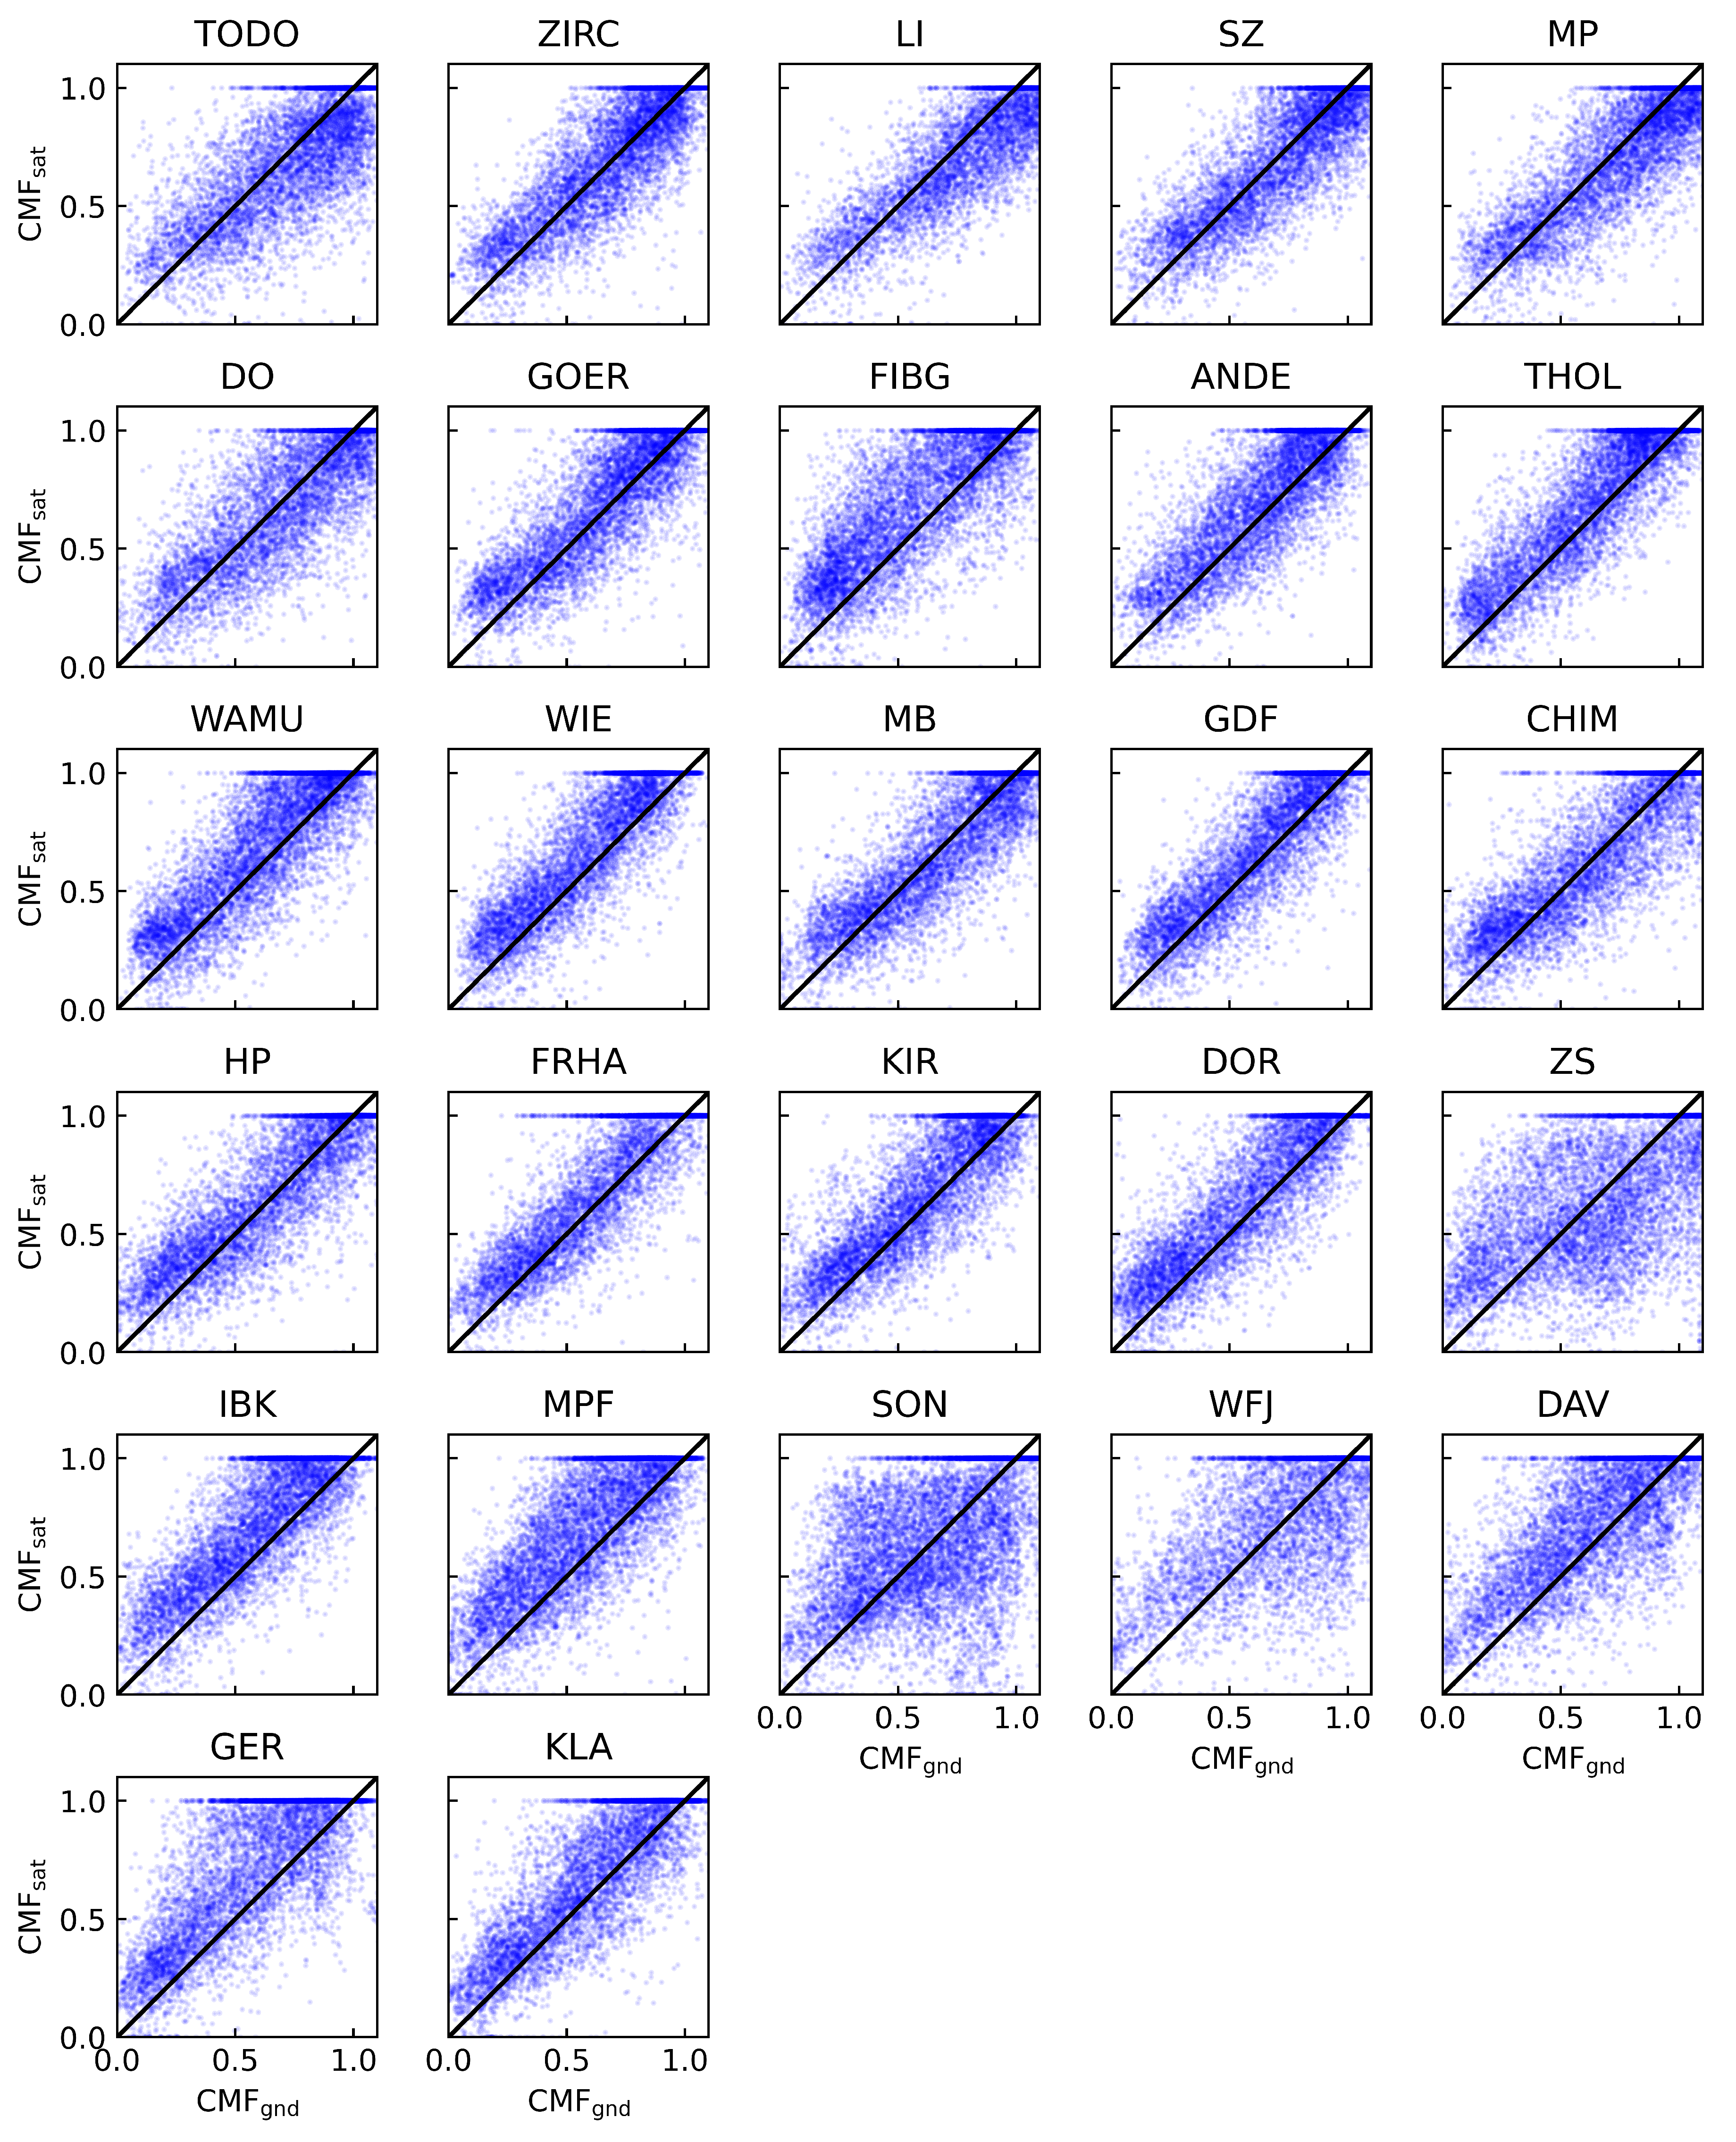
Figure 6.
Median value (black dots), 5% and 95% (grey) and 25% and 75% (black) percentiles of the difference of satellite-derived to ground-measured UV Index () evaluated for 10° wide solar elevation bands for all 27 sites (from North to South) and for all sky conditions.
Figure 6.
Median value (black dots), 5% and 95% (grey) and 25% and 75% (black) percentiles of the difference of satellite-derived to ground-measured UV Index () evaluated for 10° wide solar elevation bands for all 27 sites (from North to South) and for all sky conditions.
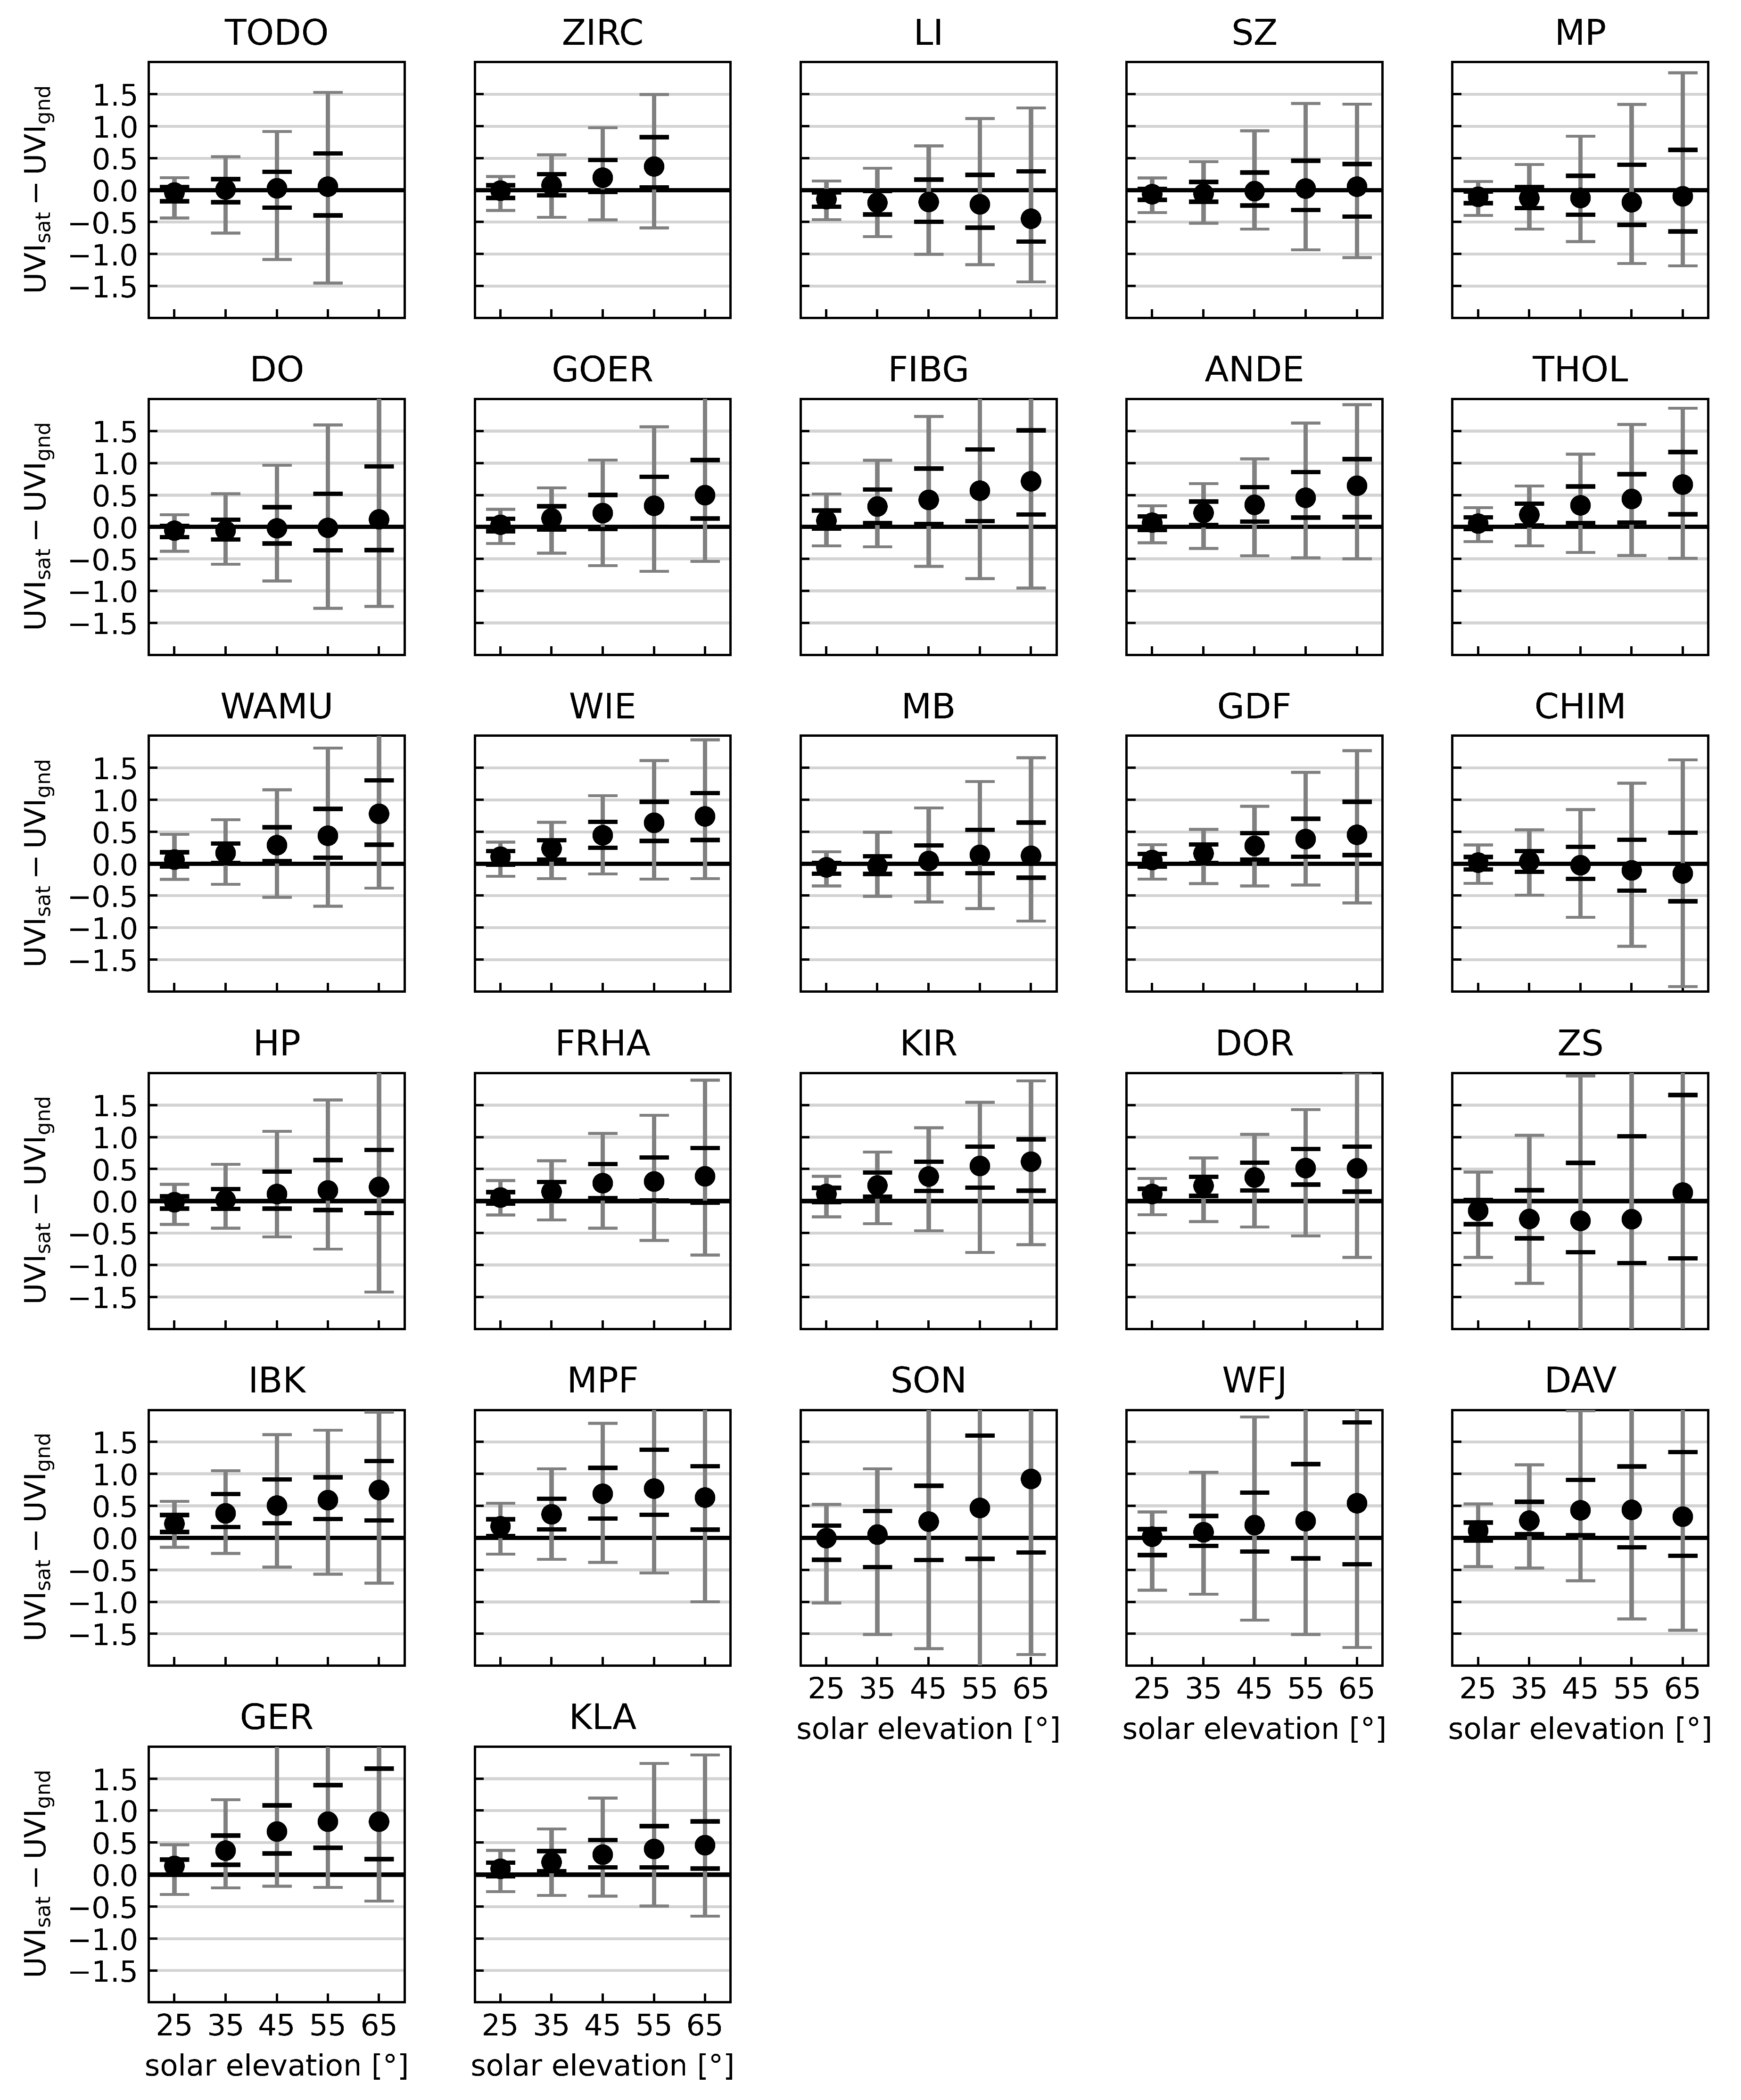
Figure 7.
Location of the sites (from North to South, red dots) and position and pixel sizes of the satellite derived (blue box), the total column ozone from OMI AURA (green box) and the model input data from CAMS (orange box).
Figure 7.
Location of the sites (from North to South, red dots) and position and pixel sizes of the satellite derived (blue box), the total column ozone from OMI AURA (green box) and the model input data from CAMS (orange box).
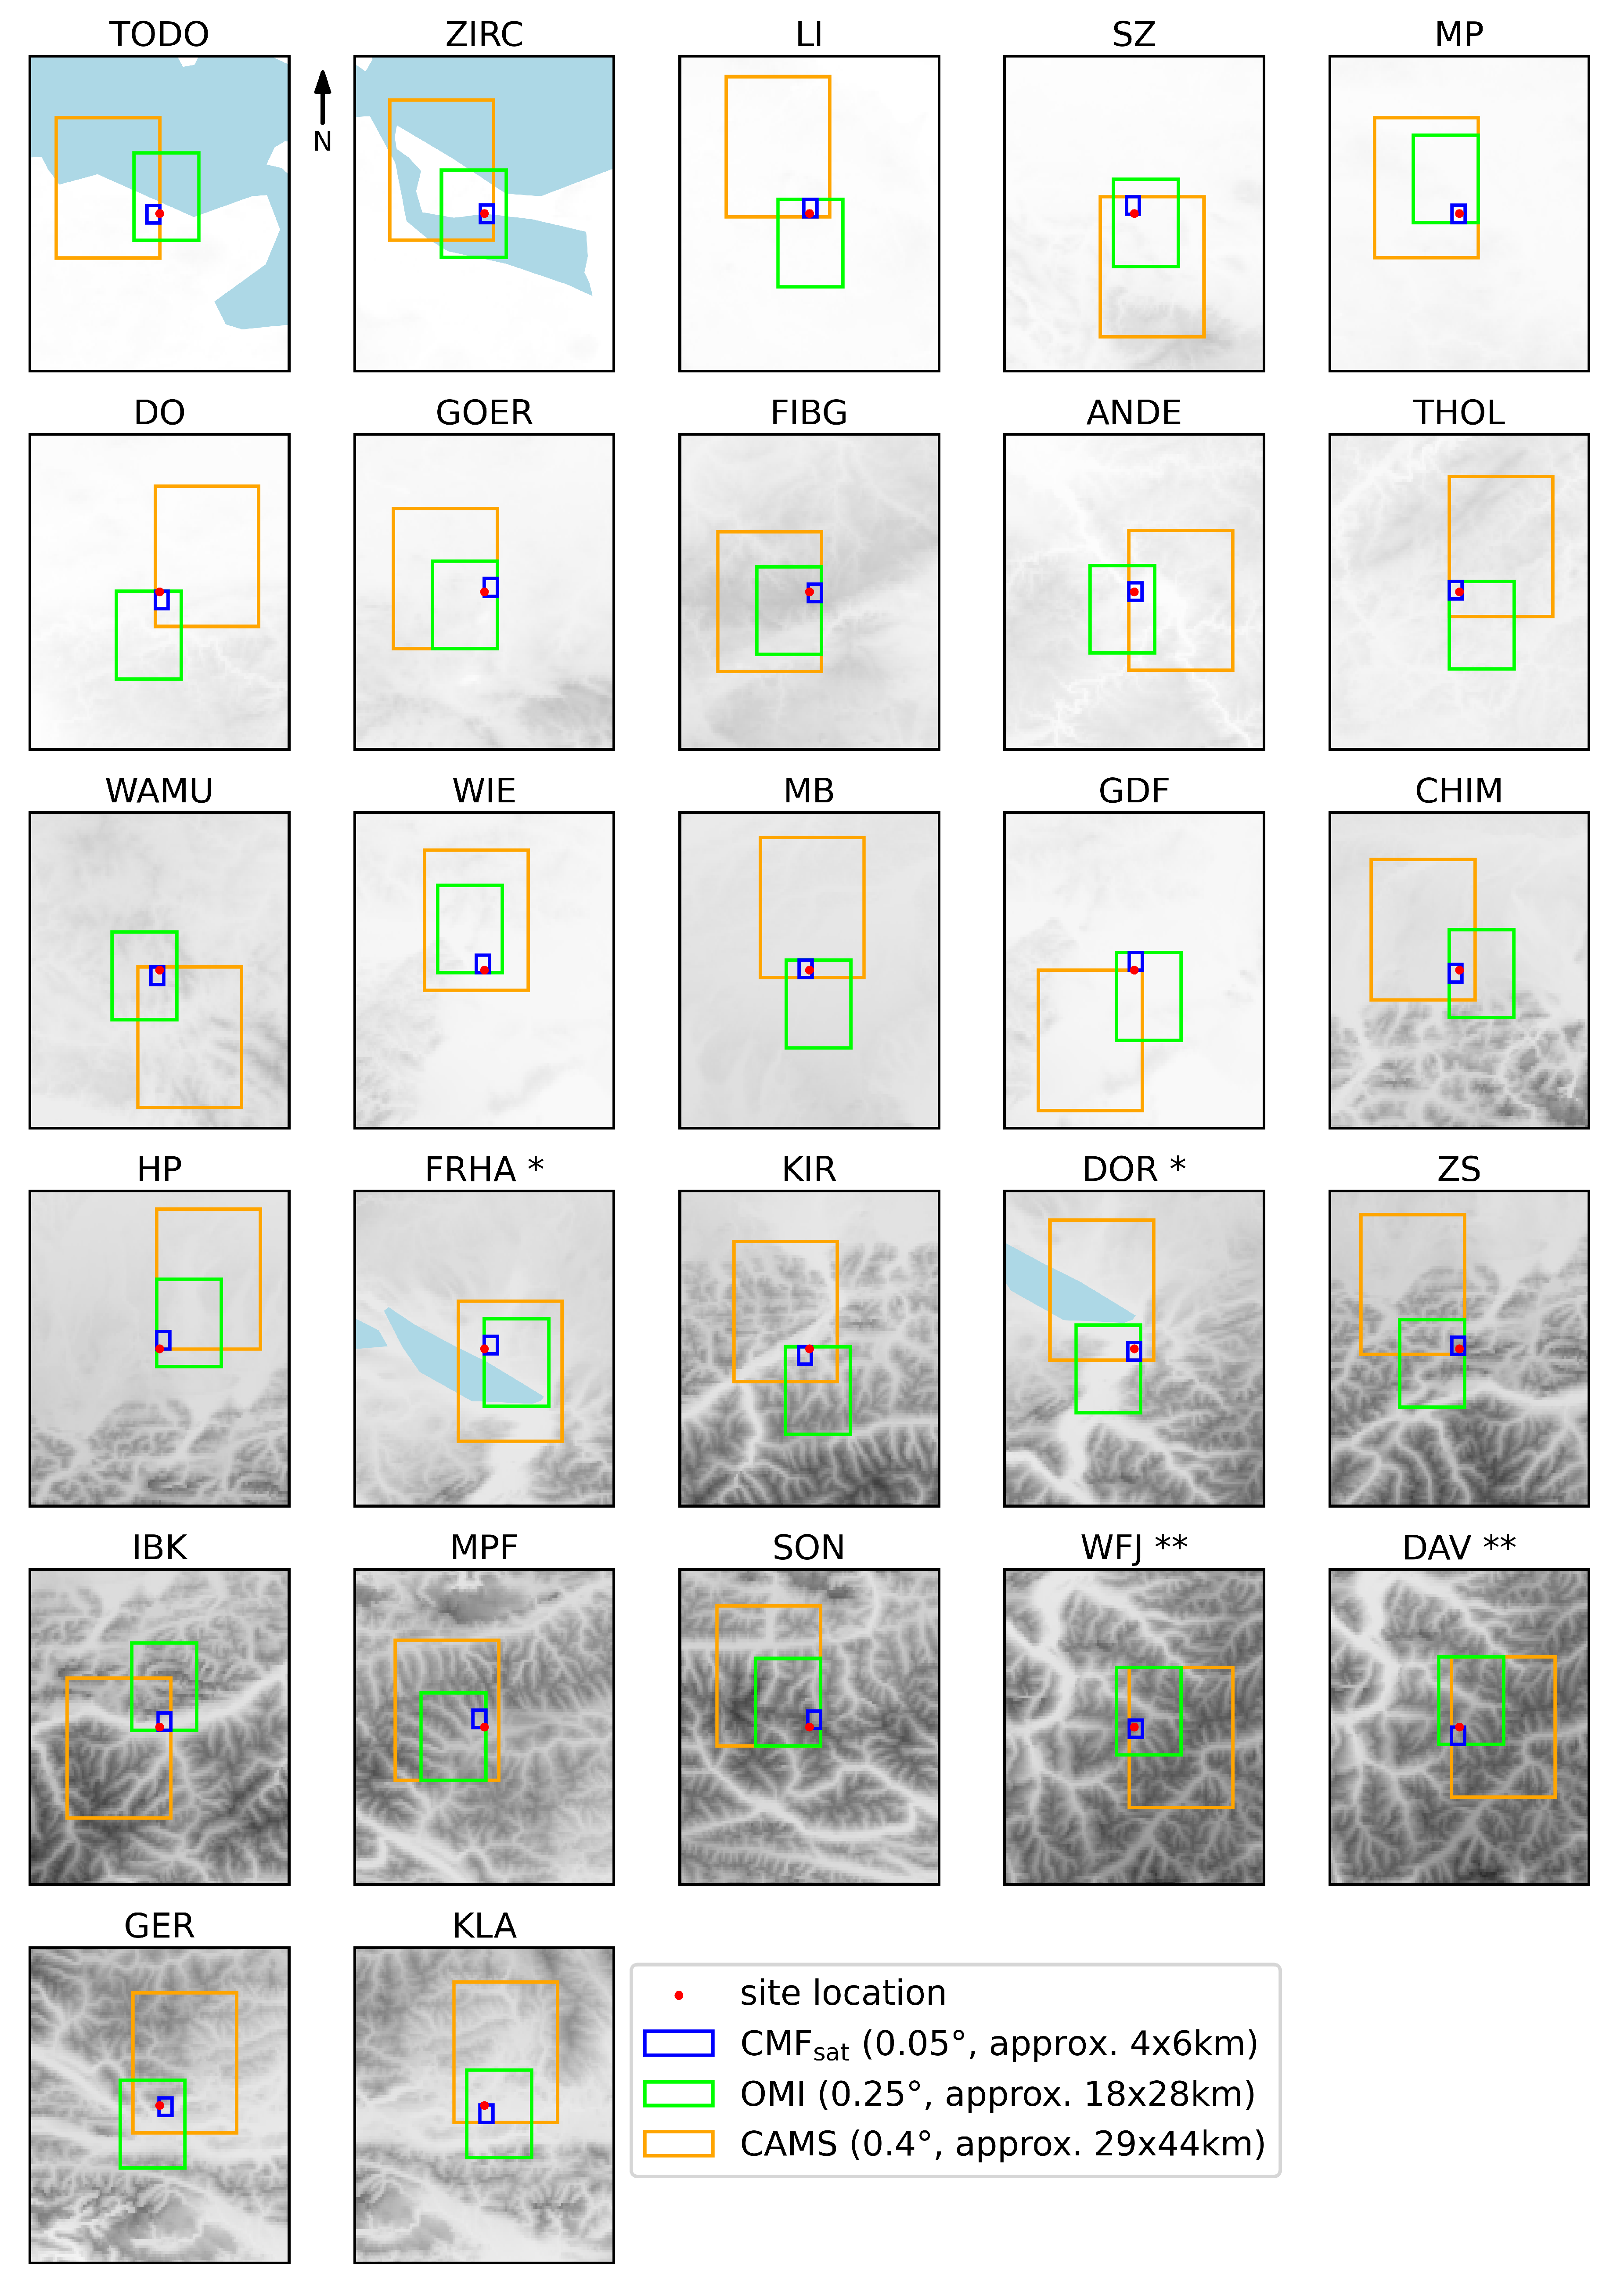
Table 1.
Ground stations of Germany, Austria and Switzerland (from North to South).
| location | acronym | m a.s.l. | type |
|---|---|---|---|
| Todendorf | TODO | 5 | sglux ERYCA |
| Zirchow | ZIRC | 30 | sglux ERYCA |
| Lindenberg | LI | 114 | BTS2048-UV-S-WP |
| Salzgitter | SZ | 90 | BTS2048-UV-S-WP |
| Melpitz | MP | 85 | BTS2048-UV-S-WP |
| Dortmund | DO | 104 | Bentham DTM300 |
| Kassel | SCHA | 317 | sglux ERYCA |
| Goerlitz | GOER | 238 | sglux ERYCA |
| Fichtelberg | FIBG | 1215 | sglux ERYCA |
| Andernach | ANDE | 76 | sglux ERYCA |
| Tholey | THOL | 386 | sglux ERYCA |
| Waldmuenchen | WAMU | 499 | sglux ERYCA |
| Wien | WIE | 160 | Solar Light Model 501 |
| Muenchen-Neuherberg | MB | 495 | BTS2048-UV-S-WP |
| Gross-Enzersdorf | GDF | 156 | Solar Light Model 501 |
| Chieming | CHIM | 551 | sglux ERYCA |
| Hohenpeissenberg | HP | 977 | BTS2048-UV-S-WP |
| Friedrichshafen | FRHA | 405 | sglux ERYCA |
| Kirchbichl | KIR | 526 | Solar Light Model 501 |
| Dornbirn | DOR | 407 | Solar Light Model 501 |
| Zugspitze-Schneefernerhaus | ZS | 2660 | BTS2048-UV-S-WP |
| Innsbruck | IBK | 578 | Solar Light Model 501 |
| Mariapfarr | MPF | 1151 | Solar Light Model 501 |
| Sonnblick | SON | 3109 | Solar Light Model 501 |
| Weissfluhjoch | WFJ | 2540 | Solar Light Model 501 |
| Davos | DAV | 1610 | Solar Light Model 501 |
| Gerlitzen | GER | 1526 | Solar Light Model 501 |
| Klagenfurt | KLA | 450 | Solar Light Model 501 |
Table 2.
Grid points of calculated with libRadtran’s sdisort model.
| Parameter | Unit | Range [grid points] |
|---|---|---|
| Albedo | 1 | 0 to 1 [12] |
| Ozone | DU | 160 to 540 [31] |
| Height a.s.l. | m | -500 to 5500 [7] |
| Solar elevation | ° | -2 to 90 [93] |
| Angstrom | 1 | 0 to 0.25 [10] |
Table 3.
Mean values of and percentages of within UVI (U0.5) and within UVI (U1.0) for all sites (from North to South).
Table 3.
Mean values of and percentages of within UVI (U0.5) and within UVI (U1.0) for all sites (from North to South).
| acronym | mean diff | U0.5 [%] | U1.0 [%] | mean diff | U0.5 [%] | U1.0 [%] |
|---|---|---|---|---|---|---|
| clear-sky | clear-sky | clear-sky | all-sky | all-sky | all-sky | |
| TODO | -0.05 | 90.5 | 97.6 | -0.02 | 79.3 | 93.1 |
| ZIRC | 0.13 | 89.4 | 97.8 | 0.13 | 82.5 | 95.4 |
| LI | -0.29 | 80.9 | 98.6 | -0.17 | 75.4 | 94.5 |
| SZ | -0.09 | 95.6 | 99.7 | -0.01 | 84.6 | 95.8 |
| MP | -0.21 | 87.8 | 99.3 | -0.09 | 80.2 | 94.9 |
| DO | -0.09 | 96.3 | 99.4 | -0.00 | 80.4 | 93.4 |
| GOER | 0.15 | 91.8 | 99.6 | 0.18 | 79.8 | 93.7 |
| FIBG | 0.24 | 78.1 | 97.3 | 0.37 | 64.3 | 85.6 |
| ANDE | 0.29 | 79.7 | 98.1 | 0.26 | 75.6 | 93.5 |
| THOL | 0.25 | 80.9 | 97.1 | 0.25 | 75.9 | 92.9 |
| WAMU | 0.20 | 88.2 | 98.8 | 0.26 | 74.9 | 91.6 |
| WIE | 0.37 | 72.5 | 96.5 | 0.34 | 71.6 | 92.3 |
| MB | -0.03 | 94.8 | 99.7 | 0.04 | 83.9 | 95.7 |
| GDF | 0.21 | 87.2 | 98.9 | 0.22 | 81.6 | 95.1 |
| CHIM | -0.08 | 91.3 | 98.1 | 0.00 | 81.2 | 93.8 |
| HP | -0.01 | 93.2 | 99.2 | 0.11 | 79.9 | 93.3 |
| FRHA | 0.18 | 83.6 | 98.1 | 0.21 | 78.2 | 94.1 |
| KIR | 0.34 | 72.4 | 97.0 | 0.29 | 70.9 | 92.4 |
| DOR | 0.30 | 76.8 | 98.0 | 0.28 | 74.4 | 94.0 |
| ZS | -0.54 | 59.1 | 86.3 | -0.11 | 51.1 | 75.7 |
| IBK | 0.43 | 60.3 | 92.9 | 0.43 | 60.4 | 87.3 |
| MPF | 0.43 | 63.7 | 91.0 | 0.47 | 58.7 | 82.4 |
| SON | -0.15 | 67.0 | 85.9 | 0.20 | 52.9 | 74.8 |
| WFJ | -0.08 | 78.7 | 92.3 | 0.21 | 59.6 | 78.4 |
| DAV | 0.15 | 79.1 | 94.9 | 0.33 | 63.4 | 83.7 |
| GER | 0.36 | 69.0 | 93.4 | 0.53 | 59.9 | 81.9 |
| KLA | 0.22 | 86.9 | 98.8 | 0.26 | 77.3 | 93.2 |
Disclaimer/Publisher’s Note: The statements, opinions and data contained in all publications are solely those of the individual author(s) and contributor(s) and not of MDPI and/or the editor(s). MDPI and/or the editor(s) disclaim responsibility for any injury to people or property resulting from any ideas, methods, instructions or products referred to in the content. |
© 2024 by the authors. Licensee MDPI, Basel, Switzerland. This article is an open access article distributed under the terms and conditions of the Creative Commons Attribution (CC BY) license (http://creativecommons.org/licenses/by/4.0/).
Copyright: This open access article is published under a Creative Commons CC BY 4.0 license, which permit the free download, distribution, and reuse, provided that the author and preprint are cited in any reuse.


