
Submitted:
16 December 2024
Posted:
17 December 2024
You are already at the latest version
Abstract
Atomic clusters exhibit properties that fall between those found for individual atoms and bulk solids. Small boron clusters exhibit planar and quasi-planar structures, which are novel materials envisioned to serve as a platform for designing nanodevices and materials with unique physical and chemical properties. Through past research advancements, experimentalists demonstrated the successful incorporation of transition metals in the middle of planar boron rings. In our study, we used first-principles calculations to examine the structure and properties of neutral boron clusters doped with transition metals, denoted as TMBn and TMB2n, where TM = Ti, Cr, Mn, Fe, Co, Nb, or Mo and n=8−10. Our calculations show that the TMB2n structures, which involve sandwiching metal atoms between two rings (called the drum configuration), as well as clusters with the single ring configuration, TMBn, are stable. These clusters typically have relatively large HOMO-LUMO gaps, suggesting high kinetic stability and low chemical reactivity. Moreover, the clusters display interesting magnetic properties, determined not only by the metal atoms but also by the induced magnetism of the boron rings. These structures have potential applications in spintronics and sensing. This work also provides a basis for studying magnetism in the one-dimensional limit.
Keywords:
borometallic clusters
; planar boron clusters
; first-principles calculations
; nanostructure design
1. Introduction
Boron, a versatile element with applications spanning many fields, has a rich history that traces its origins to the isolation of simple boranes by Stock et al. [1]. Over the past two decades, a noteworthy chapter in this narrative has unfolded with the synthesis and characterization of various low-dimensional boron nanomaterials, including nanoclusters, nanowires, nanotubes, nanobelts, nanoribbons, and monolayer crystalline sheets [2,3,4,5]. Diverging from the traditional bulk boron crystals found in -, -, and -rhombohedral and -tetragonal forms, these newly crafted boron-based nanomaterials have distinctive bonding patterns [6]. This departure gives rise to captivating physical and chemical properties, making them a focal point of fascination within materials science. Of particular note is the capability of boron-based nanomaterials, such as clusters, to serve as superatoms or as fundamental building blocks for crafting nanostructures imbued with novel functionalities and properties. These systems are characterized by having diverse structures, including planar, quasi-planar, bowl, cage, tubular drum-like forms, multiple ring tubes, and fullerenes [7,8,9,10]. Electron deficiency of the boron atom enables its involvement in localized and delocalized bonding patterns across various geometric configurations. The neutral B clusters with prefer a planar or quasi-planar structure [11]. On the other hand B clusters retain planarity (or quasi-planarity) for [12]. The perfectly planar B and B molecular wheels, with a hepta- or octacoordinated central boron atom, respectively, laid the foundation of borometallic clusters [13]. In the borometallic cluster, the central B atom is replaced with a metal atom, creating a similar doubly aromatic cluster [14,15]. Experiments in cluster beams have demonstrated that transition metal (TM) atoms can be incorporated into the center of the planar boron clusters [16,17,18].
More recently, Chang Xu et al. [19] conducted a theoretical investigation on TM-centered double-ring clusters, M@B (where M = Ti, Cr, Fe, Ni, Zn and n = 6, 7, 8). They explored the factors contributing to the stability of these clusters in their study. Miao Yan et al. [20] introduced the concept of fluxional bonds in various structures, including planar B, tubular Ta@B, and cage-like B. These bonds form and break continuously on these systems’ extremely flat potential energy surfaces. Ren et al. [21] used the CALYPSO method combined with density functional theory (DFT) calculations on niobium-doped boron clusters. Their research revealed that the global minima for the neutral clusters correspond to half-sandwich structures at and tubular-type structures at . Chen et al. [22] study offered a comprehensive overview of the geometric configurations of both pure (B) and metal-doped boron clusters, which exhibit structures such as planar, nanotube, bilayer, fullerene-like, and core-shell forms across a wide range of cluster sizes (n). They also explored the potential for developing boron-based nanomaterials with specific functionalities derived from metal-boron clusters. Liu et al. [23] identified ten potential clusters made up of rings formed by 12 to 15 atoms of boron-carbon doped with heavier alkaline-earth (Ae) metals (Ae = Ca, Sr, Ba). Their chemical bonding analyses reveal the important role of Ae d orbitals in facilitating covalent interactions between the central Ae atom and the surrounding boron-carbon rings.
Linear magnetic chains are becoming crucial in quantum information involving entanglement and correlation [24,25]. Carbon and boron-nitride-based nanotubes are used as support surfaces to stabilize unstable isolated atomic chains [26]. Photoelectron spectroscopy and theoretical studies identified metal centered tubular ionic structures MnB, CoB, RhB, and TaB with a magnetic moment of 2, 2, 0, and 0 , respectively [27,28,29,30]. Neutral boron-based tubular structures, including FeB, FeB, UB, NpB, and PuB, were examined theoretically and found to have a quenched magnetic moment of for the iron-based structures and relatively high magnetic moment of 3.69, 4.92, and 6.07 , respectively, for actinide centered tubular structures [31,32]. These research works showed that the size and stability of the tubular structures greatly depend on the encapsulated metal atoms through the covalent bonds forming between the metal ions and the boron frame (MB) [33]. Metal-centered tubular boron clusters have been suggested as the building blocks for one-dimensional metallo-nanotubes [33]. However, the magnetic moments of TM-centered tubular boron clusters remain unexplored, with limited discussion on their magnetic behaviors.
In this work, by using DFT calculations, we study the structure and properties of borometallic molecular wheel structures derived from planar boron B, B, and B wheel clusters. For all these clusters, we analyze their magnetic behavior using spin-polarized calculations and analyze charge density differences and the contribution of metal and boron atoms to the density of states via the projected density of states (PDOS) analysis.
2. Computational Details
A DFT-based study is carried out using the Quantum ESPRESSO package [34]. The generalized gradient approximation (GGA) of Perdew-Burke-Ernzerhof (PBE) [35] is used in the calculations combined with projector-augmented wave (PAW) pseudopotentials. Boron-based rings centered with TM atoms (TMB) are modeled by varying the value of n from 8 to 10 for single rings and subsequently increasing it to 16, 18, and 20 by taking the same ring twice and sandwiching the metal atom between them (TMB). The TMB and TMB clusters are shown in Figure 1. A vacuum distance of 16 Å is introduced to avoid interactions between cluster replicas. A plane-wave basis set with an energy cutoff of 70 Ry is used. The convergence threshold for the self-consistent energy calculations is , and the atomic positions are optimized until the forces on atoms are smaller than Ry/Bohr. The convergence threshold during phonon self-consistent calculations is eV. All the computations are carried out at the -point of the Brillouin zone. Assessing the stability of clusters often relies on the binding energy, , as an important parameter. The calculation of for the TMB and TMB clusters is done using the equation:
where is the total energy of the optimized boron ring with the TM atom in the center, is the total energy of the boron cluster in the ring () or drum () forms, and is the energy of the isolated TM atom. Spin-polarized calculations are carried out to study the magnetic properties of the clusters.
3. Results and discussion
We became interested in the high symmetry found in aromatic boron rings, which are represented as B where n ranges from 8 to 10. This led us to conduct thorough investigations involving replacing the central B atom with TM counterparts, specifically TM = Ti, Cr, Mn, Fe, Co, Nb, and Mo. Our exploration focused on two main configurations: the "ring configuration" (TMB), featuring a TM atom at the center of a ring composed of 8, 9, or 10 boron atoms, and the "drum configuration" (TMB), involving two rings of the same size stacked on top of each other, with the metal atom situated between the centers of two rings comprising 8, 9, or 10 boron atoms. Our system is visually represented in Figure 1, with boron atoms highlighted in dark red and forming a ring, and the central TM atom shown in blue.
3.1. Structural Properties
In line with the structural arrangement shown in Figure 1, the bond lengths between adjacent boron atoms () and those connecting boron with central metal atoms () are summarized for all the studied clusters in Table 1. It is worth noting that all the designed configurations are planar except for TiB, TiB, and FeB, where the central atom deviates slightly out of plane by 0.8387 Å 0.6168 Å and 0.8394 Å respectively, giving rise to a distinctive bowl-like structure, which aligns well with previous research. The distances between metal and boron atoms () for , 9, and 16 are small compared to their covalent bonds, indicating minimal steric repulsion between them. The bond length is influenced by the number of B atoms present in the boron ring and the size of the central metal atom, especially for and 9 (refer to Table 1). For TM = Cr, Mn, Fe, or Co, the drum configuration with the maximum number of boron atoms is only possible with B because, beyond that limit, an elliptical geometry prevails over a circular shape. In Table 1, we summarize the point group (PG) symmetry for each cluster, which was determined using the automatic flow for material discovery (AFLOW) software. Point group is assigned to TMB, except for the non-planar configuration. This outcome is in close agreement with the existing literature. For TMB clusters, the PG symmetry is due to its nearly circular geometry or due to its elliptical geometry. Drum configurations mostly belong to the PG symmetry.
In Table 1, we have summarized the values of for all the clusters. The values consistently increase from TMB to TMB (or, in some cases, TMB to TMB) and then decrease gradually until reaching TMB across all seven systems for each TM. Overall, the values are relatively high for Co-doped configurations but notably lower for Mn-doped structures. It is important to note that all structures have negative values, indicating the stability of the clusters since energy is required to separate the clusters into TM and B.
3.2. Electronic Properties
In Table 1, we have summarized the HOMO-LUMO gaps (HOMO refers to "Highest Occupied Molecular Orbital" and LUMO refers to "Lowest Unoccupied Molecular Orbital") of the studied clusters. Although DFT-GGA underestimates energy gap values, most clusters still exhibit nonzero HOMO-LUMO gaps. The highest energy gaps for the ring configurations are found in CoB, NbB, and FeB, with values of 1.055 eV, 0.907 eV, and 0.785 eV, respectively. Among the drum configurations, the HOMO-LUMO gaps for MoB, CrB, and MnB (1.088 eV, 0.822 eV, and 0.804 eV, respectively) are larger compared to other drum structures. Structures with large HOMO-LUMO gaps are associated with high kinetic stability and low chemical reactivity, making them promising candidates for future applications.
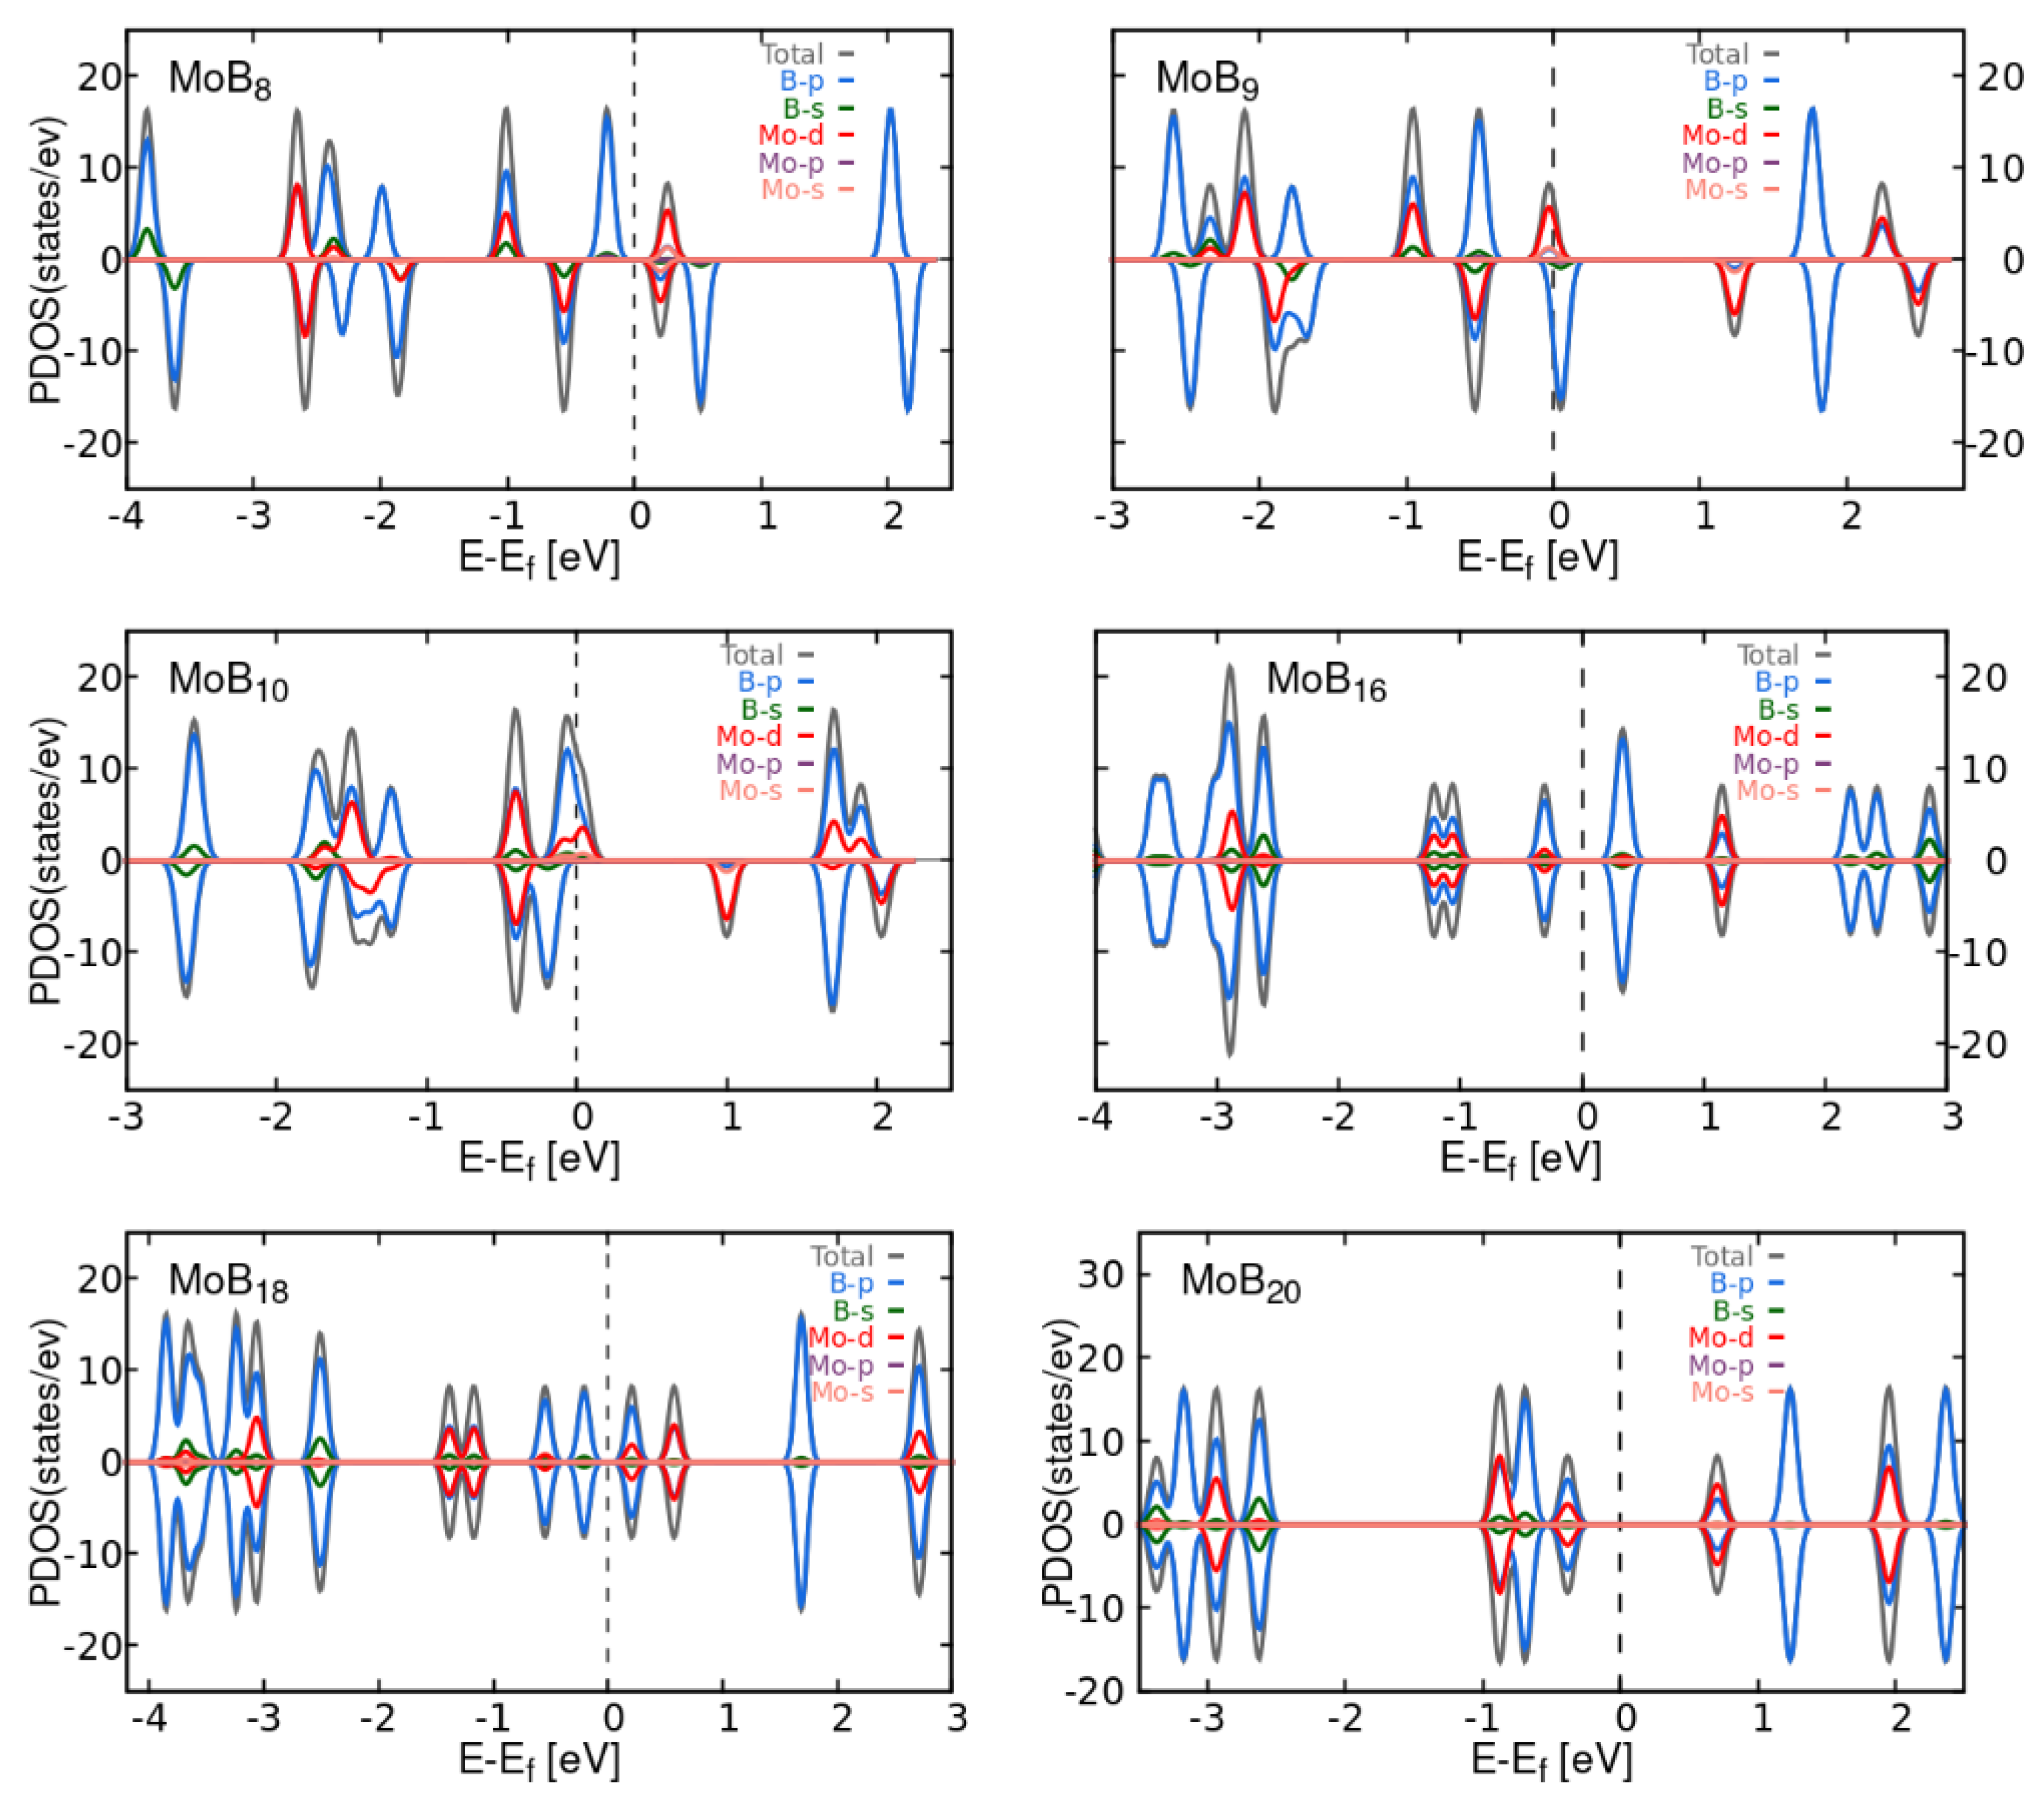
The PDOS spectra for all the clusters can be found in Appendix A. These spectra are valuable for studying the contribution of different atomic orbitals to the density of states in the studied clusters, particularly near the Fermi level. They also aid in visualizing the contribution of atomic orbitals to magnetization. In general, the p-orbitals of boron and the d-orbitals of transition metals make the most significant contributions to the density of states near the Fermi level. However, in specific cases such as TiB, CoB, NbB, and NbB, the contribution at the Fermi level comes solely from boron s-orbitals. A combination of s and d orbitals contributes to the density of states at the Fermi level for CrB, MnB, FeB, FeB, MoB, and MoB.
3.3. Vibrational Properties
The vibrational properties of the structures were analyzed using phonon computations to assess their stability. These calculations provide valuable insights into the dynamic behavior and structural integrity of the systems under study. According to the literature [36], a cluster is considered stable if all its real vibrational frequencies are positive, and the minimum vibrational frequency, denoted as , is significantly large. Table 2 presents the values of for each cluster. For the ring configuration, TMB and TMB with TM = Ti, Cr, Mn, Fe, or Co have the highest values of , whereas TMB and TMB clusters have the highest for TM = Nb and Mo. Interestingly, the FeB cluster in our calculations is at the stability border, as its value is small but negative. For the drum configurations, there is less regularity, and large values of are obtained for CrB, while the lowest value is for MnB. Our results for are in close agreement with a study by Pu et al. [18], where the values of for FeB and CoB were 110.5 cm and 96.7 cm, respectively. The full list of phonon frequencies for each cluster is provided in Appendix B.
3.4. Dynamic Properties
To further verify the stability of the ring and drum structures, we performed quantum molecular dynamics (MD) simulations at two different temperatures with the choice of 1 fs for the time step. Each run was 3.5 ps long. At a temperature of 300 K, the ring and drum structures maintain their shape during the MD run, and no significant deformations occur. At a temperature of 600 K, both structure types deform but retain their wheel-like structure. This is shown in Figure 2 on the example of CoB and MnB. It is worth noting to mention that MnB has one of the smallest in absolute value.
3.5. Magnetic Properties
The magnetic moment values, denoted as m, for each cluster, are listed in Table 1. Generally, the value of m decreases as the number of boron atoms in the ring increases from 8 to 10. In contrast, an opposite trend is observed for drum structures, with m tending to increase as the number of boron atoms in the TMB structure increases (from 16 to 20). Interestingly, the m values for CoB and MoB drum structures are independent of n, remaining equal to 1 and 0, respectively.
The contribution from boron and TM atoms to magnetization is illustrated in Figure 3. In general, the contribution from TM atoms to total m is large. However, in most cases, the boron atoms become polarized, resulting in a non-zero contribution to m. Specifically, for TMB clusters, the boron contribution (represented by the yellow line) to m is consistently greater than the TM contribution (represented by the blue line). Conversely, in the case of TMB structures, metals demonstrate dominance. For drum configurations, both metal and boron atoms consistently exhibit positive (or zero) contributions to m, except for the case of Mn, where boron atoms have slightly negative local magnetization. The case of NbB clusters is particularly interesting, as the magnetization is induced by TM atoms but is entirely localized on the boron atoms.
The result presented in Figure 3 can be spatially visualized by drawing the difference between the spin-up charge density () and the spin-down charge density ():
This is done in Figure 4 where the positive and negative values of the spin polarization density are represented with yellow and cyan, respectively. This figure clearly shows that the boron atoms in all clusters get polarized, and this polarization significantly influences the total value of m. This is quantitatively demonstrated by our Löwdin population analysis provided in Appendix C. This analysis evidenced, in most cases, a charge transfer from/to the TM atom, which gives rise to polarization effects on the boron atoms that, as a result, contribute to the total magnetic moment. The results suggest that the polarization of boron atoms is important in modulating the electron distribution, which may affect the cluster’s reactivity and interactions in different environments.
4. Summary and Conclusions
The successful integration of TM atoms into the core of planar boron clusters B creates a fascinating class of borometallic molecules. In our study, we present the results of first-principles calculations aimed at examining the electronic and magnetic properties of boron rings with a TM atom in the center, TMB (with TM being Ti, Cr, Mn, Fe, Co, Nb, or Mo, and n being 8, 9, or 10), as well as boron double-rings sandwiching the metal atom, TMB. In these molecular structures, each B atom in the circumference provides two electrons to the B–B peripheral covalent bonds and one electron to the delocalized B–TM bonds. Consequently, a TM atom with the appropriate number of valence electrons can be accommodated in the center of the boron wheel to form the TMB clusters, resulting in a structurally and dynamically stable borometallic cluster compound. Additionally, most of the studied clusters possess relatively high HOMO-LUMO gaps, which may suggest low chemical reactivity. Our investigation also indicates that the overall magnetic moment of the clusters is a combination of the magnetic moment of the central TM atom and the induced magnetic moment of the peripheral boron atoms. These molecular-based magnets provide a platform for studying magnetism in the zero-dimensional limit. Furthermore, the TMB clusters can function as building blocks for one-dimensional tubular forms.
Author Contributions
Conceptualization, S.P. and N.G.S.; methodology, S.P.; validation, S.P.; investigation, S.P. and N.G.S.; writing and original draft preparation, S.P.; writing, review, and editing, N.G.S.; visualization, S.P.; supervision, N.G.S. All authors reviewed the manuscript.
Funding
This research received no external funding.
Acknowledgments
The use of supercomputers at the Interdisciplinary Centre for Mathematical and Computational Modelling (ICM) at the University of Warsaw is gratefully acknowledged.
Conflicts of Interest
The authors declare no conflict of interest.
Appendix A. PDOS for Each Configuration
Figure A1 to Figure A7 plot the partial density of states (PDOS) spectra (spin-up and spin-down) for all the studied clusters to visualize the contribution of atomic orbitals to their electronic and magnetic properties.
Figure A1.
Projected Density of States for titanium doped ring and drum structures.
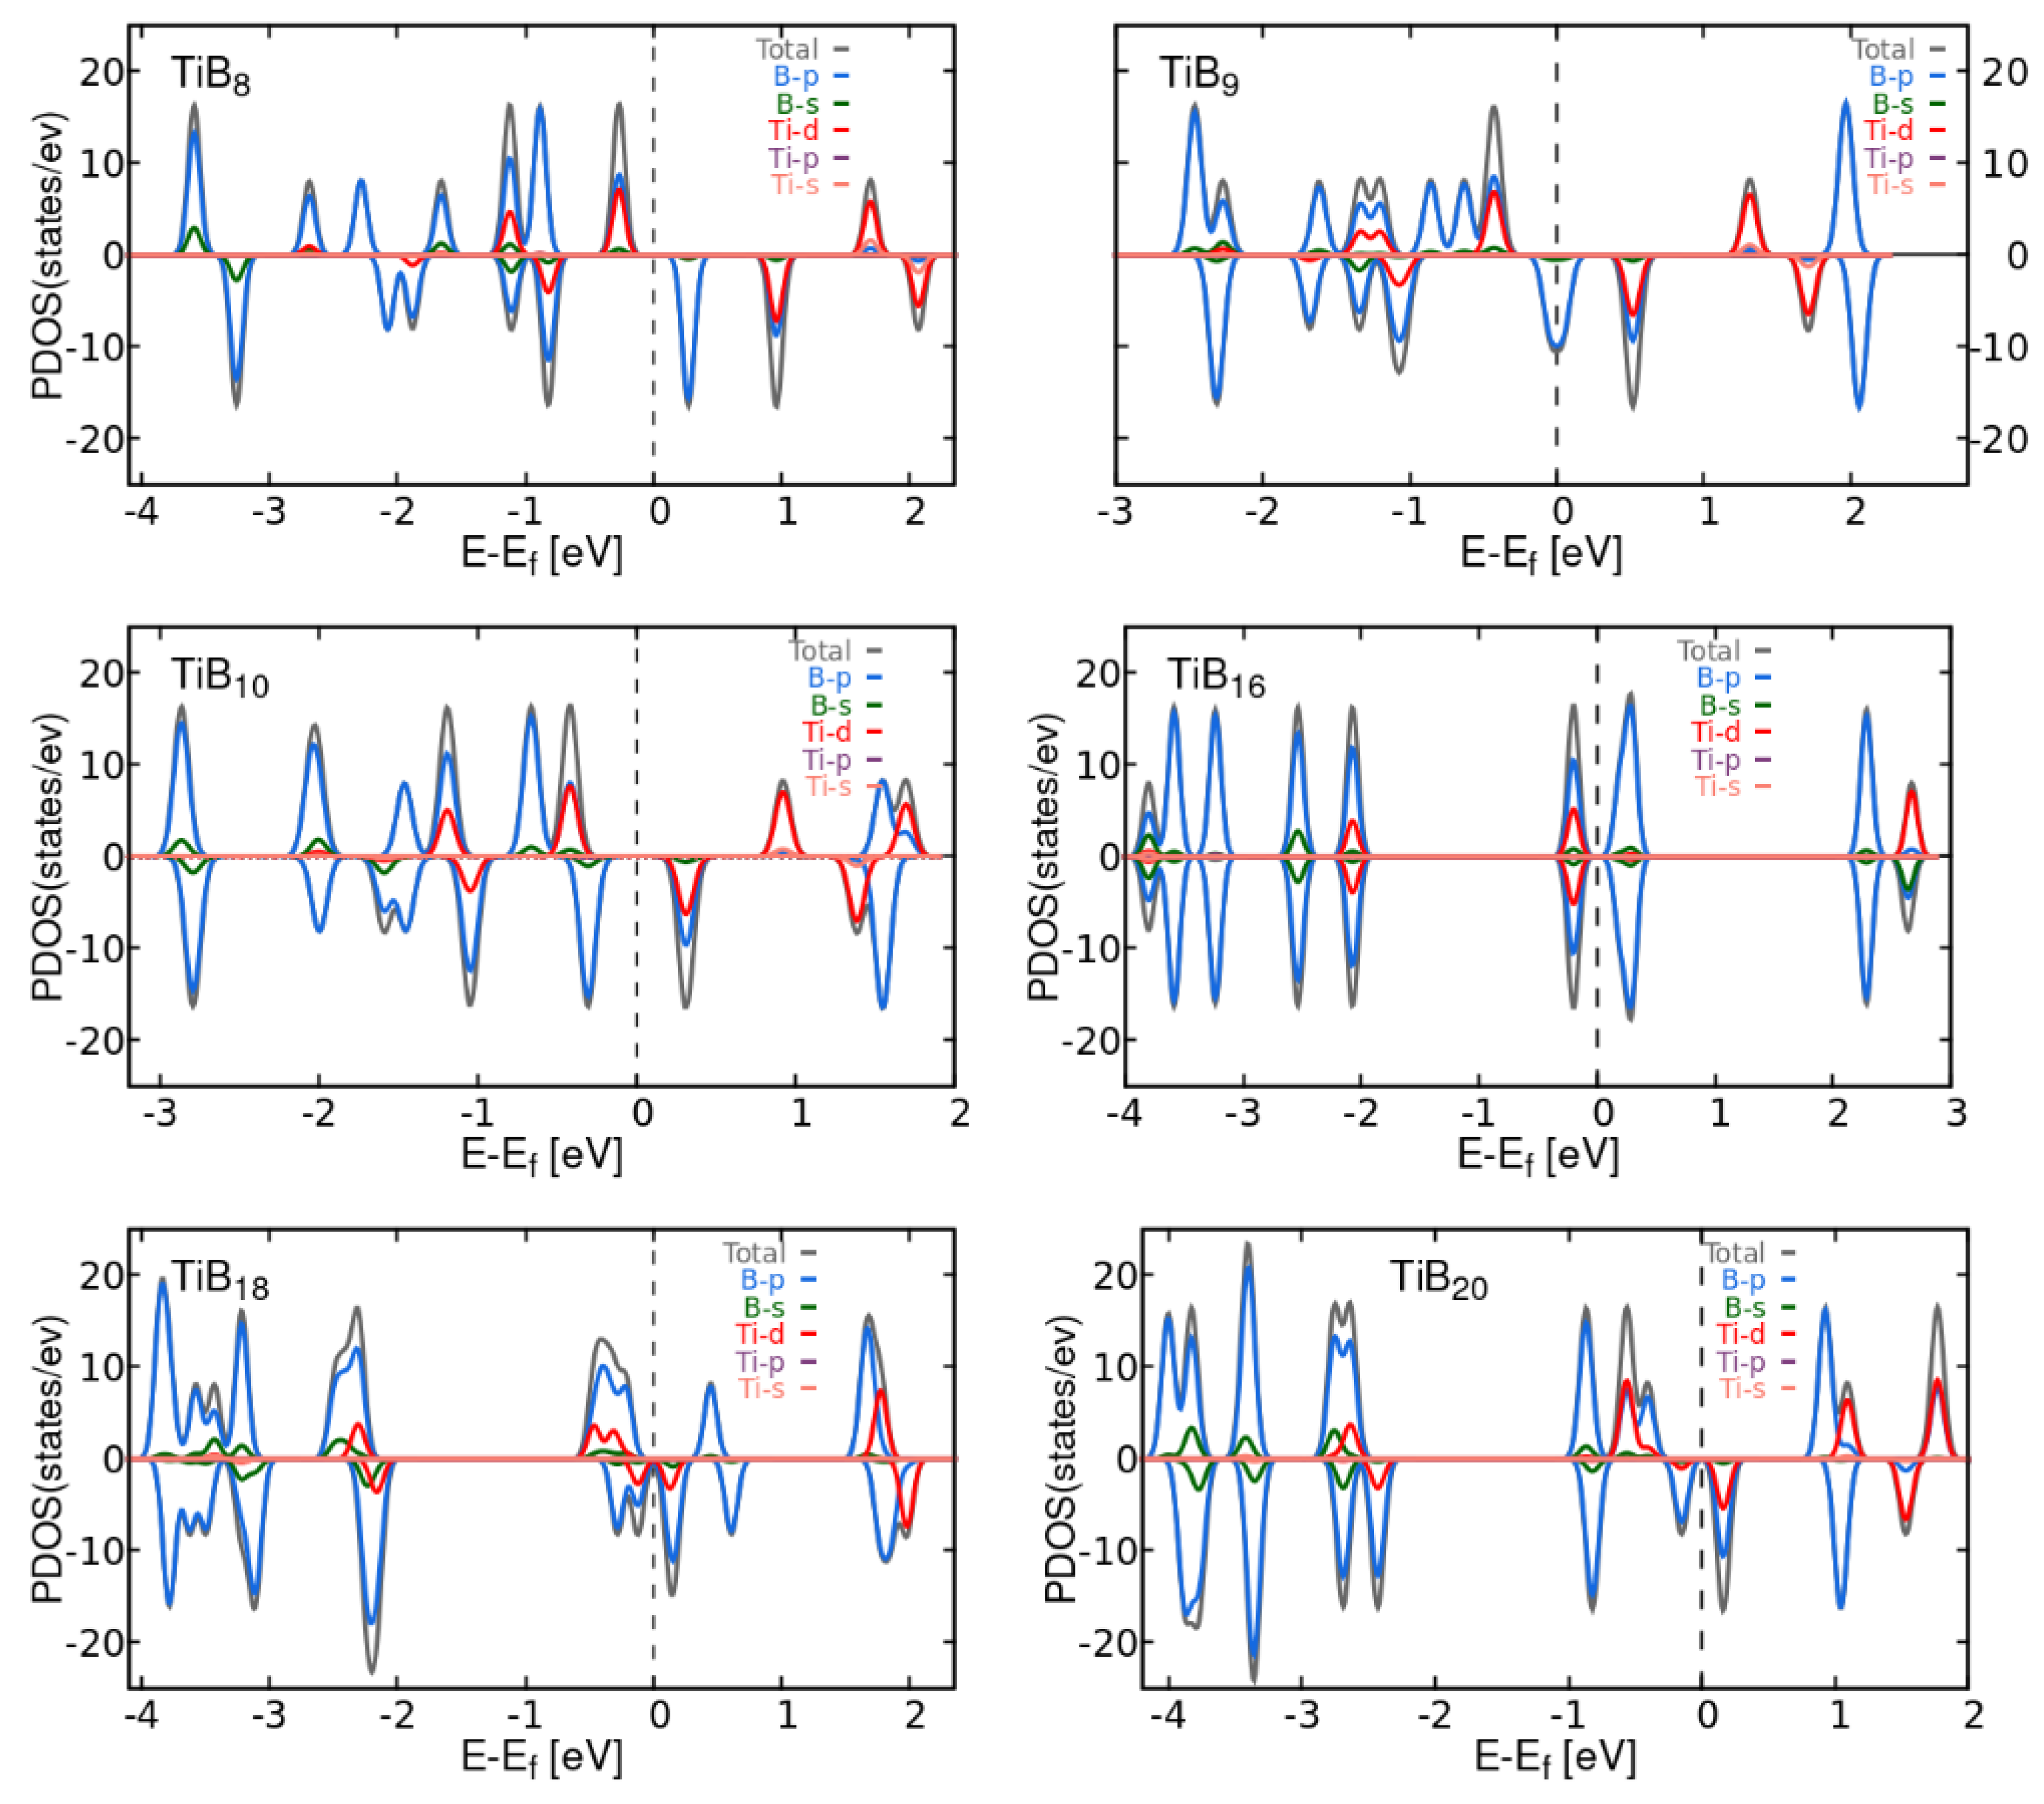
Figure A2.
Projected Density of States for Chromium-doped ring and drum structures.
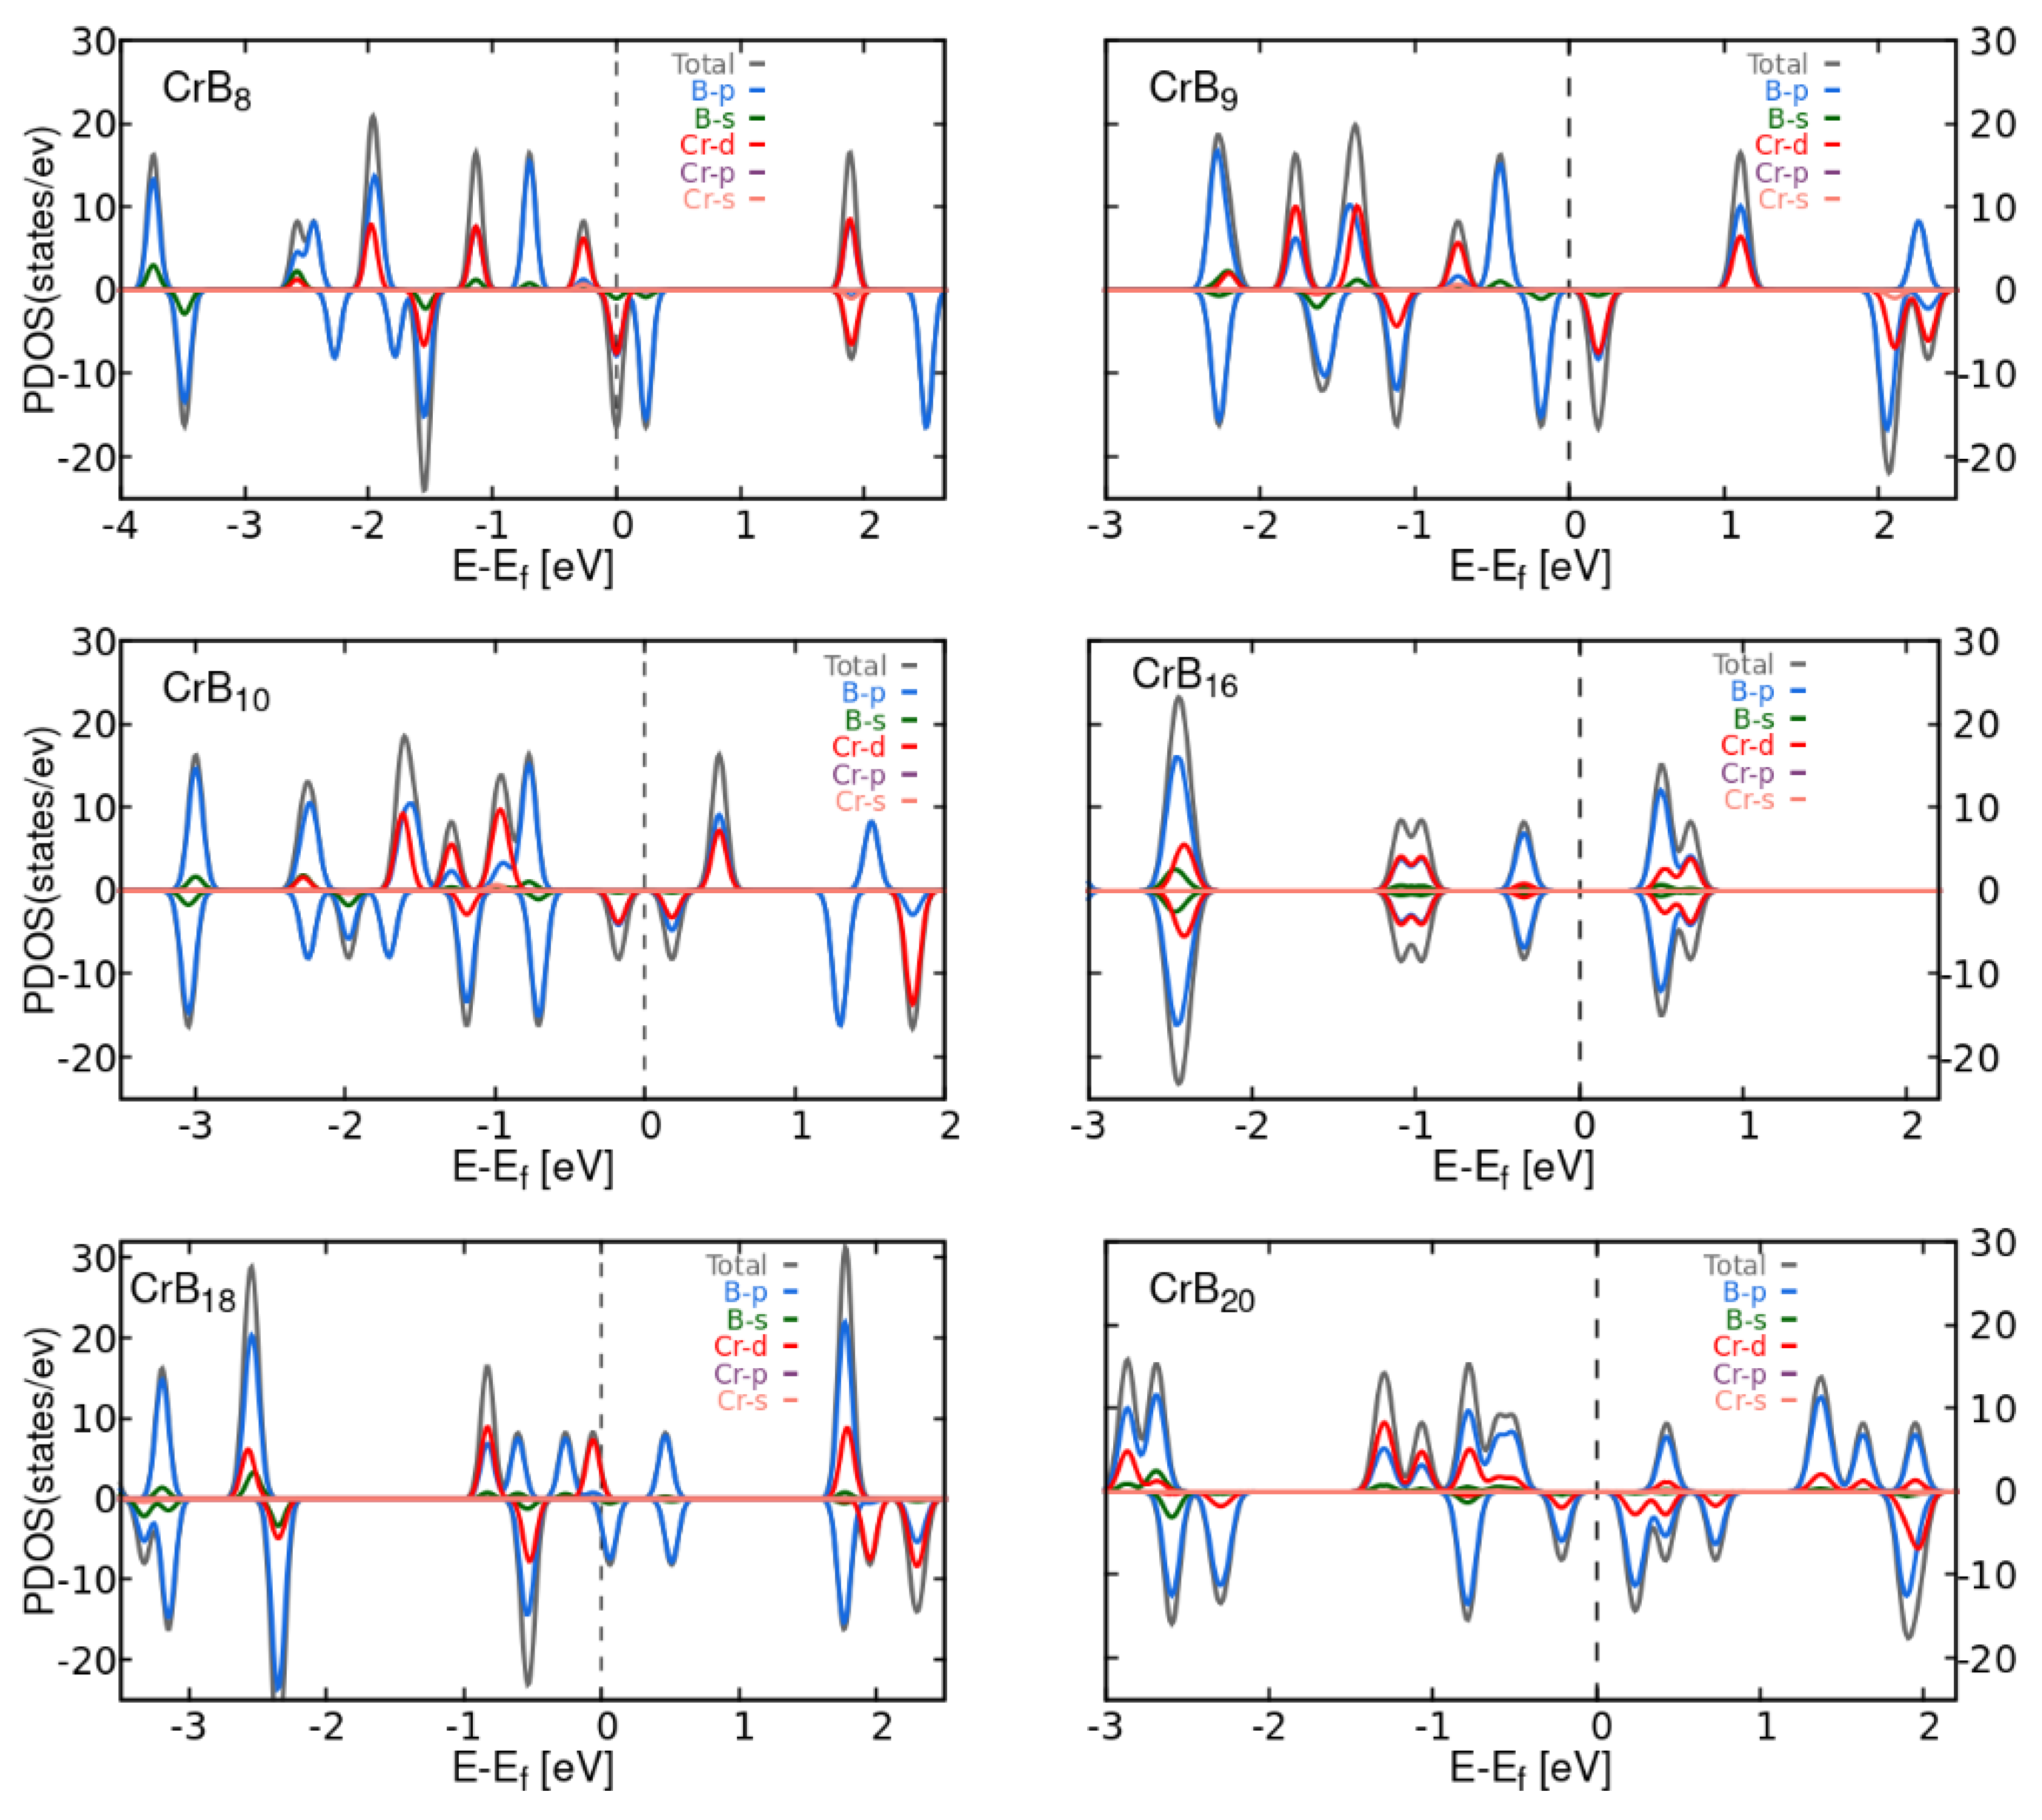
Figure A3.
Projected Density of States for Manganese-doped ring and drum structures.
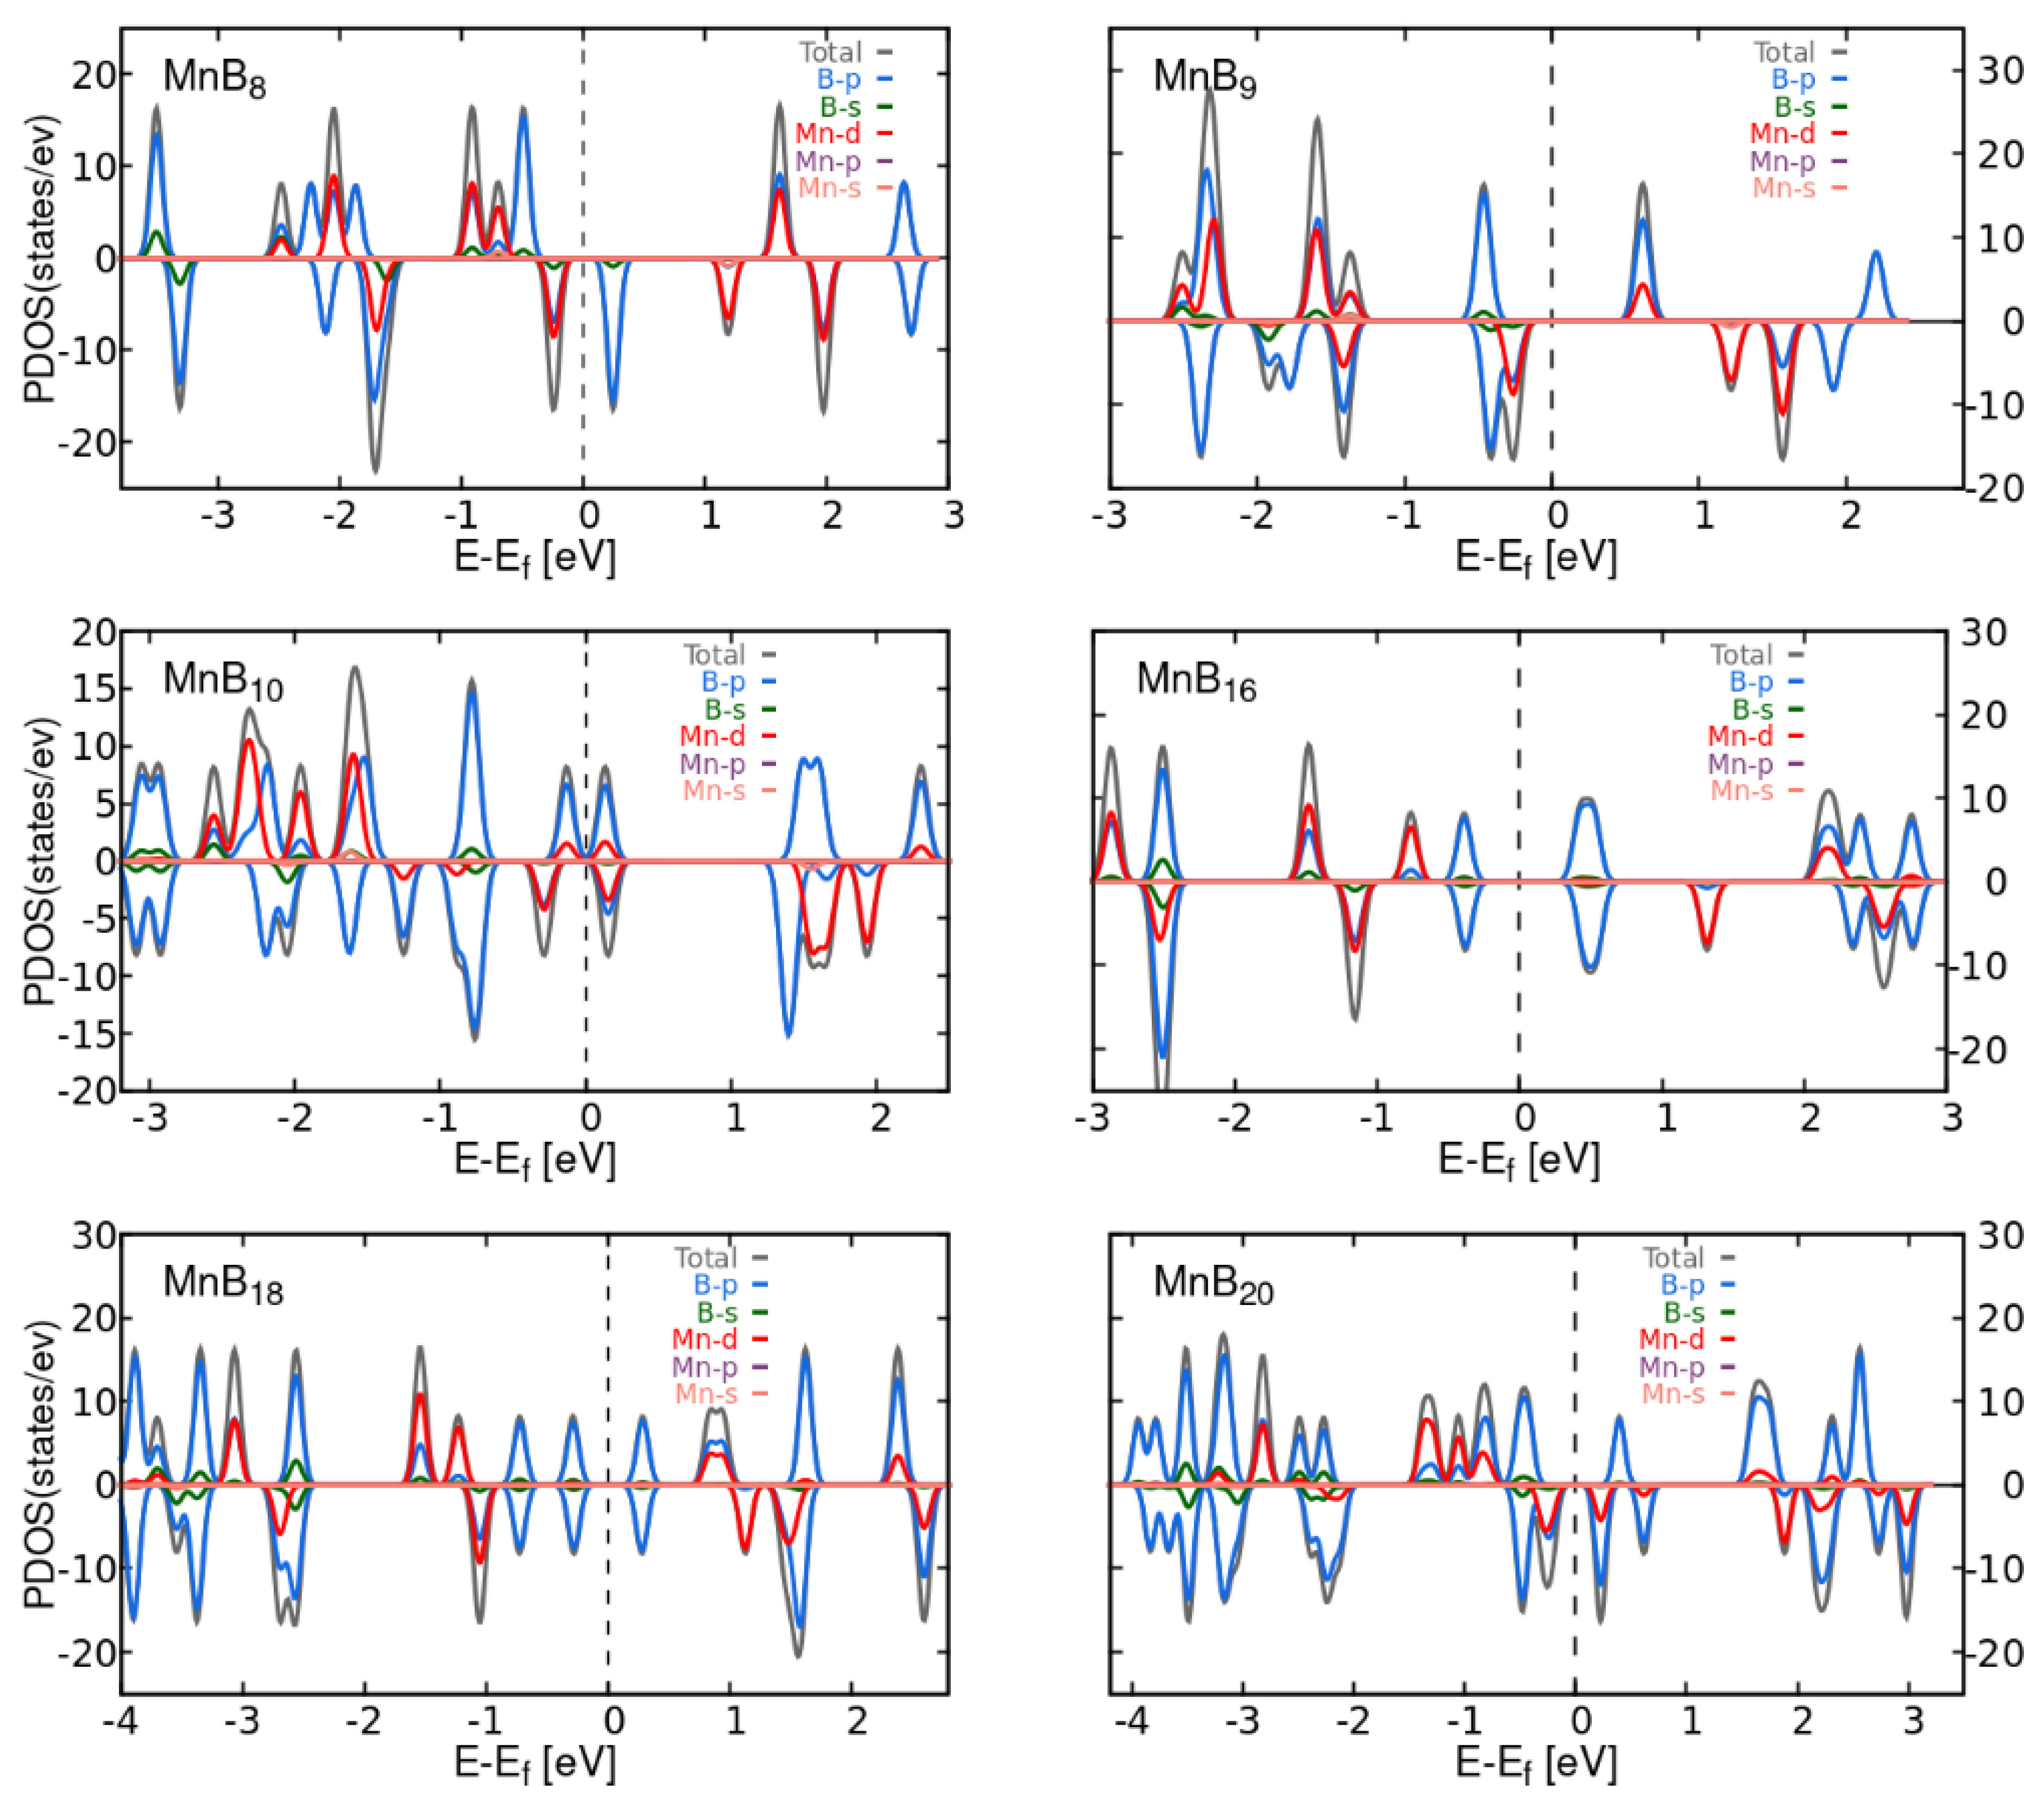
Figure A4.
Projected Density of States for Iron-doped ring and drum structures.
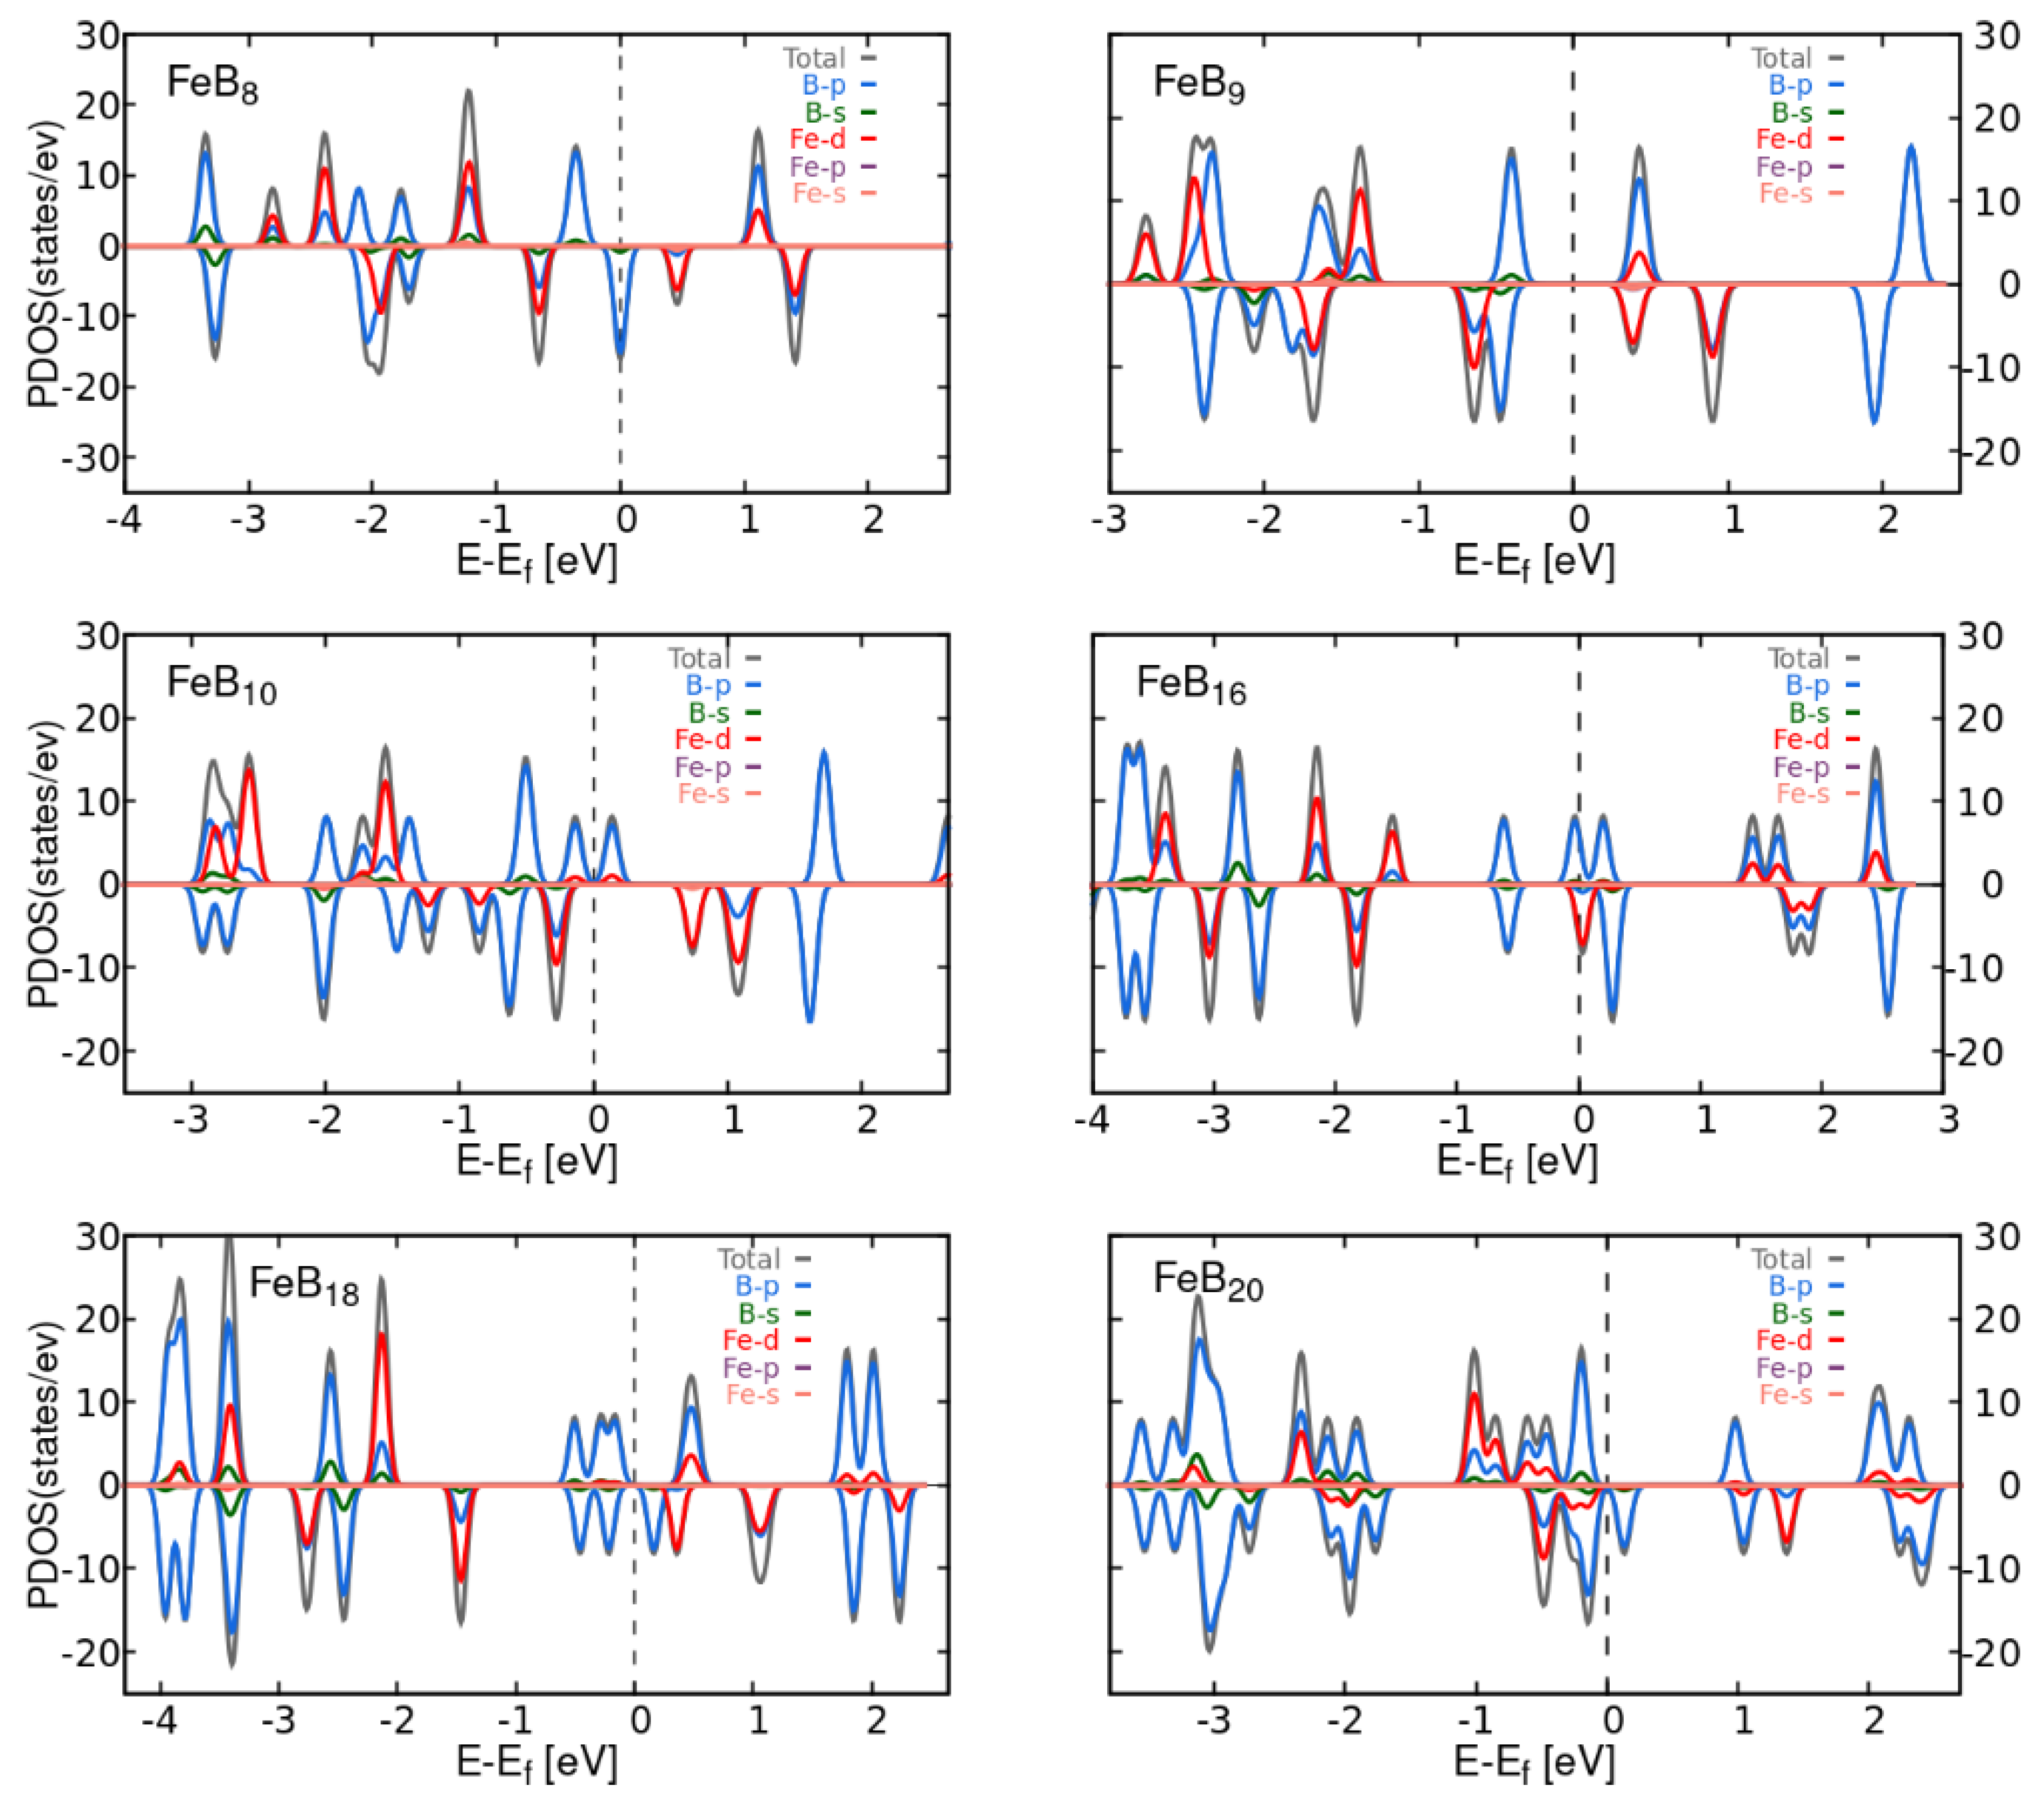
Figure A5.
Projected Density of States for Cobalt-doped ring and drum structures.
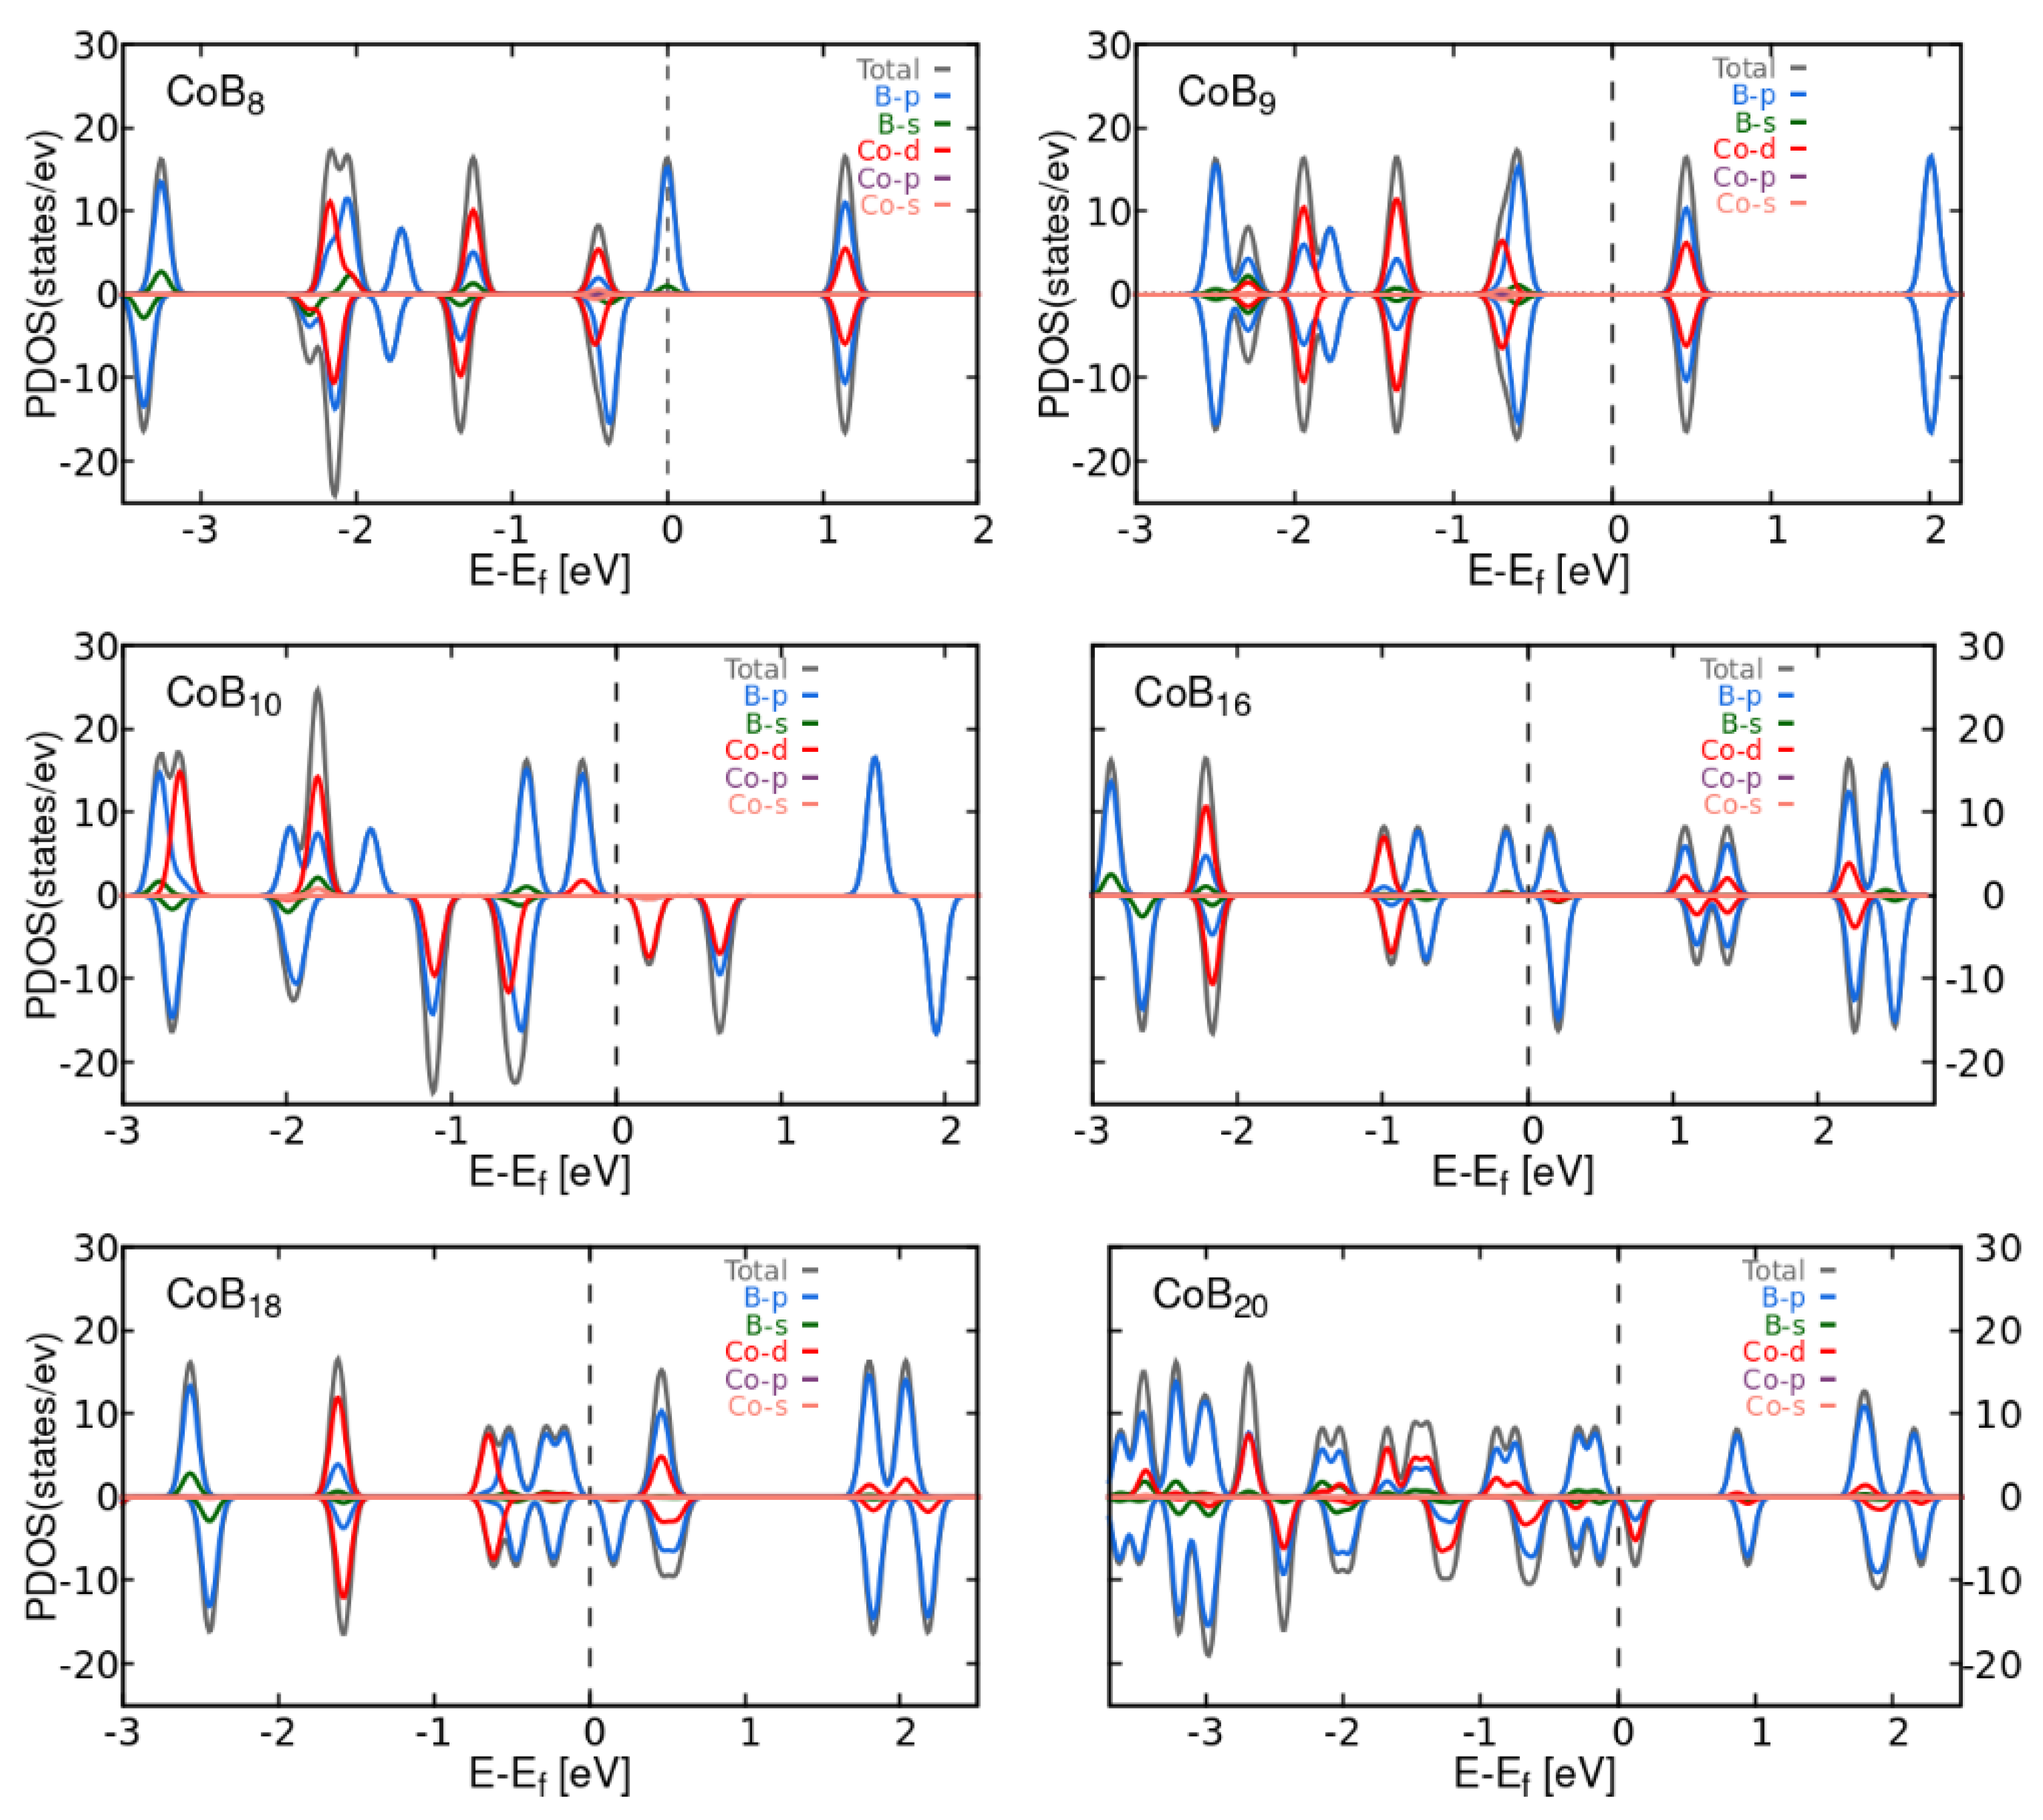
Figure A6.
Projected Density of States for Niobium-doped ring and drum structures.
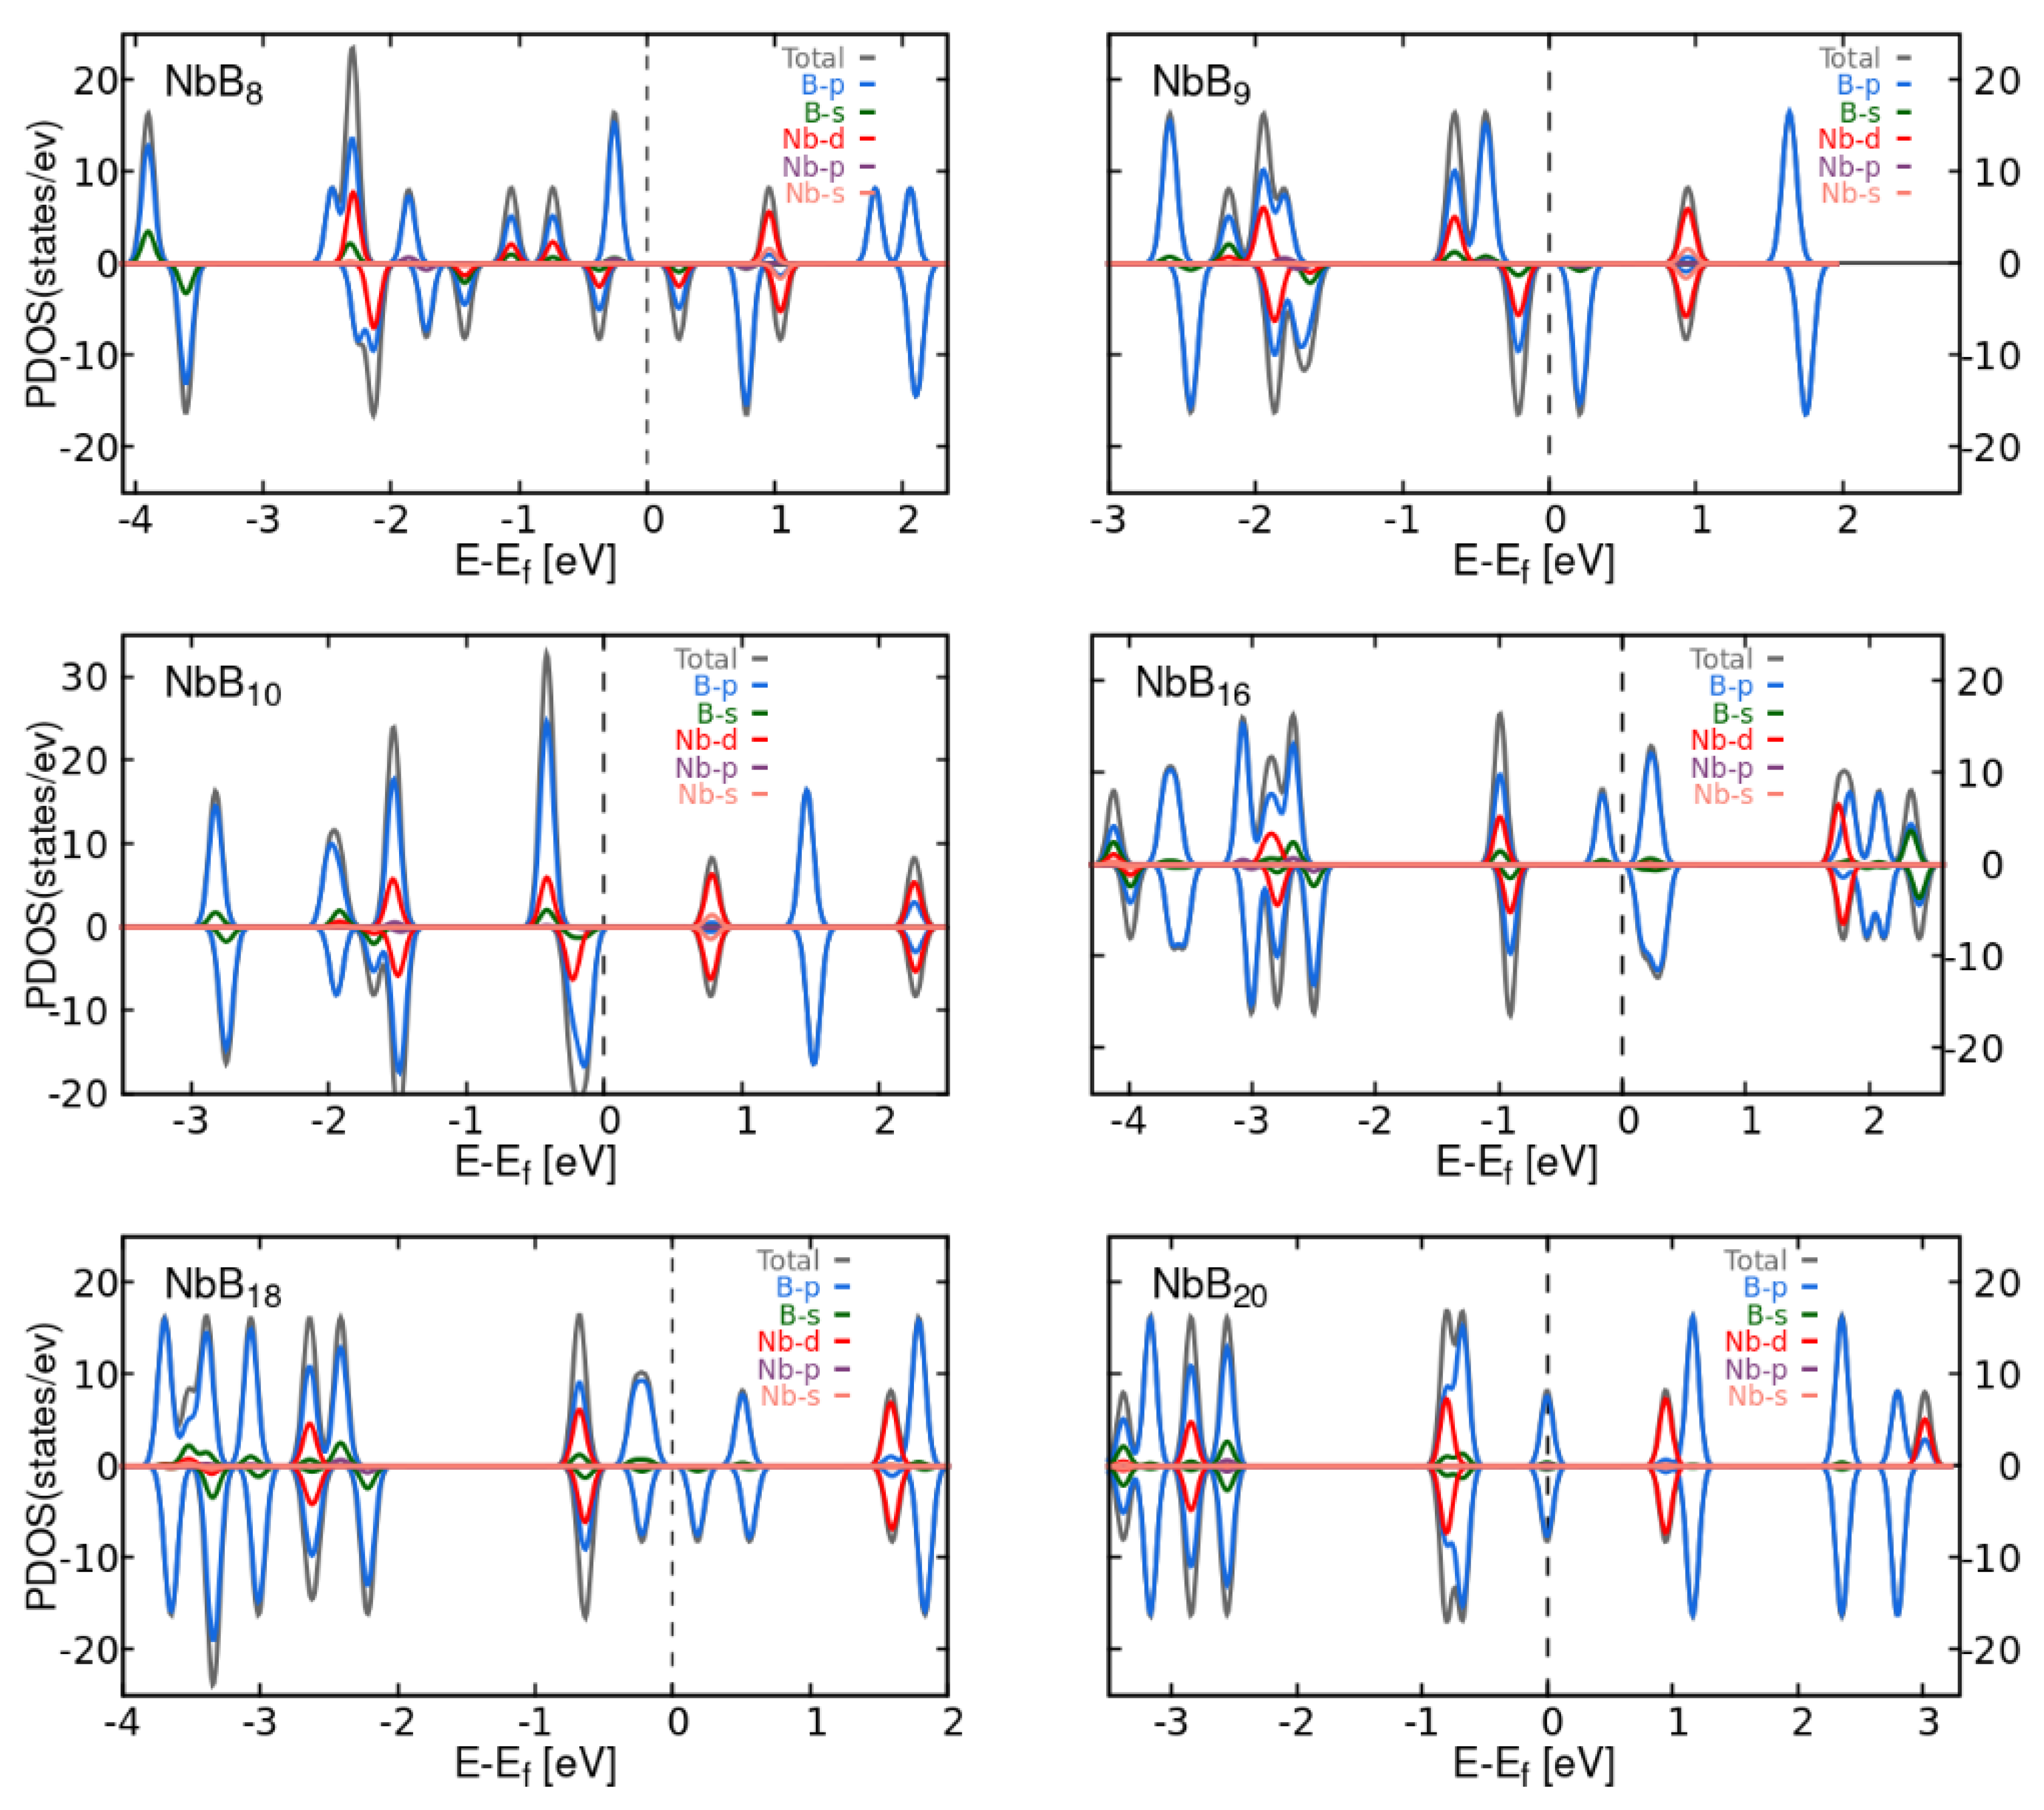
Figure A7.
Projected Density of States for Molybdenum-doped ring and drum structures.
Appendix B. Phonon frequencies for each cluster
The phonon frequencies for all the studied clusters are given in Tabs. from Table A1 to Table A14. The clusters point group symmetries specified in each table are given as identified by the Quantum ESPRESSO code.

Table A1.
Phonon frequencies of titanium doped ring configuration. Infrared (I) and Raman (R) active modes are indicated.
Table A1.
Phonon frequencies of titanium doped ring configuration. Infrared (I) and Raman (R) active modes are indicated.
| Frequency | TiB (cm) | TiB (cm) | TiB (cm) | |||
|---|---|---|---|---|---|---|
| 206.22 | A’ I+R | 123.91 | A I+R | 85.00 | A I+R | |
| 224.69 | A’ I+R | 185.43 | A I+R | 89.75 | A I+R | |
| 231.04 | A” I+R | 188.06 | A I+R | 116.18 | A I+R | |
| 370.44 | A’ I+R | 261.34 | A I+R | 224.62 | A I+R | |
| 373.23 | A” I+R | 268.23 | A I+R | 238.38 | A I+R | |
| 379.34 | A’ I+R | 328.19 | A I+R | 245.26 | A I+R | |
| 380.46 | A” I+R | 331.54 | A I+R | 248.23 | A I+R | |
| 384.39 | A’ I+R | 365.58 | A I+R | 265.62 | A I+R | |
| 402.30 | A” I+R | 366.66 | A I+R | 273.03 | A I+R | |
| 421.33 | A’ I+R | 448.66 | A I+R | 331.53 | A I+R | |
| 513.91 | A’ I+R | 449.73 | A I+R | 340.16 | A I+R | |
| 515.43 | A” I+R | 463.66 | A I+R | 421.58 | A I+R | |
| 554.40 | A’ I+R | 464.76 | A I+R | 427.34 | A I+R | |
| 685.14 | A’ I+R | 531.73 | A I+R | 449.42 | A I+R | |
| 802.41 | A” I+R | 539.14 | A I+R | 460.10 | A I+R | |
| 804.23 | A’ I+R | 644.94 | A I+R | 468.42 | A I+R | |
| 1085.07 | A’ I+R | 756.93 | A I+R | 487.28 | A I+R | |
| 1086.95 | A” I+R | 781.64 | A I+R | 587.46 | A I+R | |
| 1307.26 | A’ I+R | 943.35 | A I+R | 722.89 | A I+R | |
| 1307.79 | A” I+R | 951.86 | A I+R | 730.98 | A I+R | |
| 1424.21 | A” I+R | 1243.03 | A I+R | 1038.90 | A I+R | |
| 1248.48 | A I+R | 1041.70 | A I+R | |||
| 1495.99 | A I+R | 1228.73 | A I+R | |||
| 1496.94 | A I+R | 1230.83 | A I+R | |||
| 1552.41 | A I+R | |||||
| 1555.63 | A I+R | |||||
| 1640.06 | A I+R |
Table A2.
Phonon frequencies of titanium doped ring configuration. Infrared (I) and Raman (R) active modes are indicated.
Table A2.
Phonon frequencies of titanium doped ring configuration. Infrared (I) and Raman (R) active modes are indicated.
| Frequency | TiB (cm) | TiB (cm) | TiB (cm) | |||
|---|---|---|---|---|---|---|
| 48.41 | 65.62 | A I+R | 78.17 | A I+R | ||
| 71.92 | 180.53 | A I+R | 88.59 | A I+R | ||
| 213.37 | 187.50 | A I+R | 124.49 | A I+R | ||
| 216.99 | 207.90 | A I+R | 138.76 | A I+R | ||
| 230.46 | 244.07 | A I+R | 154.57 | A I+R | ||
| 268.49 | 271.62 | A I+R | 213.64 | A I+R | ||
| 335.67 | 303.26 | A I+R | 220.79 | A I+R | ||
| 363.85 | 323.22 | A I+R | 222.30 | A I+R | ||
| 377.72 | 357.73 | A I+R | 231.28 | A I+R | ||
| 381.98 | 375.13 | A I+R | 287.81 | A I+R | ||
| 391.88 | 396.60 | A I+R | 291.07 | A I+R | ||
| 409.97 | 406.65 | A I+R | 341.48 | A I+R | ||
| 411.31 | 414.40 | A I+R | 345.88 | A I+R | ||
| 428.03 | A” I+R | 427.55 | A I+R | 357.11 | A I+R | |
| 461.74 | 431.97 | A I+R | 372.06 | A I+R | ||
| 514.61 | 446.47 | A I+R | 375.65 | A I+R | ||
| 516.26 | 448.86 | A I+R | 399.73 | A I+R | ||
| 554.13 | 451.60 | A I+R | 405.12 | A I+R | ||
| 557.32 | 465.22 | A I+R | 414.74 | A I+R | ||
| 561.38 | 510.76 | A I+R | 418.21 | A I+R | ||
| 572.79 | 521.72 | A I+R | 432.87 | A I+R | ||
| 586.42 | 530.90 | A I+R | 469.65 | A I+R | ||
| 594.42 | 542.26 | A I+R | 473.51 | A I+R | ||
| 601.75 | 548.19 | A I+R | 480.53 | A I+R | ||
| 605.63 | 575.29 | A I+R | 487.47 | A I+R | ||
| 629.18 | A” I+R | 579.61 | A I+R | 490.59 | A I+R | |
| 653.86 | A” I+R | 582.88 | A I+R | 496.64 | A I+R | |
| 663.65 | A’ I+R | 589.95 | A I+R | 498.63 | A I+R | |
| 671.49 | A” I+R | 607.69 | A I+R | 504.49 | A I+R | |
| 702.62 | A’ I+R | 623.93 | A I+R | 532.31 | A I+R | |
| 780.41 | 639.71 | A I+R | 539.53 | A I+R | ||
| 801.22 | 644.62 | A I+R | 548.41 | A I+R | ||
| 801.60 | 655.34 | A I+R | 552.87 | A I+R | ||
| 849.86 | 663.95 | A I+R | 576.70 | A I+R | ||
| 851.32 | 743.02 | A I+R | 584.73 | A I+R | ||
| 974.28 | 748.57 | A I+R | 596.63 | A I+R | ||
| 982.95 | 760.10 | A I+R | 598.03 | A I+R | ||
| 1028.34 | A’ I+R | 826.29 | A I+R | 621.06 | A I+R | |
| 1028.95 | A” I+R | 838.67 | A I+R | 690.61 | A I+R | |
| 1078.20 | A’ I+R | 949.52 | A I+R | 698.59 | A I+R | |
| 1084.24 | A” I+R | 991.57 | A I+R | 700.29 | A I+R | |
| 1161.83 | A’ I+R | 1028.22 | A I+R | 809.58 | A I+R | |
| 1162.75 | A” I+R | 1047.53 | A I+R | 811.25 | A I+R | |
| 1170.47 | 1088.96 | A I+R | 963.38 | A I+R | ||
| 1172.85 | 1163.06 | A I+R | 966.50 | A I+R | ||
| 1174.51 | A I+R | 1049.24 | A I+R | |||
| 1186.85 | A I+R | 1050.51 | A I+R | |||
| 1205.38 | A I+R | 1211.38 | A I+R | |||
| 1230.20 | A I+R | 1214.89 | A I+R | |||
| 1232.55 | A I+R | 1223.34 | A I+R | |||
| 1246.96 | A I+R | 1226.35 | A I+R | |||
| 1326.76 | A I+R | |||||
| 1330.67 | A I+R | |||||
| 1350.50 | A I+R | |||||
| 1352.86 | A I+R | |||||
| 1361.82 | A I+R | |||||
| 1364.64 | A I+R |
Table A3.
Phonon frequencies of titanium doped ring configuration. Infrared (I) and Raman (R) active modes are indicated.
Table A3.
Phonon frequencies of titanium doped ring configuration. Infrared (I) and Raman (R) active modes are indicated.
| Frequency | CrB (cm) | CrB (cm) | CrB (cm) | |||
|---|---|---|---|---|---|---|
| 87.93 | 196.47 | A I+R | 44.03 | A I+R | ||
| 89.11 | 276.39 | A I+R | 74.20 | A I+R | ||
| 248.46 | A” I+R | 279.87 | A I+R | 107.17 | A I+R | |
| 264.32 | A’ I+R | 302.40 | A I+R | 145.49 | A I+R | |
| 396.19 | 356.02 | A I+R | 163.91 | A I+R | ||
| 400.86 | 364.95 | A I+R | 188.54 | A I+R | ||
| 403.44 | 397.43 | A I+R | 207.17 | A I+R | ||
| 436.04 | A” I+R | 406.44 | A I+R | 218.45 | A I+R | |
| 439.34 | A’ I+R | 414.43 | A I+R | 229.01 | A I+R | |
| 488.31 | A’ I+R | 474.42 | A I+R | 232.47 | A I+R | |
| 539.88 | 484.04 | A I+R | 279.80 | A I+R | ||
| 550.93 | 514.73 | A I+R | 326.56 | A I+R | ||
| 553.45 | 527.60 | A I+R | 377.09 | A I+R | ||
| 582.26 | A’ I+R | 605.38 | A I+R | 389.50 | A I+R | |
| 732.59 | A’ I+R | 647.37 | A I+R | 391.50 | A I+R | |
| 834.20 | 718.64 | A I+R | 405.31 | A I+R | ||
| 841.30 | 784.06 | A I+R | 443.08 | A I+R | ||
| 1058.24 | A” I+R | 828.17 | A I+R | 574.83 | A I+R | |
| 1070.54 | A’ I+R | 1042.96 | A I+R | 738.00 | A I+R | |
| 1185.26 | 1060.20 | A I+R | 745.55 | A I+R | ||
| 1187.53 | 1075.27 | A I+R | 1058.42 | A I+R | ||
| 1077.68 | A I+R | 1072.13 | A I+R | |||
| 1526.55 | A I+R | 1116.87 | A I+R | |||
| 1538.10 | A I+R | 1334.90 | A I+R | |||
| 1375.72 | A I+R | |||||
| 1612.60 | A I+R | |||||
| 1704.65 | A I+R |
Table A4.
Phonon frequencies for Cr doped drum configurations. Infrared (I) and Raman (R) active modes are indicated.
Table A4.
Phonon frequencies for Cr doped drum configurations. Infrared (I) and Raman (R) active modes are indicated.
| Frequency | CrB (cm) | CrB (cm) | CrB (cm) | |||
|---|---|---|---|---|---|---|
| 160.53 | A” I+R | 59.27 | A I+R | 89.91 | A I+R | |
| 200.05 | A’ I+R | 151.83 | A I+R | 154.53 | A I+R | |
| 281.70 | A’ I+R | 215.21 | A I+R | 154.66 | A I+R | |
| 317.92 | A” I+R | 226.49 | A I+R | 158.42 | A I+R | |
| 344.98 | A’ I+R | 233.87 | A I+R | 174.50 | A I+R | |
| 365.20 | A” I+R | 299.42 | A I+R | 259.01 | A I+R | |
| 368.09 | A’ I+R | 302.44 | A I+R | 275.03 | A I+R | |
| 393.15 | A” I+R | 325.75 | A I+R | 287.62 | A I+R | |
| 399.64 | A’ I+R | 328.19 | A I+R | 302.35 | A I+R | |
| 413.38 | A’ I+R | 344.05 | A I+R | 321.39 | A I+R | |
| 428.04 | A” I+R | 345.22 | A I+R | 341.26 | A I+R | |
| 437.21 | A’ I+R | 373.51 | A I+R | 366.58 | A I+R | |
| 447.12 | A” I+R | 380.91 | A I+R | 371.95 | A I+R | |
| 493.68 | A” I+R | 388.30 | A I+R | 386.25 | A I+R | |
| 497.23 | A’ I+R | 391.79 | A I+R | 389.54 | A I+R | |
| 500.33 | A” I+R | 423.15 | A I+R | 409.16 | A I+R | |
| 502.45 | A’ I+R | 436.78 | A I+R | 432.05 | A I+R | |
| 541.59 | A” I+R | 438.11 | A I+R | 444.83 | A I+R | |
| 550.71 | A” I+R | 517.63 | A I+R | 461.68 | A I+R | |
| 559.29 | A’ I+R | 524.46 | A I+R | 468.89 | A I+R | |
| 569.90 | A’ I+R | 527.23 | A I+R | 483.19 | A I+R | |
| 586.55 | A’ I+R | 532.49 | A I+R | 490.07 | A I+R | |
| 605.05 | A” I+R | 550.12 | A I+R | 509.20 | A I+R | |
| 611.36 | A’ I+R | 556.48 | A I+R | 524.29 | A I+R | |
| 614.00 | A’ I+R | 563.54 | A I+R | 530.43 | A I+R | |
| 625.91 | A” I+R | 564.14 | A I+R | 534.86 | A I+R | |
| 640.47 | A’ I+R | 571.50 | A I+R | 554.07 | A I+R | |
| 641.12 | A” I+R | 574.36 | A I+R | 586.46 | A I+R | |
| 654.37 | A” I+R | 581.64 | A I+R | 591.43 | A I+R | |
| 670.02 | A’ I+R | 605.72 | A I+R | 610.68 | A I+R | |
| 725.02 | A’ I+R | 612.56 | A I+R | 623.68 | A I+R | |
| 797.45 | A’ I+R | 620.72 | A I+R | 656.04 | A I+R | |
| 798.26 | A” I+R | 626.94 | A I+R | 661.97 | A I+R | |
| 886.53 | A’ I+R | 634.23 | A I+R | 664.99 | A I+R | |
| 893.82 | A” I+R | 713.16 | A I+R | 671.96 | A I+R | |
| 1021.65 | A” I+R | 751.79 | A I+R | 676.42 | A I+R | |
| 1040.64 | A’ I+R | 754.42 | A I+R | 712.89 | A I+R | |
| 1109.57 | A” I+R | 853.21 | A I+R | 717.67 | A I+R | |
| 1121.10 | A’ I+R | 856.63 | A I+R | 729.46 | A I+R | |
| 1164.61 | A’ I+R | 1014.90 | A I+R | 751.05 | A I+R | |
| 1173.34 | A” I+R | 1018.72 | A I+R | 803.93 | A I+R | |
| 1227.11 | A’ I+R | 1079.29 | A I+R | 811.58 | A I+R | |
| 1227.70 | A’ I+R | 1088.07 | A I+R | 834.20 | A I+R | |
| 1269.63 | A” I+R | 1222.28 | A I+R | 934.76 | A I+R | |
| 1274.26 | A” I+R | 1225.04 | A I+R | 947.80 | A I+R | |
| 1232.58 | A I+R | 1011.78 | A I+R | |||
| 1256.32 | A I+R | 1014.47 | A I+R | |||
| 1256.77 | A I+R | 1132.64 | A I+R | |||
| 1262.48 | A I+R | 1139.91 | A I+R | |||
| 1312.27 | A I+R | 1159.33 | A I+R | |||
| 1314.97 | A I+R | 1167.21 | A I+R | |||
| 1224.01 | A I+R | |||||
| 1226.23 | A I+R | |||||
| 1229.13 | A I+R | |||||
| 1262.29 | A I+R | |||||
| 1285.89 | A I+R | |||||
| 1309.64 | A I+R |
Table A5.
Phonon frequencies of titanium doped ring configuration. Infrared (I) and Raman (R) active modes are indicated.
Table A5.
Phonon frequencies of titanium doped ring configuration. Infrared (I) and Raman (R) active modes are indicated.
| Frequency | MnB (cm) | MnB (cm) | MnB (cm) | |||
|---|---|---|---|---|---|---|
| 140.21 | 135.68 | A I+R | 69.60 | A I+R | ||
| 250.98 | A’ I+R | 157.36 | A I+R | 101.24 | A I+R | |
| 267.65 | A” I+R | 160.88 | A I+R | 119.25 | A I+R | |
| 411.25 | 270.87 | A I+R | 141.23 | A I+R | ||
| 421.56 | 284.32 | A I+R | 145.87 | A I+R | ||
| 431.86 | 299.87 | A I+R | 171.55 | A I+R | ||
| 433.27 | 306.29 | A I+R | 200.51 | A I+R | ||
| 445.64 | 338.21 | A I+R | 239.89 | A I+R | ||
| 455.34 | 339.12 | A I+R | 247.45 | A I+R | ||
| 457.91 | 366.86 | A I+R | 260.50 | A I+R | ||
| 472.37 | A’ I+R | 383.65 | A I+R | 320.72 | A I+R | |
| 490.44 | 441.44 | A I+R | 375.16 | A I+R | ||
| 526.06 | 447.02 | A I+R | 386.26 | A I+R | ||
| 745.05 | 454.49 | A I+R | 404.56 | A I+R | ||
| 844.63 | 454.85 | A I+R | 421.73 | A I+R | ||
| 844.85 | 613.90 | A I+R | 425.31 | A I+R | ||
| 1030.34 | 784.11 | A I+R | 454.09 | A I+R | ||
| 1034.55 | 787.82 | A I+R | 563.31 | A I+R | ||
| 1121.44 | 1088.84 | A I+R | 709.87 | A I+R | ||
| 1122.43 | 1094.68 | A I+R | 761.80 | A I+R | ||
| 1455.81 | A” I+R | 1358.7 | A I+R | 1011.35 | A I+R | |
| 1360.87 | A I+R | 1058.85 | A I+R | |||
| 1549.66 | A I+R | 1254.93 | A I+R | |||
| 1661.71 | A I+R | 1312.99 | A I+R | |||
| 1342.30 | A I+R | |||||
| 1587.27 | A I+R | |||||
| 1677.08 | A I+R |
Table A6.
Phonon frequencies of titanium doped ring configuration. Infrared (I) and Raman (R) active modes are indicated.
Table A6.
Phonon frequencies of titanium doped ring configuration. Infrared (I) and Raman (R) active modes are indicated.
| Frequency | MnB (cm) | MnB (cm) | MnB (cm) | |||
|---|---|---|---|---|---|---|
| 122.13 | A” I+R | 130.70 | A I+R | 27.00 | A I+R | |
| 148.07 | A’ I+R | 205.58 | A I+R | 36.22 | A I+R | |
| 259.72 | A’ I+R | 213.60 | A I+R | 82.05 | A I+R | |
| 295.09 | A” I+R | 241.10 | A I+R | 152.93 | A I+R | |
| 301.85 | A” I+R | 247.32 | A I+R | 154.10 | A I+R | |
| 313.14 | A’ I+R | 282.31 | A I+R | 249.05 | A I+R | |
| 333.82 | A” I+R | 285.10 | A I+R | 268.34 | A I+R | |
| 344.93 | A’ I+R | 328.76 | A I+R | 305.02 | A I+R | |
| 374.41 | A’ I+R | 340.91 | A I+R | 319.88 | A I+R | |
| 386.44 | A” I+R | 348.24 | A I+R | 324.53 | A I+R | |
| 402.75 | A’ I+R | 354.95 | A I+R | 337.40 | A I+R | |
| 435.67 | A” I+R | 362.90 | A I+R | 347.36 | A I+R | |
| 439.86 | A’ I+R | 401.81 | A I+R | 364.77 | A I+R | |
| 471.63 | A” I+R | 411.11 | A I+R | 385.24 | A I+R | |
| 491.09 | A” I+R | 415.42 | A I+R | 391.83 | A I+R | |
| 503.18 | A’ I+R | 451.19 | A I+R | 397.88 | A I+R | |
| 508.90 | A” I+R | 465.55 | A I+R | 407.75 | A I+R | |
| 509.81 | A’ I+R | 466.85 | A I+R | 421.61 | A I+R | |
| 512.64 | A’ I+R | 510.58 | A I+R | 426.66 | A I+R | |
| 529.24 | A” I+R | 514.66 | A I+R | 444.57 | A I+R | |
| 563.75 | A’ I+R | 515.79 | A I+R | 470.51 | A I+R | |
| 567.12 | A” I+R | 528.36 | A I+R | 499.25 | A I+R | |
| 579.15 | A’ I+R | 537.72 | A I+R | 512.44 | A I+R | |
| 595.89 | A’ I+R | 554.22 | A I+R | 531.89 | A I+R | |
| 599.41 | A” I+R | 559.33 | A I+R | 542.92 | A I+R | |
| 600.40 | A’ I+R | 568.67 | A I+R | 551.45 | A I+R | |
| 627.28 | A” I+R | 577.64 | A I+R | 557.88 | A I+R | |
| 627.91 | A’ I+R | 590.77 | A I+R | 566.20 | A I+R | |
| 648.99 | A” I+R | 598.35 | A I+R | 582.03 | A I+R | |
| 661.58 | A’ I+R | 609.19 | A I+R | 592.69 | A I+R | |
| 712.79 | A’ I+R | 614.58 | A I+R | 595.63 | A I+R | |
| 797.47 | A’ I+R | 624.25 | A I+R | 626.58 | A I+R | |
| 799.21 | A” I+R | 635.05 | A I+R | 638.04 | A I+R | |
| 898.04 | A’ I+R | 636.61 | A I+R | 651.69 | A I+R | |
| 899.22 | A” I+R | 705.18 | A I+R | 660.06 | A I+R | |
| 1037.5 | A” I+R | 745.29 | A I+R | 672.36 | A I+R | |
| 1052.52 | A’ I+R | 747.39 | A I+R | 710.48 | A I+R | |
| 1123.48 | A” I+R | 848.99 | A I+R | 716.24 | A I+R | |
| 1136.15 | A’ I+R | 851.68 | A I+R | 722.12 | A I+R | |
| 1196.01 | A’ I+R | 996.60 | A I+R | 738.47 | A I+R | |
| 1205.92 | A” I+R | 1040.81 | A I+R | 798.34 | A I+R | |
| 1244.24 | A’ I+R | 1070.53 | A I+R | 816.20 | A I+R | |
| 1270.74 | A” I+R | 1089.35 | A I+R | 833.16 | A I+R | |
| 1277.74 | A’ I+R | 1248.26 | A I+R | 945.39 | A I+R | |
| 1283.42 | A” I+R | 1249.55 | A I+R | 947.22 | A I+R | |
| 1256.63 | A I+R | 1000.55 | A I+R | |||
| 1257.30 | A I+R | 1001.71 | A I+R | |||
| 1277.30 | A I+R | 1159.98 | A I+R | |||
| 1323.45 | A I+R | 1163.05 | A I+R | |||
| 1327.24 | A I+R | 1176.67 | A I+R | |||
| 1340.70 | A I+R | 1176.92 | A I+R | |||
| 1235.72 | A I+R | |||||
| 1239.22 | A I+R | |||||
| 1244.10 | A I+R | |||||
| 1247.03 | A I+R | |||||
| 1293.39 | A I+R | |||||
| 1297.31 | A I+R |
Table A7.
Phonon frequencies of titanium doped ring configuration. Infrared (I) and Raman (R) active modes are indicated.
Table A7.
Phonon frequencies of titanium doped ring configuration. Infrared (I) and Raman (R) active modes are indicated.
| Frequency | FeB (cm) | FeB (cm) | FeB (cm) | |||
|---|---|---|---|---|---|---|
| 133.40 | A I+R | 128.48 | A I+R | -22.15 | A I+R | |
| 224.32 | A I+R | 134.08 | A I+R | 53.03 | A I+R | |
| 226.41 | A I+R | 145.47 | A I+R | 62.54 | A I+R | |
| 383.79 | A I+R | 267.53 | A I+R | 121.02 | A I+R | |
| 393.28 | A I+R | 276.13 | A I+R | 147.13 | A I+R | |
| 405.13 | A I+R | 302.00 | A I+R | 178.08 | A I+R | |
| 409.61 | A I+R | 303.36 | A I+R | 195.37 | A I+R | |
| 418.95 | A I+R | 314.57 | A I+R | 197.58 | A I+R | |
| 420.62 | A I+R | 324.97 | A I+R | 214.59 | A I+R | |
| 467.53 | A I+R | 346.02 | A I+R | 255.09 | A I+R | |
| 476.08 | A I+R | 353.79 | A I+R | 277.24 | A I+R | |
| 477.54 | A I+R | 396.97 | A I+R | 328.88 | A I+R | |
| 520.92 | A I+R | 404.54 | A I+R | 354.13 | A I+R | |
| 712.11 | A I+R | 452.36 | A I+R | 363.65 | A I+R | |
| 840.35 | A I+R | 453.69 | A I+R | 368.98 | A I+R | |
| 843.51 | A I+R | 639.43 | A I+R | 402.22 | A I+R | |
| 1095.31 | A I+R | 796.92 | A I+R | 435.17 | A I+R | |
| 1103.15 | A I+R | 805.37 | A I+R | 576.90 | A I+R | |
| 1331.41 | A I+R | 1134.73 | A I+R | 722.45 | A I+R | |
| 1343.31 | A I+R | 1140.10 | A I+R | 782.20 | A I+R | |
| 1465.65 | A I+R | 1435.83 | A I+R | 1027.66 | A I+R | |
| 1437.46 | A I+R | 1084.49 | A I+R | |||
| 1618.87 | A I+R | 1373.17 | A I+R | |||
| 1620.88 | A I+R | 1380.96 | A I+R | |||
| 1614.33 | A I+R | |||||
| 1626.26 | A I+R | |||||
| 1714.97 | A I+R |
Table A8.
Phonon frequencies of iron doped drum configuration. Infrared (I) and Raman (R) active modes are indicated.
Table A8.
Phonon frequencies of iron doped drum configuration. Infrared (I) and Raman (R) active modes are indicated.
| frequency | FeB (cm) | FeB (cm) | FeB (cm) | |||
|---|---|---|---|---|---|---|
| 75.14 | 79.27 | A I+R | 64.30 | A I+R | ||
| 121.32 | 116.64 | A I+R | 78.44 | A I+R | ||
| 129.29 | 156.43 | A I+R | 144.22 | A I+R | ||
| 141.11 | A” I+R | 196.52 | A I+R | 146.62 | A I+R | |
| 263.02 | 222.01 | A I+R | 176.12 | A I+R | ||
| 282.42 | 236.64 | A I+R | 193.43 | A I+R | ||
| 329.72 | 250.30 | A I+R | 258.13 | A I+R | ||
| 341.01 | 308.08 | A I+R | 294.80 | A I+R | ||
| 352.32 | 309.17 | A I+R | 301.95 | A I+R | ||
| 357.58 | 318.45 | A I+R | 319.23 | A I+R | ||
| 358.23 | 326.52 | A I+R | 324.93 | A I+R | ||
| 397.74 | 327.83 | A I+R | 343.10 | A I+R | ||
| 401.93 | 377.66 | A I+R | 360.90 | A I+R | ||
| 423.08 | 396.03 | A I+R | 370.68 | A I+R | ||
| 427.67 | A” I+R | 398.02 | A I+R | 381.40 | A I+R | |
| 445.85 | A’ I+R | 443.40 | A I+R | 401.29 | A I+R | |
| 496.75 | 453.10 | A I+R | 415.90 | A I+R | ||
| 504.06 | 459.54 | A I+R | 422.69 | A I+R | ||
| 507.18 | 473.23 | A I+R | 435.98 | A I+R | ||
| 518.93 | 477.45 | A I+R | 458.96 | A I+R | ||
| 529.96 | 479.29 | A I+R | 493.18 | A I+R | ||
| 530.70 | 501.22 | A I+R | 497.50 | A I+R | ||
| 537.57 | 523.79 | A I+R | 525.10 | A I+R | ||
| 543.55 | 526.24 | A I+R | 558.65 | A I+R | ||
| 558.71 | 528.54 | A I+R | 565.16 | A I+R | ||
| 567.45 | 544.09 | A I+R | 580.26 | A I+R | ||
| 572.90 | A’ I+R | 549.00 | A I+R | 616.03 | A I+R | |
| 577.23 | A” I+R | 554.77 | A I+R | 622.21 | A I+R | |
| 614.54 | 559.19 | A I+R | 628.83 | A I+R | ||
| 649.37 | A’ I+R | 563.51 | A I+R | 637.04 | A I+R | |
| 685.97 | 575.72 | A I+R | 651.22 | A I+R | ||
| 798.02 | 585.47 | A I+R | 669.40 | A I+R | ||
| 800.19 | 587.52 | A I+R | 677.94 | A I+R | ||
| 824.08 | A” I+R | 609.16 | A I+R | 690.66 | A I+R | |
| 889.22 | 658.86 | A I+R | 693.92 | A I+R | ||
| 890.37 | 745.59 | A I+R | 712.02 | A I+R | ||
| 1033.99 | A’ I+R | 751.48 | A I+R | 720.57 | A I+R | |
| 1073.42 | A” I+R | 847.73 | A I+R | 726.85 | A I+R | |
| 1101.09 | A’ I+R | 850.24 | A I+R | 779.83 | A I+R | |
| 1112.60 | A’ I+R | 1014.30 | A I+R | 790.20 | A I+R | |
| 1141.75 | A” I+R | 1035.94 | A I+R | 819.42 | A I+R | |
| 1223.30 | A” I+R | 1068.58 | A I+R | 850.42 | A I+R | |
| 1223.32 | A’ I+R | 1076.31 | A I+R | 857.09 | A I+R | |
| 1270.65 | 1245.54 | A I+R | 927.42 | A I+R | ||
| 1272.06 | 1261.98 | A I+R | 958.75 | A I+R | ||
| 1264.37 | A I+R | 998.25 | A I+R | |||
| 1270.61 | A I+R | 1014.79 | A I+R | |||
| 1271.87 | A I+R | 1026.92 | A I+R | |||
| 1331.34 | A I+R | 1121.23 | A I+R | |||
| 1331.72 | A I+R | 1122.90 | A I+R | |||
| 1355.65 | A I+R | 1154.21 | A I+R | |||
| 1163.22 | A I+R | |||||
| 1213.52 | A I+R | |||||
| 1216.40 | A I+R | |||||
| 1225.36 | A I+R | |||||
| 1249.61 | A I+R | |||||
| 1264.58 | A I+R |
Table A9.
Phonon frequencies of cobalt doped ring configuration. Infrared (I) and Raman (R) active modes are indicated.
Table A9.
Phonon frequencies of cobalt doped ring configuration. Infrared (I) and Raman (R) active modes are indicated.
| Frequency | CoB (cm) | CoB (cm) | CoB (cm) | |||
|---|---|---|---|---|---|---|
| 132.22 | A I+R | 102.07 | A I+R | 78.05 | A I+R | |
| 226.44 | A I+R | 108.75 | A I+R | 95.65 | A I+R | |
| 227.15 | A I+R | 174.92 | A I+R | 105.29 | A I+R | |
| 387.23 | A I+R | 270.40 | A I+R | 114.93 | A I+R | |
| 394.42 | A I+R | 272.27 | A I+R | 123.21 | A I+R | |
| 418.58 | A I+R | 286.67 | A I+R | 130.86 | A I+R | |
| 419.63 | A I+R | 297.14 | A I+R | 178.84 | A I+R | |
| 420.75 | A I+R | 301.72 | A I+R | 200.91 | A I+R | |
| 427.31 | A I+R | 304.33 | A I+R | 213.54 | A I+R | |
| 475.59 | A I+R | 329.26 | A I+R | 217.34 | A I+R | |
| 476.76 | A I+R | 337.61 | A I+R | 251.07 | A I+R | |
| 485.87 | A I+R | 379.35 | A I+R | 323.01 | A I+R | |
| 531.35 | A I+R | 387.30 | A I+R | 331.76 | A I+R | |
| 738.23 | A I+R | 438.29 | A I+R | 359.37 | A I+R | |
| 846.01 | A I+R | 439.58 | A I+R | 375.51 | A I+R | |
| 847.85 | A I+R | 651.98 | A I+R | 398.13 | A I+R | |
| 1101.23 | A I+R | 810.22 | A I+R | 437.11 | A I+R | |
| 1103.46 | A I+R | 811.89 | A I+R | 560.52 | A I+R | |
| 1353.44 | A I+R | 1150.56 | A I+R | 747.49 | A I+R | |
| 1358.81 | A I+R | 1157.41 | A I+R | 748.06 | A I+R | |
| 1479.23 | A I+R | 1454.00 | A I+R | 1075.52 | A I+R | |
| 1457.51 | A I+R | 1077.22 | A I+R | |||
| 1646.17 | A I+R | 1367.16 | A I+R | |||
| 1648.97 | A I+R | 1368.35 | A I+R | |||
| 1618.81 | A I+R | |||||
| 1622.29 | A I+R | |||||
| 1725.10 | A I+R |
Table A10.
Phonon frequencies of cobalt doped drum configuration. Infrared (I) and Raman (R) active modes are indicated.
Table A10.
Phonon frequencies of cobalt doped drum configuration. Infrared (I) and Raman (R) active modes are indicated.
| Frequency | CoB (cm) | CoB (cm) | CoB (cm) | |||
|---|---|---|---|---|---|---|
| 55.24 | 70.30 | A I+R | 90.34 | A I+R | ||
| 125.56 | A” I+R | 104.90 | A I+R | 130.45 | A I+R | |
| 183.41 | 186.93 | A I+R | 144.81 | A I+R | ||
| 239.82 | 190.51 | A I+R | 154.66 | A I+R | ||
| 251.97 | 193.83 | A I+R | 173.13 | A I+R | ||
| 281.51 | 223.87 | A I+R | 214.68 | A I+R | ||
| 283.58 | 227.31 | A I+R | 293.36 | A I+R | ||
| 295.37 | 268.21 | A I+R | 303.80 | A I+R | ||
| 327.38 | 277.13 | A I+R | 315.26 | A I+R | ||
| 336.41 | 302.99 | A I+R | 330.09 | A I+R | ||
| 338.91 | 314.84 | A I+R | 345.59 | A I+R | ||
| 388.97 | 323.52 | A I+R | 363.58 | A I+R | ||
| 389.10 | 357.26 | A I+R | 369.65 | A I+R | ||
| 402.59 | 386.96 | A I+R | 382.94 | A I+R | ||
| 443.12 | A’ I+R | 396.95 | A I+R | 389.96 | A I+R | |
| 443.77 | A” I+R | 406.73 | A I+R | 412.65 | A I+R | |
| 483.54 | 436.30 | A I+R | 420.45 | A I+R | ||
| 483.55 | 443.72 | A I+R | 442.17 | A I+R | ||
| 518.91 | 450.95 | A I+R | 448.84 | A I+R | ||
| 520.43 | 458.89 | A I+R | 482.05 | A I+R | ||
| 520.83 | 471.01 | A I+R | 508.91 | A I+R | ||
| 530.04 | A’ I+R | 483.58 | A I+R | 511.74 | A I+R | |
| 537.34 | A” I+R | 502.31 | A I+R | 546.64 | A I+R | |
| 538.10 | A’ I+R | 506.27 | A I+R | 552.08 | A I+R | |
| 555.69 | A” I+R | 514.22 | A I+R | 581.40 | A I+R | |
| 577.98 | 519.47 | A I+R | 583.95 | A I+R | ||
| 578.60 | 533.71 | A I+R | 600.39 | A I+R | ||
| 614.82 | 535.66 | A I+R | 636.88 | A I+R | ||
| 617.04 | 544.27 | A I+R | 645.18 | A I+R | ||
| 648.44 | A’ I+R | 551.28 | A I+R | 663.60 | A I+R | |
| 694.17 | 556.12 | A I+R | 667.42 | A I+R | ||
| 799.36 | 570.59 | A I+R | 678.98 | A I+R | ||
| 799.39 | 575.16 | A I+R | 693.57 | A I+R | ||
| 890.72 | 607.35 | A I+R | 698.88 | A I+R | ||
| 891.06 | 645.77 | A I+R | 705.84 | A I+R | ||
| 895.58 | 740.25 | A I+R | 725.20 | A I+R | ||
| 1034.15 | A’ I+R | 744.15 | A I+R | 732.12 | A I+R | |
| 1090.63 | A” I+R | 849.47 | A I+R | 742.46 | A I+R | |
| 1119.24 | A’ I+R | 854.15 | A I+R | 788.81 | A I+R | |
| 1146.91 | A” I+R | 1020.57 | A I+R | 805.33 | A I+R | |
| 1240.40 | 1042.72 | A I+R | 807.82 | A I+R | ||
| 1240.79 | 1071.67 | A I+R | 833.73 | A I+R | ||
| 1249.37 | A’ I+R | 1080.23 | A I+R | 863.13 | A I+R | |
| 1281.95 | 1263.77 | A I+R | 931.85 | A I+R | ||
| 1282.75 | 1265.38 | A I+R | 945.16 | A I+R | ||
| 1273.63 | A I+R | 997.06 | A I+R | |||
| 1279.82 | A I+R | 1005.73 | A I+R | |||
| 1280.97 | A I+R | 1119.18 | A I+R | |||
| 1342.26 | A I+R | 1128.13 | A I+R | |||
| 1347.29 | A I+R | 1156.08 | A I+R | |||
| 1364.44 | A I+R | 1159.55 | A I+R | |||
| 1192.41 | A I+R | |||||
| 1198.65 | A I+R | |||||
| 1223.64 | A I+R | |||||
| 1227.45 | A I+R | |||||
| 1252.21 | A I+R | |||||
| 1257.99 | A I+R |
Table A11.
Phonon frequencies of niobium doped ring configuration. Infrared (I) and Raman (R) active modes are indicated.
Table A11.
Phonon frequencies of niobium doped ring configuration. Infrared (I) and Raman (R) active modes are indicated.
| Frequency | NbB (cm) | NbB (cm) | NbB () | |||
|---|---|---|---|---|---|---|
| 45.69 | 93.35 | A I+R | 87.85 | A I+R | ||
| 313.89 | A” I+R | 231.47 | A I+R | 99.43 | A I+R | |
| 319.69 | A’ I+R | 239.29 | A I+R | 119.56 | A I+R | |
| 385.82 | 324.59 | A I+R | 228.25 | A I+R | ||
| 391.04 | 326.83 | A I+R | 251.08 | A I+R | ||
| 480.65 | A’ I+R | 399.08 | A I+R | 269.88 | A I+R | |
| 482.80 | A” I+R | 403.12 | A I+R | 274.93 | A I+R | |
| 490.75 | A’ I+R | 422.12 | A I+R | 275.32 | A I+R | |
| 524.98 | A’ I+R | 427.38 | A I+R | 279.48 | A I+R | |
| 566.78 | A” I+R | 478.30 | A I+R | 359.78 | A I+R | |
| 605.52 | A’ I+R | 485.41 | A I+R | 360.65 | A I+R | |
| 616.09 | 501.33 | A I+R | 426.68 | A I+R | ||
| 620.13 | 502.90 | A I+R | 428.06 | A I+R | ||
| 723.57 | A’ I+R | 504.64 | A I+R | 431.2 | A I+R | |
| 766.64 | 513.64 | A I+R | 431.57 | A I+R | ||
| 766.89 | 671.58 | A I+R | 463.92 | A I+R | ||
| 880.82 | A” I+R | 754.23 | A I+R | 474.95 | A I+R | |
| 896.65 | A” I+R | 755.89 | A I+R | 598.35 | A I+R | |
| 911.61 | A’ I+R | 933.68 | A I+R | 725.33 | A I+R | |
| 1019.63 | A” I+R | 939.01 | A I+R | 741.39 | A I+R | |
| 1024.44 | A’ I+R | 1042.89 | A I+R | 1041.86 | A I+R | |
| 1046.05 | A I+R | 1048.98 | A I+R | |||
| 1441.40 | A I+R | 1312.83 | A I+R | |||
| 1443.84 | A I+R | 1314.16 | A I+R | |||
| 1539.09 | A I+R | |||||
| 1541.32 | A I+R | |||||
| 1629.34 | A I+R |
Table A12.
Phonon frequencies of niobium doped drum configuration. Infrared (I) and Raman (R) active modes are indicated.
Table A12.
Phonon frequencies of niobium doped drum configuration. Infrared (I) and Raman (R) active modes are indicated.
| Frequency | NbB (cm) | NbB (cm) | NbB (cm) | |||
|---|---|---|---|---|---|---|
| 153.38 | A” I+R | 38.60 | A I+R | 102.61 | A I+R | |
| 225.89 | A’ I+R | 107.72 | A I+R | 129.29 | A I+R | |
| 255.94 | A’ I+R | 177.78 | A I+R | 134.64 | A I+R | |
| 371.24 | A’ I+R | 284.27 | A I+R | 149.29 | A I+R | |
| 381.25 | A” I+R | 302.70 | A I+R | 181.05 | A I+R | |
| 390.64 | A” I+R | 308.98 | A I+R | 215.88 | A I+R | |
| 395.53 | A’ I+R | 316.19 | A I+R | 218.76 | A I+R | |
| 402.44 | A’ I+R | 326.75 | A I+R | 298.28 | A I+R | |
| 411.50 | A” I+R | 331.19 | A I+R | 304.37 | A I+R | |
| 435.82 | A” I+R | 392.56 | A I+R | 330.27 | A I+R | |
| 437.24 | A” I+R | 399.84 | A I+R | 335.28 | A I+R | |
| 452.89 | A’ I+R | 407.55 | A I+R | 380.34 | A I+R | |
| 463.47 | A’ I+R | 410.92 | A I+R | 389.66 | A I+R | |
| 475.30 | A” I+R | 419.69 | A I+R | 403.76 | A I+R | |
| 477.29 | A’ I+R | 444.91 | A I+R | 408.58 | A I+R | |
| 508.80 | A” I+R | 450.70 | A I+R | 411.67 | A I+R | |
| 513.09 | A’ I+R | 453.16 | A I+R | 414.72 | A I+R | |
| 526.48 | A” I+R | 455.63 | A I+R | 420.79 | A I+R | |
| 529.77 | A” I+R | 505.88 | A I+R | 422.32 | A I+R | |
| 548.57 | A’ I+R | 513.86 | A I+R | 469.69 | A I+R | |
| 585.34 | A’ I+R | 525.01 | A I+R | 473.67 | A I+R | |
| 607.84 | A” I+R | 526.71 | A I+R | 488.11 | A I+R | |
| 615.15 | A’ I+R | 530.15 | A I+R | 491.91 | A I+R | |
| 620.61 | A’ I+R | 553.84 | A I+R | 498.13 | A I+R | |
| 628.93 | A” I+R | 567.70 | A I+R | 502.23 | A I+R | |
| 636.29 | A’ I+R | 568.91 | A I+R | 503.08 | A I+R | |
| 651.43 | A” I+R | 585.49 | A I+R | 504.58 | A I+R | |
| 675.07 | A” I+R | 585.71 | A I+R | 509.92 | A I+R | |
| 678.25 | A’ I+R | 610.94 | A I+R | 518.68 | A I+R | |
| 701.59 | A’ I+R | 616.56 | A I+R | 521.01 | A I+R | |
| 736.31 | A’ I+R | 618.38 | A I+R | 529.44 | A I+R | |
| 783.80 | A” I+R | 621.92 | A I+R | 533.12 | A I+R | |
| 784.32 | A’ I+R | 623.28 | A I+R | 537.08 | A I+R | |
| 806.59 | A’ I+R | 624.97 | A I+R | 553.72 | A I+R | |
| 812.25 | A” I+R | 697.93 | A I+R | 555.91 | A I+R | |
| 849.55 | A” I+R | 741.01 | A I+R | 569.10 | A I+R | |
| 912.57 | A” I+R | 745.00 | A I+R | 570.58 | A I+R | |
| 949.59 | A’ I+R | 825.52 | A I+R | 603.47 | A I+R | |
| 965.49 | A” I+R | 826.19 | A I+R | 655.46 | A I+R | |
| 983.48 | A’ I+R | 970.24 | A I+R | 702.13 | A I+R | |
| 1013.57 | A’ I+R | 988.10 | A I+R | 705.11 | A I+R | |
| 1037.14 | A’ I+R | 1023.17 | A I+R | 817.16 | A I+R | |
| 1038.94 | A” I+R | 1043.28 | A I+R | 819.79 | A I+R | |
| 1063.51 | A’ I+R | 1072.06 | A I+R | 976.61 | A I+R | |
| 1093.04 | A” I+R | 1176.98 | A I+R | 980.59 | A I+R | |
| 1178.71 | A I+R | 1051.48 | A I+R | |||
| 1196.05 | A I+R | 1053.57 | A I+R | |||
| 1197.44 | A I+R | 1242.33 | A I+R | |||
| 1224.51 | A I+R | 1242.87 | A I+R | |||
| 1226.53 | A I+R | 1253.91 | A I+R | |||
| 1260.09 | A I+R | 1255.97 | A I+R | |||
| 1363.29 | A I+R | |||||
| 1365.27 | A I+R | |||||
| 1372.29 | A I+R | |||||
| 1374.83 | A I+R | |||||
| 1389.72 | A I+R | |||||
| 1390.28 | A I+R |
Table A13.
Phonon frequencies of molybdenum doped ring configuration. Infrared (I) and Raman (R) active modes are indicated.
Table A13.
Phonon frequencies of molybdenum doped ring configuration. Infrared (I) and Raman (R) active modes are indicated.
| Frequency | MoB (cm) | MoB (cm) | MoB (cm) | |||
|---|---|---|---|---|---|---|
| 36.02 | 96.98 | A I+R | 75.20 | A I+R | ||
| 283.32 | A” I+R | 190.06 | A I+R | 97.13 | A I+R | |
| 295.36 | A’ I+R | 190.86 | A I+R | 145.88 | A I+R | |
| 359.78 | 317.12 | A I+R | 181.14 | A I+R | ||
| 369.94 | 324.29 | A I+R | 192.76 | A I+R | ||
| 467.31 | 379.84 | A I+R | 226.27 | A I+R | ||
| 471.56 | 380.44 | A I+R | 240.30 | A I+R | ||
| 515.87 | A’ I+R | 387.91 | A I+R | 250.33 | A I+R | |
| 518.61 | 396.99 | A I+R | 259.06 | A I+R | ||
| 532.09 | 467.66 | A I+R | 300.87 | A I+R | ||
| 549.84 | 470.01 | A I+R | 315.34 | A I+R | ||
| 563.40 | 485.96 | A I+R | 378.54 | A I+R | ||
| 569.58 | 487.57 | A I+R | 380.05 | A I+R | ||
| 744.50 | 508.31 | A I+R | 406.28 | A I+R | ||
| 755.39 | 512.49 | A I+R | 409.66 | A I+R | ||
| 766.06 | 682.96 | A I+R | 419.85 | A I+R | ||
| 975.24 | 772.93 | A I+R | 457.02 | A I+R | ||
| 986.44 | 777.37 | A I+R | 591.93 | A I+R | ||
| 1022.85 | 1047.92 | A I+R | 738.93 | A I+R | ||
| 1025.17 | 1050.32 | A I+R | 743.74 | A I+R | ||
| 1268.69 | A” I+R | 1284.07 | A I+R | 1062.62 | A I+R | |
| 1286.94 | A I+R | 1070.44 | A I+R | |||
| 1386.01 | A I+R | 1351.72 | A I+R | |||
| 1463.49 | A I+R | 1355.90 | A I+R | |||
| 1584.62 | A I+R | |||||
| 1591.94 | A I+R | |||||
| 1677.30 | A I+R |
Table A14.
Phonon frequencies of molybdenum doped drum configuration. Infrared (I) and Raman (R) active modes are indicated.
Table A14.
Phonon frequencies of molybdenum doped drum configuration. Infrared (I) and Raman (R) active modes are indicated.
| Frequency | MoB (cm) | MoB (cm) | MoB (cm) | |||
|---|---|---|---|---|---|---|
| 86.96 | A’ I+R | 41.17 | A I+R | 106.48 | A I+R | |
| 149.69 | A’ I+R | 139.66 | A I+R | 137.41 | A I+R | |
| 247.98 | A’ I+R | 175.18 | A I+R | 163.80 | A I+R | |
| 298.75 | A” I+R | 206.40 | A I+R | 183.62 | A I+R | |
| 341.11 | A’ I+R | 284.88 | A I+R | 192.86 | A I+R | |
| 362.46 | A” I+R | 293.06 | A I+R | 199.49 | A I+R | |
| 384.84 | A’ I+R | 313.07 | A I+R | 243.12 | A I+R | |
| 390.28 | A” I+R | 339.85 | A I+R | 251.63 | A I+R | |
| 402.10 | A’ I+R | 345.63 | A I+R | 256.67 | A I+R | |
| 402.27 | A” I+R | 355.67 | A I+R | 321.15 | A I+R | |
| 413.72 | A” I+R | 393.38 | A I+R | 326.87 | A I+R | |
| 415.55 | A’ I+R | 397.79 | A I+R | 343.29 | A I+R | |
| 418.27 | A” I+R | 412.58 | A I+R | 359.64 | A I+R | |
| 438.25 | A’ I+R | 424.90 | A I+R | 363.27 | A I+R | |
| 481.72 | A” I+R | 453.61 | A I+R | 386.09 | A I+R | |
| 494.34 | A’ I+R | 472.52 | A I+R | 399.55 | A I+R | |
| 503.95 | A’ I+R | 488.48 | A I+R | 423.97 | A I+R | |
| 530.17 | A” I+R | 490.03 | A I+R | 451.92 | A I+R | |
| 549.49 | A” I+R | 506.37 | A I+R | 461.98 | A I+R | |
| 560.59 | A” I+R | 525.15 | A I+R | 463.18 | A I+R | |
| 572.54 | A’ I+R | 538.00 | A I+R | 464.44 | A I+R | |
| 574.70 | A’ I+R | 550.61 | A I+R | 488.79 | A I+R | |
| 586.20 | A’ I+R | 565.27 | A I+R | 490.98 | A I+R | |
| 603.55 | A’ I+R | 568.47 | A I+R | 494.90 | A I+R | |
| 621.51 | A” I+R | 569.86 | A I+R | 499.06 | A I+R | |
| 623.58 | A” I+R | 579.06 | A I+R | 501.98 | A I+R | |
| 625.95 | A’ I+R | 592.43 | A I+R | 503.32 | A I+R | |
| 636.93 | A” I+R | 597.32 | A I+R | 503.87 | A I+R | |
| 664.00 | A’ I+R | 598.71 | A I+R | 520.83 | A I+R | |
| 683.00 | A’ I+R | 603.63 | A I+R | 523.70 | A I+R | |
| 707.94 | A’ I+R | 617.80 | A I+R | 536.05 | A I+R | |
| 776.19 | A’ I+R | 620.09 | A I+R | 539.91 | A I+R | |
| 778.54 | A” I+R | 632.32 | A I+R | 547.71 | A I+R | |
| 845.88 | A” I+R | 640.08 | A I+R | 550.01 | A I+R | |
| 855.78 | A’ I+R | 705.75 | A I+R | 552.95 | A I+R | |
| 952.11 | A’ I+R | 735.70 | A I+R | 559.29 | A I+R | |
| 960.07 | A” I+R | 755.45 | A I+R | 561.40 | A I+R | |
| 1046.70 | A” I+R | 823.60 | A I+R | 598.34 | A I+R | |
| 1048.67 | A’ I+R | 835.86 | A I+R | 652.15 | A I+R | |
| 1057.82 | A” I+R | 969.00 | A I+R | 701.09 | A I+R | |
| 1070.43 | A’ I+R | 1006.34 | A I+R | 710.29 | A I+R | |
| 1070.44 | A” I+R | 1039.57 | A I+R | 819.94 | A I+R | |
| 1158.50 | A’ I+R | 1056.87 | A I+R | 823.73 | A I+R | |
| 1198.49 | A” I+R | 1191.11 | A I+R | 986.84 | A I+R | |
| 1206.90 | A’ I+R | 1208.72 | A I+R | 987.98 | A I+R | |
| 1212.50 | A I+R | 1068.50 | A I+R | |||
| 1220.63 | A I+R | 1071.95 | A I+R | |||
| 1223.47 | A I+R | 1254.08 | A I+R | |||
| 1263.41 | A I+R | 1256.73 | A I+R | |||
| 1268.85 | A I+R | 1273.45 | A I+R | |||
| 1298.54 | A I+R | 1276.47 | A I+R | |||
| 1394.08 | A I+R | |||||
| 1401.76 | A I+R | |||||
| 1405.10 | A I+R | |||||
| 1405.78 | A I+R | |||||
| 1414.40 | A I+R | |||||
| 1415.44 | A I+R |
Appendix C. Löwdin population analysis
The application of Löwdin population analysis, combined with the consideration of polarization effects, provided a comprehensive picture of the studied system’s electronic structure. The Löwdin charge (q) and polarization (P) on each atom for all the studied clusters are given in Tabs. from Table A15 to Table A21.
Table A15.
Löwdin charge (q) and polarization (P) on each atom for Ti-doped boron clusters.
| Cluster | TiB | TiB | TiB | TiB | TiB | TiB | ||||||
|---|---|---|---|---|---|---|---|---|---|---|---|---|
| Atom | q | P | q | P | q | P | q | P | q | P | q | P |
| Ti | 10.97 | 1.012 | 10.78 | 1.005 | 10.61 | 1.135 | 11.25 | 0 | 10.97 | 0.535 | 10.8 | 1.176 |
| B | 3.07 | 0.284 | 3.10 | -0.003 | 3.08 | 0.011 | 2.98 | 0 | 2.98 | 0.095 | 2.98 | 0.017 |
| B | 3.07 | 0.284 | 3.08 | -0.004 | 3.08 | -0.126 | 2.98 | 0 | 3.01 | -0.020 | 2.98 | 0.079 |
| B | 3.07 | 0.284 | 3.08 | -0.004 | 3.08 | -0.126 | 2.98 | 0 | 2.97 | -0.031 | 2.98 | -0.023 |
| B | 3.07 | 0.284 | 3.06 | -0.003 | 3.08 | 0.011 | 2.98 | 0 | 2.98 | 0.087 | 2.98 | 0.041 |
| B | 3.07 | 0.284 | 3.06 | -0.003 | 3.08 | -0.048 | 2.98 | 0 | 3.00 | 0.077 | 2.98 | 0.103 |
| B | 3.07 | 0.285 | 3.07 | -0.002 | 3.08 | -0.048 | 2.98 | 0 | 2.98 | 0.009 | 2.98 | -0.081 |
| B | 3.07 | 0.284 | 3.07 | -0.002 | 3.08 | -0.043 | 2.98 | 0 | 3.01 | -0.006 | 2.98 | 0.119 |
| B | 3.07 | 0.284 | 3.09 | -0.003 | 3.08 | -0.124 | 2.98 | 0 | 2.98 | 0.029 | 2.98 | -0.051 |
| B | 3.09 | -0.003 | 3.08 | -0.124 | 2.98 | 0 | 3.00 | 0.06 | 2.98 | 0.110 | ||
| B | 3.08 | -0.043 | 2.98 | 0 | 2.99 | 0.097 | 2.98 | -0.073 | ||||
| B | 2.98 | 0 | 3.00 | -0.029 | 3.01 | 0.078 | ||||||
| B | 2.98 | 0 | 3.00 | -0.023 | 3.01 | 0.073 | ||||||
| B | 2.98 | 0 | 2.99 | 0.07 | 3.01 | 0.078 | ||||||
| B | 2.98 | 0 | 2.99 | 0.091 | 3.01 | 0.076 | ||||||
| B | 2.98 | 0 | 3.00 | -0.01 | 3.01 | 0.088 | ||||||
| B | 2.98 | 0 | 3.00 | 0.015 | 3.01 | -0.05 | ||||||
| B | 2.99 | 0.052 | 3.01 | 0.087 | ||||||||
| B | 3.00 | 0.036 | 3.01 | 0.004 | ||||||||
| B | 3.01 | 0.095 | ||||||||||
| B | 3.01 | 0.049 | ||||||||||
Table A16.
Löwdin charge (q) and polarization (P) on each atom for Cr-doped boron clusters.
| Cluster | CrB | CrB | CrB | CrB | CrB | CrB | ||||||
|---|---|---|---|---|---|---|---|---|---|---|---|---|
| Atom | q | P | q | P | q | P | q | P | q | P | q | P |
| Cr | 13.03 | 1.698 | 12.71 | 3.019 | 12.73 | 2.664 | 13.01 | 0 | 13.01 | 1.187 | 12.91 | 3.161 |
| B | 3.06 | 0.368 | 3.08 | 0.113 | 3.04 | 0.085 | 2.98 | 0 | 2.99 | 0.134 | 2.98 | 0.027 |
| B | 3.06 | 0.368 | 3.08 | 0.198 | 3.09 | 0.085 | 2.98 | 0 | 3.01 | -0.018 | 2.96 | 0.027 |
| B | 3.06 | 0.368 | 3.08 | 0.198 | 3.09 | 0.085 | 2.98 | 0 | 2.97 | 0.039 | 2.99 | 0.026 |
| B | 3.06 | 0.368 | 3.08 | 0.319 | 3.04 | 0.085 | 2.98 | 0 | 2.99 | 0.132 | 2.97 | 0.026 |
| B | 3.06 | 0.368 | 3.08 | 0.319 | 3.06 | 0.085 | 3.00 | 0 | 3.00 | 0.126 | 2.93 | 0.027 |
| B | 3.06 | 0.368 | 3.08 | 0.271 | 3.06 | 0.085 | 3.00 | 0 | 2.98 | 0.090 | 2.99 | 0.027 |
| B | 3.06 | 0.368 | 3.08 | 0.271 | 3.06 | 0.085 | 2.99 | 0 | 3.00 | -0.016 | 2.94 | 0.027 |
| B | 3.06 | 0.368 | 3.08 | 0.137 | 3.09 | 0.085 | 2.99 | 0 | 2.98 | 0.094 | 3.00 | 0.027 |
| B | 3.08 | 0.137 | 3.09 | 0.085 | 3.00 | 0 | 3.00 | 0.122 | 2.95 | 0.027 | ||
| B | 3.06 | 0.085 | 3.00 | 0 | 2.99 | 0.153 | 3.00 | 0.026 | ||||
| B | 3.00 | 0 | 3.01 | 0.046 | 3.03 | 0.056 | ||||||
| B | 3.00 | 0 | 2.97 | -0.022 | 3.04 | 0.056 | ||||||
| B | 3.00 | 0 | 2.98 | 0.114 | 3.05 | 0.055 | ||||||
| B | 3.00 | 0 | 2.99 | 0.152 | 3.01 | 0.055 | ||||||
| B | 3.00 | 0 | 2.97 | -0.02 | 2.94 | 0.056 | ||||||
| B | 3.00 | 0 | 3.00 | 0.105 | 3.03 | 0.056 | ||||||
| B | 2.98 | 0.111 | 2.96 | 0.055 | ||||||||
| B | 3.00 | 0.108 | 3.03 | 0.055 | ||||||||
| B | 2.95 | 0.055 | ||||||||||
| B | 3.03 | 0.055 | ||||||||||
Table A17.
Löwdin charge (q) and polarization (P) on each atom for Mn-doped boron clusters.
| Cluster | MnB | MnB | MnB | MnB | MnB | MnB | ||||||
|---|---|---|---|---|---|---|---|---|---|---|---|---|
| Atom | q | P | q | P | q | P | q | P | q | P | q | P |
| Mn | 14.05 | 1.058 | 13.73 | 2.681 | 13.67 | 3.54 | 14.01 | 1.223 | 13.98 | 1.475 | 13.95 | 2.8323 |
| B | 3.06 | 0.24 | 3.08 | -0.075 | 3.05 | -0.097 | 2.99 | -0.015 | 3.01 | -0.028 | 3.03 | 0.010 |
| B | 3.06 | 0.241 | 3.08 | -0.075 | 3.11 | -0.187 | 2.99 | -0.015 | 2.99 | -0.027 | 2.95 | 0.081 |
| B | 3.06 | 0.24 | 3.08 | -0.075 | 3.11 | -0.187 | 2.99 | -0.015 | 2.95 | -0.02 | 3.02 | -0.059 |
| B | 3.06 | 0.241 | 3.08 | -0.075 | 3.05 | -0.097 | 2.99 | -0.015 | 3.00 | -0.027 | 3.03 | 0.006 |
| B | 3.06 | 0.24 | 3.08 | -0.075 | 3.06 | 0.078 | 3.01 | -0.014 | 3.01 | -0.029 | 2.94 | 0.105 |
| B | 3.06 | 0.24 | 3.08 | -0.074 | 3.06 | 0.078 | 3.01 | -0.014 | 2.97 | -0.022 | 3.00 | -0.093 |
| B | 3.06 | 0.24 | 3.08 | -0.074 | 3.05 | 0.046 | 3.00 | -0.011 | 2.99 | -0.028 | 2.94 | 0.107 |
| B | 3.06 | 0.24 | 3.08 | -0.075 | 3.10 | -0.108 | 3.00 | -0.011 | 2.98 | -0.024 | 3.02 | -0.065 |
| B | 3.08 | -0.075 | 3.10 | -0.108 | 2.99 | -0.013 | 3.01 | -0.029 | 2.95 | 0.08 | ||
| B | 3.05 | 0.046 | 3.00 | -0.015 | 3.01 | -0.029 | 3.00 | -0.092 | ||||
| B | 3.00 | -0.015 | 2.99 | -0.027 | 3.01 | -0.011 | ||||||
| B | 2.99 | -0.013 | 2.96 | -0.02 | 2.98 | 0.043 | ||||||
| B | 3.00 | -0.015 | 3.00 | -0.026 | 3.01 | -0.009 | ||||||
| B | 2.99 | -0.013 | 3.01 | -0.029 | 2.98 | 0.047 | ||||||
| B | 3.00 | -0.015 | 2.96 | -0.021 | 2.92 | 0.073 | ||||||
| B | 2.99 | -0.013 | 3.00 | -0.029 | 3.01 | -0.108 | ||||||
| B | 2.99 | -0.025 | 2.95 | 0.101 | ||||||||
| B | 3.00 | -0.029 | 3.01 | -0.082 | ||||||||
| B | 2.95 | 0.104 | ||||||||||
| B | 3.02 | -0.085 | ||||||||||
Table A18.
Löwdin charge (q) and polarization (P) on each atom for Fe-doped boron clusters.
| Cluster | FeB | FeB | FeB | FeB | FeB | FeB | ||||||
|---|---|---|---|---|---|---|---|---|---|---|---|---|
| Atom | q | P | q | P | q | P | q | P | q | P | q | P |
| Fe | 14.88 | 2.051 | 14.81 | 1.744 | 14.73 | 2.702 | 14.98 | 0.913 | 14.9 | 1.518 | 15.09 | 1.389 |
| B | 3.08 | -0.071 | 3.07 | -0.081 | 3.07 | -0.174 | 3.02 | 0.093 | 3.01 | -0.009 | 3.05 | -0.024 |
| B | 3.08 | -0.071 | 3.07 | -0.081 | 3.07 | -0.168 | 3.02 | 0.093 | 2.99 | 0.121 | 3.01 | 0.045 |
| B | 3.08 | -0.071 | 3.07 | -0.081 | 3.07 | -0.168 | 3.02 | 0.093 | 2.97 | 0.019 | 2.94 | 0.105 |
| B | 3.08 | -0.071 | 3.07 | -0.081 | 3.07 | -0.174 | 3.02 | 0.093 | 3.00 | -0.019 | 3.05 | -0.027 |
| B | 3.08 | -0.071 | 3.07 | -0.081 | 3.06 | 0.060 | 2.97 | -0.027 | 3.01 | -0.006 | 2.99 | -0.005 |
| B | 3.08 | -0.07 | 3.07 | -0.081 | 3.06 | 0.060 | 2.97 | -0.027 | 2.97 | 0.017 | 2.94 | -0.001 |
| B | 3.08 | -0.071 | 3.07 | -0.081 | 3.07 | -0.025 | 2.97 | -0.027 | 3.00 | 0.071 | 2.99 | 0.015 |
| B | 3.08 | -0.071 | 3.07 | -0.081 | 3.07 | -0.035 | 2.97 | -0.027 | 3.00 | -0.018 | 2.93 | 0.113 |
| B | 3.07 | -0.081 | 3.07 | -0.036 | 3.00 | 0.038 | 3.00 | 0.065 | 3.00 | 0.055 | ||
| B | 3.07 | -0.026 | 3.00 | 0.038 | 3.01 | -0.023 | 2.94 | 0.019 | ||||
| B | 3.00 | 0.038 | 2.99 | 0.107 | 3.00 | 0.003 | ||||||
| B | 3.00 | 0.038 | 2.97 | 0.026 | 2.99 | 0.055 | ||||||
| B | 3.00 | 0.038 | 3.00 | -0.023 | 2.94 | 0.094 | ||||||
| B | 3.00 | 0.038 | 3.01 | 0.023 | 2.98 | 0.024 | ||||||
| B | 3.00 | 0.038 | 2.98 | 0.001 | 2.99 | 0.05 | ||||||
| B | 3.00 | 0.038 | 2.99 | 0.104 | 2.94 | 0.072 | ||||||
| B | 2.98 | -0.003 | 3.00 | -0.032 | ||||||||
| B | 3.01 | 0.028 | 2.97 | 0.05 | ||||||||
| B | 3.00 | 0.017 | ||||||||||
| B | 2.92 | -0.024 | ||||||||||
Table A19.
Löwdin charge (q) and polarization (P) on each atom for Co-doped boron clusters.
| Cluster | CoB | CoB | CoB | CoB | CoB | CoB | ||||||
|---|---|---|---|---|---|---|---|---|---|---|---|---|
| Atom | q | P | q | P | q | P | q | P | q | P | q | P |
| Co | 16.00 | -0.104 | 15.92 | 0 | 15.73 | 2.075 | 16 | 0.026 | 16.02 | -0.002 | 16.03 | 0.872 |
| B | 3.06 | -0.135 | 3.06 | 0 | 3.07 | 0.091 | 3.02 | 0.134 | 2.97 | 0.042 | 3.05 | 0.005 |
| B | 3.06 | -0.135 | 3.06 | 0 | 3.07 | 0.092 | 3.02 | 0.134 | 3.00 | 0.007 | 3.03 | -0.018 |
| B | 3.06 | -0.136 | 3.06 | 0 | 3.07 | 0.091 | 3.02 | 0.134 | 3.00 | 0.01 | 2.95 | -0.007 |
| B | 3.06 | -0.136 | 3.06 | 0 | 3.07 | 0.092 | 3.02 | 0.134 | 2.98 | 0.14 | 3.05 | 0.005 |
| B | 3.06 | -0.135 | 3.06 | 0 | 3.07 | 0.091 | 2.96 | -0.02 | 2.98 | 0.132 | 2.99 | 0.061 |
| B | 3.06 | -0.135 | 3.06 | 0 | 3.07 | 0.092 | 2.96 | -0.02 | 3.00 | 0.067 | 2.94 | -0.001 |
| B | 3.06 | -0.136 | 3.06 | 0 | 3.07 | 0.092 | 2.96 | -0.02 | 3.00 | 0.054 | 2.99 | 0.06 |
| B | 3.06 | -0.136 | 3.06 | 0 | 3.07 | 0.091 | 2.96 | -0.02 | 2.98 | 0.019 | 2.95 | -0.007 |
| B | 3.06 | 0 | 3.07 | 0.092 | 2.99 | 0.064 | 2.98 | 0.023 | 3.03 | -0.018 | ||
| B | 3.07 | 0.091 | 2.99 | 0.064 | 2.98 | 0.15 | 2.94 | -0.001 | ||||
| B | 2.99 | 0.064 | 3.00 | 0.023 | 2.99 | -0.007 | ||||||
| B | 2.99 | 0.064 | 3.00 | 0.031 | 3.00 | 0.002 | ||||||
| B | 2.99 | 0.064 | 2.97 | 0.034 | 2.96 | -0.009 | ||||||
| B | 2.99 | 0.064 | 2.97 | 0.037 | 2.96 | -0.002 | ||||||
| B | 2.99 | 0.064 | 2.99 | 0.007 | 3.00 | 0.003 | ||||||
| B | 2.99 | 0.064 | 2.99 | 0.01 | 2.96 | -0.009 | ||||||
| B | 2.99 | 0.108 | 2.98 | 0.068 | ||||||||
| B | 2.99 | 0.095 | 2.96 | -0.002 | ||||||||
| B | 2.99 | -0.007 | ||||||||||
| B | 2.90 | 0.011 | ||||||||||
Table A20.
Löwdin charge (q) and polarization (P) on each atom for Nb-doped boron clusters.
| Cluster | NbB | NbB | NbB | NbB | NbB | NbB | ||||||
|---|---|---|---|---|---|---|---|---|---|---|---|---|
| Atom | q | P | q | P | q | P | q | P | q | P | q | P |
| Nb | 12.73 | 0.249 | 12.53 | -0.081 | 12.29 | -0.033 | 12.84 | -0.014 | 12.64 | -0.017 | 12.44 | 0 |
| B | 2.97 | 0.524 | 3.00 | 0.229 | 3.02 | 0.103 | 2.94 | 0.005 | 2.95 | 0.118 | 2.97 | 0 |
| B | 2.97 | 0.524 | 3.00 | 0.229 | 3.02 | 0.103 | 2.94 | 0.005 | 2.97 | -0.014 | 2.97 | 0 |
| B | 2.97 | 0.524 | 3.00 | 0.229 | 3.02 | 0.103 | 2.94 | 0.005 | 2.97 | 0.013 | 2.97 | 0 |
| B | 2.97 | 0.524 | 3.00 | 0.229 | 3.02 | 0.103 | 2.94 | 0.005 | 2.96 | 0.069 | 2.97 | 0 |
| B | 2.99 | 0.158 | 3.00 | 0.229 | 3.02 | 0.100 | 2.96 | 0.09 | 2.95 | 0.132 | 2.97 | 0 |
| B | 2.99 | 0.158 | 3.00 | 0.228 | 3.02 | 0.101 | 2.96 | 0.09 | 2.97 | -0.013 | 2.97 | 0 |
| B | 2.99 | 0.158 | 3.00 | 0.228 | 3.02 | 0.101 | 2.97 | 0.15 | 2.96 | 0.067 | 2.97 | 0 |
| B | 2.99 | 0.158 | 3.00 | 0.228 | 3.02 | 0.101 | 2.97 | 0.15 | 2.95 | 0.107 | 2.97 | 0 |
| B | 3.00 | 0.228 | 3.02 | 0.101 | 2.95 | 0.085 | 2.96 | 0.024 | 2.97 | 0 | ||
| B | 3.02 | 0.101 | 2.95 | 0.042 | 2.95 | 0.113 | 2.97 | 0 | ||||
| B | 2.95 | 0.042 | 2.96 | 0.017 | 2.97 | 0 | ||||||
| B | 2.95 | 0.085 | 2.97 | -0.015 | 2.97 | 0 | ||||||
| B | 2.95 | 0.042 | 2.95 | 0.131 | 2.97 | 0 | ||||||
| B | 2.95 | 0.085 | 2.96 | 0.075 | 2.97 | 0 | ||||||
| B | 2.95 | 0.042 | 2.96 | 0.06 | 2.97 | 0 | ||||||
| B | 2.95 | 0.085 | 2.97 | -0.011 | 2.97 | 0 | ||||||
| B | 2.96 | 0.02 | 2.97 | 0 | ||||||||
| B | 2.95 | 0.113 | 2.97 | 0 | ||||||||
| B | 2.97 | 0 | ||||||||||
| B | 2.97 | 0 | ||||||||||
Table A21.
Löwdin charge (q) and polarization (P) on each atom for Mo-doped boron clusters.
| Cluster | MoB | MoB | MoB | MoB | MoB | MoB | ||||||
|---|---|---|---|---|---|---|---|---|---|---|---|---|
| Atom | q | P | q | P | q | P | q | P | q | P | q | P |
| Mo | 13.09 | -0.174 | 13.05 | 0.712 | 12.83 | 0.674 | 13.07 | 0 | 12.96 | 0 | 12.94 | 0 |
| B | 3.06 | 0.269 | 3.05 | 0.190 | 3.07 | -0.033 | 3.00 | 0 | 3.01 | 0 | 2.98 | 0 |
| B | 3.06 | 0.269 | 3.05 | 0.190 | 3.06 | -0.049 | 3.00 | 0 | 3.00 | 0 | 2.98 | 0 |
| B | 3.06 | 0.269 | 3.05 | 0.190 | 3.06 | -0.035 | 3.00 | 0 | 2.98 | 0 | 2.98 | 0 |
| B | 3.06 | 0.269 | 3.05 | 0.190 | 3.06 | -0.064 | 3.00 | 0 | 3.02 | 0 | 2.98 | 0 |
| B | 3.06 | 0.270 | 3.05 | 0.190 | 3.04 | -0.14 | 3.00 | 0 | 3.00 | 0 | 2.98 | 0 |
| B | 3.06 | 0.270 | 3.05 | 0.190 | 3.07 | -0.046 | 3.00 | 0 | 3.01 | 0 | 2.98 | 0 |
| B | 3.06 | 0.270 | 3.05 | 0.190 | 3.05 | -0.099 | 3.01 | 0 | 2.98 | 0 | 2.98 | 0 |
| B | 3.06 | 0.270 | 3.05 | 0.189 | 3.07 | -0.041 | 3.01 | 0 | 2.98 | 0 | 2.98 | 0 |
| B | 3.05 | 0.189 | 3.05 | -0.119 | 2.98 | 0 | 3.03 | 0 | 2.98 | 0 | ||
| B | 3.07 | -0.037 | 2.98 | 0 | 3.00 | 0 | 2.98 | 0 | ||||
| B | 2.98 | 0 | 2.98 | 0 | 3.00 | 0 | ||||||
| B | 2.98 | 0 | 2.97 | 0 | 3.00 | 0 | ||||||
| B | 2.98 | 0 | 2.97 | 0 | 3.00 | 0 | ||||||
| B | 2.98 | 0 | 3.00 | 0 | 3.00 | 0 | ||||||
| B | 2.98 | 0 | 2.95 | 0 | 3.00 | 0 | ||||||
| B | 2.98 | 0 | 3.00 | 0 | 3.00 | 0 | ||||||
| B | 3.01 | 0 | 3.00 | 0 | ||||||||
| B | 2.97 | 0 | 3.00 | 0 | ||||||||
| B | 3.00 | 0 | ||||||||||
| B | 3.00 | 0 | ||||||||||
References
- Stone, F.G.A. Chemical reactivity of the boron hydrides and related compounds. In Advances in Inorganic Chemistry and Radiochemistry; Elsevier, 1960; Vol. 2, pp. 279–313.
- Feng, B.; Zhang, J.; Zhong, Q.; Li, W.; Li, S.; Li, H.; Cheng, P.; Meng, S.; Chen, L.; Wu, K. Experimental realization of two-dimensional boron sheets. Nature chemistry 2016, 8, 563–568. [Google Scholar] [CrossRef]
- Tarkowski, T.; Gonzalez Szwacki, N.; Marchwiany, M. Structure of porous two-dimensional boron crystals. Physical Review B 2021, 104, 195423. [Google Scholar] [CrossRef]
- Tarkowski, T.; Gonzalez Szwacki, N. Boron nanotube structure explored by evolutionary computations. Crystals 2022, 13, 19. [Google Scholar] [CrossRef]
- Tarkowski, T.; Gonzalez Szwacki, N. The structure of thin boron nanowires predicted using evolutionary computations. Solid State Sciences 2023, 142, 107241. [Google Scholar] [CrossRef]
- Li, W.; Wu, K.; Chen, L. Epitaxial growth of borophene on substrates. Progress in Surface Science, 1007. [Google Scholar]
- Van Duong, L.; Mai, D.T.T.; Pham-Ho, M.P.; Nguyen, M.T. A theoretical approach to the role of different types of electrons in planar elongated boron clusters. Physical Chemistry Chemical Physics 2019, 21, 13030–13039. [Google Scholar] [CrossRef]
- Pham, H.T.; Muya, J.T.; Buendia, F.; Ceulemans, A.; Nguyen, M.T. Formation of the quasi-planar B 50 boron cluster: topological path from B 10 and disk aromaticity. Physical Chemistry Chemical Physics 2019, 21, 7039–7044. [Google Scholar] [CrossRef] [PubMed]
- Dong, X.; Jalife, S.; Vásquez-Espinal, A.; Ravell, E.; Pan, S.; Cabellos, J.L.; Liang, W.y.; Cui, Z.h.; Merino, G. Li2B12 and Li3B12: Prediction of the Smallest Tubular and Cage-like Boron Structures. Angewandte Chemie International Edition 2018, 57, 4627–4631. [Google Scholar] [CrossRef]
- Van Duong, L.; Pham, H.T.; Tam, N.M.; Nguyen, M.T. A particle on a hollow cylinder: the triple ring tubular cluster B 27+. Physical Chemistry Chemical Physics 2014, 16, 19470–19478. [Google Scholar] [CrossRef] [PubMed]
- Tai, T.B.; Tam, N.M.; Nguyen, M.T. Structure of boron clusters revisited, Bn with n=14–20. Chemical Physics Letters 2012, 530, 71–76. [Google Scholar] [CrossRef]
- Li, W.L.; Chen, X.; Jian, T.; Chen, T.T.; Li, J.; Wang, L.S. From planar boron clusters to borophenes and metalloborophenes. Nature Reviews Chemistry 2017, 1, 0071. [Google Scholar] [CrossRef]
- Zhai, H.J.; Alexandrova, A.N.; Birch, K.A.; Boldyrev, A.I.; Wang, L.S. Hepta-and octacoordinate boron in molecular wheels of eight-and nine-atom boron clusters: Observation and confirmation. Angewandte Chemie International Edition 2003, 42, 6004–6008. [Google Scholar] [CrossRef]
- Romanescu, C.; Galeev, T.R.; Li, W.L.; Boldyrev, A.I.; Wang, L.S. Aromatic metal-centered monocyclic boron rings: Co©B8- and Ru©B9-. Angewandte Chemie International Edition 2011, 50, 9334–9337. [Google Scholar] [CrossRef] [PubMed]
- Romanescu, C.; Galeev, T.R.; Li, W.L.; Boldyrev, A.I.; Wang, L.S. Geometric and electronic factors in the rational design of transition-metal-centered boron molecular wheels. The Journal of Chemical Physics 2013, 138, 134315. [Google Scholar] [CrossRef]
- Romanescu, C.; Galeev, T.R.; Li, W.L.; Boldyrev, A.I.; Wang, L.S. Transition-metal-centered monocyclic boron wheel clusters (M©B n): A new class of aromatic borometallic compounds. Accounts of chemical research 2013, 46, 350–358. [Google Scholar] [CrossRef] [PubMed]
- Miao, C.; Guo, J.; Li, S. M@ B9 and M@ B10 molecular wheels containing planar nona-and deca-coordinate heavy group 11, 12, and 13 metals (M= Ag, Au, Cd, Hg, In, Tl). Science in China Series B: Chemistry 2009, 52, 900–904. [Google Scholar] [CrossRef]
- Pu, Z.; Ito, K.; Schleyer, P.v.R.; Li, Q.S. Planar hepta-, octa-, nona-, and decacoordinate first row d-block metals enclosed by boron rings. Inorganic chemistry 2009, 48, 10679–10686. [Google Scholar] [CrossRef]
- Xu, C.; Cheng, L.; Yang, J. Double aromaticity in transition metal centered double-ring boron clusters M@B2n (M = Ti, Cr, Fe, Ni, Zn; n = 6, 7, 8). The Journal of Chemical Physics 2014, 141, 124301. [Google Scholar] [CrossRef]
- Yan, M.; Li, H.; Zhao, X.; Lu, X.; Mu, Y.; Lu, H.; Li, S. Fluxional Bonds in Planar B19-, Tubular Ta@B20-, and Cage-Like B39-. Journal of Computational Chemistry 2018, 40, 966–970. [Google Scholar] [CrossRef]
- Ren, M.; Jin, S.; Wei, D.; Jin, Y.; Tian, Y.; Lu, C.; Gutsev, G.L. NbB12-: a new member of half-sandwich type doped boron clusters with high stability. Physical Chemistry Chemical Physics 2019, 21, 21746–21752. [Google Scholar] [CrossRef] [PubMed]
- Chen, B.; He, K.; Dai, W.; Gutsev, G.L.; Lu, C. Geometric and electronic diversity of metal doped boron clusters. Journal of Physics: Condensed Matter 2023, 35, 183002. [Google Scholar] [CrossRef]
- Liu, X.b.; Tiznado, W.; Cui, L.J.; Barroso, J.; Leyva-Parra, L.; Miao, L.h.; Zhang, H.y.; Pan, S.; Merino, G.; Cui, Z.h. Exploring the Use of “Honorary Transition Metals” To Push the Boundaries of Planar Hypercoordinate Alkaline-Earth Metals. Journal of the American Chemical Society 2024, 146, 16689–16697. [Google Scholar] [CrossRef] [PubMed]
- Choi, D.J.; Lorente, N.; Wiebe, J.; Von Bergmann, K.; Otte, A.F.; Heinrich, A.J. Colloquium: Atomic spin chains on surfaces. Reviews of Modern Physics 2019, 91, 041001. [Google Scholar] [CrossRef]
- Wang, J.H.; Li, Z.Y.; Yamashita, M.; Bu, X.H. Recent progress on cyano-bridged transition-metal-based single-molecule magnets and single-chain magnets. Coordination Chemistry Reviews 2021, 428, 213617. [Google Scholar] [CrossRef]
- Ferstl, P.; Hammer, L.; Sobel, C.; Gubo, M.; Heinz, K.; Schneider, M.A.; Mittendorfer, F.; Redinger, J. Self-organized growth, structure, and magnetism of monatomic transition-metal oxide chains. Physical Review Letters 2016, 117, 046101. [Google Scholar] [CrossRef]
- Jian, T.; Li, W.L.; Popov, I.A.; Lopez, G.V.; Chen, X.; Boldyrev, A.I.; Li, J.; Wang, L.S. Manganese-centered tubular boron cluster–MnB16-: A new class of transition-metal molecules. The Journal of Chemical Physics 2016, 144, 154310. [Google Scholar] [CrossRef] [PubMed]
- Popov, I.A.; Jian, T.; Lopez, G.V.; Boldyrev, A.I.; Wang, L.S. Cobalt-centred boron molecular drums with the highest coordination number in the CoB16- cluster. Nature communications 2015, 6, 8654. [Google Scholar] [CrossRef] [PubMed]
- Jian, T.; Li, W.L.; Chen, X.; Chen, T.T.; Lopez, G.V.; Li, J.; Wang, L.S. Competition between drum and quasi-planar structures in RhB 18-: motifs for metallo-boronanotubes and metallo-borophenes. Chemical science 2016, 7, 7020–7027. [Google Scholar] [CrossRef] [PubMed]
- Li, W.L.; Jian, T.; Chen, X.; Li, H.R.; Chen, T.T.; Luo, X.M.; Li, S.D.; Li, J.; Wang, L.S. Observation of a metal-centered B 2-Ta@ B 18- tubular molecular rotor and a perfect Ta@ B 20- boron drum with the record coordination number of twenty. Chemical Communications 2017, 53, 1587–1590. [Google Scholar] [CrossRef]
- MinháTam, N.; TanáPham, H.; VanáDuong, L.; PhuongáPham-Ho, M.; ThoáNguyen, M. Fullerene-like boron clusters stabilized by an endohedrally doped iron atom: B n Fe with n= 14, 16, 18 and 20. Physical Chemistry Chemical Physics 2015, 17, 3000–3003. [Google Scholar]
- Wang, J.; Zhang, N.X.; Wang, C.Z.; Wu, Q.Y.; Lan, J.H.; Chai, Z.F.; Nie, C.M.; Shi, W.Q. Theoretical probing of twenty-coordinate actinide-centered boron molecular drums. Physical Chemistry Chemical Physics 2021, 23, 26967–26973. [Google Scholar] [CrossRef] [PubMed]
- Fan, Y.W.; Zhang, W.; Ge, N.N.; Li, Z. Design of Lanthanide Single-Chain Magnets Based on Tubular Segment Clusters. The Journal of Physical Chemistry C 2022, 127, 621–626. [Google Scholar] [CrossRef]
- Giannozzi, P.; Baroni, S.; Bonini, N.; Calandra, M.; Car, R.; Cavazzoni, C.; Ceresoli, D.; Chiarotti, G.L.; Cococcioni, M.; Dabo, I.; others. QUANTUM ESPRESSO: a modular and open-source software project for quantum simulations of materials. Journal of physics: Condensed matter 2009, 21, 395502. [Google Scholar] [CrossRef]
- Perdew, J.P.; Burke, K.; Ernzerhof, M. Generalized gradient approximation made simple. Physical review letters 1996, 77, 3865. [Google Scholar] [CrossRef] [PubMed]
- Hoffmann, R.; Schleyer, P.v.R.; Schaefer, H.F. Predicting Molecules—More Realism, Please! Angewandte Chemie International Edition 2008, 47, 7164–7167. [Google Scholar] [CrossRef]
Figure 1.
The structure of TMB (left) and TMB (right) for , 9, and 10 in (a), (b), and (c), respectively. In each case, top and side views of the clusters are shown.
Figure 1.
The structure of TMB (left) and TMB (right) for , 9, and 10 in (a), (b), and (c), respectively. In each case, top and side views of the clusters are shown.
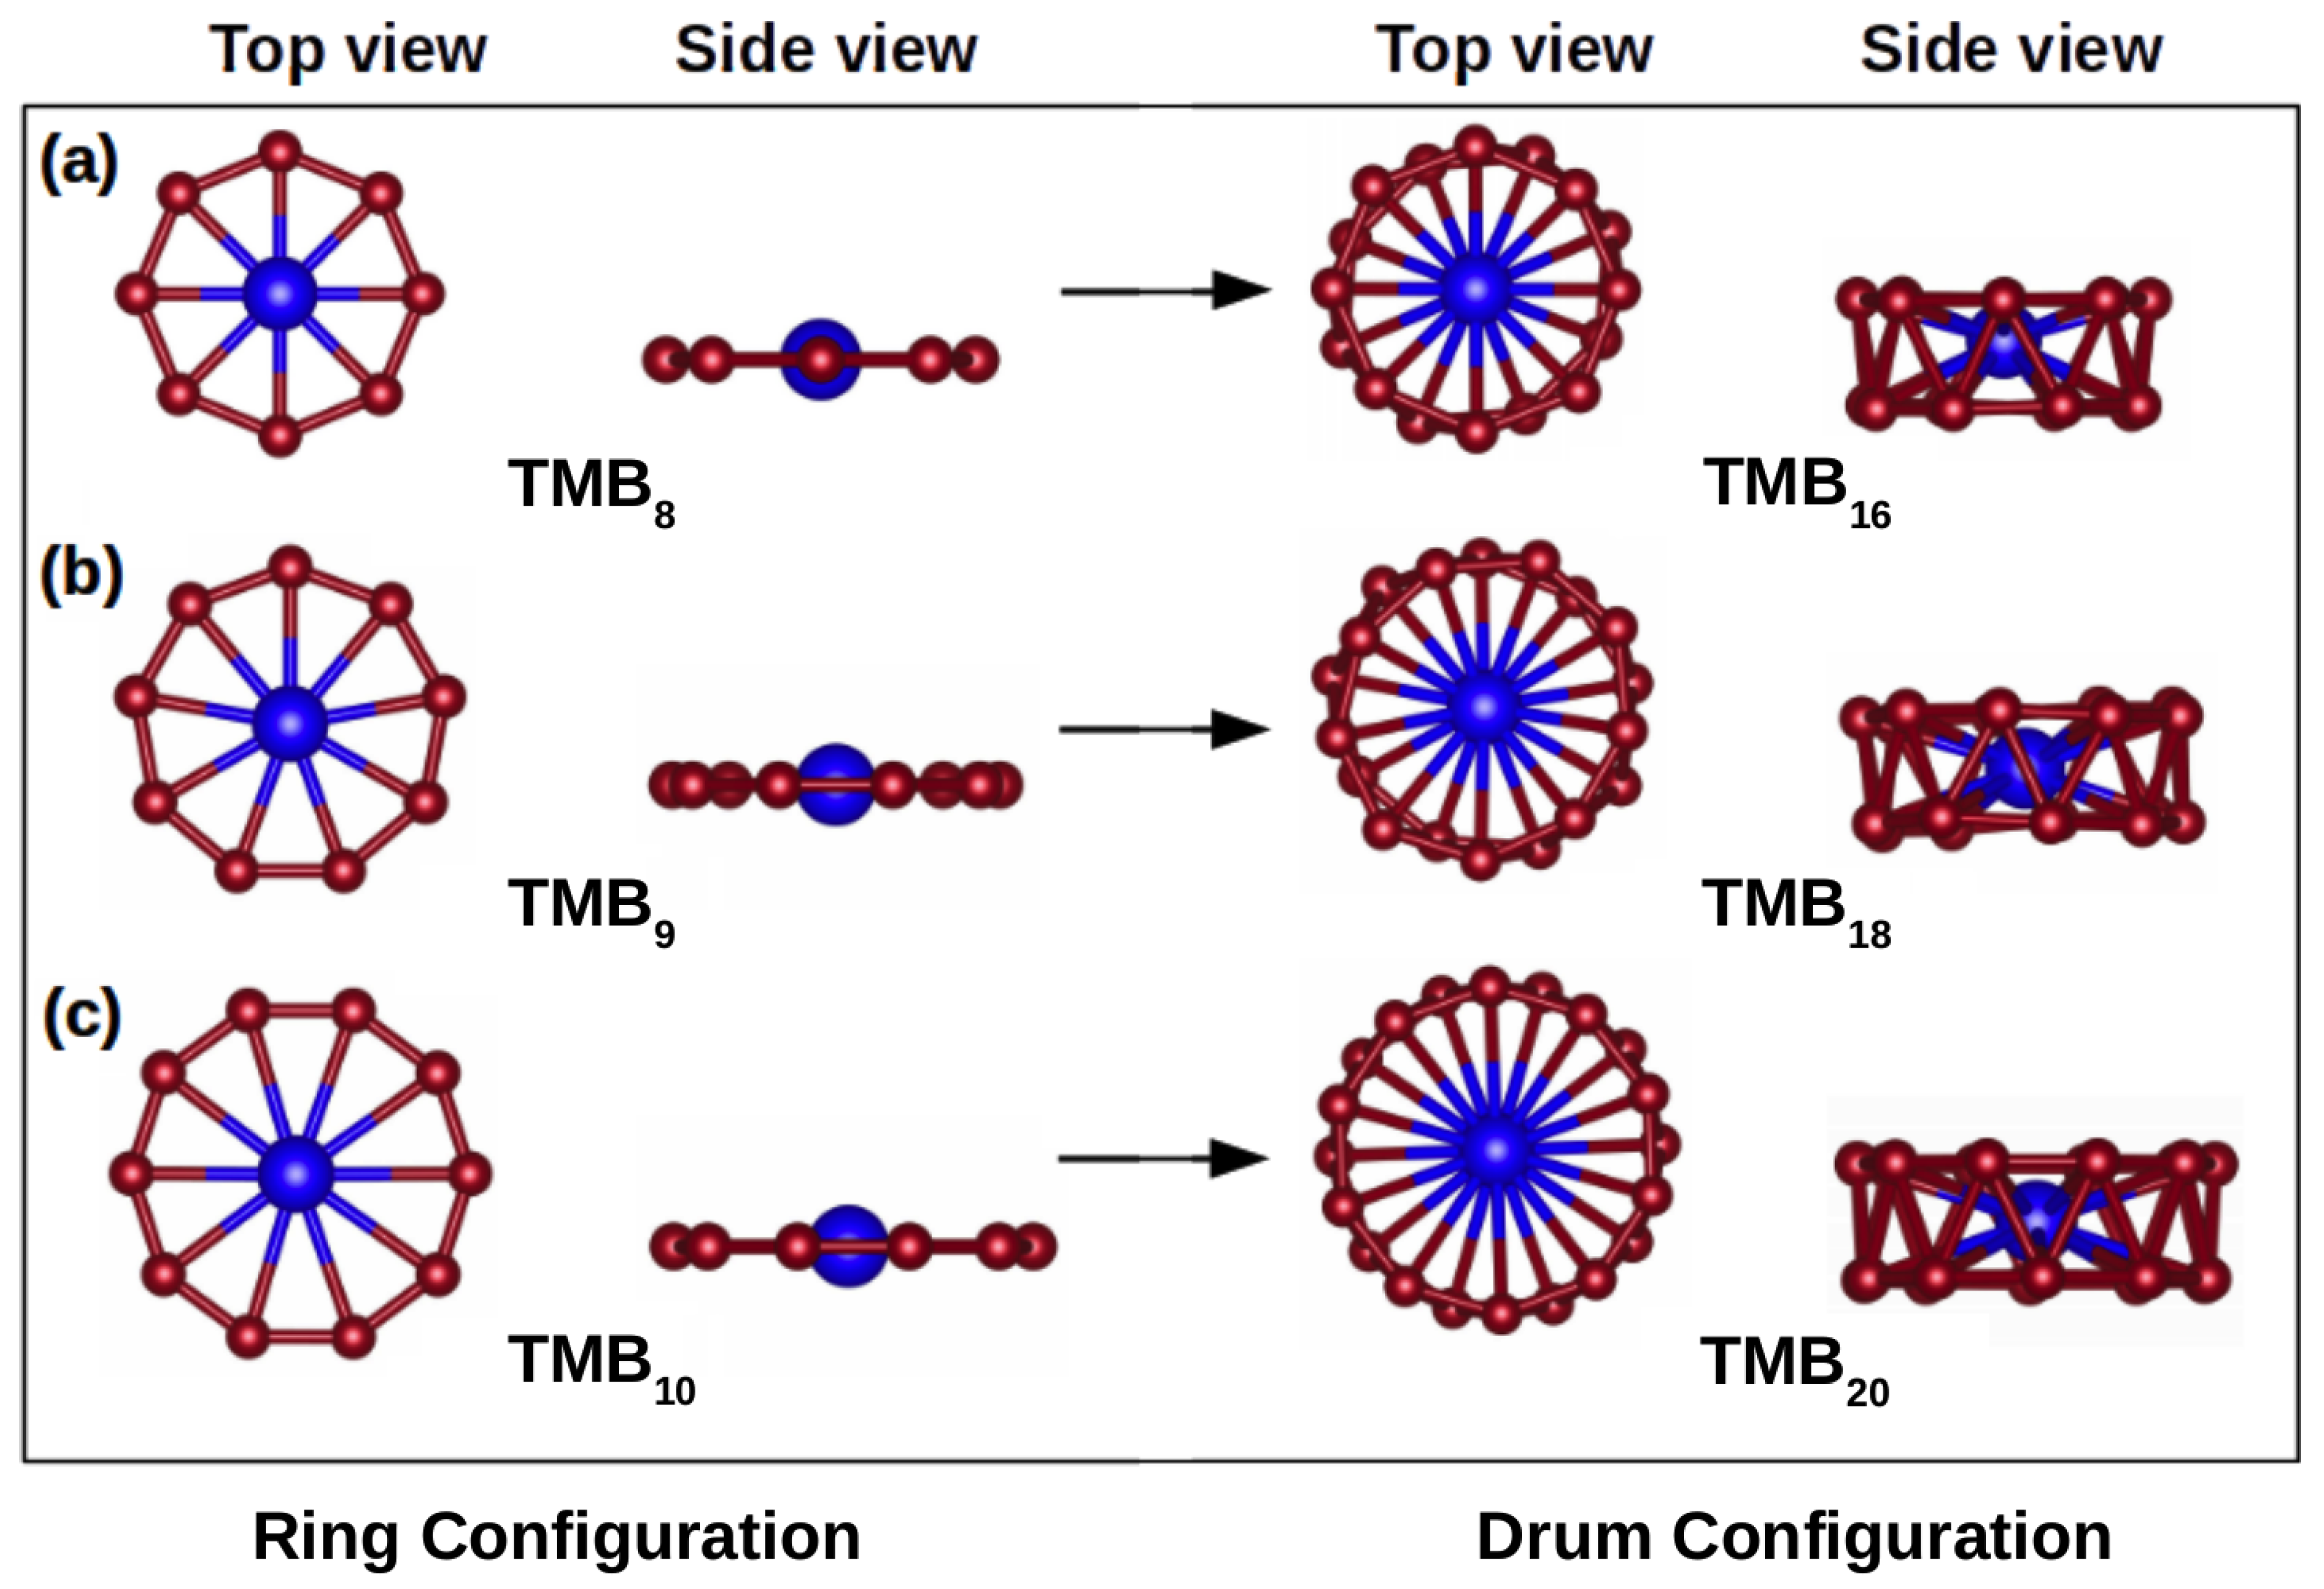
Figure 2.
Ab initio molecular dynamics simulations at 300 K and 600 K. The top and side views of CoB and MnB clusters are shown for each temperature.
Figure 2.
Ab initio molecular dynamics simulations at 300 K and 600 K. The top and side views of CoB and MnB clusters are shown for each temperature.
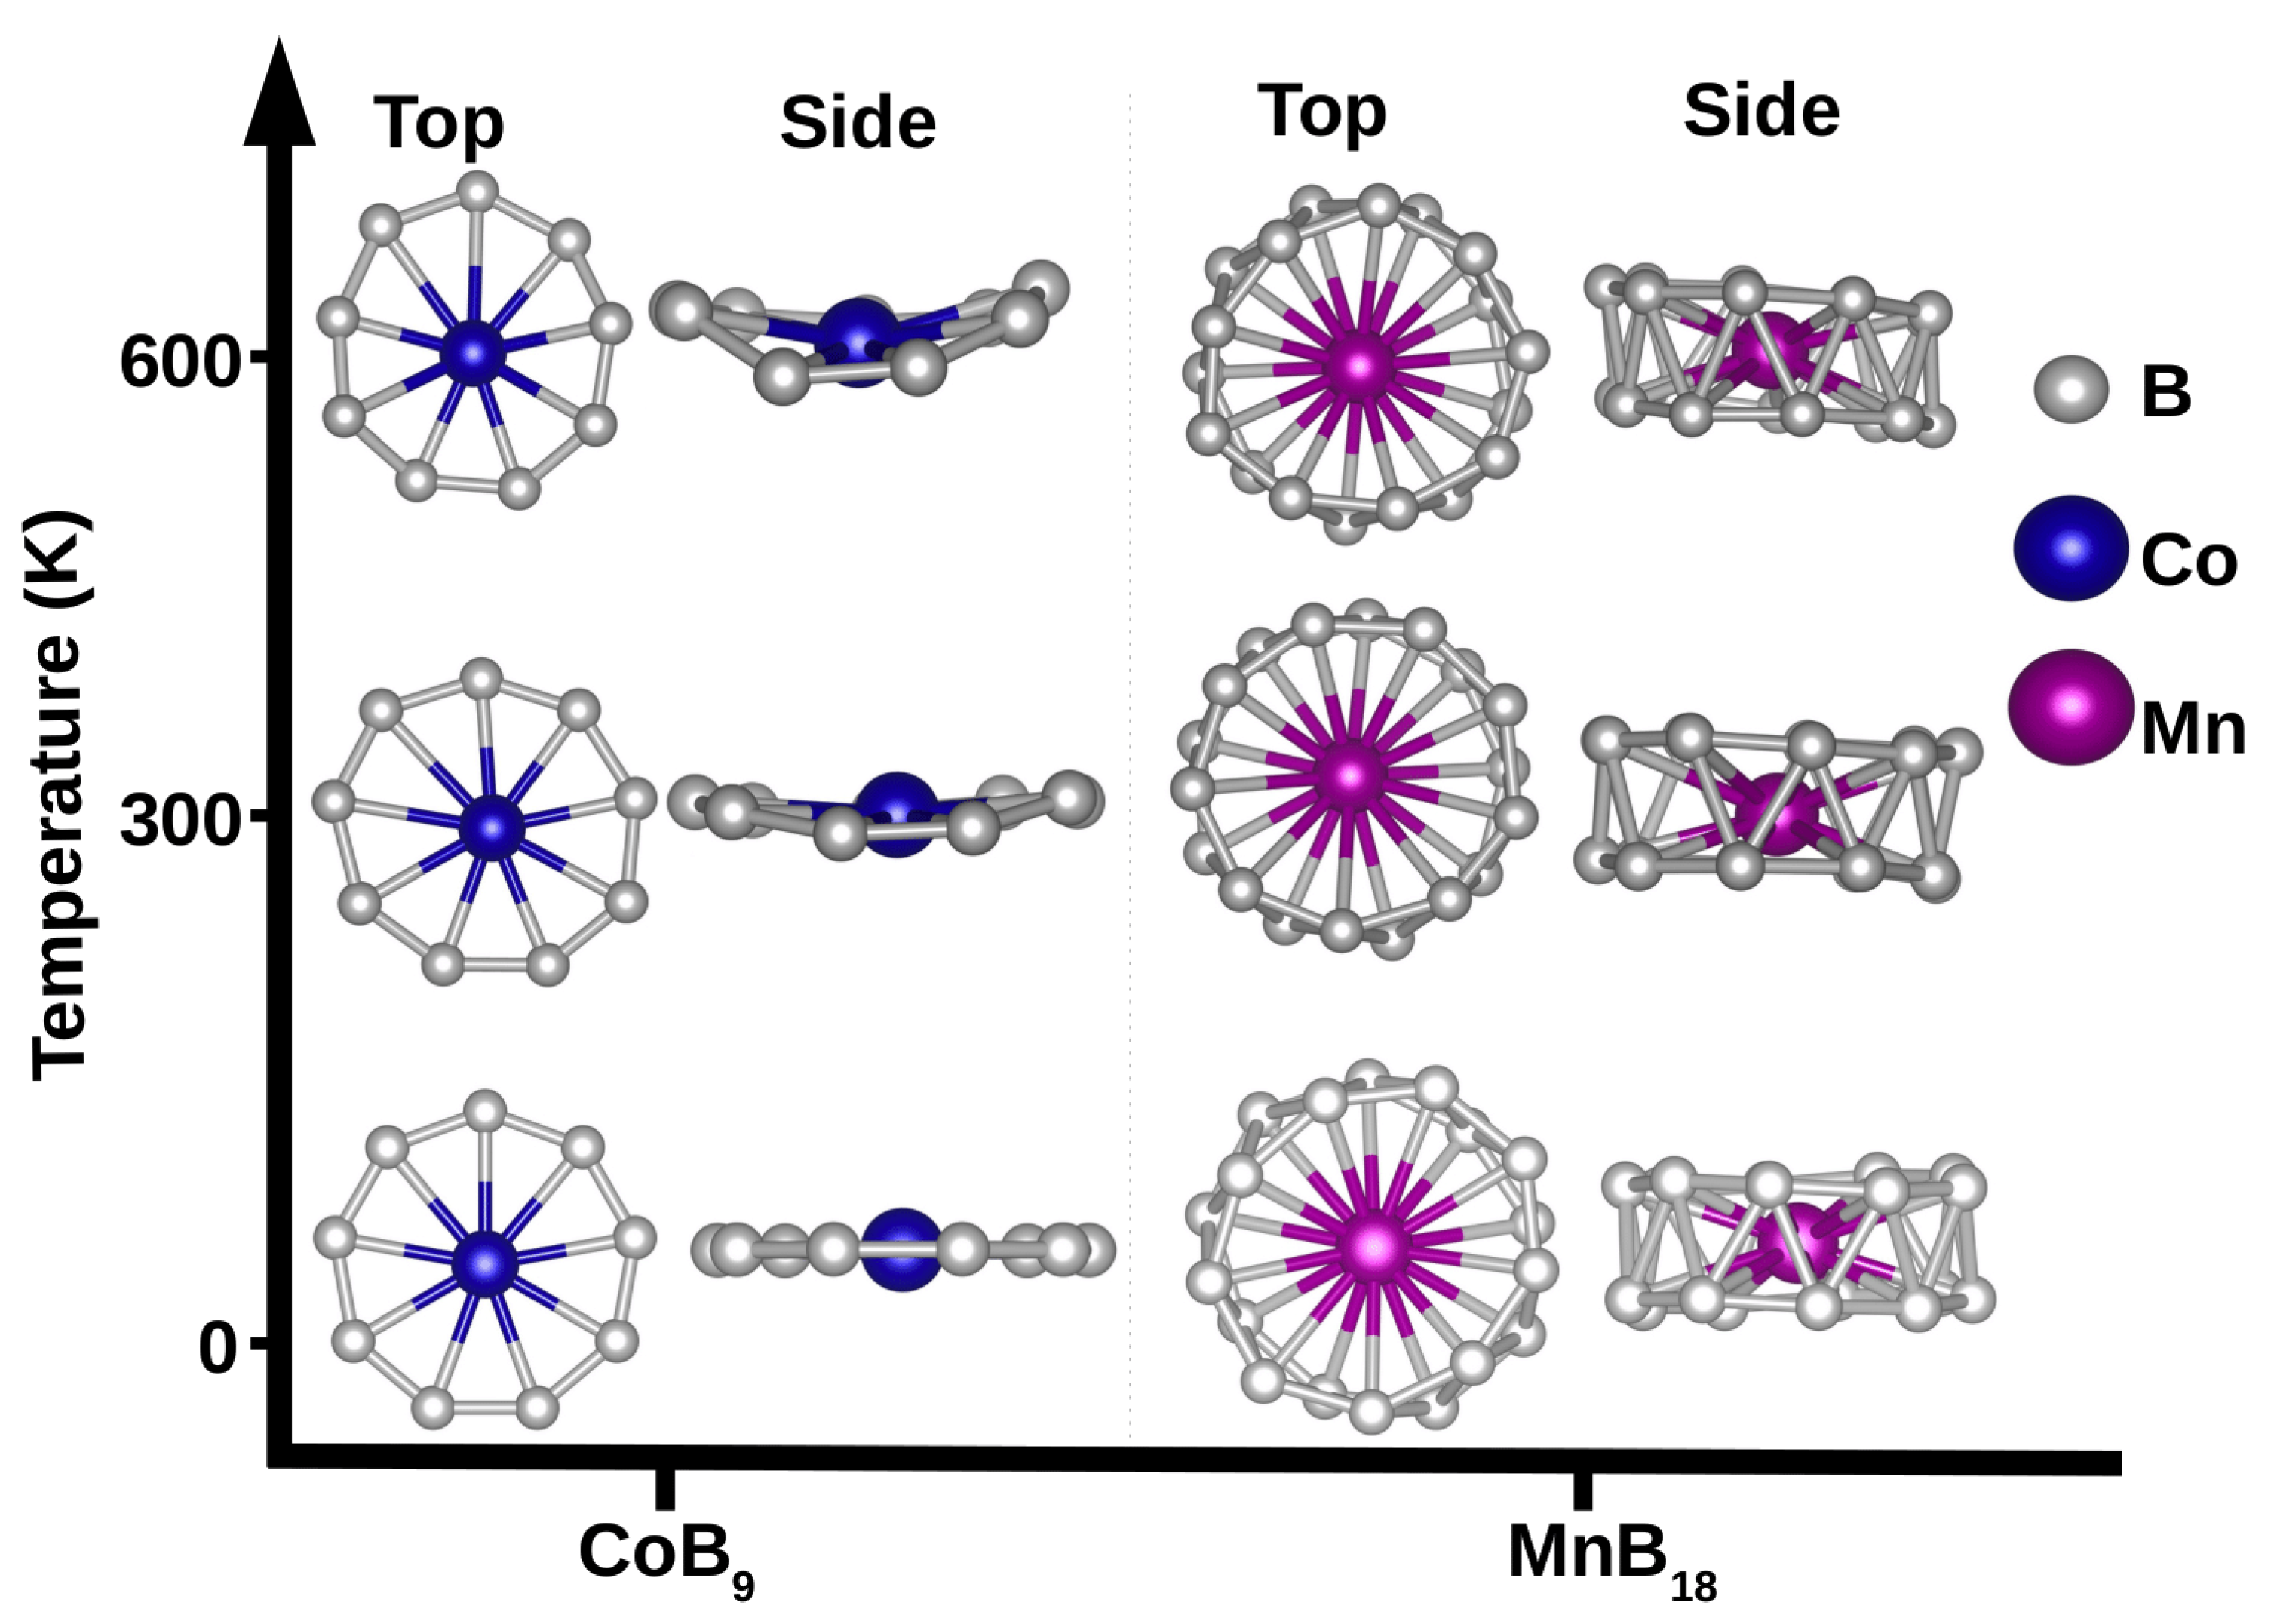
Figure 3.
Total magnetic moment m and local magnetic moment contributions coming from the TM (TM = Ti, Cr, Mn, Fe, Co, Nb, or Mn) atom and the boron atoms for each TMB cluster. In the graph, the total magnetization is represented by the yellow curve, the magnetization due to boron atoms is represented by the blue line, and the contribution from the TMs is represented by the red line.
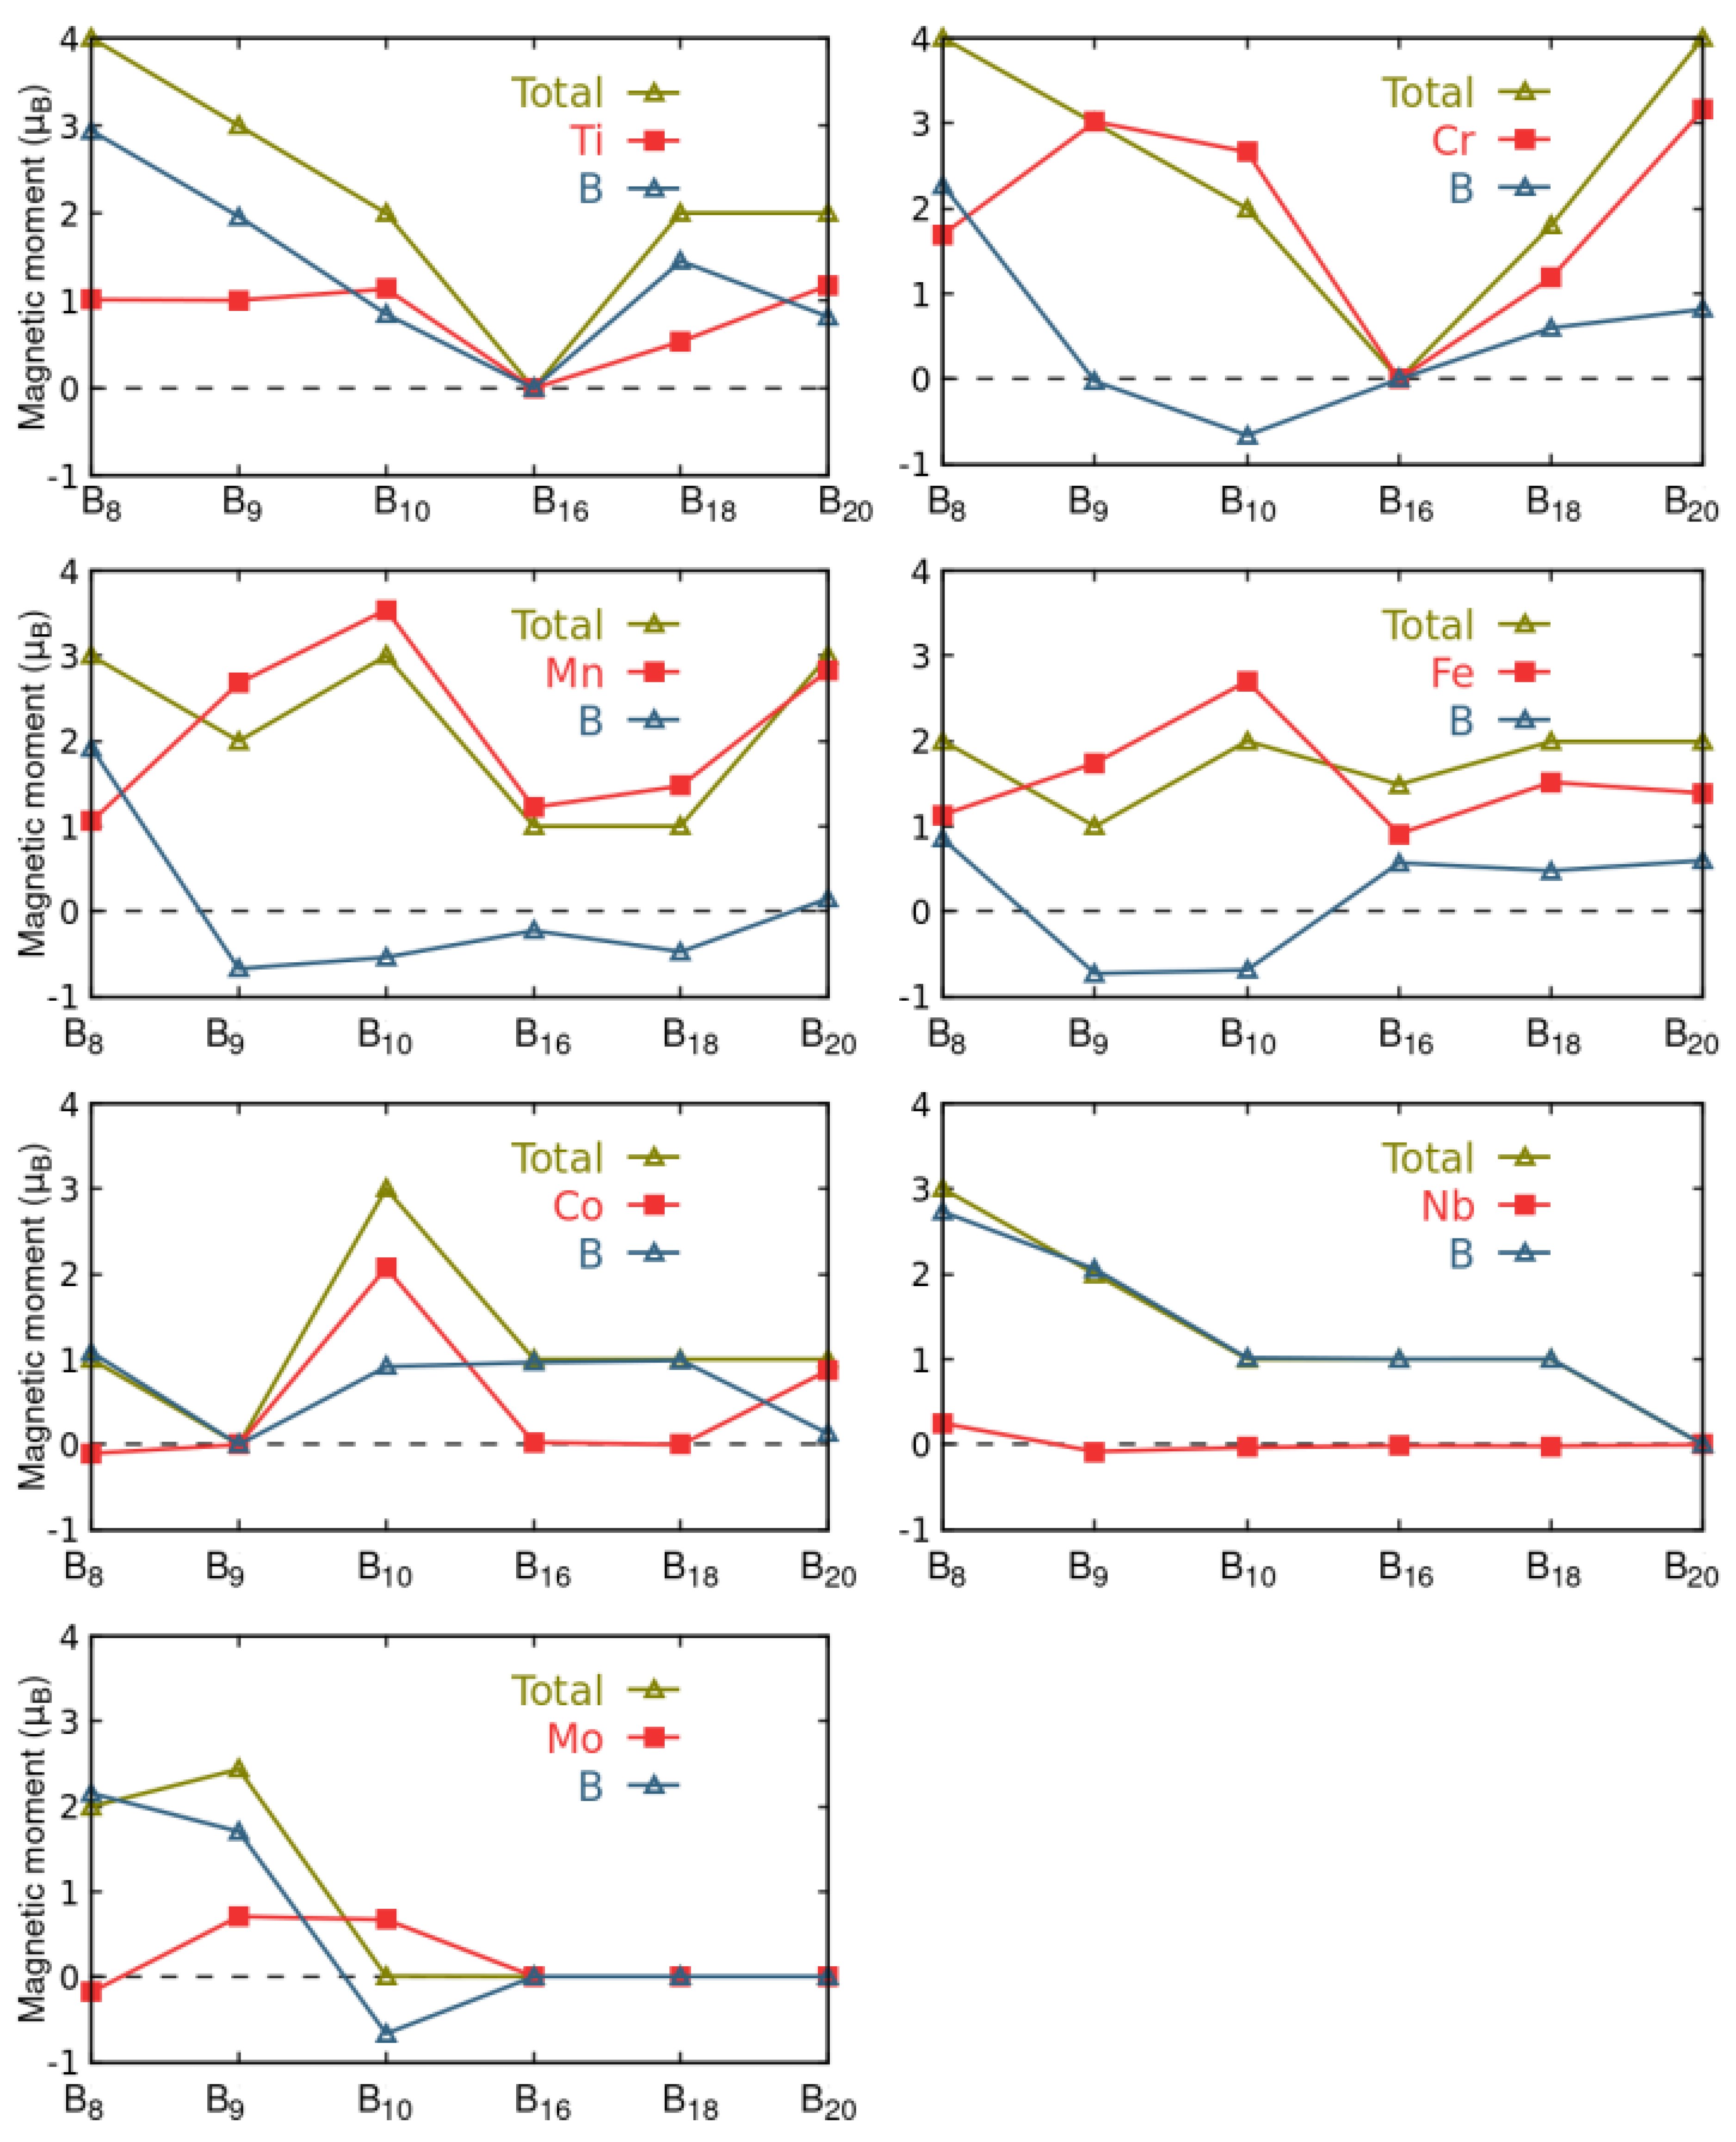
Figure 4.
Difference between the spin-up charge density and the spin-down charge density. Positive and negative values are represented with yellow and cyan, respectively. The value of the iso-surface is given below each system.
Figure 4.
Difference between the spin-up charge density and the spin-down charge density. Positive and negative values are represented with yellow and cyan, respectively. The value of the iso-surface is given below each system.
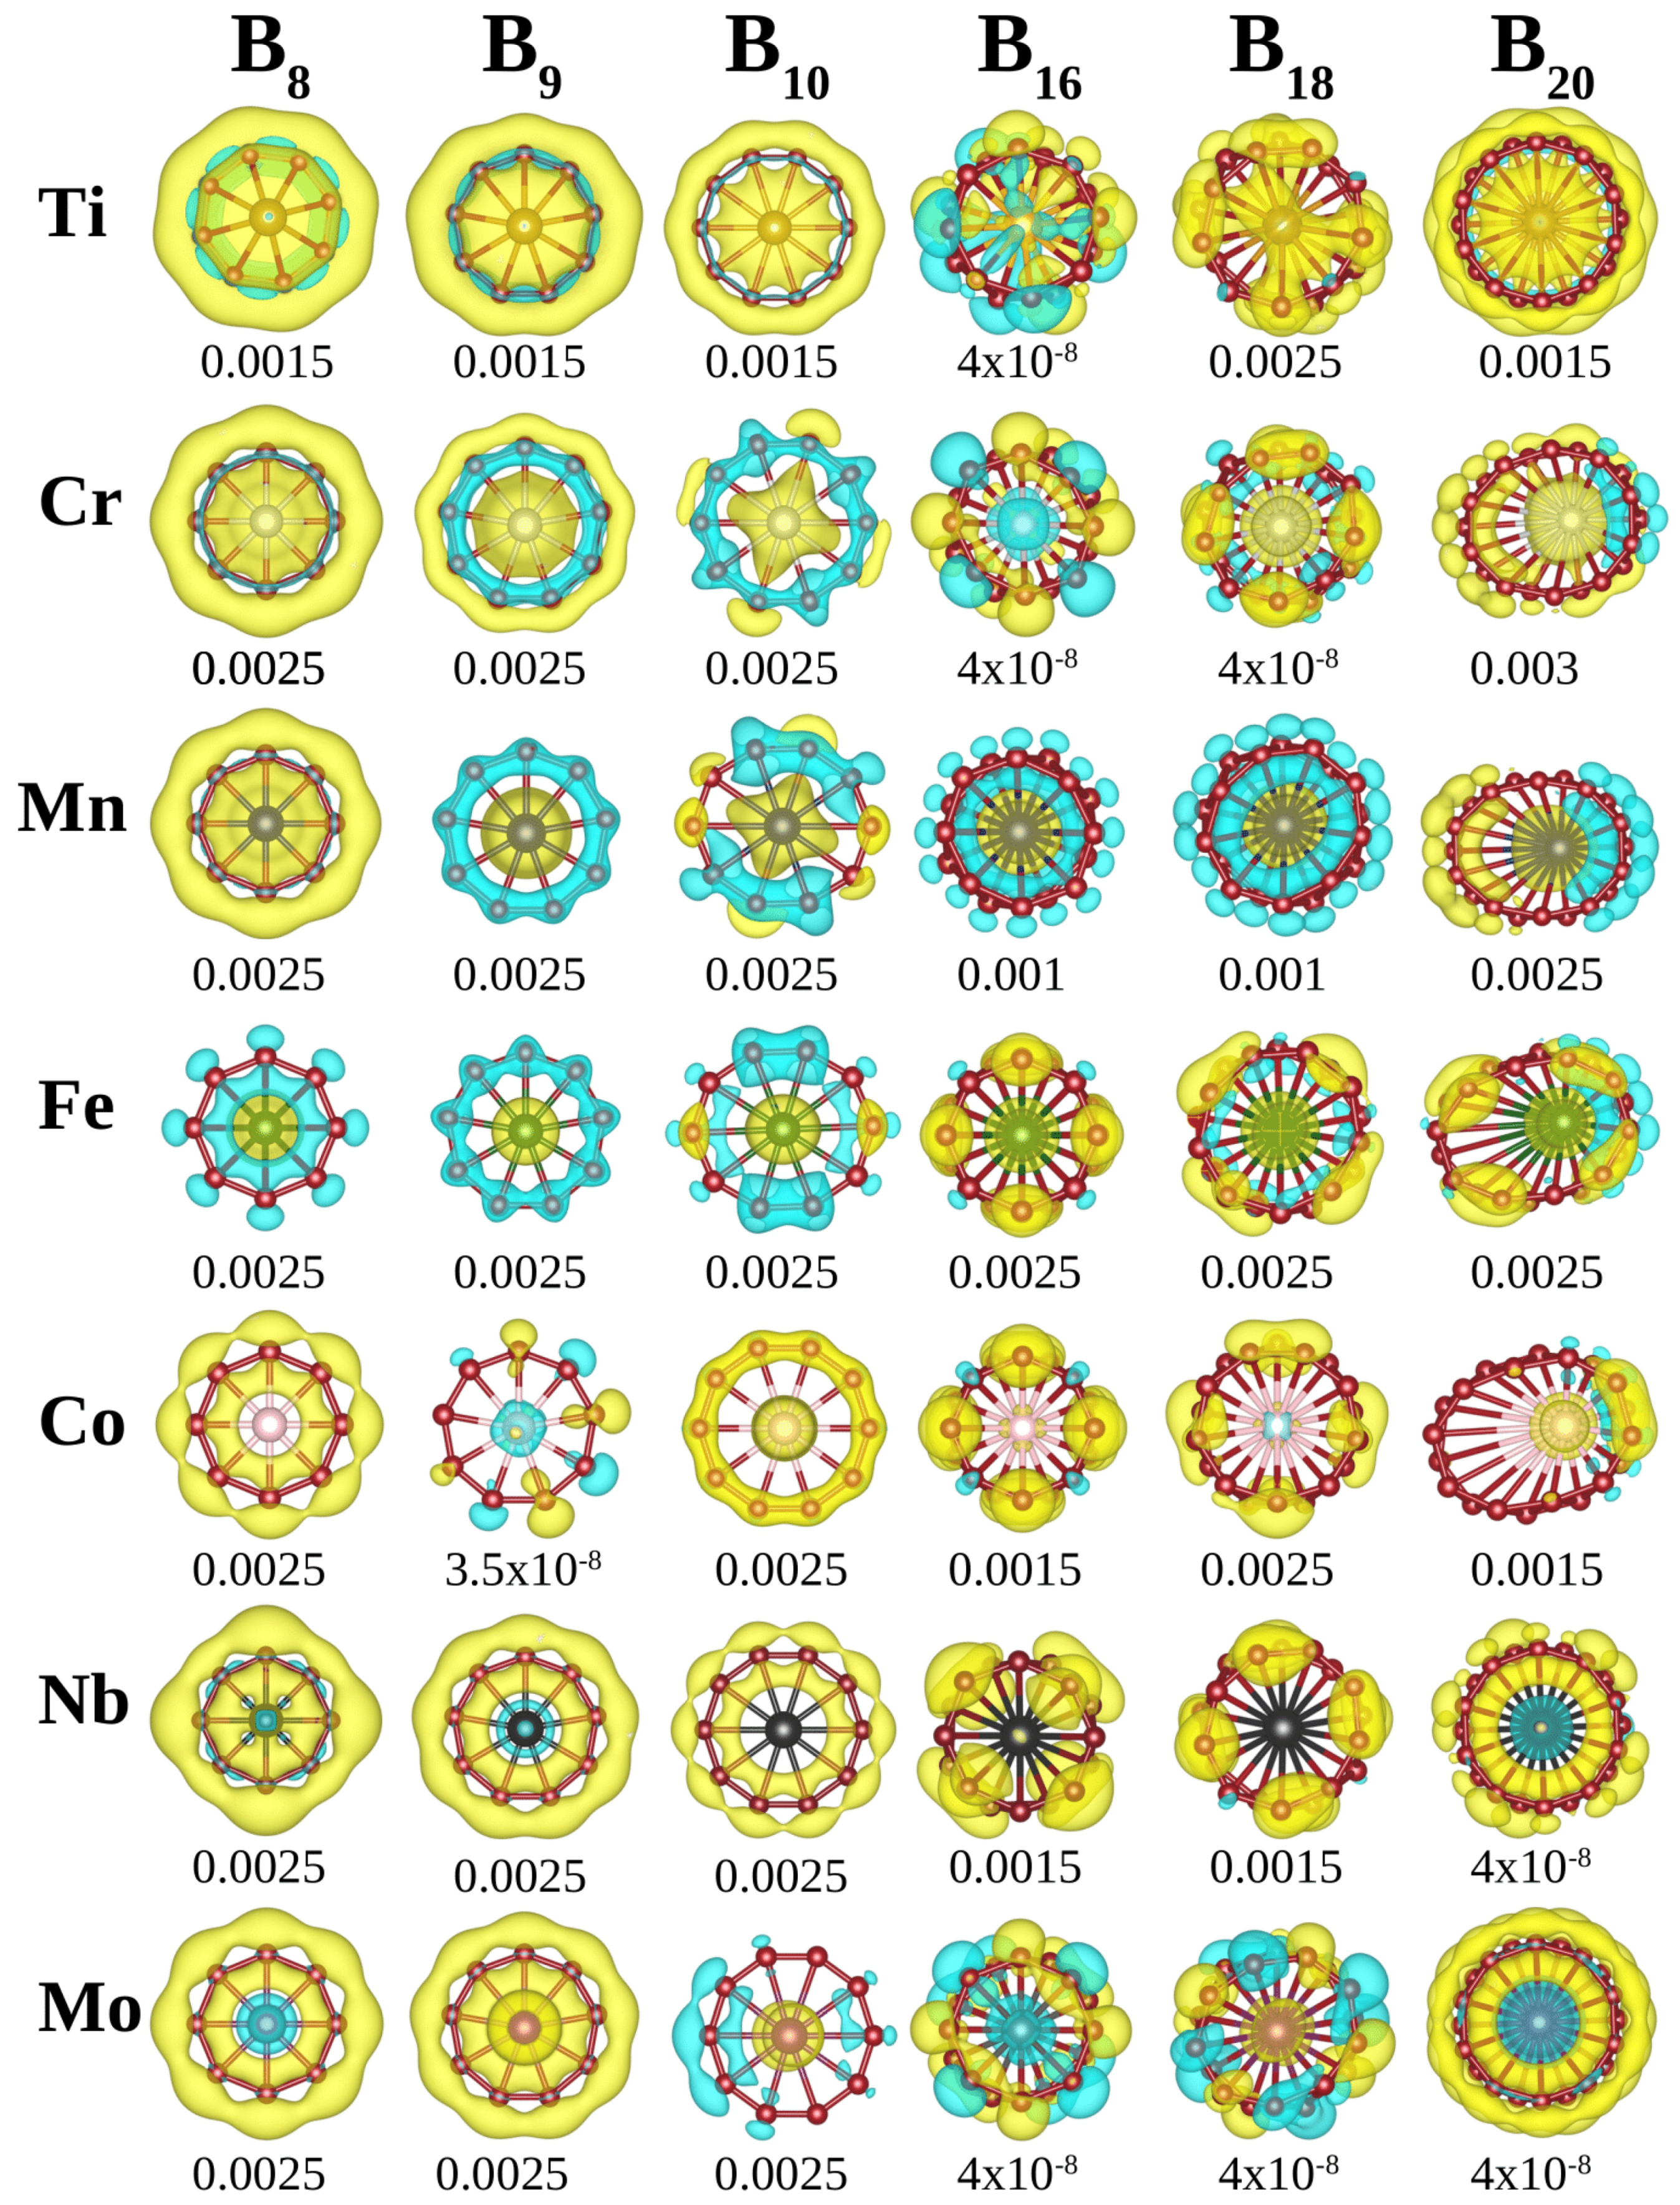
Table 1.
Calculated parameters related to each studied structure: bond length between boron atoms (), bond length between boron and metal atoms (), point group (PG), magnetic moment (m), HOMO-LUMO gap, and binding energy ().
Table 1.
Calculated parameters related to each studied structure: bond length between boron atoms (), bond length between boron and metal atoms (), point group (PG), magnetic moment (m), HOMO-LUMO gap, and binding energy ().
| MB | PG | m | H-L Gap | |||
|---|---|---|---|---|---|---|
| (Å) | (Å) | () | (eV) | (eV) | ||
| TiB | 1.578 | 2.226 | 4 | 0.541 | -9.667 | |
| TiB | 1.558 | 2.335 | 3 | 0.090 | -10.692 | |
| TiB | 1.536 | 2.485 | 2 | 0.617 | -11.106 | |
| TiB | 1.639 | 2.275 | 0 | 0.392 | -8.214 | |
| TiB | 1.608 | 2.460 | 2 | 0.246 | -9.245 | |
| TiB | 1.579 | 2.593 | 2 | 0.312 | -7.925 | |
| CrB | 1.587 | 2.073 | 4 | 0.004 | -11.476 | |
| CrB | 1.551 | 2.269 | 3 | 0.367 | -12.495 | |
| CrB | 1.524 | 2.466 | 2 | 0.357 | -12.152 | |
| CrB | 1.614 | 2.209 | 0 | 0.822 | -11.234 | |
| CrB | 1.588 | 2.432 | 1.8 | 0.122 | -10.471 | |
| CrB | 1.608 | 2.645 | 4 | 0.425 | -8.272 | |
| MnB | 1.572 | 2.054 | 3 | 0.486 | -7.288 | |
| MnB | 1.542 | 2.255 | 2 | 0.880 | -7.733 | |
| MnB | 1.530 | 2.473 | 3 | 0.264 | -7.128 | |
| MnB | 1.602 | 2.235 | 1 | 0.804 | -6.472 | |
| MnB | 1.584 | 2.431 | 1 | 0.558 | -5.397 | |
| MnB | 1.602 | 2.723 | 3 | 0.439 | -3.518 | |
| FeB | 1.564 | 2.065 | 2 | 0.016 | -10.866 | |
| FeB | 1.533 | 2.241 | 1 | 0.785 | -12.050 | |
| FeB | 1.523 | 2.461 | 2 | 0.274 | -11.099 | |
| FeB | 1.594 | 2.231 | 1.49 | 0.063 | -9.955 | |
| FeB | 1.581 | 2.445 | 2 | 0.324 | -8.645 | |
| FeB | 1.617 | 2.760 | 2 | 0.268 | -7.918 | |
| CoB | 1.564 | 2.044 | 1 | 0.001 | -15.709 | |
| CoB | 1.539 | 2.234 | 0 | 1.055 | -15.889 | |
| CoB | 1.522 | 2.462 | 3 | 0.404 | -14.585 | |
| CoB | 1.591 | 2.232 | 1 | 0.297 | -13.398 | |
| CoB | 1.579 | 2.443 | 1 | 0.3105 | -11.828 | |
| CoB | 1.619 | 2.749 | 1 | 0.258 | -11.881 | |
| NbB | 1.653 | 2.157 | 3 | 0.504 | -10.702 | |
| NbB | 1.573 | 2.300 | 2 | 0.418 | -13.055 | |
| NbB | 1.533 | 2.481 | 1 | 0.907 | -13.451 | |
| NbB | 1.661 | 2.306 | 1 | 0.322 | -10.318 | |
| NbB | 1.561 | 2.477 | 1 | 0.362 | -12.179 | |
| NbB | 1.573 | 2.674 | 0 | 0.00 | -10.937 | |
| MoB | 1.628 | 2.126 | 2 | 0.419 | -12.395 | |
| MoB | 1.560 | 2.281 | 2.44 | 0.080 | -14.0208 | |
| MoB | 1.524 | 2.467 | 0 | 0.092 | -13.998 | |
| MoB | 1.658 | 2.249 | 0 | 0.616 | -11.811 | |
| MoB | 1.602 | 2.431 | 0 | 0.415 | -12.663 | |
| MoB | 1.568 | 2.760 | 0 | 1.088 | -10.871 |
Table 2.
Minimum vibrational frequencies for each studied cluster.
| Ring | (cm) | Drum | (cm) |
|---|---|---|---|
| TiB | 206.22 | TiB | 48.41 |
| TiB | 123.91 | TiB | 65.62 |
| TiB | 85.00 | TiB | 78.17 |
| CrB | 87.93 | CrB | 160.53 |
| CrB | 196.47 | CrB | 59.27 |
| CrB | 44.03 | CrB | 89.9 |
| MnB | 140.21 | MnB | 122.13 |
| MnB | 135.68 | MnB | 130.70 |
| MnB | 69.60 | MnB | 27.00 |
| FeB | 133.40 | FeB | 75.14 |
| FeB | 128.48 | FeB | 79.27 |
| FeB | -22.1 | FeB | 64.30 |
| CoB | 132.22 | CoB | 55.24 |
| CoB | 102.07 | CoB | 70.30 |
| CoB | 78.0 | CoB | 90.34 |
| NbB | 45.69 | NbB | 153.38 |
| NbB | 93.35 | NbB | 38.60 |
| NbB | 87.85 | NbB | 102.61 |
| MoB | 29.26 | MoB | 86.96 |
| MoB | 95.29 | MoB | 41.17 |
| MoB | 68.08 | MoB | 106.48 |
Disclaimer/Publisher’s Note: The statements, opinions and data contained in all publications are solely those of the individual author(s) and contributor(s) and not of MDPI and/or the editor(s). MDPI and/or the editor(s) disclaim responsibility for any injury to people or property resulting from any ideas, methods, instructions or products referred to in the content. |
© 2024 by the authors. Licensee MDPI, Basel, Switzerland. This article is an open access article distributed under the terms and conditions of the Creative Commons Attribution (CC BY) license (https://creativecommons.org/licenses/by/4.0/).
Copyright: This open access article is published under a Creative Commons CC BY 4.0 license, which permit the free download, distribution, and reuse, provided that the author and preprint are cited in any reuse.


