Submitted:
16 December 2024
Posted:
17 December 2024
You are already at the latest version
Abstract
Background: The Keiser 10-rep leg press test employs very short rest intervals between each of the ten repetitions (2-38 seconds). This raises concerns about whether the rest periods are sufficient for the athlete to perform optimally in each individual repetition. Objectives: The study aims to investigate the effect of using short (2-38s) or long (3min) rest intervals on maximal force (F0), velocity (V0), power (Pmax), and the slope of the FV-profile (FVslope) in the Keiser's 10-repetition leg press test. Methods: A total of 30 athletes (age 17.1 ± .9 years, height 177.8 ± 8.8 cm, body mass 71.9 ± 11.3 kg), performed 3 separate tests (total of ~ 900 repetitions) in a Keiser A420 leg press machine, separated by 4 to 8 days. Test day 1 included a 1RM test followed by a 10-repetition force-velocity test with short rest intervals between the repetitions. Test days 2 and 3 involved the same test, with pre-programmed either short rest intervals, or manually conducted long rest intervals, between repetitions. Results: Increasing inter-repetition rest significantly improved V₀ and Pₘₐₓ, while also altering the FV slope. A small but significant reduction was observed in F0. These benefits of longer rest were associated with light to moderate loads, where standard Keiser rest intervals are short (2–9 seconds). However, extending rest intervals beyond approximately 30 seconds, as used at higher loads, provided no additional advantages. Conclusions: Longer rest intervals improve V₀, Pₘₐₓ, and FV slope, particularly at light to moderate loads where standard short rests are insufficient. Extending rest beyond 30 seconds at higher loads offers no additional benefits.
Keywords:
Physical testing
; force-velocity test
; power
; mobilizing
; rest intervals
; recovery
1. Introduction
Force-velocity (FV) profiling, and specifically the Keiser 10-rep test, has seen a significant rise in popularity over the last decades [1,2]. Due to the fixed seating position and back support, machine exercises such as this are considered safe, less technically demanding, and require less familiarization compared to more traditional free-weight exercises [3]. In sports requiring significant strength, power, and speed, FV profiling has become an essential tool for assessing performance, monitoring training adaptations, and providing coaches with valuable insights to optimize training programs for athletes [3,4,5,6,7,8]. The concept of FV profiling is grounded in the fundamental properties of skeletal muscle, wherein an inverse relationship exists between force and velocity [9,10].
The FV relationship in multi-joint movements exhibits a linear pattern, contrasting with the hyperbolic relationship seen in isolated muscles or single-joint movements [9]. This linearity allows the calculation of a linear regression line and the extrapolation of its endpoints, identifying four key metrics: the theoretical maximum force (F0), representing the force at zero velocity, and the theoretical maximum velocity (V0), representing the velocity at zero force. Additionally, the theoretical maximum power is calculated using the formula (F0·V0)/4, and the slope of the FV profile (FVslope) is determined as F0/V0 [6,11].
For assessing lower body musculature, force-velocity (FV) profiling has most commonly been determined using vertical jumps with incremental loads [12,13]. However, this method has limitations, including the technical difficulty of jumping with heavy loads near F0 and the inability to measure velocities close to V0 due to body weight being the lightest possible load [7]. The pneumatic resistance-based Keiser leg press, widely used in sports and research facilities globally, offers several advantages over traditional weight-based exercises [14]. One of the main advantages with pneumatic based resistance is that it allows for more precise assessment near the F0 and V0 intercepts since the effects of inertia and body weight are minimized. Obtaining measurements closer to F0 and V0 has been shown to produce more reliable results [6,15]. The Keiser A420 leg press is equipped with a pre-installed, standardized protocol for force-velocity profiling based on a series of 10 repetitions at different loads. The test requires an input of an estimated 1RM value, from which it calculates appropriate loads for each repetition necessary to obtain a full FV profile [16].
To achieve a valid test result that can be used to assess development in high-level athletes, it is crucial that the test accurately reflects the performance capacity[17]. In the context of FV-profiling, using appropriate inter-repetition rest intervals is crucial for achieving full recovery, which in turn facilitates consistent and optimal performance results [18,19,20]. In the Keiser A420 10-rep test, the inter-repetition rest intervals are pre-determined, ranging from 2 seconds between the two lightest loads (reps 1 and 2) to 38 seconds between the two heaviest loads (reps 9 and 10), which diverge from widely accepted recommendations for maximal effort strength, speed and power testing [18,21,22,23]. For one-repetition maximum (1RM) testing, rest intervals of 2 to 5 minutes are commonly recommended [21,24]. In assessments of explosive strength and sprint, rest intervals of 1 to 3 minutes have been suggested as optimal [23]. These rest intervals are reference ranges and may need to be adjusted based on gender, age, sport, and training status [25,26,27,28]. Previous studies have indicated that strong individuals with a significant amount of muscle mass may require longer rest periods than weaker individuals with less muscle mass [29].
To our knowledge, no previous investigations have explored the influence of longer inter-repetition rest interval duration on the FV-outcome using the Keiser A420 leg press. The aim of this study was to compare the results of the Keiser protocol using standard incremental inter-repetition rest intervals of 2-38 seconds, with a modified protocol using fixed 3 inter-repetition rest duration, focusing on the main test outcome variables: V0, F0, Pmax, and FVslope.
2. Methods
2.1. Participants
A total of 30 participants, all enrolled in a sports program at the same high school in Norway, were recruited for this study. Their age, height, and body mass (mean ± SD) were 17.1 ± 0.9 years, 177.8 ± 9.0 cm, and 71.9 ± 12.1 kg. The study included both male (n=14; 16.9 ± 0.9 years; 185.3 ± 6.6 cm; 77.7 ± 12.1 kg) and female (n=16; 17.1 ± 0.8 years; 171.3 ± 4.7 cm; 66.4 ± 8.1 kg) athletes. Fifteen of the participants were handball players, and the remaining 15 participants were endurance athletes competing in track (middle-distance and long-distance, n = 6), orienteering (n = 1), cycling (n = 2), rowing (n = 5), and swimming (n = 1). All participants competed at a national junior level in their respective sport (Table 1).
2.2. Experimental Approach to the Problem
All participants completed three days of testing (Table 2), separated by 4 to 8 days to allow for adequate physical recovery. All tests were performed on a Keiser A420 pneumatic leg press machine at the Norwegian Olympic Federation test center in Stavanger, Norway. On Test Day 1, participants underwent a 1RM (one-repetition maximum) test protocol, followed by a familiarization session using the Keiser 10-repetition force-velocity (FV) profiling test. Standard rest intervals of 2–38 seconds were implemented between repetitions during the familiarization session. The recovery time between the two tests was 5 minutes. During test day 2 and 3, the participants performed either the Keiser 10-repetition FV-profiling test with standard (Short) incremental rest intervals of 2-38 seconds, or a fixed manually timed 3-minute rest intervals (Long) between each repetition. Participants were randomized into two groups, ensuring a balanced distribution of gender and sport background in each group. Differentiating the test order aimed to minimize the potential influence of test familiarization on the results.
2.3. Procedures and Warm-Up
On test day 1, body weight and height were measured using a Seca 877 floor scale and a Seca 222 mechanical telescopic measuring rod. All subjects performed a standardized warm-up prior to each test session. This included a general warm-up consisting of 5 minutes of ergometer rowing (pace 2-2:30 min/500m), followed by a specific warm-up on the Keiser leg press, consisting of 1 x 3 repetitions at 20%, 40%, and 60% of estimated 1RM, with a 1-minute rest interval between each load level. In advance, all participants received written instructions to prepare themselves for each test sessions as they would for a competition, with regards to diet, fluid intake, and rest. They were also instructed to avoid any strenuous exercise 24 hours prior to testing. The equipment, test leader, and location were identical for all tests.
2.4. Strength Testing Protocols
For both the 1RM and Keiser's 10-rep tests, each participant's seat on the Keiser A420 leg press was adjusted to achieve a nearly vertical femur, with the position recorded and consistently used across all tests. Feet were positioned with the heels flush at the lower end of the foot pedal to standardize testing across participants.
Maximum strength was assessed using Earle's 1RM testing protocol [21,27]. Following a warm-up, participants rested for 2 minutes before doing 2-3 repetitions at a submaximal load equivalent to approximately 80% of their predicted 1RM. The load was then progressively increased, with 3-minute rest intervals between attempts, until 1RM was achieved. All participants successfully determined their 1RM within 3–5 attempts.
All participants underwent Keiser's 10-rep test protocol on 3 separate occasions (Table 2). The value from the 1RM test was entered and based on this the Keiser A420 software calculated and dictated individual test loads. Participants were instructed to execute each repetition with maximum effort during the concentric phase, starting from the predetermined pedal position ensuring concentric-only actions without countermovement. The eccentric phase was performed submaximally and was not recorded.
2.4. Statistical Analyses
A repeated measures multivariate analysis of variance (RM-MANOVA) was conducted to examine the overall effect of experimental conditions on the four dependent variables (V0, F0, Pmax and FVslope) while accounting for within-subject variability and the correlations among the dependent variables. The analysis included one within-subject factor, rest interval, with two levels: "Short" and "Long." The RM-MANOVA tested the main effect of rest intervals and the interaction between the two levels of conditions (Short and Long) and the dependent variables to determine whether the condition's effect varied across the different measures.
Before conducting the RM-MANOVA, data were restructured, and key assumptions were tested and confirmed within acceptable limits. These included normality (Shapiro-Wilk test), homogeneity of covariance matrices (Box’s M test), and sphericity (Mauchly's test). Correlations among the dependent variables were also examined, confirming that multicollinearity was not a concern.
Follow-up univariate analyses were conducted for each dependent variable to identify specific effects. A significance level of α=0.05 was applied to all statistical analyses. Bonferroni correction was applied to control for Type I error across multiple comparisons, and effect sizes (partial eta squared, η²) are reported to indicate the magnitude of the observed differences. Consistent with established guidelines, effect sizes values were interpreted as small (η²=0.01), medium (η²=0.06), and large (η²=0.14). All statistical analyses were conducted using SPSS (version 28, IBM Corp., Armonk, NY, USA). GraphPad Prism (version 10.4.0, GraphPad Software, San Diego, CA, USA) was used for data visualization and graphical representation of the results.
3. Results
The initial analysis (RM-MANOVA) showed no significant difference of inter-repetition rest interval length when considering all dependent variables together (F1,29 = 0.329, p = 0.571, partial η² = 0.011). However, a significant interaction effect was found between rest and dependent variables (F3,27 = 8.969, p < 0.001, partial η² = 0.499), suggesting that the effect of rest interval length varied across the dependent variables. Follow-up univariate analyses revealed significant differences between short and long rest intervals across all measured variables (Table 4). Participants exhibited a significantly higher theoretical maximum velocity (V₀) following long rest intervals compared to short rest intervals (Mean ± SD: 2.38 ± 0.27 m/s² vs. 2.26 ± 0.27 m/s²; p < 0.001). This represented a 5.7% increase with a large effect size (η² = 0.344), suggesting that extended recovery optimizes velocity-dominant performance. Conversely, maximum force (F₀) was slightly but significantly greater with short rest intervals compared to long rest intervals (Mean ± SD: 2082.6 ± 523.7 N vs. 2040.2 ± 523.0 N; p = 0.010). Although the mean difference was modest (-2.1%), the effect size was moderate (η² = 0.208), indicating a potential benefit of shorter rests for force output. Long rest intervals produced significantly higher peak power outputs (Mean ± SD: 1296.7 ± 440.3 W vs. 1243.2 ± 389.6 W; p = 0.005), with a mean increase of 3.69% and a moderate effect size (η² = 0.253). This underscores the importance of recovery for optimizing power performance. The force-velocity slope (FVₛₗₒₚₑ) was steeper following long rest intervals compared to short rest intervals (Mean ± SD: -0.0119 ± 0.002 vs. -0.0111 ± 0.002; p = 0.035). Although the percentage change was relatively large (+8.12%), the effect size was small (η² = 0.146), suggesting a less pronounced but significant influence of rest duration on the relationship between force and velocity.
The individual test results for each metric, shown in Figure 1 (a–d), provide a detailed visualization of participant-level variability. Figure 1a demonstrates consistently higher V₀ values observed with long rest intervals across most participants. In contrast, figure 1b demonstrates greater variability in F₀ values, with some individuals performing similarly, or in some cases better, with short rest intervals. Figure 1c illustrates a clear trend toward higher Pₘₐₓ with longer rest intervals, while Figure 1d shows individual responses for FVₛₗₒₚₑ with an overall trend pointing towards steeper slopes with longer recovery. These figures illustrate the range of individual adaptations to different rest interval protocols, complementing the statistical findings reported in Table 4.
Figure 2 illustrates the average relative changes in velocity, force, and power metrics across repetitions during the 10-repetition test. For velocity, average changes ranged from 2.57% to -11.53% across repetitions, with increasing variability reflected by a standard deviation of 7.79% to 23.54%. Similarly, force changes ranged from 3.33% to -0.79%, showing lower variability (SD: 6.46% to 2.62%). Power demonstrated the largest relative changes (5.14% to -9.63%) and the greatest variability (SD: 10.51% to 20.20%). These trends highlight the advantage of longer rest intervals at lower loads, with progressively diminishing performance benefits of long rest intervals as loads increase.
4. Discussion
This study aimed to investigate if longer inter-repetition rest intervals influence force-velocity (FV) metrics—specifically V0, F0, Pmax, and FVslope—during the Keiser A420 leg press 10-rep test. A significant interaction revealed that the impact of inter-repetition rest duration varied across the FV metrics. Follow-up analyses demonstrated significant differences in all four metrics, with the largest average difference in the FVslope (8.1%), followed by a 5,7% increase in V0 and 3,7% increase in Pmax. In contrast, a small but significant reduction (2,1%) was observed in F0 when longer rest intervals were used. Individual repetition analysis revealed a load specific effect, indicating that the very short rest intervals (2-9 seconds) used in the Keiser 10-rep test at low and moderate loads impair optimal performance and should be increased to elicit optimal performance and test results.
Accurate assessments of metrics such as V0, F0, Pmax, and FVslope are critical for tailoring athlete training programs [5,7,14]. When assessing athletic performance, even subtle improvements can be meaningful if they represent a genuine enhancement in an athlete’s capabilities rather than variability caused by testing protocols, instrumentation, or fluctuations in athlete preparedness on a given day. In sports testing, the smallest worthwhile change (SWC) is frequently calculated as 0.2 × the baseline standard deviation (SD), as suggested by Cohen [30,31]). Applying this threshold to our data, both V0 and FVslope comfortably exceeds the SWC, while Pmax approaches but remains just below this limit. However, for elite athletes, even smaller relative changes might be considered worthwhile, given the minimal margins often separating competitors at the highest level [32,33].
Another important consideration when interpreting test performance data is the reliability of the test itself. Reliability ensures that observed differences are not the result of random measurement error. In this context, the typical error (TE), a widely recognized measure of reliability, quantifies the random variation inherent in repeated measurements [34]. Although the TE was not explicitly reported in this study, all differences in FV-variables, except for F0, exceeded TE thresholds (data not shown). This indicates that the performance changes due to longer rest intervals are unlikely due to random variability, thereby underscoring the practical significance of our findings. Together, evaluation of SWC and TE strengthens the confidence that the reported improvements in this study reflect real and meaningful changes in performance rather than measurement noise [35].
In agreement with our findings, both velocity and power have previously been shown to be highly sensitive to recovery times [36]. Although the initial loads in the Keiser 10-rep test start as low as 15% of 1RM, each repetition requires maximal efforts and must elicit the highest possible rate of force development (RFD), requiring maximal bursts of action potentials in the nervous system [37,38]. It seems plausible that resting for only 2-9 seconds, which is the case for rep 1 through 6, does not give the nervous system enough time to fully recover and prepare for another maximal effort action potential discharge [20]. Other explanations for the benefits of longer rest intervals might lie within the muscle cells energy delivery system, as high intensity efforts rely on fast acting glycolytic energy systems. Depleting PCr stores and accumulating metabolic byproducts, such as H+ ions, have previously been shown to impair muscle function ([24,29]). Extending rest intervals beyond 2-9 seconds would thus increase muscle cells ability for sufficient PCr replenishment and pH stabilization, potentially enabling higher force and velocity outputs [29].
In contrast to the results observed at light and moderate loads, and somewhat unexpectedly, extending rest intervals at loads above 80% of 1RM (repetitions 8–10) did not improve performance. Instead, it resulted in a small yet statistically significant reduction in performance. One possible explanation for this finding might lie in the fact that resting as long as 3 minutes might be counterproductive. Extending inter-repetition rest intervals longer than needed might cause participants to lose focus and optimal level of arousal, thereby reducing the phycological basis to optimally perform maximal effort attempts [39]. In fact, this sensation was reported to the test leader by several of the athletes during and after testing. In accordance with this hypothesis, a study by Nibali and coworkers [20], found no significant benefits of additional rest beyond one minute, when performing FV-profiling using a loaded squat jump. As shorter rest intervals were not tested in their study, and considering our findings, it is plausible that a threshold exists somewhere around 30–60 seconds, beyond which no further improvement in performance can be achieved. Extending rest intervals beyond this time frame may negatively impact maximal effort test results during single repetitions, such as in force-velocity profiling.
The substantial inter-subject variation observed at high loads, particularly during repetition 10, likely results from a combination of factors. Firstly, the final repetition in the Keiser 10-rep test represents the participant's 1RM. Notably, six out of the 30 participants were unable to complete a full concentric repetition at their predetermined 1RM (established during test day one) on one or both subsequent test days. Despite instructions to prepare consistently, as they would for competition, individual differences in readiness and day-to-day variations are inevitable. Additionally, we believe that excessively long rest intervals may have contributed to the increased variance observed at higher loads, likely due to fatigue from prolonged duration and a loss of optimal arousal levels, as previously mentioned. While rest protocols were counterbalanced for half of the participants to reduce familiarization and learning effects, the load sequence remained consistent across all participants. Future research should explore reversing the load sequence, starting with the highest loads, to assess whether prolonged test durations and potential psychological fatigue are specifically related to the load or the overall testing time.
From a methodological standpoint, our findings emphasize the importance of aligning FV profiling protocols with physiological and psychological recovery principles. Furthermore, while 3-minute rest intervals were used in this study, reducing unnecessarily long rest intervals—and thereby shortening the total test duration—would be advantageous from a practical perspective. Given that tests are often conducted on larger groups or teams, logistical efficiency, cost-effectiveness, and time management are important considerations. Future research should therefore aim to identify the optimal recovery time required to balance these practical constraints with accurate performance assessment.
5. Conclusion
In conclusion, this study highlights the need to re-evaluate inter-repetition rest interval lengths in FV profiling using the Keiser A420 leg press. While longer rest intervals significantly enhance performance metrics at light to moderate loads, they offer no additional benefits at higher loads. Future research should aim to optimize load-specific rest intervals to maximize performance outcomes without compromising the efficiency of testing protocols.
Author Contributions
Conceptualization, C.M.J, E.T. and J.M.K.; methodology, C.M.J, J.M.K, S.B.A. and E.T. validation, C.M.J, E.T. and J.M.K..; formal analysis, C.M.J, E.T. and J.M.K.; investigation, C.M.J, E.T. and J.M.K.; resources, C.M.J, J.M.K, S.B.A. and E.T..; data curation, C.M.J, J.M.K, S.B.A. and E.T. writing—original draft preparation, C.M.J, J.M.K, S.B.A. and E.T..; writing—review and editing, C.M.J., J.M.K, S.B.A. and E.T..; visualization, J.M.K., C.M.J..; supervision, J.M.K, and E.T.; project administration, C.M.J. and E.T..; All authors have read and agreed to the published version of the manuscript.”
Institutional Review Board Statement
The study was conducted in accordance with the ethical standards of the responsible academic institution. Approval for data protection and management was obtained from the Norwegian Center for Research Data (reference number: 339372) and performed in agreement with the Declaration of Helsinki.
Informed Consent Statement
Informed consent was obtained from all subjects involved in the study.
Data Availability Statement
The datasets generated and/or analyzed during the current study can be obtained from the corresponding author upon reasonable request.
Acknowledgments
The authors would like to thank the participating athletes for their time and effort, and the Norwegian Olympic Federation (Stavanger) for access to facilities and equipment.
Conflicts of Interest
The authors declare no conflicts of interest.
References
- Colyer, S.L.; Stokes, K.A.; Bilzon, J.L.J.; Holdcroft, D.; Salo, A.I.T. Training-Related Changes in Force–Power Profiles: Implications for the Skeleton Start. International Journal of Sports Physiology and Performance 2018, 13, 412–9. [Google Scholar] [CrossRef] [PubMed]
- Huang, R.; Zhang, M.; Huang, L.; Chen, Z.; Mo, Y.; Gao, Y. Effects of lower-extremity explosive strength on youth judo athletes adopting different types of power-based resistance training. Front Physiol. 2023, 14, 1065036. [Google Scholar] [CrossRef] [PubMed]
- Haff, G.G. Roundtable Discussion: Machines Versus Free Weights. National Strength & Conditioning Association 2000, 22, 18–30. [Google Scholar]
- Drigny, J.; Pamart, N.; Azambourg, H.; Remilly, M.; Reboursière, E.; Gauthier, A. Impact of a 20-Week Resistance Training Program on the Force–Velocity Profile in Novice Lifters Using Isokinetic Two-Point Testing. JFMK 2024, 9, 222. [Google Scholar] [CrossRef]
- Jiménez-Reyes, P.; Samozino, P.; Brughelli, M.; Morin, J.B. Effectiveness of an Individualized Training Based on Force-Velocity Profiling during Jumping. Front Physiol. 2016, 7, 677. [Google Scholar] [CrossRef]
- Lindberg, K.; Solberg, P.; Bjørnsen, T.; Helland, C.; Rønnestad, B.; Thorsen Frank, M. Force-velocity profiling in athletes: Reliability and agreement across methods. PLoS ONE 2021, 16, e0245791. [Google Scholar] [CrossRef]
- Lindberg, K.; Solberg, P.; Rønnestad, B.R.; Frank, M.T.; Larsen, T.; Abusdal, G. Should we individualize training based on force-velocity profiling to improve physical performance in athletes? Scandinavian Med Sci Sports 2021, 31, 2198–210. [Google Scholar] [CrossRef]
- Morin, J.B.; Samozino, P. Interpreting Power-Force-Velocity Profiles for Individualized and Specific Training. International Journal of Sports Physiology and Performance 2016, 11, 267–72. [Google Scholar] [CrossRef]
- Alcazar, J.; Csapo, R.; Ara, I.; Alegre, L.M. On the Shape of the Force-Velocity Relationship in Skeletal Muscles: The Linear, the Hyperbolic, and the Double-Hyperbolic. Front Physiol. 2019, 10, 769. [Google Scholar] [CrossRef]
- Gülch, R. Force-Velocity Relations in Human Skeletal Muscle. Int J Sports Med. 1994, 15, S2–10. [Google Scholar] [CrossRef]
- Samozino, P. A Simple Method for Measuring Lower Limb Force, Velocity and Power Capabilities During Jumping. I: Morin JB, Samozino P, redaktører. Biomechanics of Training and Testing [Internett]. Cham: Springer International Publishing; 2018 [sitert 10. desember 2024]. s. 65–96. Available online: http://link.springer.com/10.1007/978-3-319-05633-3_4.
- Bobbert, M.F.; Lindberg, K.; Bjørnsen, T.; Solberg, P.; Paulsen, G. The Force–Velocity Profile for Jumping: What It Is and What It Is Not. Medicine & Science in Sports & Exercise 2023, 55, 1241–9. [Google Scholar]
- Kotani, Y.; Lake, J.; Guppy, S.N.; Poon, W.; Nosaka, K.; Hori, N. Reliability of the Squat Jump Force-Velocity and Load-Velocity Profiles. Journal of Strength and Conditioning Research 2022, 36, 3000–7. [Google Scholar] [CrossRef] [PubMed]
- Lindberg, K.; Eythorsdottir, I.; Solberg, P.; Gløersen, Ø.; Seynnes, O.; Bjørnsen, T. Validity of Force–Velocity Profiling Assessed With a Pneumatic Leg Press Device. International Journal of Sports Physiology and Performance 2021, 16, 1777–85. [Google Scholar] [CrossRef] [PubMed]
- Avrillon, S.; Jidovtseff, B.; Hug, F.; Guilhem, G. Influence of Isoinertial-Pneumatic Mixed Resistances on Force–Velocity Relationship. International Journal of Sports Physiology and Performance 2017, 12, 385–92. [Google Scholar] [CrossRef]
- Larsen, F.; Loturco, I.; Sigvaldsen, E.; Strand, M.F.; Kalhovde, J.M.; Haugen, T. Reliability and Validity of Different Lower-Limb Strength Tests to Determine 1RM in the Keiser A300 Leg Press. Journal of Strength and Conditioning Research 2023, 37, 1963–8. [Google Scholar] [CrossRef]
- Sheppard, J.M.; Cormack, S.; Taylor, K.L.; McGuigan, M.R.; Newton, R.U. Assessing the Force-Velocity Characteristics of the Leg Extensors in Well-Trained Athletes: The Incremental Load Power Profile. Journal of Strength and Conditioning Research 2008, 22, 1320–6. [Google Scholar] [CrossRef]
- Lawton, T.W.; Cronin, J.B.; Lindsell, R.P. Effect of Interrepetition Rest Intervals on Weight Training Repetition Power Output. J Strength Cond Res. 2006, 20, 172. [Google Scholar]
- McMaster, D.T.; Gill, N.; Cronin, J.; McGuigan, M. A Brief Review of Strength and Ballistic Assessment Methodologies in Sport. Sports Med. 2014, 44, 603–23. [Google Scholar] [CrossRef]
- Nibali, M.L.; Chapman, D.W.; Robergs, R.A.; Drinkwater, E.J. Influence of Rest Interval Duration on Muscular Power Production in the Lower-Body Power Profile. Journal of Strength and Conditioning Research. oktober 2013, 27, 2723–9. [Google Scholar] [CrossRef]
- Grgic, J.; Schoenfeld, B.J.; Skrepnik, M.; Davies, T.B.; Mikulic, P. Effects of Rest Interval Duration in Resistance Training on Measures of Muscular Strength: A Systematic Review. Sports Med 2018, 48, 137–51. [Google Scholar] [CrossRef]
- Hernandez, D.J.; Healy, S.; Giacomini, M.L.; Kwon, Y.S. Effect of Rest Interval Duration on the Volume Completed During a High-Intensity Bench Press Exercise. Journal of Strength and Conditioning Research 2021, 35, 2981–7. [Google Scholar] [CrossRef] [PubMed]
- Weakley, J.; Pérez Castilla, A.; García Ramos, A.; Banyard, H.; Thurlow, F.; Edwards, T. Effect of Traditional, Rest Redistribution, and Velocity-Based Prescription on Repeated Sprint Training Performance and Responses in Semiprofessional Athletes. Journal of Strength & Conditioning Research 2023, 37, 1566–72. [Google Scholar]
- De Salles, B.F.; Simão, R.; Miranda, F.; Da Silva Novaes, J.; Lemos, A.; Willardson, J.M. Rest Interval between Sets in Strength Training. Sports Medicine 2009, 39, 765–77. [Google Scholar] [CrossRef]
- Drey, M.; Sieber, C.C.; Degens, H.; McPhee, J.; Korhonen, M.T.; Müller, K. Relation between muscle mass, motor units and type of training in master athletes. Clin Physio Funct Imaging 2016, 36, 70–6. [Google Scholar] [CrossRef]
- Meylan, C.M.P.; Cronin, J.B.; Oliver, J.L.; Hughes, M.M.G.; Jidovtseff, B.; Pinder, S. The reliability of isoinertial force–velocity–power profiling and maximal strength assessment in youth. Sports Biomechanics 2015, 14, 68–80. [Google Scholar] [CrossRef]
- Schoenfeld, B.; Snarr, R.L. National Strength & Conditioning Association. NSCA’s essentials of personal training, Third edition; Human Kinetics: Champaign, IL, 2021. [Google Scholar]
- Schoenfeld, B.J.; Pope, Z.K.; Benik, F.M.; Hester, G.M.; Sellers, J.; Nooner, J.L. Longer Interset Rest Periods Enhance Muscle Strength and Hypertrophy in Resistance-Trained Men. Journal of Strength and Conditioning Research 2016, 30, 1805–12. [Google Scholar] [CrossRef]
- Singer, A.; Wolf, M.; Generoso, L.; Arias, E.; Delcastillo, K.; Echevarria, E. Give it a rest: a systematic review with Bayesian meta-analysis on the effect of inter-set rest interval duration on muscle hypertrophy. Front Sports Act Living 2024, 6, 1429789. [Google Scholar] [CrossRef]
- Cohen, J. Statistical Power Analysis for the Behavioral Sciences, 2nd ed.; Taylor and Francis: Hoboken, 2013. [Google Scholar]
- Hopkins, W.G.; Hawley, J.A.; Burke, L.M. Design and analysis of research on sport performance enhancement. Medicine & Science in Sports & Exercise 1999, 31, 472–85. [Google Scholar]
- König, S.; Valeri, F.; Wild, S.; Rosemann, T.; Rüst, C.A.; Knechtle, B. Change of the age and performance of swimmers across World Championships and Olympic Games finals from 1992 to 2013 – a cross-sectional data analysis. SpringerPlus 2014, 3, 652. [Google Scholar] [CrossRef]
- Pyne, D.B.; Trewin, C.B.; Hopkins, W.G. Progression and variability of competitive performance of Olympic swimmers. Journal of Sports Sciences 2004, 22, 613–20. [Google Scholar] [CrossRef]
- Hopkins, W.G. Measures of Reliability in Sports Medicine and Science. Sports Medicine 2000, 30, 1–15. [Google Scholar] [CrossRef] [PubMed]
- Redden, J.; Stokes, K.; Williams, S. Establishing the Reliability and Limits of Meaningful Change of Lower Limb Strength and Power Measures during Seated Leg Press in Elite Soccer Players. 2018. [Google Scholar]
- González-Hernández, J.M.; Jimenez-Reyes, P.; Janicijevic, D.; Tufano, J.J.; Marquez, G.; Garcia-Ramos, A. Effect of different interset rest intervals on mean velocity during the squat and bench press exercises. Sports Biomechanics 2023, 22, 834–47. [Google Scholar] [CrossRef] [PubMed]
- Rodríguez-Rosell, D.; Pareja-Blanco, F.; Aagaard, P.; González-Badillo, J.J. Physiological and methodological aspects of rate of force development assessment in human skeletal muscle. Clin Physio Funct Imaging 2018, 38, 743–62. [Google Scholar] [CrossRef] [PubMed]
- Sale, D.G. Neural adaptation to resistance training. Medicine & Science in Sports & Exercise 1988, 20, S135–45. [Google Scholar]
- Perkins, D.; Wilson, G.V.; Kerr, J.H. The Effects of Elevated Arousal and Mood on Maximal Strength Performance in Athletes. Journal of Applied Sport Psychology 2001, 13, 239–59. [Google Scholar] [CrossRef]
Figure 1.
Individual test results for the Keiser 10-rep test for V0 (a), F0 (b), Pmax (c) and FVslope (d). “Short” refers to standard rest intervals as dictated by Keisers 10-rep test protocol (2-38 s), while “Long” represents consistent 3-minute rest intervals between each repetition.
Figure 1.
Individual test results for the Keiser 10-rep test for V0 (a), F0 (b), Pmax (c) and FVslope (d). “Short” refers to standard rest intervals as dictated by Keisers 10-rep test protocol (2-38 s), while “Long” represents consistent 3-minute rest intervals between each repetition.
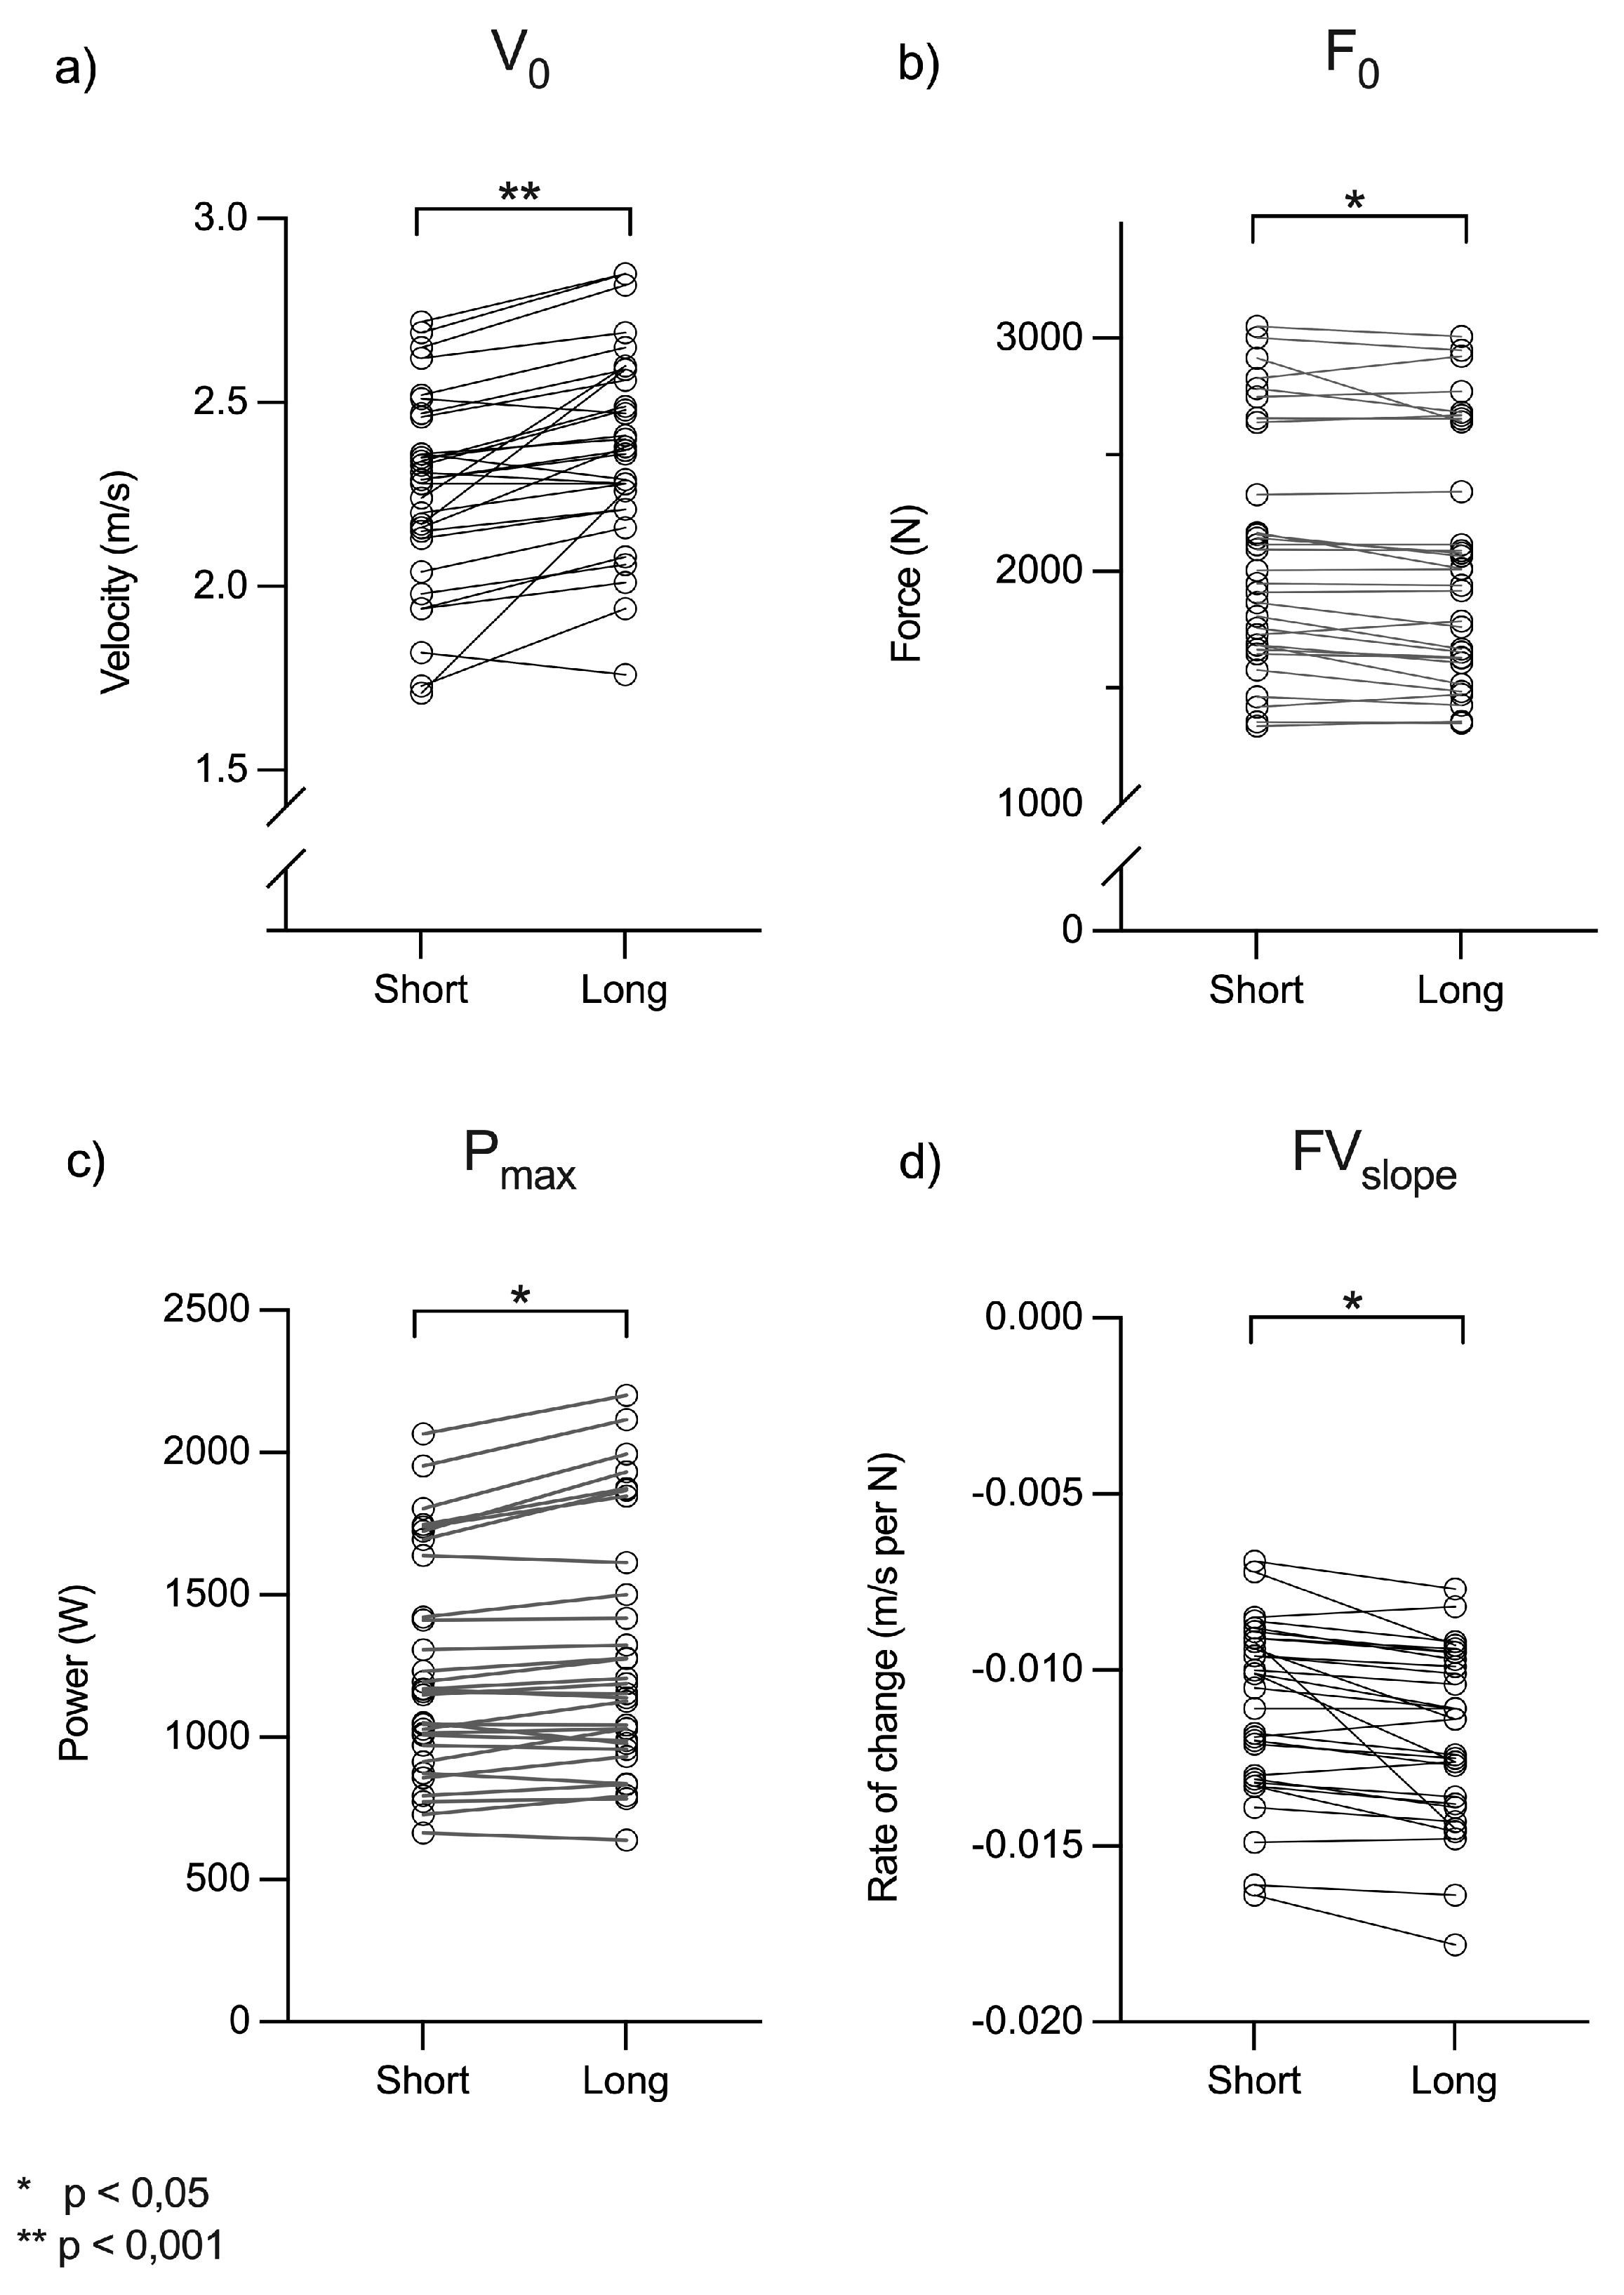
Figure 2.
Mean values for each repetition from light (1) to maximal (10) loads for velocity, force and power. Error bar: 95% CI.
Figure 2.
Mean values for each repetition from light (1) to maximal (10) loads for velocity, force and power. Error bar: 95% CI.
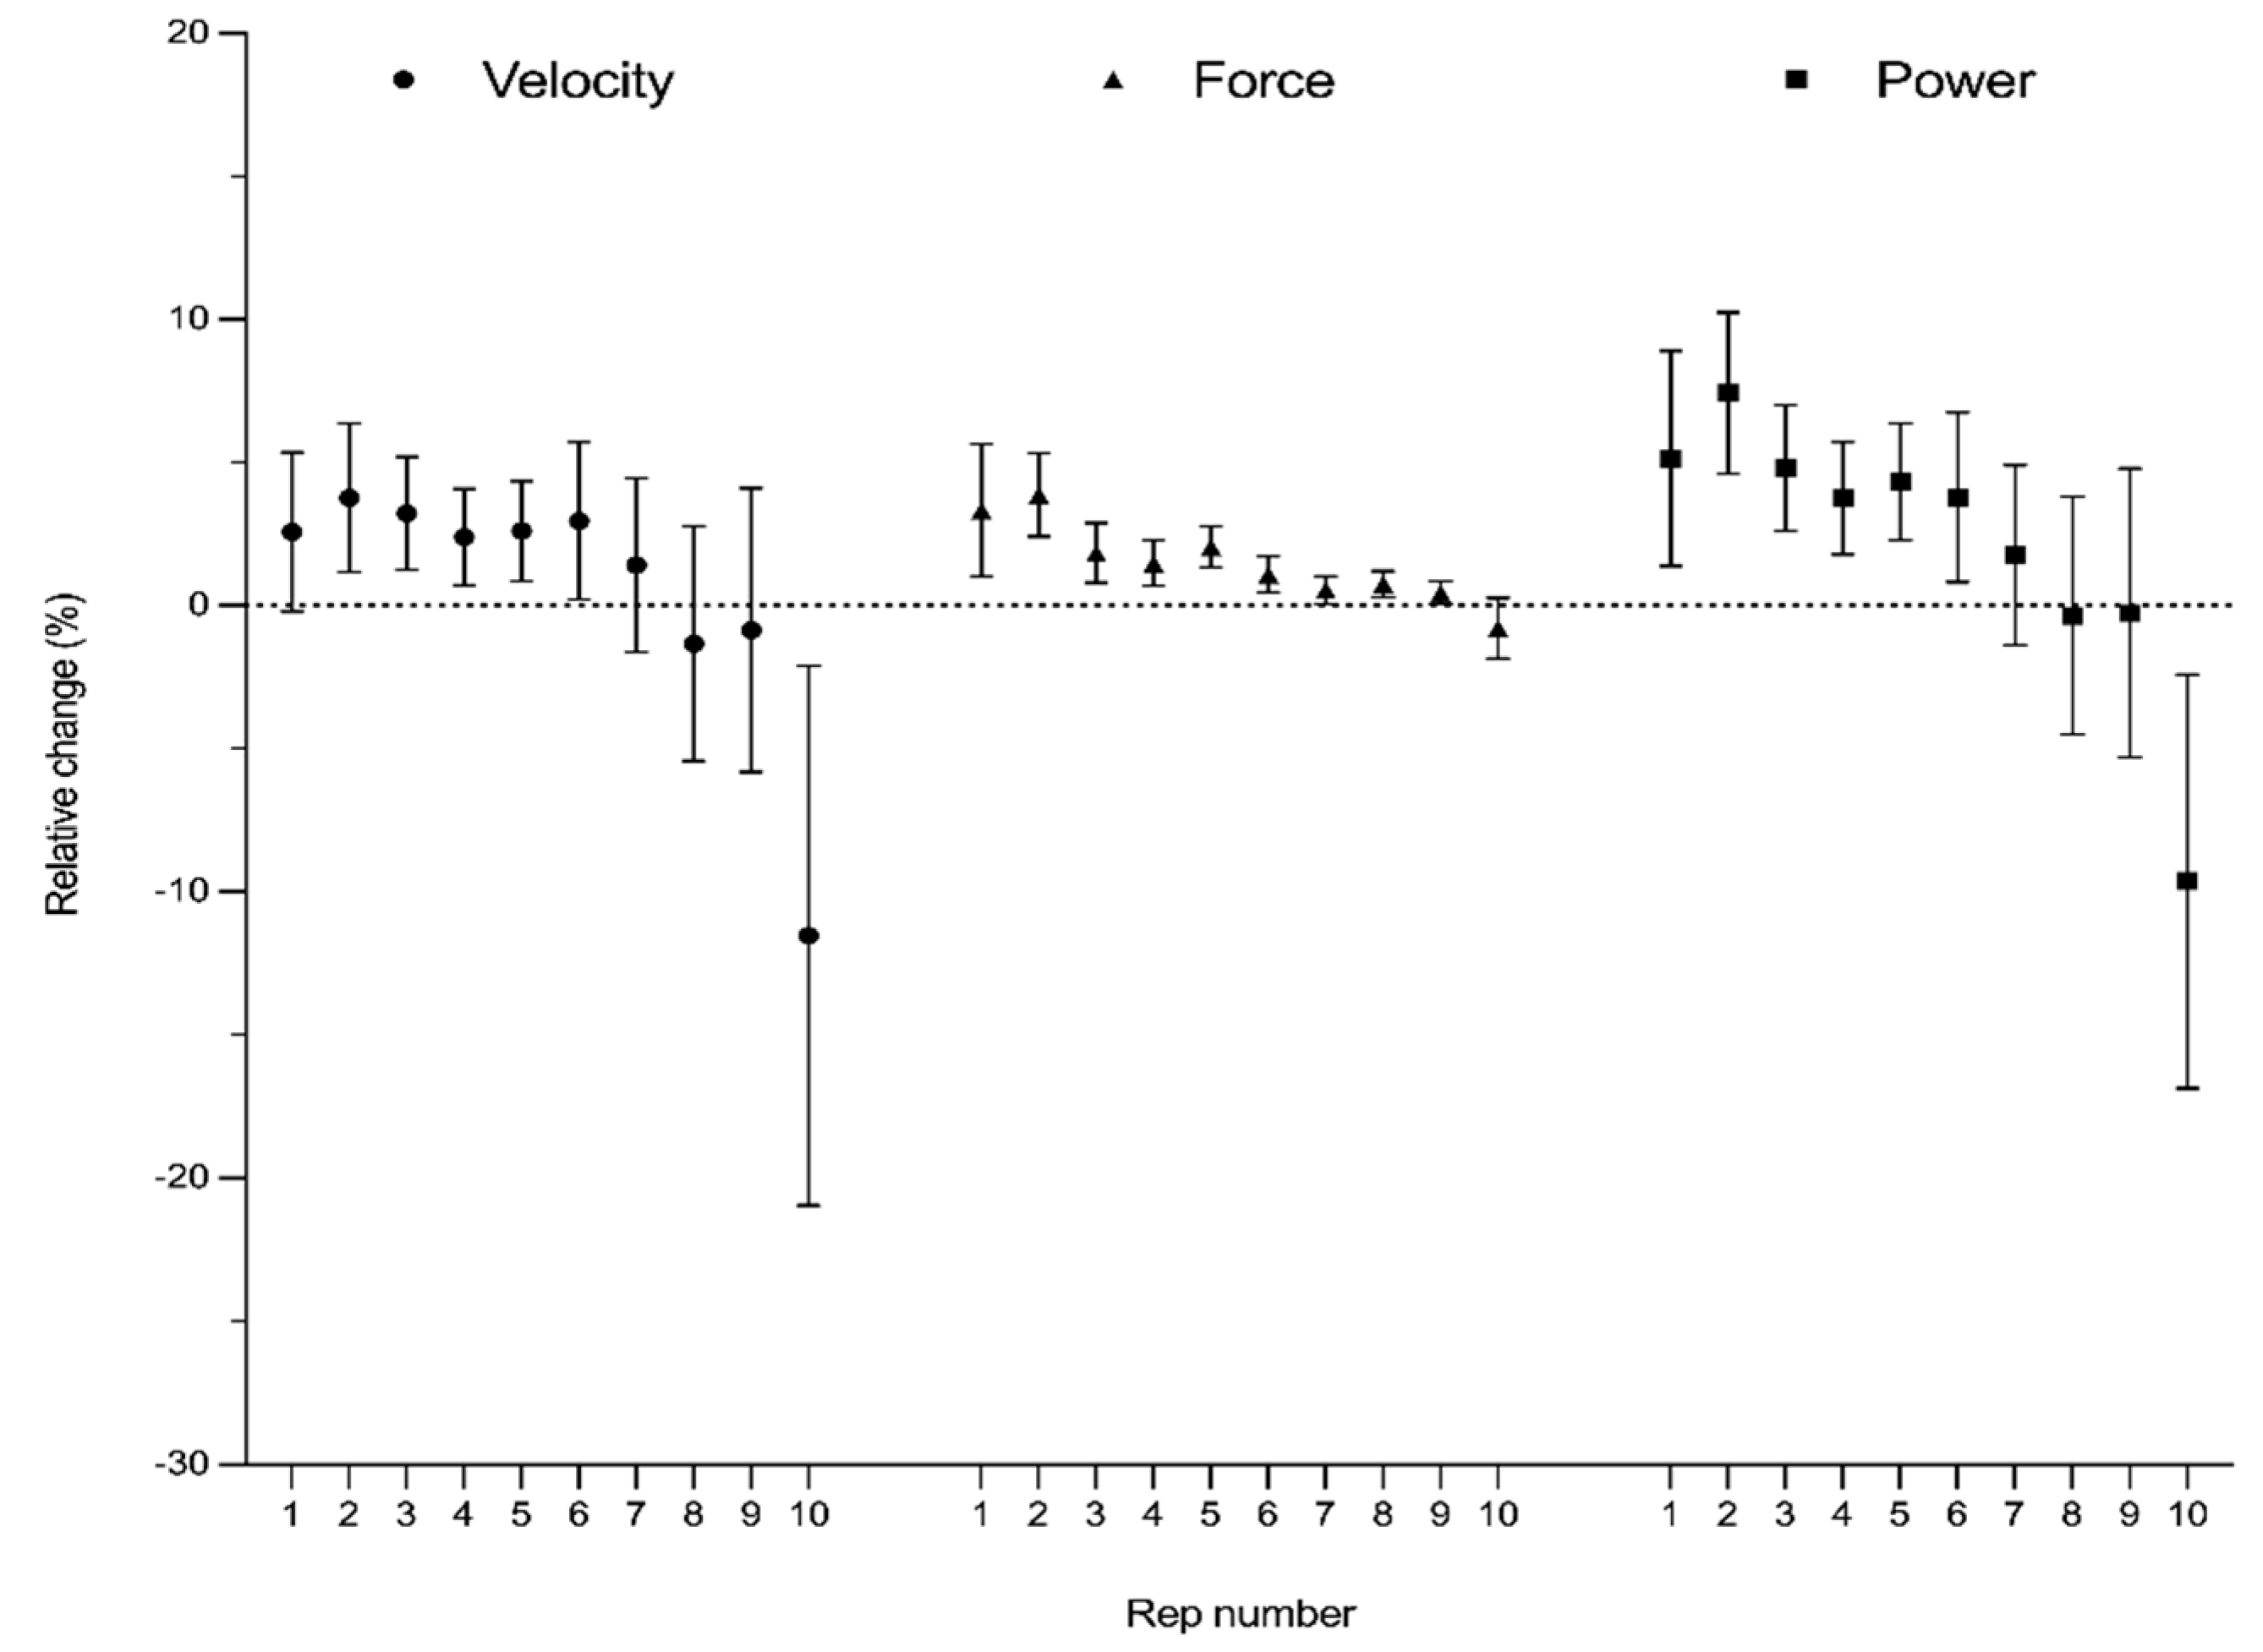

Table 1.
Baseline characteristics of the athletes in the study (n = 30).
| Variable | All athletes (n = 30) | Endurance athletes (n = 15) | Handball athletes (n = 15) | |||
| Sex (n) Age (years) |
F (16) 17.1 ± .8 |
M (14) 16.9 ± .9 |
F (8) 17.5 ± .8 |
M (7) 16.2 ± .4 |
F (8) 16.9 ± 0.8 |
M (7) 17.7 ± .5 |
| Height (cm) | 171.3 ± 4.7 | 185,3 ± 6.6 | 171.3 ± 5.5 | 180.6 ± 4.9 | 173.0 ± 11.3 | 189.9 ± 7.6 |
| Weight (kg) | 66.4 ± 8.1 | 71.9 ± 12.1 | 64.5 ± 10.3 | 71.9 ± 10.1 | 74.8 ± 12.7 | 86.8 ± 5.9 |
Table 2.
The content of the test days.
| Group | Test day 1 | Test day 2 | Test day 3 |
| 1 | 1RM + FV profiling (Short) | FV profiling (Short) | FV profiling (Long) |
| 2 | 1RM + FV profiling (Short) | FV profiling (Long) | FV profiling (Short) |
Table 3.
Rep-by-rep values for loads relative to 1RM and inter-repetition rest durations under the two test conditions: short (standard) and long (fixed 3 minutes).
Table 3.
Rep-by-rep values for loads relative to 1RM and inter-repetition rest durations under the two test conditions: short (standard) and long (fixed 3 minutes).
| Repetition: | 1 | 2 | 3 | 4 | 5 | 6 | 7 | 8 | 9 | 10 |
| % of 1RM | 15 | 27 | 35 | 45 | 54 | 63 | 72 | 82 | 91 | 100 |
| Short rest intervals (sec)* | 2 | 5 | 5 | 6 | 9 | 13 | 18 | 26 | 38 | |
| Long rest intervals (min)** | 3 | 3 | 3 | 3 | 3 | 3 | 3 | 3 | 3 |
* The total recovery time was 2:08 minutes using short rest intervals. ** The total recovery time was 27:00 minutes using long rest intervals.
Table 4.
Mean values and results from univariate analyses of all FV-metrics calculated using the Keiser 10-repetition test, with Bonferroni-corrected p-values, for standard short (2–38 seconds) and long (3-minute) inter-repetition rest intervals.
Table 4.
Mean values and results from univariate analyses of all FV-metrics calculated using the Keiser 10-repetition test, with Bonferroni-corrected p-values, for standard short (2–38 seconds) and long (3-minute) inter-repetition rest intervals.
| FV-variable | Mean value (±SD) | Mean difference (%) | Effect size (η²) | P-value | |
| Short | Long | ||||
| V0 (m/s2) | 2,26 (0,27) | 2,38 (0,27) | 5,7 | 0,344 | < 0,001 |
| F0 (N) | 2082,6 (523,7) | 2040,2 (523,0) | -2,1 | 0,208 | 0,010 |
| Pmax (W) | 1243,2 (389,6) | 1296,7 (440,3) | 3,7 | 0,253 | 0,005 |
| FVslope (N∙m/s) | -0,0111 (0,002) | -0,0119 (0,002) | 8,1 | 0,146 | 0,035 |
Disclaimer/Publisher’s Note: The statements, opinions and data contained in all publications are solely those of the individual author(s) and contributor(s) and not of MDPI and/or the editor(s). MDPI and/or the editor(s) disclaim responsibility for any injury to people or property resulting from any ideas, methods, instructions or products referred to in the content. |
© 2024 by the authors. Licensee MDPI, Basel, Switzerland. This article is an open access article distributed under the terms and conditions of the Creative Commons Attribution (CC BY) license (http://creativecommons.org/licenses/by/4.0/).
Copyright: This open access article is published under a Creative Commons CC BY 4.0 license, which permit the free download, distribution, and reuse, provided that the author and preprint are cited in any reuse.


