
Submitted:
12 December 2024
Posted:
13 December 2024
You are already at the latest version
Abstract
This study evaluated the concurrent validity of the Vitruve linear encoder compared to the T-Force device for measuring mean propulsive velocity (MPV) and peak velocity (PV) during the free-weight bench exercise. Twelve resistance-trained men participated in three sessions, during which MPV and PV were recorded sim-ultaneously by both devices. The data were analyzed using one-way ANOVA, Pearson's correlation, Bland-Altman analysis, and effect size calculations, with statistical significance set at p ≤ 0.05. The results showed discrepancies between the Vitruve and T-Force devices across different intensity levels. Specifically, the Vitruve device generally reported higher MPV and lower PV values, particularly at moderate and low in-tensities. Vitruve was deemed useful for MPV measurements, especially at velocities below 0.65 m/s during free-weight bench press exercises. In conclusion, the Vitruve device overestimated MPV and underestimated PV at moderate and low loads (> 0.65 m·s⁻¹), with the discrepancies increasing as velocity rose. It can provide valuable data for monitoring and assessing resistance training programs focused on MPV at heavier loads (< 0.65 m·s⁻¹). Researchers and practitioners should take these findings into account when incorporating the Vi-truve into velocity-based strength training protocols.
Keywords:
strength training
; instrumentation
; mean propulsive velocity
; peak velocity
1. Introduction
Velocity-based training is currently the most accurate method to assess, monitor, and prescribe resistance training [1]. This method involves measuring the linear velocity throughout the concentric phase of a movement with different aims. For instance, measuring means propulsive velocity (MPV) and peak velocity (PV) may be useful for estimating fatigue over series [2,3,4]. Additionally, MPV can offer valuable insights for athletes in training programs [1,5]. However, identifying a reliable device capable of accurately measuring it is essential to fully leverage this information.
Numerous studies have investigated the reliability and validity of commercial transducers across various exercises and movement executions [6,7]. In this sense, the T-force has been widely used and raised as one of the gold standards due to its validity and excellent reliability [8,9,10,11]. Other encoders, such as Speed4Lift (now Vitruve), have been the focus of conflicting conclusions regarding their validity and reliability [6,7,12,13]. However, the device has demonstrated good reliability at higher loads, suggesting its potential utility for 1RM estimation [13]. However, its use has been accepted under certain conditions despite limited supporting evidence [14]. Similarly to many other devices, Vitruve and Speed4Lift have primarily been evaluated within a narrow velocity range (0.17–0.8 m·s⁻¹) commonly used for strength assessment [8,15]. In contrast, their accuracy at moderate and low loads (≥1 m·s⁻¹), which are frequently utilized for training at near-optimal loads [16], remains to be confirmed.
A previous study found the Vitruve device reliable for 20–90% of 1RM (CV < 8.8%) but invalid for estimating 1RM, regardless of the prediction model used [15]. Another recent study [16] investigated the validity and agreement between the Vitruve and T-Force transducers during squat and bench press exercises. The results showed that the Vitruve is valid and accurate only at velocities below 0.75 m·s⁻¹ and 0.45 m·s⁻¹, respectively. Furthermore, MPV measurements were more reliable than PV, suggesting that the Vitruve might not be suitable for precisely monitoring resistance training or assessing strength performance across the entire load-velocity curve. The first study mentioned was carried out during the free-weight back squat exercise [15], whereas the second study used a Smith machine for both back squat and bench press exercises [16].
Therefore, the main purpose of the present study was to evaluate the validity of Vitruve in wide range of velocities during the free weight bench press exercise. Specifically, the results of MPV and PV at high velocities (> 1 m/s) during the propulsive phase of this exercise was compared to those obtained from the T-Force device, which was considered the “gold standard”.
2. Materials and Methods
2.1. Participants
Twelve healthy resistance-trained men participated in the present study (23.4 ± 1.9 years, 1.81 ± 0.07 m, 78.8 ± 6.8 kg, and 3.7 ± 1.1 years of experience in weightlifting). Pre-tenders were excluded if they had suffered a muscle-skeletal impairment or injury in the last two months. This study was approved by the University research ethics committee, and all subjects read and signed an informed consent document before participating.
2.2. Procedures
Participants attended three times at weightlifting room properly equipped at the University. After standardised warm-up, which consisted of five minutes of aerobic exercise (skipping rope), joint mobility and three progressive series of ten repetitions on triceps extension, band pull apart, and plyometric push up, one-repetition maximum test on bench press exercise was performed. In order to provide ecological validity to this study, the three attendances happened over a training program. In each measurement, the mean propulsive velocity (MPV) and peak velocity (PV) were simultaneously recorded by two linear encoders (Vitruve and T-Force) in each repetition. An increment of the load was carried out according to the MPV of execution. Afterwards, each attempt was categorized as high (≤0.65 m· s-1), moderate (<0.99 m· s-1) or low (≥1 m·s-1) intensity for subsequent analysis [17]. That is why we provide up to 160, 62, and 65 recording on low, moderate, and high intensity, respectively.
2.3. Bench Press One repetition Maximum Test (1RM)
Participants were asked to lie down on a flat bench and to keep their head, shoulder, buttock, and feet in touch with the surface during press execution (Figure 1). They had to flex their elbows and extend their shoulder until the bar touches their chest at 3 cm above the sternal xiphoid and make a pause of 2 seconds. After the pause, they should execute the press as fast as possible.
It used a protocol, previously described by González-Badillo et al [18], to assess the one-repetition maximum in the bench press. The initial load was established at 20 kg and every increment of the load was 10 kg until the attained MPV was <0.5 m·s-1. Then, the load was increased from 2.5 to 5 kg. The recoveries were three minutes for a low and medium loads and five minutes for heavy loads. Moreover, according to original protocol [18], participants were required to perform three repetitions in loads which can be able to move higher 1 m·s-1, two repetition in load between 0.99 - 0.66 m·s-1, and just one repetition in load moved lower than 0.65 m·s-1. The fastest repetition in each attempt was used for the analysis.
2.4. Instruments
The two encoders (Vitruve and T-Force) were arranged in parallel on the same side of the bar to avoid misalignments in between (Figure 1).
Vitruve is a linear encoder built with a nylon rope of 2 m of length and 3 mm of thickness whose weight is 365 g. The encoder has six magnets in the base to ensure a fix during execution lift. It allows measuring the linear distance of movement, mean and maximal propulsive velocity and power values with a sample rate of 100 Hz. According to the manufacturer, it has a range measuring between 0.04 to 6 m·s-1. The data recorded by the Vitruve were sent to an Android phone (Xiaomi Redmi 5 Plus) through a Wi-Fi connection and analysed by a specific software (Speed4Lifts App, v. 1.41).
T-Force is a linear encoder built with a steelware of 2 m in length and 0.45 mm in diameter, which can resist 5.3 N of tension. This device records a maximal velocity of 10 m·s-1 and maximal acceleration of 16 G’s (157 m·s-2). It has a sample rate of 1 kHz and an interface of conversions A/D of 14 bits of resolution. According to the manufacturer has an absolute error of ±1 mm and a relative error of less than 0.25%. Several authors have previously used this linear encoder and compared it with other devices [8,9,10]. Currently, it has been considered a gold standard device [11]. The data recorded by the T-Force system were sent to a laptop (Lenovo B50-50 running Windows 10), where they were analysed using specific software (T-Force, v.3.70)
2.5. Statistical Analysis
Data analysis was performed through a one-way ANOVA to discern differences between encoders in three categorical intensities according to MPV and the interaction were submitted to the post hoc Bonferroni test. When differences were identified below analyses were performed. (i) The relationship of measurements between devices was analysed with Pearson’s correlation. The criteria to interpret the strength of the r coefficients were as follows: trivial (<.1), small (<.3), moderate (<.5), high (<.7), very high (<.9), or practically perfect (≥.9) [20]. (ii) Bland-Altman [20] analysis was performed to evaluate the concurrent encoder’s validity concerning T-Force. (iii) The magnitude of differences was calculated using Hedges’g between different devices. The g values were interpreted as trivial (g < 0.2), small (g < 0.5), moderate (g < 0.8) and large (g ≥ 0.8). Significance was set up at p< .05.
3. Results
Both MPV and PV were analysed. While very high correlations were observed between T-Force and Vitruve, interaction effects were found across all intensity levels. This indicates that the two devices provided differing values for the same measurements.
3.1. Mean Propulsive Velocity
MPV data from T-Force and Vitruve measurements showed an almost perfect correlation (Low: r = .96, p < .05; Moderate: r = .95, p < .05; High: r = .99, p < .05) (Figure 2). A Bland-Altman analysis was conducted to examine the differences between the two devices. The results indicate that Vitruve measures, on average, between 0.003 and 0.110 m·s⁻¹ higher than T-Force. This difference revealed a significant systematic negative bias, particularly at moderate (Figure 2e) and low intensities (Figure 2h). Additionally, the relative error showed increased variability in the differences as the mean propulsive velocity rose (Figure 2c,f,i).
3.2. Peak Velocity
PV data analysis (ANOVA) showed interaction effects at moderate and low loads, indicating disagreement between T-Force and Vitruve in several measurements. Despite this, the correlation between the devices showed high values, suggesting an almost perfect relationship (Low: r = .98, p < .05; Moderate: r = .99, p < .05; High: r = .99, p < .05) (Figure 3). A Bland-Altman analysis identified differences between the devices, with Vitruve measuring 0.009 to 0.079 m·s⁻¹ less than T-Force at moderate and low intensities. Furthermore, the differences revealed a significant bias at moderate (Figure 3e) and low (Figure 3h) intensities, with a tendency for the bias to increase as velocity rises.
3.3. Magnitude of Change
The analysis of the magnitude of the differences between the two devices showed small to moderate effect size in MPV at moderate and low intensities (Loads), and small effect size in PV at low intensity. Additionally, the differences showed a wide confidence interval for both MPV and PV (~ 0.7 m/s), mainly at moderate and low Loads (Table 1).
4. Discussion
This study aimed to evaluate the validity of the Vitruve device (formerly Speed4lift) compared to the T-Force transducer in measuring MPV and PV variables. Previous research has assessed the validity of various devices, including the Vitruve encoder, which demonstrated high reliability for loads between 40% and 85% of 1RM [7,8,15]. However, only one recent study has examined training loads above 1 m·s⁻¹ measured with the Vitruve device, and it was conducted using a Smith machine rather than during free-weight exercises [16]. In the present study, the bench press free-weight movement was analyzed, with the load classified based on mean propulsive velocity, which is considered a potentially more practical approach for training [18]. Consequently, this study offers a deeper understanding of the capabilities of the latest Vitruve device for training and performance assessment.
The main finding of this study was that Vitruve overestimates MPV (Figure 2) while understimating PV (Figure 3), mainly at moderate and low loads (at medium and high velocities, respectively). These differences could be due to: (i) The T-Force device had a sampling rate of 1000 Hz while the Vitruve device operated at 100 Hz. This may have caused the detection of the start and end of the concentric phase to be imprecise in the Vitruve device when determining MPV [16]. It is also possible that the final phase of the movement, which becomes more critical as the bench press velocity increases, was not properly recorded by this device. On the other hand, failing to properly filter the signal and relying on raw data could explain the observed differences in PV [16]. (ii) The T-Force device uses a transductor of steel wire while the Vitruve uses a nylon rope, which could be more influenced by friction and heat [21]. This could also explain why Vitruve recorded lower PV and higher MPV compared to T-Force. Over repetitions, the nylon's elasticity might stretch the rope, reducing rotor torque and lowering PV. Meanwhile, MPV could increase due to the material's restitution and higher torque during recording.
In the present study, the training load was analysed according to MPV instead of absolute mass or percentage of 1RM, as previous studies did [8,11,15]. Therefore, the practical application might be more transferable to real training, where the users obtain PV or MPV directly from the display of these devices. The MPV has been advocated as a benchmark for determining and monitoring the velocity-based strength training [5,16], for the reasons mentioned in the previous paragraph.
Nonetheless, Vitruve may still be a useful tool for monitoring MPV at heavier loads (i.e., slower velocities). These findings (Figure 2) align with those of Kilgallon et al. [15], suggesting that Vitruve is likely valid only at higher intensities (≤0.65 m·s⁻¹ for MPV). Similarly, the results are consistent with Callaghan’s study [13], which identified the same limitation in Vitruve when used with lighter loads during free-weight exercises like the bench press. Finally, a recent study considers that this device is valid only at MPV <0.45 m·s⁻¹ when measuring the bench press on a Smith machine (~80% of 1RM) [16]. All the abovementioned studies showed difficulties for measuring MPV with the Vitruve device during the bench press exercise at moderate and low loads (i.e., medium and high velocities, respectively). Furthermore, the Table 1 shows that the confidence interval for the differences is significantly wider at moderate and low loads. Therefore, the use of this device under these conditions is not recommended.
The main limitations of the present study were: (i) The number of repetitions analysed at low, moderate and high intensities were not uniform (i.e., 160, 62, and 65, respectively), because the study design was performed over an ecological environment of training, and the protocol of 1RM estimation [18] required more repetitions at low intensity. (ii) Related to the previous point, the reliability of the two devices was not measured, because only one repetition at high intensity was available. However, to measure this characteristic was not a purpose of the present study, because previous studies did it [8,13,15,16]. (iii) The fact of using several measurements from a given participant could cause autocorrelation which overestimates regression statistics [22]. Nonetheless, the analysis of correlations has not been the focus of this study.
5. Conclusions
The Vitruve device overestimated MPV and underestimated PV during the free-weight bench press exercise at moderate and low loads (> 0.65 m·s⁻¹), with these discrepancies becoming more pronounced as the load decreased (i.e., as the velocity increased). These differences were likely caused by the device's low sampling rate (100 Hz), the processing of the velocity signal (i.e., data analysis), and the components linking to the transducer (e.g., nylon rope). However, it may be a useful tool for monitoring MPV at heavier loads (< 0.65 m·s⁻¹). Researchers and practitioners should take these findings into account when incorporating the Vitruve into velocity-based training strength protocols.
Author Contributions
Conceptualization, A. J.-Á. and J. G.-L.; methodology, A. J.-Á. and J. G.-L.; software, A. J.-Á. and J. G.-L.; validation, A. G.-V. and R. S.; formal analysis, A. G.-V.; investigation, A. J.-Á.; resources, J. G.-L.; data curation, A. J.-Á. and A. G.-V.; writing—original draft preparation, A. G.-V.; writing—review and editing, R. S. and J. G-L.; visualization, A. G.-V.; supervision, J. G.-L.; project administration, J. G.-L. All authors have read and agreed to the published version of the manuscript.
Funding
This research received no external funding.
Institutional Review Board Statement
The study was conducted in accordance with the Declaration of Helsinki, and approved by the Ethics Committee of Universidad de León (ETICA-ULE-026-2022)
Informed Consent Statement
Informed consent was obtained from all subjects involved in the study
Data Availability Statement
The raw data supporting the conclusions of this article will be made available by the authors on request.
Acknowledgments
The authors would like to thank the participants for their voluntary contribution to this study.
Conflicts of Interest
The authors declare no conflicts of interest.
References
- Weakley, J.; Mann, B.; Banyard, H.; McLaren, S.; Scott, T.; Garcia-Ramos, A. Velocity-Based Training: From Theory to Application. Strength and Conditioning Journal 2021, 43, 31–49. [Google Scholar] [CrossRef]
- Sánchez-Medina, L.; González-Badillo, J.J. Velocity Loss as an Indicator of Neuromuscular Fatigue during Resistance Training. Medicine and science in sports and exercise 2011, 43, 1725–1734. [Google Scholar] [CrossRef] [PubMed]
- Weakley, J.; McLaren, S.; Ramirez-Lopez, C.; García-Ramos, A.; Dalton-Barron, N.; Banyard, H.; Mann, B.; Weaving, D.; Jones, B. Application of Velocity Loss Thresholds during Free-Weight Resistance Training: Responses and Reproducibility of Perceptual, Metabolic, and Neuromuscular Outcomes. 2019, 38, 477–485. [Google Scholar] [CrossRef] [PubMed]
- Sánchez-Medina, L.; González-Badillo, J.J.; Pérez, C.E.; Pallarés, J.G. Velocity- and Power-Load Relationships of the Bench Pull VsBench Press Exercises. International Journal of Sports Medicine 2014, 35, 209–216. [Google Scholar] [CrossRef]
- Sanchez-Medina, L.; Perez, C.E.; Gonzalez-Badillo, J.J. Importance of the Propulsive Phase in Strength Assessment. International Journal of Sports Medicine 2010, 31, 123–129. [Google Scholar] [CrossRef] [PubMed]
- Pérez-Castilla, A.; Piepoli, A.; Garrido-Blanca, G.; Delgado-García, G.; Balsalobre-Fernández, C.; García-Ramos, A. Precision of 7 Commercially Available Devices for Predicting Bench-Press 1-Repetition Maximum from the Individual Load–Velocity Relationship. International Journal of Sports Physiology and Performance 2019, 14, 1442–1446. [Google Scholar] [CrossRef] [PubMed]
- Held, S.; Rappelt, L.; Deutsch, J.P.; Donath, L. Valid and Reliable Barbell Velocity Estimation Using an Inertial Measurement Unit. International Journal of Environmental Research and Public Health 2021, 18, 9170. [Google Scholar] [CrossRef] [PubMed]
- Pérez-Castilla, A.; Piepoli, A.; Delgado-García, G.; Garrido-Blanca, G.; García-Ramos, A. Reliability and Concurrent Validity of Seven Commercially Available Devices for the Assessment of Movement Velocity at Different Intensities during the Bench Press. Journal of Strength and Conditioning Research 2019, 33, 1258–1265. [Google Scholar] [CrossRef] [PubMed]
- Garnacho-Castaño, M. V.; López-Lastra, S.; Maté-Muñoz, J.L. Reliability and Validity Assessment of a Linear Position Transducer. Journal of Sports Science and Medicine 2014, 14, 128–136. [Google Scholar]
- Lorenzetti, S.; Lamparter, T.; Lüthy, F. Validity and Reliability of Simple Measurement Device to Assess the Velocity of the Barbell during Squats. BMC research notes 2017, 10, 707. [Google Scholar] [CrossRef] [PubMed]
- Janicijevic, D.; García-Ramos, A.; Lamas-Cepero, J.L.; García-Pinillos, F.; Marcos-Blanco, A.; Rojas, F.J.; Weakley, J.; Pérez-Castilla, A. Comparison of the Two Most Commonly Used Gold-Standard Velocity Monitoring Devices (GymAware and T-Force) to Assess Lifting Velocity during the Free-Weight Barbell Back Squat Exercise. Proceedings of the Institution of Mechanical Engineers, Part P: Journal of Sports Engineering and Technology 2021, 17543371211029614. [Google Scholar] [CrossRef]
- Martínez-Cava, A.; Hernández-Belmonte, A.; Courel-Ibáñez, J.; Morán-Navarro, R.; González-Badillo, J.J.; Pallarés, J.G. Reliability of Technologies to Measure the Barbell Velocity: Implications for Monitoring Resistance Training. PloS one 2020, 15, e0232465. [Google Scholar]
- Callaghan, D.E.; Guy, J.H.; Elsworthy, N.; Kean, C. Validity of the PUSH Band 2. 0 and Speed4lifts to Measure Velocity during Upper and Lower Body Free-Weight Resistance Exercises. Journal of Sports Sciences 2022, 40, 968–975. [Google Scholar] [CrossRef]
- Courel-Ibáñez, J.; Buendía-Romero, Á.; Pallarés, J.G.; García-Conesa, S.; Martínez-Cava, A.; Izquierdo, M. Impact of Tailored Multicomponent Exercise for Preventing Weakness and Falls on Nursing Home Residents’ Functional Capacity. Journal of the American Medical Directors Association 2022, 23, 98–104.e3. [Google Scholar] [CrossRef] [PubMed]
- Kilgallon, J.; Cushion, E.; Joffe, S.; Tallent, J. Reliability and Validity of Velocity Measures and Regression Methods to Predict Maximal Strength Ability in the Back-Squat Using a Novel Linear Position Transducer. Proceedings of the Institution of Mechanical Engineers, Part P: Journal of Sports Engineering and Technology 2022. [Google Scholar] [CrossRef]
- González-Galán, J.; Herrera-Bermudo, J.C.; González-Badillo, J.J.; Rodríguez-Rosell, D. Validity and Concordance of a Linear Position Transducer (Vitruve) for Measuring Movement Velocity during Resistance Training. Sensors 2024, 24, 6444. [Google Scholar] [CrossRef] [PubMed]
- Loturco, I.; Nakamura, F.Y.; Tricoli, V.; Kobal, R.; Abad, C.C.C.; Kitamura, K.; Ugrinowitsch, C.; Gil, S.; Pereira, L.A.; González-Badillo, J.J. Determining the Optimum Power Load in Jump Squat Using the Mean Propulsive Velocity. PLoS ONE 2015, 10, e0140102. [Google Scholar] [CrossRef] [PubMed]
- González-Badillo, J.J.; Rodríguez-Rosell, D.; Sánchez-Medina, L.; Gorostiaga, E.M.; Pareja-Blanco, F. Maximal Intended Velocity Training Induces Greater Gains in Bench Press Performance than Deliberately Slower Half-Velocity Training. European Journal of Sport Science 2014, 14, 772–781. [Google Scholar] [CrossRef]
- Hopkins, W.G.; Marshall, S.W.; Batterham, A.M.; Hanin, J. Progressive Statistics for Studies in Sports Medicine and Exercise Science. Med Sci Sports Exerc 2009, 41, 3–12. [Google Scholar] [CrossRef]
- Martin Bland, J.; Altman, D.G. Statistical Methods for Assessing Agreement Between Two Methods of Clinical Measurement. The Lancet 1986, 327, 307–310. [Google Scholar] [CrossRef]
- Kumar, K.; Goyal, D.; Banwait, S.S. Effect of Key Parameters on Fretting Behaviour of Wire Rope: A Review. Archives of Computational Methods in Engineering 2020, 27, 549–561. [Google Scholar] [CrossRef]
- Bland, J.M.; Altman, D.G. Statistics Notes: Correlation, Regression, and Repeated Data. BMJ 1994, 308, 896. [Google Scholar] [CrossRef] [PubMed]
Figure 1.
Location of the two encoders to measure the bar velocity during the bench press exercise.
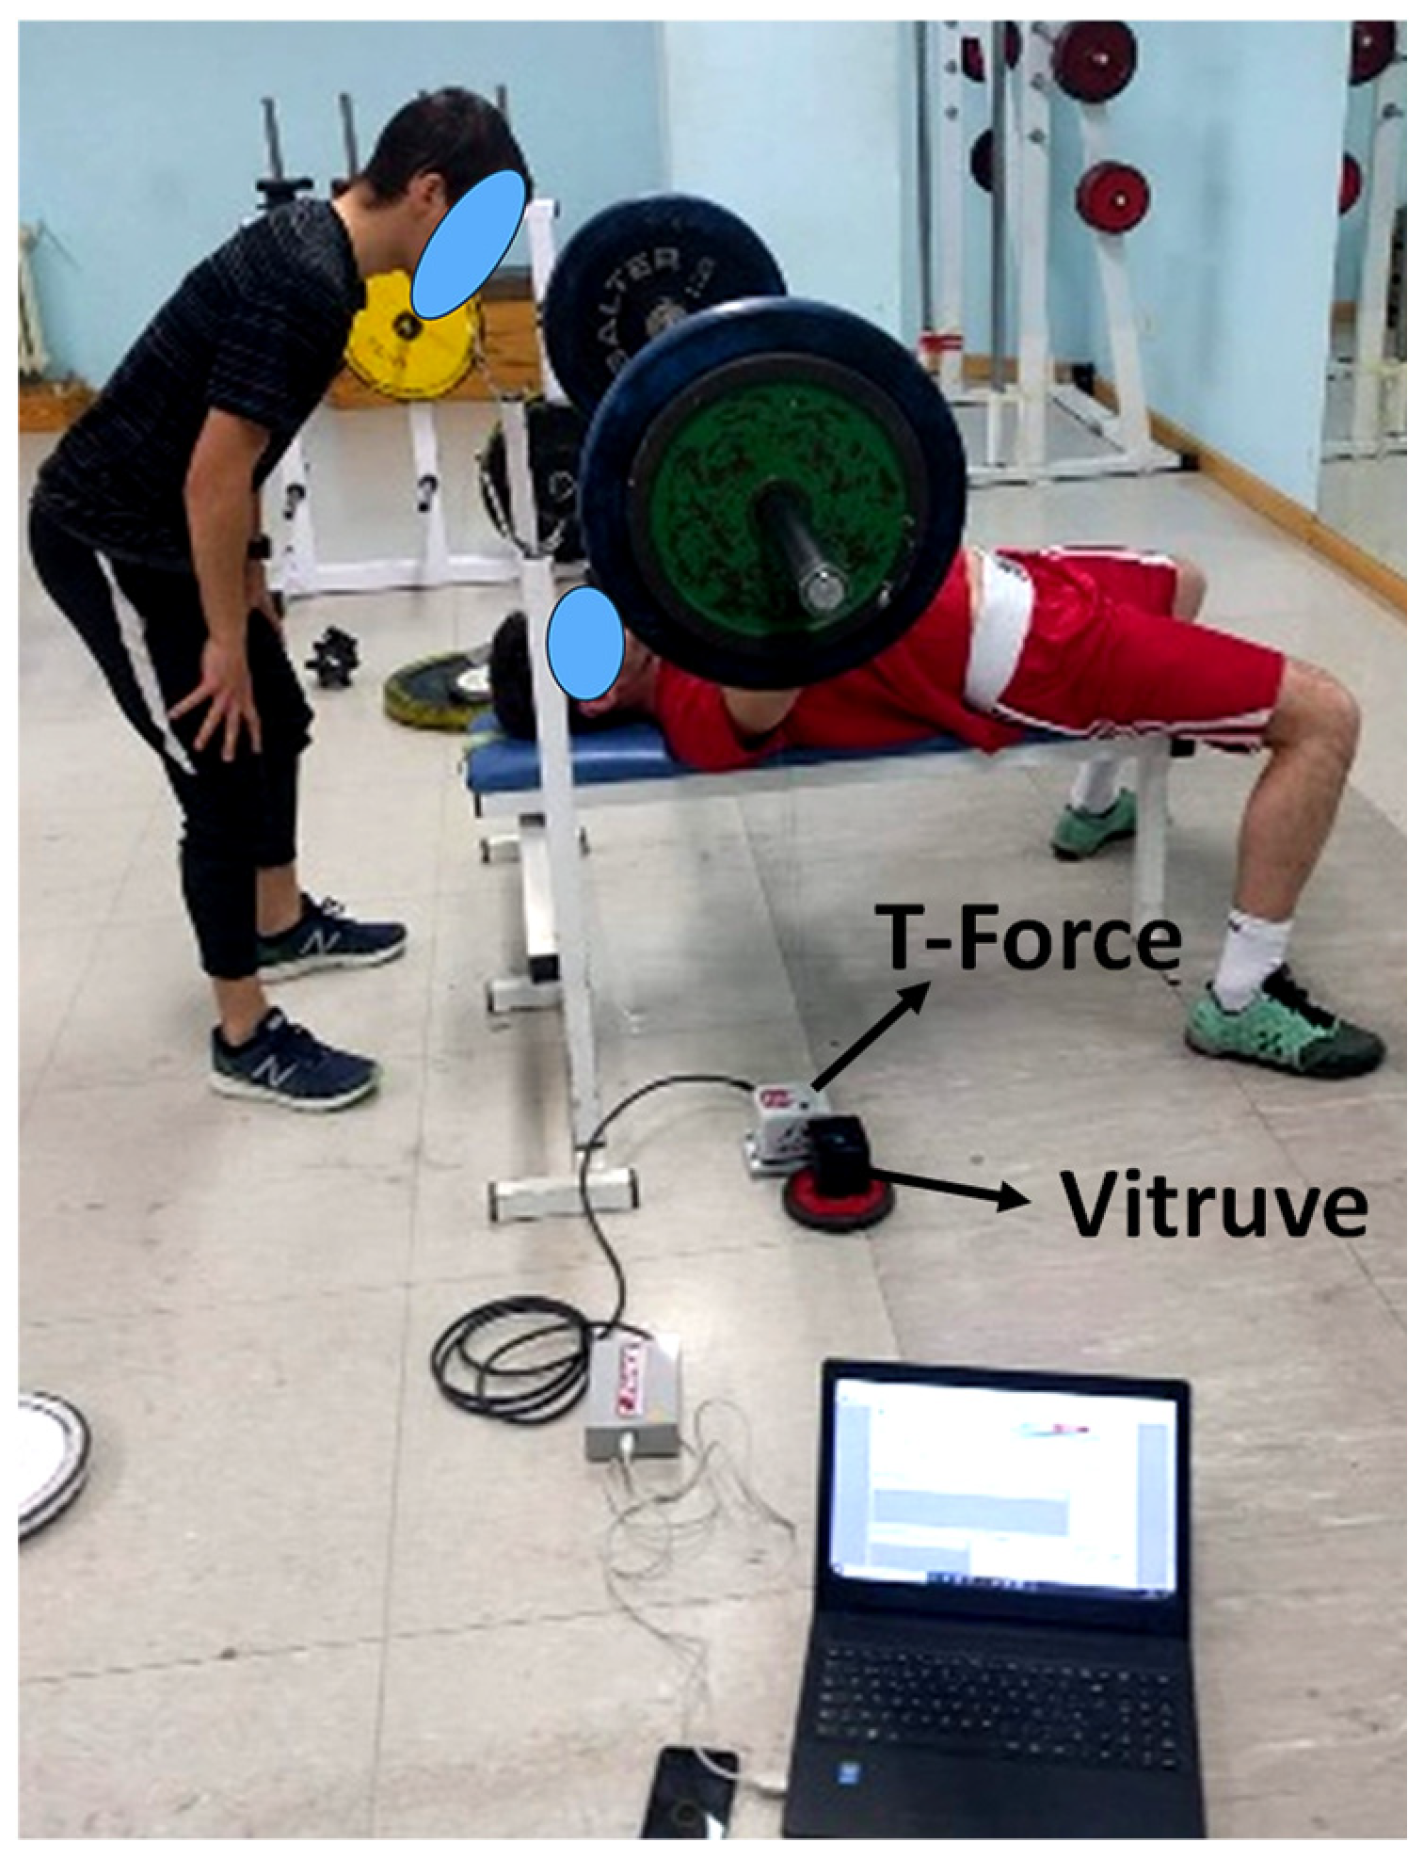
Figure 2.
Bland Altman analysis for mean propulsive velocity (MPV). High (A, B, and C), moderate (D, E, and F), and low (G, H, and I) intensities are presented, left to right, the regression line between hypothetical measurements done T-Force (TF) and Vitruve (Vi); Plot of difference between T-Force (TF) and Vitruve (Vi)vs. mean of two measurements; and, Plot of differences between T-Force (TF) and Vitruve (Vi), expressed as percentages of average vs. the mean of two measurements.
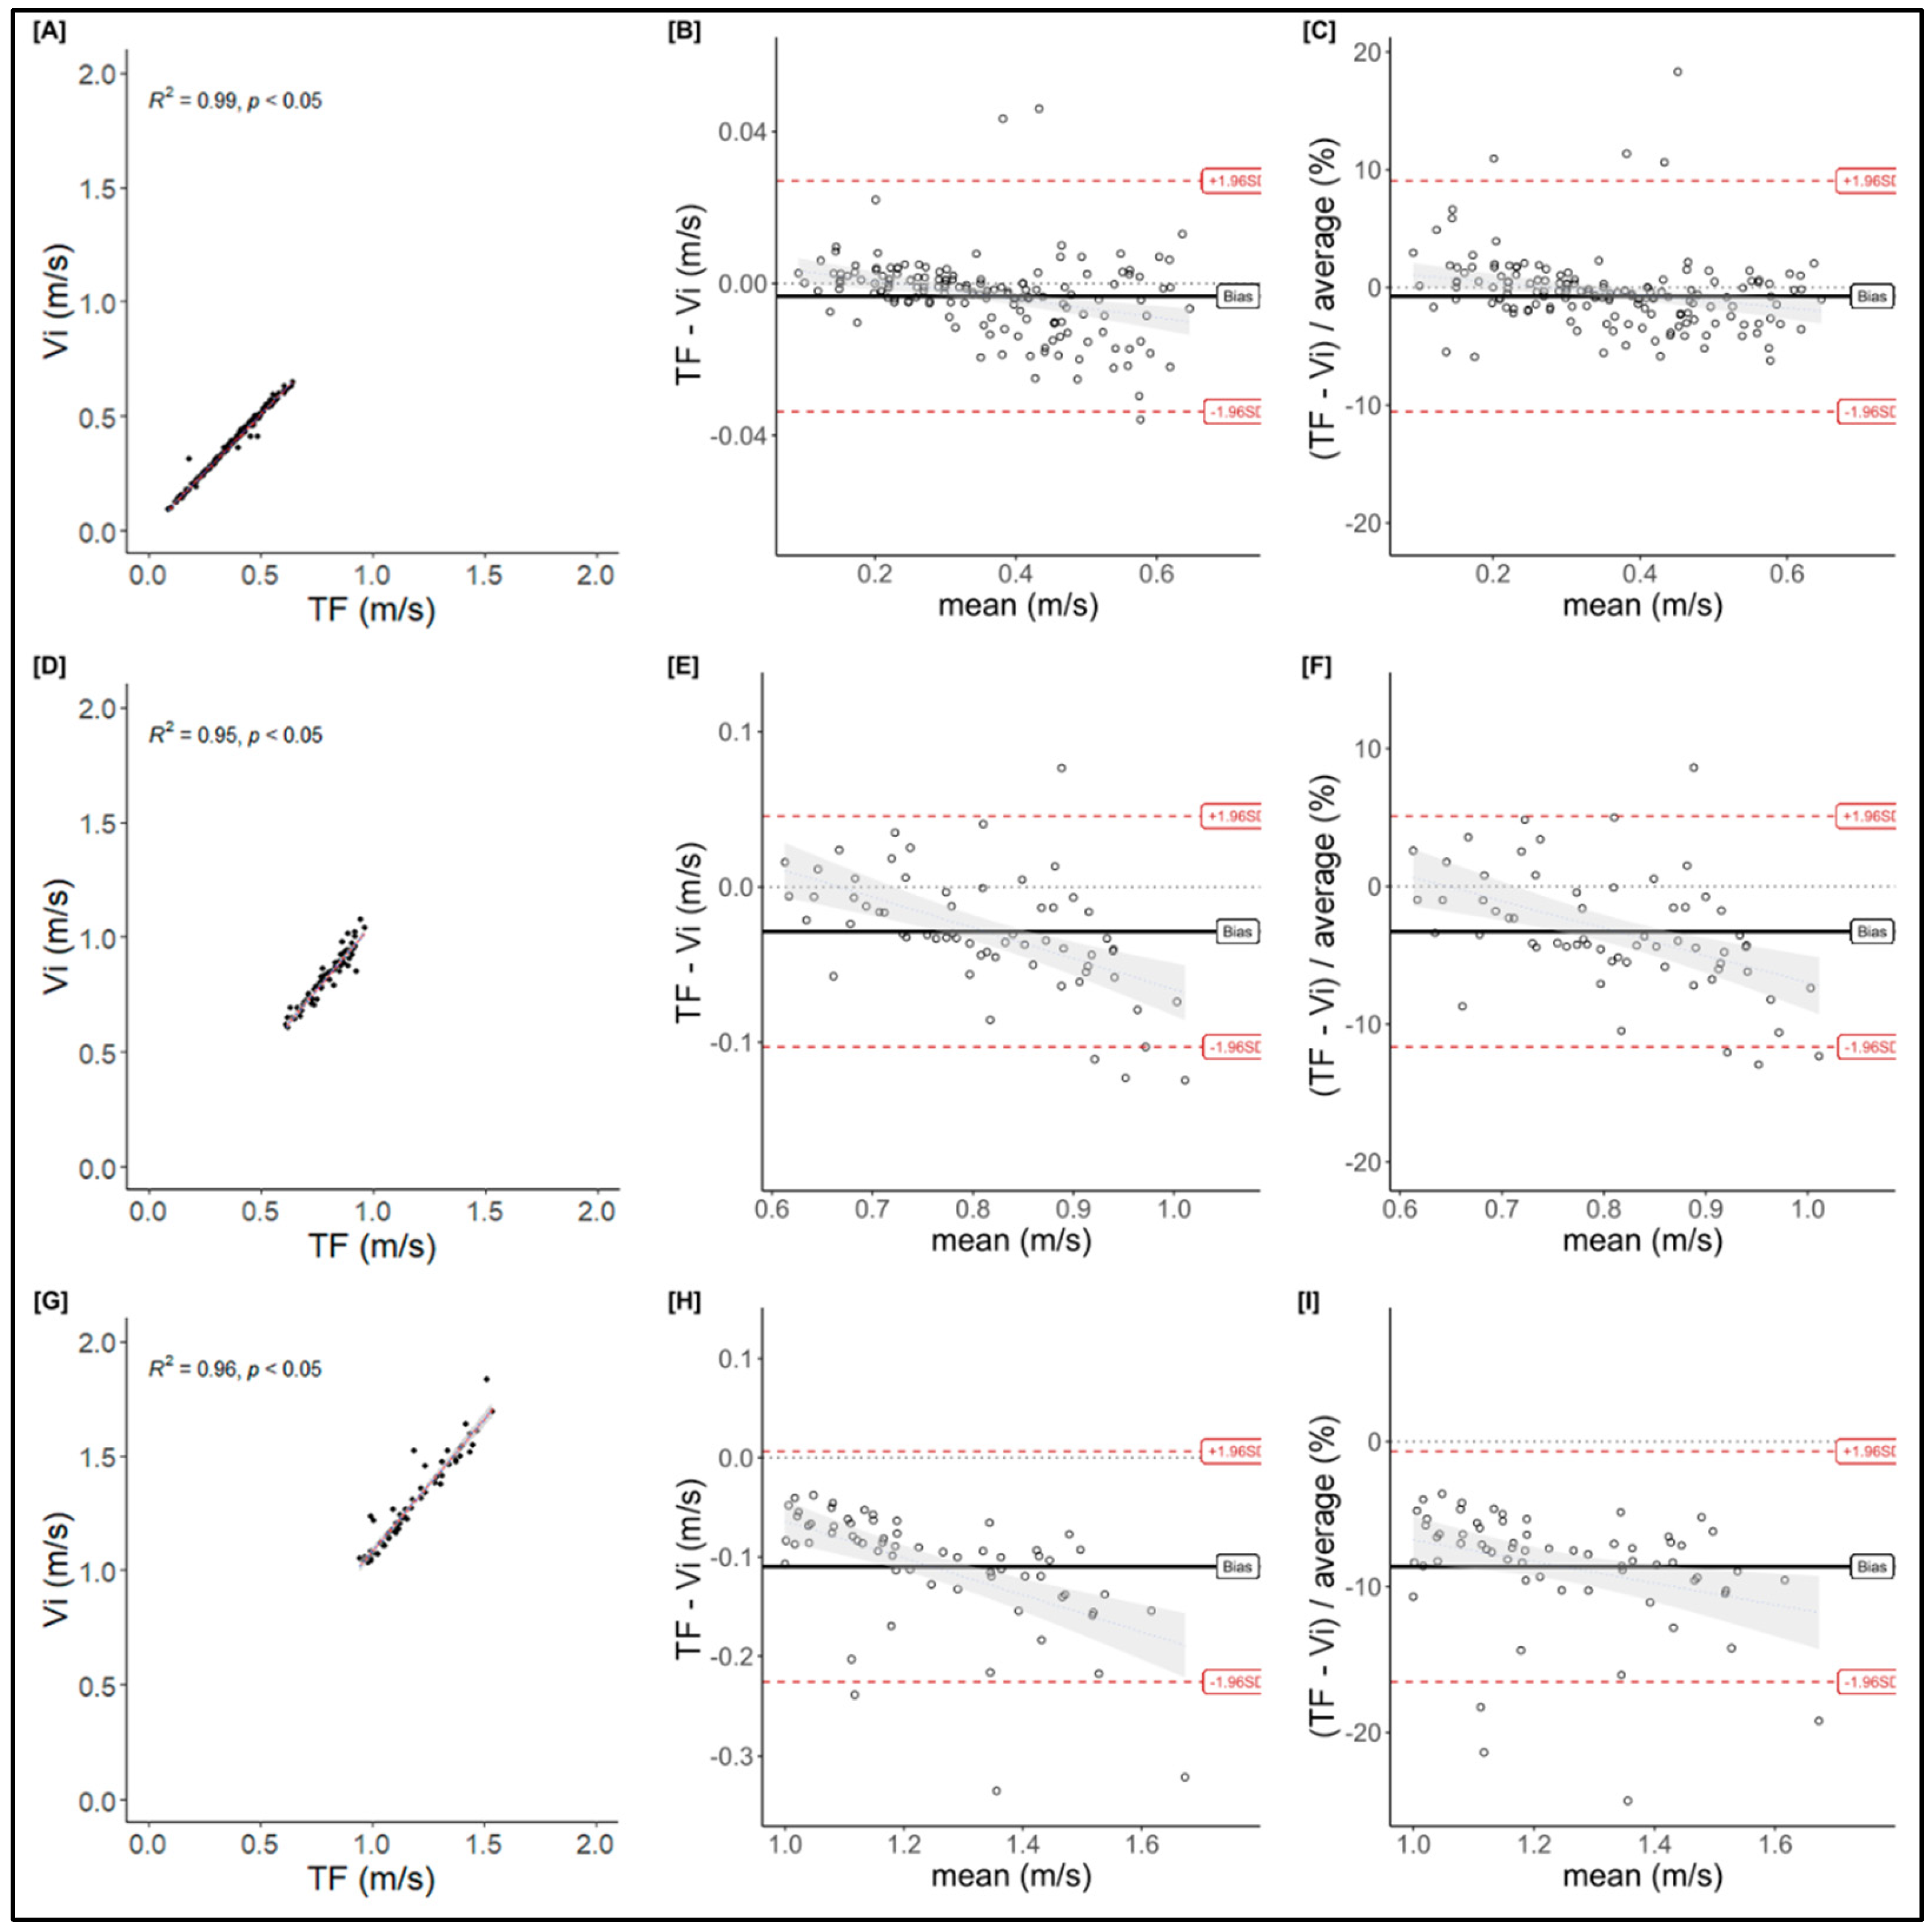
Figure 3.
Bland Altman analysis for peak velocity (PV). High (A, B, and C), moderate (D, E, and F), and low (G, H, and I) intensities are presented, left to right, the regression line between hypothetical measurements done T-Force (TF) and Vitruve (Vi); Plot of difference between T-Force (TF) and Vitruve (Vi) vs. mean of two measurements; and, Plot of differences between T-Force (TF) and Vitruve (Vi), expressed as percentages of average vs. the mean of two measurements.
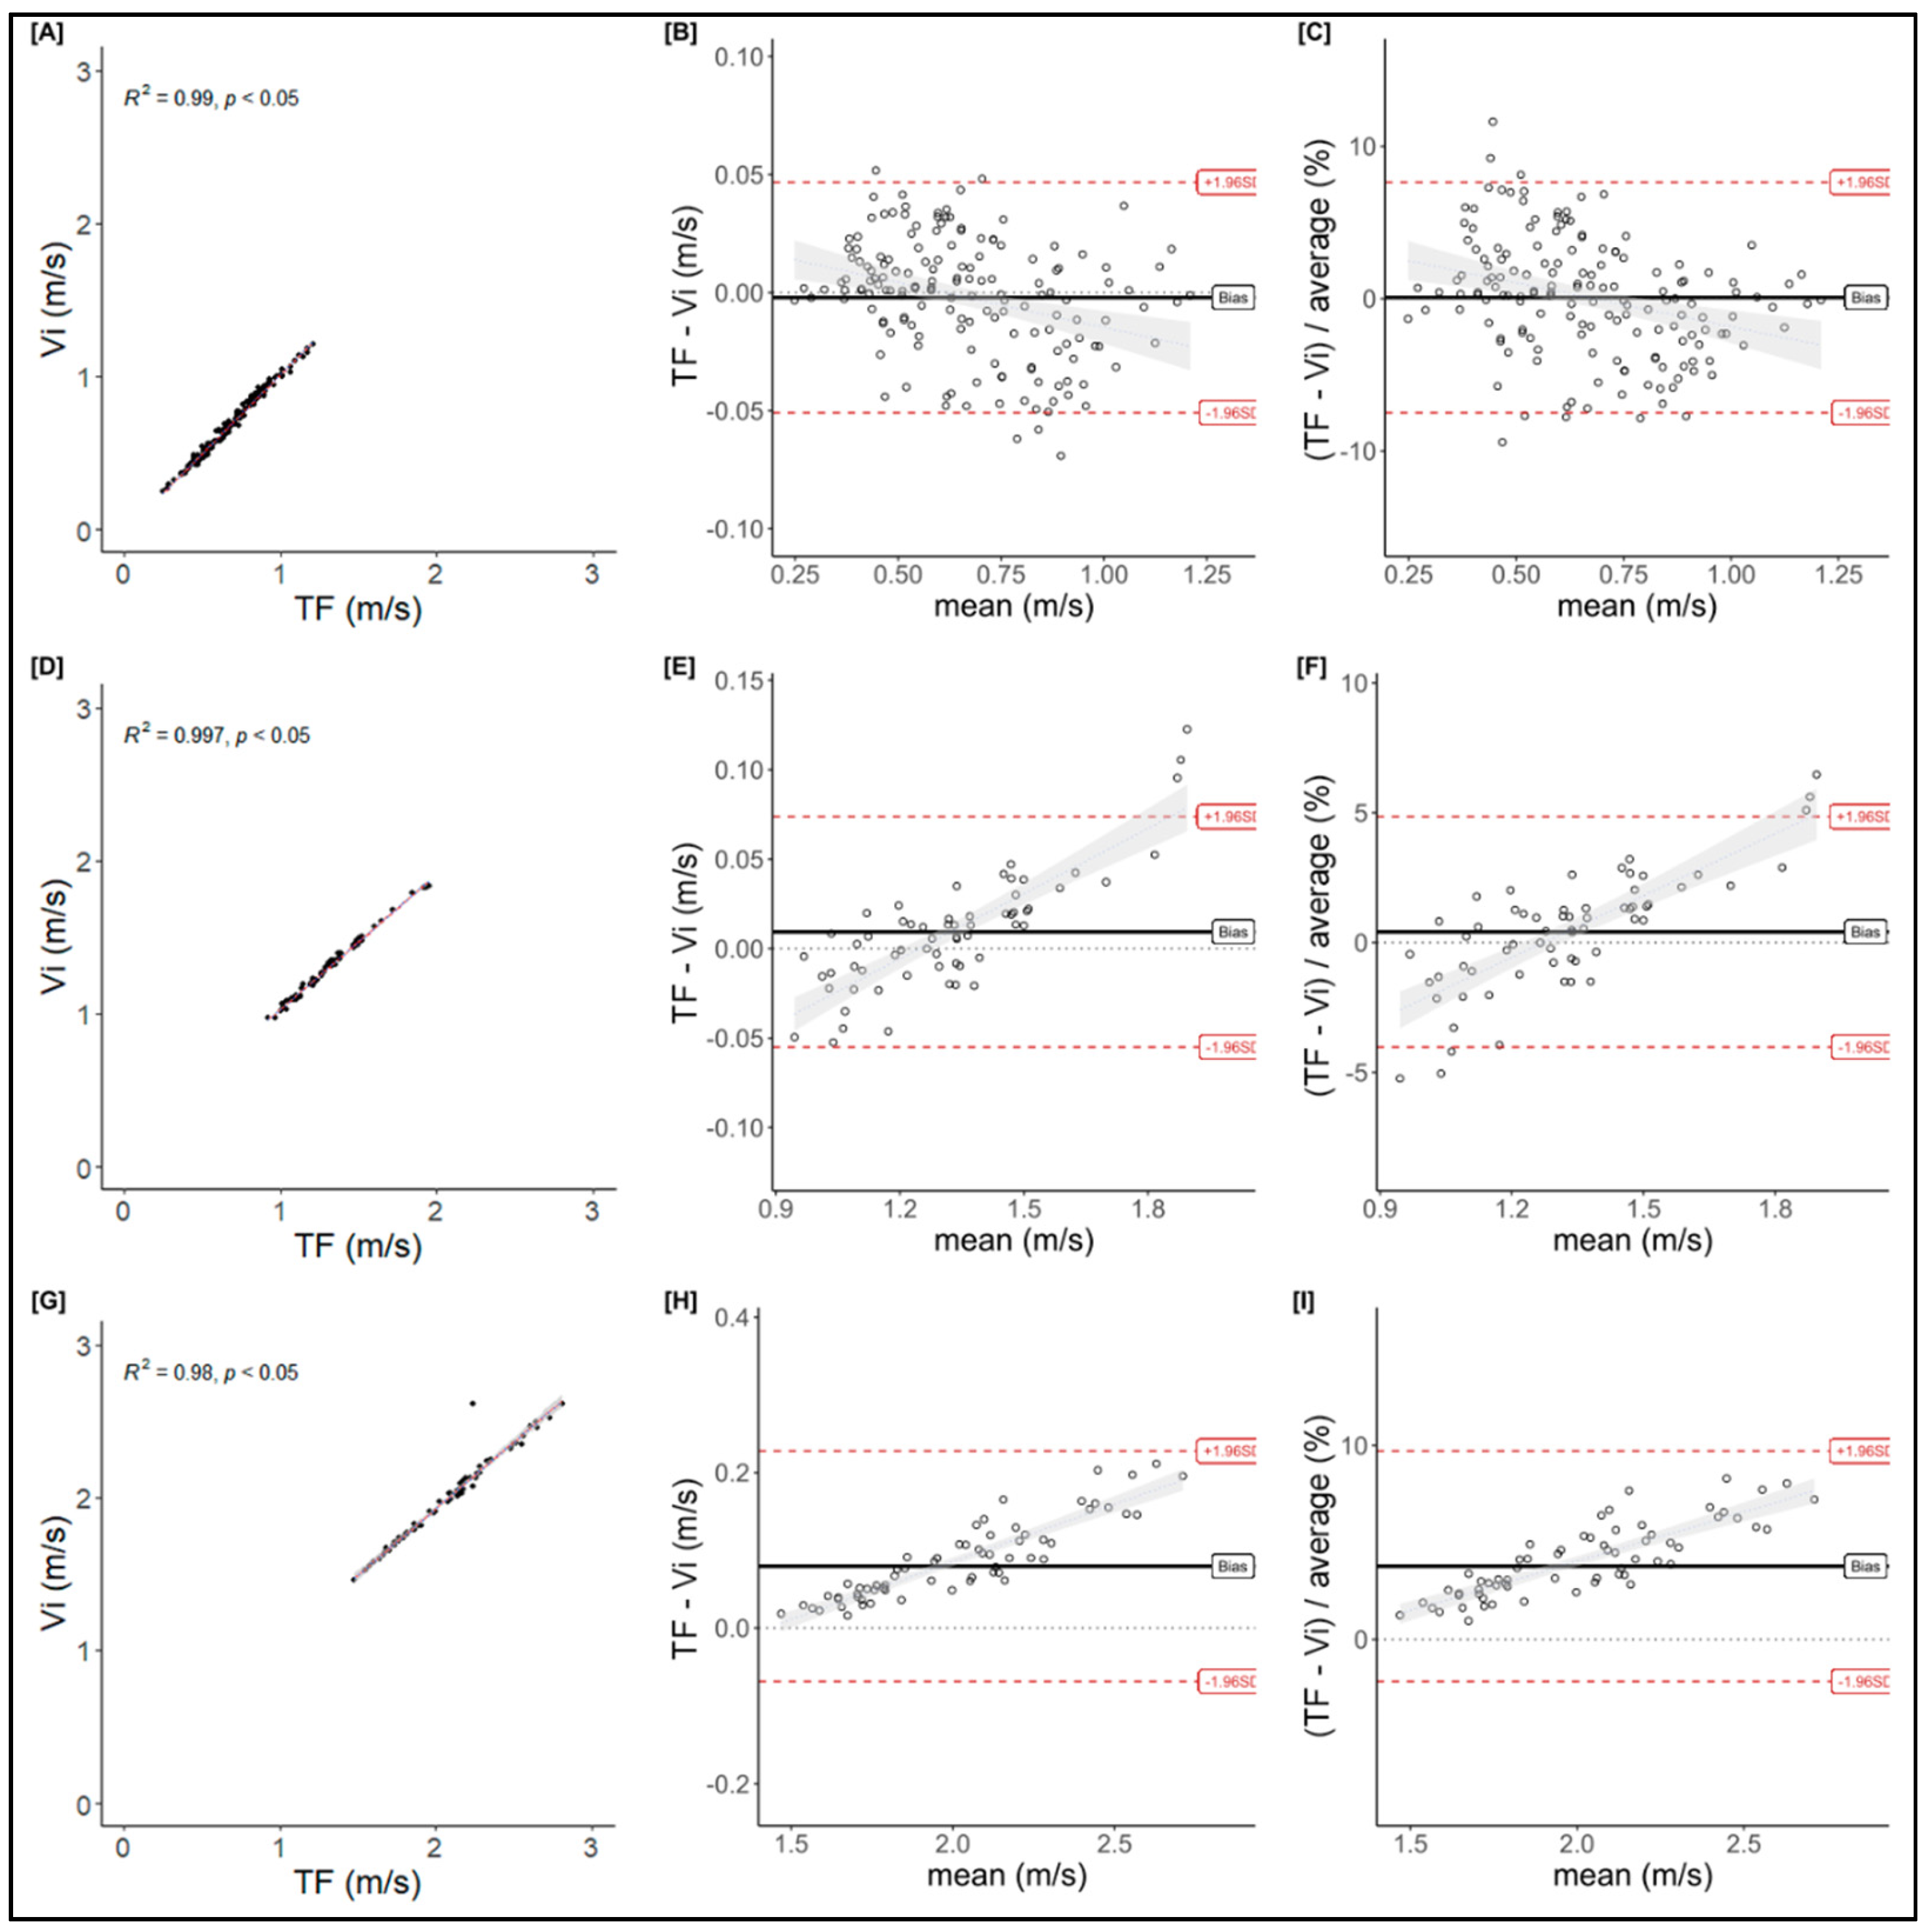

Table 1.
Effect size and confidence interval of the differences between T-Force and Vitruve to measure the mean propulsive velocity (MPV) and the peak velocity (PV) at different intensities (Loads) during the bench press exercise.
Table 1.
Effect size and confidence interval of the differences between T-Force and Vitruve to measure the mean propulsive velocity (MPV) and the peak velocity (PV) at different intensities (Loads) during the bench press exercise.
| MPV | PV | |||
|---|---|---|---|---|
| Loads | ES | 95% CI | ES | 95% CI |
| High | -0.02 | -0.24, 0.19 | -0.01 | -0.23, 0.21 |
| Moderate | -0.26 | -0.61, 0.09 | 0.04 | -0.09, 0.60 |
| Low | -0.61 | -0.97, -0.25 | 0.25 | -0.31, 0.39 |
ES = effect size; CI = Confidence interval.
Disclaimer/Publisher’s Note: The statements, opinions and data contained in all publications are solely those of the individual author(s) and contributor(s) and not of MDPI and/or the editor(s). MDPI and/or the editor(s) disclaim responsibility for any injury to people or property resulting from any ideas, methods, instructions or products referred to in the content. |
© 2024 by the authors. Licensee MDPI, Basel, Switzerland. This article is an open access article distributed under the terms and conditions of the Creative Commons Attribution (CC BY) license (http://creativecommons.org/licenses/by/4.0/).
Copyright: This open access article is published under a Creative Commons CC BY 4.0 license, which permit the free download, distribution, and reuse, provided that the author and preprint are cited in any reuse.


