Preprint
Article

This version is not peer-reviewed.

Understanding the Utilization of Indigenous Institutions: The Case of Wonosobo, Central Java, Indonesia

A peer-reviewed article of this preprint also exists.

Submitted:

15 December 2024

Posted:

16 December 2024

You are already at the latest version

Abstract

Indigenous institutions may play a vital role in sustainable development at the local level by serving the people’s interests and supporting their livelihood. By spreading structured questionnaires to the households in our research area, this research aims to find the determinant factor of the utilization of community institutions, especially the indigenous institutions. Per household, 26 features, including demographic, psycho-social, economic, and location variables, were collected to study the predictability of the utilization of the community institutions. The results show that the location variables are the most crucial for explaining the utilization of the community institutions in times of need.

Keywords: 
;  ;  ;  ;  ;  ;  

1. Introduction

Sustainable development mandates the current generation to use resources without sacrificing the needs of future generations [1]. Sustainable development is crucial for nations striving to balance economic growth with the preservation of natural resources, environmental protection and social objectives. It requires long term investments in economic, human , and environment capital [2,3]. To be able to achieve such condition, a strategy is needed that involves all possible effective activities. Such a strategy should be accepted and supported by as many parts of society as possible and should also overcome various differences in institutional power. For that, the local level of knowledge and skills which are based on culture and social traditions are needed [4]. At the local level of society, sustainable development is often supported by the traditional, or indigenous institutions. These institutions harness indigenous knowledge to efficiently and sustainably manage resources for productive activities [5]. Their utilization reflects the community’s participation in enhancing its livelihood, thus, promoting community development.
However, indigenous institutions are frequently overlooked. Historically, the knowledge embedded in indigenous institutions was dismissed by scientists and policy makers due to colonial and imperial biases, and their associations with “non-Western” knowledge systems. Furthermore, indigenous institutions often emerged from marginalized people, distinct from dominant governance and knowledge structures [6,7]. Nevertheless, indigenous institutions are invaluable for formulating empowerment policies, fostering local participation in decision-making and program implementation, and proving instrumental in poverty alleviation [8].
In Asia, kinship and personal relationships significantly influence commercial activities by fostering trust and collective responsibility [9]. In Indonesia, particularly, there is a deeply-rooted long-standing tradition of mutual support and collaboration manifested through labor and voluntary efforts, known as tolong menolong, or more specifically gotong royong. It serves as a cultural adhesive in the social fabric [10]. However, its function has sometimes been co-opted for political motives. Historical instances include its usage by Dutch and Japanese colonizers and later during different Indonesian political eras for various objectives. In Old Order/Soekarno era prior to 1964, it was employed for his political view as “active cooperation and struggle of horizontally aligned groups and factions and it referred to a goal of political action” [11]. During the New Order/Soeharto regime from 1965 to 1998, gotong royong was used for supporting the top-down development which implemented coercion towards farmers to plant high-yielding rice varieties that demands a debt for the inputs. It was even used to get free collective labor from the villagers in the rural development programs. The government placed local institutions based on gotong royong as an instrument of the extension of power at the village level, rather than as a control force of government policy. Consequently, there was no empowerment of the lower layers of society, but the co-optation of local institutions in authoritarian state corporatism [7,12]. Despite these co-optations, in local realities, at the community level, gotong royong remains a foundation for balanced and generalized reciprocity in farming and for events such as ceremonies related to stages of life i.e., birth, marriage, or death [7].
The principle of gotong royong is expressed differently across Indonesia’s diverse ethnic landscape. In Central Java, jimpitan exemplifies a local mutual aid/indigenous institution, drawing from the ethos of gotong royong. It has evolved to primarily aid the economically vulnerable [13]. Amidst the global economic strains induced by Covid-19 pandemic, the Central Java government endorsed the tradition of jimpitan as a form of community sustenance, with local initiatives like jogo tonggo (literally jogo means to keep/to guard, tonggo means neighbor) also emerged in response. In Tegal, Central Java, in Tegalsari village (Tegal Barat sub-district), the local people implement it by growing vegetable crops and other food plants, cultivating the fish in the pond, and growing kale plants and greens. They also have food barns to store the aid from outside the neighborhood or from jimpitan within the neighborhood. The food barn is used to help people outside the neighborhood who are affected by Covid-19 [14,15].
Jimpitan typically involves rice contribution activities conducted by women who bring an amount of rice to the monthly meeting and by men who take rice from a small tray hung in front of each house while checking around for safety in the neighborhood [16]. Rice, as the medium in jimpitan, is the staple food for most people in Indonesia. In the context of the International Year of Rice as launched by FAO (2004), it was stated that having sufficient rice determines food security and livelihood [17]. Other regions in Indonesia and other countries have analogous institutions, showcasing the universal nature of such community-based solutions i.e., Perelek [18] and Gintingan in West Java [19] and Bareh Saganggam in West Sumatera [20], Ajo in Nigeria [21], Iddir in Ethiopia [22], Bayanihan in the Philippines [23,24], and Kuu in Liberia [25]. The active engagement of local populations through these institutions can significantly advance poverty alleviations efforts, leading to sustainable community development.
Diverse institutions, with their unique capabilities to harness and administer resources, jointly contribute to sustainable development. Often, informal institutions offer services distinct from the formal ones, necessitating their coexistence for comprehensive societal service, termed market differentiation [26,27]. Only half of Indonesian population utilizes formal banking services, with the remainder either opting for informal services or not using any services at all [28]. In East Indonesia, barriers to formal services drive people towards informal alternatives [29]. Therefore, this study choose three types of institutions observed in the community, where the local people participate in one out of three: (i) the indigenous institution jimpitan, a community-based institution that is informal, and based on gotong royong; (ii) the transitional institutions, that are characterized by in-between informal and formal institutions, in this study represented by the cooperatives and PNPM-UPK (national community empowerment program-subdistrict activity management unit); or (iii) the modern institutions, that are the formal and rule-based institutions, in this study represented by the bank.
The participation of the community in these community institutions can be used as an instrument which helps to make interventions more relevant to local needs. The aim of the study is to describe which factors are considered important in the utilization of the institutions available in the community. The emphasis is on the indigenous institution jimpitan, because it is focused on a culture of mutual support, exchange of gifts and sharing. In other words, it was built on trust and a great deal on social capital. Historically, jimpitan was conducted in the evening when the man doing their routine night patrol (ronda) around the neighbourhood for safeguarding, they were also collecting the jimpitan rice put in the plastic cup or bamboo hung in front of each house. Alternatively, the jimpitan was also conducted by the woman in their routine meeting of rotating credit and savings association (arisan). Both ronda and arisan have become a parameter of people’s participation in the community.

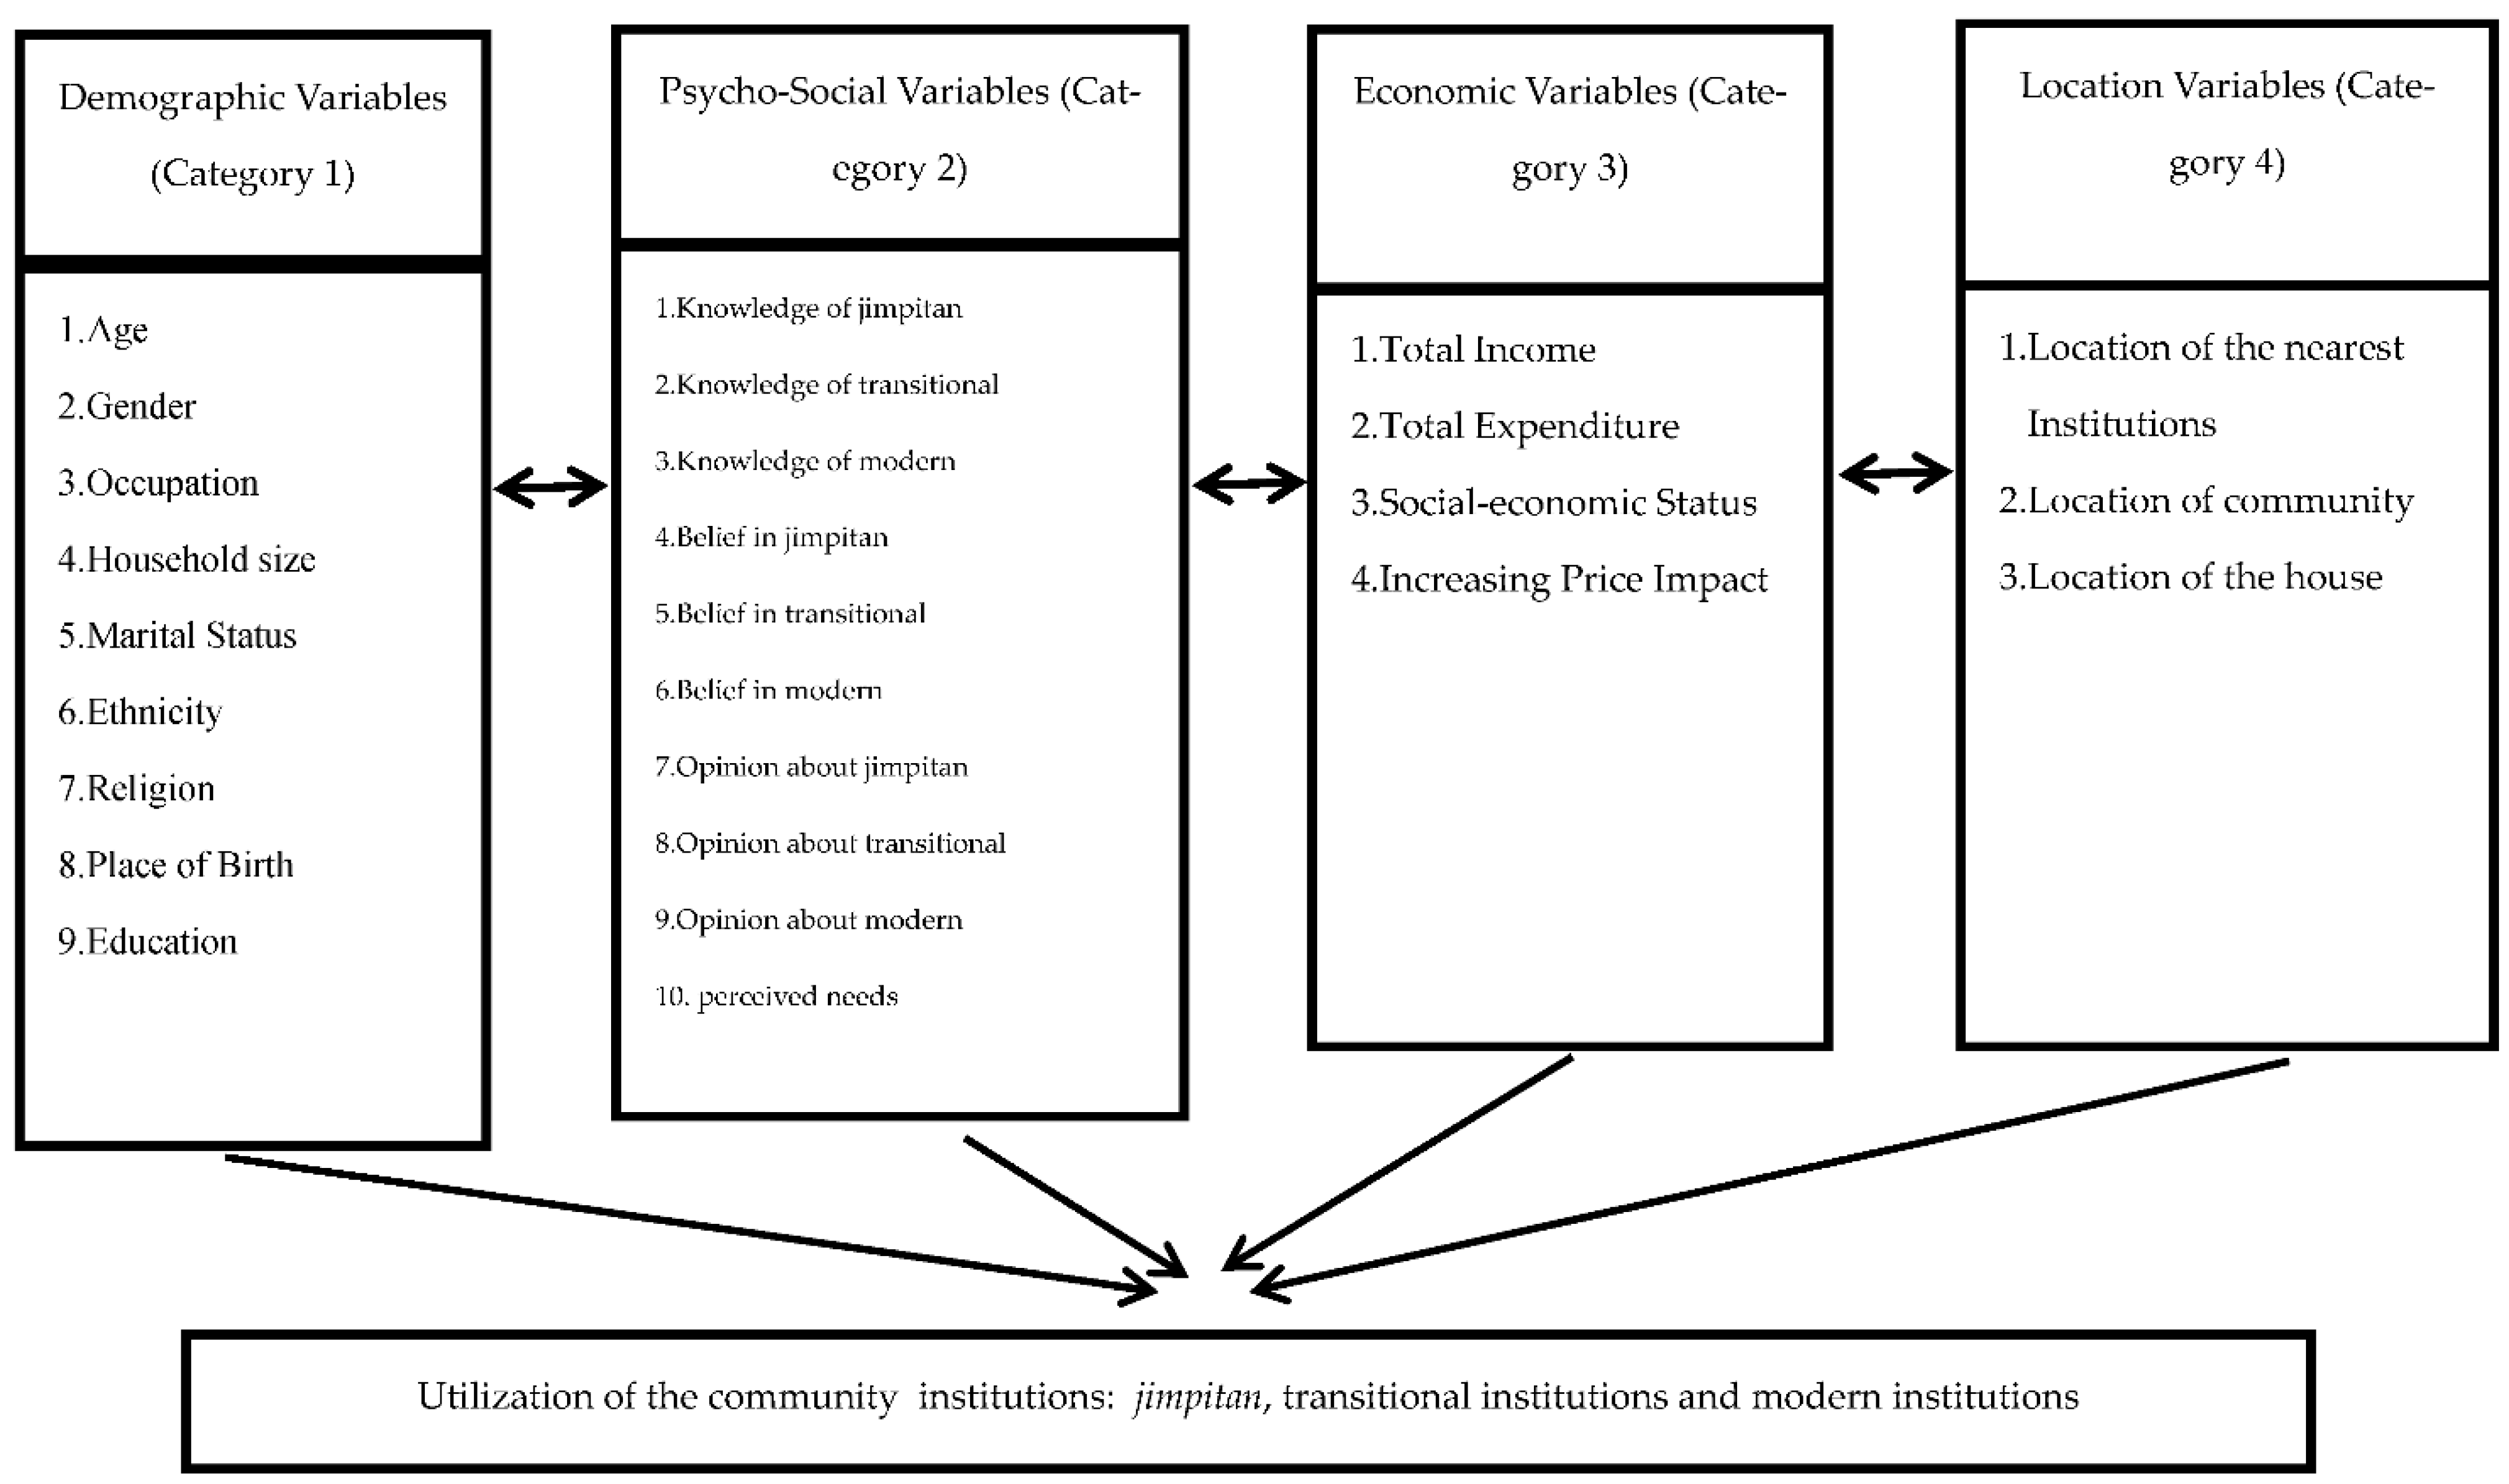
2. Materials and Methods

2.1. Materials

To capture what factors play a key role in the utilization of community institutions, we gathered the data through household surveys by spreading the structured questionnaires in four villages during field research in 2017 [30]. The households were asked to reflect the economic and financial activity of the year before. The questionnaires documented various features considered as potential determinants of socio-economic behavior of the local people in the research area. In the following they are called variables. The study area covered the geographical location of the Wonosobo District, which is divided into a mountain area in the northern part and a low-land area in the middle section. It also included a rural and an urban area. The respondents were selected randomly. The number of households surveyed was 199. The distribution of surveys over the four villages in terms of geographical and type area is shown in Table 1.
We collected 26 variables from the questions in the questionnaires which where divided over four categories. The first category included socio-demography variables which consisted of: age (AGE), gender (GENDER), education (EDU), occupation (OCCU), household size (NOHHMEM), marital status (MARSTAT), ethnicity (ETHNIC), religion (RELIGI), and place of birth (POBIRTH). The second category included the psycho-social variables: knowledge about jimpitan (KNOWJIMP), belief in jimpitan (BELJIMP), opinion on jimpitan (OPJIMP), knowledge about transitional organizations (KNOWTRANS), belief in transitional organizations (BELTRANS), opinion on transitional organizations (OPTRANS), knowledge about the bank (KNOWBANK), belief in the bank (BELBANK), opinion on the bank (OPBANK), and perceived needs (PERCNEED). The third category included economic variables: total income (TOTINC), total expenditure (TOTEXP), social-economic status (SES), and increasing price impact (PRICEIMP). The fourth category included the location variables: nearest location of institutions (NEARINST), the location of the community (LOCCOMM), and the location of the house (LOCHOUSE).
The dependent variable in our analysis was the utilization of community institutions. Figure 1 below shows the model hypothizing the interaction between the independent and dependent variables. The four downward pointing arrows illustrate the hypothetical influence of each variable independent on the utilization of community institutions. The two-way arrow between the box indicates the hypothetical interaction between independent variables.
The variables are grouped in the same category (in the box) due to their closeness characteristics. The variables gender, occupation, marital status, ethnicity, religion, and place of birth, social-economic status, perceived needs, location of the community and location of the house are nominal. The other independent variables are ordinal. The dependent variable is nominal with the utilization classes 1) the indigenous or traditional institution of jimpitan; 2) transitional institutions; and 3) modern institutions.

2.2. Method

The analysis in this study follows the Random Forest approach [32]. Random Forest uses a large number, in our case 500, of decision trees that are trained to predict the dependent variable, also called the response variable, based on the independent variables, also called the predictive variables. Each decision tree is trained by a random sample of cases and a random sample of predictive variables. The prediction of the Random Forest approach as a whole is based on the combined decisions of all the sparate trees. The Random Forest approach is chosen here for several reasons. Random Forest can be used for the classification of categorical variables [33,34,35]. Random Forest can deal with the independent and dependent variables that are ordinal as well as nominal [32,33]. No assumption on the type of relationships between dependent and independent variables nor on those between independents is needed. The Random Forest approach can tell us which independent variables explain the dependent variables best, because the importance of each independent variable in predicting the dependent variable can be estimated.
For any statistical analysis, one needs to know the interdependency of the independent variables. When the variables are highly correlated they are unfit to be included in an analysis together, because in that case they actually contain the same information. Including them both in the same analysis leads to singularity. Therefore, we employed the χ2 test and calculated Cramer’s V tests to assess the interdependency of the independent variables. Cramer’s V shows the correlation between two variables on a scale of 0 to 1, and the χ2 test gives the statistical significance of the correlation as p-value. If the p-value from the χ2 test and the value of Cramer’s V displays a strong correlation between two variables, then we should drop one of the two variables from the analysis. The consequence of excluding high correlated variables in the analysis is that the separate influence of those two variables on the dependent variables cannot be assessed. Our Random Forest approach focused on two kinds of analysis:
  • The importance of independent variables for prediction institutions’ utilization. The Random Forest approach figures out the importance of the variables in predicting the utilization of the community institutions, by calculating the accuracy of the prediction by the Random Forest approach based on all independent variables minus the variable of concern. The difference in accuracy between the prediction of the complete Random Forest and that of Random Forest minus the variable of concern is called the importance value. Variable importance was calculated ten times in order to assess the variability of the importance due to random steps within the Random Forest approach. The independent variables with an importance variance not including zero were regarded as having an importance value that is significantly higher than zero, and were called non-zero variable. The higher the importance value, the larger the predictive power of the variable.
  • The average importance per variable category was to capture which category best explained the utilization of institutions. By averaging the importance value of variables in each category and checking with a permutation test whether it is significantly higher than the average of a random sample of the variables, we would know which category significantly influenced the utilization of institutions. The permutation test is conducted by taking a fixed number of variables equal to the number in that category randomly out of all variables (ie., for category one, nine out of 26 variables; for category two, ten out of 26 variables; for category three, four out of 26 variables; and for category four, three out of 26 variables), calculate the average, and repeat this 1000 times to get the distribution of the random average. When the actual average of the importance of the variables in the category is higher than the 95 per-centiles of that distribution, the average is considered significantly higher than the random average. The permutation test in this form is an exact one-sided test.
All analyses were performed in R (R Core Team 2021). The Random Forest analysis were grown using the function cforest() and the function varimp() was used for estimating the variable importance, both of the package party, using the default settings for unbiased partitioning [36,37]. This ensured that the importance we used was the conditional importance, the importance of an independent variable assuming that all other independent variables are constant [34]. The χ2 test was performed with the function chsqr test() and Cramer’s V with cramer v() of the package rstatix [38].

3. Results

The utilization of the institutions in the research area were respectively 32.2% (n=64), 30.6% (n=61), and 37.2% (n=74) for the traditional/indigenous institution jimpitan, transitional institutions and modern institutions. The number did not significantly differ between the institutions (chi-sq = 1.397, p-value = 0.532), which means that there was a balanced distribution of the utilization of the community institutions in the study area. Table 2 shows the distribution over four villages of institutions’ utilization. The respondents from Kejajar village, a rural area located high up in the mountain, preferred to use the indigenous institution jimpitan. This is in contrast with the respondents from Sojokerto, a rural area located in the low land. They tended to utilize the modern institutions, just like the respondents from Wonosobo Barat, an urban area located in the low land, while for the respondents from Kalibeber, an urban area located in the low land, most people preferred to use the transitional institutions. Depending on village, the respondents choose different institutions when they needed help (chi-sq test; p ≤ 0.001, Cramer’s V = 0.5123).

3.1. The Correlation Test (Cramer’s V and Chi-Square)

The result from Cramer’s V and Chi-square tests (see Supplementary Table A1.) shows that there are five pairs of variables that indicate high significant correlation value (V>0.60): age and ethnicity (V=0.62); religion and ethnicity (V=0.65); belief in jimpitan and knowledge about jimpitan (V=0.60); opinion on transitional institutions and belief in transitional institutions (V=0.62); and nearest institutions and location of the community (V=0.68). Overall, according to the results of Cramer’s V, there were no pair of variables that had a Cramer’s V that depicts a very high correlation (V>0.8). Therefore, all of 26 independent variables were included in Random Forest.

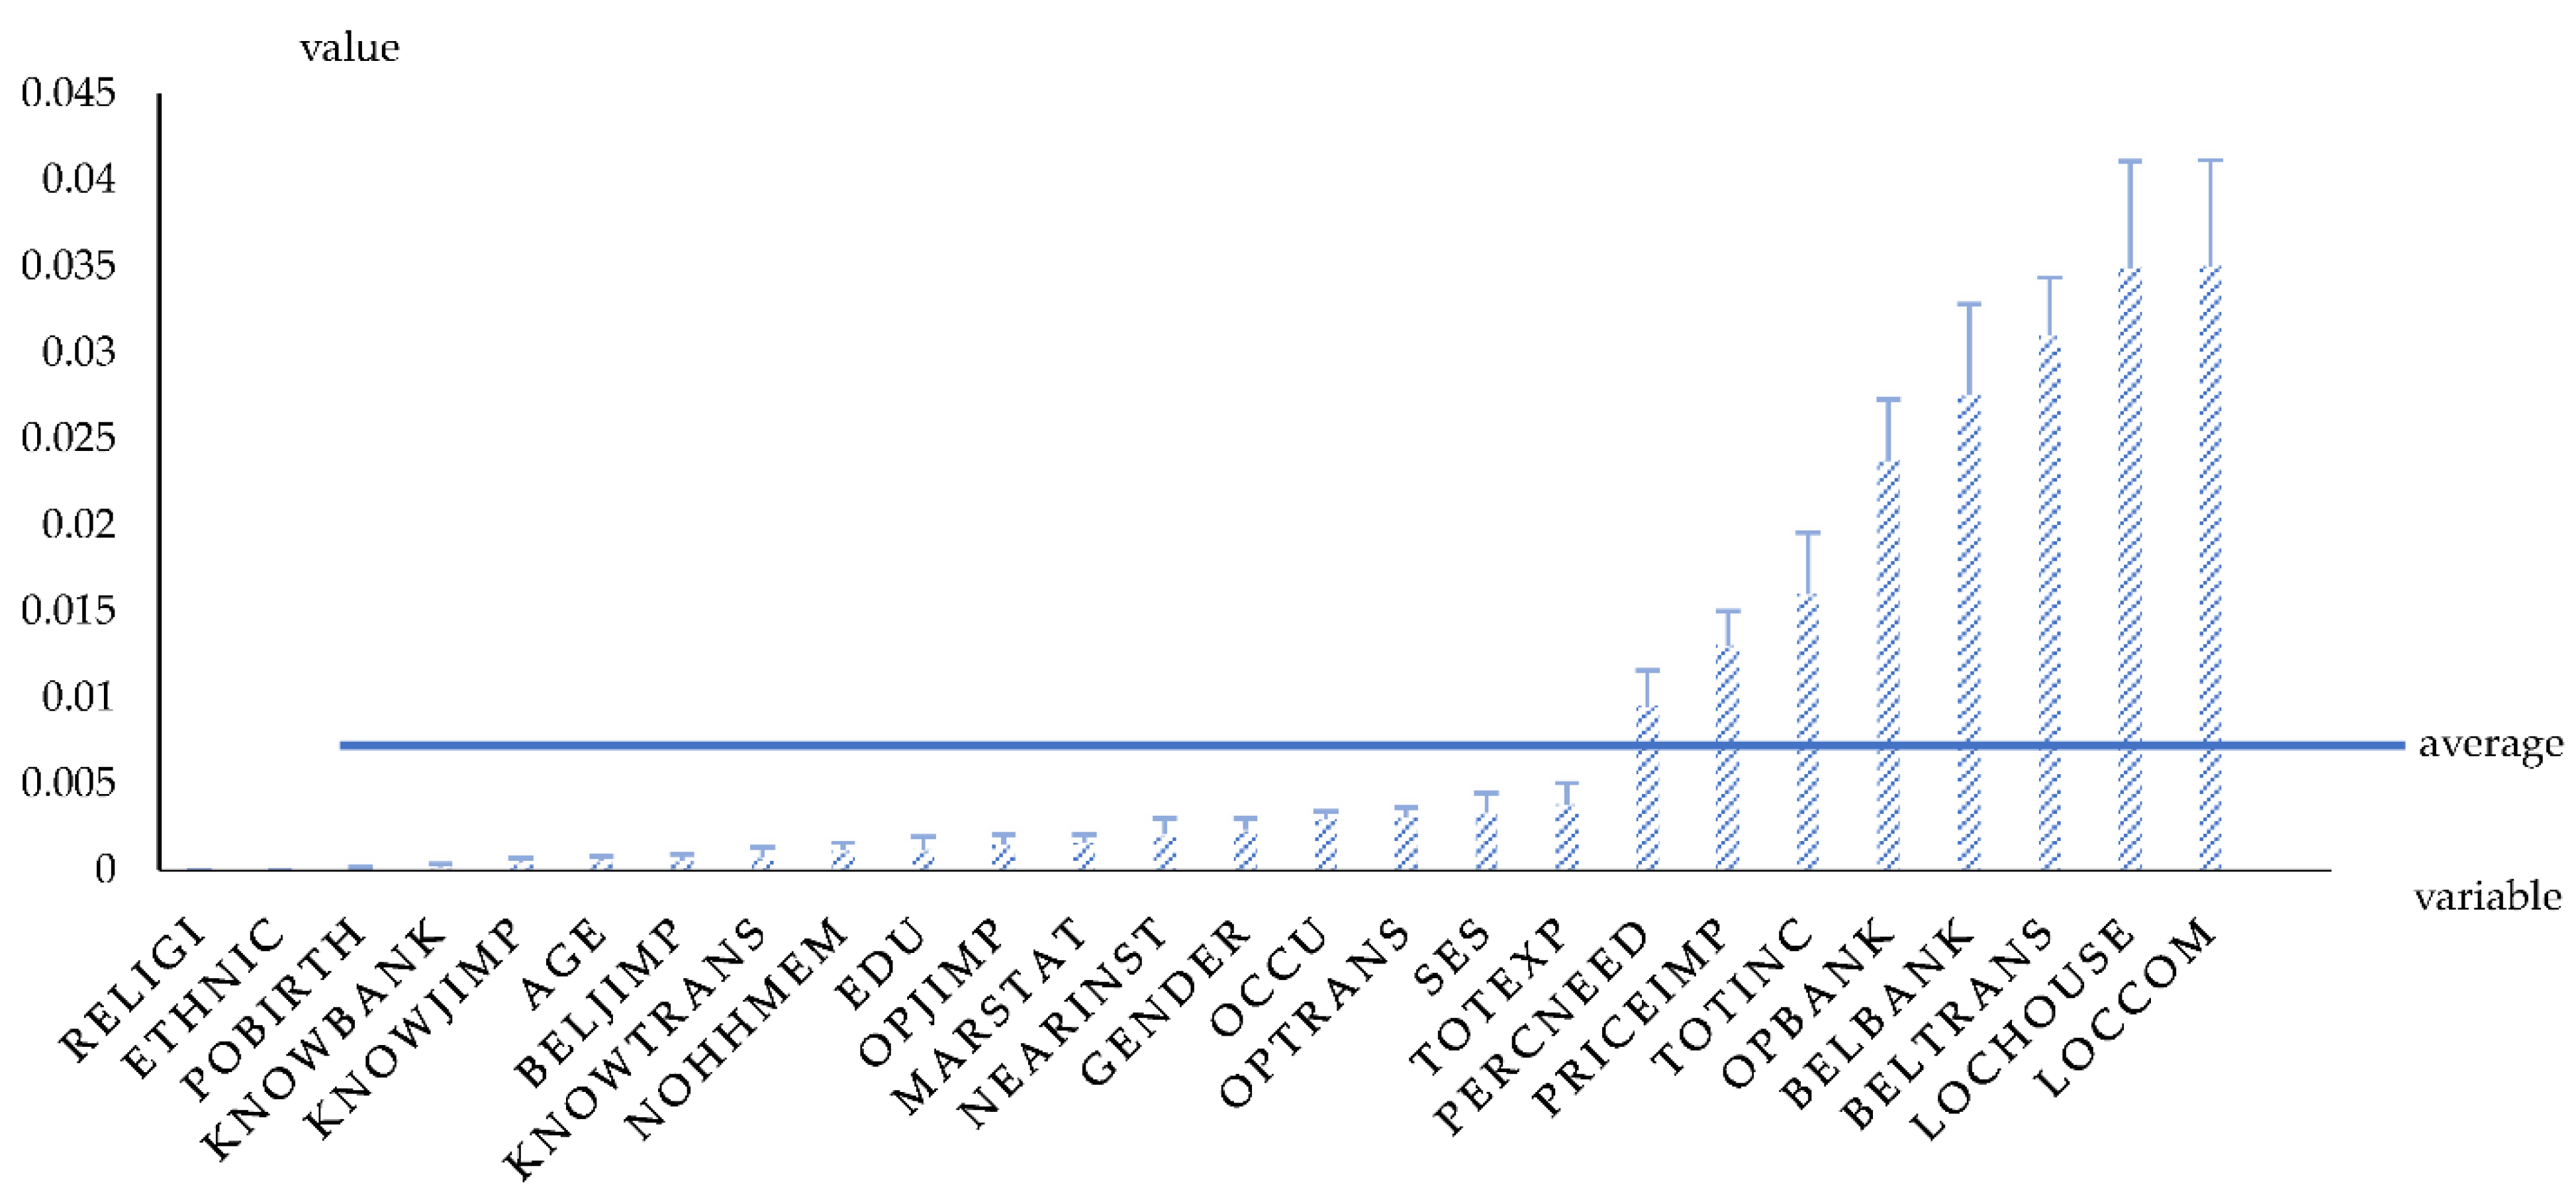
3.2. The importance of variables for prediction institutions’ utilization

The Random Forest, to predict the utilization of institutions, was performed ten times. The predictive power of the Random Forest turned out to be 77% on average, i.e., 77% of the respondents were classified correctly to their institutions’ utilization. The importance of the independent variables is provided in the Figure 2. Of the 26 variables, 22 variables had an importance higher than zero. The eight variables with the highest importance value were, in descending order, the location of the community (LOCCOM), the location of the house (LOCHOUSE), the belief in transitional institutions (BELTRANS), the belief in modern institutions (BELBANK), the opinion on modern institutions (OPBANK), the total income (TOTINC), the increasing price impact (PRICEIMP), and perceived needs (PERCNEED). Of those eight variables two variables are in the location category, four in the psycho-social category, and two in the economic category. We chose to explain the top eight variables due to their high value compared to the average.

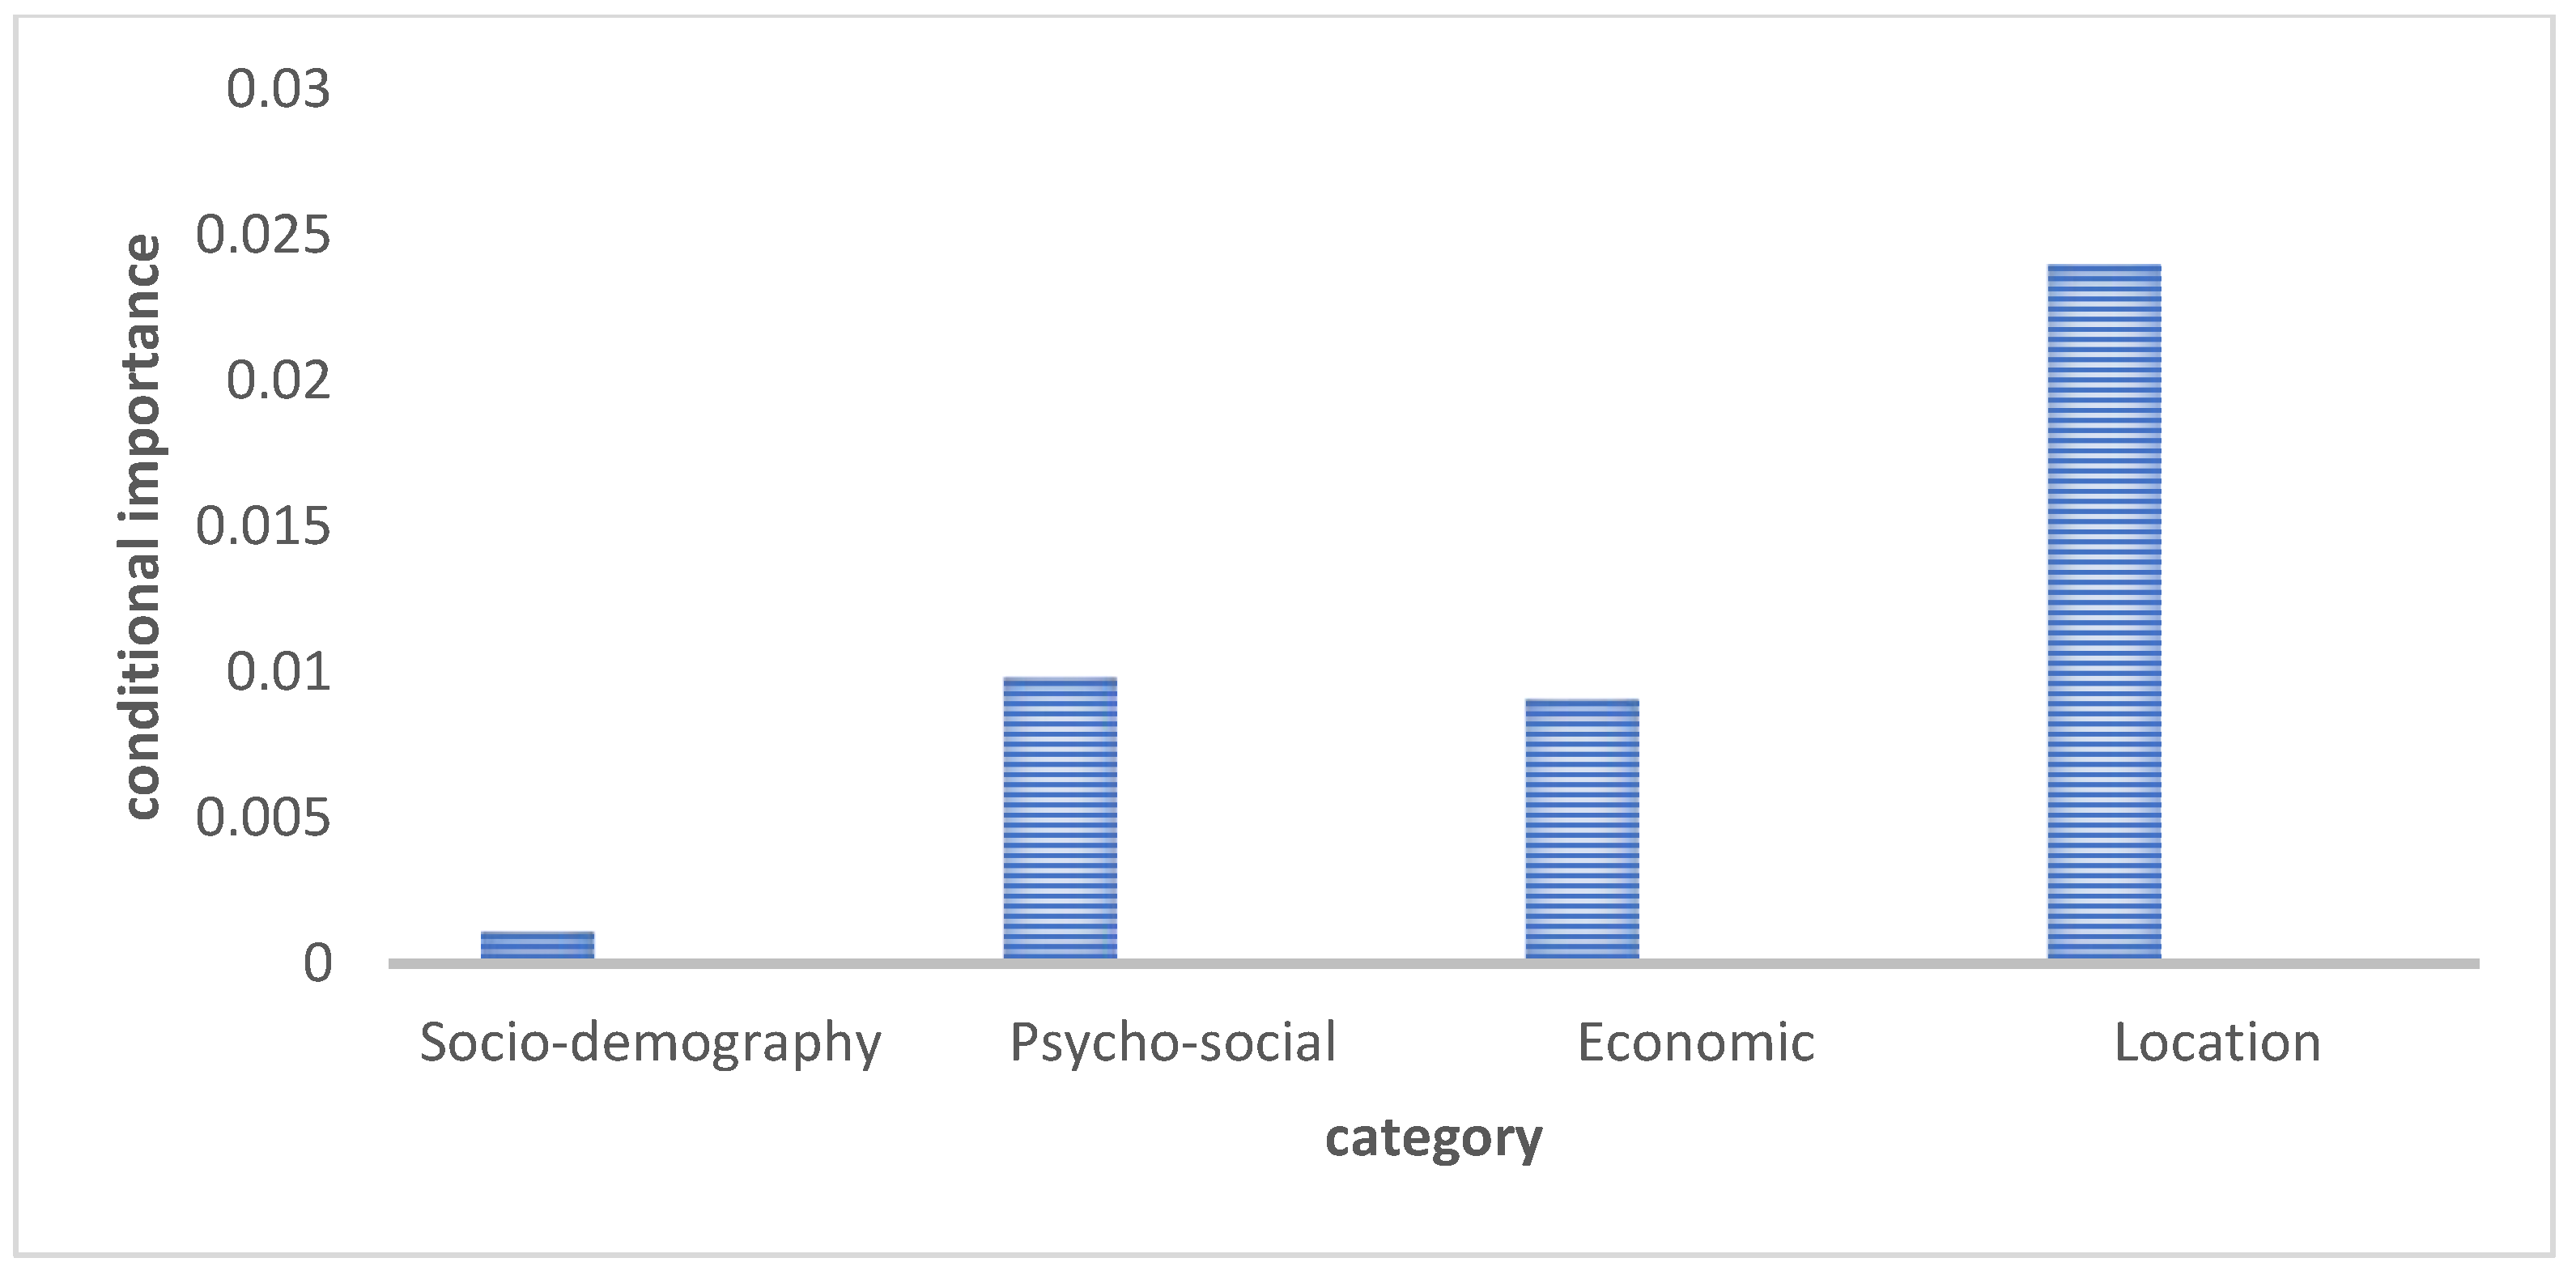
3.3. The average importance per variable category value

The summary of the result of the average importance of the variable categories is shown in Figure 3 below.
The found average was considered significantly different from the random average, if it lies above the 95% of the distribution of the random average. Table 4 shows the result of the permutation test. The category that has the asterisk sign shows an average importance above 95% of the random distribution of the average. It is only the location category which significantly influences the utilization of community institutions

4. Discussion

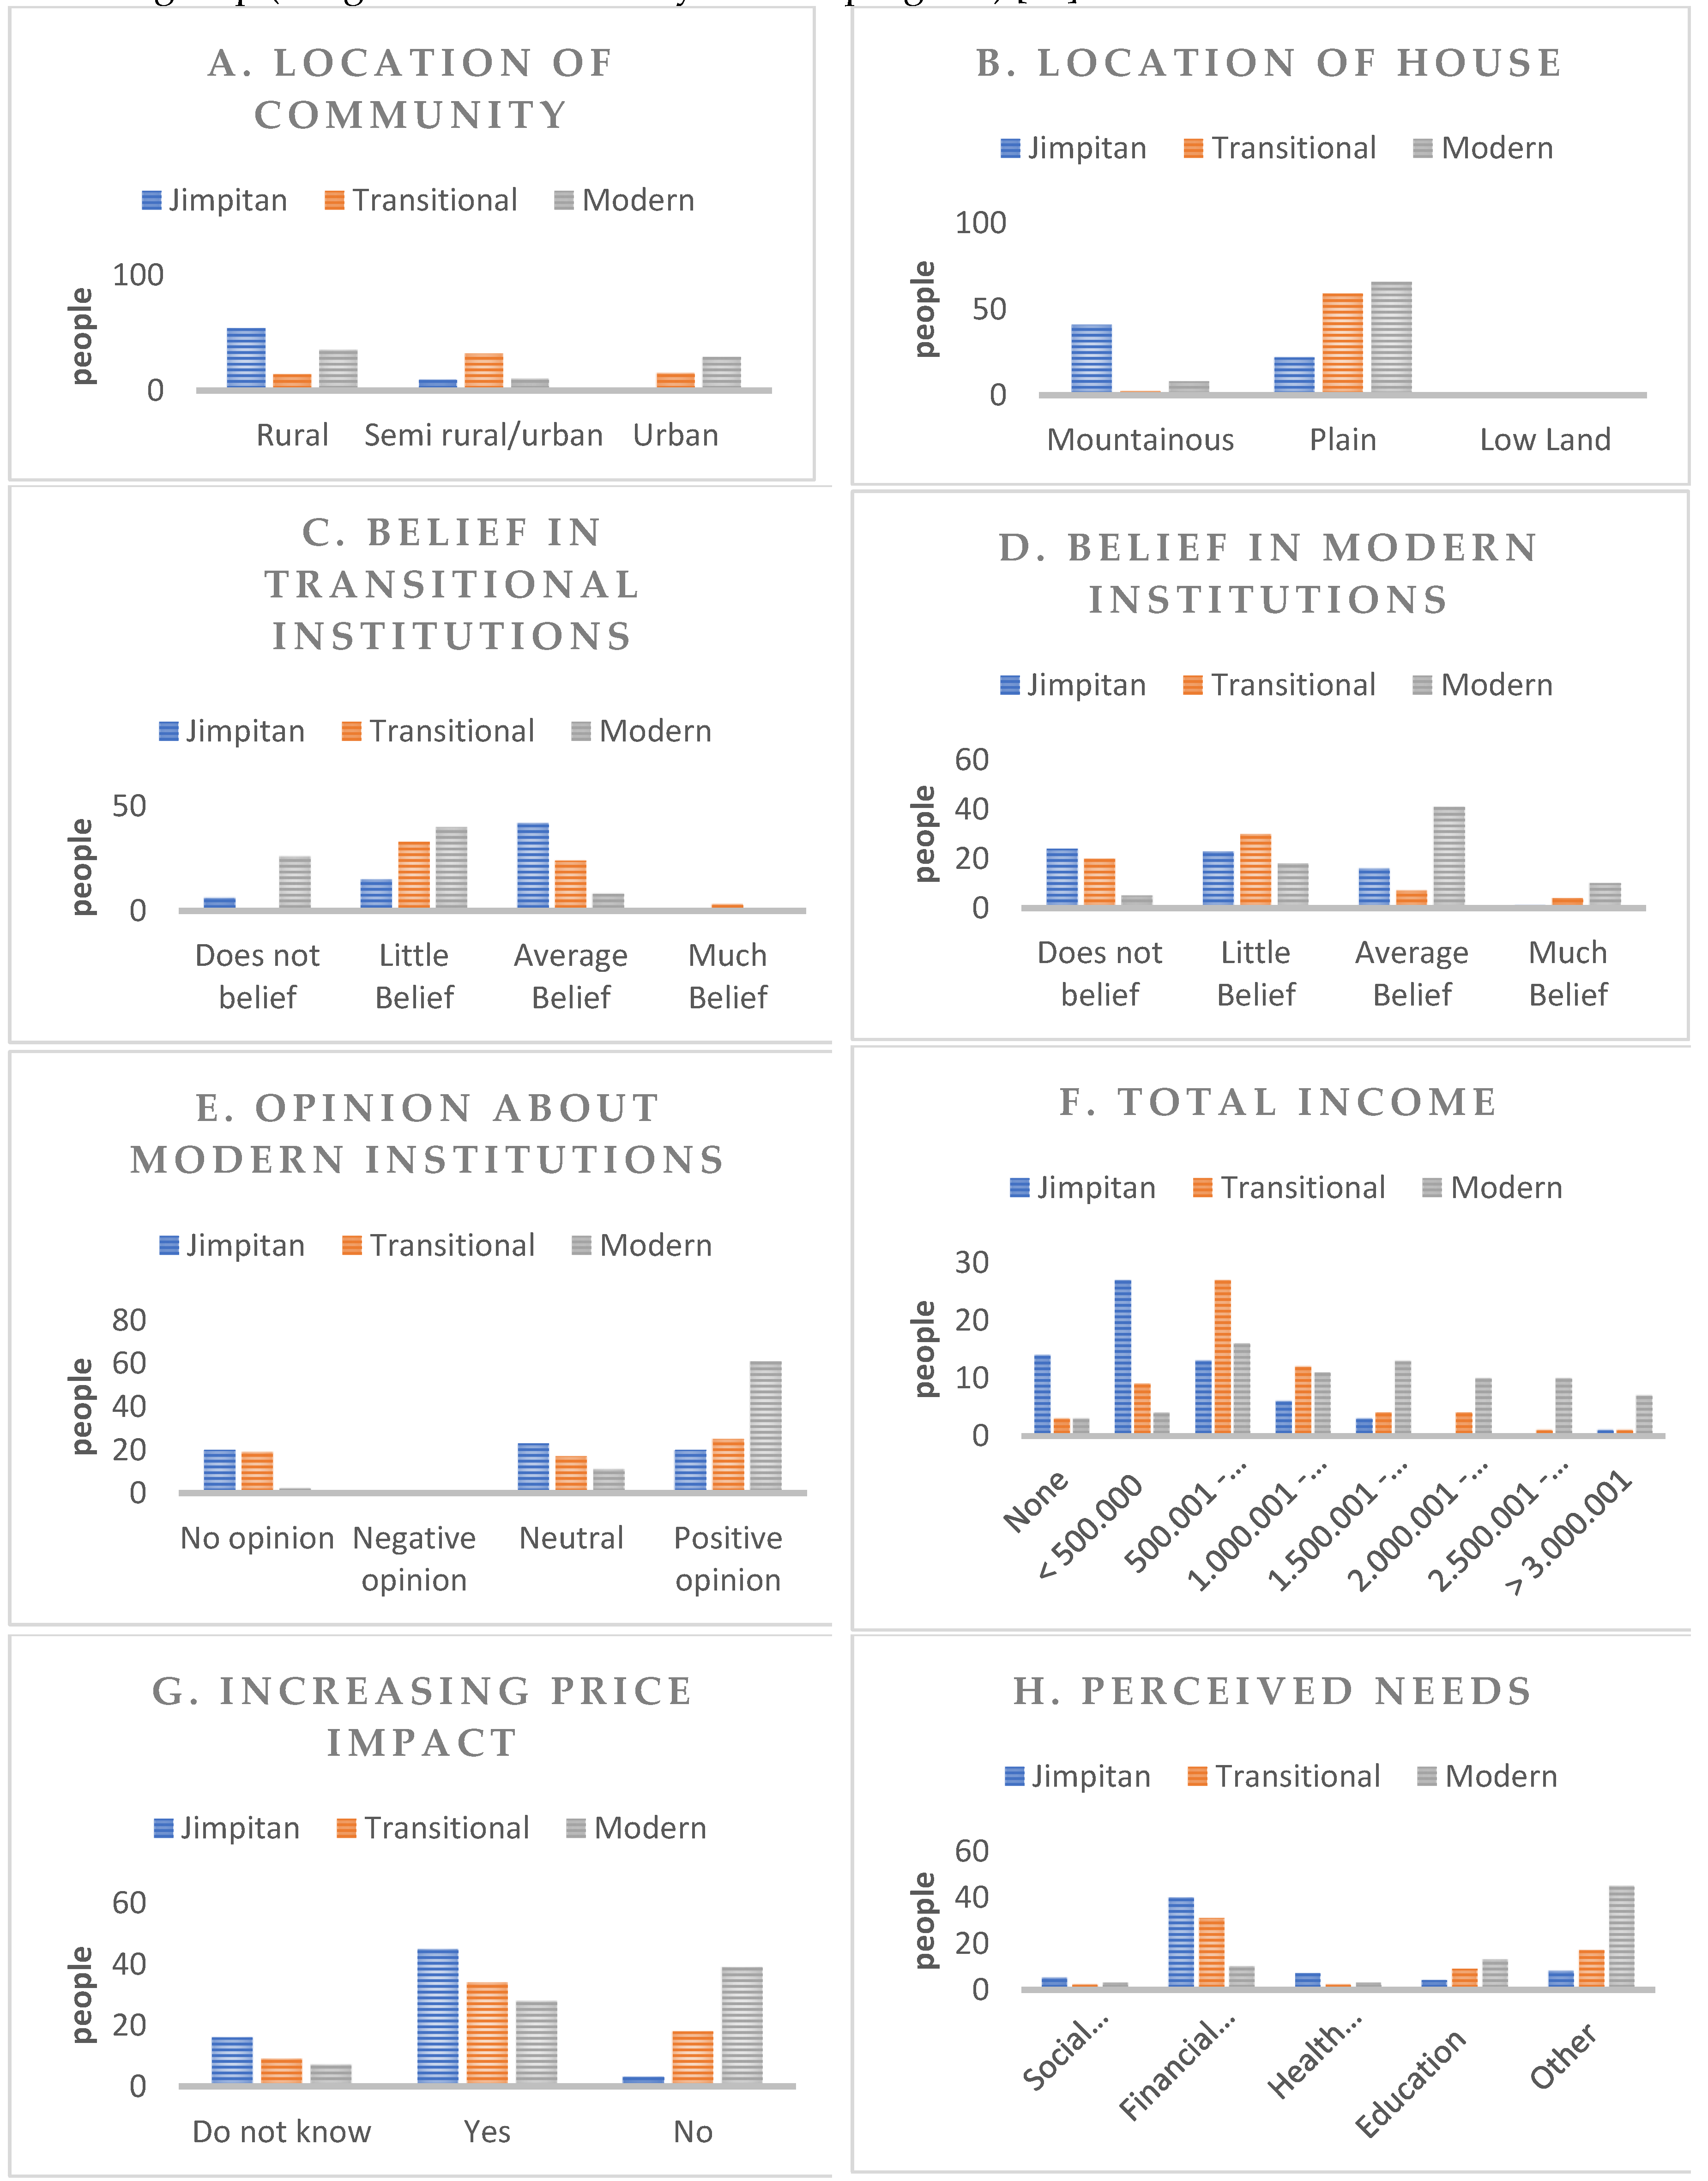
4.1. General Results

In times of need, 64 out of 199 respondents preferred the traditional/indigenous institution jimpitan, 61 made use of transitional institutions, and the rest 74, choose for modern institutions. Most of the respondents who were interviewed reside in the rural area, and most of them preferred the indigenous institution jimpitan. In urban areas, the number of banks available is higher than in the rural area, which enables the people who live in an urban area to make use of the modern institutions (Figure 4.A). Regarding the location of the house, most of the respondents who live in the plain area choose modern institutions. The respondents who live in mountainous areas mostly chose indigenous institution jimpitan (Figure 4.B).

4.2. The importance of variables for prediction institutions’ utilization

The Random Forest approach showed that 22 out of 26 variables had non-zero importance. This means that they really explain the utilization of community institutions. The top-eight variables, i.e., the variables with an importance that lied above the average, are location community, location house, belief in transitional institutions, belief in modern institutions, opinion about modern institutions, total income, increasing price impact, and perceived needs. The location of the community (LOCCOM) is divided into rural, semi rural/urban, and urban (Figure 4.A). The location of the house is classified into mountain, plain, and low land (Figure 4.B). The location is an important variable for determining the choice made by the respondent about the utilization of community institutions, it might be due to the availability of the institutions in their area.
The high importance value of subjective elements of psycho-social category (BELTRANS, BELBANK, OPBANK) shows that the utilization of community institutions by the local people is explained by some psycho-social variables, but the psycho-social category as a whole is not very important. Two aspects of culture, according to Matsumoto [39] are (a) objective elements, the physical manifestations of culture, and (b) subjective elements, the intangible aspects such as social norms, customs, attitudes, and values. The latter are differentiated in two ways, (i) by the domain which refers to socio-psychological traits as products of culture, eg. attitudes, values, beliefs, opinions, norms, customs and rituals; and (ii) by the dimension which refers to things which influence behavior and describes aspects of cultural variability. Most of the respondents who reported to have little belief in transitional institutions choose modern institutions more than transitional institutions (Figure 4.C). This could be because when someone does not put trust on the institutions that much she/he will tend not to choose these institutions. The respondents who have average belief in transitional institutions prefer indigenous institution jimpitan over transitional institutions. Only four respondents out of 199 reported to have much belief in transitional institutions, and three of them, indeed, choose the transitional institutions.
The belief in and opinion about modern institutions of the banks (BELBANK and OPBANK) exhibit a coherent outcome where the respondents who have much belief in and positive opinion about banks tend to utilize modern banking institutions. Those who reported to have an average belief in modern institutions choose modern institutions, and those who have much belief in modern institutions, also utilize them. Out of those who have no belief in modern institutions, only five prefer modern institutions, and more than half prefer the indigenous institution jimpitan (Figure 4.D). Related to the opinion on modern institutions, most respondents who have a positive opinion on modern banking institutions prefer bank over two other institutions. Those who reported to have no opinion on modern institutions prefer to go to the indigenous institution jimpitan (Figure 4.E). The behavior is the result of the norms, attitudes, beliefs and opinion/values that constitutes their cognitive part of social capital [40].
The total income explained the utilization of community institutions as well (Figure 4.F). The respondents who reported to have a monthly income of less than IDR 500,000 (more or less 32 euros, 2023) are the ones who choose to prefer jimpitan. It is common that in order to get a loan from the saving and loan program of jimpitan, the local people need no massive amount of money to pay the interest rate. Therefore, the respondents feel safer to get assistance from jimpitan rather than from another source of finance, ie. the local banks which require a higher interest rate. Moreover, the elderly and the orphan get help at no cost since it is given in the form of aid [30]. Of the respondents who reported having a monthly income between IDR 2,500,000 (more or less 155 Euro, 2023) and IDR 3,000,000 (more or less 186 Euro, 2023), none choose to go to the indigenous institution jimpitan. All of them choose the modern banks.
Income (Figure 4.F) and expenditure are two variables which measure the enabling variable which will allow or impede someone to possess something. As aptly put by Beard [41], most of the community development efforts acquire households to contribute or to give resources to accept goods and services, thereupon their socio-economic status usually mediates the participation from households. According to Marsh and Djankov et al. [42,43], the decision of going to a modern commercial bank to get a loan will not be made by the poor, since they possess inadequate material to be used by them as collateral; they are also reluctant to take the risks. They consider that the costs of getting a loan exceed the benefits. Those reasons are associated with the socio-economic status of a household, eg. the higher the income, the more money or assets which can be used as collateral.
Regarding the impact of increasing price toward utilization of community institutions (Figure 4.G), the respondents who utilize indigenous institution jimpitan reported to have been most affected by it. This is plausible because the money they get from jimpitan is not as much as the money they get from the other two types of institutions, therefore if there is an increasing price they are the ones who will get most affected.
The perceived need for satisfaction with financial services measures the cognitive aspects which relate to the systems of knowledge, belief and opinion (Figure 4.H). It is measured by five categories, i.e., social responsibility, financial support, health care, education, and other. Most of the respondents who reported to utilize the jimpitan perceived their needs as financial needs, either to buy staple food, to take a loan from jimpitan, but mostly to meet the daily needs (pers. comm) [30]. As a staple food and primary need, the need for rice should be immediately fulfilled. Therefore, at the beginning of the development of jimpitan, its purpose was to overcome the shortage of rice. It was mainly allocated for disabled people, widows with many children, those suffering long-lasting illnesses, although since then the rice was mostly replaced by money. This jimpitan was mainly organised by PKK women’s group (the government’s family welfare program) [13].
Nowadays, jimpitan is collected and shared for loans, for example, like in Sojokerto, people tend to take the loans to repair or renovate their homes or to pay the school fees of their children. Even in Ngedok, Wonosobo Barat village, they use the money to buy uniforms for their small PKK women’s group to be used whenever they have a regular meeting or to finance their vacation. As Kendal et al. [44] write that most of the poor people do most of their saving through informal financial institutions, whose significant advantages, unlike in the formal one, are the short distance they might have to go to reach them and the modest cost that will be charged. Four variables that have no predictive power for the utilization of available institutions/organizations are place of birth, ethnicity, religion, and knowledge about modern organizations (Figure 2). In this study, all respondents are homogenous in terms of ethnicity and religion. They are all Javanese and adhere Islam. Therefore, those two variables explain nothing about the utilization of community institutions. Meanwhile, the quite unexpected result is the irrelevancy of knowledge about the modern institutions over the utilization of community institutions.

4.3. The average importance per variable category value

Location is the only category of variables that has an average importance value that is significantly higher than expected under randomization of the variables. The economic, the socio-demographic and the psycho-social categories, apparently, do not significantly influence the decision of the local people in using the community institutions. The location category consists of three variables, they are the location of the community, the location of the house and the nearest institutions. The former two have importance values above the average, unlike the last variable. As we can see from Figure 3.A, respondents in the rural area mostly prefer the indigenous institution jimpitan, those who live in semi urban/rural setting area prefer more transitional institutions, and those in urban area mostly prefer modern banks. In Figure 3.B, we can conclude that respondents who reside in the mountain area most likely choose the indigenous institution jimpitan, and there were more respondents who live in the plain area who prefer modern banks more than transitional institutions or the indigenous institution jimpitan.
Based on the field observation [30], this importance of location is supported by the availability of the community institutions in the research area. Those who reported to live at the mountain and rural areas tend to choose the indigenous institution jimpitan, meanwhile those who reside in urban areas prefer the modern institutions of banks. The number of banks available in urban area is higher than in the rural area. Therefore, the urban people have more preferences for the bank than the people who live in rural areas. Although some of the respondents who live in urban areas chose jimpitan, they use it differently. In rural areas, most of the respondents used the funds they got from jimpitan for basic needs’ fulfilment. In urban areas, they used it for secondary needs. Nevertheless, in both urban and rural area, the funds from jimpitan are used for helping the poor, especially the orphan and widows, and to finance various social activities within the neighbourhood, such as commemoration of independent day, or the national religious day. At the outset of its development, jimpitan was meant as a social fund for helping the poor.

5. Conclusion

The spatial location of the community is the most important factor according to the respondents in the utilization of community institutions. The urban respondents tend to prefer the modern or transitional institutions, meanwhile respondents who reside in the rural area tend to prefer the indigenous institutions jimpitan. Those who reside in a mountain area had preferences for the indigenous institution jimpitan more than the other two types of institutions. Those who live in the plain area preferred to go to the modern banks.
Jimpitan constitutes an activity of putting and collecting a small portion of rice or money conducted routinely by each member of community who resides in the same neighborhood. At its outset of development, jimpitan has been used among the low-income families for supporting the orphans and elderly by supplying free rice. Later on, its usage became varied such as supplying loan, accepting savings, providing funding for activities in the community, and preserving the tradition. In terms of saving and loans functions, particularly, it supported the livelihood of the members of the community. Field observation showed that the loan offered by the indigenous institutions jimpitan was used by those who have rather unstable income in order to meet daily needs such as buying staple foods. This institutions empowers and encourages local people to actively participate in decision making regarding their life. It creates social cohesion and a proof of the resourcefulness of local people in addressing their own problems. When the members of a community work together, this may stimulate local community development.
Development should takes both material and non-material (cultural) aspects into account with respect to the well-being of the people. Therefore, any social research discuss about community institutions should take not only the economic factor (eg. income, expenditure), but also the non-economic factor (eg. spatial location) into account. Development that has solely been focused on economic growth often disregarded the non-economic aspect of human well-being. Welfare is only measured by the monetary side. Thus, development program that do not take into account the culture of the local community may be ineffective in reducing poverty or inequality and reaching sustainable development.

References

  1. WCED. (1987). Our Common Future. . Oxford: Oxford University Press.
  2. Kohler, J. (2014). Globalisation and Sustainable Development: Case Study on International Transport and Sustainable Development. Journal of Environment & Development, 66–100.
  3. Barkemeyer, R. , Holt, D., Preuss, L., & Tsang, S. (2014). What happened to the development in ‘Sustainable Development?’. Sustainable Development, 15-32.
  4. De Graaf, H.J. , Musters, C.J.M., & ter Keurs, W.J. (1995). Sustainable Development: Looking for A New Strategies. Ecological Ecvonomics, 16 (1996), 205-216.
  5. Uphoff, N. (1992). Local Institutions and Participation for Sustainable Development. UN System Task Team on The Post-2015 UN Development Agenda, Thematic Think Piece.
  6. . Watson, E. (2003). Examining the Potential of Indigenous Institutions for Development: A Perspective from Borana, Ethiopia. Development Change, 287-310.
  7. . Whyte, K.P. (2013). On the Role of Traditional Ecological Knowledge as A Collaborative Concept: A Philosophical Study. Ecological Processes, 1-12.
  8. FAO. (2009). Pro-Poor Policy Options: Empowering Indigenous Institutions in Indonesia. Retrieved from https://www.fao.org/documents/card/en/c/b778a1b2-13ef-4232-91e9-a1aa227fc2f9/.
  9. Szirmai, A. (2015). Socio-Economic Development (2nd ed). Cambridge: Cambridge University Press.
  10. . Shohibussirri, M. (2014). Gotong Rotong and Sambatan: Analysis and Comparison of Indonesian and Javanese Cultural Keyword Using NSM. Working Paper ANU, 1-25.
  11. . Bowen, J.R. (1986). On the Political Construction of Tradition: Gotong Royong in Indonesia. The Journal of Asian Studies, 545-561.
  12. . Nugroho, H. (2004). Memerangi Delegitimasi Institusi Lokal. Jurnal Pembangunan Pedesaan, 173-186.
  13. Mukherjee, N. (1999). Consultation With the Poor in Indonesia. Washington: The World Bank.
  14. Farasonalia, R. (2020). Hadapi Corona, Ganjar minta Desa Hidupkan Lagi Tradisi Jimpitan Untuk Lumbung Pangan. Retrieved from https://regional.kompas.com/read/2020/04/02/23161761/hadapi-corona-ganjar-minta-desa-hidupkan-lagi-tradisi-jimpitan-untuk-lumbung?lgn_method=google.
  15. Humas jateng. (2020). Warga Perumahan SUPM Tegal Wujudkan Program Jogo Tonggo. Retrieved from https://humas.jatengprov.go.id/detail_berita_gubernur?id=4294.
  16. Lont, H. (2005). Juggling Money: Financial Self-Help Organizations and Social Security in Yogyakarta. Leiden: KITLV Press.
  17. FAO. (2004). Statement on the Official Lunch: The International Year of Rice. Retrieved from https://www.fao.org/3/Y5167E/y5167e02.htm.
  18. Rusnandar, N. (2016). Beas Perelek: Pemberdayaan Masyarakat di Kabupaten Purwakarta. Patanjala Journal, 301-316.
  19. Saefullah, K. (2019). Gintingan in Subang: An Indigenous Institution for Sustainable Community-Based Development in the Sunda Region of West Java, Indonesia. Leiden: Leiden University.
  20. Yulhendri. , Kurniawati, T. & Susanti, N. (2018). Strategi Investasi Pada Rumah Tangga Petanu Tradisional di Kecamatan Mapattungul Selatan. ( 2018). Strategi Investasi Pada Rumah Tangga Petanu Tradisional di Kecamatan Mapattungul Selatan. Jurnal Ekonomi Pendidikan dan Kewirausahaan, 15–30.
  21. Esiobu, N.S. , Nkete, G.A., Ejiougu, A.O., & Onubuogu, G.C. (2015). Analysis of Use of Ajo in Financing Cassava Production in Aniocha North Local Government of Delta State, Nigeria. C. ( Investment and Development, 1–21.
  22. Aredo, D. (1993). The Iddir: A Study of an Indigenous Informal Financial Institution in Ethiopia. Savings and Development, 77-90.
  23. Ang, G, R. (1979). The Bayanihan Spirit: Dead or Alive? Philippine Quarterly of Culture and Society, 91-93.
  24. Ealdama, Y. (2012). Bayanihan: The Indigenous Philipino Strengths Perspective. International Conference on Strengths-Based Practice in Social Work and Human Services (pp. 1-13). Kathmandu: University of Philipine.
  25. Seibel, H.D. (2001). Mainstreaming Informal Financial Institutions. Journal of Developmental Entrepreneurship, 83-95.
  26. Aliber, M. (2015). The Importance of Informal Finance in Promoting Decent Work Among Informal Operators: A Comparative Study of Uganda and India. Working Paper ILO, 11-30.
  27. Yami, M. , Vogl, C, & Hausera, M. (2009). Comparing The Effectiveness of Informal and Formal Institutions in Sustainable Common Pool Resources Management in Sub-Saharan Africa. Conservation & Society, Vol. 7, No.
  28. World Bank. (2009). Improving Access to Financial Services in Indonesia. New York: World Bank.
  29. Jayanti, A.D. , Agusti, K.S. & Setyawati, Y. (2021). Barriers to Access Formal Financial Services: An Empirical Study from Indonesia. Journal of Asian Finance, Economics, and Business, 97-106.
  30. Swaningrum, A. (2023). Jimpitan in Wonosobo, Central Java: An Indigenous Institutions in the Context of Sustainable Socio-Economic Development in Indonesia. Leiden: Leiden University.
  31. (1999). Ethnoscience, ‘TEK’ and its Application to Conservation. In: D.A. Posey (Ed.), Cultural and Spiritual Values of Biodiversity: A Complementary Contribution to the Global Biodiversity Assessment (pp. 196-177). London/Nairobi: Intermediate Technology Publications.
  32. Musters, C.J.M. & van Bodegom, P.M. (2018). Analysis of Species Attributes to Determine Dominant Environmental Drivers, Ilustrated by Species Decline in the Netherlands since the 1950s. Biological Conversation, 68-77.
  33. Breiman, L. (2001). Random Forests. Machine Learning, 5-32.
  34. Cutler, A. , Cutler, D.R. & Stevens, J.R. (2012). Random Forest. In Ensemble machine learning (pp. 157-175). S: New York.
  35. Strobl, C. , Malley, J. & Tutz, G. (2009). An Introduction to Recursive Partitioning: Rationale, Application and Characteristics of Classification and Regression Trees, Bagging and Random Forests. . Psychol Methods, 323-348.
  36. Hothorn, T. , Hornik, K., & Zeileis, A. (2006). Unbiased Recursive Partitioning:A Conditional Inference Framework. Journal of Computational and Graphical Statiztics, 15(3), page 651-674.
  37. Zeileis, A. , Hothorn, T., & Hornik, K. (2008). Model-Based Recursive Partitioning. Journal of Computational and Graphical Statistics, 17(2), 492-514.
  38. Kassambara, A. (2023). Rstatix: Pipe-Friendly Framework for Basic Statistical Tests. Computer Science.
  39. Matsumoto, D. Culture and Psychology: People Around the World. 2nd ed. Wadsworth: Marceline.
  40. Uphoff, N. (2000). Understanding Social Capital: Learning from The Analysis and Experience of Participation. In: Dasgupta, P. & Serageldin, I (ed.). Social Capital: A multifaceted Perspectives on Development Series (pp. 173-215). Washington D.C: World Bank.
  41. Beard, V.A. (2007). Household Contribution to Community Development in Indonesia. World Development, 607–625.
  42. Marsh, R. (2003). Working With Local Institutions to Support Sustainable Livelihoods. Rome: FAO.
  43. Djankov, S. Djankov, S., Miranda, P., Seira, E., & Sharma, S. (2008). Who Are the Unbanked?. Policy Research Working Paper.
  44. Kendall, J. Kendall, J., Mylenko, N., & Ponce, A. (2010). Measuring Financial Access Around the World. World Bank Policy Research Working Paper WPS 5253, 1-65.
Figure 1. Analytical Framework. Source: Adapted from Slikkerveer [31].
Preprints 142973 g001
Figure 2. The importance value of 26 variables.
Preprints 142973 g002
Figure 3. Average importance value per category of variables.
Preprints 142973 g003
Figure 4. Top-eight non-zero variables.
Preprints 142973 g004
Table 1. Distribution of households related to the geographical area.
Name of the village Type of area Geographic area of Wonosobo Number of households
Kejajar Highland/Rural Northern area 51
Kalibeber Lowland/Sub-urban Central area 50
Wonosobo Barat Lowland/Urban Central area 46
Sojokerto Lowland/Rural Western area 52
Total number of households 199
Table 2. Utilization of the community institutions in the four villages.
Village Utilization of the community institutions
Village Name Indigenous Transitional Modern Total
N % N % N % N
Kejajar 41 80.4 2 3.9 8 15.7 51
Kalibeber 9 18.0 31 62.0 10 20.0 50
Wonosobo Barat 1 2.2 16 34.8 29 63.0 46
Sojokerto 13 25.0 12 23.1 27 51.9 52
Total 64 32.2 61 30.6 74 37.2 199
Table 4. The Permutation Result of Four Categories.
Category 95 percentile n Mean Sign
Socio-Demography 0.013497 9 0.001094
Psycho-Social 0.012797 10 0.009814
Economic 0.017877 4 0.009062
Location 0.020554 3 0.023986 *
Disclaimer/Publisher’s Note: The statements, opinions and data contained in all publications are solely those of the individual author(s) and contributor(s) and not of MDPI and/or the editor(s). MDPI and/or the editor(s) disclaim responsibility for any injury to people or property resulting from any ideas, methods, instructions or products referred to in the content.
Copyright: This open access article is published under a Creative Commons CC BY 4.0 license, which permit the free download, distribution, and reuse, provided that the author and preprint are cited in any reuse.
Prerpints.org logo

Preprints.org is a free preprint server supported by MDPI in Basel, Switzerland.

Subscribe

Disclaimer

Terms of Use

Privacy Policy

Privacy Settings

© 2025 MDPI (Basel, Switzerland) unless otherwise stated