
Submitted:
13 December 2024
Posted:
16 December 2024
You are already at the latest version
Abstract
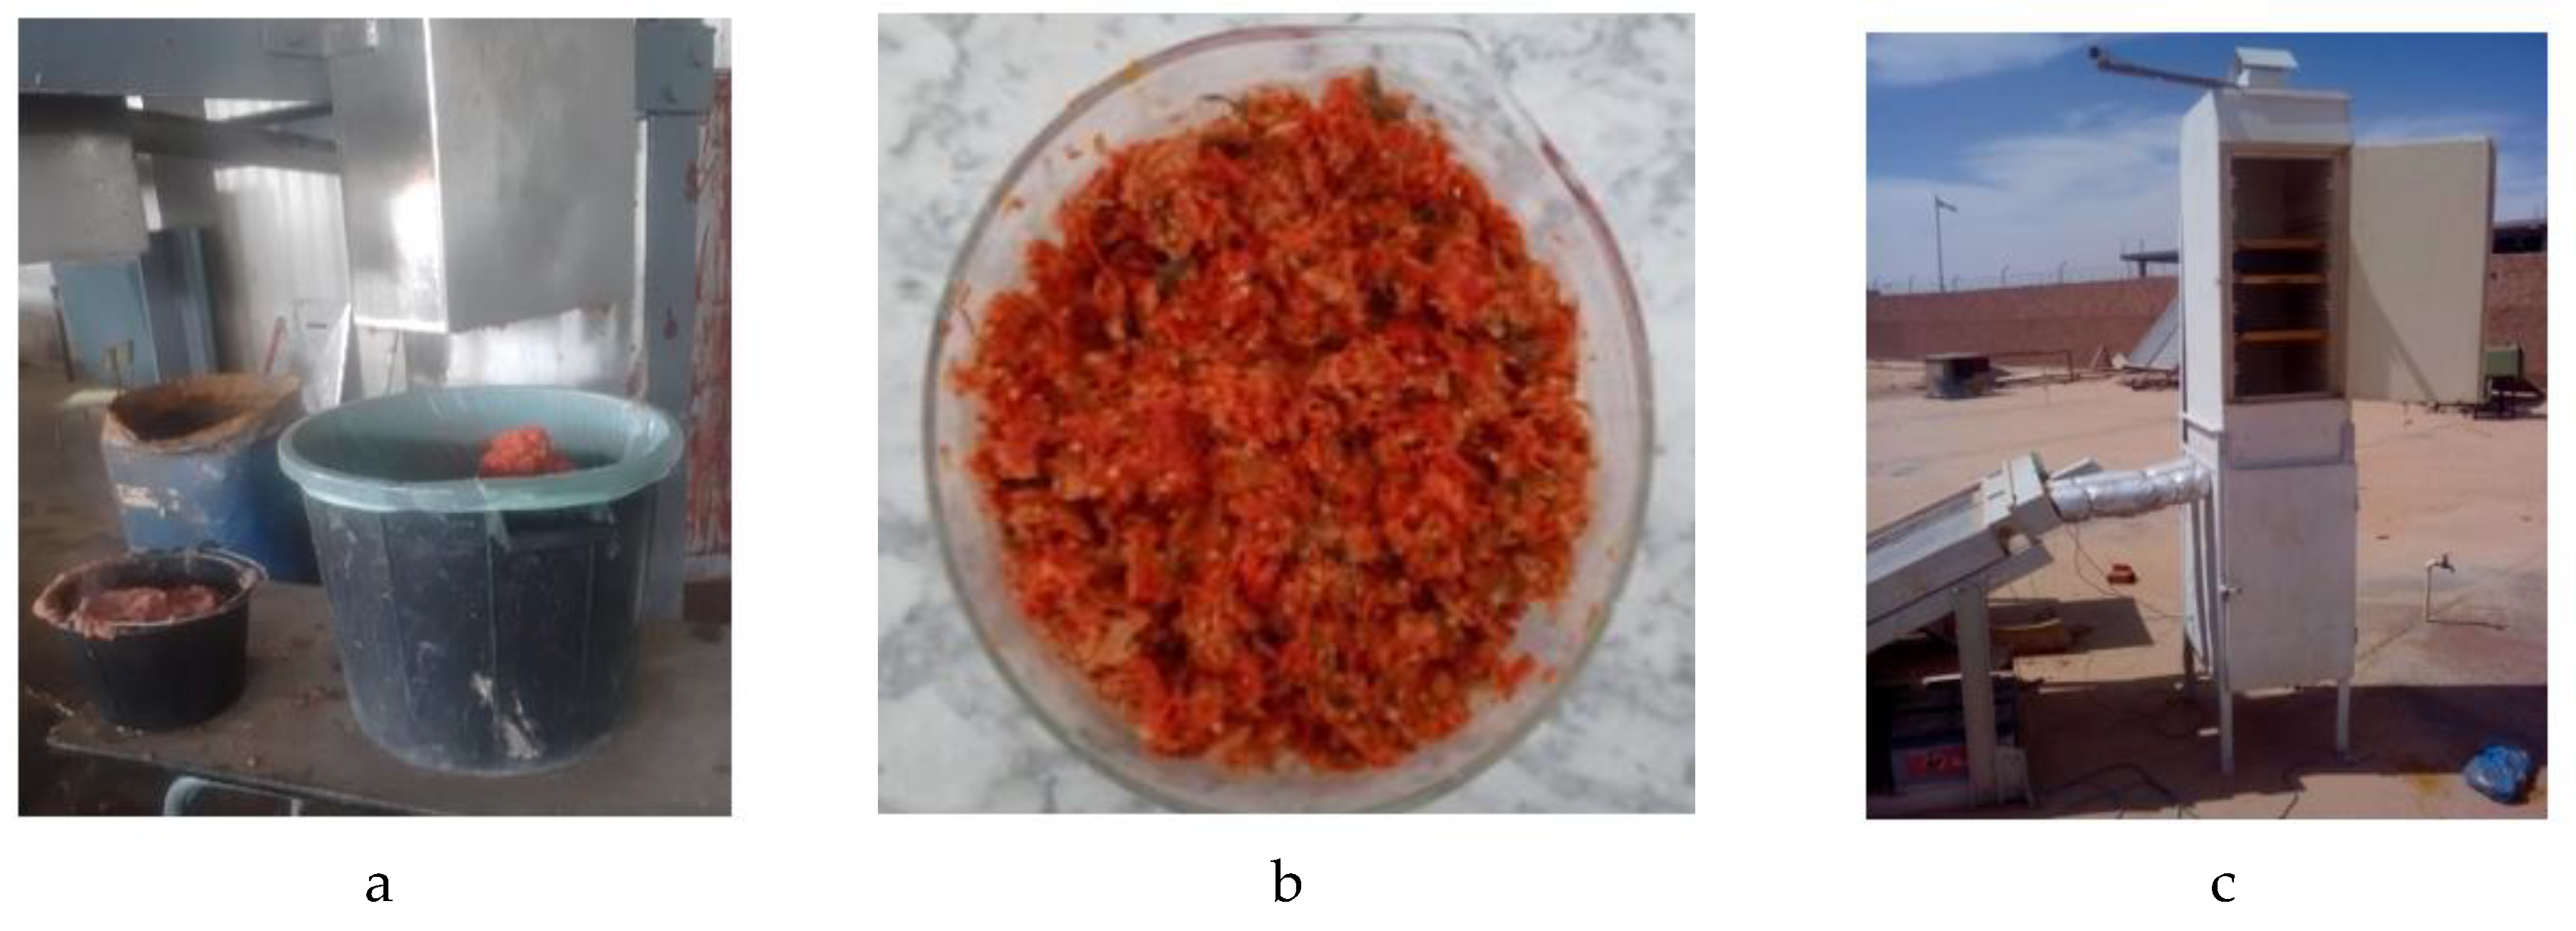
This research aims to promote bioethanol production for the first time from tomato waste (skins, pips and peels) generated by the "Fouggara" tomato canning factory in Réggane/Adrar, in South-West Algeria. The waste is thermally pre-treated, followed by chemical pre-treatment with sulphuric acid. This process is characterized by a drop in density from 1.14 to 1.03 kg/l accompanied by a significant release of carbon dioxide (CO2) during alcoholic fermentation. The produced CO2 mainly resulted by the glucose converting into ethanol followed by weight loss in the form of CO2. A decrease in reducing sugars from 5.24 to 2.02 mg/L was recorded at the end of fermentation. Bioethanol production reaches an alcohol content of 12° in 72 hours, with a density of 0.886 kg/L, close to that of commercial ethanol, which is 0.789 kg/L.
Keywords:
1. Introduction
1.1. Tomato Waste
1.2. State of the Art Alcoholic Fermentation
1.3. Alcoholic Fermentation Principles
1.4. Scope and Outline
2. Materials and Methods
2.1. The Substrate
2.2. Experimental Methodology for Alcoholic Fermentation
2.2.1. Samples Preparation
2.2.2. Substrate Pretreatment
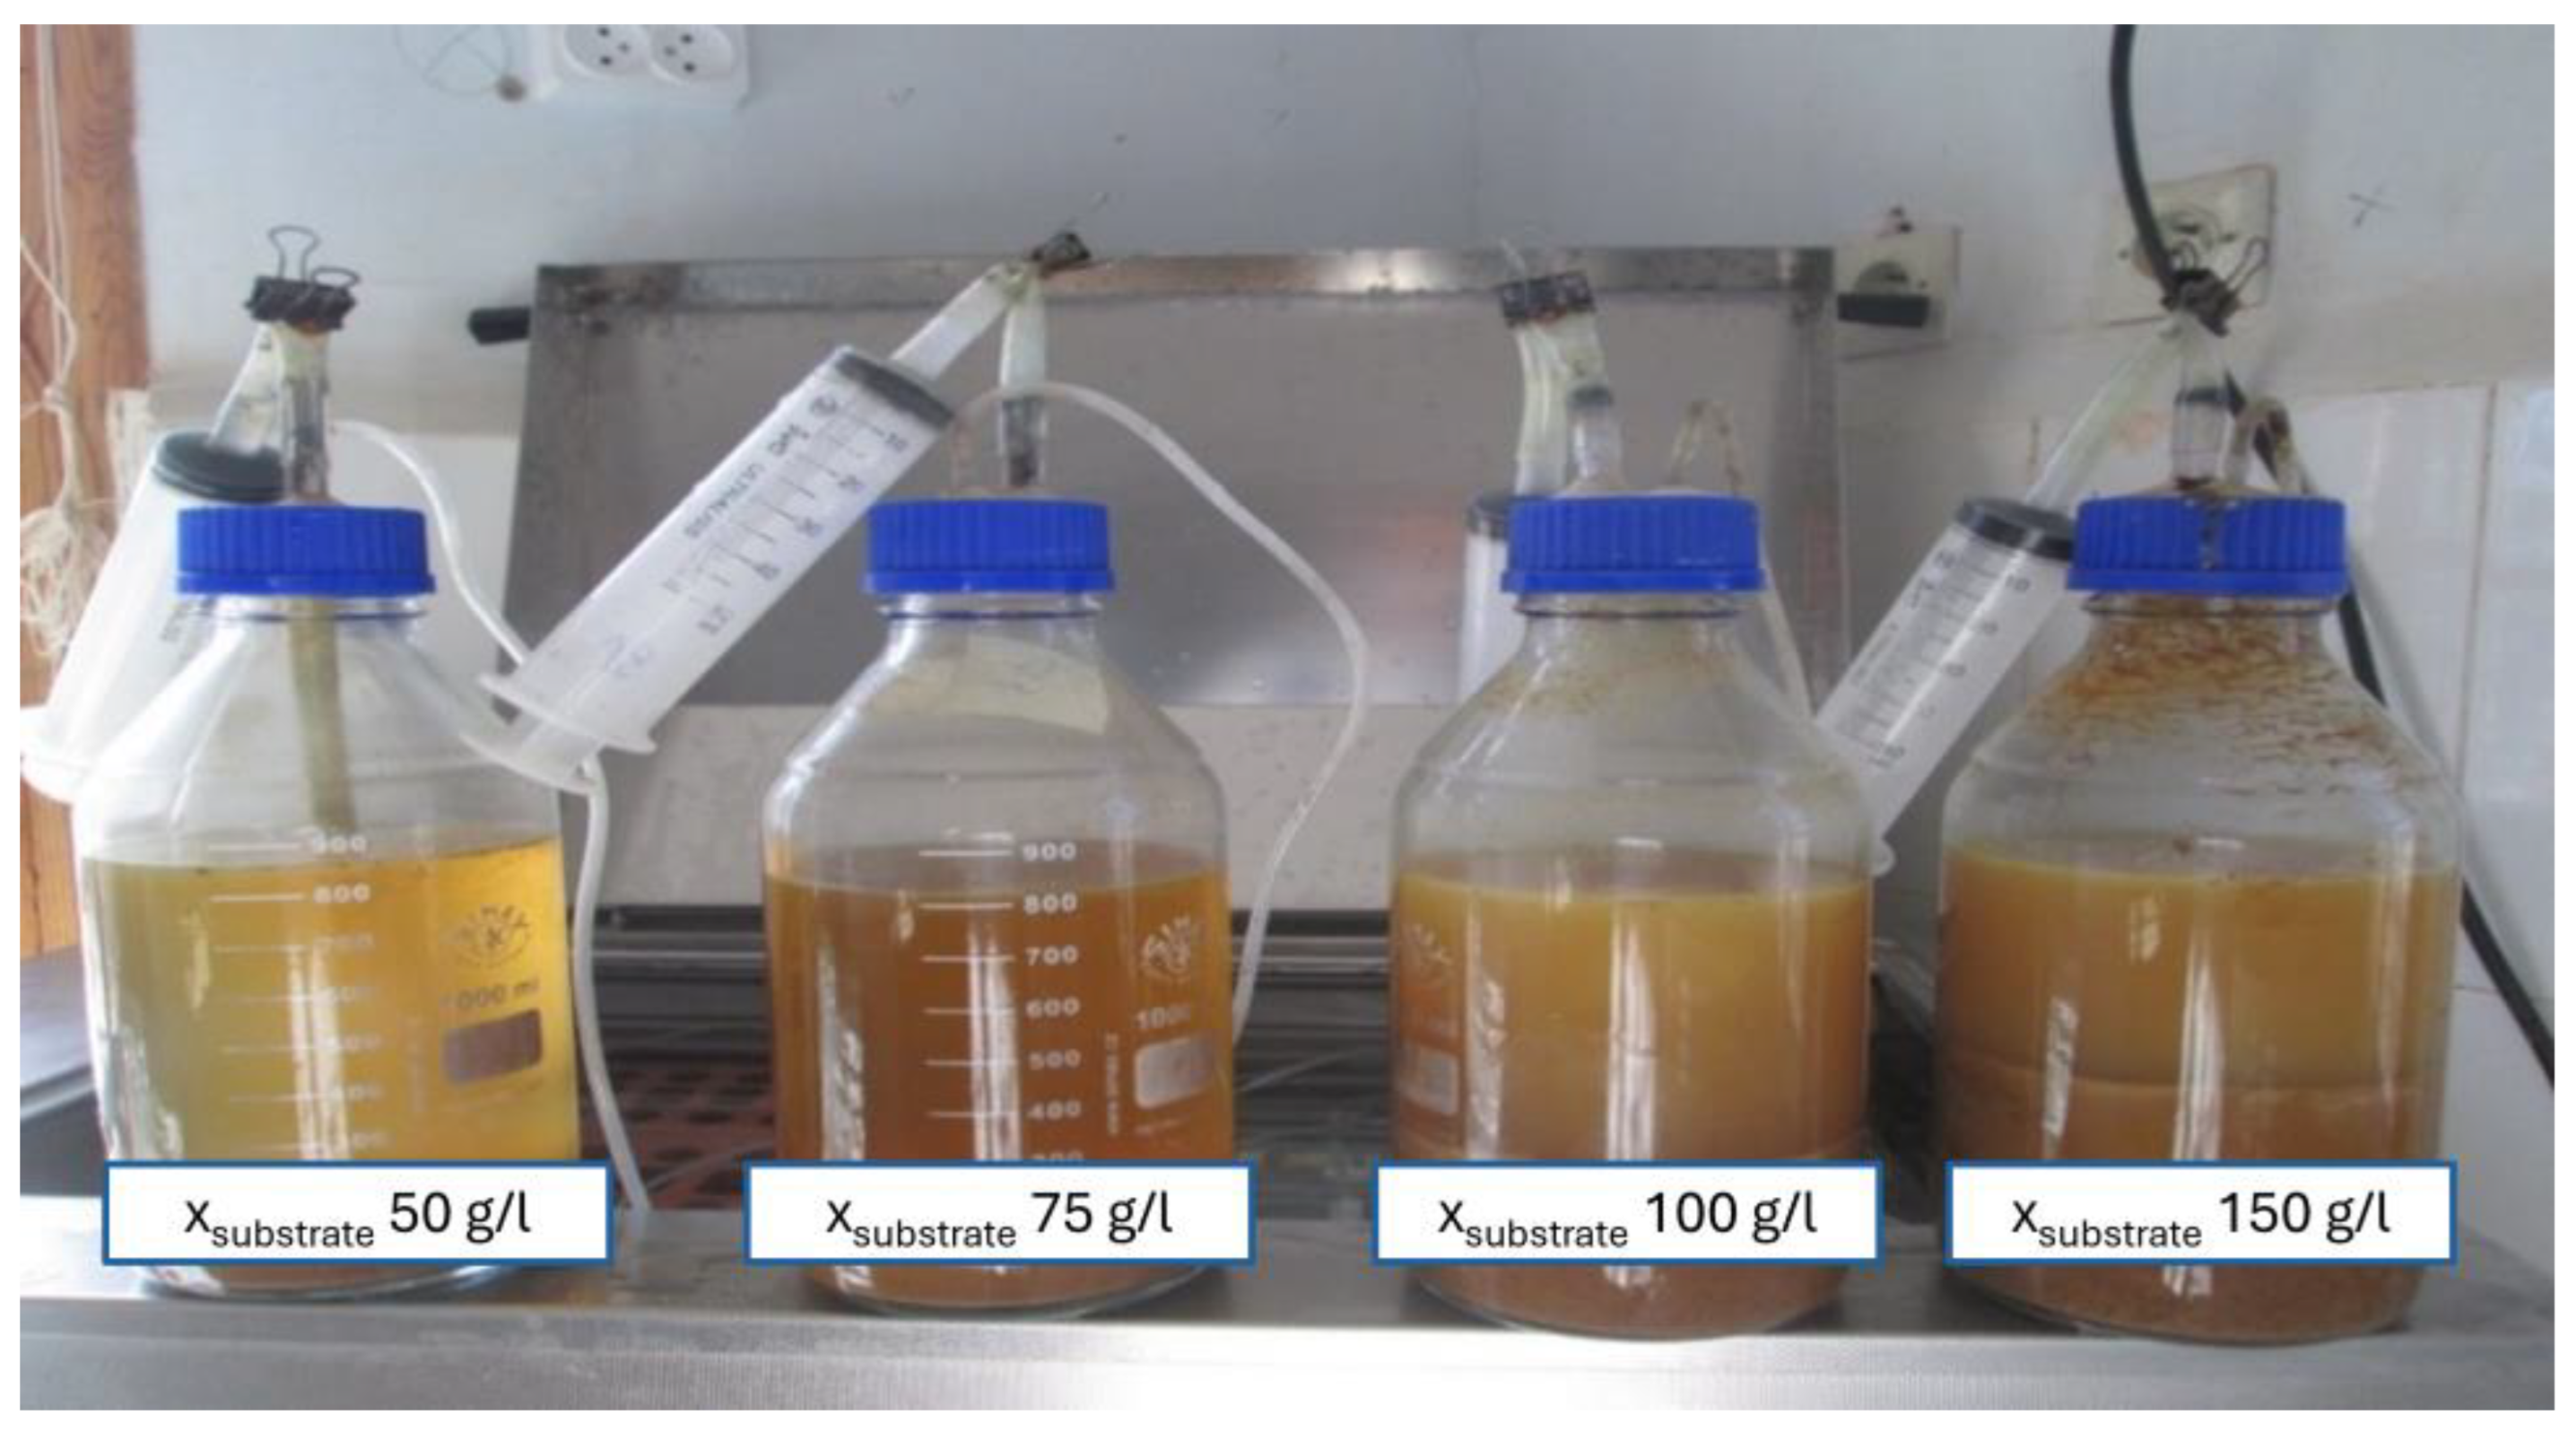
- Steam explosion: to initiate the experiment, the 4 bioreactors are filled with 35, 52.5, 70, and 105 g of substrate and topped up with tap water to reach a total volume of 700 mL. The mixture undergoes thermal pretreatment in an autoclave at 140 °C and 2.5 bar for 40 minutes with 3 depressurization cycles to ensure the effective cracking of lignocellulosic bonds.
- Acid hydrolysis: following steam explosion, concentrated sulfuric acid (H2SO4) is added to the bioreactors in an amount equivalent to 5% of the working volume (3.5 mL in 700 mL). The treated bioreactors are then reintroduced into the autoclave for 50 minutes at 90 °C to break polysaccharide bonds and produce monomers [37]. Subsequently, to eliminate phenolic compounds that inhibit microbial activity during fermentation, calcium hydroxide (Ca(OH)2) is added.
2.3. Alcoholic Fermentation and Distillation
2.4. Measurements: Targets and Equipment
- Ash: ash content represents the total mass of mineral salts present in a fruit is calculated according to the American Society for Testing and Materials' (ASTM) standard methodology ASTM-E-1755-01 (2020) (Oxidation at 575± 25 °C standard test method for ash in biomass) [40].
- Proteins: to assess the protein content, the total nitrogen content is determined. Nitrogen is essential for protein synthesis, which plays a role in transporting sugars into the cell during AF, where they are converted into bioethanol. The protein content is determined with the Kjeldahl method, which measures total nitrogen, essential for assessing protein content during fermentation processes [41].
- pH: it is determined with a pH meter (Mettler-Toledo AG, Analytical CH-8603 Schwerzenbach, Switzerland).
- Reducing sugars: the reducing sugars are measured as prescribed in the method of Dubois and Cool (1956) [42]
- Density Density measurements are performed at 20 °C by laboratory density meter based on oscillation (OIV-MA-AS2-01A:R2012)
- CO2: the volume of CO2 generated is measured using the liquid displacement method
- Refractive index: it is a dimensionless quantity characteristic of a medium, describing the behavior of light in that medium. An Abbé refractometer (Standard NF ISO 2173: 2003) is used to measure refractive index.
- Brix degree/soluble solids: the total soluble solids, expressed as °Brix %, are measured from homogeneous filtered fruit juice using an Abbé refractometer. (Standard NF ISO 2173: 2003).
- Alcohol content: an alcoholmeter with a range of 0-100° (standard OIV-MA-AS312-01A: R2009) is used to measure alcoholic content.
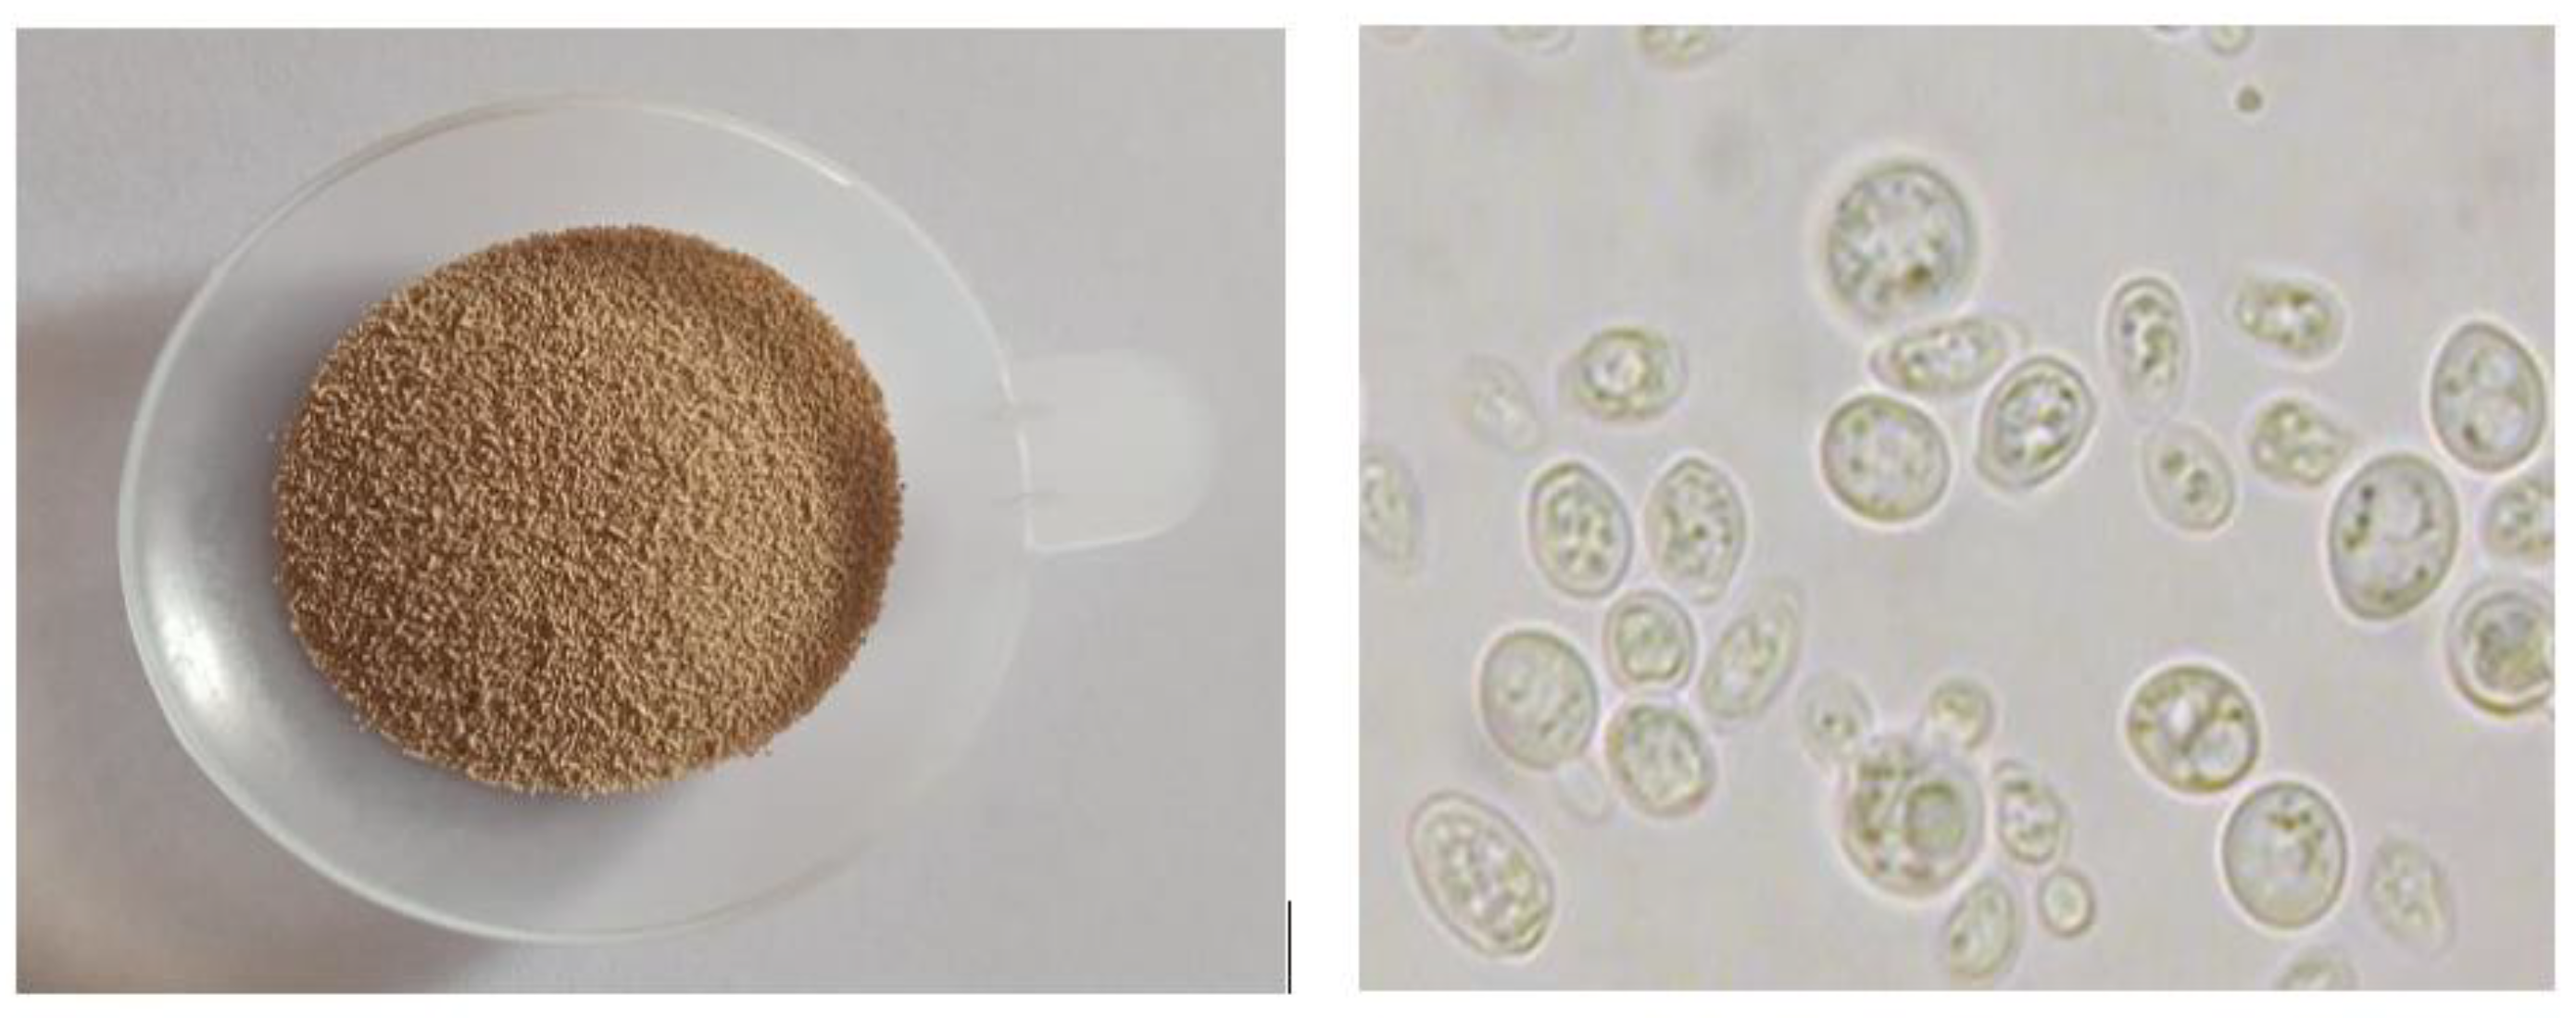
- Yeast evolution: yeast proliferation under a microscope over the course of 72 hours of fermentation is measured. The evolution of the yeast is monitored by hemocytometric counting (Malassez Cell) of the microbial population under an optical microscope type (OPTIKA B-350, G: 100×).
- For sampling from the flasks, as shown in Figure 3, there are 2 holes, one for CO2 removal and the other for sampling. The sample volume (after mixing and homogenization) does not exceed 3 mL, which has no influence on the total reactor volume.
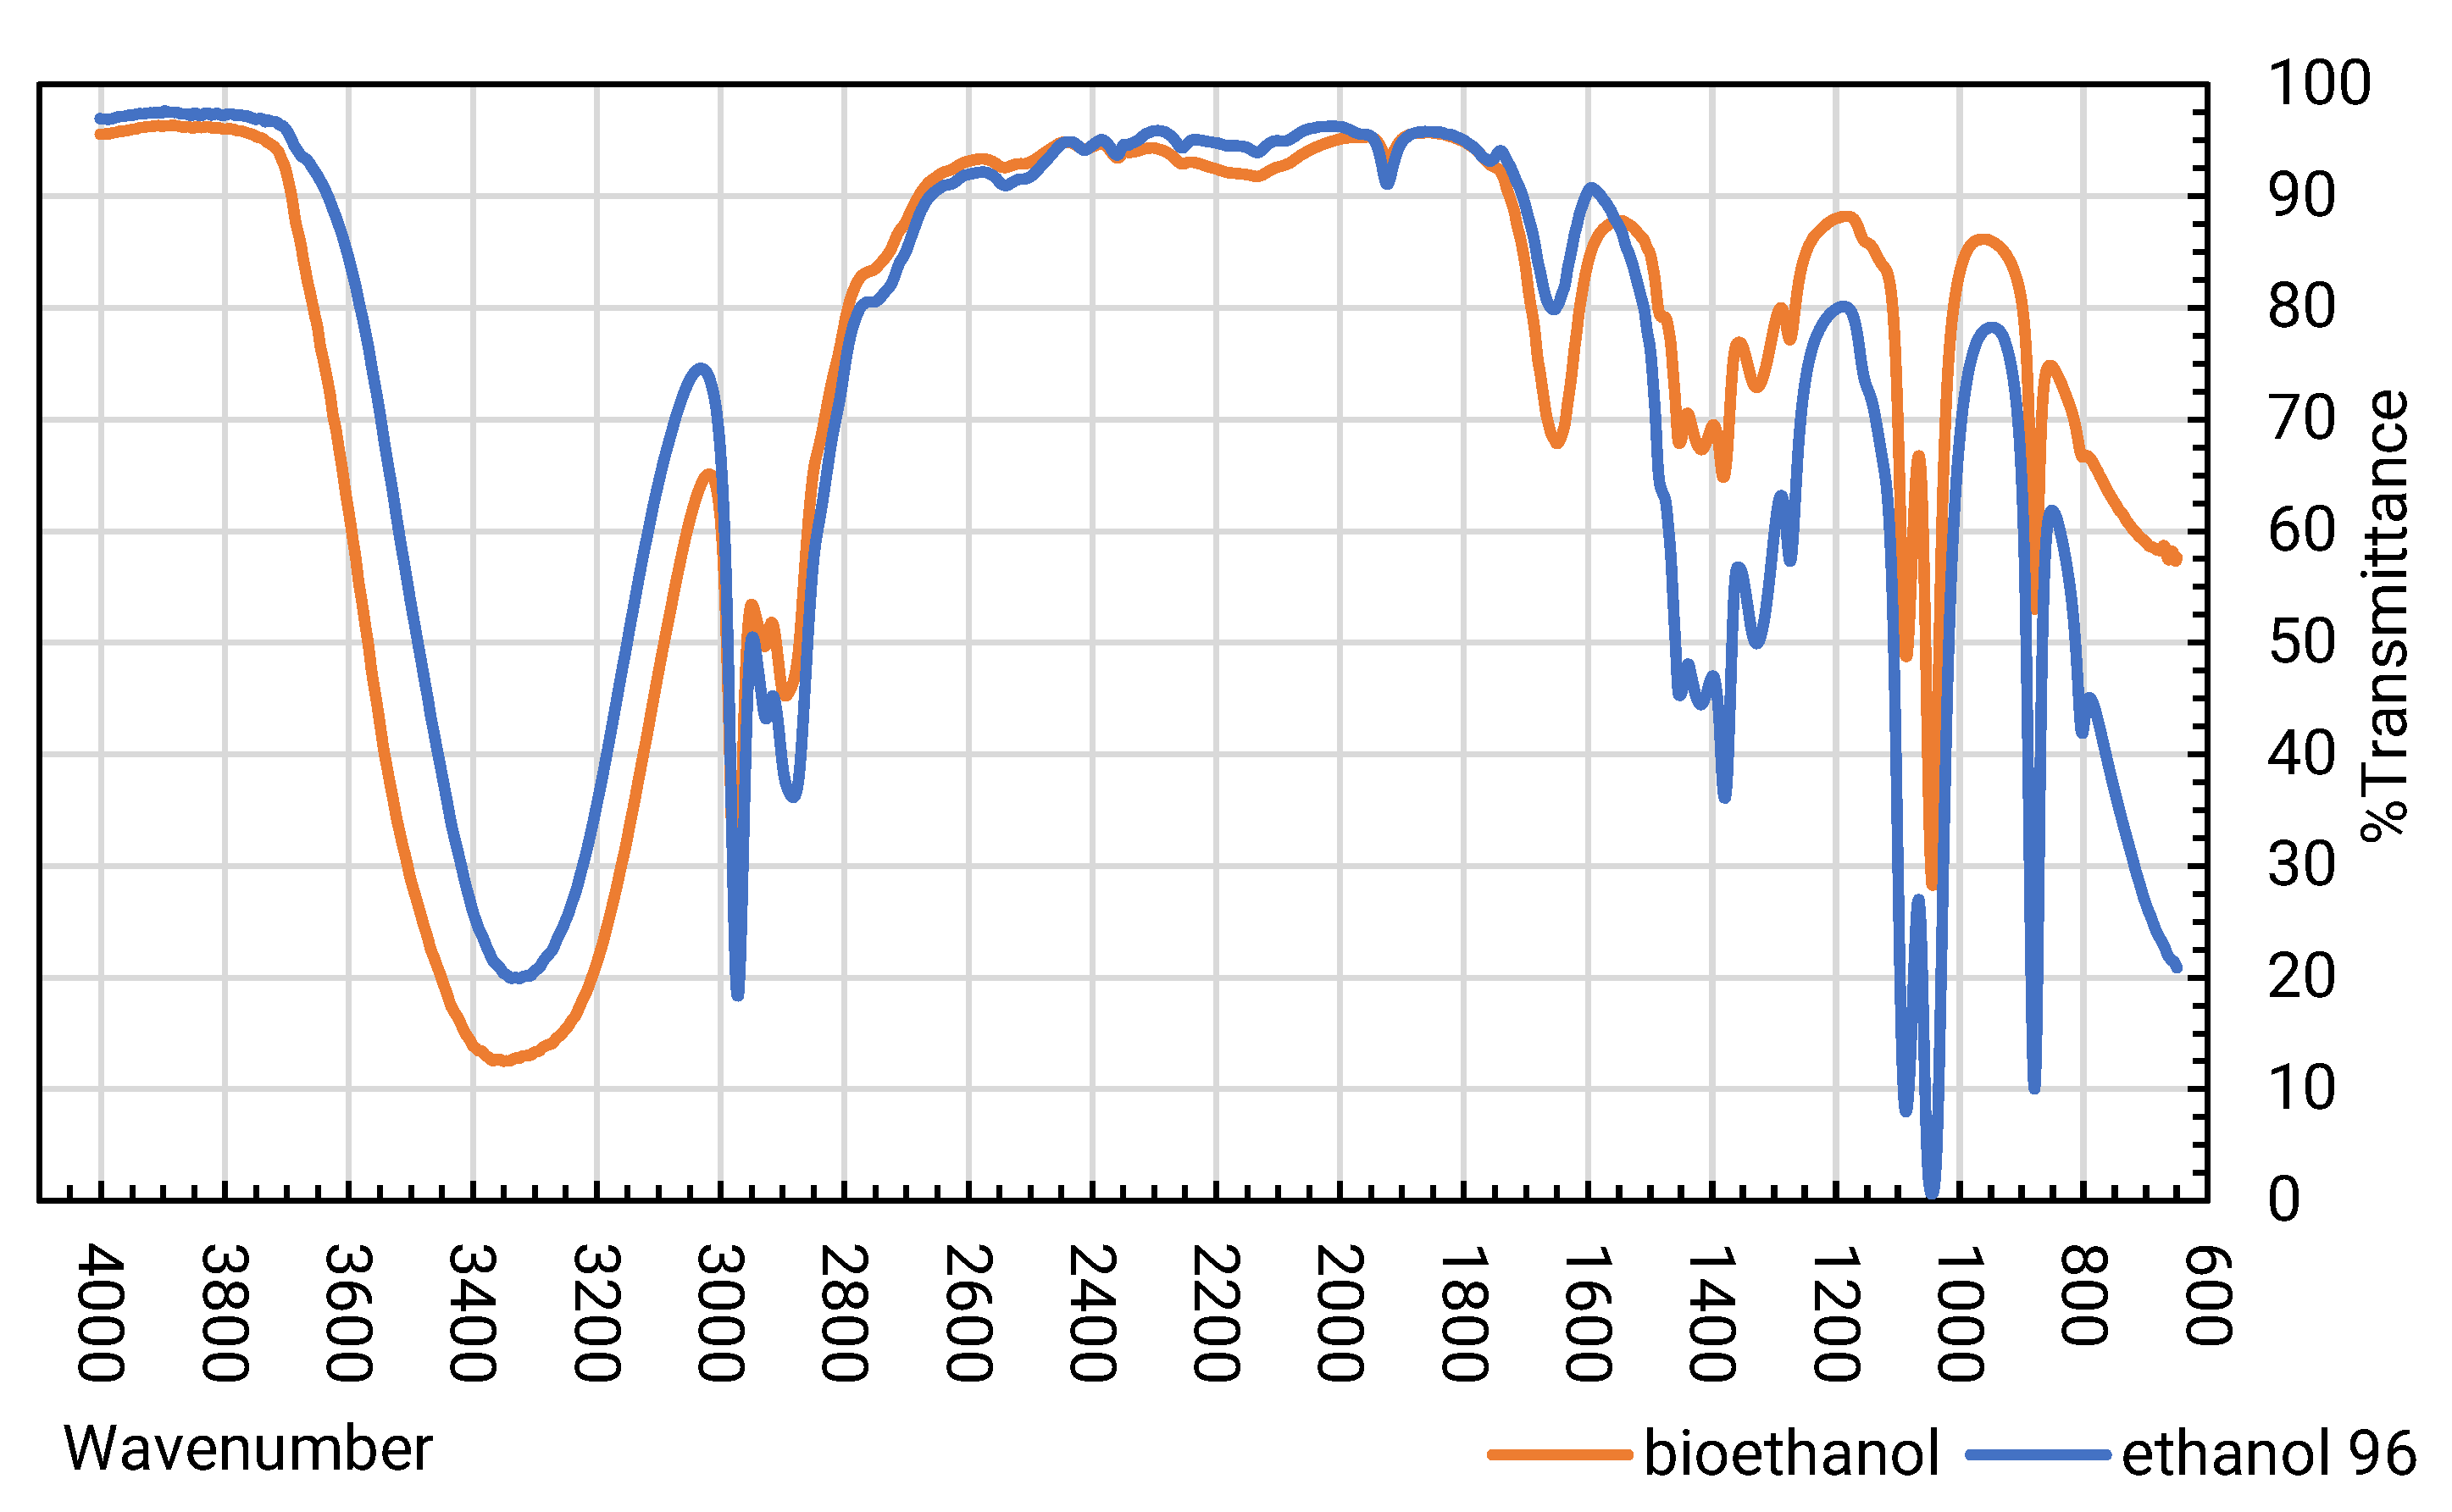
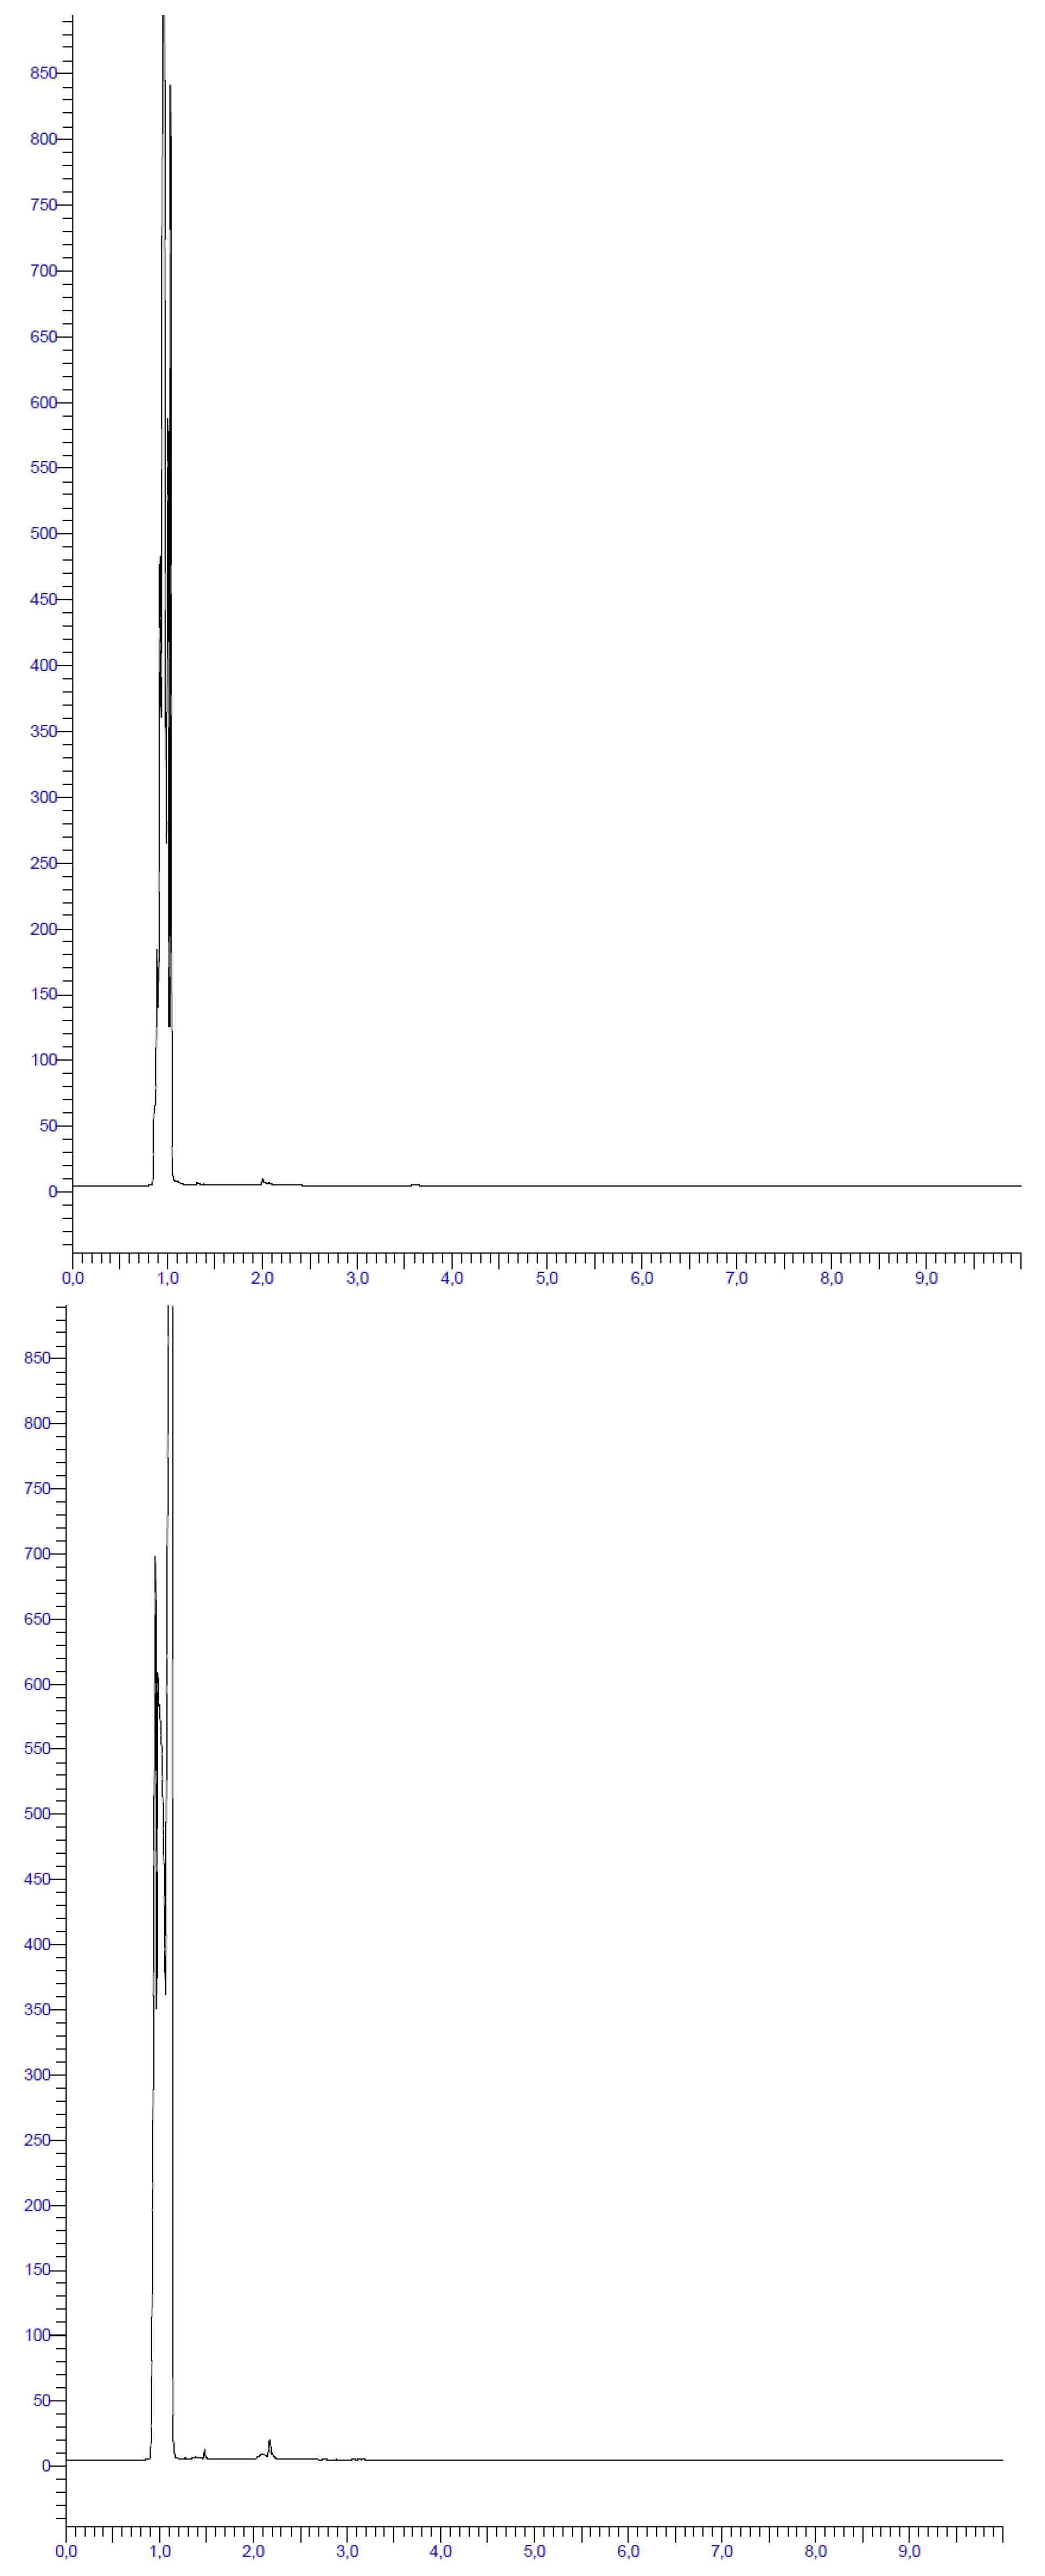
- Finally, bioethanol is characterized using Agilent Cary 660 Fourier Transform Infrared (FT-IR) infrared spectrometer. Chromatographic analyses were carried out on an electronically pressure-controlled PerkinElmer Gas Chromatography (GC) (Clarus 500 series). The instrument is controlled by a “Total Chrom Tutorial, version 6.3” computer system.
3. Results and Discussion
3.1. Fermentation Parameters
3.1.1. Ash Content
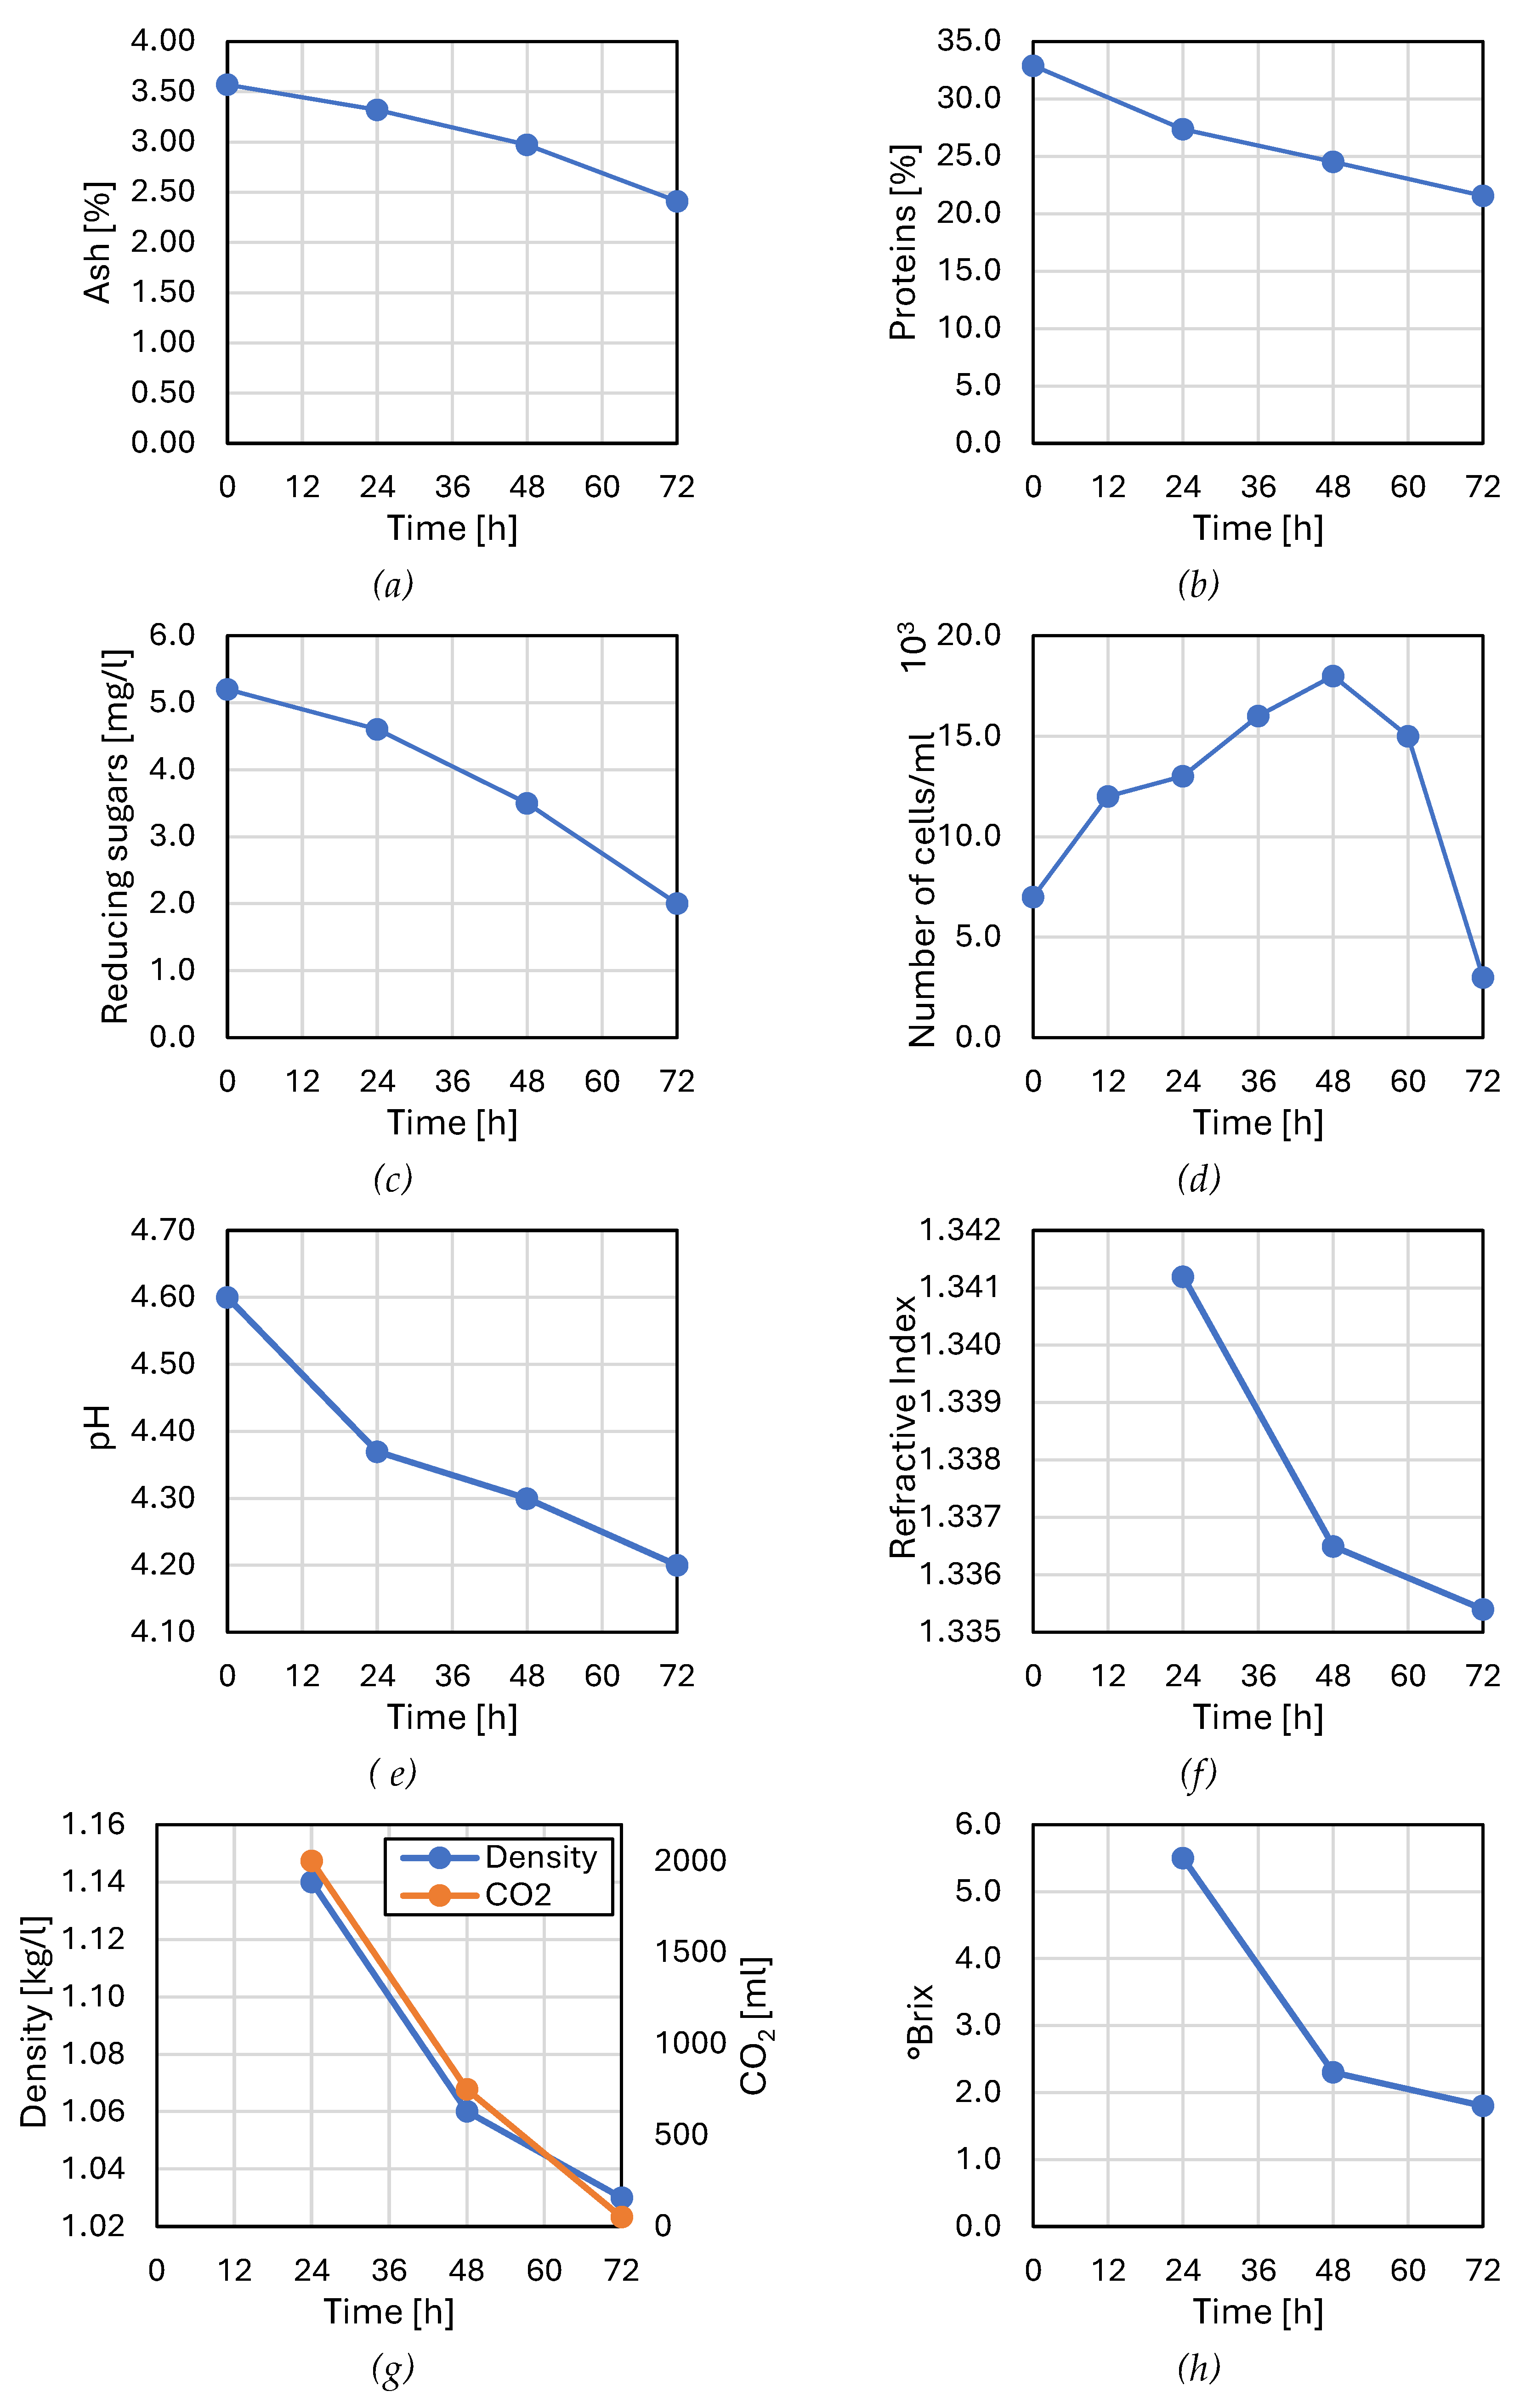
3.1.2. Proteins
3.1.3. Reducing Sugar Content
3.1.4. Cell Count
- Phase 1 (0-12h): Latency phase during which cells synthesize the enzymes needed to metabolize the substrate present. Cell reproduction is nearly non-existent during this phase.
- Phase 2 (12-24h): Acceleration phase where actual growth initiation occurs.
- Phase 3 (24-36h): Exponential growth phase with cell reproduction reaching its maximum at a constant rate. This is due to the richness of TCW in nutrients (mineral compounds, vitamins, carbon, and nitrogen compounds), providing an energy source [53]. Additionally, the nitrogen source is significant because it contributes to the structure of nucleic acids and proteins, important constituents of Saccharomyces cerevisiae cells [54].
- Phase 4 (36-60h): Stationary phase with cell concentration remaining relatively constant, indicating cessation of cell reproduction. This is a sign of exhaustion of nutritional sources, namely glucose, and accumulation of inhibitory products resulting from microbial metabolism, where ethanol concentration increases in the medium (Figure 12). Growth rate, metabolic activity, cell viability, and yeast production capacity are all declining. Canetta et al., [55] confirmed these phenomena in their work, especially in Saccharomyces cerevisiae.
- Phase 5 (60-72h): Decline phase with a decrease in cell mass due to autolysis and a negative growth rate. This is attributed to ethanol causing stress in yeast and becoming toxic at high concentrations. These findings have been validated by several researchers, particularly in Saccharomyces cerevisiae [54,55,56,57].
3.1.6. Refractive Index
3.1.7. Density
3.1.8. Soluble Solids Content
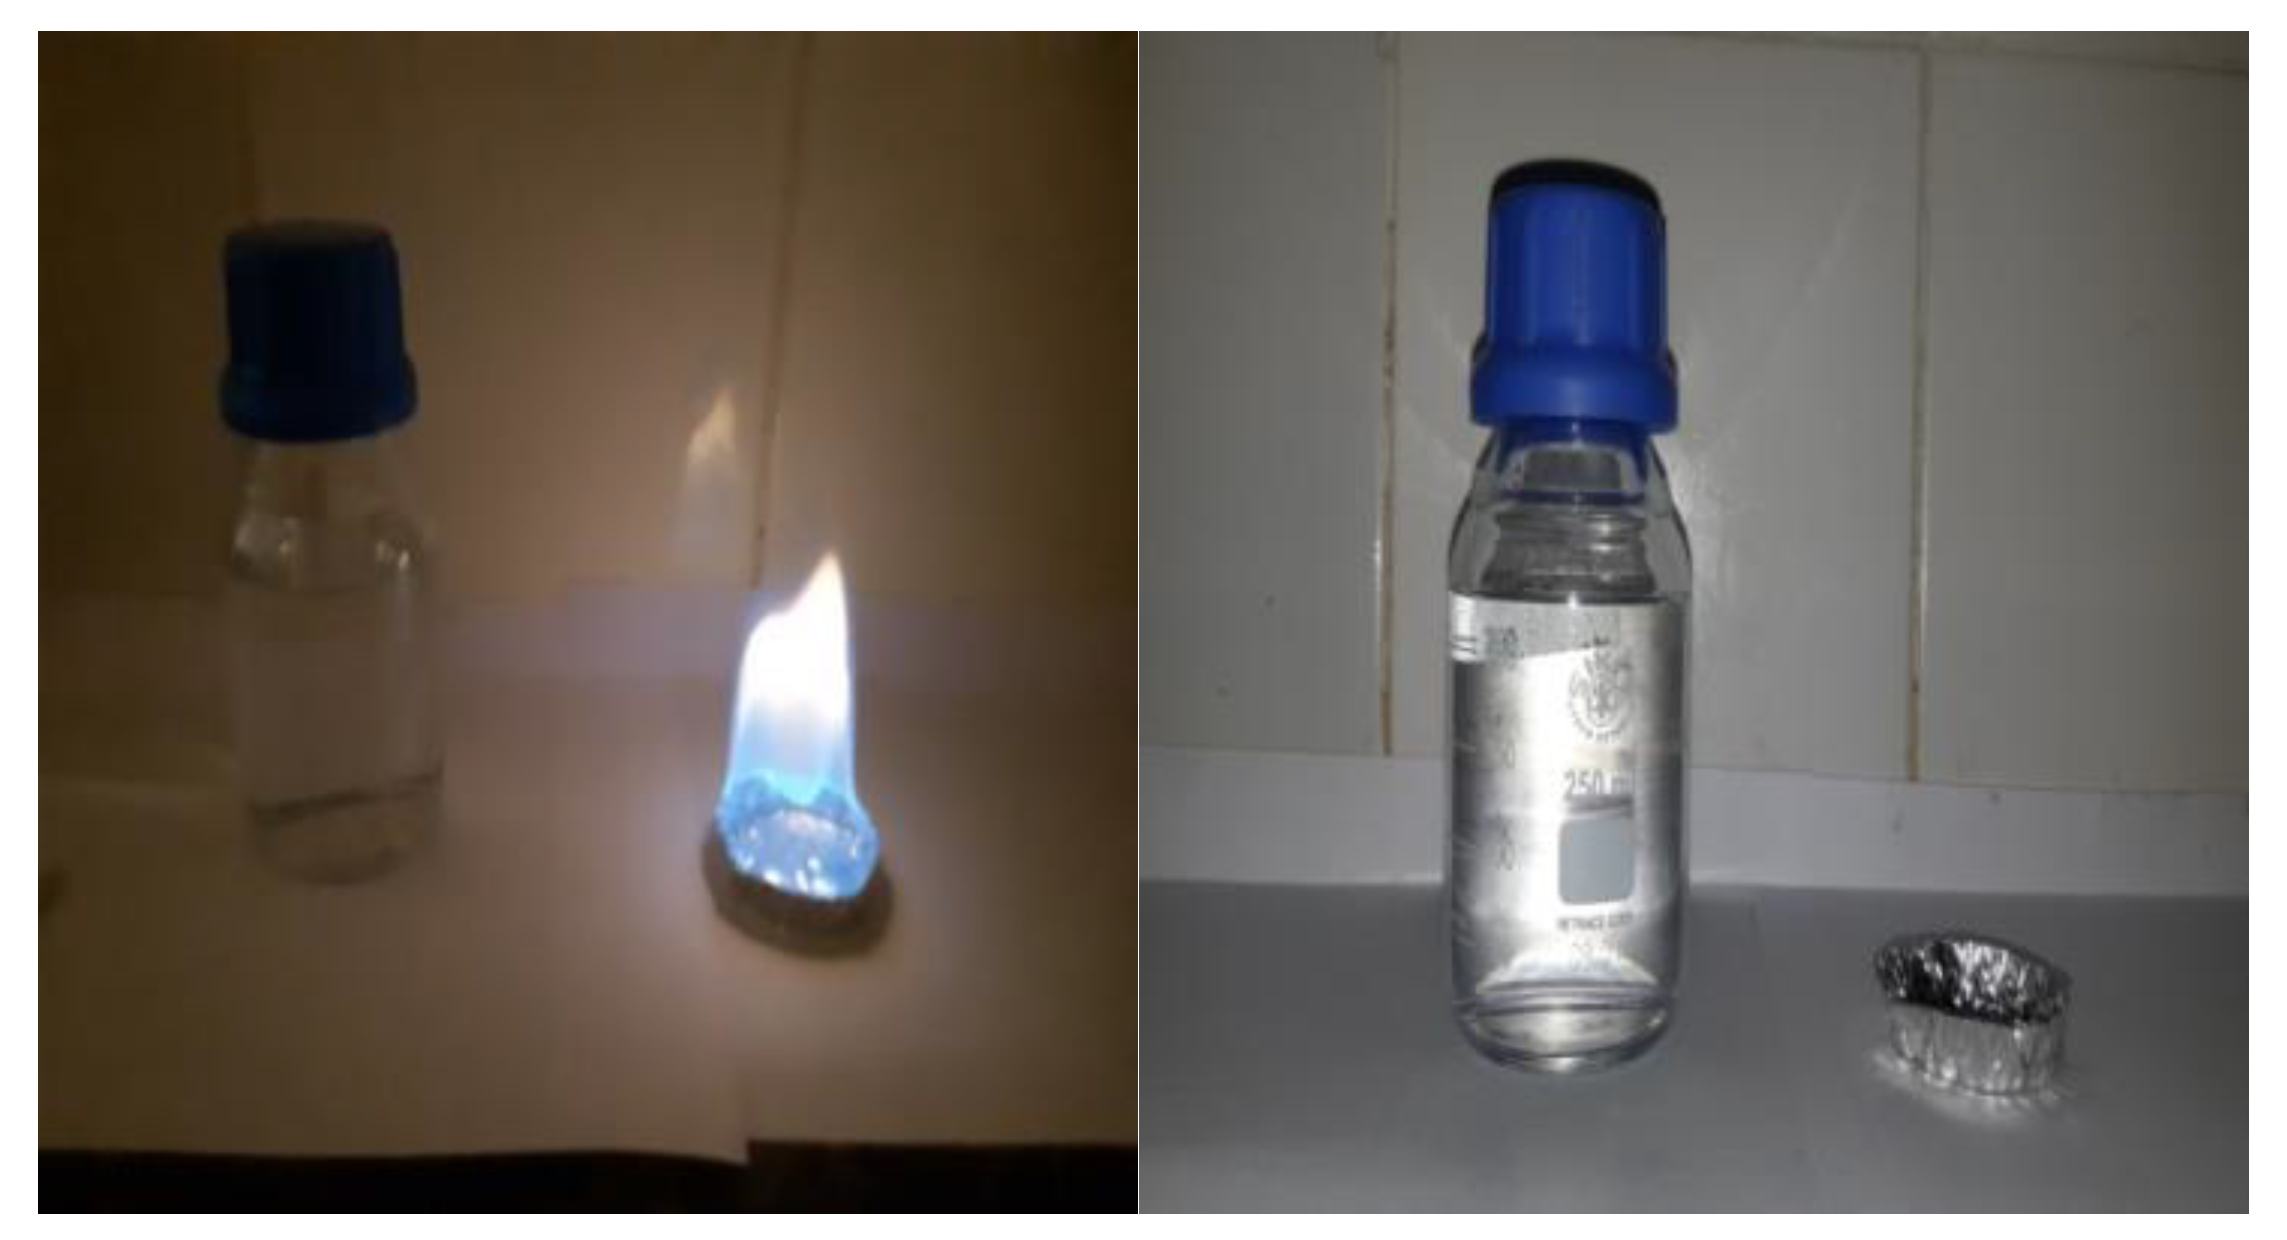
3.1.9. Alcohol Degree
3.2. Characterization of the "Bioethanol" Fermentation Product
3.2.1. Characterization of Bioethanol Obtained by IR Spectrophotometry
4. Conclusions
Nomeclature
Author Contributions
Funding
Institutional Review Board Statement
Informed Consent Statement
Acknowledgments
Conflicts of Interest
References
- Bibra, M.; Samanta, D.; Sharma, N.K.; Singh, G.; Johnson, G.R.; Sani, R.K. Food Waste to Bioethanol: Opportunities and Challenges. Fermentation 2022, 9, 8. [Google Scholar] [CrossRef]
- Sikiru, S.; Abioye, K.J.; Adedayo, H.B.; Adebukola, S.Y.; Soleimani, H.; Anar, M. Technology Projection in Biofuel Production Using Agricultural Waste Materials as a Source of Energy Sustainability: A Comprehensive Review. Renew. Sustain. Energy Rev. 2024, 200, 114535. [Google Scholar] [CrossRef]
- Branthôme, F.-X. Worldwide (Total Fresh) Tomato Production in 2021 - Tomato News.
- Mimouni, C. Plans de Développement Agricole En Algérie: Etat Des Lieux et Leur Impact Sur La Production Agricole de 2000 à 2019. Rev. Financ. marchés 2023, 10, 121–142. [Google Scholar]
- Generale, R.; Terres, D.E.S. République Algérienne Démocratique et Populaire Ministère de l ’ Agriculture et Du Développement Rural Direction Des Statistiques Agricoles et Des Systèmes d ’ Information SUPERFICIES ET PRODUCTIONS JUILLET. 2021; Volume 2021, pp. 1–87. [Google Scholar]
- Shrestha, N.; Fogg, A.; Wilder, J.; Franco, D.; Komisar, S.; Gadhamshetty, V. Electricity Generation from Defective Tomatoes. Bioelectrochemistry 2016, 112, 67–76. [Google Scholar] [CrossRef] [PubMed]
- Del Valle, M.; Cámara, M.; Torija, M. Chemical Characterization of Tomato Pomace. J. Sci. Food Agric. 2006, 86, 1232–1236. [Google Scholar] [CrossRef]
- Garcia-Marti, M.; Simal-Gandara, J. Chemical and Biological Valorization of Tomato Waste. 2023. [Google Scholar]
- Christofi, A.; Fella, P.; Agapiou, A.; Barampouti, E.M.; Mai, S.; Moustakas, K.; Loizidou, M. The Impact of Drying and Storage on the Characteristics of Two-Phase Olive Pomace. Sustainability 2024, 16, 1116. [Google Scholar] [CrossRef]
- Pemas, S.; Gkiliopoulos, D.; Samiotaki, C.; Bikiaris, D.N.; Terzopoulou, Z.; Pechlivani, E.M. Valorization of Tomato Agricultural Waste for 3D-Printed Polymer Composites Based on Poly (Lactic Acid). Polymers (Basel). 2024, 16, 1536. [Google Scholar] [CrossRef] [PubMed]
- Drescher, A.; Schwingshackl, L.; Kienberger, M. Identification of Molecules from Tomato Plant Residues Using Sustainable Green Chemicals. 2024. [Google Scholar]
- Farinon, B.; Felli, M.; Sulli, M.; Diretto, G.; Savatin, D. V; Mazzucato, A.; Merendino, N.; Costantini, L. Tomato Pomace Food Waste from Different Variants as a High Antioxidant Potential Resource. Food Chem. 2024, 452, 139509. [Google Scholar] [CrossRef]
- Rashwan, M.; Abd El-Razzak, H.; Alkoaik, F.; Ibrahim, M.; Fulleros, R. Influence of Tomato Waste Composts on Dry Matter and Heavy Metals Content in Cucumber and Summer Squash Seedlings. J. Air Waste Manage. Assoc. 2023, 73, 695–704. [Google Scholar] [CrossRef] [PubMed]
- Chen, T.; Wang, Q.; Wang, Y.; Dou, Z.; Yu, X.; Feng, H.; Wang, M.; Zhang, Y.; Yin, J. Using Fresh Vegetable Waste from Chinese Traditional Wet Markets as Animal Feed: Material Feasibility and Utilization Potential. Sci. Total Environ. 2023, 902, 166105. [Google Scholar] [CrossRef] [PubMed]
- Heuzé, V.; Tran, G.; Hassoun, P.; Bastianelli, D.; Lebas, F. Tomato Pomace, Tomato Skins and Tomato Seed. 2015. [Google Scholar]
- Arroussi, A.; Tahri, A.; Kalloum, S.; Abdelli, N.; Bouziane, N. Valorization Of Lignocellulosic Material From Date Palm Waste (Phoenix Dactylefera L. ) Elhmira Cultivar By Composting As Organic Fertilizer. UPB Sci Bull, Ser B 2022, 84, 59–72. [Google Scholar]
- Tawantum, J.; Muensit, N.; Sathapondecha, P.; Mamimin, C. Valorization of Agro-Industrial Solid Waste by Two-Stage Anaerobic Digestion for Biohythane Production. ASEAN J. Sci. Technol. Reports 2024, 27, e253769–e253769. [Google Scholar] [CrossRef]
- Arroussi, A.; Tahri, A.; Nehar, O.K.; Soulimani, A.E.-A.; Dahou, M.E.-A. VALORIZATION OF DATE WASTE (HMIRA CULTIVAR) FOR THE PRODUCTION OF BIOALCOHOL AND BIOGAS. Curr. Trends Nat. Sci. 2023, 12, 78–91. [Google Scholar] [CrossRef]
- Durmuş, M.; Kızılkaya, R. The Effect of Tomato Waste Compost on Yield of Tomato and Some Biological Properties of Soil. Agronomy 2022, 12, 1253. [Google Scholar] [CrossRef]
- Mekunye, F.; Makinde, P. Production of Biofuels from Agricultural Waste. Asian J. Agric. Hortic. Res. 2024, 11, 37–49. [Google Scholar] [CrossRef]
- Rola, K.; Gruber, S.; Goričanec, D.; Urbancl, D. Waste Lignocellulosic Biomass as a Source for Bioethanol Production. Sustain. Chem. 2024, 5, 1–12. [Google Scholar] [CrossRef]
- Yerizam, M.; Jannah, A.M.; Aprianti, N.; Yandriani, Y.; Rendana, M.; Ernas, A.Q.; Tamba, J.L. Bioethanol Production from Coconut Husk Using DES-NADES Pretreatment and Enzymatic Hydrolysis Method. Comptes Rendus. Chim. 2023, 26, 1–10. [Google Scholar] [CrossRef]
- Vieira, R.C.; De Farias Silva, C.E.; da Silva, L.O.M.; Almeida, R.M.R.G.; de Oliveira Carvalho, F.; dos Santos Silva, M.C. Kinetic Modelling of Ethanolic Fermented Tomato Must (Lycopersicon Esculentum Mill) in Batch System: Influence of Sugar Content in the Chaptalization Step and Inoculum Concentration. React. Kinet. Mech. Catal. 2020, 130, 837–862. [Google Scholar] [CrossRef]
- Vieira, R.C. Estudo Da Modelagem Cinética Da Fermentação Alcoólica Em Batelada de Polpa de Tomate (Lycopersicon Esculentum Mill). 2020. [Google Scholar]
- Osei, J.A. Feasibility of Bioethanol Production from Rotten Tomatoes (Solanum Lycopersicum) Using Saccharomyces Cerevisiae. Waste Technol. 8, 34–38.
- Many, J.N.; Radhika, B.; Ganesan, T. Study on Tomato Wine Production and Optimization. J. Environ. Sci. Toxicol. Food Technol. 2014, 97–100. [Google Scholar] [CrossRef]
- Deng, K.; Li, E. Study on Preparation of Low Alcoholic Wine from Tomato. In Proceedings of the Proceedings of the 2012 International Conference on Applied Biotechnology (ICAB 2012) Volume 2; Springer, 2014; pp. 931–941. [Google Scholar]
- Yuan, J.; Zhang, H.; Zeng, C.; Song, J.; Mu, Y.; Kang, S. Impact of Fermentation Conditions on Physicochemical Properties, Antioxidant Activity, and Sensory Properties of Apple–Tomato Pulp. Molecules 2023, 28, 4363. [Google Scholar] [CrossRef]
- Jang, S.-Y.; Woo, S.-M.; Jo, Y.-J.; Kim, O.-M.; Kim, I.-H.; Jeong, Y.-J. Quality Characteristics of Tomato Wine on Fermentation Conditions. J. Korean Soc. Food Sci. Nutr. 2010, 39, 443–448. [Google Scholar] [CrossRef]
- Watanabe, M.; Tamura, K.; Magbanua, J.P.; Takano, K.; Kitamoto, K.; Kitagaki, H.; Akao, T.; Shimoi, H. Elevated Expression of Genes under the Control of Stress Response Element (STRE) and Msn2p in an Ethanol-Tolerance Sake Yeast Kyokai No. 11. J. Biosci. Bioeng. 2007, 104, 163–170. [Google Scholar] [CrossRef] [PubMed]
- Bocquet, J. Généralités Sur Les Microorganismes. Tec Doc Lavoisier: Paris, 1982; Volume 11. [Google Scholar]
- Pishgar, R.; Najafpour, G.; Neya, B.N.; Mousavi, N.; Bakhshi, Z. Anaerobic Biodegradation of Phenol: Comparative Study of Free and Immobilized Growth. Iran. J. Energy Environ. 2011, 2, 348–355. [Google Scholar] [CrossRef]
- Revuz, B. Microbiologie et Industrie Alimentaire (Culture de La Levure Sur Mêlasse).(Ed). Lavoisier, 1979. [Google Scholar]
- Bourgeois, C.M.; Larpent, J.P. Microbiologie Alimentaire: Alements Fermentés et Fermentations Alimentaires. Lavoisier, 1996; ISBN 2743000805. [Google Scholar]
- El Hadj, M.D.O.; Dan-Badjo, A.T.; Halouane, F.; Doumandji, S. Toxicité Comparée Des Extraits de Trois Plantes Acridifuges Sur Les Larves Du Cinquième Stade et Sur Les Adultes de Schistocerca Gregaria Forskål, 1775 (Orthoptera-Cyrtacanthacridinae). Sci. Chang. planétaires/Sécheresse 2006, 17, 407–414. [Google Scholar]
- Boulal, A.; Khelafi, M.; Kaidi, K. Procédés Expérimentales Sur La Production de Bioéthanol de Deuxième Génération à Partir Des Sous-Produits Des Palmiers Dattiers. Rev. des Energies Renouvelables SIENR 2018, 18, 63–69. [Google Scholar]
- Didderen, I.; Destain, J.; Thonart, P. Le Bioéthanol de Seconde Génération: La Production d’éthanol à Partir de Biomasse Lignocellulosique. Presses agronomiques de Gembloux, 2008; ISBN 2870160852. [Google Scholar]
- Kraiem, N.; Lajili, M.; Limousy, L.; Said, R.; Jeguirim, M. Energy Recovery from Tunisian Agri-Food Wastes: Evaluation of Combustion Performance and Emissions Characteristics of Green Pellets Prepared from Tomato Residues and Grape Marc. Energy 2016, 107, 409–418. [Google Scholar] [CrossRef]
- Kaidi, F.; Touzi, A. Production de Bioalcool à Partir Des Déchets de Dattes. Rev. des Energies Renouvelables, NS Biomasse Prod. Valoris 2001, 75–78. [Google Scholar]
- Amellal nee Chibane, H. Aptitudes Technologique de Quelques Variétés Communes de Dattes: Formulation d’un Yaourt Naturellement Sucré et Aromatisé. 2008. [Google Scholar]
- Aguirre, J. The Kjeldahl Method. In The Kjeldahl Method: 140 Years; Springer, 2023; pp. 53–78. [Google Scholar]
- DuBois, M.; Gilles, K.A.; Hamilton, J.K.; Rebers, P.A. t; Smith, F. Colorimetric Method for Determination of Sugars and Related Substances. Anal. Chem. 1956, 28, 350–356. [Google Scholar] [CrossRef]
- Sarada, R.; Nand, K. Start-up Anaerobic Digestion of Tomato-Processing Wastes for Methane Generation. Biol. wastes 1989, 30, 231–237. [Google Scholar] [CrossRef]
- Persia, M.E.; Parsons, C.M.; Schang, M.; Azcona, J. Nutritional Evaluation of Dried Tomato Seeds. Poult. Sci. 2003, 82, 141–146. [Google Scholar] [CrossRef]
- SEDDIKI, D. Valorisation Des Sous-Produits de Tomates. 2021. [Google Scholar]
- Booth, C. Methods in Microbiology; Academic press, 1971; ISBN 0080860303. [Google Scholar]
- Leveau, J.-Y.; Bouix, M. Microbiologie Industrielle: Les Micro-Organismes d’intérêt Industriel. 1993. [Google Scholar]
- Jeguirim, M.; Jellali, S.; Khiari, B. Foreword: Recent Advances in Sustainable Biomass Valorization. Comptes Rendus. Chim. 2022, 25, 1–5. [Google Scholar] [CrossRef]
- Leyral, G.; Vierling, E.; Figarella, J.; Zonsain, F. Microbiologie et Toxicologie Des Aliments: Hygiène et Sécurité Alimentaires; Doin, 1997; ISBN 2704007055. [Google Scholar]
- Jellali, S.; Hamdi, N.; Riahi, K.; Hamdi, H.; Jeguirim, M. Environmental Applications of Tomato Processing By-Products. In Tomato Processing by-Products; Elsevier, 2022; pp. 231–284. [Google Scholar]
- Jiang, Y.; Liang, C.; Zhao, W.; Chen, T.; Yu, B.; Hou, A.; Zhu, J.; Zhang, T.; Liu, Q.; Ying, H. Cell Cycle Progression Influences Biofilm Formation in Saccharomyces Cerevisiae 1308. Microbiol. Spectr. 2022, 10, e02765-12. [Google Scholar] [CrossRef]
- Vallino, J.J.; Hopkinson, C.S.; Hobbie, J.E. Modeling Bacterial Utilization of Dissolved Organic Matter: Optimization Replaces Monod Growth Kinetics. Limnol. Oceanogr. 1996, 41, 1591–1609. [Google Scholar] [CrossRef]
- Jeguirim, M.; Khiari, B. Biofuels Production. In Palm Trees and Fruits Residues; Elsevier, 2023; pp. 351–391. [Google Scholar]
- Ammouche, A. Contribution a l’etude de La Concentration En Methanol et de La Nature de La Source Azotee Sur La Croissance de La Levure (Hansenula Polymorpha). 1979. [Google Scholar]
- Canetta, E.; Adya, A.K.; Walker, G.M. Atomic Force Microscopic Study of the Effects of Ethanol on Yeast Cell Surface Morphology. FEMS Microbiol. Lett. 2006, 255, 308–315. [Google Scholar] [CrossRef]
- Aguilera, F.; Peinado, R.A.; Millan, C.; Ortega, J.M.; Mauricio, J.C. Relationship between Ethanol Tolerance, H+-ATPase Activity and the Lipid Composition of the Plasma Membrane in Different Wine Yeast Strains. Int. J. Food Microbiol. 2006, 110, 34–42. [Google Scholar] [CrossRef] [PubMed]
- Hirasawa, T.; Yoshikawa, K.; Nakakura, Y.; Nagahisa, K.; Furusawa, C.; Katakura, Y.; Shimizu, H.; Shioya, S. Identification of Target Genes Conferring Ethanol Stress Tolerance to Saccharomyces Cerevisiae Based on DNA Microarray Data Analysis. J. Biotechnol. 2007, 131, 34–44. [Google Scholar] [CrossRef] [PubMed]
- Birch, R.M.; Walker, G.M. Influence of Magnesium Ions on Heat Shock and Ethanol Stress Responses of Saccharomyces Cerevisiae. Enzyme Microb. Technol. 2000, 26, 678–687. [Google Scholar] [CrossRef] [PubMed]
- Jones, R.P.; Pamment, N.; Greenfield, P.F. Alcohol Fermentation by Yeasts-the Effect of Environmental and Other Variables. Process Biochem. Kingdom) 1981, 16. [Google Scholar]
- Gaillard, J.L.; Leclerc, H.; Simonet, M. Microbiologie Générale. Ed. Doin: Paris, 1995; Volume 535. [Google Scholar]
- El Ogaïdi, H.K.H. Dates and Confectionery Product; FAO: Rome, 1987; pp. 1–25. [Google Scholar]
- Bouhadi, D.; Larbi, K.S.; Belkhodja, H.; Belmimoun, A.; Habib, A.; Semmache, A.; Ouahdi, M. Bioethanol Production from Potato Peel Waste Using Saccharomyces Cerevisiae. Acta Agric. Serbica 2023, 28. [Google Scholar] [CrossRef]

| Duration | Alcoholic degree | Comments |
|---|---|---|
| 0 h | 0° | Mixture color: Brown |
| 24 h | 2° | Appearance of 2 layers |
| 48 h | 6° | Precipitate color: Dark brown |
| 72 h | 12° | The supernatant becomes increasingly clear (yellowish). The residue turns brown. |
| Parameter | Bioethanol from TCW | Bioethanol from Potato Waste | Commercial ethanol |
|---|---|---|---|
| Density | 0.886 kg/L | 0.662 kg/L | 0.789 kg/L |
| Refractive index | 1.3628 | 1.395 | 1.3594 |
| Alcohol content after 1st distillation | 12° | - | - |
| Alcohol content after rectification | 54° | - | - |
Disclaimer/Publisher’s Note: The statements, opinions and data contained in all publications are solely those of the individual author(s) and contributor(s) and not of MDPI and/or the editor(s). MDPI and/or the editor(s) disclaim responsibility for any injury to people or property resulting from any ideas, methods, instructions or products referred to in the content. |
© 2024 by the authors. Licensee MDPI, Basel, Switzerland. This article is an open access article distributed under the terms and conditions of the Creative Commons Attribution (CC BY) license (http://creativecommons.org/licenses/by/4.0/).


