
Submitted:
13 December 2024
Posted:
16 December 2024
You are already at the latest version
Abstract
We investigated the transcription of circadian clock genes in publicly available datasets of gene expression in medulloblastoma (MB) tissues using the R2 Genomics Analysis and Visualization Platform. Differential expression of the core clock genes among the four consensus subgroups of MB (defined in 2012 as Group 3, Group 4, the SHH group, and the WNT group) included the core clock genes (CLOCK, NPAS2, PER1, PER2, CRY1, CRY2, BMAL1, BMAL2, NR1D1, and TIMELESS) as well as genes which encode proteins that regulate the transcription of clock genes (CIPC, FBXL21, and USP2). Overexpression of several clock genes, including CIPC, was found in individuals with the isochromosome 17q chromosomal aberration in MB Group 3 and Group 4.
The most significant biological pathways associated with clock gene expression were ribosome subunits, phototransduction, GABAergic synapse, WNT signaling pathway, and the Fanconi anemia pathway.
Survival analysis of clock genes was examined using the Kaplan Meier method and the Cox proportional hazards regression model through the R2 Genomics Platform. Two clock genes most significantly related to survival were CRY1 and USP2. The data suggest that several clock proteins, including CRY1 and USP2, be investigated as potential therapeutic targets in MB.
Keywords:
brain tumor
; clock genes
; medulloblastoma
; transcription
; isochromosome 17
; survival
1. Introduction
The 2017 Nobel Prize in Physiology and Medicine was awarded to Hall, Rosbash and Young for their work on clock genes and proteins and led to the transcription translation feedback model as essential to account for the circadian oscillation of clock components [1]. Circadian rhythms in transcription of clock genes occurs in the suprachiasmatic nucleus (SCN) of the hypothalamus as well as in peripheral tissues [2,3]. Most peripheral tissues express clock genes [4]. Expression of clock genes in some peripheral tissues may be synchronized by the SCN [5], but may be independent of the SCN in others. Seven of the core clock genes have been reported to undergo a circadian oscillation in all major tissues tested including liver, kidney, lung, adipose tissue, muscle, heart, and brain [6]. Disruption of circadian rhythms can result in a variety of diseases. There are reports that disruption of circadian rhythms may be involved in the development of several cancers including lung, breast, liver, and prostate cancer [7,8,9,10,11,12]. Disruption of the circadian clock is regarded as a risk factor for cancer [13,14], and circadian clock proteins have been proposed as therapeutic targets in cancer [9,15].
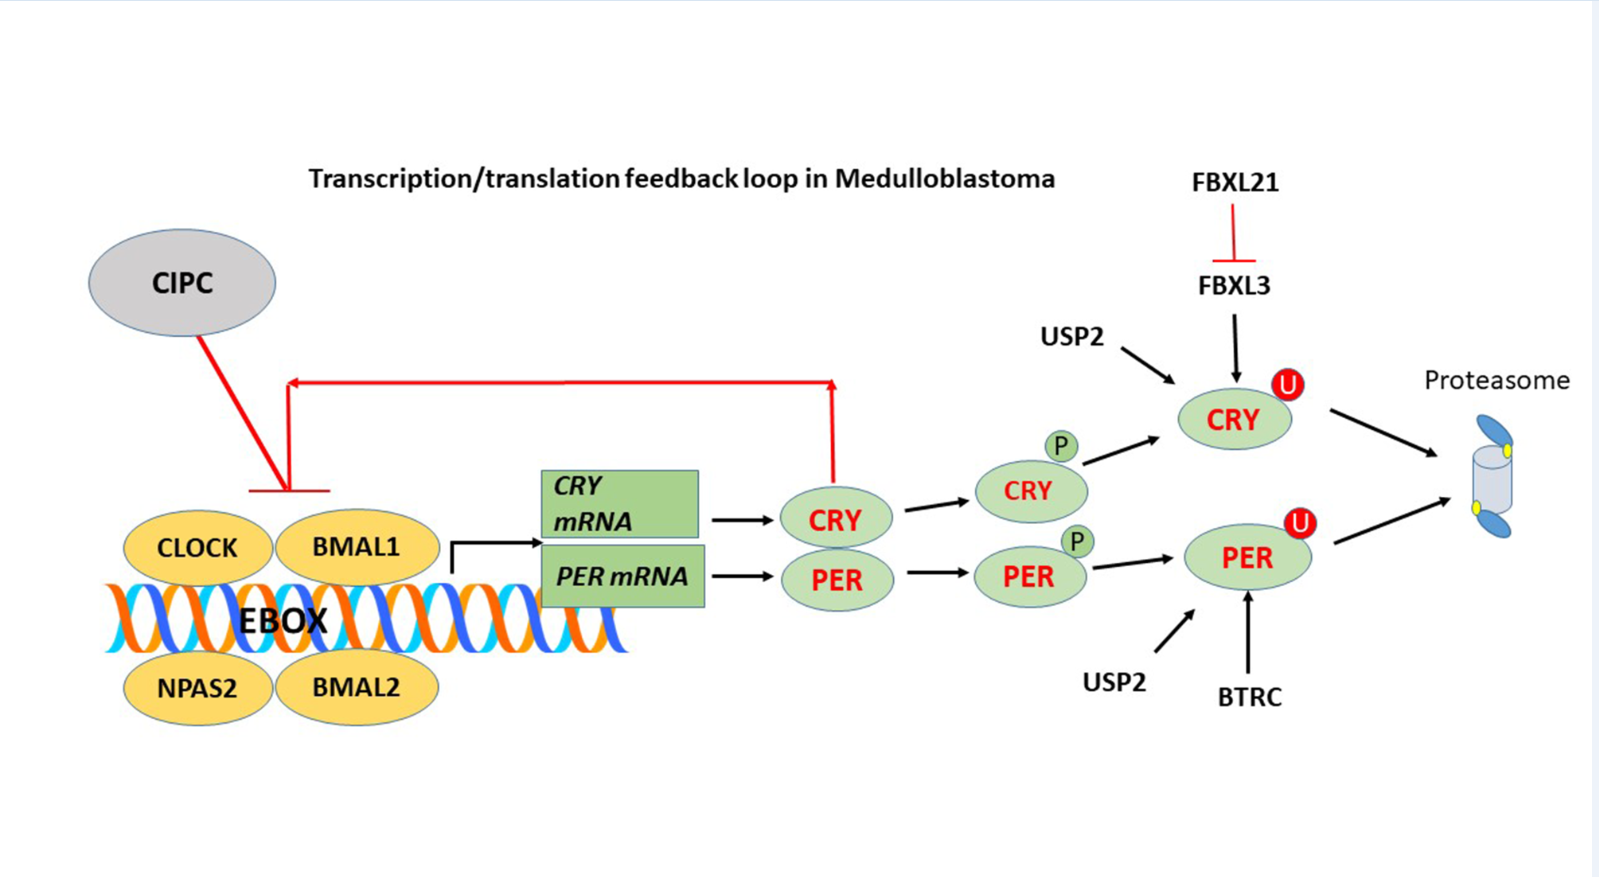
The core clock genes include genes for transcription factors CLOCK, BMAL1 (aka ARNTL), BMAL2 (aka ARNTL2), NPAS2, the transcription repressor genes PER1, PER2, PER3 (PERIOD 1, 2, 3), and the cryptochrome genes CRY1 and CRY2. [5,16]. The BMAL1/CLOCK complex stimulates the transcription of the period and cryptochrome genes, by binding to E-Box elements in their promoters. The PER and CRY proteins in turn bind to CLOCK/BMAL1 forming a PER/CRY transcription/translation feedback loop (Figure 1) which drives the circadian clock [5].
In addition to the primary PER/CRY feedback loop, a secondary transcriptional/translational feedback loop regulating the core clock genes, the REV-ERB and ROR (Related Orphan Receptor) feedback loop, has been described and is regarded as part of the transcriptional structure of the circadian clock [5]. REV-ERB-alpha and REV-ERB-beta proteins are encoded for by the genes NR1D1 and NR1D2. NR1D1 is transcriptional repressor and nuclear heme receptor that has been reported to coordinate circadian rhythms of activity [17,18].
Finally, a third feedback loop was described by Cox and Takahashi [19] as a DBP/NFIL3 (D-Box binding transcription factor/Nuclear factor IL3 binding protein) loop. In the model of Cox and Takahashi DBP and NFIL3 dimerized proteins bind to D-box elements of the PERIOD, RORA/B and NR1D1/2 genes to regulate transcription [19].
Several components of the ubiquitin proteasome system have been found to regulate the expression of circadian clock genes [5], and are included in our analysis of MB clock gene expression. The best documented are the F-box ubiquitin ligase adaptors FBXL3 [20,21], FBXL21 [22,23,24], [25,26,27], FBXW7 [16,28], and the deubiquitinase USP2 [6,29,30,31,32,33]. FBXL21 is highly expressed in the suprachiasmatic nucleus, the hypothalamic nucleus which is the major pacemaker in mammals whereas FBXL3 and USP2 are expressed in many tissues [22]. A mutation in FBXL3 referred to as OVERTIME led to the discovery that the FBXL3 protein is required for the reactivation of CLOCK and BMAL1 by facilitating the degradation of CRY1 and CRY2 proteins and resulting in the loss of negative feedback [34]. Another mutation of FBXL3, AFTERHOURS, slows the degradation of CRY protein [35]. The FBXL21 protein binds to the CRY proteins and antagonizes the action of FBXL3 on the degradation of these proteins [23].
Additional clock related genes include TIMELESS, and CIPC (Clock Interacting Pacemaker), and the clock regulator kinases CSNK1δ and CSNK1ε.
Current availability of public datasets on genome wide gene transcription make it possible to investigate the expression of circadian clock genes in various cancers and in their subgroups. Medulloblastoma (MB) datasets provide an interesting source in which to study the interaction of circadian rhythm genes and cancer since Group 3 MB tumors were initially delineated, in part, by over-expression of photoreceptor and phototransduction genes [36,37,38,39,40].
In the current study we investigate the expression of clock genes, in public datasets of medulloblastoma. These include the Cavalli dataset [40] and the Swartling dataset, a reanalysis of 23 MB (including the Cavalli dataset) and non-tumor datasets, for batch variation [41]. The data enabled us to address the question of whether circadian clock genes were expressed in medulloblastoma tissue samples and if so, whether transcription of these genes was differentially expressed among the 4 consensus subgroups of medulloblastoma, Group 3, Group 4, SHH and WNT [36]. The Cavalli data allowed for further study of clock genes by the twelve subtypes within the four subgroups in this dataset; it also facilitated the examination of gene expression based on chromosome arm copy number variation. The Swartling data, moreover, enabled us to determine differences in expression of clock genes between MB tumor tissue and non-tumor (NT) cerebellum.
The Cavalli dataset also had available survival data, which allowed us to determine whether the expression of any of the core clock genes in MB tissues were associated with patient survival. The data facilitated the identification of potential therapeutic targets among the clock genes that were associated with survival.
Reports relating clock genes and melatonin synthesis have been reported [42,43]. Therefore we also examined the medulloblastoma datasets to determine whether expression of the gene for the rate-limiting step in melatonin synthesis, AANAT, was related to MB subgroups.
Several clock genes, as well as AANAT, are located on chromosome 17, the chromosome associated with copy number gains of 17q in MB and the chromosomal abnormality isochromosome 17q. The genes located on chromosome 17q include the clock gene NR1D1, the clock related gene CSNK1D as well as the gene encoding AANAT. The availability of copy number variation data in supplemental datasets of Cavalli et al. [40] facilitated the determination of whether the expression of clock genes in MB were related to copy number gain of chromosome 17q.
Finally, based on the evidence that several clock proteins act as transcription factors, or transcription regulators, we examined the most significant KEGG pathways associated with genes whose transcription was correlated with that of each of the clock genes.
2. Methods
Data Sources
Gene expression was mined from publicly available datasets of gene expression in MB, primarily the Cavalli dataset (n = 763) and the Swartling dataset (n = 1350 MB samples and 291 NT brain samples), a reanalysis of several datasets (including the Cavalli data) for batch variation. These datasets were made available through the R2 Genomics Analysis and Visualization Platform (R2 Genomics) (https://r2.amc.nl). Each of the datasets provided differential expression of genes for the four consensus subgroups of MB, the WNT, SHH, Group 3, and Group 4. The Cavalli dataset (n = 763) provided further information on gene expression in subtypes of each group, for a total of 12 subtypes, and also provided survival data. The Swartling dataset (n = 1641), a batch-corrected meta-analysis, in addition to providing gene expression of the four subgroups of MB, also included gene expression data of non-tumor tissue derived from 291 normal cerebellum tissue samples. Subsequently we refer to this group as the NT group.
Additional MB datasets found the R2 Genomics Platform included the Pfister dataset, the Northcott MAGIC MB dataset, and the Gilbertson dataset. Additional NT datasets included the NT brain dataset of Berchtold, and the NT cerebellum dataset of Roth.
Data Analysis
The R2 Genomics platform was also used for basic statistical analysis, including analysis of variance (anova), of differentially expressed clock genes and, in the Cavalli dataset, for Kaplan-Meier analysis of survival data related to these genes. In addition, Cox proportional hazards regression analysis was performed through the R2 Genomics platform for the clock genes listed in Table 1. The Morpheus program (Broad Institute) was used to produce a heatmap and cluster analysis of clock gene expression in the Cavalli dataset (Figure 2).
Chromosomal copy number variation data, found in the supplemental tables of Cavalli et al. [40], facilitated the examination of clock gene expression as it relates to copy number gain of Chromosome 17q.
The KEGG pathways associated with groups of genes correlated with each of the clock genes were determined using the gene set analysis application in the R2 Genomics platform.
3. Results
3.1. Clock Gene Expression in Medulloblastoma Subgroups
Our list of clock genes included the core clock genes as well as genes that encode proteins that regulate clock gene expression. Differential expression of various clock genes between MB subgroups was highly significant by analysis of variance (anova). Table 1 shows the significance of MB group differences in the Cavalli dataset and the relative significance in the Swartling meta-analysis, which included a NT group in addition to the 4 MB subgroups.
Our gene expression results are discussed in the order of clock proteins presented in the 2021 review of Cox and Takahashi [19]: genes of the core clock proteins CLOCK and BMAL1, genes of the PERIOD/CRYPTOCHROME feedback loop (Figure 1), genes of the REV-ERB and ROR feedback loop, and genes of a third feedback loop described as a DBP/NFIL3 loop. This will be followed by presentation of gene expression associated with the ubiquitin proteasome system, which has been shown to have a key role in circadian regulation of clock proteins; these genes include FBXL3, FBXL21, FBXW7, BTRCP, and USP2. Our focus is on the results with the greatest statistical significance, and on results that are confirmed across datasets. Differential expression of clock genes by MB subgroup in the Cavalli dataset are illustrated in the heatmap and cluster analysis of Figure 2.
Table 2 shows the statistics for the Kaplan-Meier survival curve scans (chi squared and p values) up to 144 months, as well as the Hazards Ratios determined using the Cox proportional HR analysis. The most significant Kaplan-Meier scans (high vs low gene expression) were found for the following clock related genes: USP2, CRY1, and CLOCK (Table 2).
3.1.1. CLOCK and BMAL Expression in MB Subgroups
Differential expression of CLOCK among the four major medulloblastoma (MB) subgroups was observed across multiple datasets. Analysis of the Cavalli dataset revealed significant differences in CLOCK expression (F = 77.07, p = 1.59 x 10⁻⁴³), which were validated in the Pfister (F = 21.78, p = 2.21 x 10⁻¹²), Northcott (F = 52.76, p = 2.44 x 10⁻²⁰), and recalculated Swartling datasets (F = 155.46, p = 6.27 x 10⁻⁸⁶). The Swartling dataset, which included a normal tissue (NT) group, allowed for subgroup comparisons against NT (Figure 3). CLOCK expression was lowest in Group 3 MB, with a highly significant reduction compared to NT (p = 1.25 x 10⁻³⁹). In contrast, no significant difference in CLOCK expression was found between Group 4 and NT.
The CLOCK protein, together with its binding partner BMAL1, acts as a transcription factor regulating genes such as PERIOD, CRYPTOCHROME, and NR1D1/NR1D2. Low CLOCK expression, as observed in Group 3 MB, may disrupt cellular responses to DNA damage, as CLOCK has been implicated in this process. Notably, low CLOCK expression was associated with worse overall survival (Figure 3, Table 2). These findings suggest that the role of reduced CLOCK protein in the development and proliferation of Group 3 MB warrants further investigation.
Expression of ARNTL (coding for BMAL1) was also differentially expressed across MB subgroups in the Cavalli dataset (F = 59.29, p = 1.92 x 10⁻³⁴) and validated in other datasets, including the Swartling dataset (F = 137.94, p = 1.88 x 10⁻⁷⁷). While ARNTL expression was depressed in the SHH subgroup compared to NT (p = 2.8 x 10⁻⁸⁷), it was significantly elevated in Group 3 MB (Figure 3). A strong statistical correlation between ARNTL and RORA expression (Figure 8B) supports a potential functional relationship, such as RORA promoting BMAL1 transcription.
The CLOCK homolog, NPAS2, whose protein can dimerize with BMAL1 as an alternative to CLOCK, exhibited highly significant differential expression (F = 283.34, p = 1.59 x 10⁻¹⁸³). Elevated NPAS2 expression was observed in Group 4 MB compared to other groups and NT, suggesting it may serve as a marker for Group 4 MB. NPAS2 has been reported as a tumor suppressor involved in DNA damage repair in breast cancer cells; however, its role in MB remains unexplored.
Expression of ARNTL2 (coding for BMAL2) was lowest in the WNT subgroup (p = 1.82 x 10⁻³⁷), with reduced ARNTL2 expression associated with better survival outcomes (Chi = 12.91, p = 3.27 x 10⁻⁴) (Table 2). Interestingly, ARNTL2 was specifically elevated in Group 4α, one of the 12 Cavalli subtypes.
3.1.2. BHLHE40 and Survival in WNT MBs
BHLHE40 (aka DEC1), a transcriptional repressor that inhibits the transcriptional activity of the CLOCK/BMAL complex [44], was differentially expressed at a highly significant level (F = 209.02, p = 7.20 x 10⁻¹⁴⁴). Expression levels of BHLHE40 were elevated in the WNT subgroup compared to other subgroups and normal cerebellar tissue (NT) (Figure 3).
Our analysis revealed that this upregulation of BHLHE40 in the WNT subgroup aligns with observations in other cancers, as reported by Kiss et al., who listed various malignancies with increased BHLHE40 expression [45]. This finding adds the WNT subtype of medulloblastoma (MB) to the list of cancers where BHLHE40 is upregulated.
Kaplan-Meier survival analysis (Table 2) demonstrated that elevated BHLHE40 expression is associated with improved survival outcomes in WNT MB patients, further highlighting its potential role as a prognostic marker.
3.1.3. Cryptochrome (CRY) and Period (PER) Gene Expression
Cryptochrome proteins are required to maintain circadian rhythmicity in mammals Cryptochrome proteins are blue light photoreceptors in plants and in insects including Drosophila, but knockout experiments in mice lead to the conclusion that they do not function as direct photoreceptors in mammals [46]. Differential expression of CRY1 (F = 160.65, p = 1.29 x 10-80) andCRY2(F = 35.25; 2.48 x 10⁻²¹) was noted among the four major subgroups of MB in the Cavalli dataset and in the Swartling dataset. Compared to the NT group in the Swartling dataset CRY1 expression (Figure 4A) was elevated in Group 3 MB by t-test (p = 5.73 x 10-48), but depressed in the SHH (p = 4.81 x 10-47) and WNT (p = 7.49 x 10⁻¹⁷) groups. CRY2 (Figure 4B) expression was depressed in Group 3 (p = 5.76 x 10⁻¹⁸), SHH (p = 1.41 x 10-46), and WNT (p = 3.06 x 10⁻³⁰) groups compared to the NT group.
Among the 12 MB subtypes of the 4 subgroups, highest expression of CRY1 was found in the Cavalli Group 3 alpha subtype (p = 2.77 x 10-56 vs NT). Individuals with high levels of CRY1 were mostly less than 10 years of age (Figure 4C). High expression was associated with poor survival (Table 2).
PERIOD proteins adjust circadian rhythms to changes in photoperiod [47]. They function as transcriptional repressors in the transcription/translation feedback loop (Figure 1). Differential expression of the Period genes, PER1 and PER2, was observed between MB subgroups in the Cavalli dataset and in the Swartling dataset (Figure 5). Compared to the NT group in the Swartling dataset the major statistical differences were a depression of PER1 expression in the WNT subgroup (p = 2.34 x 10⁻²⁰) and in Group 4 (p = 5.00 x 10⁻²⁰). Decreased expression of PER2 expression was observed in the WNTgroup (p = 1.72 x 10⁻³²) and in Group 3 (p =5.29 x 10⁻³¹) groups compared to the NT group.
3.1.4. TIMELESS and MB
The TIMELESS gene codes for a protein, TIM, that inhibits activation of the PER1 gene and regulates minor changes in circadian rhythms by interacting with PER2 and CRY2 proteins [48,49]. It also contributes to the DNA damage response [50]. In the Swartling dataset TIMELESS expression was substantially elevated in the MB groups G3, G4, and WNT compared to the non-tumor group (Figure 6). In the Cavalli dataset, high expression was associated with worse survival based on the Kaplan-Meier (Table 2).
3.1.5. CSNK1D and Chromosome 17q
CSNK1D, a gene located on chromosome 17q, encodes a casein kinase which phosphorylates PER1 and PER2 proteins. Phosphorylation together with ubiquitination enables the degradation of these proteins by the proteasome [51] (Figure 1). Figure 7 shows an increase in expression of CSNK1D in Groups 3 and 4 and major decrease in expression of CSNK1D in the SHH subgroup compared to the other subgroups, including the NT group. Our analysis found that high expression of this gene was statistically associated with copy number gain of chromosome 17q; its expression was elevated in individuals with 17q copy number gain.
3.1.6. REV-ERB and RORA Expression
The ROR (RORA, RORB, RORC) and NR1D (NR1D1 and NR1D2) genes encode proteins that bind to ROR-binding elements on the BMAL1 (ARNTL) gene. RORA and REV-ERBα compete for these binding sites, regulating BMAL1 transcription [19,52].
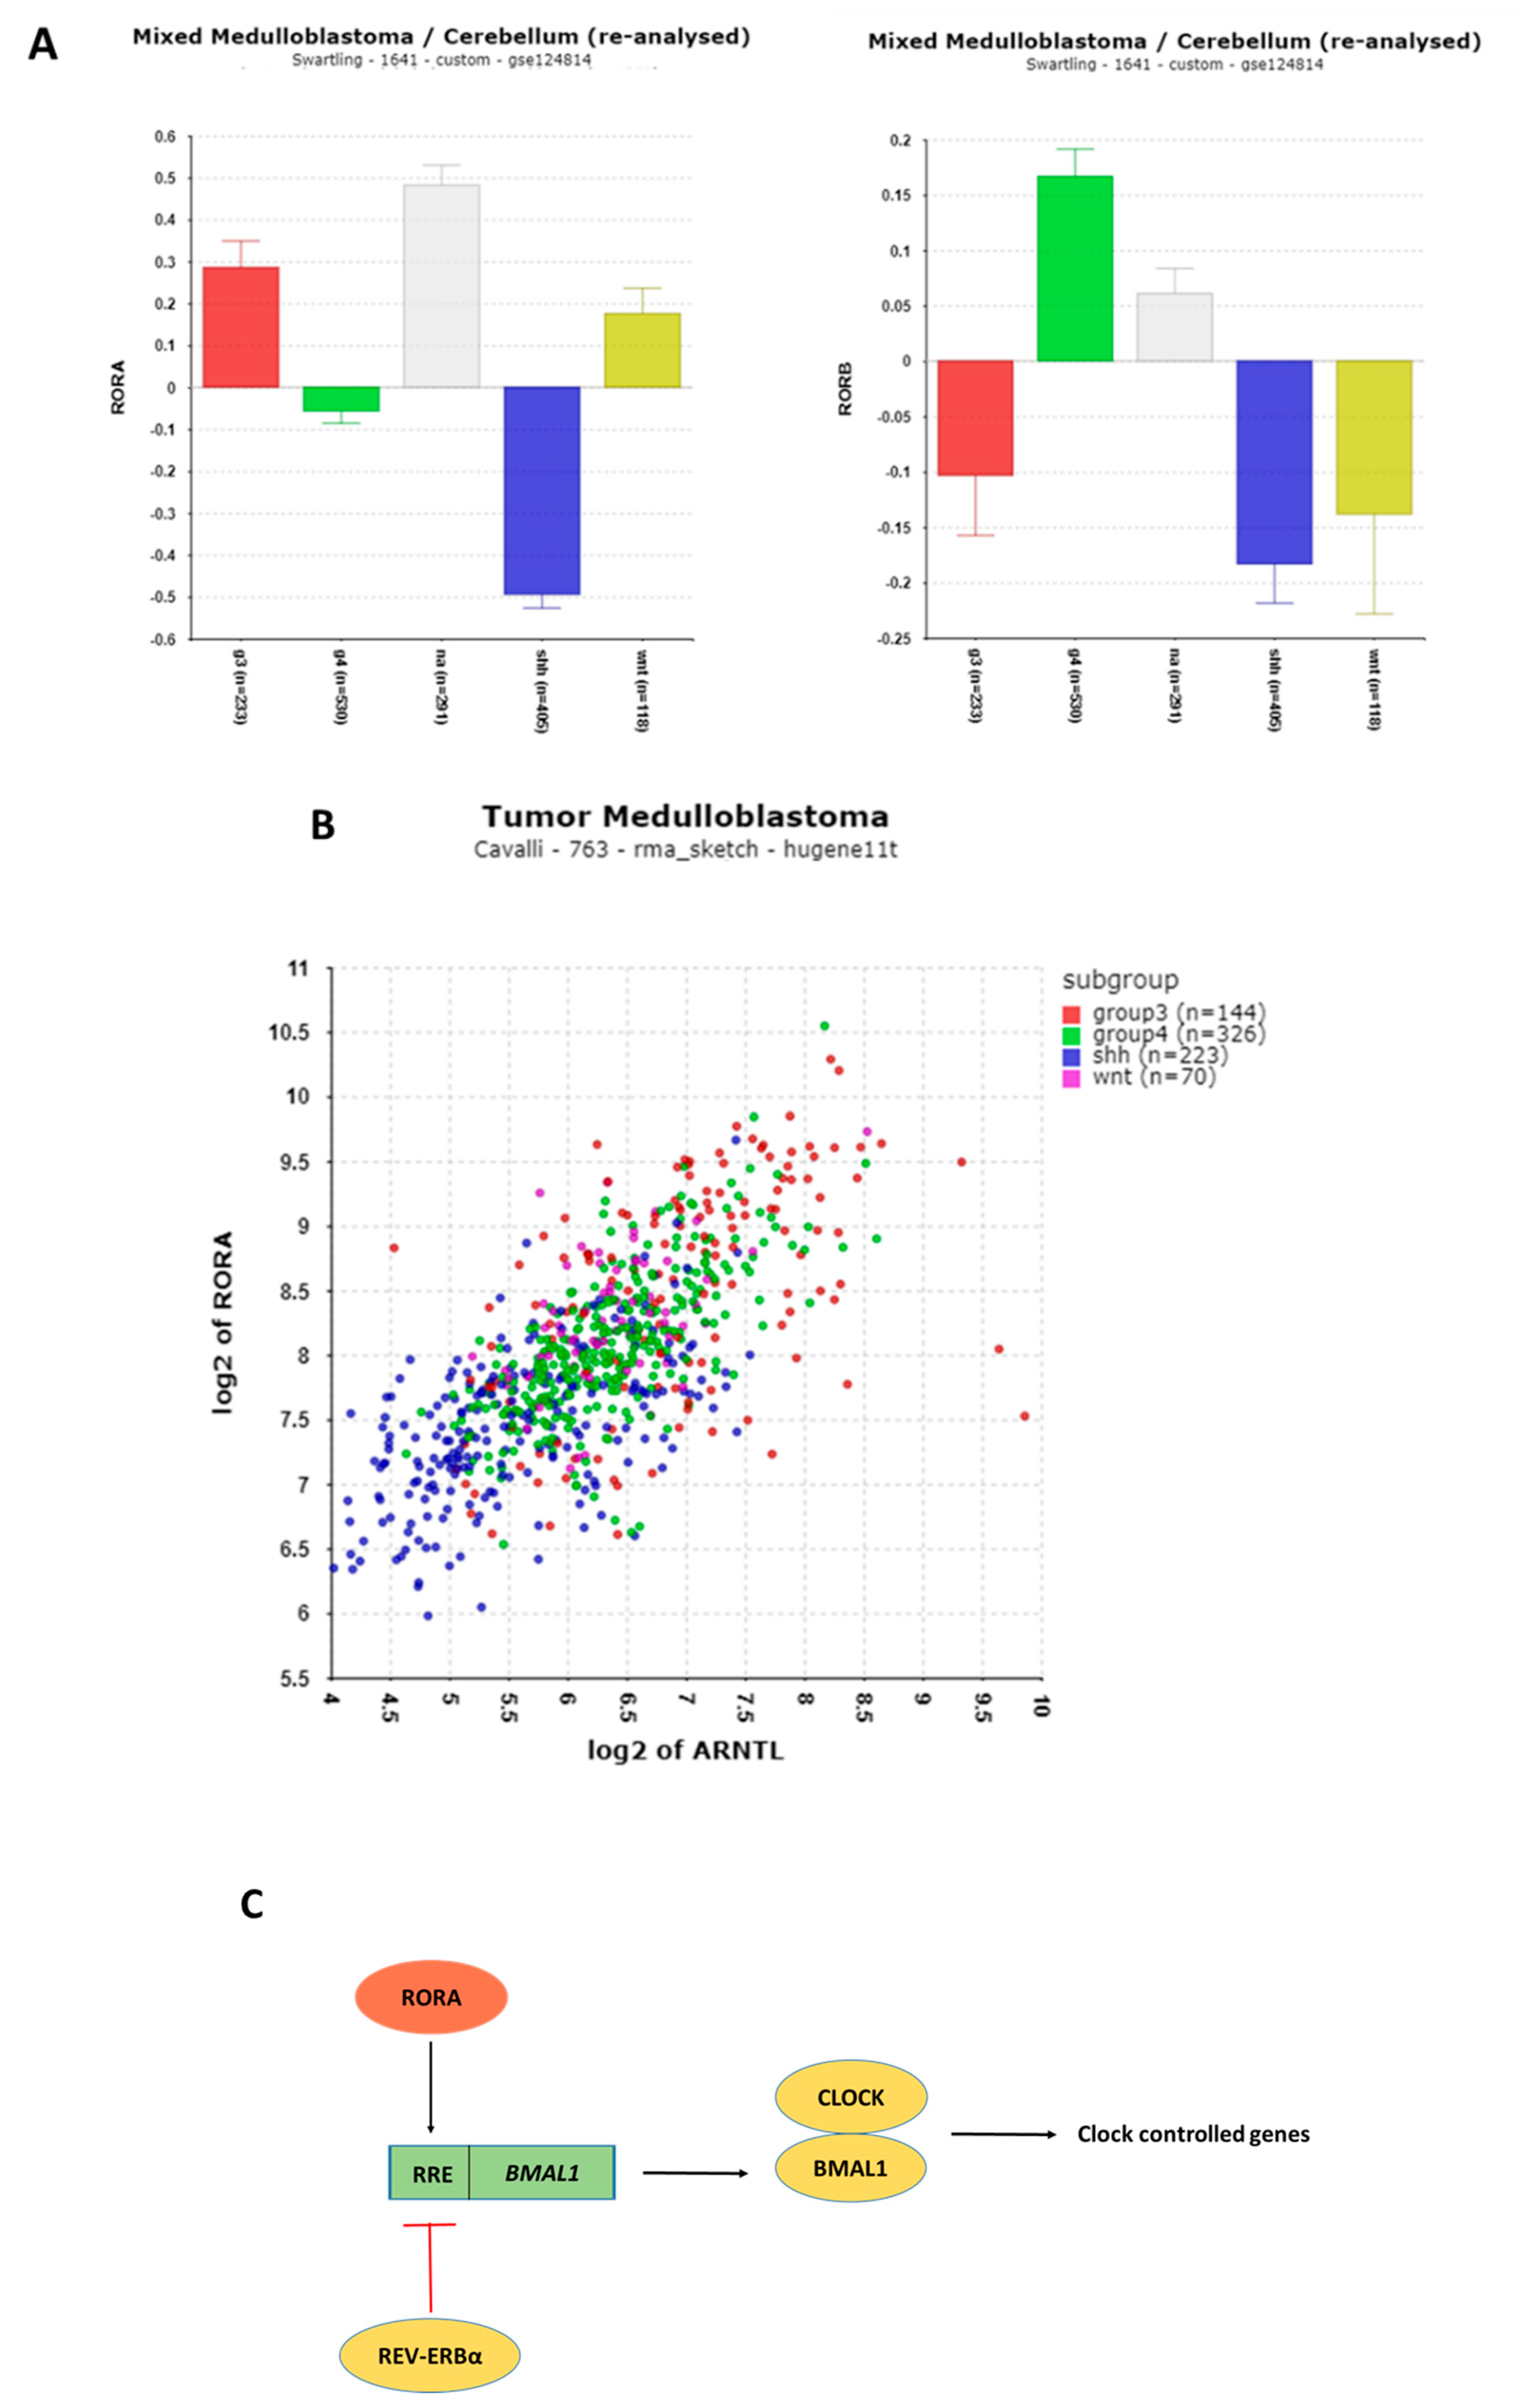
The most notable finding was the significant depression of RORA expression (Figure 8a) in the SHH group compared to the normal tissue (NT) group (t = 17.53, p = 3.00 x 10⁻⁵⁷). RORA expression was strongly correlated with BMAL1 (ARNTL) expression in the Cavalli dataset. Among 18,267 gene combinations analyzed, RORA had the most significant correlation with BMAL1 expression (r = 0.70, p = 3.19 x 10⁻¹¹¹), supporting the role of RORA in promoting BMAL1 transcription (Figure 8B) [53].
RORA also functions as a component of the second major feedback pathway regulating clock genes (Figure 8C). Its association with the phototransduction pathway was particularly striking. Correlation analysis revealed that the KEGG pathway most statistically associated with RORA expression was the phototransduction pathway, including genes encoding proteins of the phototransduction cascade [54] (Table 4) .
Seven genes of this pathway—CNGB1, GNAT1, GRK1, GUCY2D, PDE6B, PDE6G, and RCVRN—were highly correlated with RORA (r > 0.50). These genes were markedly overexpressed in the MB Group 3 alpha subtype in the Cavalli dataset. Furthermore, AANAT, the gene encoding the rate-limiting enzyme for melatonin synthesis, was also overexpressed in Group 3 MBs (Figure 17). The KEGG pathway statistically associated with AANAT and USP2 expression was represented by the same 4 phototransduction-related genes (GNAT1, GRK1, GUCY2D, and RCVRN).
These findings are consistent with prior research by Hooper et al. [55], who compared Group 3 MB expression profiles to normal molecular developmental events. They found that Group 3 MB expression profiles resembled those of rod cell precursor cells at around 15 weeks of human retinal development. Hooper et al. described a neoplastic switch from granule cell precursors to rod cell precursors in a Group 3 MB cohort, suggesting a molecular relationship between Group 3 MBs and pineal tumors.
The refined classification of Group 3 MBs into subtypes—Group 3 alpha, beta, and gamma—in the Cavalli dataset highlights increased expression of phototransduction genes in the Group 3 alpha subtype. This suggests that Group 3 alpha MBs may originate from photoreceptor precursors. Further investigation is needed to test this hypothesis and better understand the developmental origins of Group 3 alpha MBs.
Figure 8.
A. Differential expression of RORA and RORB in the Swartling dataset. RORA, F = 85.84, p = 5.18 x 10-66; RORB, F = 19.47, p = 1.18 x 10⁻¹⁵. Red – Group 3, Green – Group 4, Grey – NA (normal) in Swartling dataset is the non-tumor group, Blue – SHH, Yellow – WNT. B. Correlation of RORA and ARNTL (BMAL1) expression in Cavalli dataset (r = 0.70, p = 1.19 x 10-111). MB subgroups identified by color. C. RORA and REV-ERBα (NR1D1) proteins share binding sites on the BMAL1 gene. RRE – Retinoic acid response element.
3.1.7. THRA/NR1D1, NR1D2, and Their Implications in Medulloblastoma (MB)
NR1D1and NR1D2 encode the proteins REV-ERBα and REV-ERBβ, respectively, which play key roles in circadian rhythm regulation [56]. Differential expression of the THRA/NR1D1 locus (F = 423.43, p = 1.43 x 10⁻¹⁸¹) was observed across MB subgroups, with the highest expression in Group 4 MB (Figure 9). This locus includes two genes, THRA (Thyroid Hormone Receptor A) and NR1D1, which are transcribed from opposite strands of DNA on chromosome 17q21.1 [57]. This arrangement complicates the interpretation of gene expression data, as datasets like Cavalli aggregate their expression into a single locus labeled THRA/NR1D1. Meanwhile, the Swartling dataset lists only THRA, further limiting the clarity of NR1D1-specific data.
The high expression of THRA/NR1D1 in Group 4 MB aligns with the frequent occurrence of isochromosome 17q in this subgroup, particularly in the Group 4 beta subtype, where over 95% of cases exhibit this chromosomal abnormality .[40]. Statistical analyses revealed that THRA/NR1D1 expression in Group 4 MB is strongly associated with copy number gain of chromosome 17q (Table 3). Kaplan-Meier analysis showed a significant correlation between high THRA/NR1D1 expression and poor survival (p = 1.84 x 10⁻³) (Table 2), suggesting its potential as a prognostic marker.
NR1D1 (REV-ERBα) is a transcriptional regulator that inhibits BMAL1 transcription [19,58] and regulates numerous circadian-expressed genes across multiple chromosomes (Figure 8C). The CLOCK/BMAL1 protein complex activates NR1D1 transcription [59], further linking this gene to circadian rhythm pathways. High levels of NR1D1 protein (REV-ERBα) in Group 4 MB could lead to the suppression of BMAL1 activity, disrupting downstream transcriptional networks.
For NR1D2, the most significant difference by subgroup was observed as a depression in expression in the SHH subgroup compared to normal tissue (p = 3.86 x 10⁻²⁹) (Figure 8).
The high level of differential expression of the THRA/NR1D1 reporter (Hugene 11t platform probe 8007008) in Group 4 MB suggests it could serve as a biomarker for this subgroup (Table 1, Figure 9). This elevated expression likely reflects the impact of isochromosome 17q on transcription levels.
Down-regulation of REV-ERBα (NR1D1) has been observed in various cancers, as reviewed by Gomatou et al.[60]. However, there is limited literature specifically linking NR1D1 or its encoded protein REV-ERBα to MB. Our findings that high THRA/NR1D1 expression is associated with poor survival in Group 4 MB underscore the need for follow-up studies. Exploring the role of REV-ERBα as a therapeutic target may yield new insights into treatment strategies for Group 4 MB.
3.1.8. DBP (D-Box of Albumin Promoter) and NFIL3 Gene Expression
Differential expression of DBP (D-box binding protein) (F = 55.93, p = 1.14 x 10⁻³²) was highly significant in the Swartling dataset, with the lowest expression values observed in the SHH group (Figure 10A). Compared to the NT group in the Swartling dataset, the depression of DBP in the SHH group was particularly pronounced (t = 15.65, p = 1.54 x 10-47). Similarly, in the Cavalli dataset, NFIL3 expression was lowest in the SHH group compared to the other three subgroups (F = 106.98, p = 9.10 x 10-58).
DBP gene transcription is a known target of the CLOCK/BMAL1 dimer complex. Both DBP and NFIL3 proteins bind to D-box elements of promoters of selected clock genes, playing opposing roles in their regulation. Studies by Ueda et al. [61] and Keniry et al.[62], as reviewed by Cox and Takahashi [19], highlight these opposing effects on D-box elements of clock gene promoters (Figure 10B).
DBP and NFIL3 encode proteins that are components of the third clock gene feedback pathway (Figure 10) described by Cox and Takahashi [19]. Correlation analysis of DBP (Table 4) reveals that the most significant biological pathway associated with DBP gene correlates is the GABAergic pathway, which has been linked to Group 3 MB in the 2012 consensus report [36]. Elevated DBP expression is illustrated in Group 3 MB (Figure 10), suggesting that DBP may contribute to defining this subgroup.
Highest transcription of NFIL3 was observed in Groups 3 and 4 MB in the Cavalli dataset. High expression of NFIL3 was associated with poor survival (Table 2). Zeng et al. have reviewed the abnormal expression of NFIL3 in various cancers and proposed NFIL3 as a therapeutic target [63]. However, to date, neither the NFIL3 gene nor its protein has been specifically studied as a therapeutic target in MB.
3.1.9. Clock Interacting Pacemaker (CIPC) (aka KIAA1737)
CIPC expression is included in the present study due to the report that the CIPC protein binds directly to the CLOCK/BMAL1 complex [64] and due to its extremely high statistical differential expression by MB subgroups (Swartling, F =379.47, p = 1.67 x 10-150, Cavalli; F = 587.87, p = 2.87 x 10-240). Compared to the NT group in the Swartling dataset CIPC was elevated in Group 4 (p = 1.29 x 10-48), but depressed in the SHH (p = 1.28 x 10-83) and WNT (p = 1.46 x 10-46) groups (Figure 11A). Among the clock genes, a high correlation of CIPC and FBXL21 was noted (r= 0.79, p = 7.75 x 10-164). Figure 11B shows the correlation of CIPC and FBXL21, with subgroup expression identified by color. High expression of both genes was associated with copy number gain of chromosome 17q (Table 3).
3.2. Ubiquitin Proteasome Pathway Regulation of Clock Genes in MB
FBXL3
The differential expression of FBXL3 was significant in the Swartling dataset (F = 55.21, p = 1.31 x 10-43 (Figure 12A). By t test the most significantly different expression of FBXL3 from the normal group was depression in the WNT group.
FBXL15
Figure 12B shows that expression of FBXL15 was depressed in the SHH MB subgroup compared to the other 3 groups as well as to the NT group.
FBXL21
Expression values of FBXL21 were not available in the Swartling dataset (due to its classification as a pseudogene in humans), preventing a comparison of expression values to the NT group. However, using the Megasample application of the R2 Genomics program, we were able to compare expression of FBXL21 in medulloblastoma (Pfister and Gilbertson datasets) to normal brain (Berchtold) and normal cerebellum (Roth dataset) using the same gene chip (Affytmetrix u133p2) and the same reporter (1555412_at). This analysis showed that FBXL21 expression was elevated in MB compared to that of the NT group (Figure 13A).
Differential expression of FBXL21 transcription was also highly significant in the Cavalli dataset (F = 289.07, p = 4.14 x 10-125), with the mimimal expression in the SHH MB group (Figure 13B); expression of FBXL21 in Group 3 was 25-fold greater than in the SHH group, while expression in Group 4 was approximately 35-fold greater than in the SHH group. This over-expression is primarily in children less than 15 years of age (Figure 13C). The findings of elevated expression of FBXL21 in groups 3 and 4 were confirmed in the Northcott MAGIC MB dataset, in the Pfister MB dataset, and in the Gilbertson dataset, all available in the R2 Genomics platform.
FBXW7
FBXW7 expresssion was depressed in all 4 subgroups compared to the NT group in the Swartling dataset (Figure 14A). However FBXW7 expression was specifically elevated in one of the SHH MB subtypes in the Cavalli dataset, the SHH gamma subtype (Figure 14B), a subtype whose subjects are infants of less than 3 years of age. The SHH gamma subtype was the only subtype in which expression of FBXW7 was significantly elevated compared to all other subtype groups, including NT controls. Kaplan-Meier analysis showed that high expression of FBXW7 was protective (Table 2).
MYCBP2
MYCBP2 is a gene which encodes a ubiquitin ligase (aka PAM, protein associated with MYC) reportedly necessary for normal CNS development [65] and required for the degradation of the NR1D1 encoded protein REV-ERBα [66]. Expression of MYCBP2 was highest in Cavalli Group 4 and lowest in the WNT group. Differential expression of this gene was among the highest statistical significance. (Figure 15; Table 1).
USP2 – A Gene Encoding a Deubiquitinase for Clock Genes
USP2 is an enzyme which deubiquitinates various proteins, including BMAL1, CRY1 and PER1 [29,30,33], and regulates the distribution of PER1 between nucleus and cytoplasm [33]. Elevated expression of the USP2 gene was associated with Group 3 MB (Figure 16). High expression of USP2 was associated with poor survival (Chi squared = 21.73, p = 3.14 x 10-06). By Cox proportional hazard ratio (HR) analysis of all the clock genes in Table 2, USP2 had the most significant HR (p = 3.5 x 10⁻⁵).
3.3. AANAT Is Over-Expressed in MB Group 3
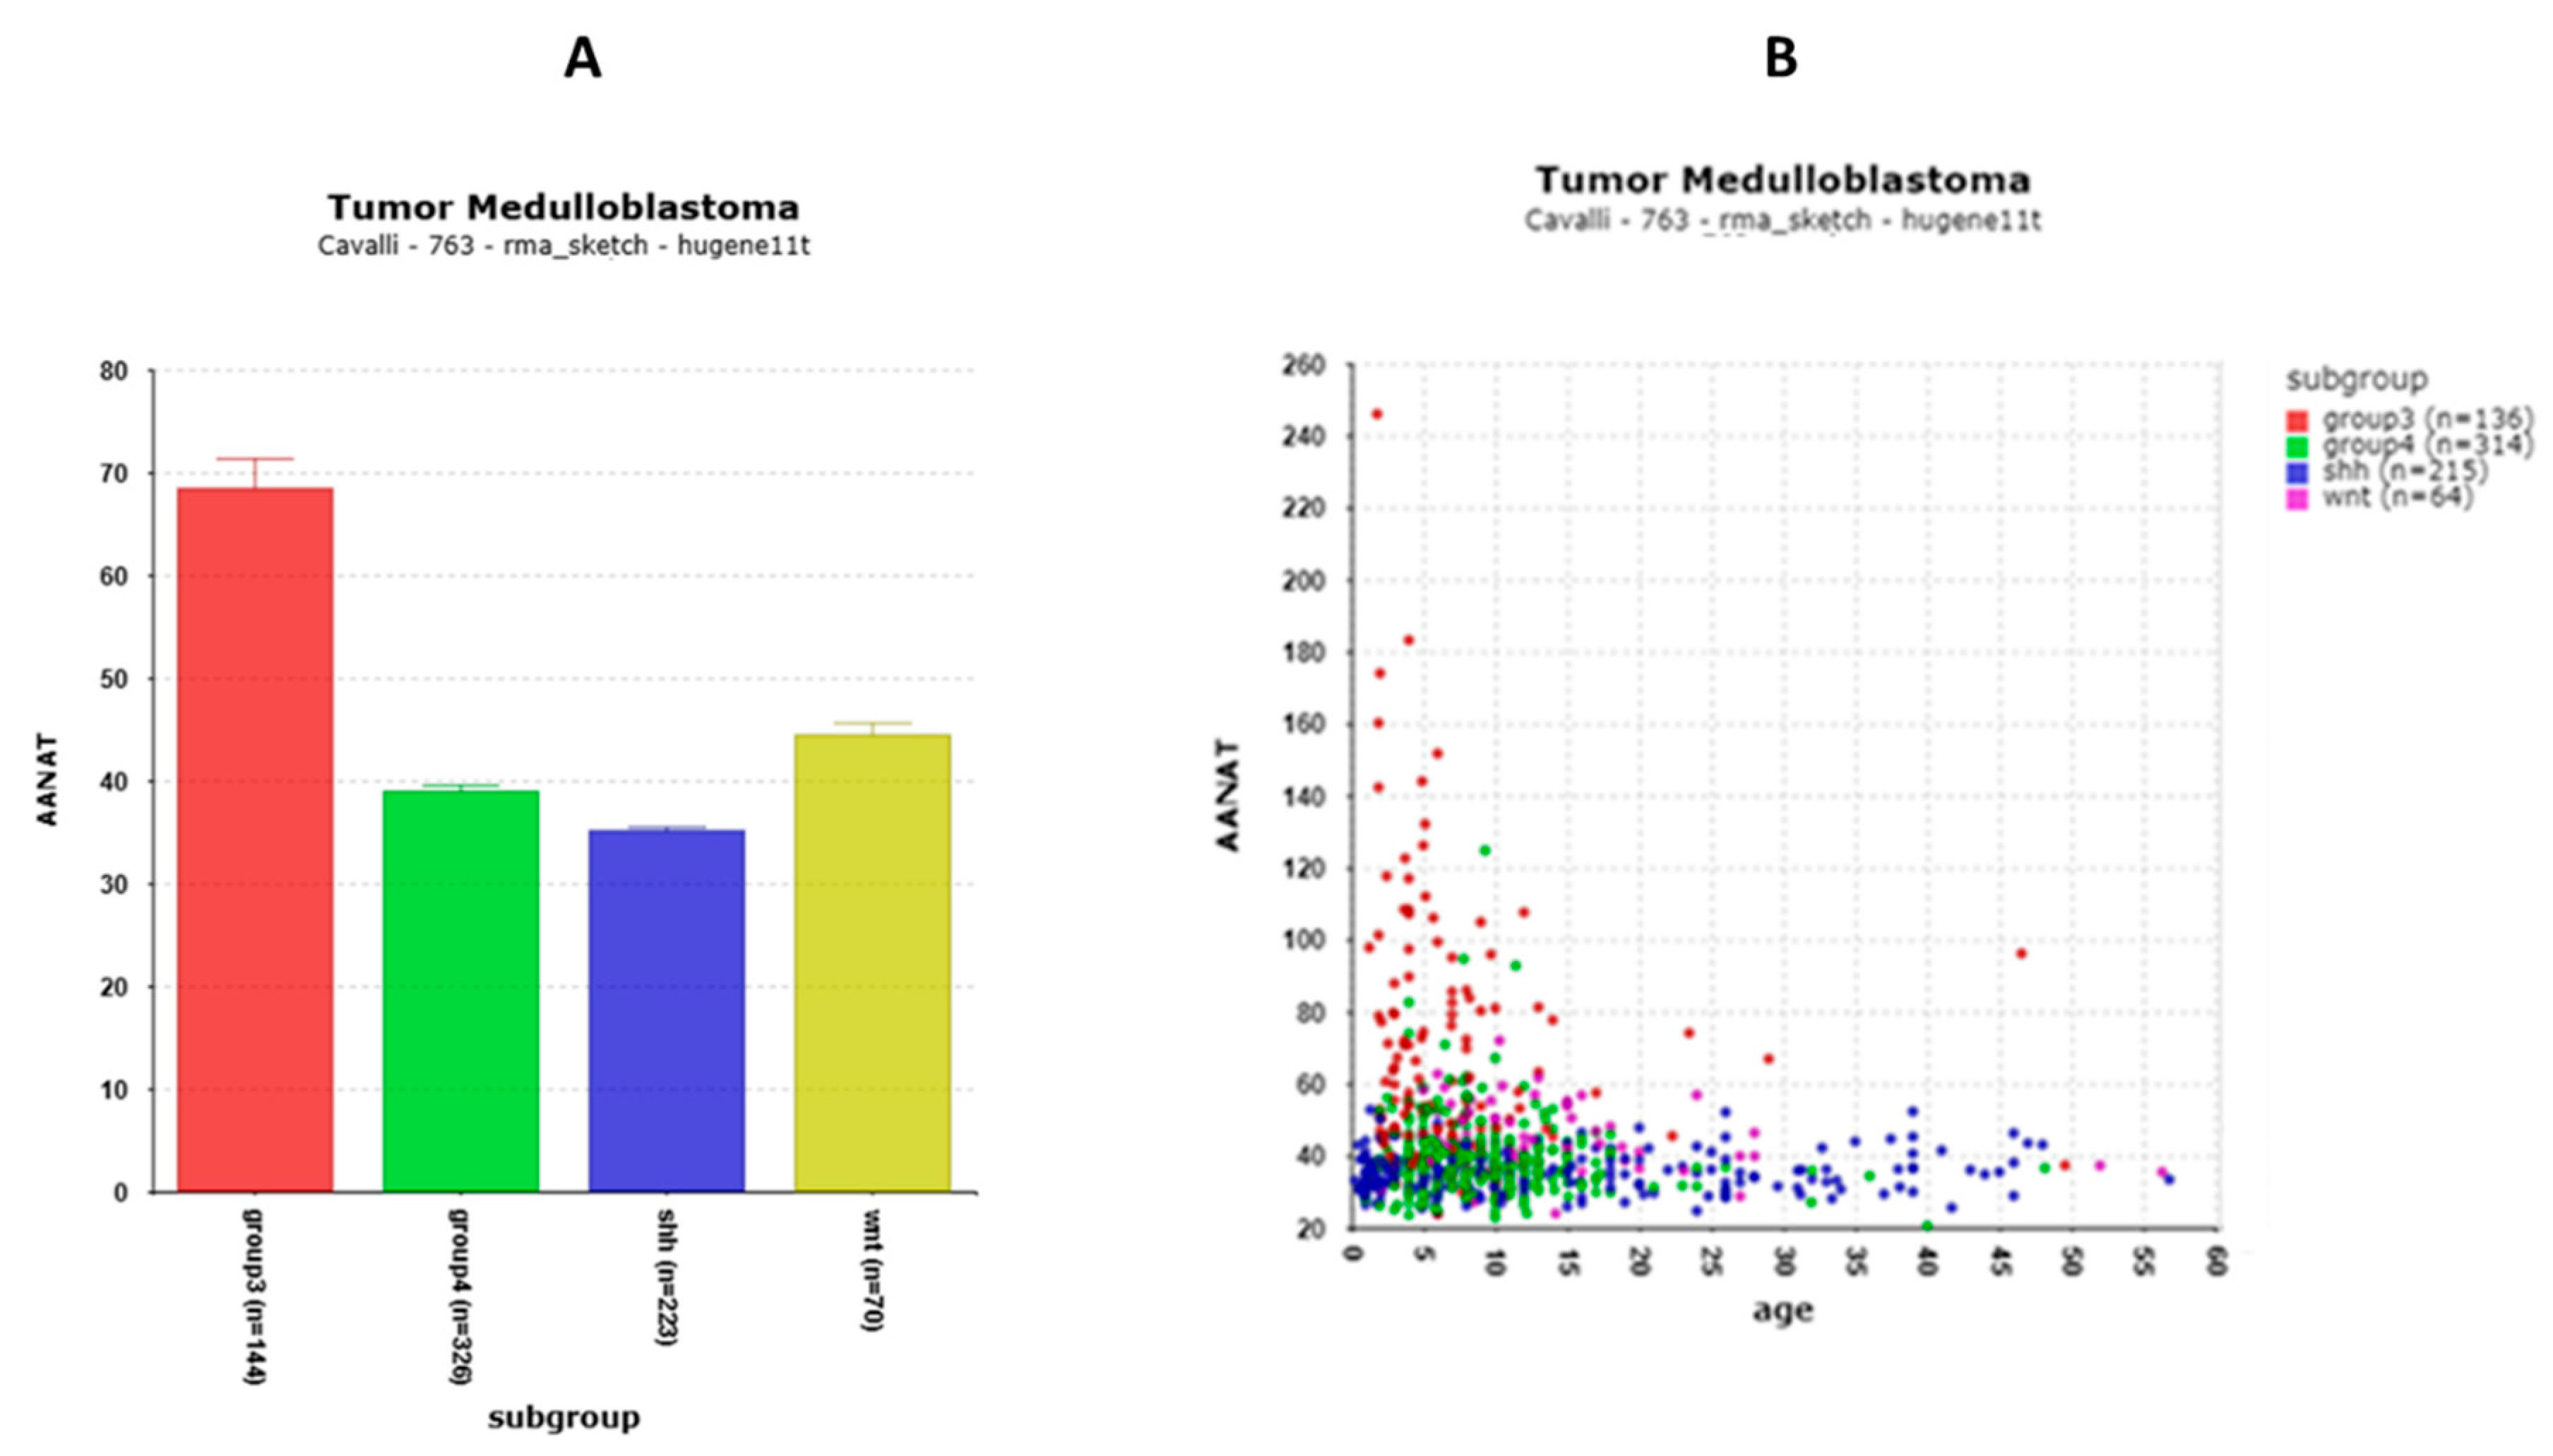
Since melatonin has been associated with circadian rhythms and clock gene expression we examined the expression of the gene encoding the rate-limiting enzyme of melatonin synthesis, AANAT (Aralkylamine N-Acetyltransferase) [67] in MB subgroups. While AANAT data were not available in the Swartling dataset, the Cavalli data show that AANAT expression was signficantly greater in Group 3 MBs than in the other groups (Fig, 17A). More specifically the elevation in AANAT expression was observed primarily in a subtype of Group 3 MBs, the Group 3 alpha subtype. AANAT expression was elevated primarily in young children (Figure 17B).
Figure 17.
A. AANAT expression high in MB Group 3. F= 127.15.09, p = 9.93 x 10-67 B. Age related expression of AANAT.
Figure 17.
A. AANAT expression high in MB Group 3. F= 127.15.09, p = 9.93 x 10-67 B. Age related expression of AANAT.
3.4. Clock Genes and Survival in the Cavalli Dataset
Several clock genes were significantly associated with survival in the Cavalli dataset. Table 2 shows the Chi squared and p values for Kaplan-Meier analysis of survival curves (high vs low scan) of clock related genes, in order of significance. Also included in Table 2 are the significant hazard ratios, as determined by the Cox proportional hazard analysis.
The three most significant Kaplan-Meier scans, were of CRY1, USP2, and CLOCK expression. Kaplan-Meier analysis showed that high expression of CRY1 and of USP2 were associated with poor survival (CRY1, Chi squared = 22.33, p = 2.29 x 10-06, USP2, Chi squared =21.73, p = 3.14 x 10-06) (Table 2, Figure 18); high expression of CLOCK, on the other hand, was associated with better survival (Chi squared = 20.21, p = 6.96 x 10-06). Expression of CRY1, USP2, and CLOCK were also associated with significant Hazard ratios (Table 2).
Expression of ARNTL2 (BMAL2) and CSNK1D, was also associated with significant Kaplan-Meier scans as well as with signficant Hazard ratios (Table 2). High expression of both of these genes was associated with worse survival (and low expression with survival protection).
Expression of TIMELESS, FBXL21, and BTRC showed significantly different (high vs low expression) Kaplan-Meier scans, but no significant Hazard ratios. At a lower level of significance, high expression of RORB and of NFIL3 were associated with worse survival (Table 2). High expression of CIPC was also associated with lower survival, albeit at a low level of significance (p = 0.046).
3.5. Clock Genes Correlates: Pathway Analysis in the Cavalli Dataset
Table 4 shows the correlates for each of the clock genes and the most significant KEGG pathways associated with them. The number of correlates of clock genes (at r > 0.50) varied from zero to over 1000. The highest number of significant correlates were for the clock related gene loci CIPC (1063 genes), THRA/NR1D1 (1041 genes), FBXL21 (605 genes) and MYCBP2 (183 genes).
KEGG analysis identified the most over-represented pathway for correlates of each of these 4 genes as the ribosome pathway (CIPC, p = 1.34 x 10-73; THRA/NR1D1, p = 1.44 x 10-80; FBXL21, p = 2.32 x 10-74; MYCBP2, p = 1.34 x 10-48). The expression of these four genes was negatively correlated (r > 0.50) with numerous genes for ribosome subunits (CIPC, 57 genes; THRA/NR1D1, 59 genes; FBXL21, 44 genes, MYCBP2, 29 genes). It should be noted that the most over-represented KEGG pathway for all survival related genes (p < 0.001 by Kaplan Meier analysis) in the Cavalli dataset was the ribosome biogenesis pathway.
The KEGG pathway of phototransduction was the most significant pathway associated with correlates of RORA (with 7 contributing genes), correlates of USP2 (4 contributing genes), as well as for AANAT (4 contributing genes). For each of these 3 genes the correlates included the phototransduction genes GNAT1, GRK1, GUCY2D, RCVRN, genes whose expression was selectively elevated in the Cavalli MB subtype, Group 3 apha. Numerous phototransduction genes were over-expressed in the Group 3 alpha subtype in the Cavalli dataset; they include the rhodopsin gene (RHO) and the gene encoding phosducin (PDC). A detailed analysis of enhanced expression of genes coding for proteins of the phototransduction cascade in MB is beyond the scope of the present manuscript.
In addition for each of the three genes, RORA, USP2, and AANAT the second most significant pathway associated with their correlates was the GABAergic synapse, including the four GABAergic related genes, CACNA1F, GNB3, GNB5, and TRAK2.
3.6. Clock Gene Expression Is Related to Copy Number Gain of Chromosome 17q
A major statistical factor determining expression of clock genes was copy number gain of chromosome 17q (Table 3). This would be expected for genes located on chromosome 17q, such as the THRA/NR1D1 locus, which showed the most significant effect of 17q copy number gain (p = 1.57 x 10-84) vs normal 17q copy number. The increase in expression was substantial (Table 3). The data however show that increased expression associated with copy number gain of chromosome 17q is also found for clock genes not on chromosome 17q, including CIPC (chr 14q), FBXL21 (chr 5q), and MYCBP2 (chr 13). Table 3 shows the statistical effect of 17q copy number gain on clock gene expression in order of significance by t-test.
4. Discussion
It has been estimated that the circadian clock regulates up to 50% of transcription in eukaryotes [69]. Evidence for a role of circadian clock genes in cancer is gradually emerging [70,71]. Here we present gene expression profiling of clock genes in the four major subgroups of medulloblastoma; furthermore the availability of the batch adjusted meta-analysis dataset of Weishaupt et al. [41] enabled a comparison of gene expression to that of NT brain tissue. We show that the prognostic significance of selected clock genes depends on the molecular subgroups of MB defined (Group3, Group 4, SHH, and WNT) and to some extent, on the 12 molecular subtypes reported by Cavalli et al. [40]. While we observed significant MB subgroup differences in expression for most the of clock genes, we focus the discussion on those that are associated with transcription of other genes, those that are most significantly associated with survival and those that have potential therapeutic relevance.
The transcription translation feedback model provides a functional paradigm that explains circadian variations in clock genes [1]. A number of the clock genes are active as transcription factors or transcription repressors. Querying Cytoscape for molecular functions of these genes we found the most significant GO (Gene ontology) molecular term associated with the genes of Table 1 was E-box binding. The reviews of Cox and Takahashi [5,19] illustrate the role of E-box binding in clock controlled genes. The E-box regulators BMAL1, CLOCK, CRY1 and PER1, as proteins (Figure 1), play a role in several cancers [72,73,74] and MB should be added to the list of those cancers. E-box binding transcription factors (EBTFs) in cancer have been reviewed by Pan, Watt and Kay [75].
Cox and Takahashi point out that that the characterization of the human clock mechanisms are not nearly complete [19]. Our analysis of clock gene expression, showing MB group specific variations in clock genes suggest that transcription translation feedback loops in clock genes are present in MB tissue and that they operate differentially in the tissues of the 4 consensus MB subtypes. We also identify the clock genes whose expression is related to copy number gain of chromosome 17q, a common genetic aberration in Groups 3 and 4 MB. Furthermore, our correlation analysis shows the major biological pathways associated with expression of clock genes The present results suggest that the MB subgroups provide novel in vitro models for further study of regulation of clock genes and proteins, and furthermore show that expression of some of the clock genes are strongly associated with patient survival in MB.
CRY1 and USP2 and Survival in Group 3 MB
The gene expression data (Figure 4A) highlight CRY1 as a defining factor in Group 3 medulloblastoma (MB), particularly in pediatric cases (Figure 4C). High CRY1 expression, noted in Group 3—the MB group with the worst survival—correlates with poor prognosis (Table 2). CRY1, a circadian rhythm regulator, is also implicated in DNA repair and tumorigenesis in cancers such as prostate cancer, making it a potential therapeutic target in Group 3 MB. High CRY1 levels likely disrupt BMAL1/CLOCK-induced transcription, further contributing to the malignancy.
CRY1 stability is regulated by ubiquitination and deubiquitination (Figure 1). USP2, a deubiquitinase, stabilizes CRY1 by protecting it from proteasomal degradation, enhancing its negative feedback role in the circadian loop. USP2 is overexpressed in Group 3 MB, particularly in young children, and is linked to survival outcomes (Table 2). Pathway analysis (Table 4) indicates that USP2 correlates significantly with phototransduction and visual perception pathways, suggesting its circadian function is dysregulated in MB.
As an oncogene, USP2 has been suggested as a therapeutic target in cancers. USP2 inhibitors have been reported [76,77] and could be tested for their effects on MB tumorigenesis and tumor cell proliferation. Additionally, the SCF-FBXL3 ubiquitin ligase complex plays a role in CRY1 degradation, with mutations in FBXL3 leading to CRY1 accumulation. Targeting the CRY1-USP2 feedback loop (Figure 1) offers a promising avenue for therapeutic intervention in Group 3 MB.
PERIOD Genes and CSNK1D in MB: Role of Phosphorylation
The PER1 and PER2 genes encode transcriptional repressors that inhibit CLOCK/BMAL (Figure 1). The USP2 protein binds and deubiquitinates PER1, regulating its nuclear localization [31,78]. Ubiquitination of period genes is mediated by the BTRC ligase [19]. CSNK1D, which encodes CK1δ, phosphorylates PER1 and PER2 proteins prior to their degradation [51]. Over-expression of CSNK1D is observed in various cancers [79], and in Group 3 and 4 MB (Figure 7), with high expression linked to poor survival (Table 2). Inhibition of CK1δ using PF-670462 has shown potential in reducing PER1, PER2, and other clock genes in rats [80] and is suggested as a cancer therapeutic [79].
The TIMELESS Connection to MB
The TIMELESS gene, encoding the TIM protein, interacts with PER2 and CRY2 [48,49]. Elevated TIMELESS expression is found in Group 3, Group 4, and WNT MB (Figure 6), and high expression correlates with poor survival (Table 2). Over-expression of TIMELESS is linked to poor prognosis in various cancers [49] and has been suggested as a therapeutic target. TIMELESS also contributes to DNA stability during replication [50], with pathway analysis (Table 4) highlighting the Fanconi anemia pathway, associated with medulloblastoma risk [81].
Clock Genes, Ribosome Connection, and Copy Number Gain of Chromosome 17q
Our analysis (Table 4) shows that the expression of four clock gene loci—THRA/NR1D1, CIPC, FBXL21, and MYCBP2—highly correlates with the ribosome biogenesis pathway. High expression of these genes inversely correlates with ribosome subunit gene transcription, with THRA/NR1D1 showing the strongest correlation (59 ribosome subunit genes). These four genes are most highly expressed in Group 4 MB (Table 1), suggesting dysregulation of clock genes affects ribosome biogenesis.
THRA/NR1D1, located on 17q, is elevated in individuals with 17q copy number gain, as shown in Table 3, along with CIPC, FBXL21, and MYCBP2. We propose the hypothesis that the isochromosome 17q aberration in MB leads to elevated clock gene expression and reduced ribosomal protein gene transcription.
NR1D1 (REV-ERBα) and CIPC influence CLOCK/BMAL1-induced transcription (Figure 1 and Figure 8), with CIPC inhibiting this pathway [64]. Jouffe et al. [82] and Pelletier et al. [83] highlighted the coordination between clock genes and ribosomal biogenesis. Our findings suggest that clock genes are linked to subgroup-specific ribosome expression in MB, supporting the view that MB cell lines could provide insights into ribosome biogenesis. Our Kaplan-Meier survival analysis indicates that the ribosome biogenesis pathway is the most significant KEGG pathway associated with all survival related genes in the Cavalli dataset.
Clock Genes, the Casein Kinase Connection, and Copy Number Gain of Chromosome 17q
CSNK1D1 is one of two clock gene loci located on chromosome 17q. Expression of both THRA/NR1D1 and CSNK1D1 are associated, at a very high statistical level, with 17q copy number gain Table 3). CSNK1D1 encodes a kinase protein that can phosphorylate a number of proteins including the PERIOD proteins and as such has been described as a major non-transcriptional regulator of circadian rhythms [84]. We suggest further study of CK1δ inhibitors (particularly those that cross the blood brain barrier) as potential therapeutic agents in individuals with copy number gain of chromosome 17q.
AANAT Another Chromosome 17q Gene Associated with Phototransduction
Since melatonin has been associated with circadian rhythms and reported to interact with BMAL1 [67], we examined the expression of AANAT, the gene encoding the rate limiting enzyme in synthesis of melatonin. AANAT is another gene located on chromosome 17q. However, no significant increase in expression was found in individuals with copy number gain of 17q (Table 3).
The expression of AANAT was elevated specifically in Group 3 (Figure 17), more specifically in Group 3 alpha. Correlation analysis showed that the biological pathways most significantly correlated with AANAT expression were the phototransduction pathway (Table 4). Our analysis relates AANAT expression to numerous phototransduction genes overexpressed in the Group 3 subgroup of the Cavalli dataset. One interpretation, that has not been disproved, is that the cell type of origin of Group 3 alpha is a photoreceptor precursor cell expressing phototransducton genes and AANAT. This developmental pattern of expression also appears to be found in the neonatal rat pineal AANAT [85].
Ubiquitin Proteasome Pathway Regulation of Clock Genes in MB
Figure 1 shows the role of ubiquitin ligases in the degradation of clock proteins, including F-box motif proteins that serve as adaptors for E3 ubiquitin ligase complexes. Several genes coding for ubiquitin ligases or adaptors are differentially expressed in MB at high significance.
FBXL15 has the lowest expression in the SHH MB subgroup (Figure 12B). FBXL15, a substrate adaptor, plays a role in resetting the circadian clock in Drosophila by degrading the TIM protein and also contributes to the degradation of SMURF1 in the SHH pathway [86,87]. FBXL21 shows one of the most significant differential expressions (Table 1). The FBXL21 protein binds to CRY proteins and opposes FBXL3's action on CRY degradation [23]. It is implicated in the central circadian clock in mammals [22], although its classification as a pseudogene in humans remains debated.
Summary of Pathway Analysis of Clock Gene Correlates
Table 4 summarizes the results of the KEGG pathway analysis of genes whose expression was most significantly correlated with that of clock genes. Table 4 lists the clock genes, the number of genes correlated with their expression, and the biological pathways over-represented in these lists of genes; the clock genes are listed in order of the p value for the most significant KEGG pathway. It is not a comprehensive study of all biological pathways associated with clock genes.

Table 4.
Pathway analysis of clock genes.
| CLOCK genes | Number of correlates r > 0.50 | Most significant KEGG pathways over-represented | # of genes representing pathway | p value for pathway |
|---|---|---|---|---|
| THRA/NR1D1 | 1041 | ribosome | 59 | 1.44 x 10-80 |
| CIPC (KIAA1737) | 1063 | ribosome | 57 | 1.34 x 10-73 |
| FBXL21 | 605 | ribosome | 44 | 2.32 x 10-74 |
| MYCBP2 | 423 | ribosome | 29 | 1.34 x 10-48 |
| UTS2/PER3 | 18 | circadian rhythm | 3 | 2.62 x 10-43 |
| RORA | 184 | phototransduction | 7 | 2.30 x 10⁻³³ |
| NPAS2 | 85 | synaptic vesicle cycle | 6 | 2.09 x 10⁻²¹ |
| CRY2 | 52 | GABAergic synapse | 5 | 4.38 x 10⁻¹⁹ |
| TIMELESS | 31 | Fanconi anemia | 3 | 1.07 x 10⁻¹⁸ |
| BTRC | 34 | Oocyte meiosis | 4 | 5.61 x 10⁻¹² |
| USP2 | 161 | phototransduction | 4 | 1.74 x 10⁻¹¹ |
| AANAT | 157 | phototransduction | 4 | 1.74 x 10⁻¹¹ |
| BHLHE40 | 148 | WNT signaling | 10 | 2.47 x 10-09 |
| DBP | 62 | GABAergic synapse | 4 | 3.98 x 10-09 |
| FBXW7 | 88 | morphine addiction | 5 | 3.98 x 10-08 |
| NFIL3 | 82 | Hippo signaling | 5 | 3.28 x 10-06 |
| CSNK1D | 105 | prolactin signaling | 4 | 3.45 x 10-06 |
| CRY1 | 139 | peroxisome | 4 | 1.12 x 10-03 |
| PER2 | 22 | circadian rhythm | 1 | 2.13 x 10-03 |
| FBXL3 | 37 | circadian rhythm | 1 | 4.90 x 10-02 |
| ARNTL (BMAL1) | 8 | * | ||
| ARNTL2 (BMAL2) | 0 | * | ||
| PER1 | 5 | * | ||
| RORB | 0 | * | ||
| LINGO4/RORC | 0 | * | ||
| FBXL15 | 0 | * |
*no KEGG pathway detected at cutoff of r > 0..
The ribosome pathway was the most significant pathway associated with clock gene correlates, particularly in relation to copy number gain of chromosome 17q. We hypothesize that one or more clock genes regulate ribosome subunit gene expression at one or more stages in the ribosome biogenesis pathway. The significant correlations of NR1D1 and CIPC expression with other genes (Table 4) suggest that REV-ERBα and CIPC may regulate transcription, including ribosome subunit genes. FBXL21 and MYCBP2, which encode ubiquitin ligase components, could regulate the degradation of clock proteins involved in feedback on the CLOCK/BMAL complex (Figure 1).
The phototransduction pathway was linked to RORA, USP2, and AANAT correlates, with over-expression seen in MB Group 3 alpha (Table 4). Hooper et al. [55] showed the Group 3 MB expression profiles were similar to that of retinal rod cell precursors. We suggest the hypothesis that RORA may stimulate transcription of phototransduction genes in the Group 3 alpha subtype.
Other significant KEGG pathways associated with clock gene correlates include the GABAergic synapse, synaptic vesicle cycle, Fanconi anemia, WNT signaling, Hippo signaling, and peroxisome pathways (Table 4), indicating potential mechanisms by which clock genes influence gene transcription in MB.
5. Conclusions
We identified clock gene expression differences in public MB datasets, with major variations between MB subgroups and subtypes. Aberrations in clock gene expression and feedback were group-specific, with major differences noted for THRA/NR1D1 and CIPC loci. Key genes encoding proteins involved in clock protein degradation, including FBXL21, FBXL3, FBXL15, MYCBP2, and the deubiquitinase USP2, also showed differential expression.
Copy number gain of chromosome 17q was associated with increased clock gene expression, both for genes on 17q and on other chromosomes, suggesting that the isochromosome 17q syndrome significantly affects clock gene transcription in MB subgroups.
The ribosome pathway was the most significant KEGG pathway associated with clock gene expression, and it also correlated with survival, likely due to 17q copy number gain.
Pathway analysis of clock gene correlates also showed associations with phototransduction, GABAergic, synaptic vesicle, WNT signaling, and Fanconi anemia pathways, with E-box binding being the most significant GO molecular term. MB should be considered a cancer in which E-box regulators play a role.
Kaplan-Meier analysis identified clock genes CRY1, USP2, CLOCK, MYCBP2, and TIMELESS as survival-related, with high expression of CRY1, USP2, MYCBP2, and TIMELESS linked to poor survival, and CLOCK to survival protection. These genes could serve as potential therapeutic targets in MB subgroups and ubtypes. Methods targeting E-box regulators, including protein degradation strategies, should be explored for those currently lacking specific inhibitors.
Author Contributions
Conceptualization, JV;, methodology, JV; Formal Analysis, JV; Investigation, JV; Writing – original draft preparation, JV; Writing –review and editing, AG; Project administration , JV; .
Funding
This research received no external funding.
Data Availability Statement
The data referred to in this manuscript are publivcly available (GEO ID: GSE124814) and at the R2 Genomics Analysis and Visualization Platform (http://r2:amc.nl) and are available upon reasonable request from the corresponding author.
Conflicts of Interest
The authors declare no conflicts of interest.
References
- Huang, R.C. The discoveries of molecular mechanisms for the circadian rhythm: The 2017 Nobel Prize in Physiology or Medicine. Biomed J. 2018, 41, 5–8. [Google Scholar] [CrossRef]
- Buhr, E.D.; Takahashi, J.S. Molecular components of the Mammalian circadian clock. Handb Exp Pharmacol. 2013, 3–27. [Google Scholar]
- Lamia, K.A.; Storch, K.F.; Weitz, C.J. Physiological significance of a peripheral tissue circadian clock. Proc Natl Acad Sci U S A. 2008, 105, 15172–15177. [Google Scholar] [CrossRef]
- Balsalobre, A. Clock genes in mammalian peripheral tissues. Cell Tissue Res. 2002, 309, 193–199. [Google Scholar] [CrossRef]
- Cox, K.H.; Takahashi, J.S. Circadian clock genes and the transcriptional architecture of the clock mechanism. J Mol Endocrinol. 2019, 63, R93–R102. [Google Scholar] [CrossRef]
- Zhang, R.; Lahens, N.F.; Ballance, H.I.; Hughes, M.E.; Hogenesch, J.B. A circadian gene expression atlas in mammals: Implications for biology and medicine. Proc Natl Acad Sci U S A. 2014, 111, 16219–16224. [Google Scholar] [CrossRef]
- Savvidis, C.; Koutsilieris, M. Circadian rhythm disruption in cancer biology. Mol Med. 2012, 18, 1249–1260. [Google Scholar] [CrossRef] [PubMed]
- Papagiannakopoulos T, Bauer MR, Davidson SM, Heimann M, Subbaraj L, Bhutkar A; et al. Circadian Rhythm Disruption Promotes Lung Tumorigenesis. Cell Metab. 2016, 24, 324–331.
- Sulli, G.; Lam, M.T.Y.; Panda, S. Interplay between Circadian Clock and Cancer: New Frontiers for Cancer Treatment. Trends Cancer. 2019, 5, 475–494. [Google Scholar] [CrossRef] [PubMed]
- Reszka, E.; Zienolddiny, S. Epigenetic Basis of Circadian Rhythm Disruption in Cancer. Methods Mol Biol. 2018, 1856:173-201.
- Numata M, Hirano A, Yamamoto Y, Yasuda M, Miura N, Sayama K; et al. Metastasis of Breast Cancer Promoted by Circadian Rhythm Disruption due to Light/Dark Shift and its Prevention by Dietary Quercetin in Mice. J Circadian Rhythms. 2021, 19:2.
- Stevens, R.G.; Brainard, G.C.; Blask, D.E.; Lockley, S.W.; Motta, M.E. Breast cancer and circadian disruption from electric lighting in the modern world. CA Cancer J Clin. 2014, 64, 207–218. [Google Scholar] [CrossRef]
- Huang, C.; Zhang, C.; Cao, Y.; Li, J.; Bi, F. Major roles of the circadian clock in cancer. Cancer Biol Med. 2023, 20, 1–24. [Google Scholar] [CrossRef] [PubMed]
- Straif K, Baan R, Grosse Y, Secretan B, El Ghissassi F, Bouvard V; et al. Carcinogenicity of shift-work, painting, and fire-fighting. Lancet Oncol. 2007, 8, 1065–1066.
- Zhou, L.; Zhang, Z.; Nice, E.; Huang, C.; Zhang, W.; Tang, Y. Circadian rhythms and cancers: The intrinsic links and therapeutic potentials. J Hematol Oncol. 2022, 15, 21. [Google Scholar] [CrossRef] [PubMed]
- Srikanta, S.B.; Cermakian, N. To Ub or not to Ub: Regulation of circadian clocks by ubiquitination and deubiquitination. J Neurochem. 2021, 157, 11–30. [Google Scholar] [CrossRef] [PubMed]
- Yin, L.; Wu, N.; Lazar, M.A. Nuclear receptor Rev-erbalpha: A heme receptor that coordinates circadian rhythm and metabolism. Nucl Recept Signal. 2010, 8:e001.
- Zhang-Sun ZY, Xu XZ, Escames G, Lei WR, Zhao L, Zhou YZ; et al. Targeting NR1D1 in organ injury: Challenges and prospects. Mil Med Res. 2023, 10, 62.
- Cox, K.H.; Takahashi, J.S. Introduction to the Clock System. Adv Exp Med Biol. 2021, 1344:3-20.
- Busino L, Bassermann F, Maiolica A, Lee C, Nolan PM, Godinho SI; et al. SCFFbxl3 controls the oscillation of the circadian clock by directing the degradation of cryptochrome proteins. Science. 2007, 316, 900–904.
- Siepka SM, Yoo SH, Park J, Song W, Kumar V, Hu Y; et al. Circadian mutant Overtime reveals F-box protein FBXL3 regulation of cryptochrome and period gene expression. Cell. 2007, 129, 1011–1023.
- Dardente, H.; Mendoza, J.; Fustin, J.M.; Challet, E.; Hazlerigg, D.G. Implication of the F-Box Protein FBXL21 in circadian pacemaker function in mammals. PLoS ONE. 2008, 3, e3530. [Google Scholar] [CrossRef] [PubMed]
- Hirano A, Yumimoto K, Tsunematsu R, Matsumoto M, Oyama M, Kozuka-Hata H; et al. FBXL21 regulates oscillation of the circadian clock through ubiquitination and stabilization of cryptochromes. Cell. 2013, 152, 1106–1118.
- Wirianto M, Yang J, Kim E, Gao S, Paudel KR, Choi JM; et al. The GSK-3beta-FBXL21 Axis Contributes to Circadian TCAP Degradation and Skeletal Muscle Function. Cell Rep. 2020, 32, 108140.
- Reischl S, Vanselow K, Westermark PO, Thierfelder N, Maier B, Herzel H; et al. Beta-TrCP1-mediated degradation of PERIOD2 is essential for circadian dynamics. J Biol Rhythms. 2007, 22, 375–386.
- Takahashi, J.S.; Hong, H.K.; Ko, C.H.; McDearmon, E.L. The genetics of mammalian circadian order and disorder: Implications for physiology and disease. Nat Rev Genet. 2008, 9, 764–775. [Google Scholar] [CrossRef]
- Najumuddin, Fakhar M, Gul M, Rashid S. Interactive structural analysis of betaTrCP1 and PER2 phosphoswitch binding through dynamics simulation assay. Arch Biochem Biophys. 2018, 651:34-42.
- Zhao X, Hirota T, Han X, Cho H, Chong LW, Lamia K; et al. Circadian Amplitude Regulation via FBXW7-Targeted REV-ERBalpha Degradation. Cell. 2016, 165, 1644–1657.
- Tong X, Buelow K, Guha A, Rausch R, Yin L. USP2a protein deubiquitinates and stabilizes the circadian protein CRY1 in response to inflammatory signals. J Biol Chem. 2012, 287, 25280–25291.
- Stojkovic, K.; Wing, S.S.; Cermakian, N. A central role for ubiquitination within a circadian clock protein modification code. Front Mol Neurosci. 2014, 7:69.
- Yang Y, Duguay D, Bedard N, Rachalski A, Baquiran G, Na CH; et al. Regulation of behavioral circadian rhythms and clock protein PER1 by the deubiquitinating enzyme USP2. Biol Open. 2012, 1, 789–801.
- Scoma, H.D.; Humby, M.; Yadav, G.; Zhang, Q.; Fogerty, J.; Besharse, J.C. The de-ubiquitinylating enzyme, USP2, is associated with the circadian clockwork and regulates its sensitivity to light. PLoS ONE. 2011, 6, e25382. [Google Scholar] [CrossRef]
- Kitamura H, Hashimoto M. USP2-Related Cellular Signaling and Consequent Pathophysiological Outcomes. Int J Mol Sci. 2021, 22.
- Siepka, S.M.; Yoo, S.H.; Park, J.; Lee, C.; Takahashi, J.S. Genetics and neurobiology of circadian clocks in mammals. Cold Spring Harb Symp Quant Biol. 2007, 72, 251–259. [Google Scholar] [CrossRef] [PubMed]
- Godinho SI, Maywood ES, Shaw L, Tucci V, Barnard AR, Busino L; et al. The after-hours mutant reveals a role for Fbxl3 in determining mammalian circadian period. Science. 2007, 316, 897–900.
- Taylor MD, Northcott PA, Korshunov A, Remke M, Cho YJ, Clifford SC; et al. Molecular subgroups of medulloblastoma: The current consensus. Acta Neuropathol. 2012, 123, 465–472.
- Cho YJ, Tsherniak A, Tamayo P, Santagata S, Ligon A, Greulich H; et al. Integrative genomic analysis of medulloblastoma identifies a molecular subgroup that drives poor clinical outcome. J Clin Oncol. 2011, 29, 1424–1430.
- Kool M, Koster J, Bunt J, Hasselt NE, Lakeman A, van Sluis P; et al. Integrated genomics identifies five medulloblastoma subtypes with distinct genetic profiles, pathway signatures and clinicopathological features. PLoS ONE. 2008, 3, e3088. [Google Scholar]
- Northcott PA, Korshunov A, Witt H, Hielscher T, Eberhart CG, Mack S; et al. Medulloblastoma comprises four distinct molecular variants. J Clin Oncol. 2011, 29, 1408–1414.
- Cavalli FMG, Remke M, Rampasek L, Peacock J, Shih DJH, Luu B; et al. Intertumoral Heterogeneity within Medulloblastoma Subgroups. Cancer Cell. 2017, 31, 737–754.
- Weishaupt H, Johansson P, Sundstrom A, Lubovac-Pilav Z, Olsson B, Nelander S; et al. Batch-normalization of cerebellar and medulloblastoma gene expression datasets utilizing empirically defined negative control genes. Bioinformatics. 2019, 35, 3357–3364.
- Yamanaka, Y.; Suzuki, Y.; Todo, T.; Honma, K.; Honma, S. Loss of circadian rhythm and light-induced suppression of pineal melatonin levels in Cry1 and Cry2 double-deficient mice. Genes Cells. 2010, 15, 1063–1071. [Google Scholar] [CrossRef] [PubMed]
- Brzezinski, A.; Rai, S.; Purohit, A.; Pandi-Perumal, S.R. Melatonin, Clock Genes, and Mammalian Reproduction: What Is the Link? Int J Mol Sci. 2021, 22(24).
- Sato F, Kawamoto T, Fujimoto K, Noshiro M, Honda KK, Honma S; et al. Functional analysis of the basic helix-loop-helix transcription factor DEC1 in circadian regulation. Interaction with BMAL1. Eur J Biochem. 2004, 271, 4409–4419.
- Kiss, Z.; Mudryj, M.; Ghosh, P.M. Non-circadian aspects of BHLHE40 cellular function in cancer. Genes Cancer. 2020, 11, 1–19. [Google Scholar] [CrossRef]
- Chaves I, Pokorny R, Byrdin M, Hoang N, Ritz T, Brettel K; et al. The cryptochromes: Blue light photoreceptors in plants and animals. Annu Rev Plant Biol. 2011, 62, 335–364.
- Schwartz, W.J.; Tavakoli-Nezhad, M.; Lambert, C.M.; Weaver, D.R.; de la Iglesia, H.O. Distinct patterns of Period gene expression in the suprachiasmatic nucleus underlie circadian clock photoentrainment by advances or delays. Proc Natl Acad Sci U S A. 2011, 108, 17219–17224. [Google Scholar] [CrossRef]
- Kurien P, Hsu PK, Leon J, Wu D, McMahon T, Shi G; et al. TIMELESS mutation alters phase responsiveness and causes advanced sleep phase. Proc Natl Acad Sci U S A. 2019, 116, 12045–12053.
- Sangoram AM, Saez L, Antoch MP, Gekakis N, Staknis D, Whiteley A; et al. Mammalian circadian autoregulatory loop: A timeless ortholog and mPer1 interact and negatively regulate CLOCK-BMAL1-induced transcription. Neuron. 1998, 21, 1101–1113.
- Vipat, S.; Moiseeva, T.N. The TIMELESS Roles in Genome Stability and Beyond. J Mol Biol. 2024, 436, 168206. [Google Scholar] [CrossRef] [PubMed]
- Camacho F, Cilio M, Guo Y, Virshup DM, Patel K, Khorkova O; et al. Human casein kinase Idelta phosphorylation of human circadian clock proteins period 1 and 2. FEBS Lett. 2001, 489, 159–165.
- Emery, P.; Reppert, S.M. A rhythmic Ror. Neuron. 2004, 43, 443–446. [Google Scholar] [CrossRef]
- Zhang, W.; Xiong, Y.; Tao, R.; Panayi, A.C.; Mi, B.; Liu, G. Emerging Insight Into the Role of Circadian Clock Gene BMAL1 in Cellular Senescence. Front Endocrinol (Lausanne). 2022, 13, 915139. [Google Scholar] [CrossRef]
- Lamb, T.D. Evolution of phototransduction, vertebrate photoreceptors and retina. Prog Retin Eye Res. 2013, 36, 52–119. [Google Scholar] [CrossRef] [PubMed]
- Hooper, C.M.; Hawes, S.M.; Kees, U.R.; Gottardo, N.G.; Dallas, P.B. Gene expression analyses of the spatio-temporal relationships of human medulloblastoma subgroups during early human neurogenesis. PLoS ONE. 2014, 9, e112909. [Google Scholar] [CrossRef] [PubMed]
- Aninye, I.O.; Matsumoto, S.; Sidhaye, A.R.; Wondisford, F.E. Circadian regulation of Tshb gene expression by Rev-Erbalpha (NR1D1) and nuclear corepressor 1 (NCOR1). J Biol Chem. 2014, 289, 17070–17077. [Google Scholar] [CrossRef] [PubMed]
- Lazar, M.A.; Hodin, R.A.; Darling, D.S.; Chin, W.W. A novel member of the thyroid/steroid hormone receptor family is encoded by the opposite strand of the rat c-erbA alpha transcriptional unit. Mol Cell Biol. 1989, 9, 1128–1136. [Google Scholar]
- Preitner N, Damiola F, Lopez-Molina L, Zakany J, Duboule D, Albrecht U; et al. The orphan nuclear receptor REV-ERBalpha controls circadian transcription within the positive limb of the mammalian circadian oscillator. Cell. 2002, 110, 251–260.
- Reppert, S.M.; Weaver, D.R. Coordination of circadian timing in mammals. Nature. 2002, 418, 935–941. [Google Scholar] [CrossRef] [PubMed]
- Gomatou, G.; Karachaliou, A.; Veloudiou, O.Z.; Karvela, A.; Syrigos, N.; Kotteas, E. The Role of REV-ERB Receptors in Cancer Pathogenesis. Int J Mol Sci. 2023, 24. [Google Scholar] [CrossRef] [PubMed]
- Ueda HR, Hayashi S, Chen W, Sano M, Machida M, Shigeyoshi Y; et al. System-level identification of transcriptional circuits underlying mammalian circadian clocks. Nat Genet. 2005, 37, 187–192.
- Keniry, M.; Dearth, R.K.; Persans, M.; Parsons, R. New Frontiers for the NFIL3 bZIP Transcription Factor in Cancer, Metabolism and Beyond. Discoveries (Craiova). 2014, 2, e15. [Google Scholar] [CrossRef]
- Zeng, L.; Chen, D.; Xue, Y.; Zhang, M.; Wu, Y.; Yang, W. A new border for circadian rhythm gene NFIL3 in diverse fields of cancer. Clin Transl Oncol. 2023, 25, 1940–1948. [Google Scholar] [CrossRef]
- Zhao WN, Malinin N, Yang FC, Staknis D, Gekakis N, Maier B; et al. CIPC is a mammalian circadian clock protein without invertebrate homologues. Nat Cell Biol. 2007, 9, 268–275.
- Mabbitt PD, Loreto A, Dery MA, Fletcher AJ, Stanley M, Pao KC; et al. Structural basis for RING-Cys-Relay E3 ligase activity and its role in axon integrity. Nat Chem Biol. 2020, 16, 1227–1236.
- Yin L, Joshi S, Wu N, Tong X, Lazar MA. E3 ligases Arf-bp1 and Pam mediate lithium-stimulated degradation of the circadian heme receptor Rev-erb alpha. Proc Natl Acad Sci U S A. 2010, 107, 11614–11619.
- Beker MC, Caglayan B, Caglayan AB, Kelestemur T, Yalcin E, Caglayan A; et al. Interaction of melatonin and Bmal1 in the regulation of PI3K/AKT pathway components and cellular survival. Sci Rep. 2019, 9, 19082.
- Ferretti, E.; De Smaele, E.; Di Marcotullio, L.; Screpanti, I.; Gulino, A. Hedgehog checkpoints in medulloblastoma: The chromosome 17p deletion paradigm. Trends Mol Med. 2005, 11, 537–545. [Google Scholar] [CrossRef]
- Caster, S.Z.; Castillo, K.; Sachs, M.S.; Bell-Pedersen, D. Circadian clock regulation of mRNA translation through eukaryotic elongation factor eEF-2. Proc Natl Acad Sci U S A. 2016, 113, 9605–9610. [Google Scholar] [CrossRef]
- Cadenas C, van de Sandt L, Edlund K, Lohr M, Hellwig B, Marchan R; et al. Loss of circadian clock gene expression is associated with tumor progression in breast cancer. Cell Cycle. 2014, 13, 3282–3291.
- Nelson N, Lombardo J, Matlack L, Smith A, Hines K, Shi W; et al. Chronoradiobiology of Breast Cancer: The Time Is Now to Link Circadian Rhythm and Radiation Biology. Int J Mol Sci. 2022, 23.
- Li, H.X. The role of circadian clock genes in tumors. Onco Targets Ther. 2019, 12, 3645–3660. [Google Scholar] [CrossRef] [PubMed]
- Battaglin F, Chan P, Pan Y, Soni S, Qu M, Spiller ER; et al. Clocking cancer: The circadian clock as a target in cancer therapy. Oncogene. 2021, 40, 3187–3200.
- Shafi AA, McNair CM, McCann JJ, Alshalalfa M, Shostak A, Severson TM; et al. The circadian cryptochrome, CRY1, is a pro-tumorigenic factor that rhythmically modulates DNA repair. Nat Commun. 2021, 12, 401.
- Pan Y, van der Watt PJ, Kay SA. E-box binding transcription factors in cancer. Front Oncol. 2023, 13, 1223208.
- Mirza, M.U.; Ahmad, S.; Abdullah, I.; Froeyen, M. Identification of novel human USP2 inhibitor and its putative role in treatment of COVID-19 by inhibiting SARS-CoV-2 papain-like (PLpro) protease. Comput Biol Chem. 2020, 89, 107376. [Google Scholar] [CrossRef]
- Davis MI, Pragani R, Fox JT, Shen M, Parmar K, Gaudiano EF; et al. Small Molecule Inhibition of the Ubiquitin-specific Protease USP2 Accelerates cyclin D1 Degradation and Leads to Cell Cycle Arrest in Colorectal Cancer and Mantle Cell Lymphoma Models. J Biol Chem. 2016, 291, 24628–24640.
- Yang Y, Duguay D, Fahrenkrug J, Cermakian N, Wing SS. USP2 regulates the intracellular localization of PER1 and circadian gene expression. J Biol Rhythms. 2014, 29, 243–256.
- Xu P, Ianes C, Gartner F, Liu C, Burster T, Bakulev V; et al. Structure, regulation, and (patho-)physiological functions of the stress-induced protein kinase CK1 delta (CSNK1D). Gene. 2019, 715, 144005.
- Kennaway, D.J.; Varcoe, T.J.; Voultsios, A.; Salkeld, M.D.; Rattanatray, L.; Boden, M.J. Acute inhibition of casein kinase 1delta/epsilon rapidly delays peripheral clock gene rhythms. Mol Cell Biochem. 2015, 398, 195–206. [Google Scholar] [CrossRef] [PubMed]
- Xu J, Margol AS, Shukla A, Ren X, Finlay JL, Krieger MD; et al. Disseminated Medulloblastoma in a Child with Germline BRCA2 6174delT Mutation and without Fanconi Anemia. Front Oncol. 2015, 5, 191.
- Jouffe C, Cretenet G, Symul L, Martin E, Atger F, Naef F; et al. The circadian clock coordinates ribosome biogenesis. PLoS Biol. 2013, 11, e1001455.
- Pelletier, J.; Thomas, G.; Volarevic, S. Ribosome biogenesis in cancer: New players and therapeutic avenues. Nat Rev Cancer. 2018, 18, 51–63. [Google Scholar] [CrossRef]
- Crosby, P.; Partch, C.L. New insights into non-transcriptional regulation of mammalian core clock proteins. J Cell Sci. 2020, 133. [Google Scholar] [CrossRef]
- Blackshaw, S.; Snyder, S.H. Developmental expression pattern of phototransduction components in mammalian pineal implies a light-sensing function. J Neurosci. 1997, 17, 8074–8082. [Google Scholar] [CrossRef] [PubMed]
- Lamaze, A.; Jepson, J.E.C.; Akpoghiran, O.; Koh, K. Antagonistic Regulation of Circadian Output and Synaptic Development by JETLAG and the DYSCHRONIC-SLOWPOKE Complex. iScience. 2020, 23, 100845. [Google Scholar] [CrossRef] [PubMed]
- Yue S, Tang LY, Tang Y, Tang Y, Shen QH, Ding J; et al. Requirement of Smurf-mediated endocytosis of Patched1 in sonic hedgehog signal reception. Elife. 2014, 3.
- Chan, A.B.; Lamia, K.A. Cancer, hear my battle CRY. J Pineal Res. 2020, 69, e12658. [Google Scholar] [CrossRef] [PubMed]
- Crusio, K.M.; King, B.; Reavie, L.B.; Aifantis, I. The ubiquitous nature of cancer: The role of the SCF(Fbw7) complex in development and transformation. Oncogene. 2010, 29, 4865–4873. [Google Scholar] [CrossRef] [PubMed]
- Yeh CH, Bellon M, Nicot C. FBXW7: A critical tumor suppressor of human cancers. Mol Cancer. 2018, 17, 115.
- Virdee, S. An atypical ubiquitin ligase at the heart of neural development and programmed axon degeneration. Neural Regen Res. 2022, 17, 2347–2350. [Google Scholar] [CrossRef] [PubMed]
Figure 1.
Core components of the circadian clock with transcription translation feedback loop. Cry – cryptochrome, Per – Period, BMAL1 (aka ARNTL1) – Aryl Hydrocarbon Receptor Nuclear Translocator-Like Protein 1, BMAL2 (aka ARNTL2) - Aryl Hydrocarbon Receptor Nuclear Translocator-Like Protein 2, CIPC – Clock Interacting Pacemaker, FBXL3 - F-Box And Leucine Rich Repeat Protein 3, FBXL21 - F-Box And Leucine-Rich Repeat Protein 21, BTRC - Beta-Transducin Repeat Containing E3 Ubiquitin Protein Ligase, USP2 - Ubiquitin Specific Peptidase 2. Degradation of CRY/PER proteins by the proteasome leads to decreased negative feedback. .
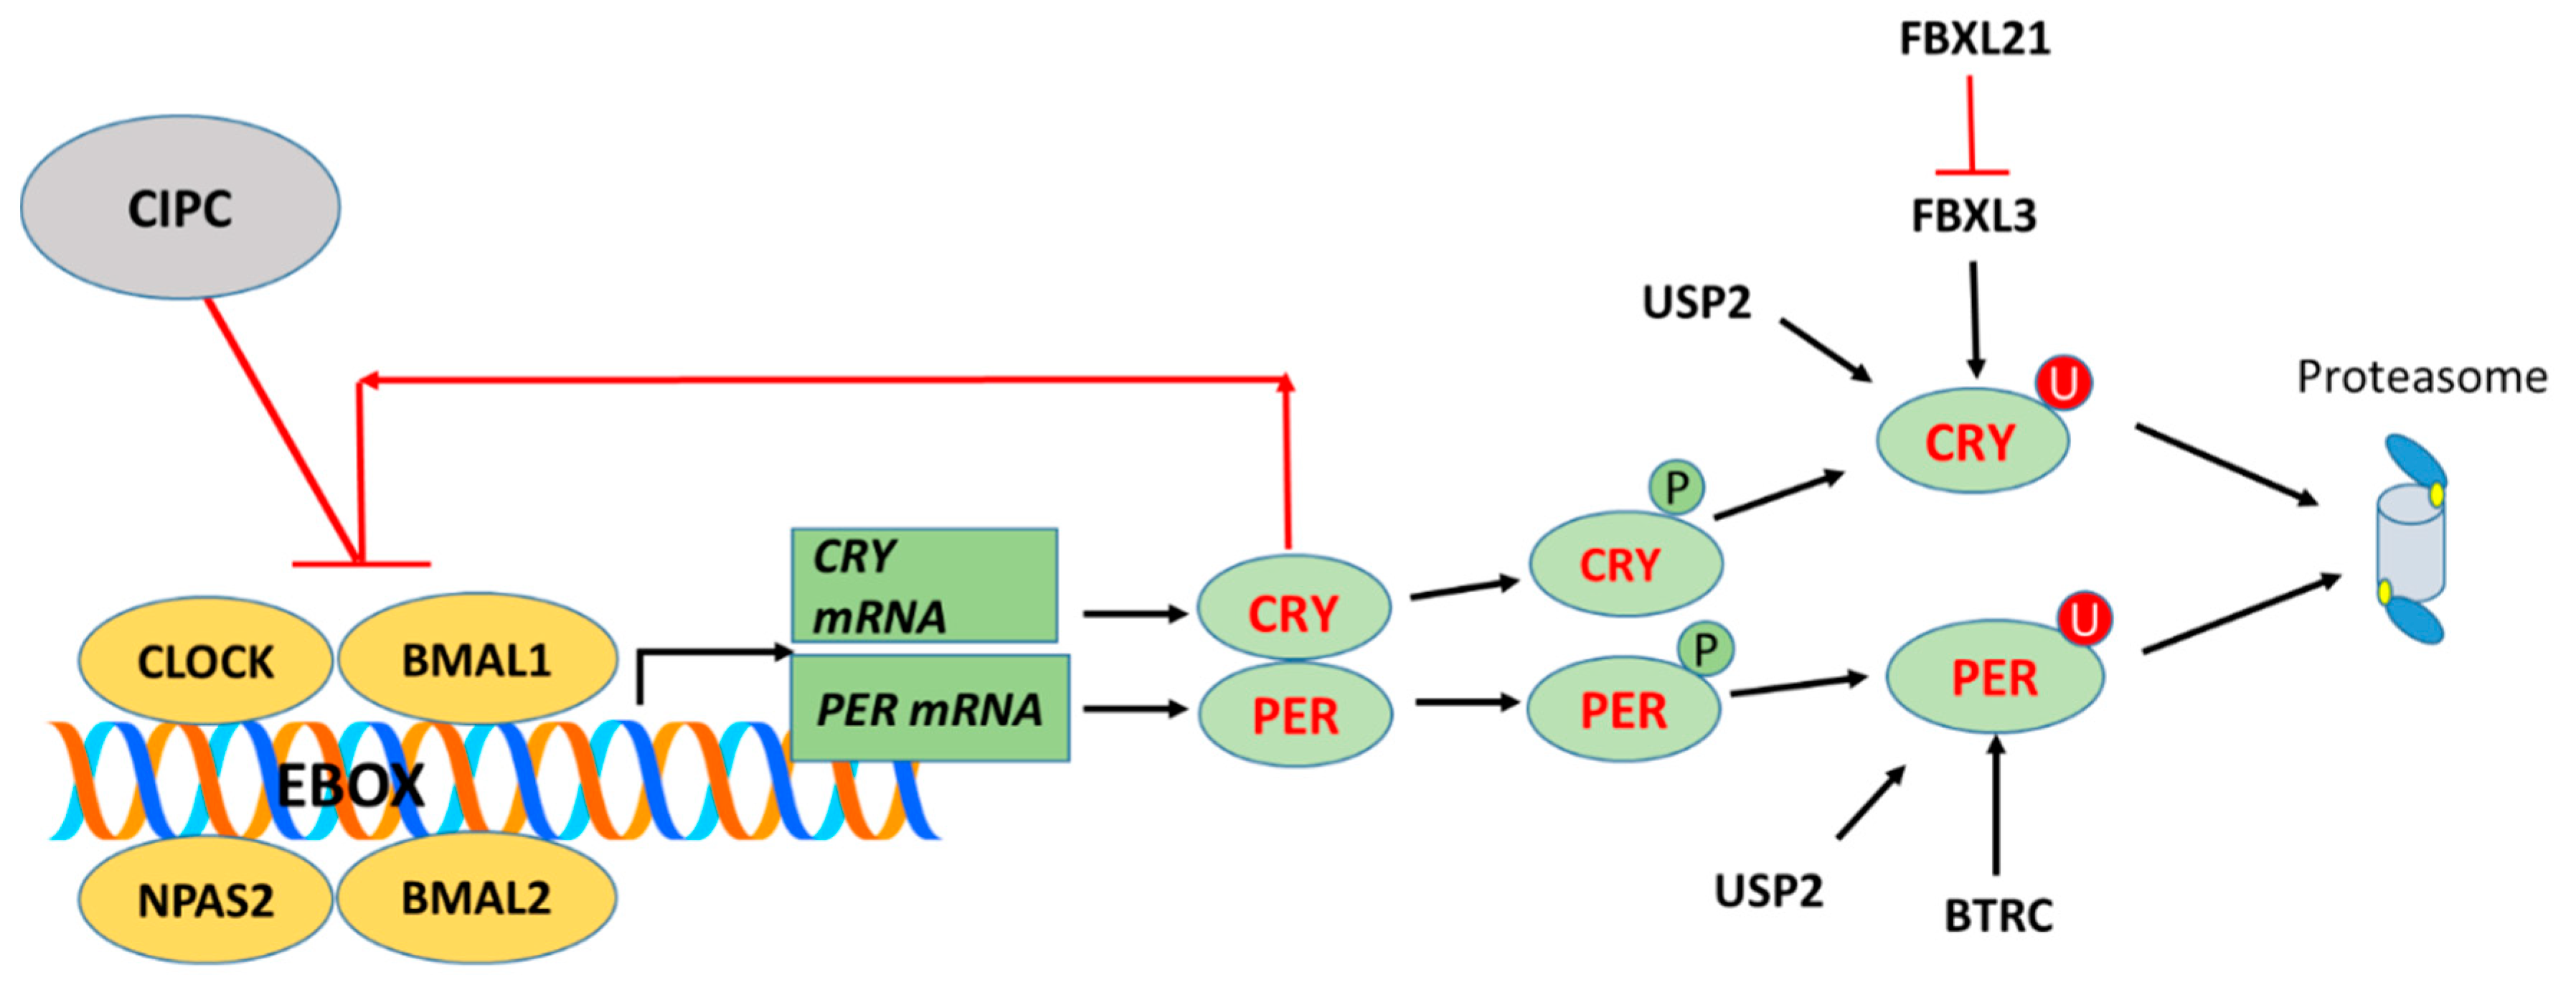
Figure 2.
Heatmap and cluster analysis of expression of clock genes in subgroups of MB. Each column is an individual, each row is a gene, and the color shows the low (blue) to high (red) gene expression levels. The 763 individuals were grouped by the MB molecular subgroups.
Figure 2.
Heatmap and cluster analysis of expression of clock genes in subgroups of MB. Each column is an individual, each row is a gene, and the color shows the low (blue) to high (red) gene expression levels. The 763 individuals were grouped by the MB molecular subgroups.
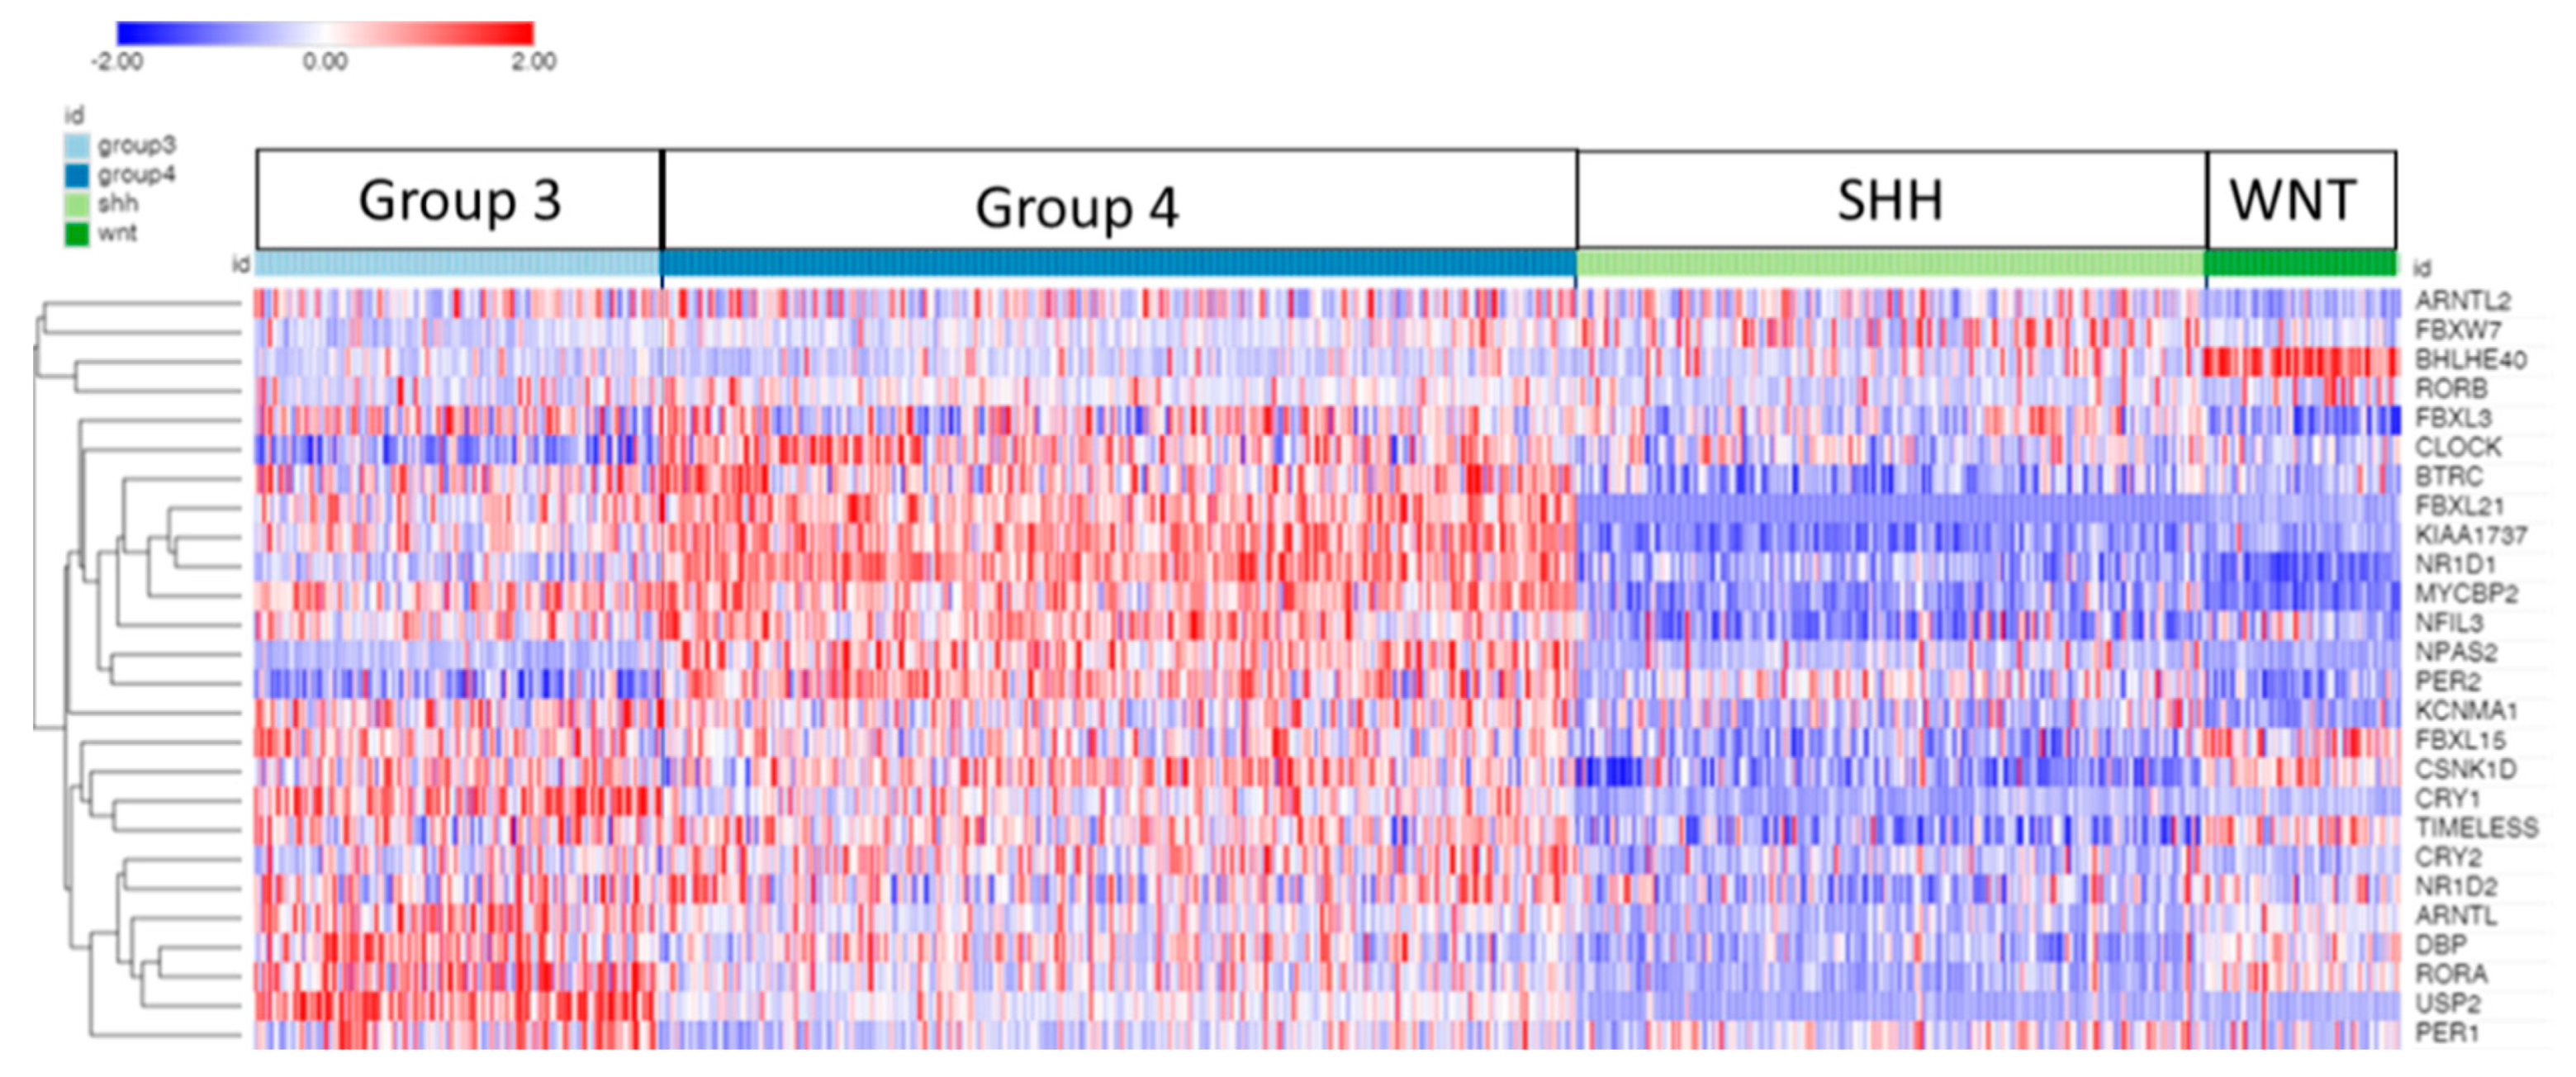
Figure 3.
Differential expression of CLOCK, NPAS2, ARNTL (BMAL1), ARNTL2 (BMAL2) and BHLHE40 in MB subgroups compared to expression in normal cerebellar (NA) tissue (Swartling dataset). Data expressed as relative gene expression by group. (CLOCK, F = 126.36, p = 1.32 x 10-93) (NPAS2, F = 283.34, p = 1.59 x 10-183) (ARNTL, F = 140.76, p = 6.58 x 10-103) (ARNTL2, F = 34.48, p = 1.26 x 10⁻²⁷) (BHLHE40, F = 209.02, p = 7.20 x 10-144). Red – Group 3, Green – Group 4, Grey – NA (normal) in the Swartling dataset is the non-tumor group, Blue – SHH, Yellow – WNT.
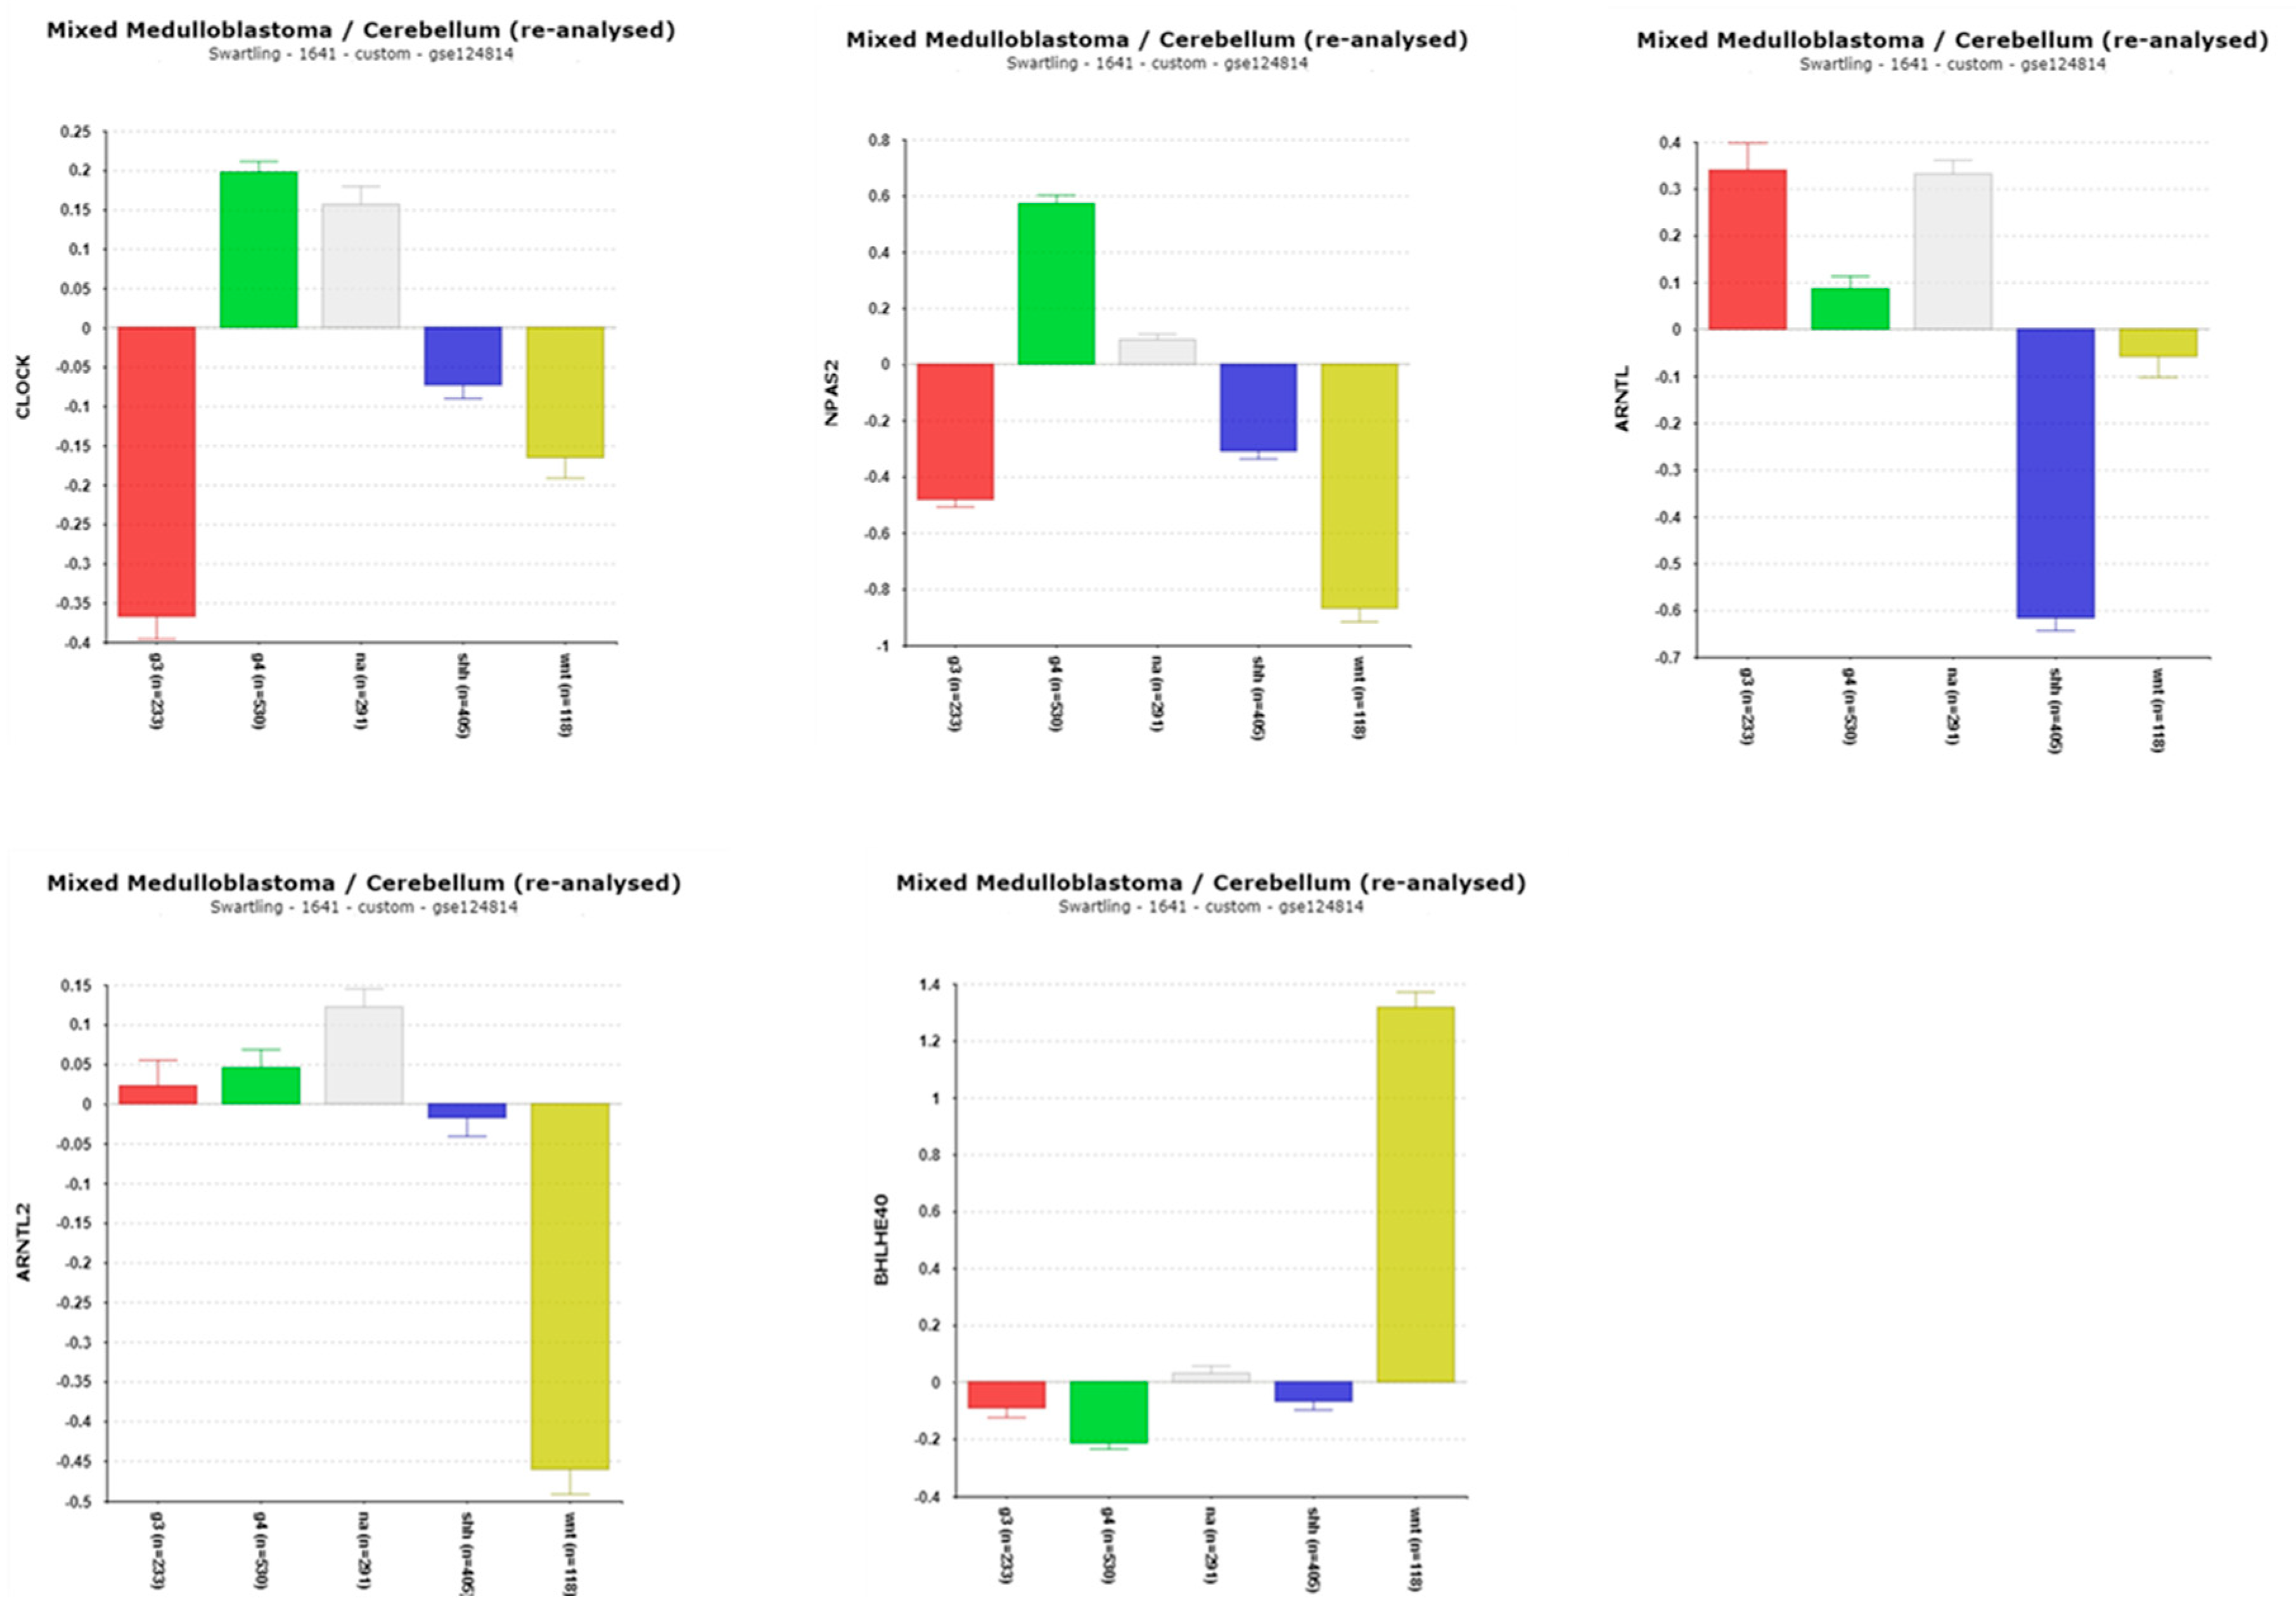
Figure 4.
Cryptochrome expression in subgroups of Medulloblastoma in the Swartling dataset. A. CRY1 expression (F = 289.27, p = 1.69 x 10-186; B. CRY2 expression, F = 115.25, p =2.96 x 10-86). Red – Group 3, Green – Group 4, Grey – NA (normal) in Swartling dataset is the non-tumor group. Blue – SHH, Yellow – WNT. C. CRY1 expression by age and MB subgroup.
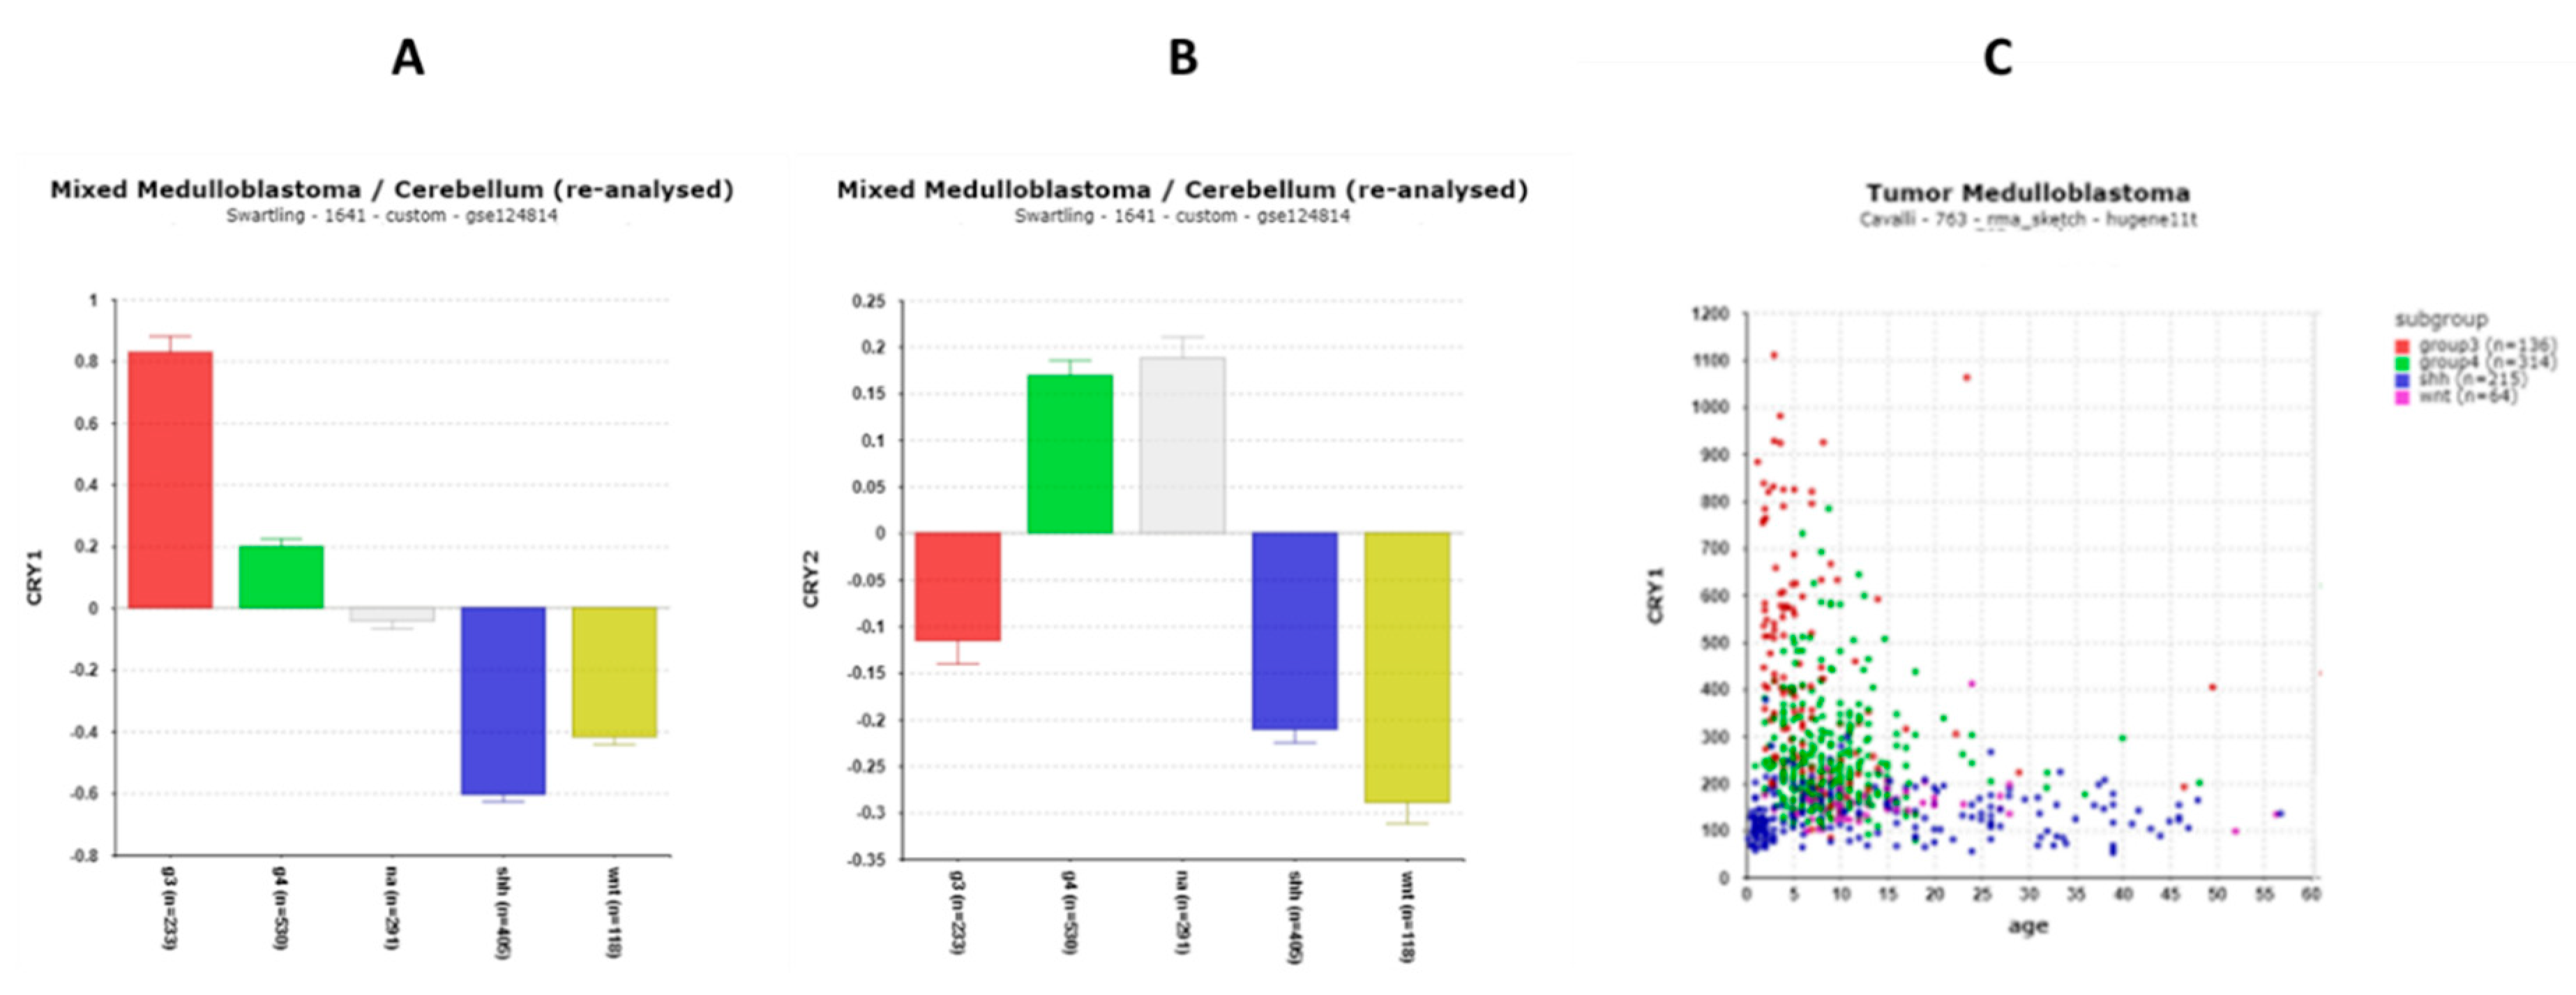
Figure 5.
Differential expression of PER1 and PER2 in the Swartling dataset. PER1, F = 39.35, p = 1.9 3x 10-31; PER2, F = 183.11, p = 6.79 x 10-129. Red – Group 3, Green – Group 4, Grey – NA (normal) in the Swartling dataset is the non-tumor group, Blue – SHH, Yellow – WNT.
Figure 5.
Differential expression of PER1 and PER2 in the Swartling dataset. PER1, F = 39.35, p = 1.9 3x 10-31; PER2, F = 183.11, p = 6.79 x 10-129. Red – Group 3, Green – Group 4, Grey – NA (normal) in the Swartling dataset is the non-tumor group, Blue – SHH, Yellow – WNT.
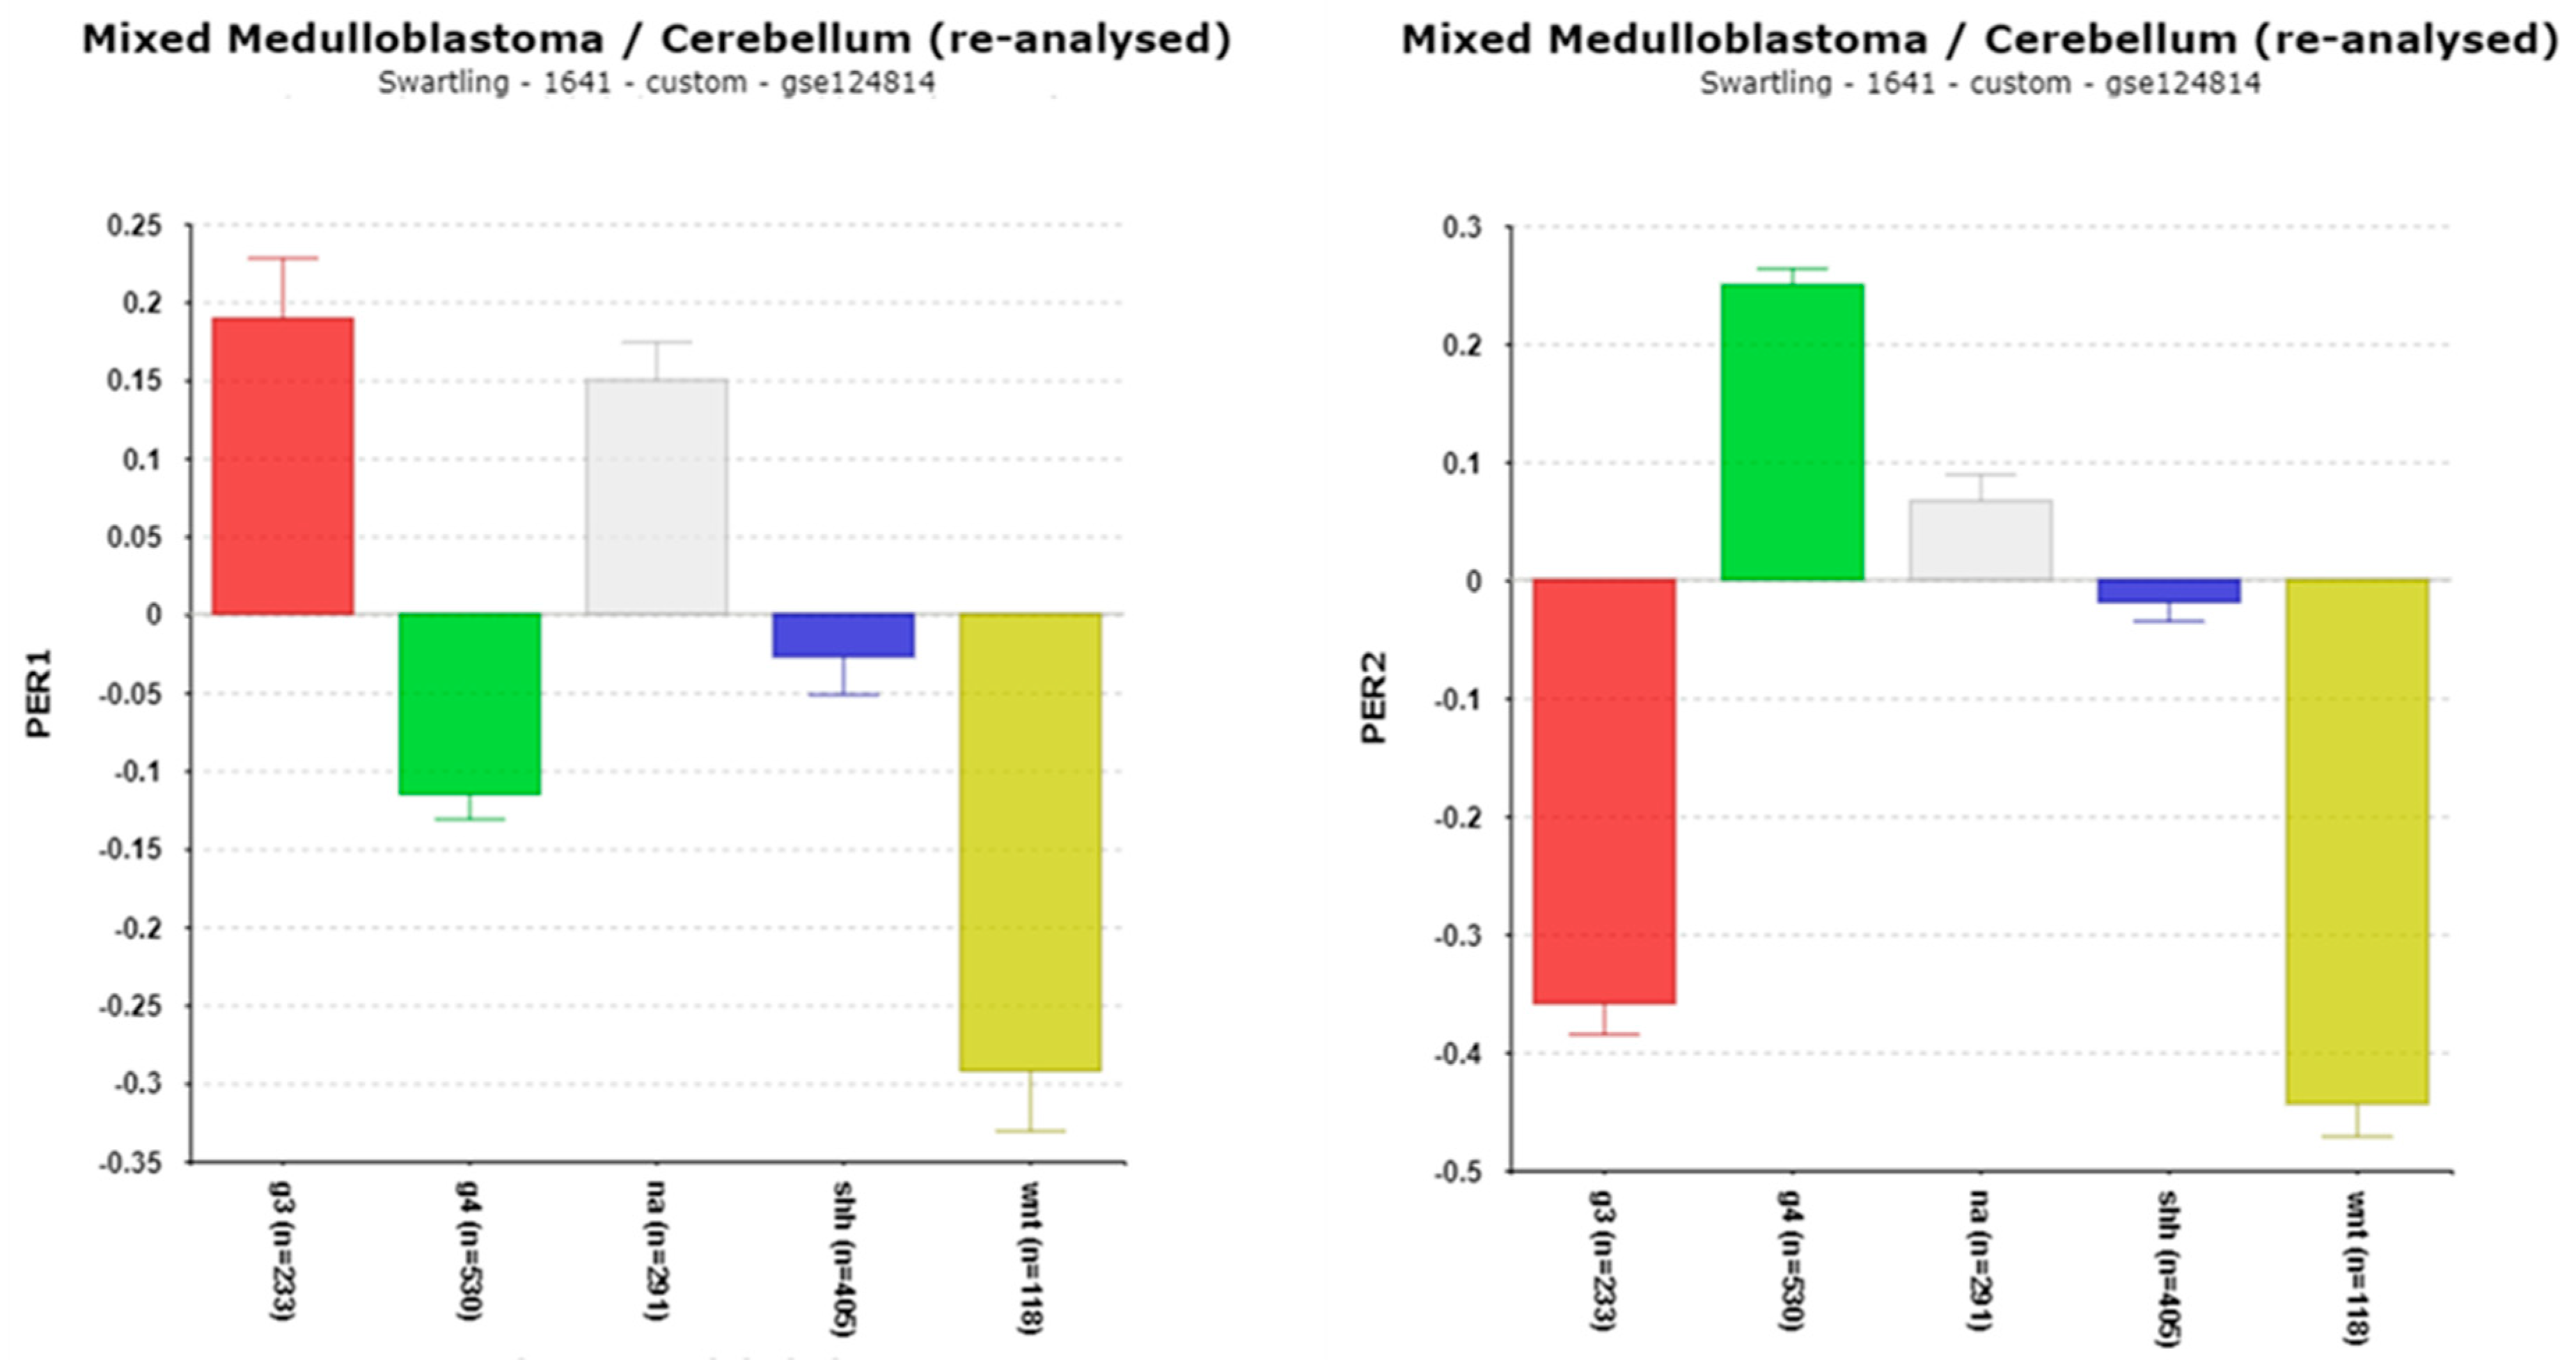
Figure 6.
Differential expression of TIMELESS expression (F =188.16, p = 7.34 x 10-132). Red – Group 3, Green – Group 4, Grey – NA (normal) in the Swartling dataset is the non-tumor group, Blue – SHH, Yellow – WNT.
Figure 6.
Differential expression of TIMELESS expression (F =188.16, p = 7.34 x 10-132). Red – Group 3, Green – Group 4, Grey – NA (normal) in the Swartling dataset is the non-tumor group, Blue – SHH, Yellow – WNT.
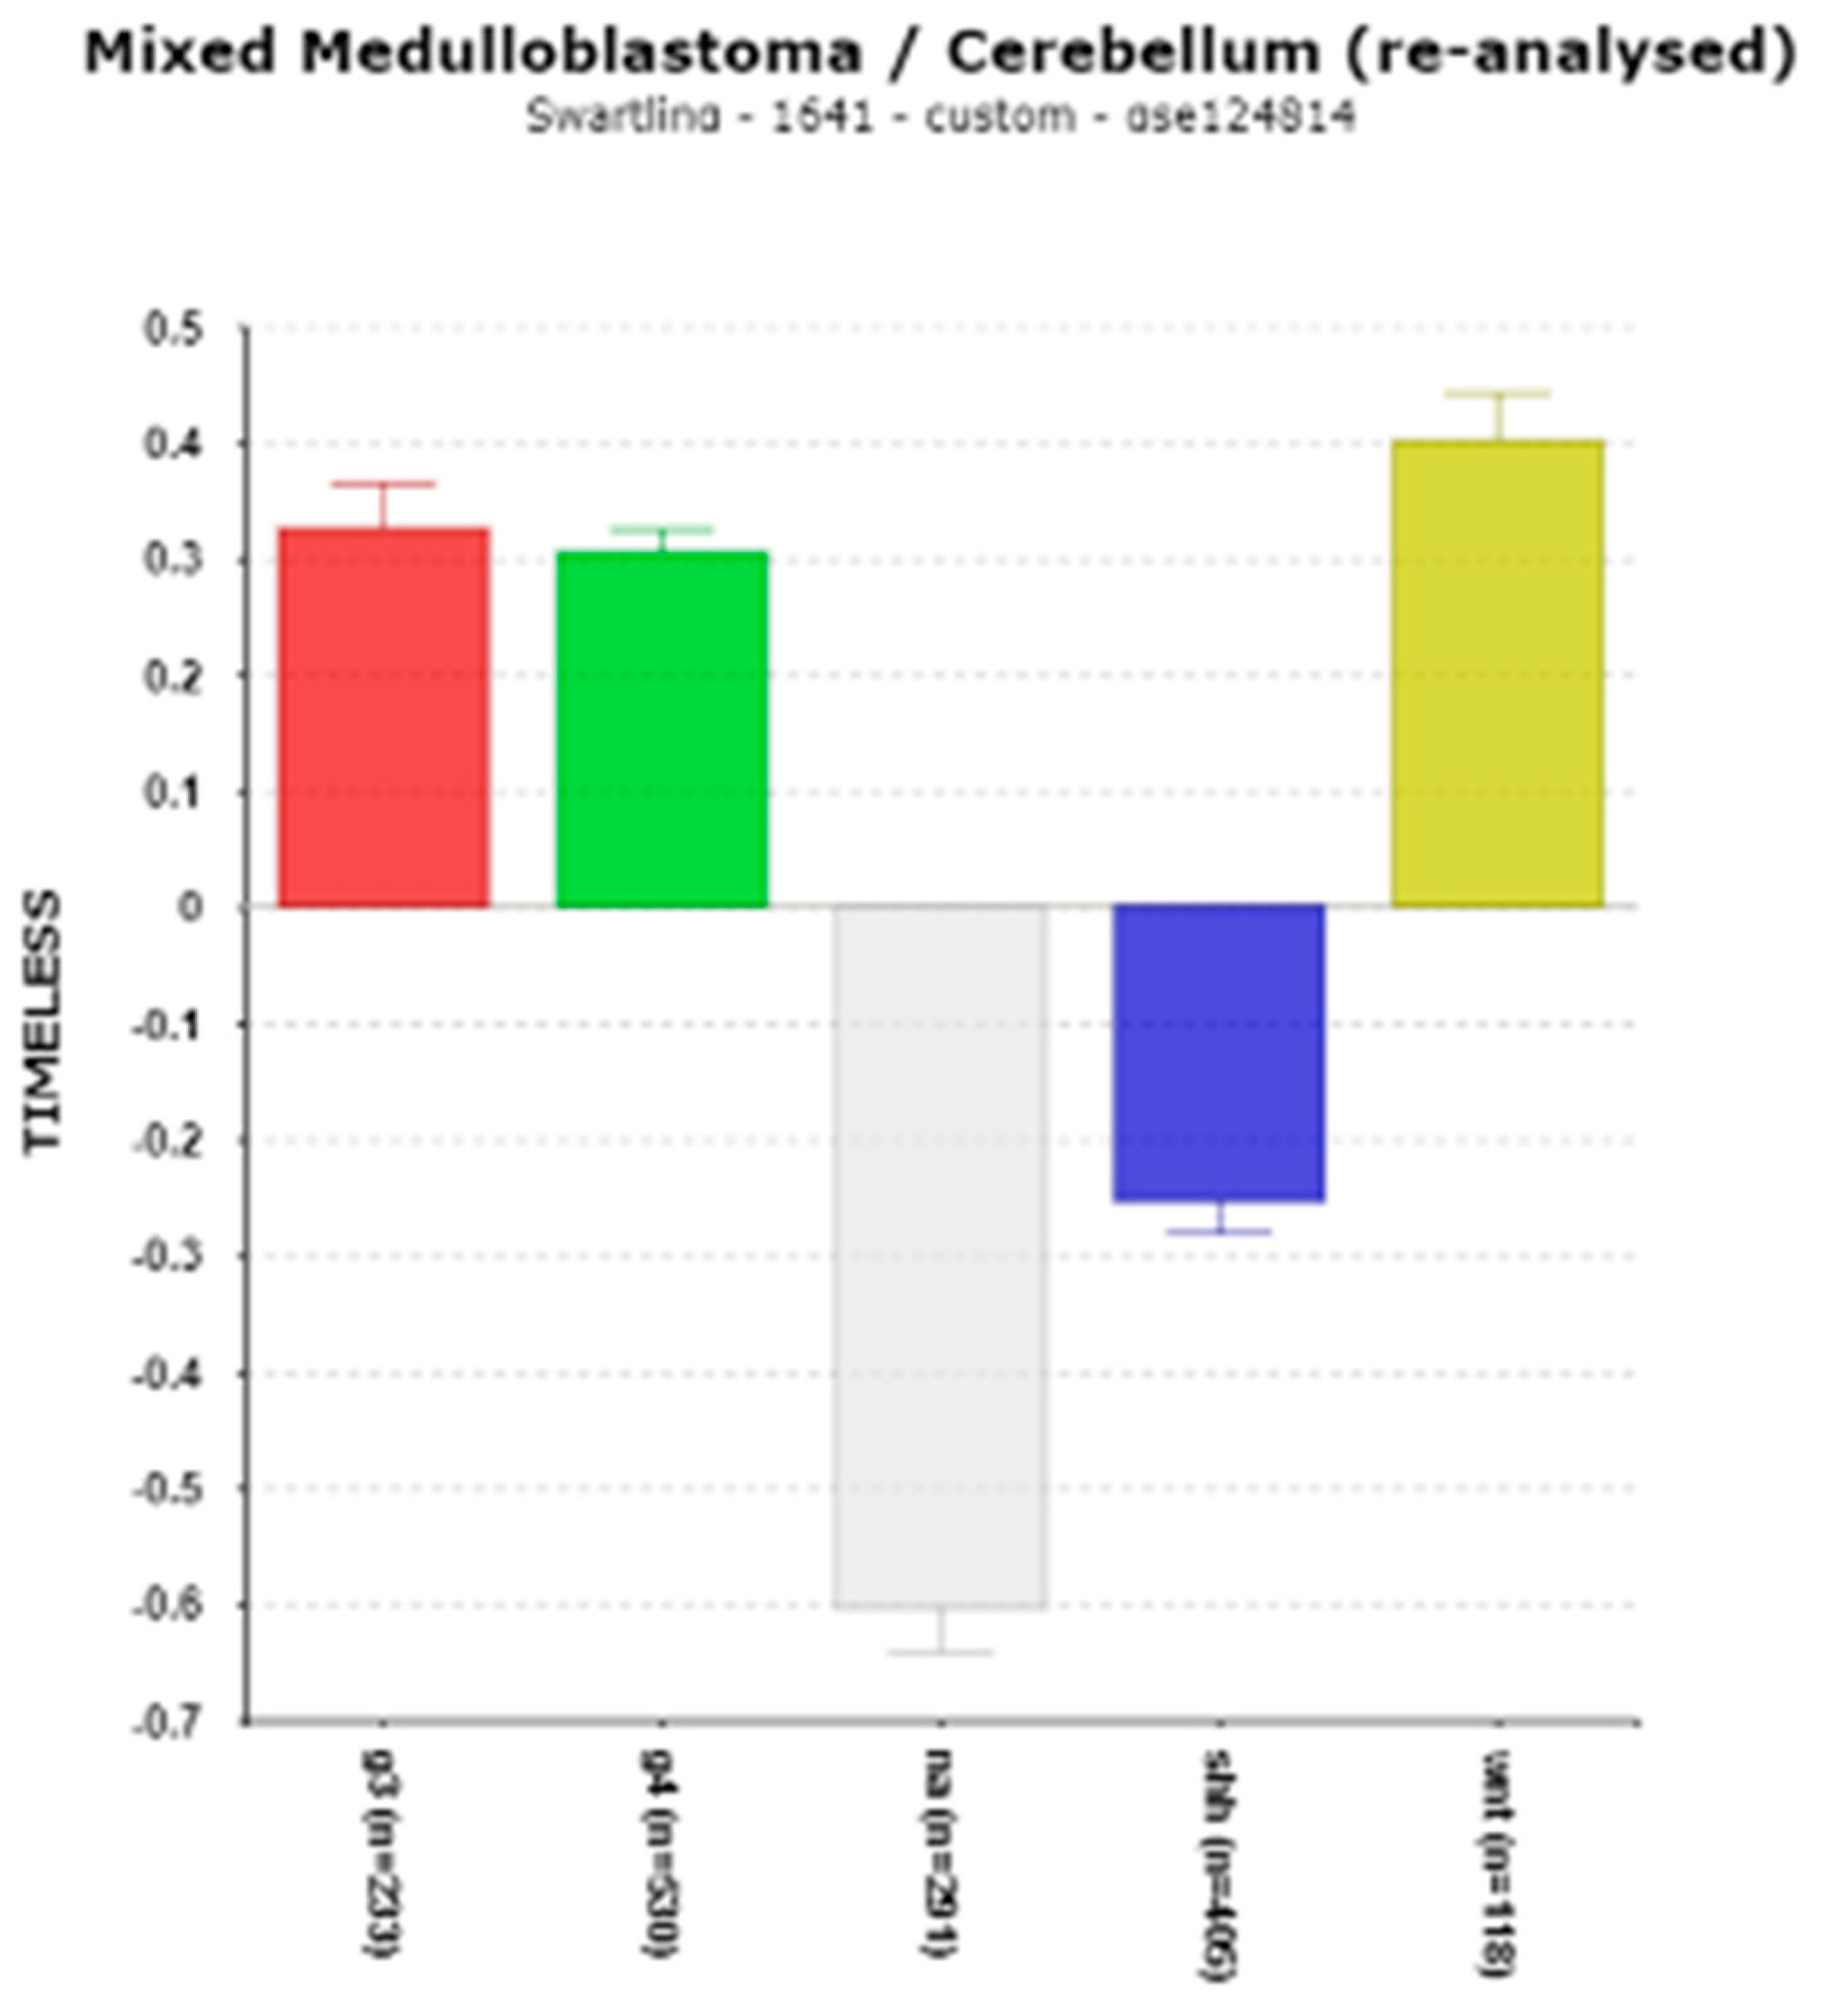
Figure 7.
Differential expression of CSNK1D, F = 259.17, p = 191 x 10-114. Decreased expression in SHH subgroup. Red – Group 3, Green – Group 4, Grey – NA (normal) in the Swartling dataset is the non-tumor group, Blue – SHH, Yellow – WNT.
Figure 7.
Differential expression of CSNK1D, F = 259.17, p = 191 x 10-114. Decreased expression in SHH subgroup. Red – Group 3, Green – Group 4, Grey – NA (normal) in the Swartling dataset is the non-tumor group, Blue – SHH, Yellow – WNT.
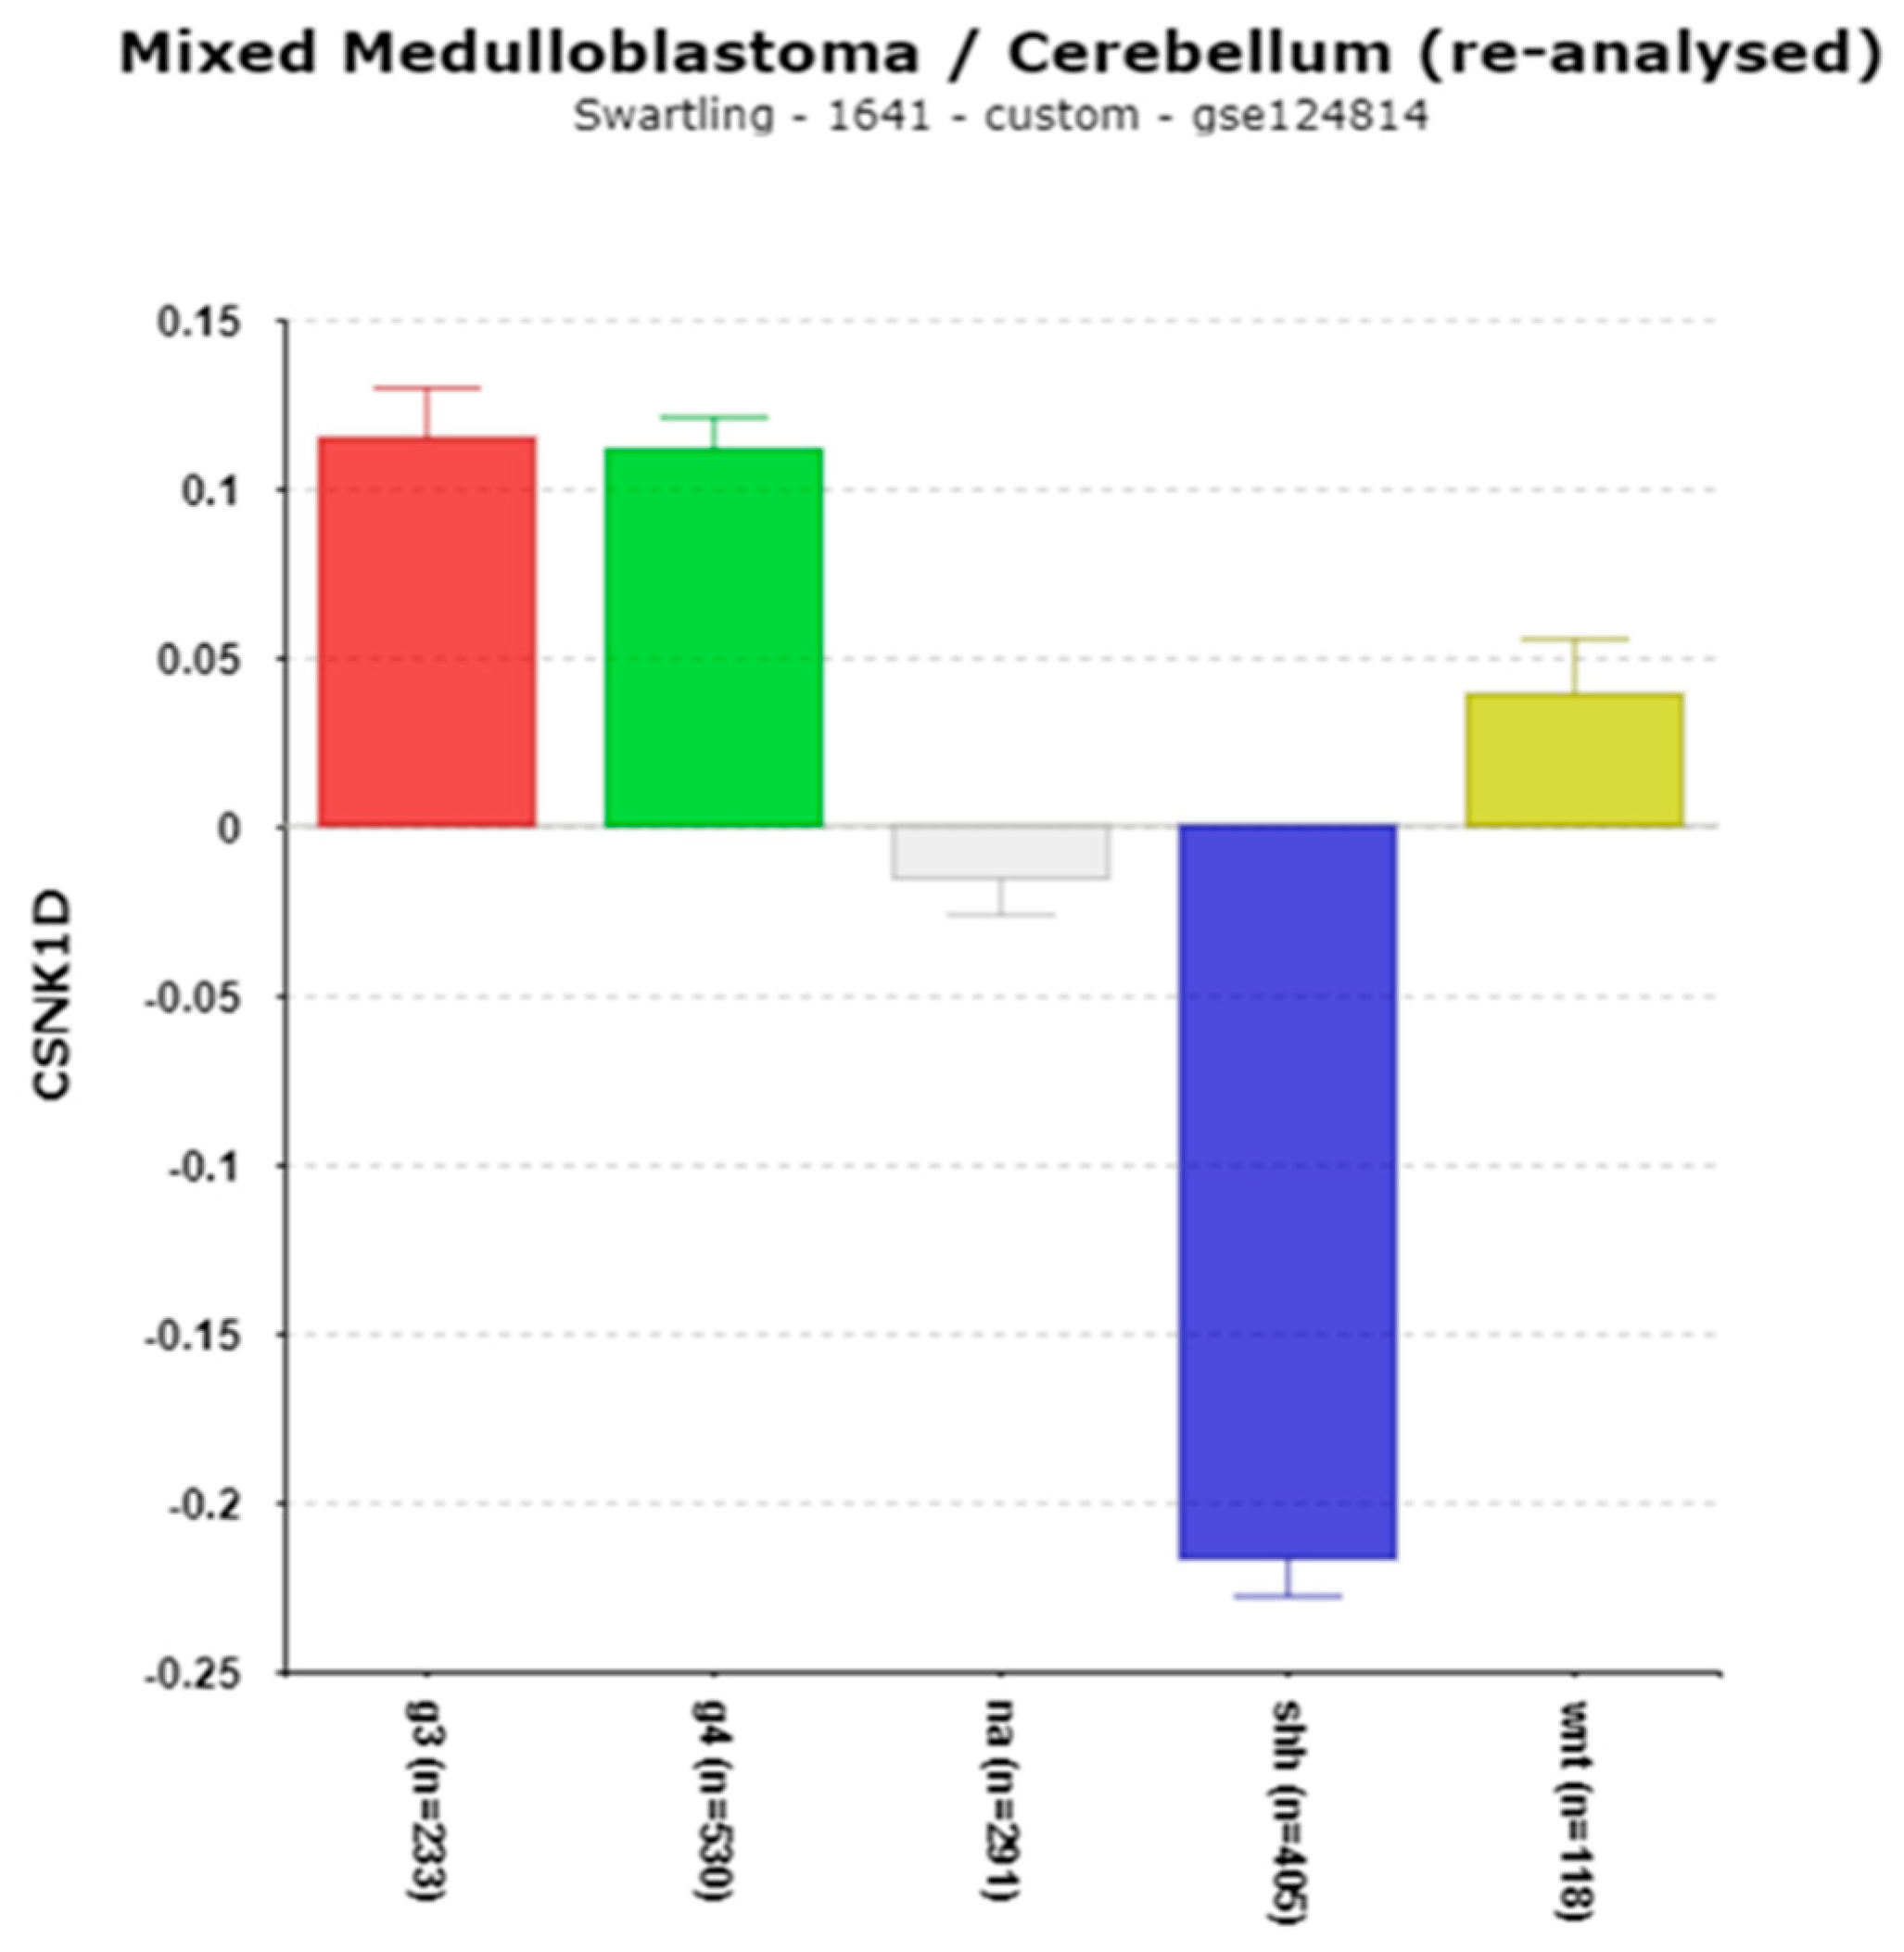
Figure 9.
Differential expression of THRA (THRA/NR1D1) (F = 461.14, p = 4.34 x 10-263) and NR1D2 (F = 40.21, p = 4.14 x 10⁻³²) in the Swartling dataset. Note: THRA and NR1D1 are at the same locus on chromosome 17 (on opposite strands) as reported in the Cavalli dataset, the major source of the Swartling data. Red – Group 3, Green – Group 4, Grey – NA (normal) in the Swartling dataset is the non-tumor group, Blue – SHH, Yellow – WNT.
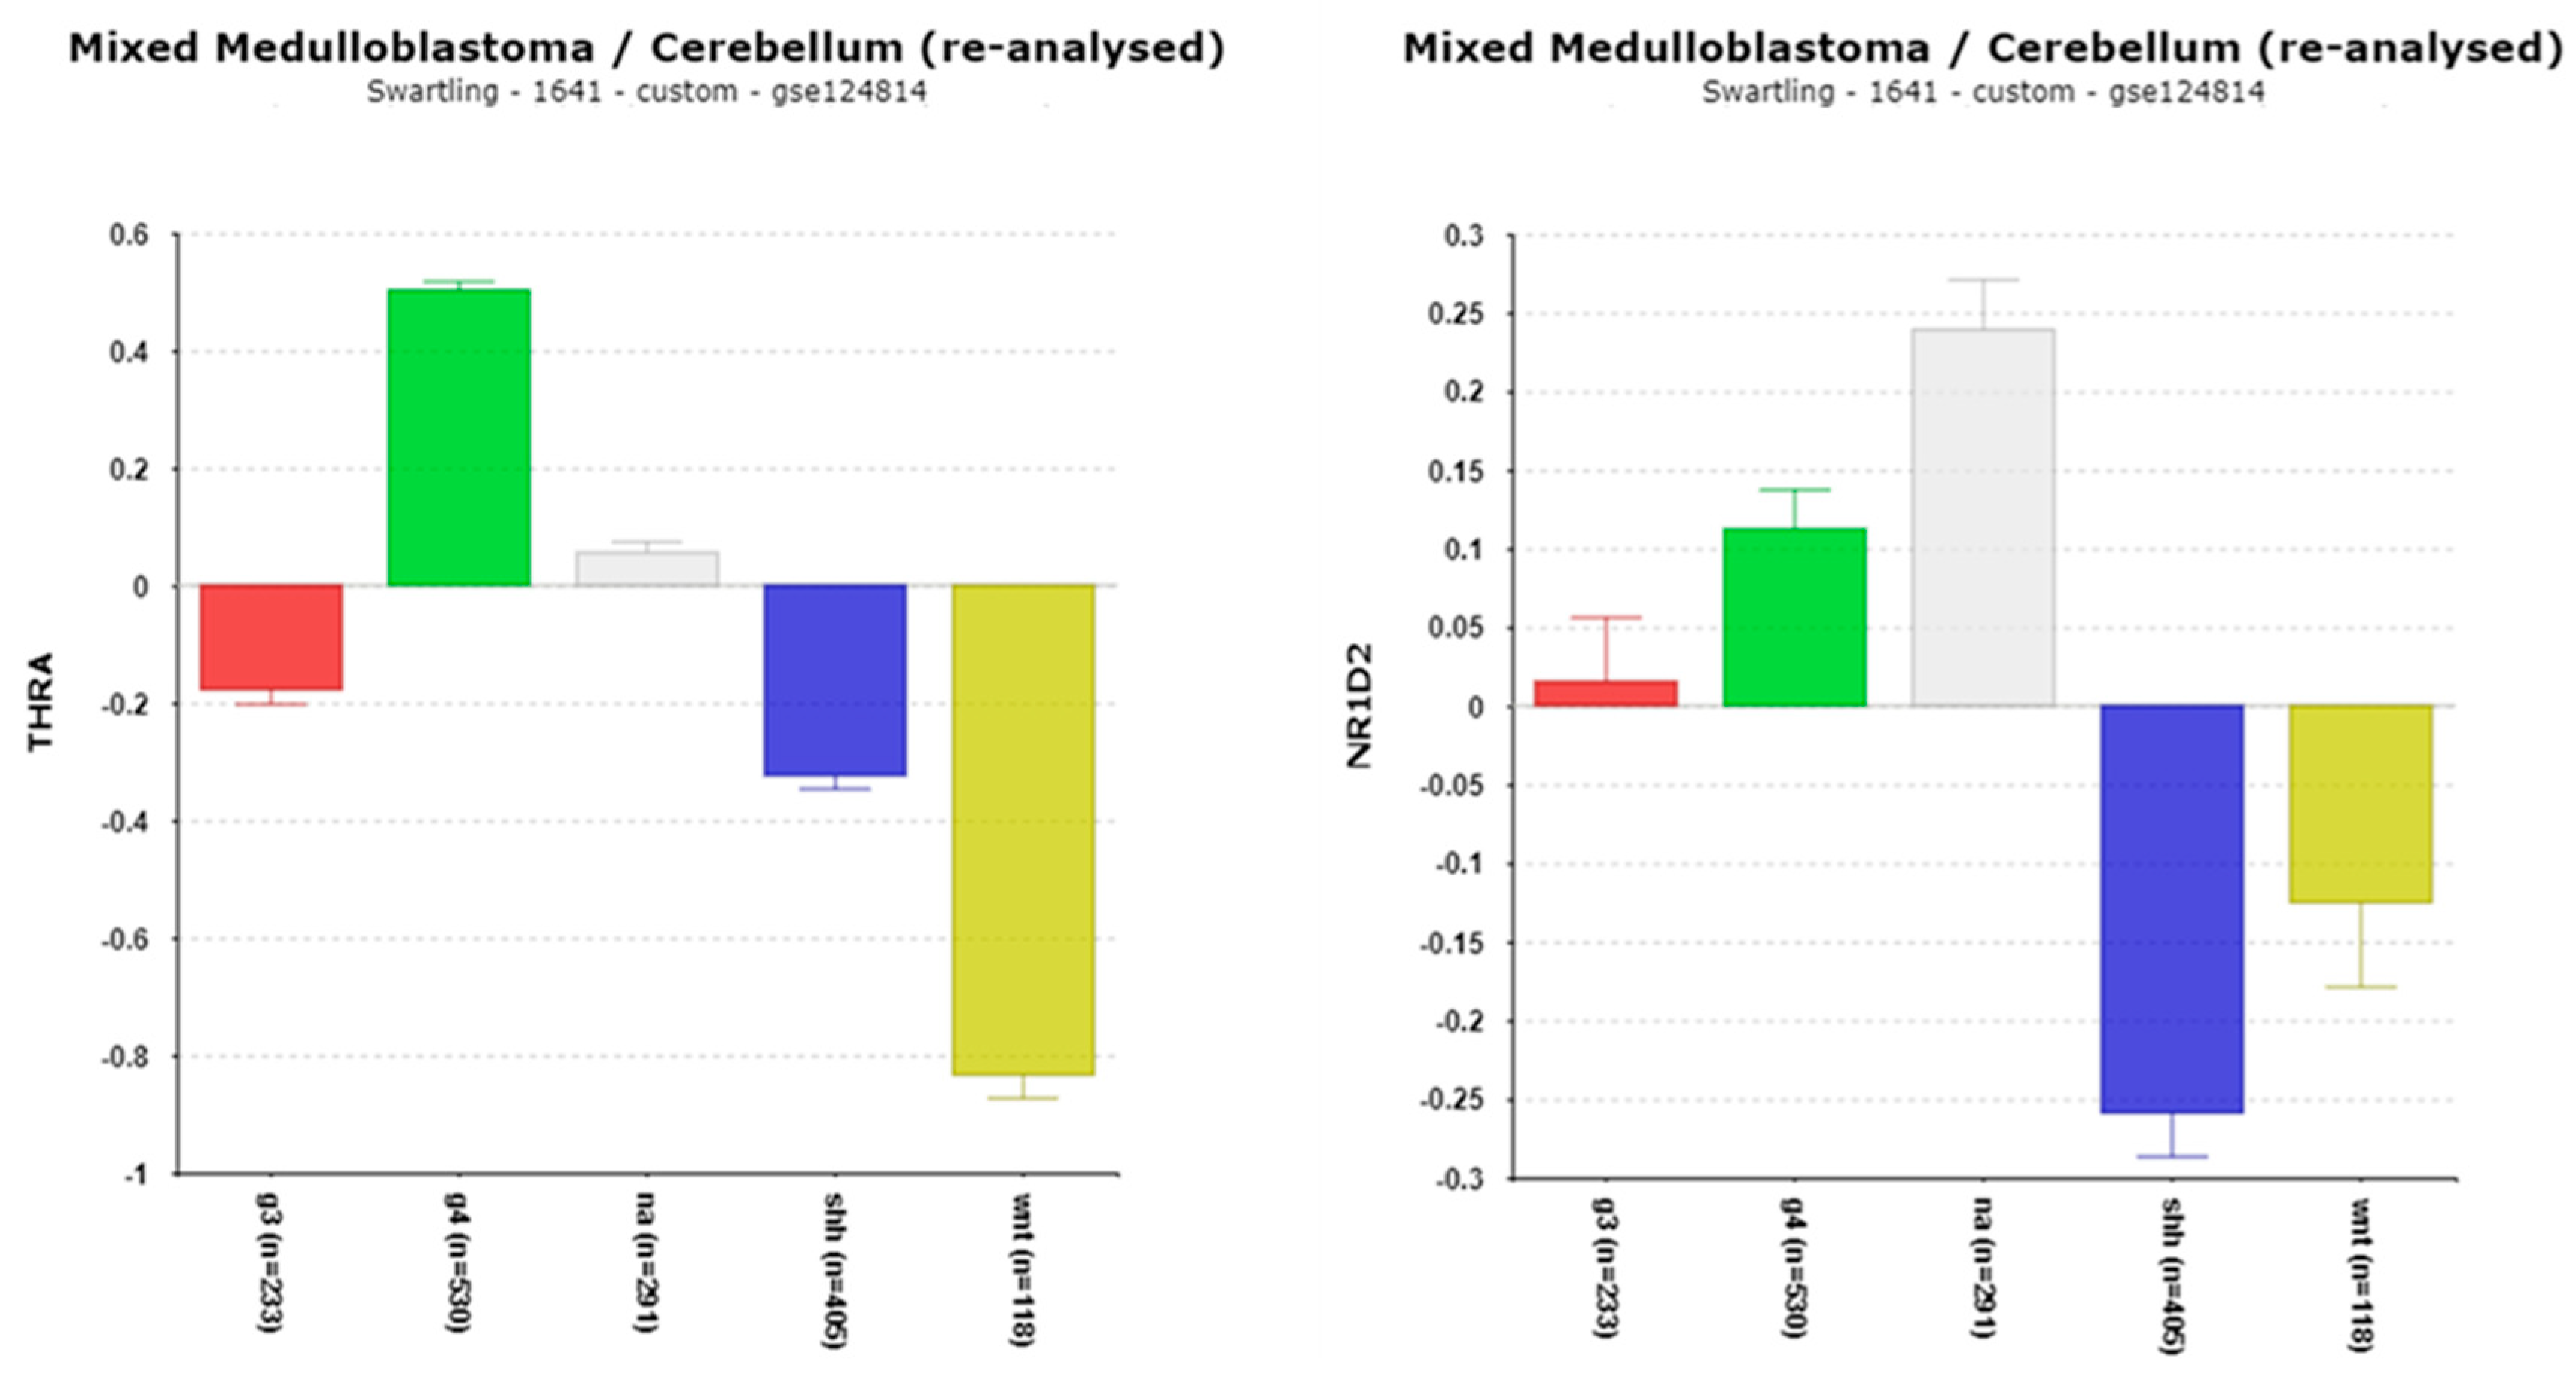
Figure 10.
DBP expression in MB subgroups. Depressed expression of DBP (F = 109.10, p = 4.06 x 10-82) in MB SHH subgroup. Red – Group 3, Green – Group 4, Grey – NA (normal) in the Swartling dataset is the non-tumor group, Blue – SHH, Yellow – WNT. Opposite effects of DBP (D box Binding Protein) and NFIL3 (Nuclear Factor, Interleukin 3) on D-box of clock genes.
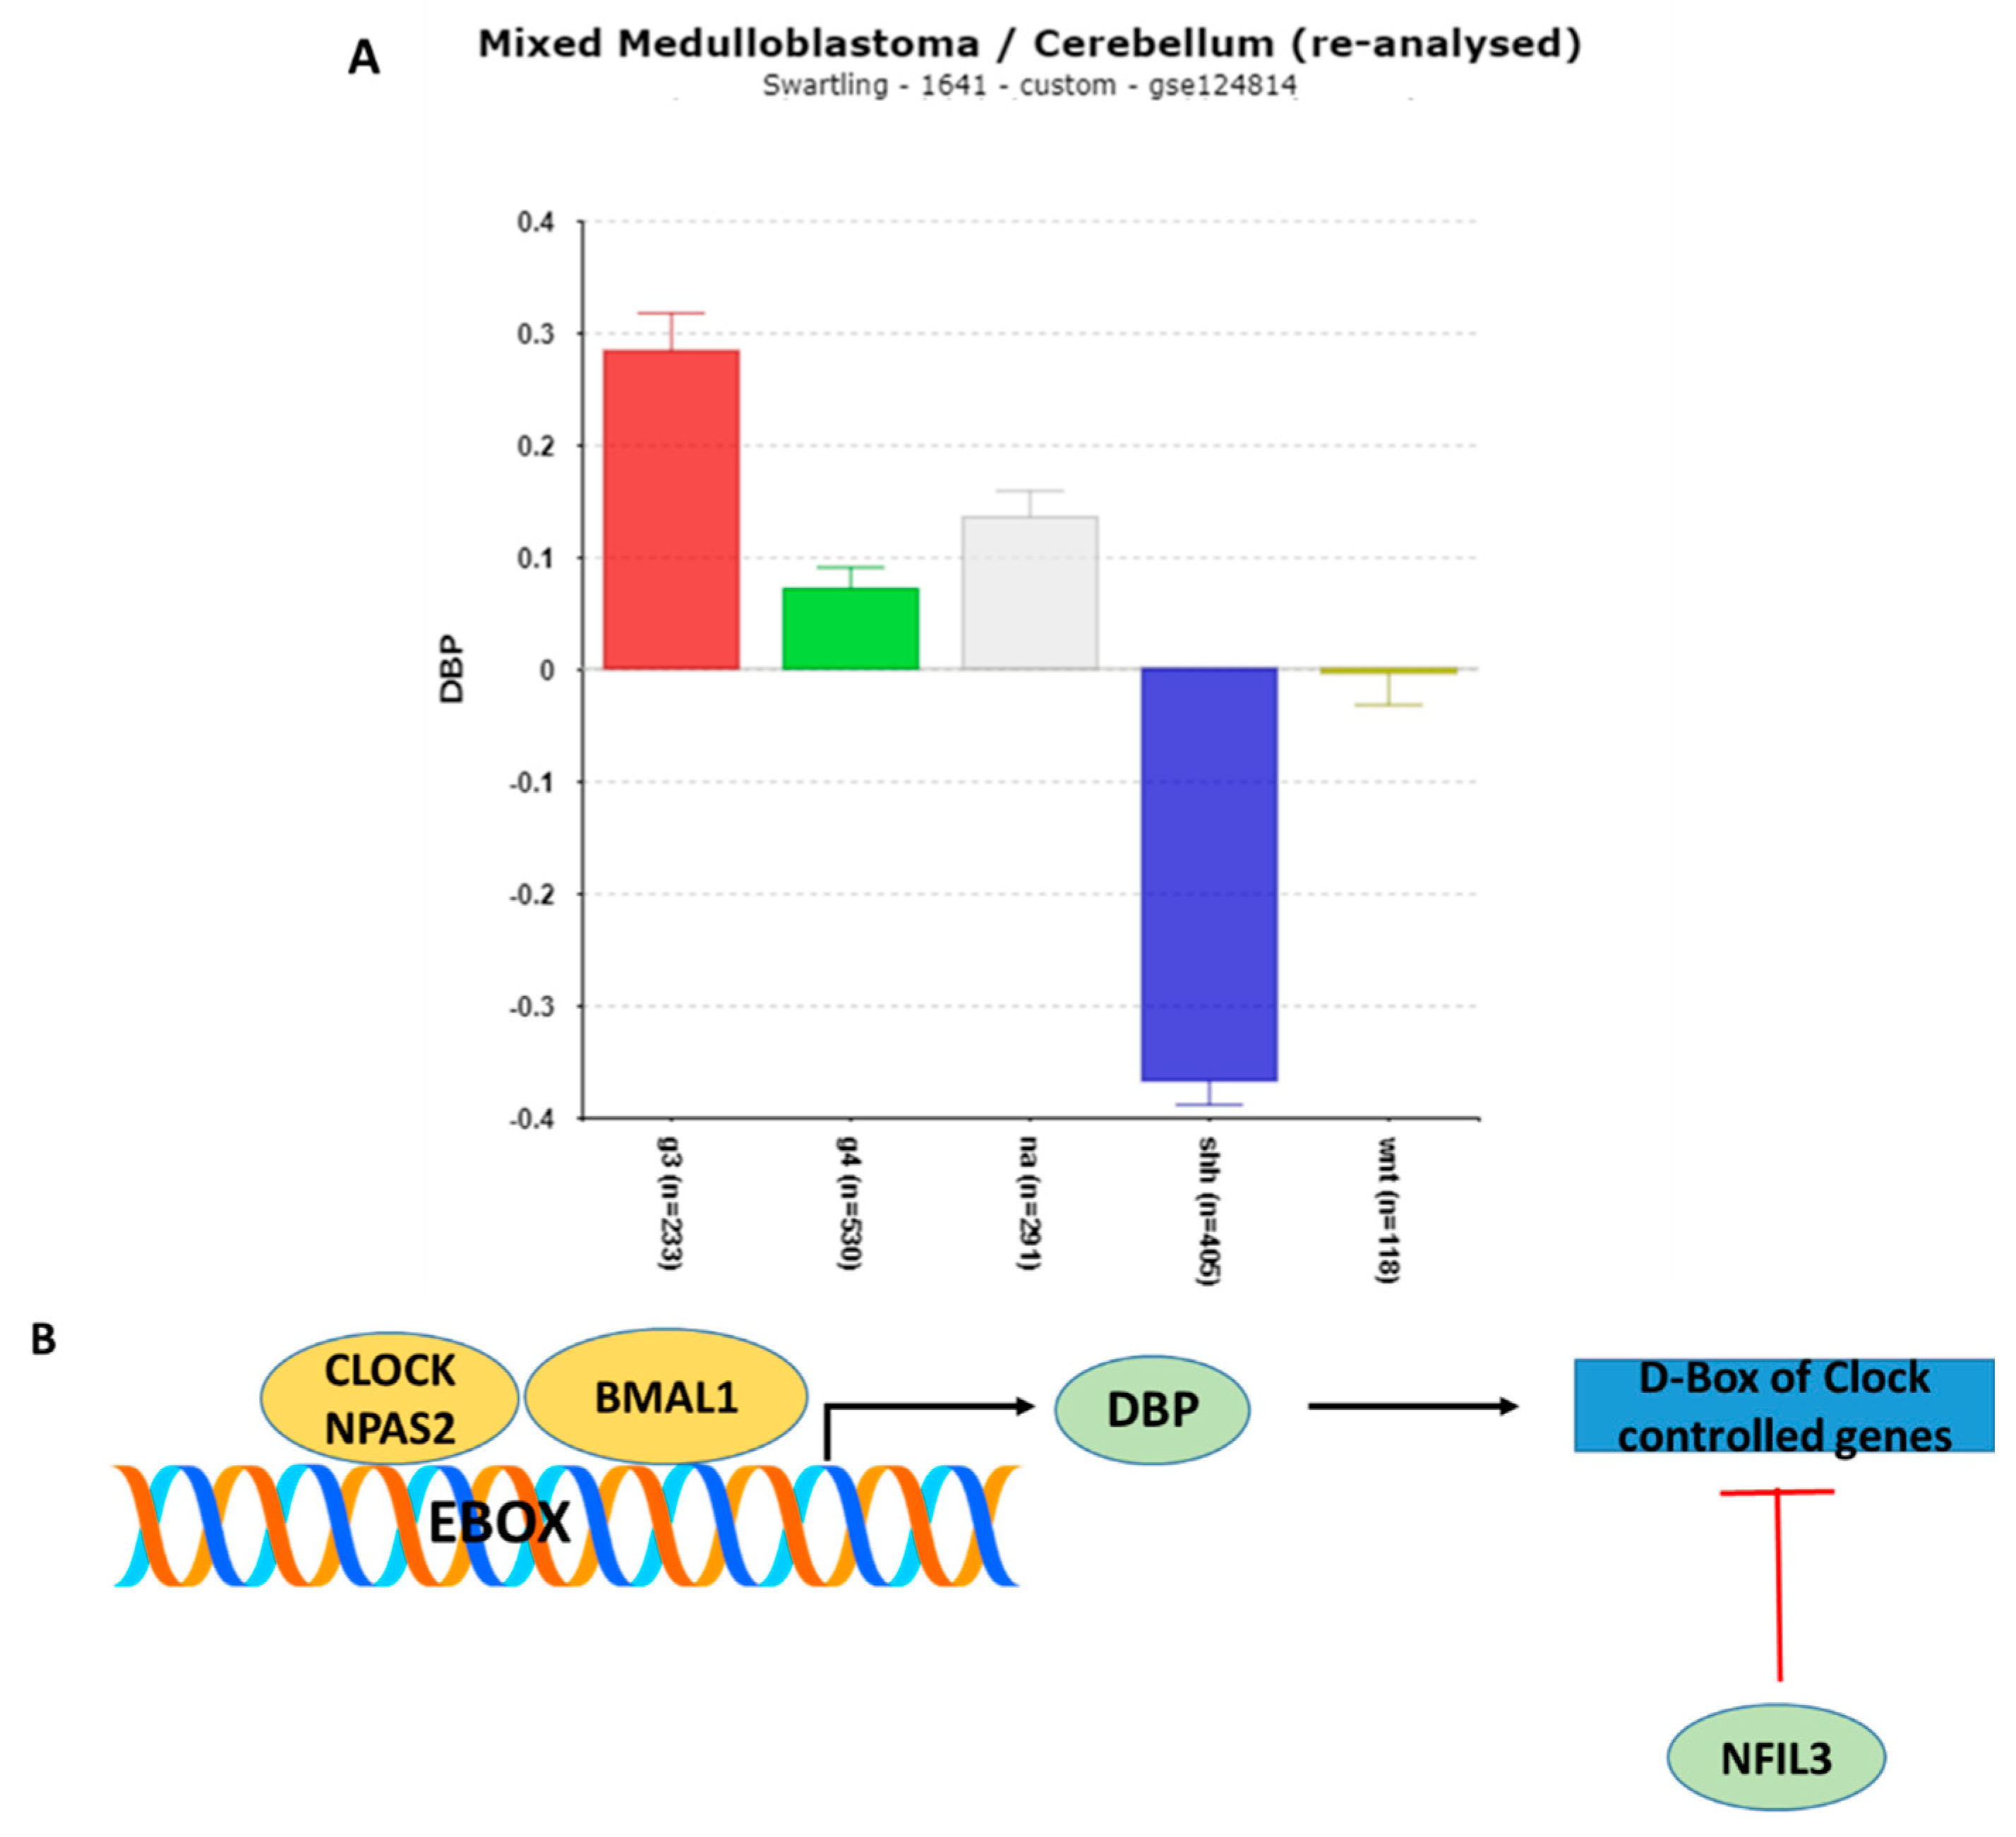
Figure 11.
A. Differential expression of CIPC (Clock Interacting pacemaker) in MB subgroups. (F = 486.84, p =3.39 x 10-273). Red – Group 3, Green – Group 4, Grey – NA (normal) in the Swartling dataset is the non-tumor group, Blue – SHH, Yellow – WNT. B. Correlation of CIPC and FBXL21 (r = 0.790, p = 7.75 x 10-164).
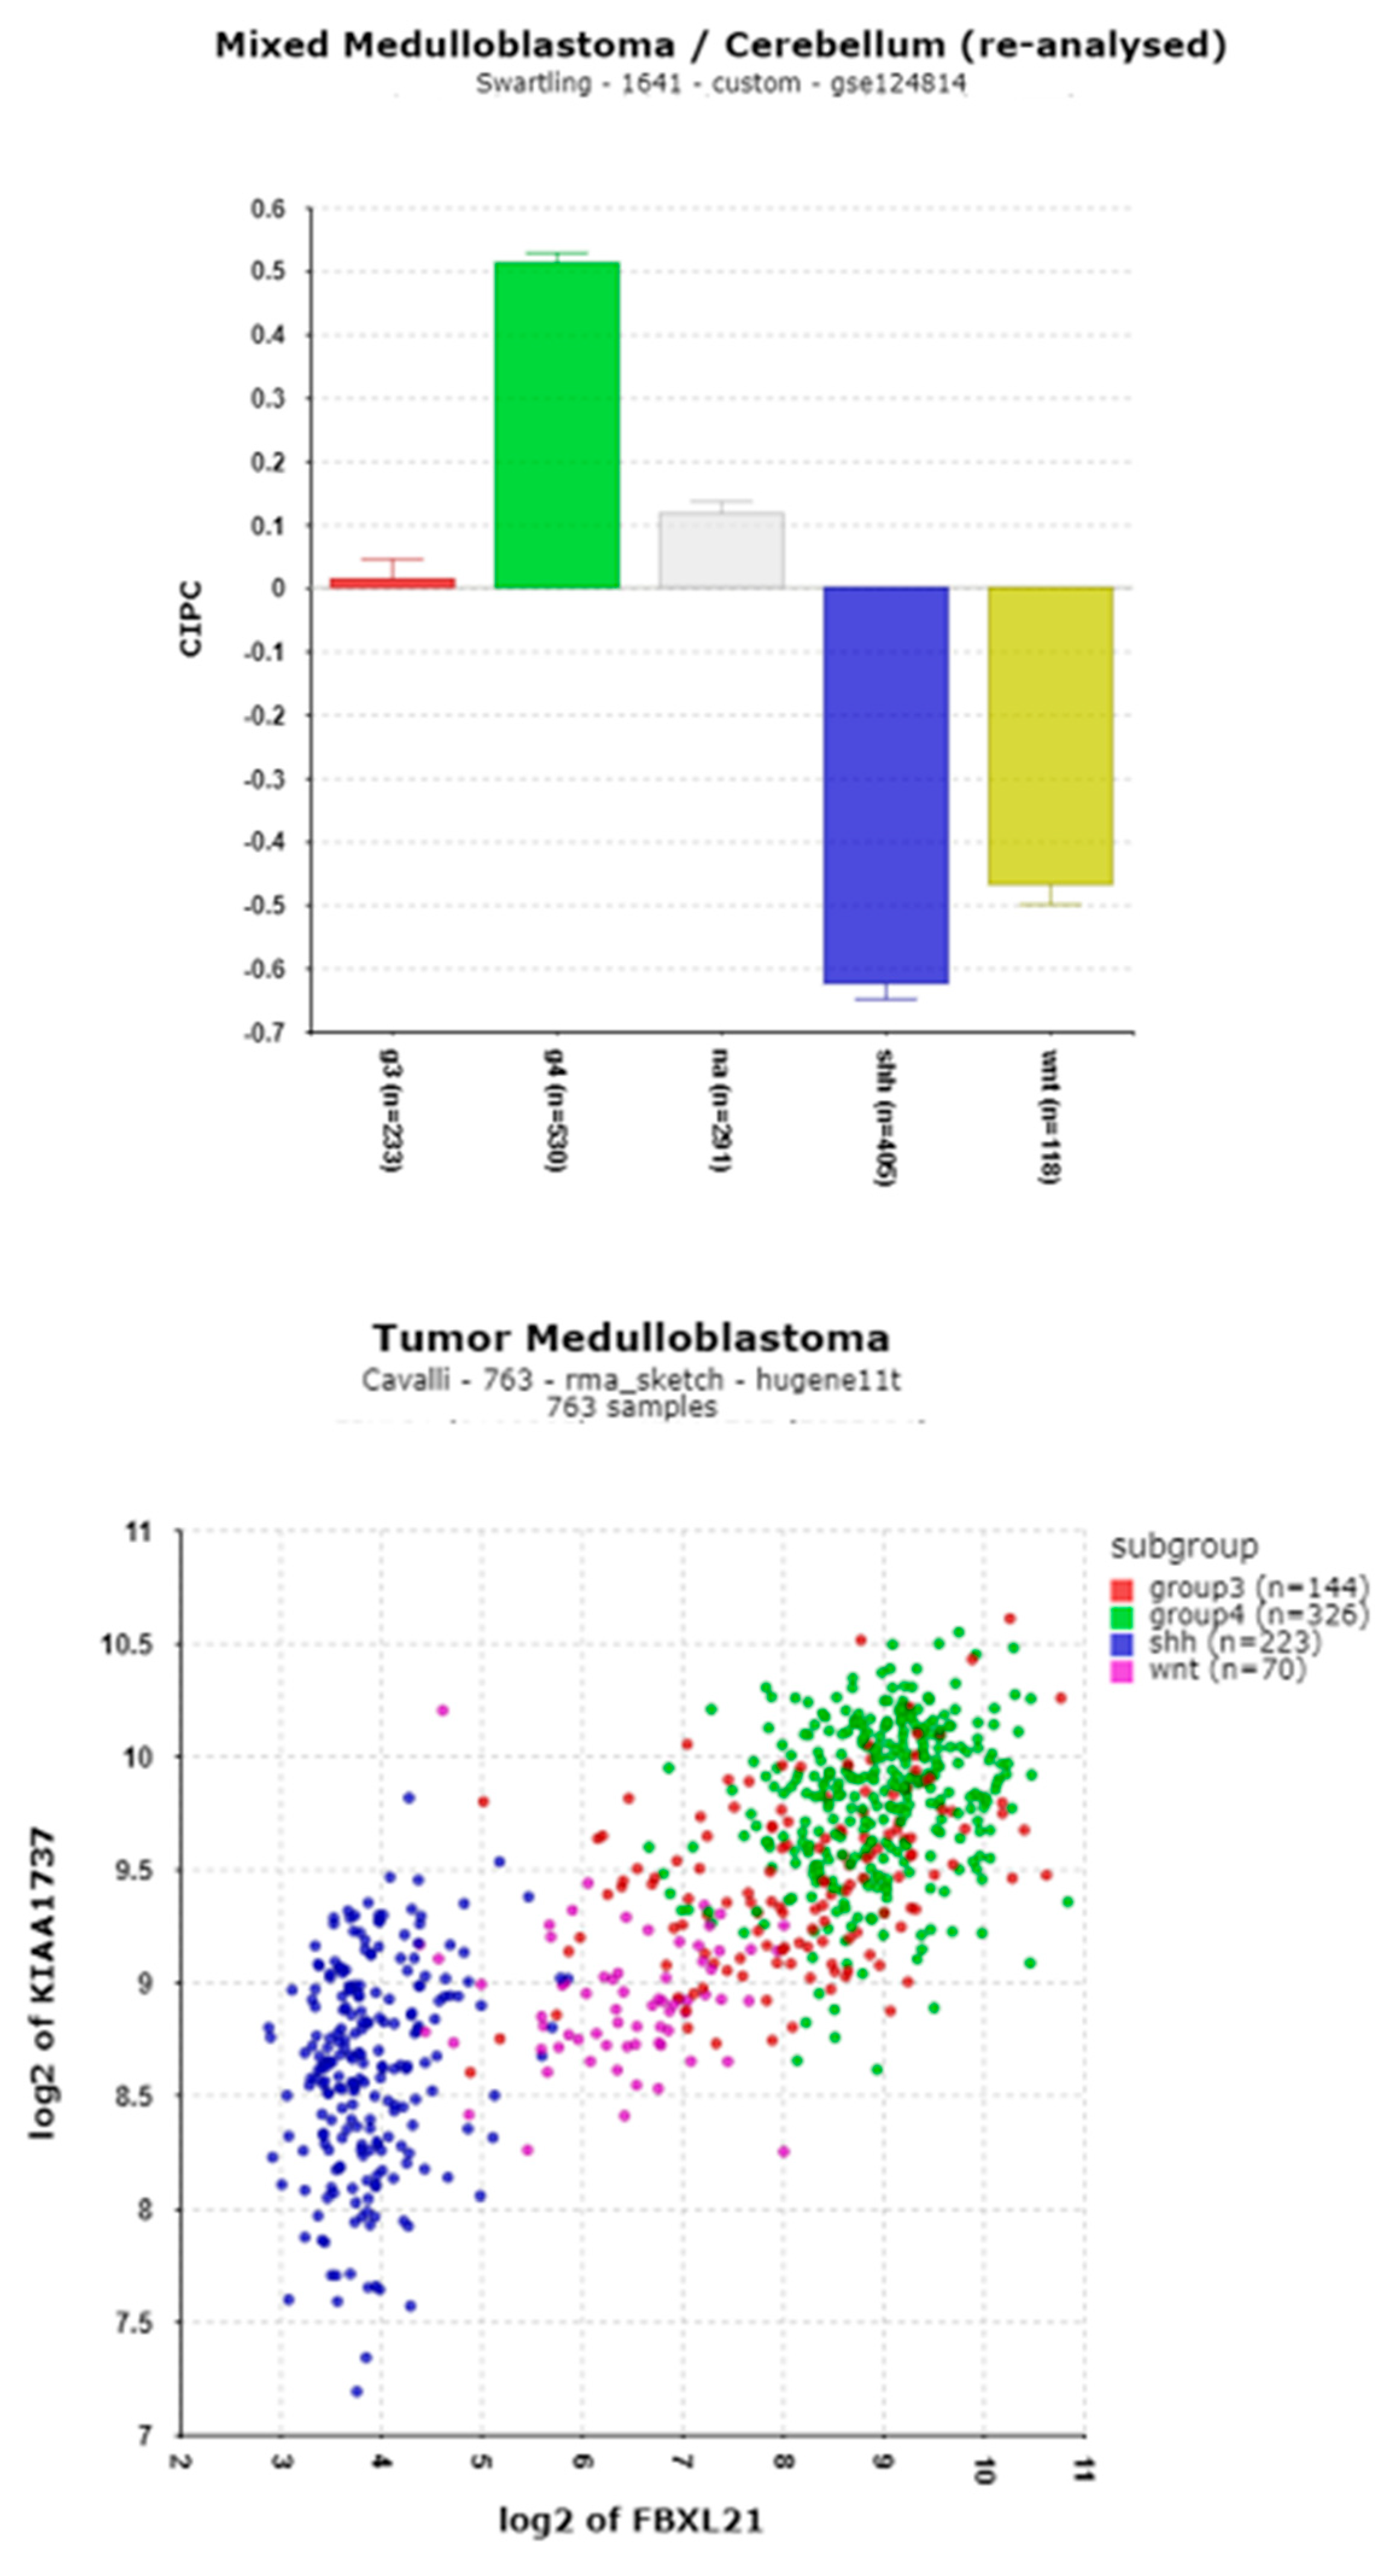
Figure 12.
A. Differential expression of FBXL3 in MB subgroups (F = 55.21, p = 1.31 x 10-43) by anova. Depression of FBXL3 in WNT subgroup compared to NA group (by t test, p = 1.63 x 10-42)). B. Differential expression of FBXL15 in MB subgroups (F = 72.93, p = 9.80 x 10-57). Depression of FBXL15 in SHH subgroup compared to NA group (by t test, p = 1.06 x 10⁻³¹). Red – Group 3, Green – Group 4, Grey – NA (normal) in the Swartling dataset is the non-tumor group, Blue – SHH, Yellow – WNT.
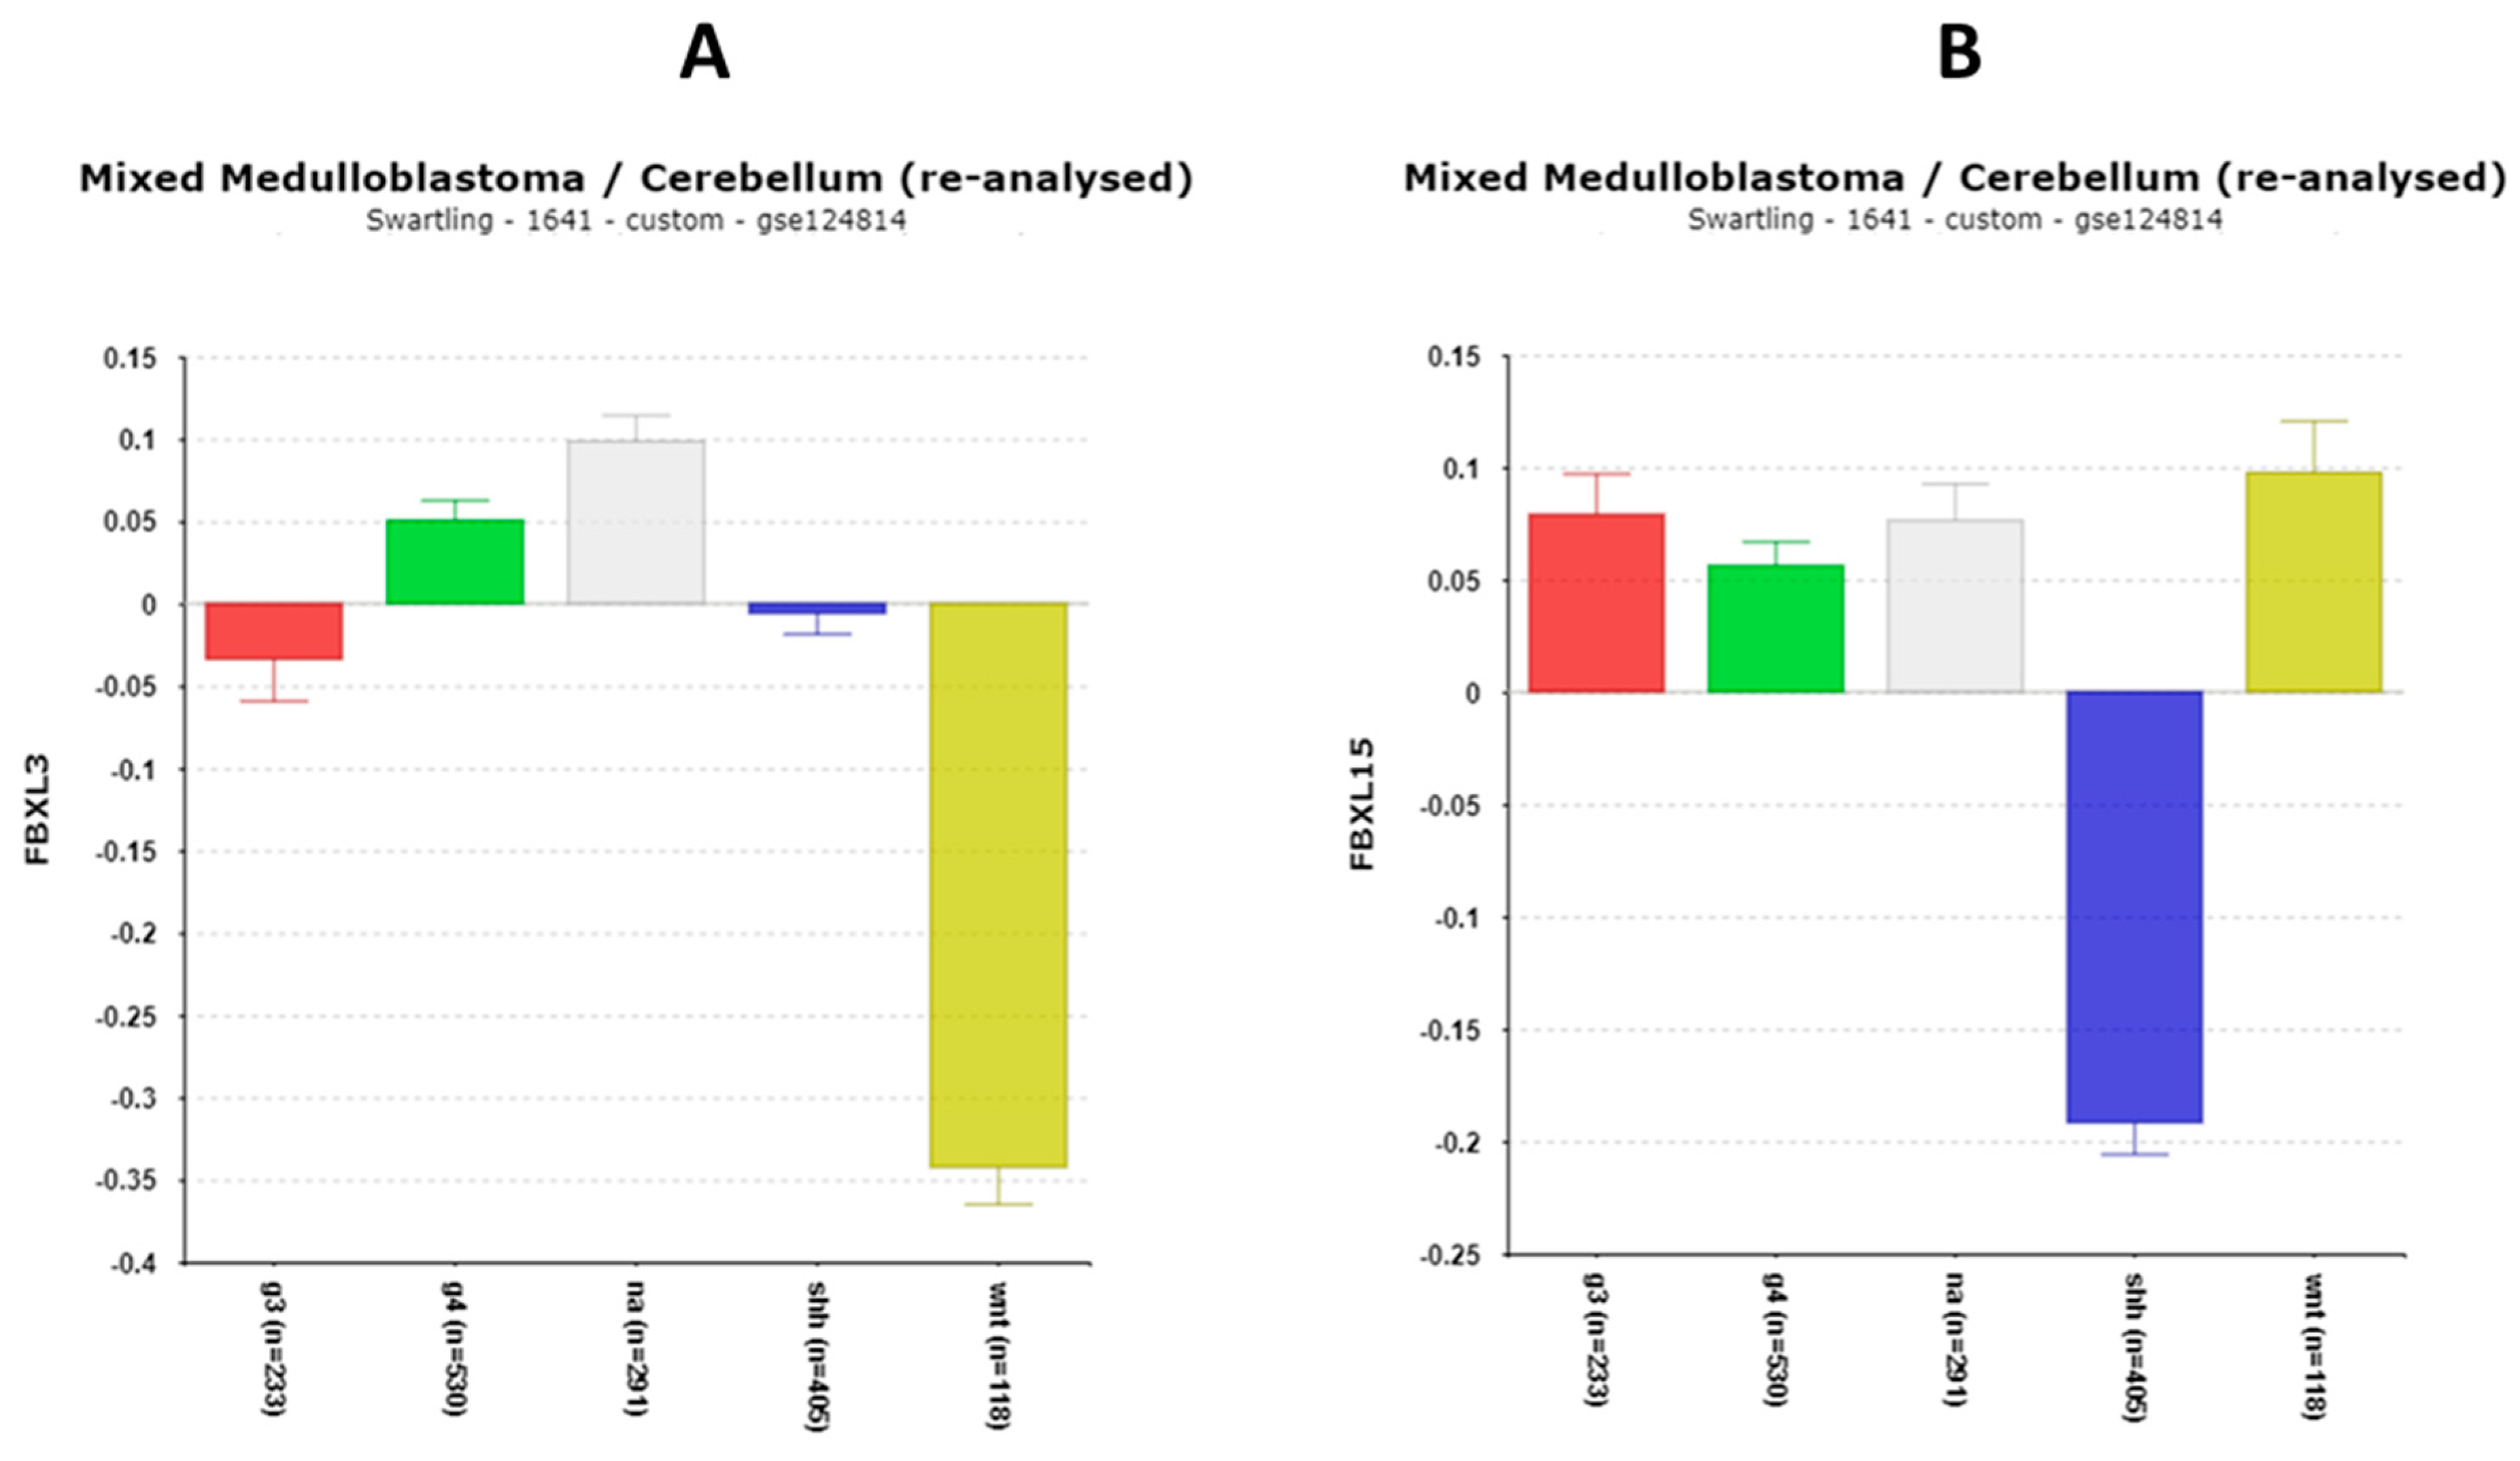
Figure 13.
FBXL21 expression in MB. A. Expression of FBXL21 elevated in MB (Pfister dataset and Gilbertson dataset) compared to normal brain (Berchtold dataset) or normal cerebellum (Roth dataset), F = 51.49, p = 7.76 x 10⁻²⁹. .B. Expression of FBXL21 elevated in MB Groups 3 and 4 MB compared to SHH and WNT MB, Cavalli dataset. F = 289.07, p = 4.14 x 10-125. C. Age-related expression of FBXL21 by subtype in Cavalli dataset.
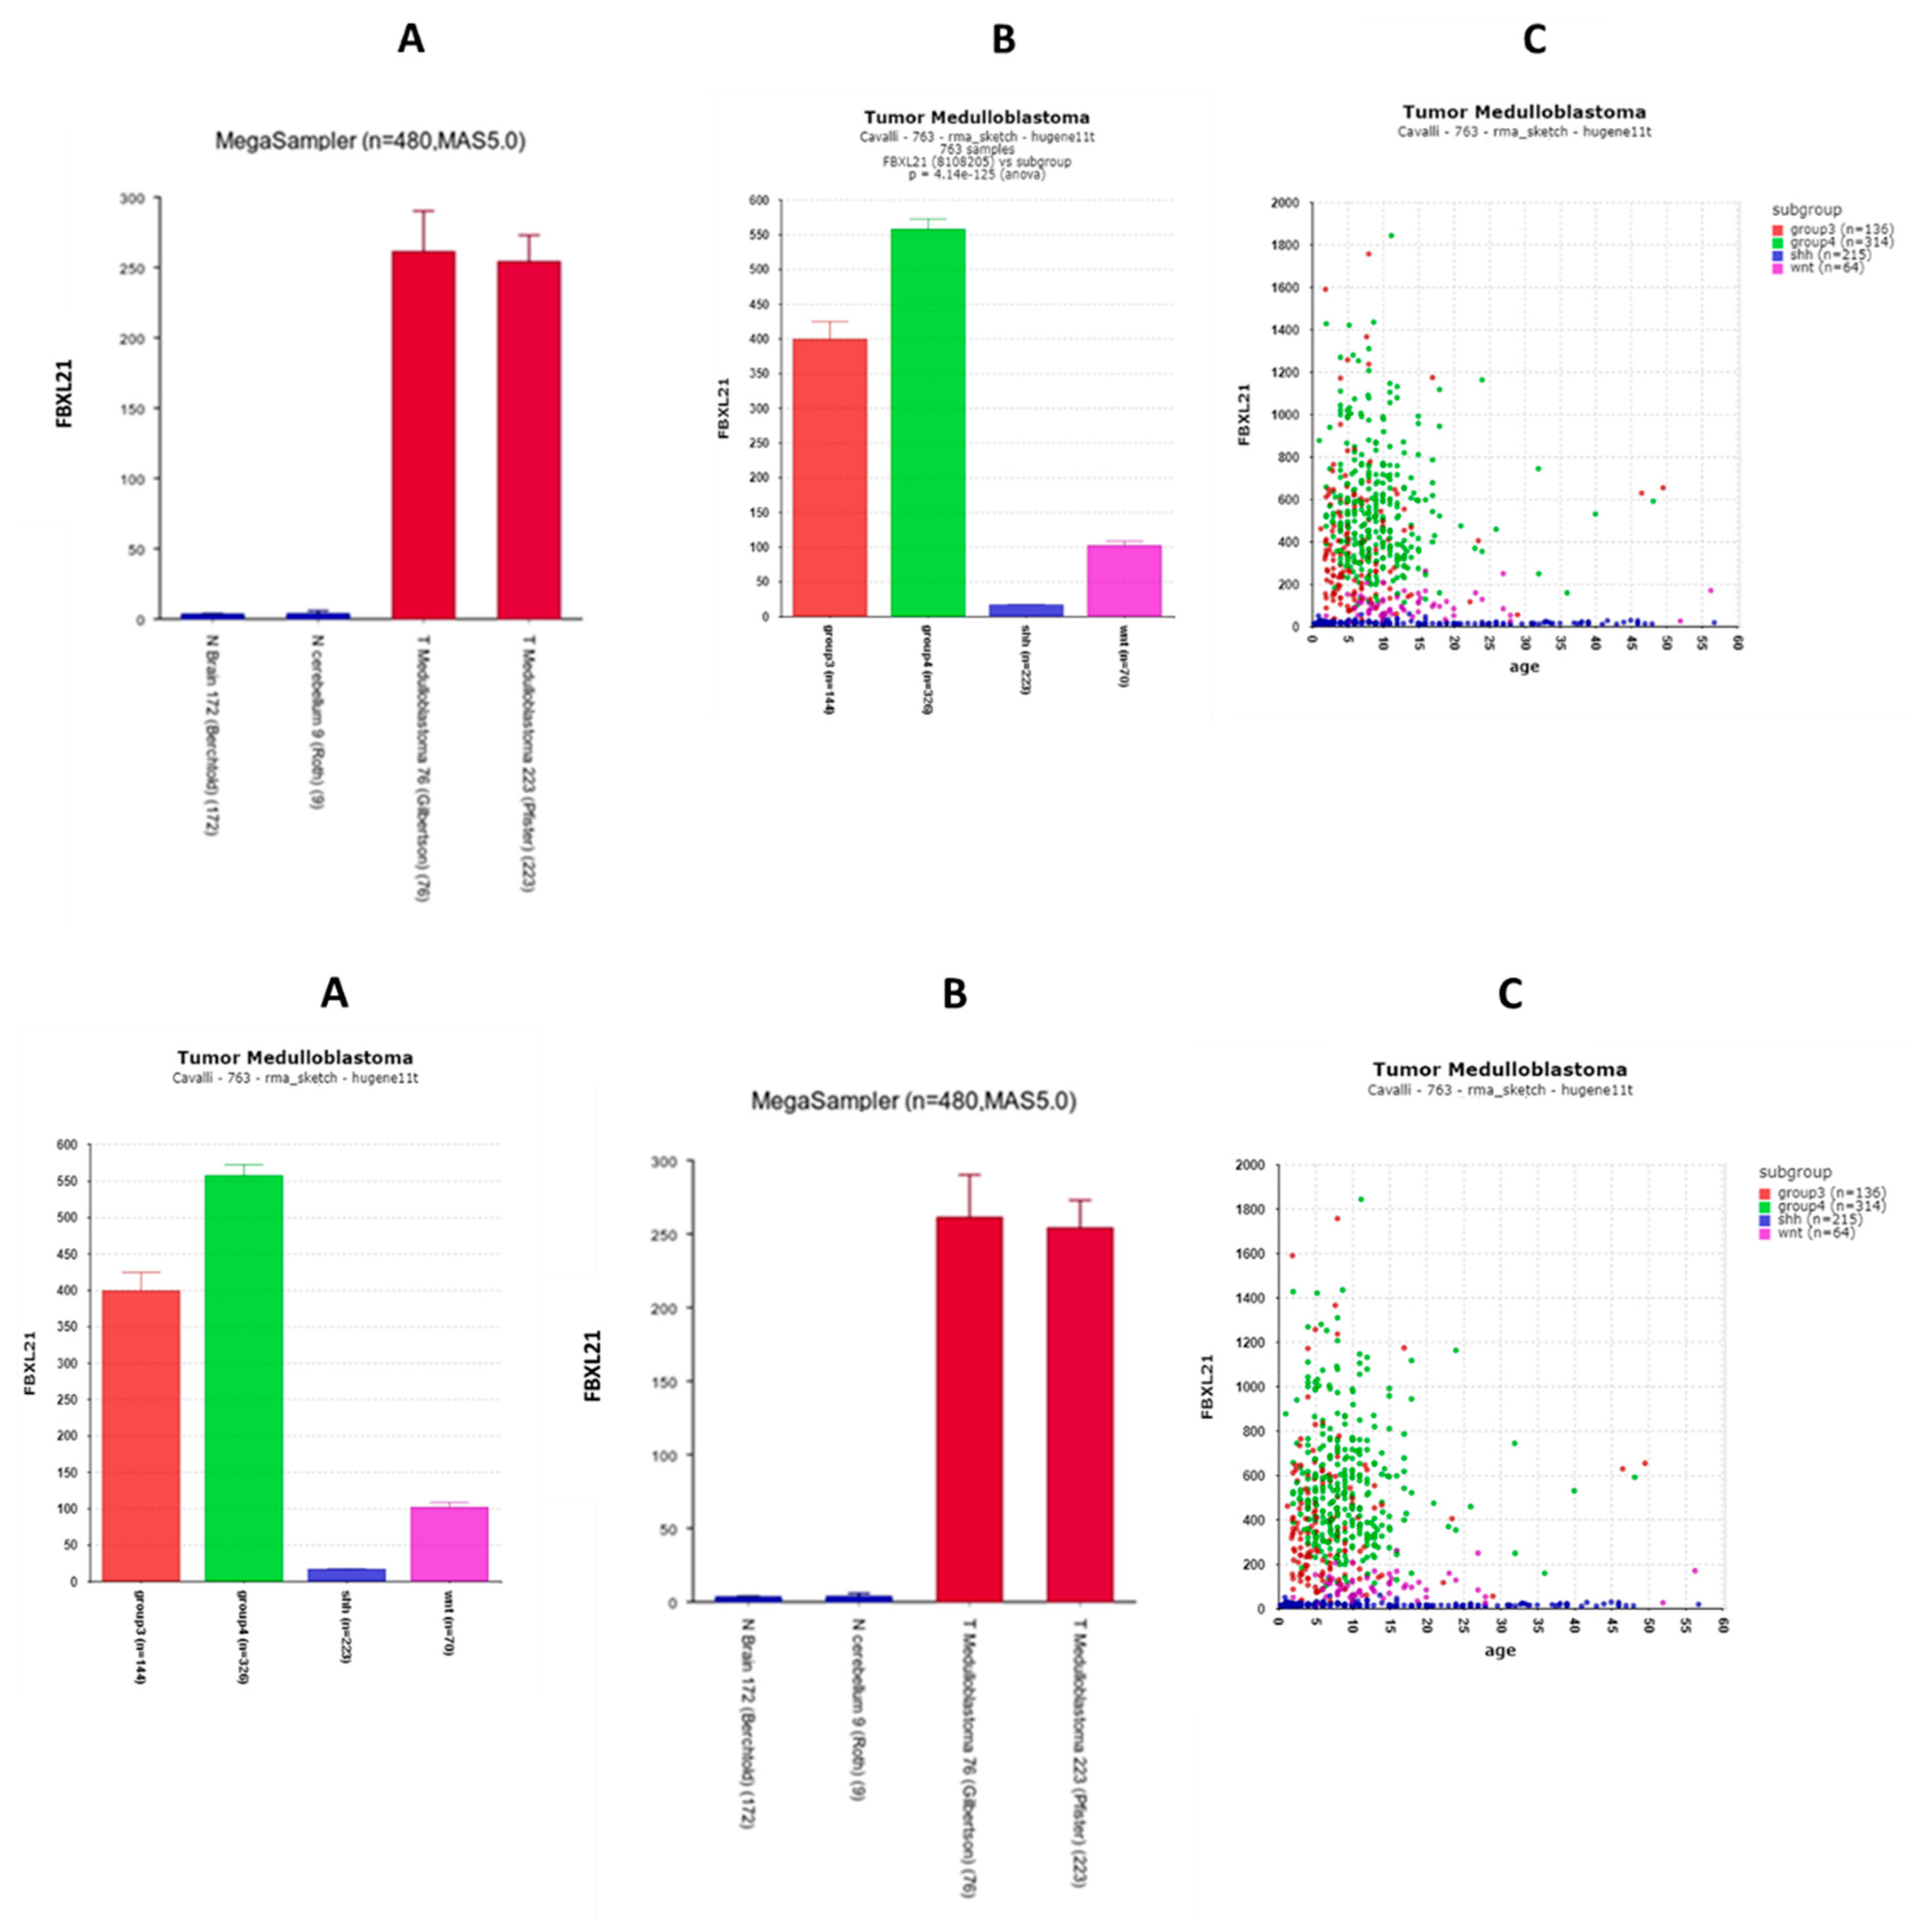
Figure 14.
A. Differential expression by subgroup of FBXW7 ( F = 71.21, p = 1.74 x 10-55) in Swarttling dataset. Red – Group 3, Green – Group 4, Grey – NA (normal) in the Swartling dataset is the non-tumor group, Blue – SHH, Yellow – WNT.B. Differential expression by 12 subtypes in Cavalli dataset (F = 40, p = 3.68 x 10-60). Increased expression in SHH gamma subtype. .
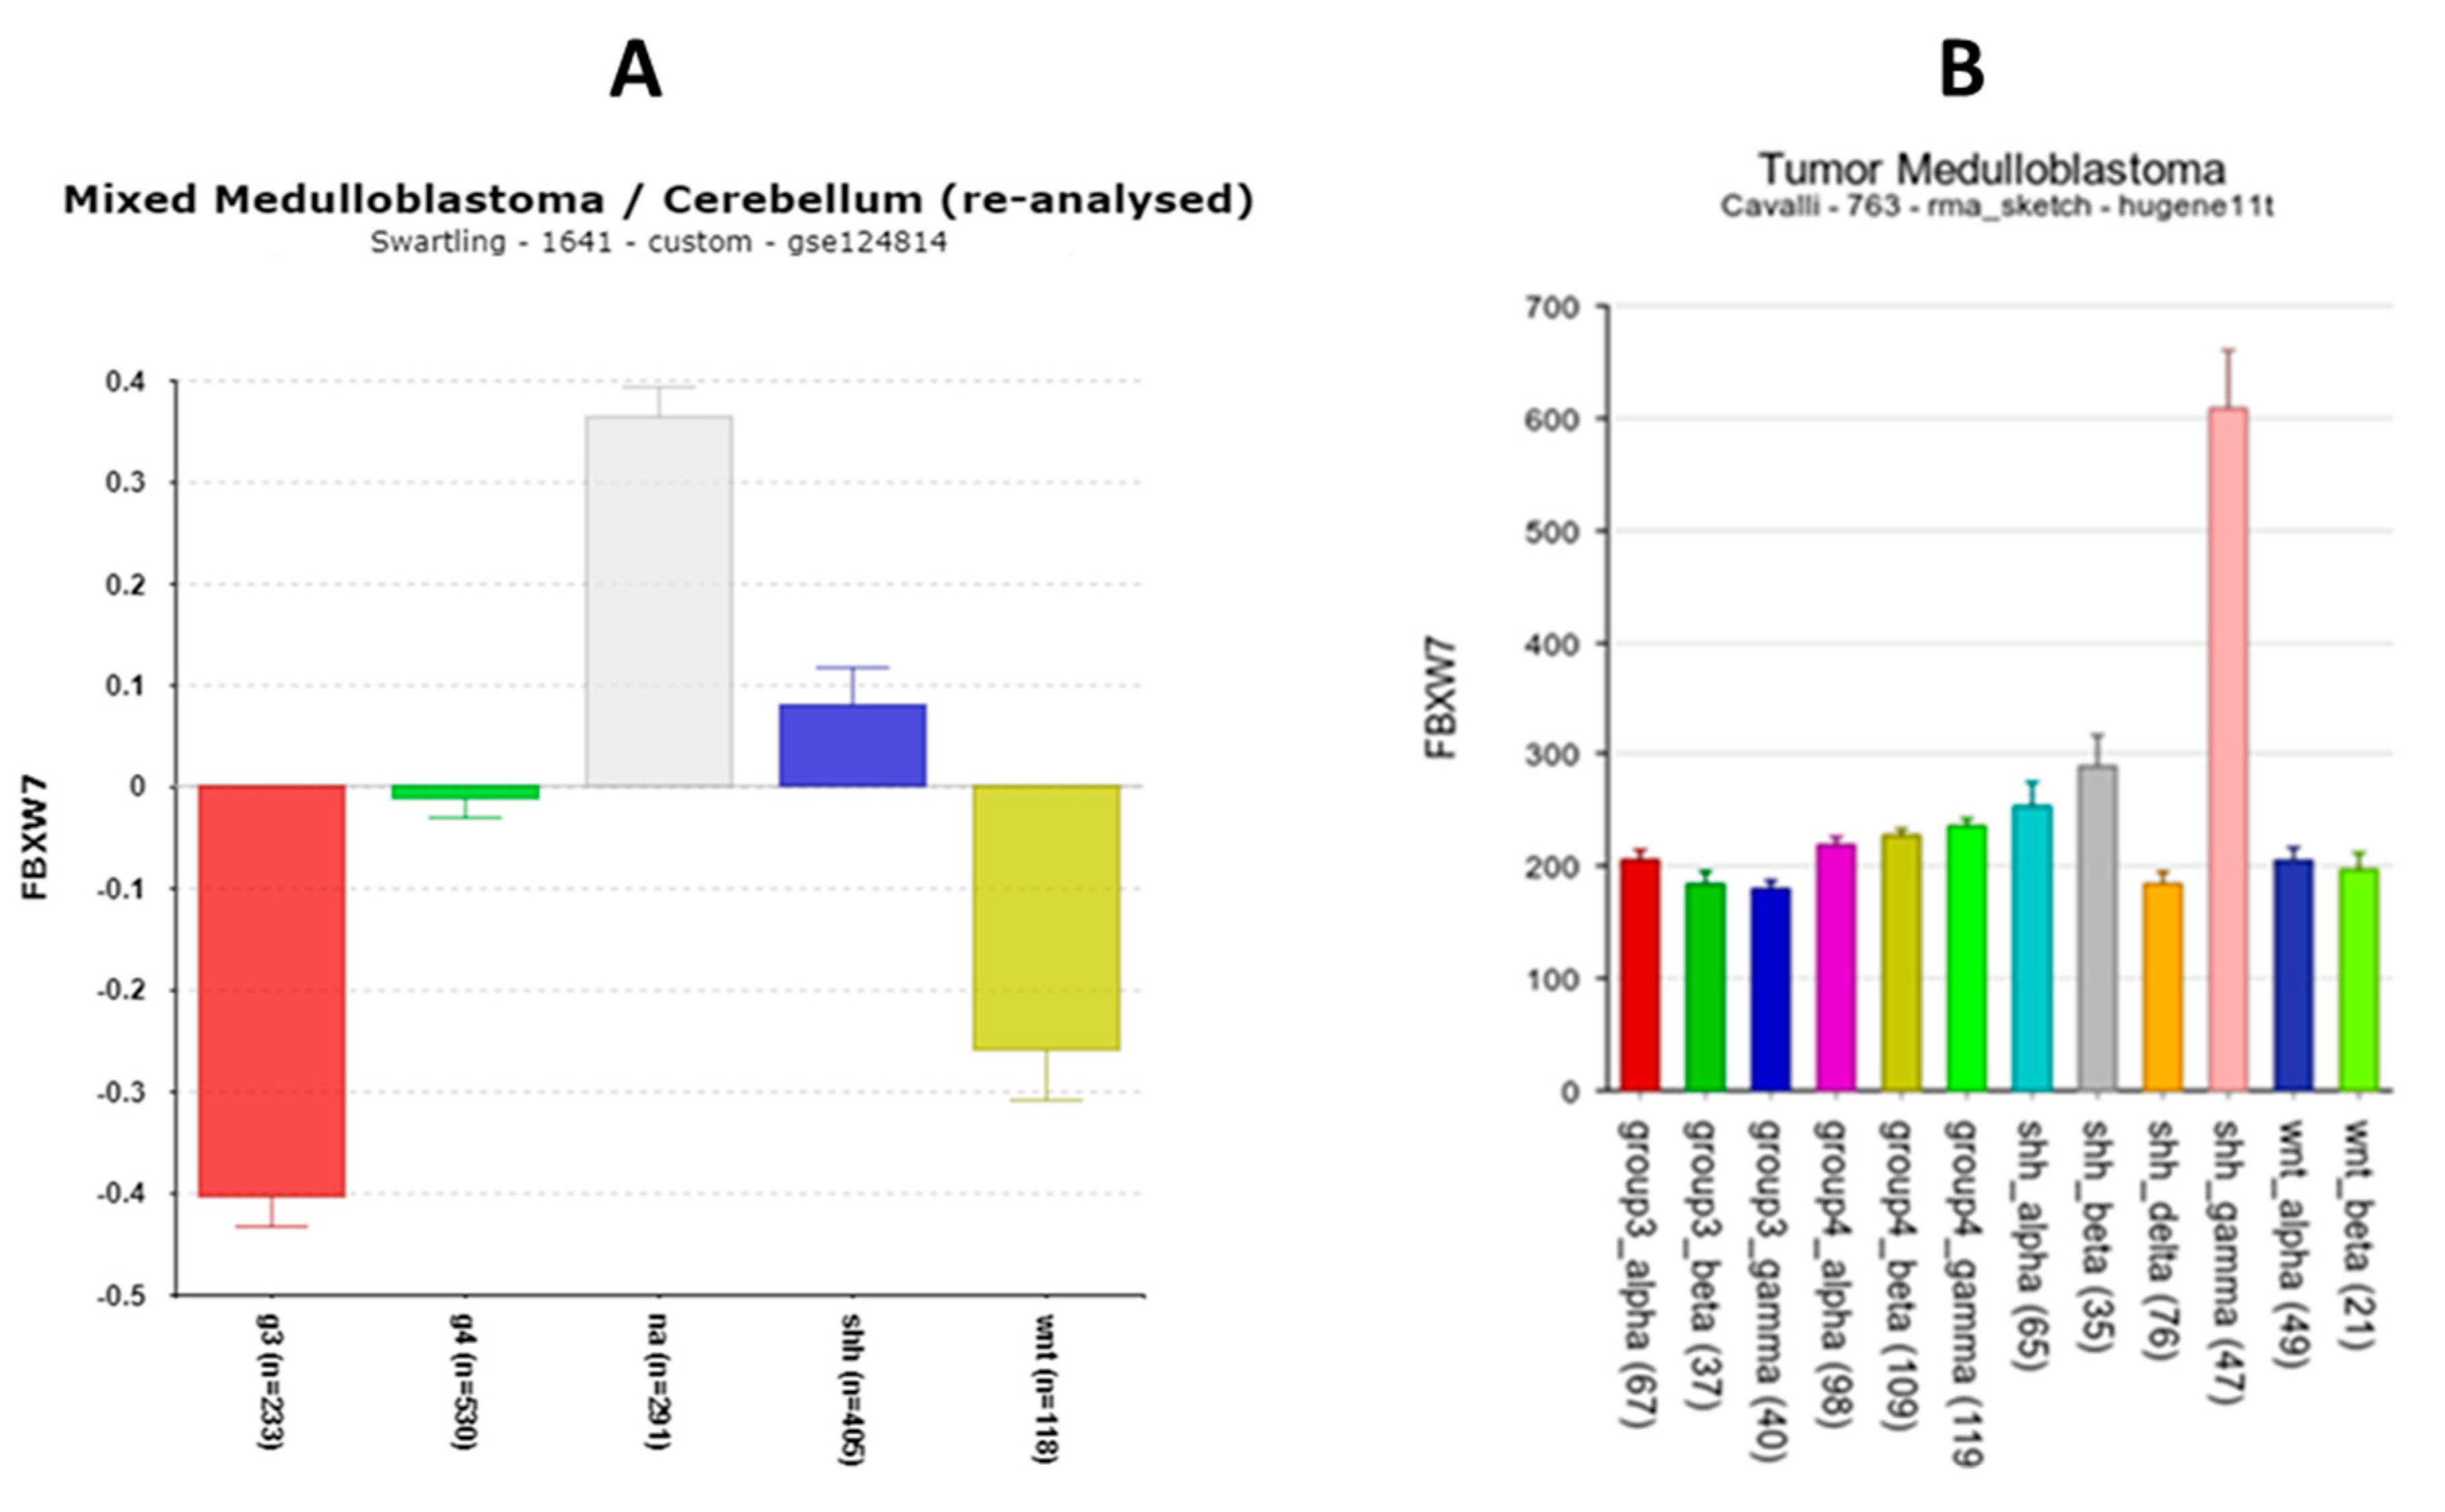
Figure 15.
Differential expression by subgroup of MYCBP2 (F = 350.75, p = 6.62 x 10-216). Red – Group 3, Green – Group 4, Grey – NA (normal) in Swartling dataset is the non-tumor group, Blue – SHH, Yellow – WNT.
Figure 15.
Differential expression by subgroup of MYCBP2 (F = 350.75, p = 6.62 x 10-216). Red – Group 3, Green – Group 4, Grey – NA (normal) in Swartling dataset is the non-tumor group, Blue – SHH, Yellow – WNT.
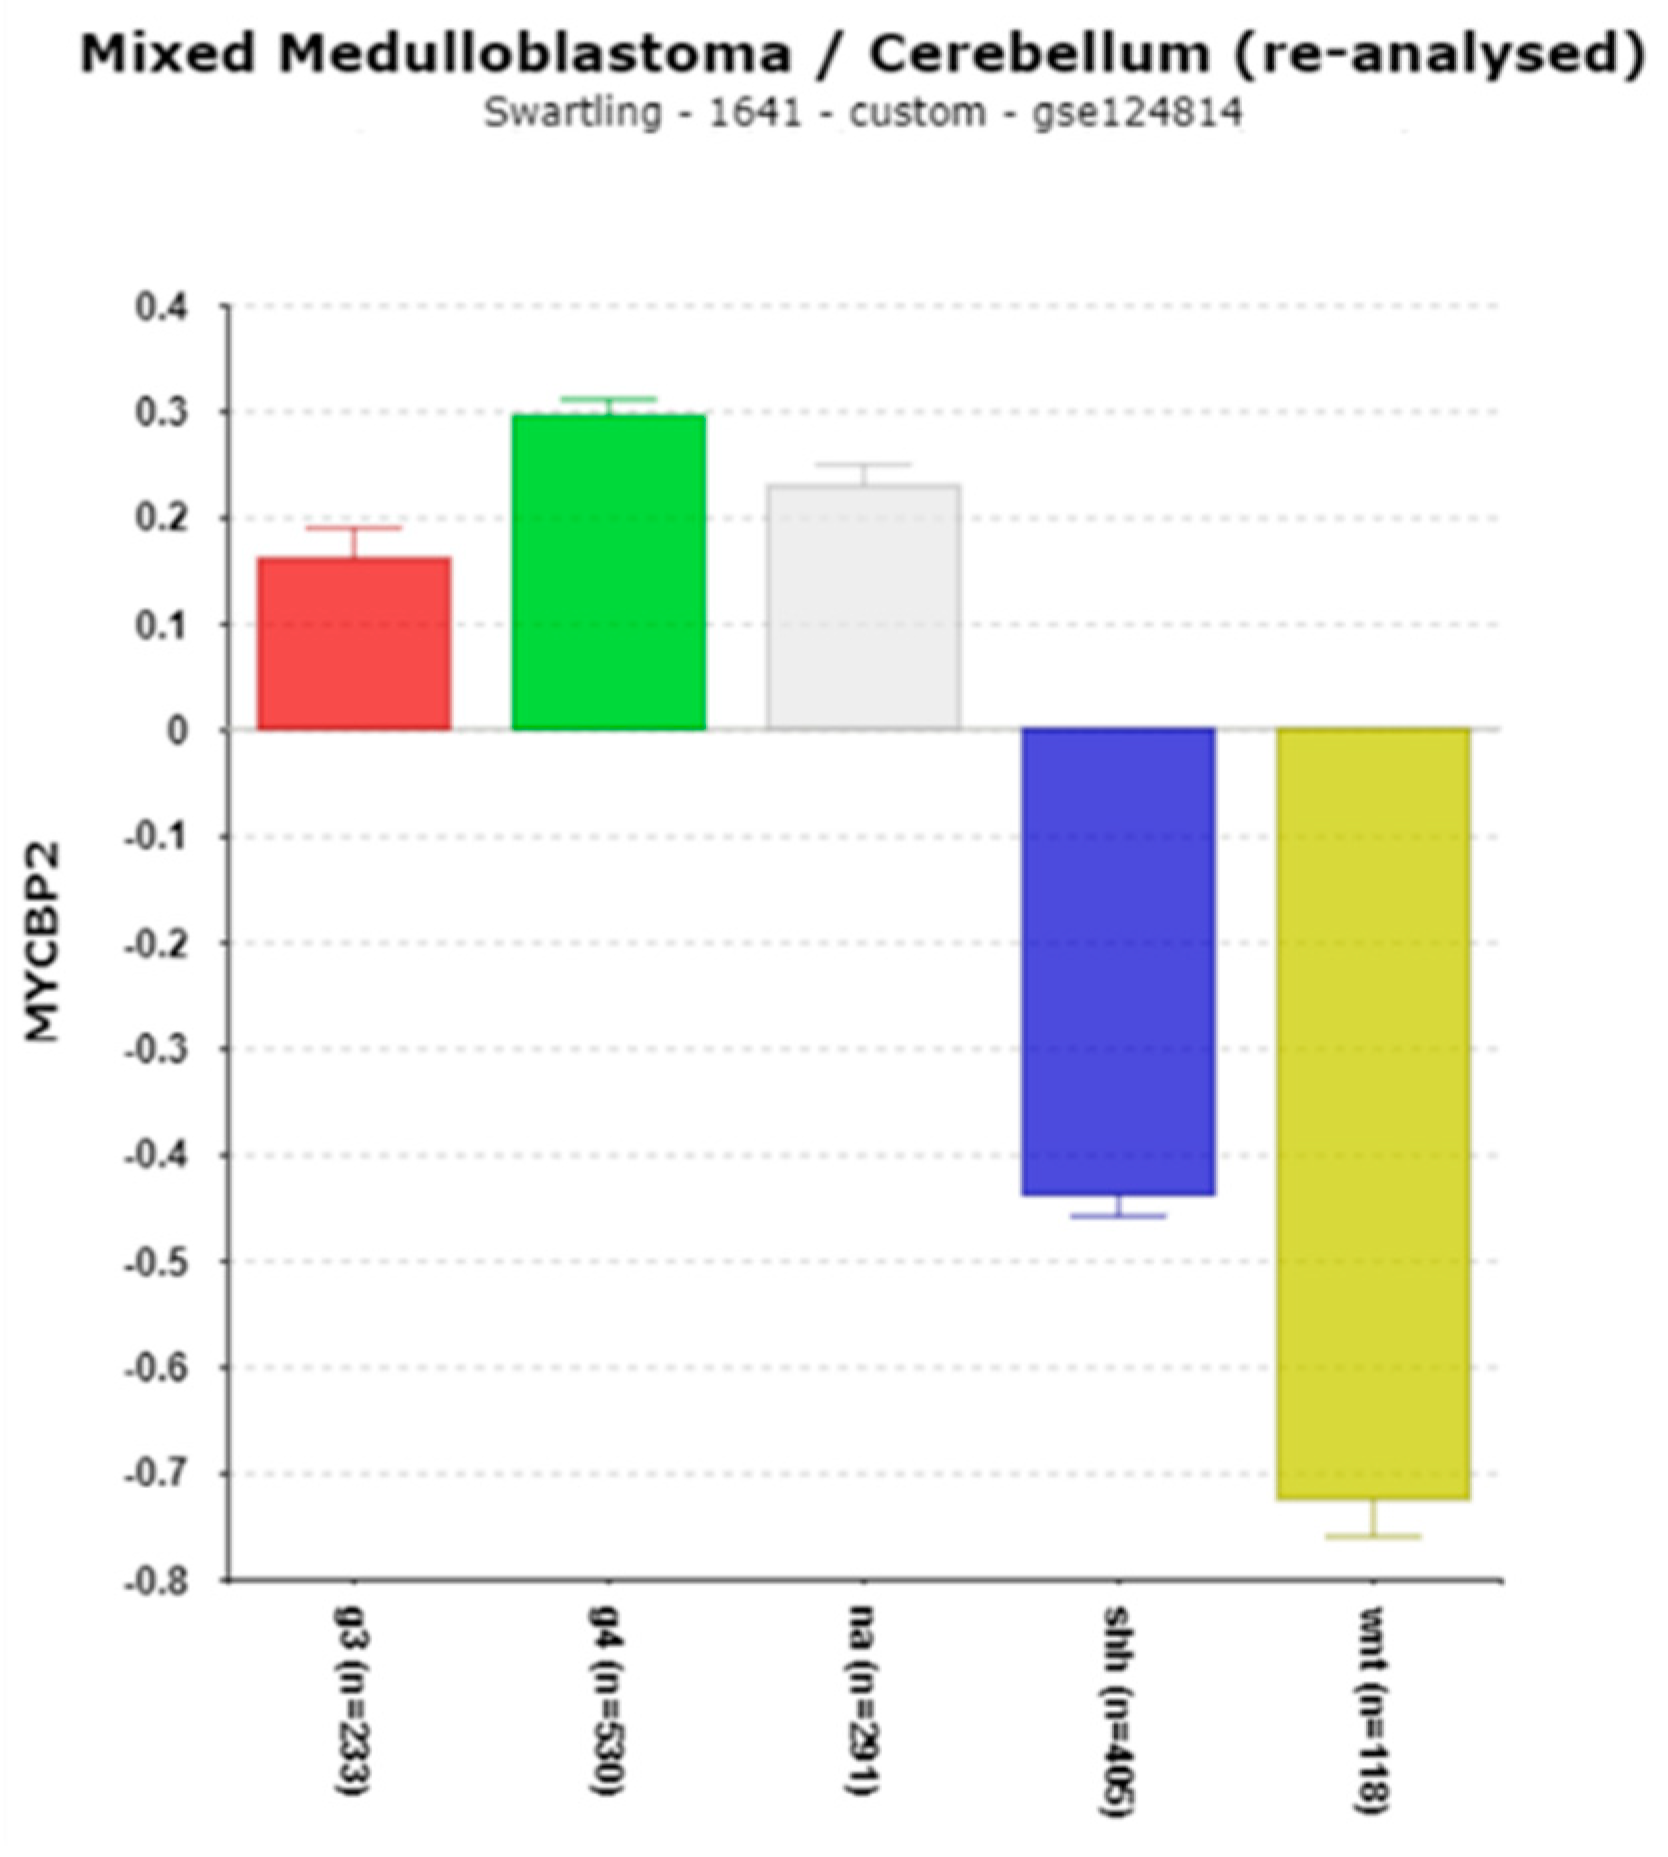
Figure 16.
Differential expression of USP2. F = 508.57, p = 1.63 x 10-281. Red – Group 3, Green – Group 4, Grey – NA (normal) in the Swartling dataset is the non-tumor group, Blue – SHH, Yellow – WNT.
Figure 16.
Differential expression of USP2. F = 508.57, p = 1.63 x 10-281. Red – Group 3, Green – Group 4, Grey – NA (normal) in the Swartling dataset is the non-tumor group, Blue – SHH, Yellow – WNT.
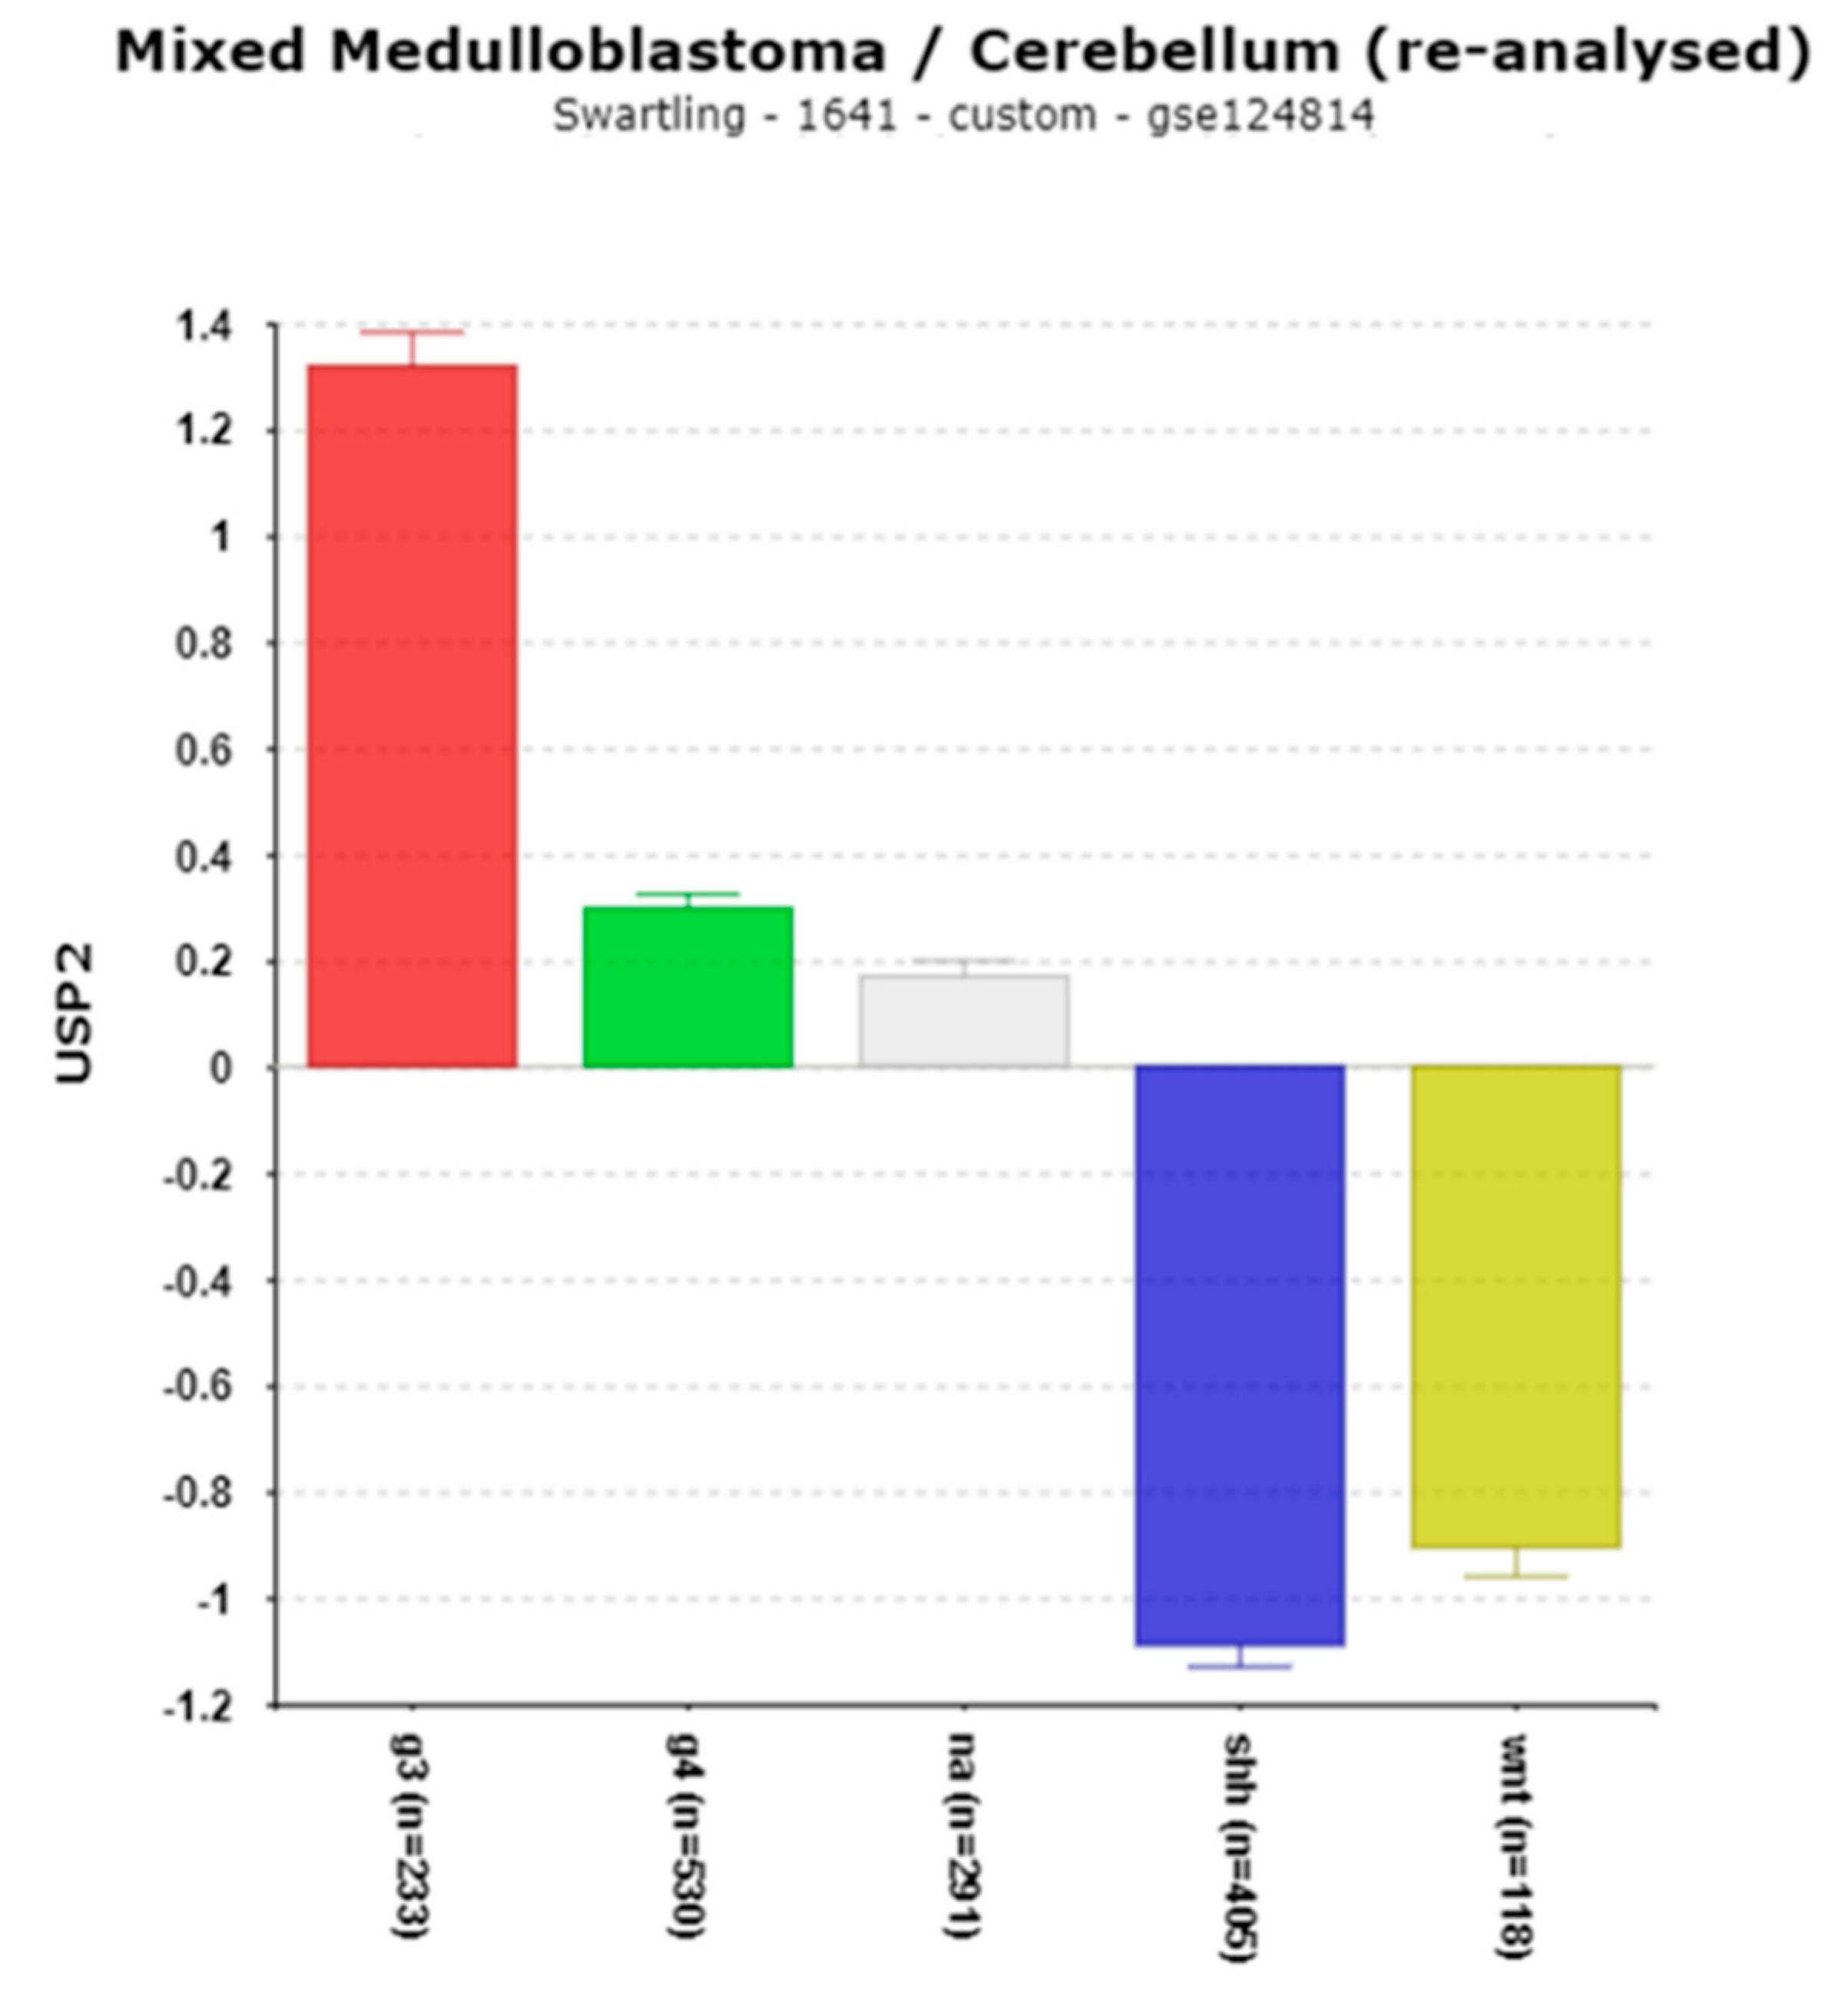
Figure 18.
Most significant Kaplan-Meier Chi-squared p values for clock genes.;.A. CRY1, Chi squared = 22.33, p = 2.29 x 10-06;.B. USP2, Chi squared = 21.73, p = 3.41 x 10-06; C. CLOCK, Chi squared = 20.21, p = 6.96 x 10-06. Red – survival curve for high gene expression; Blue – survival curve for low gene expression.
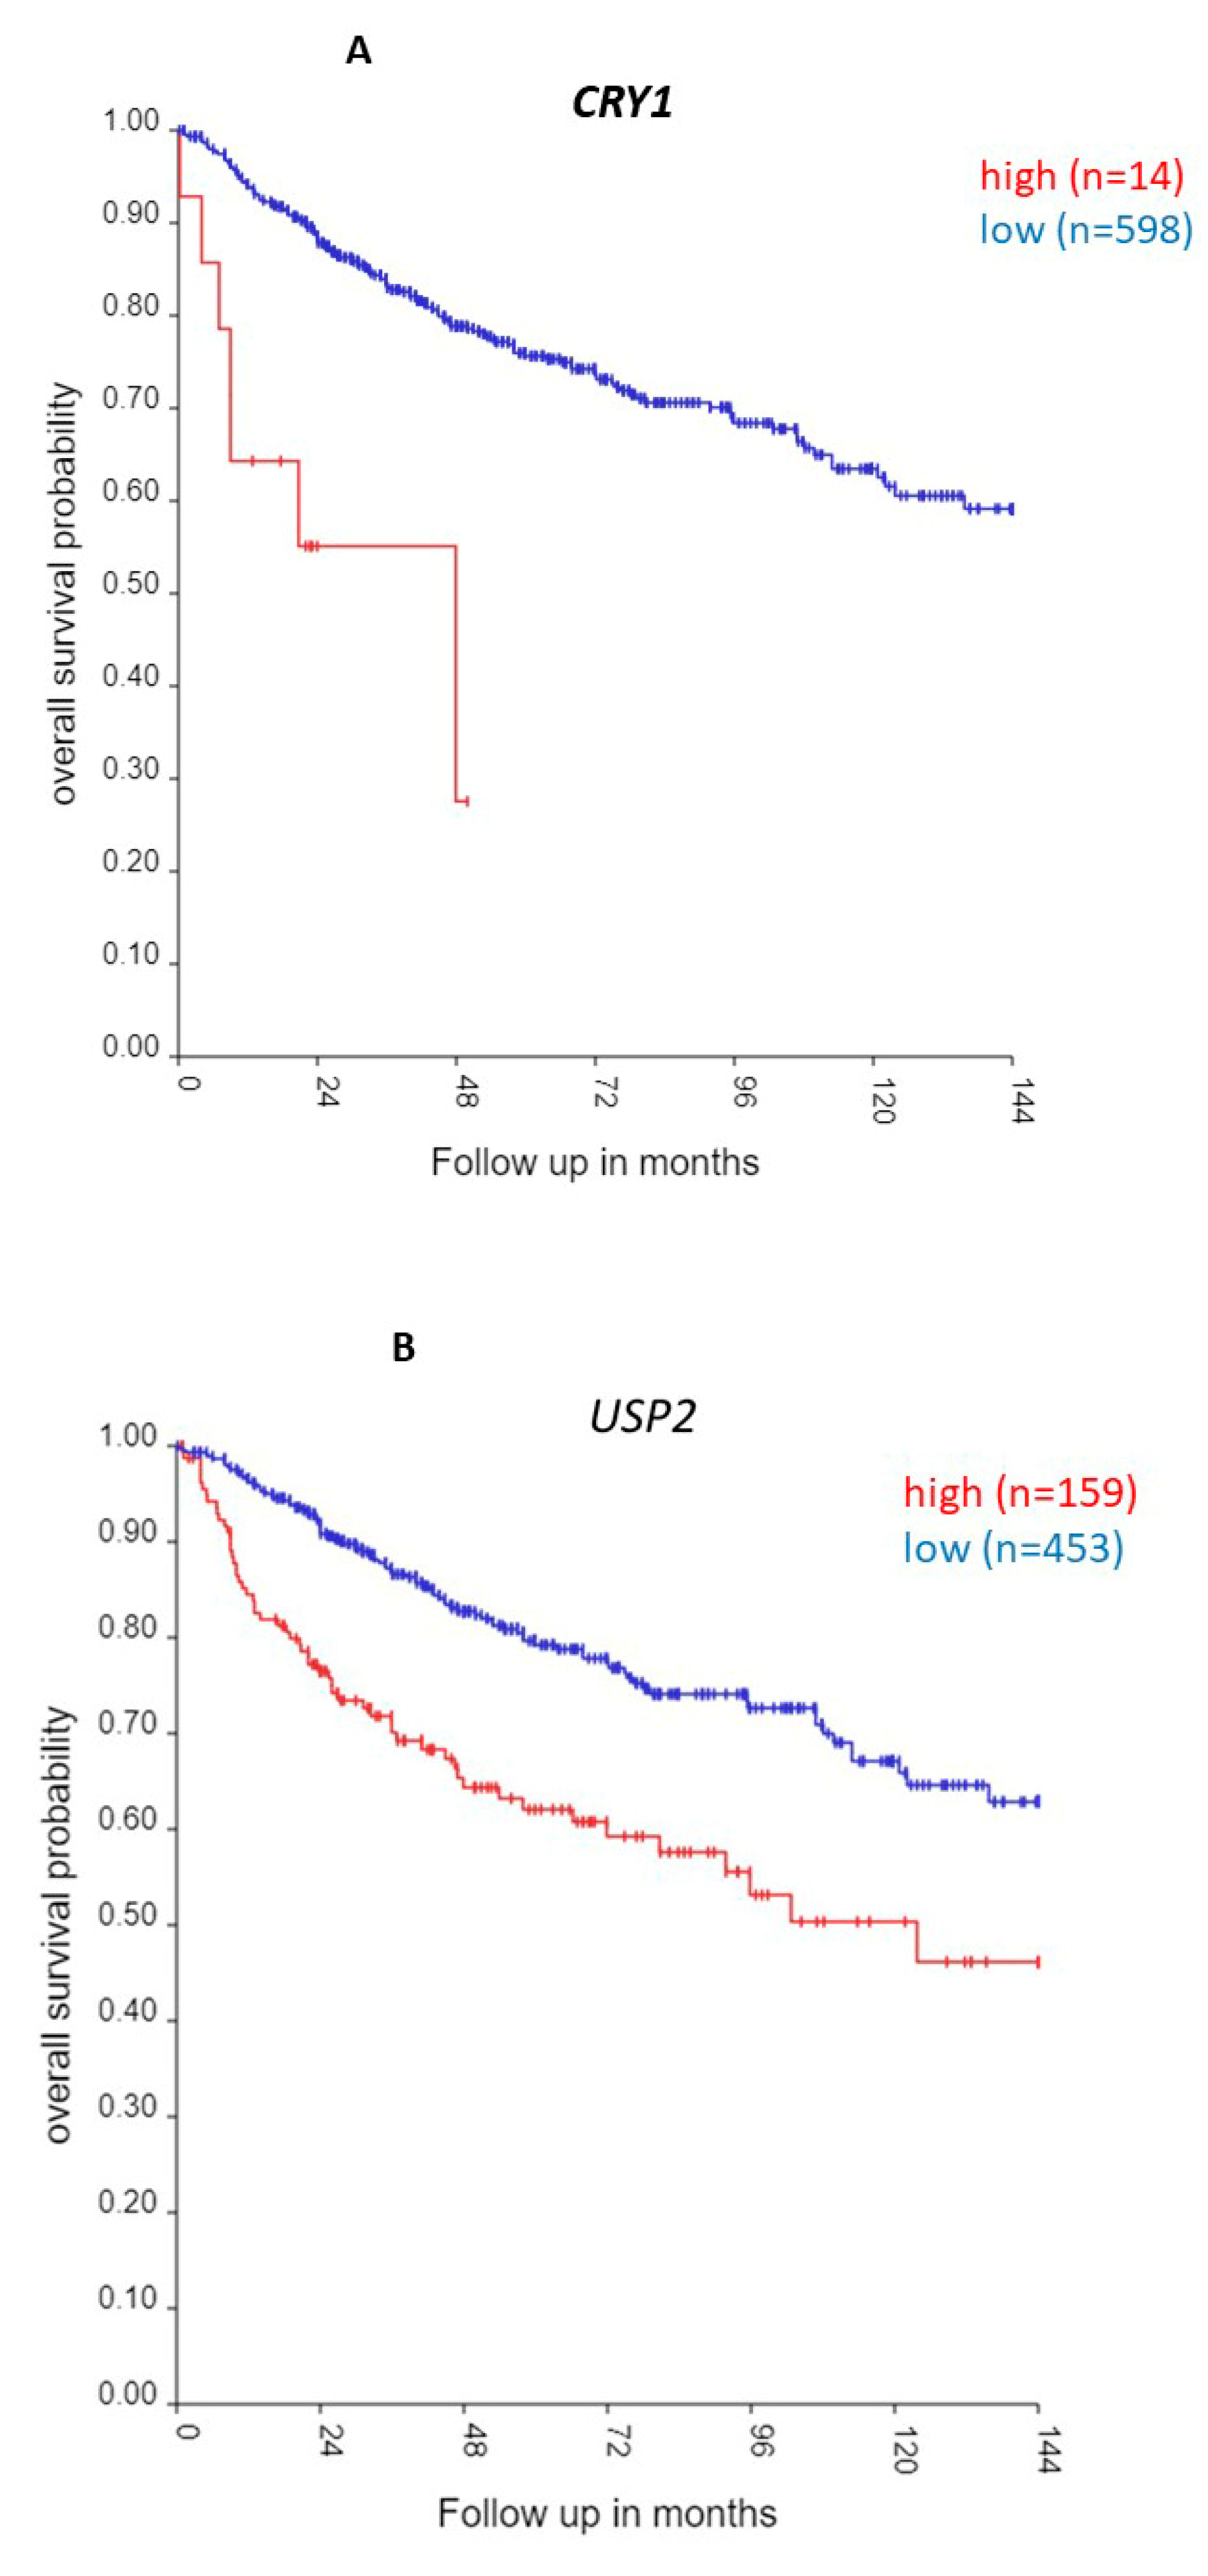
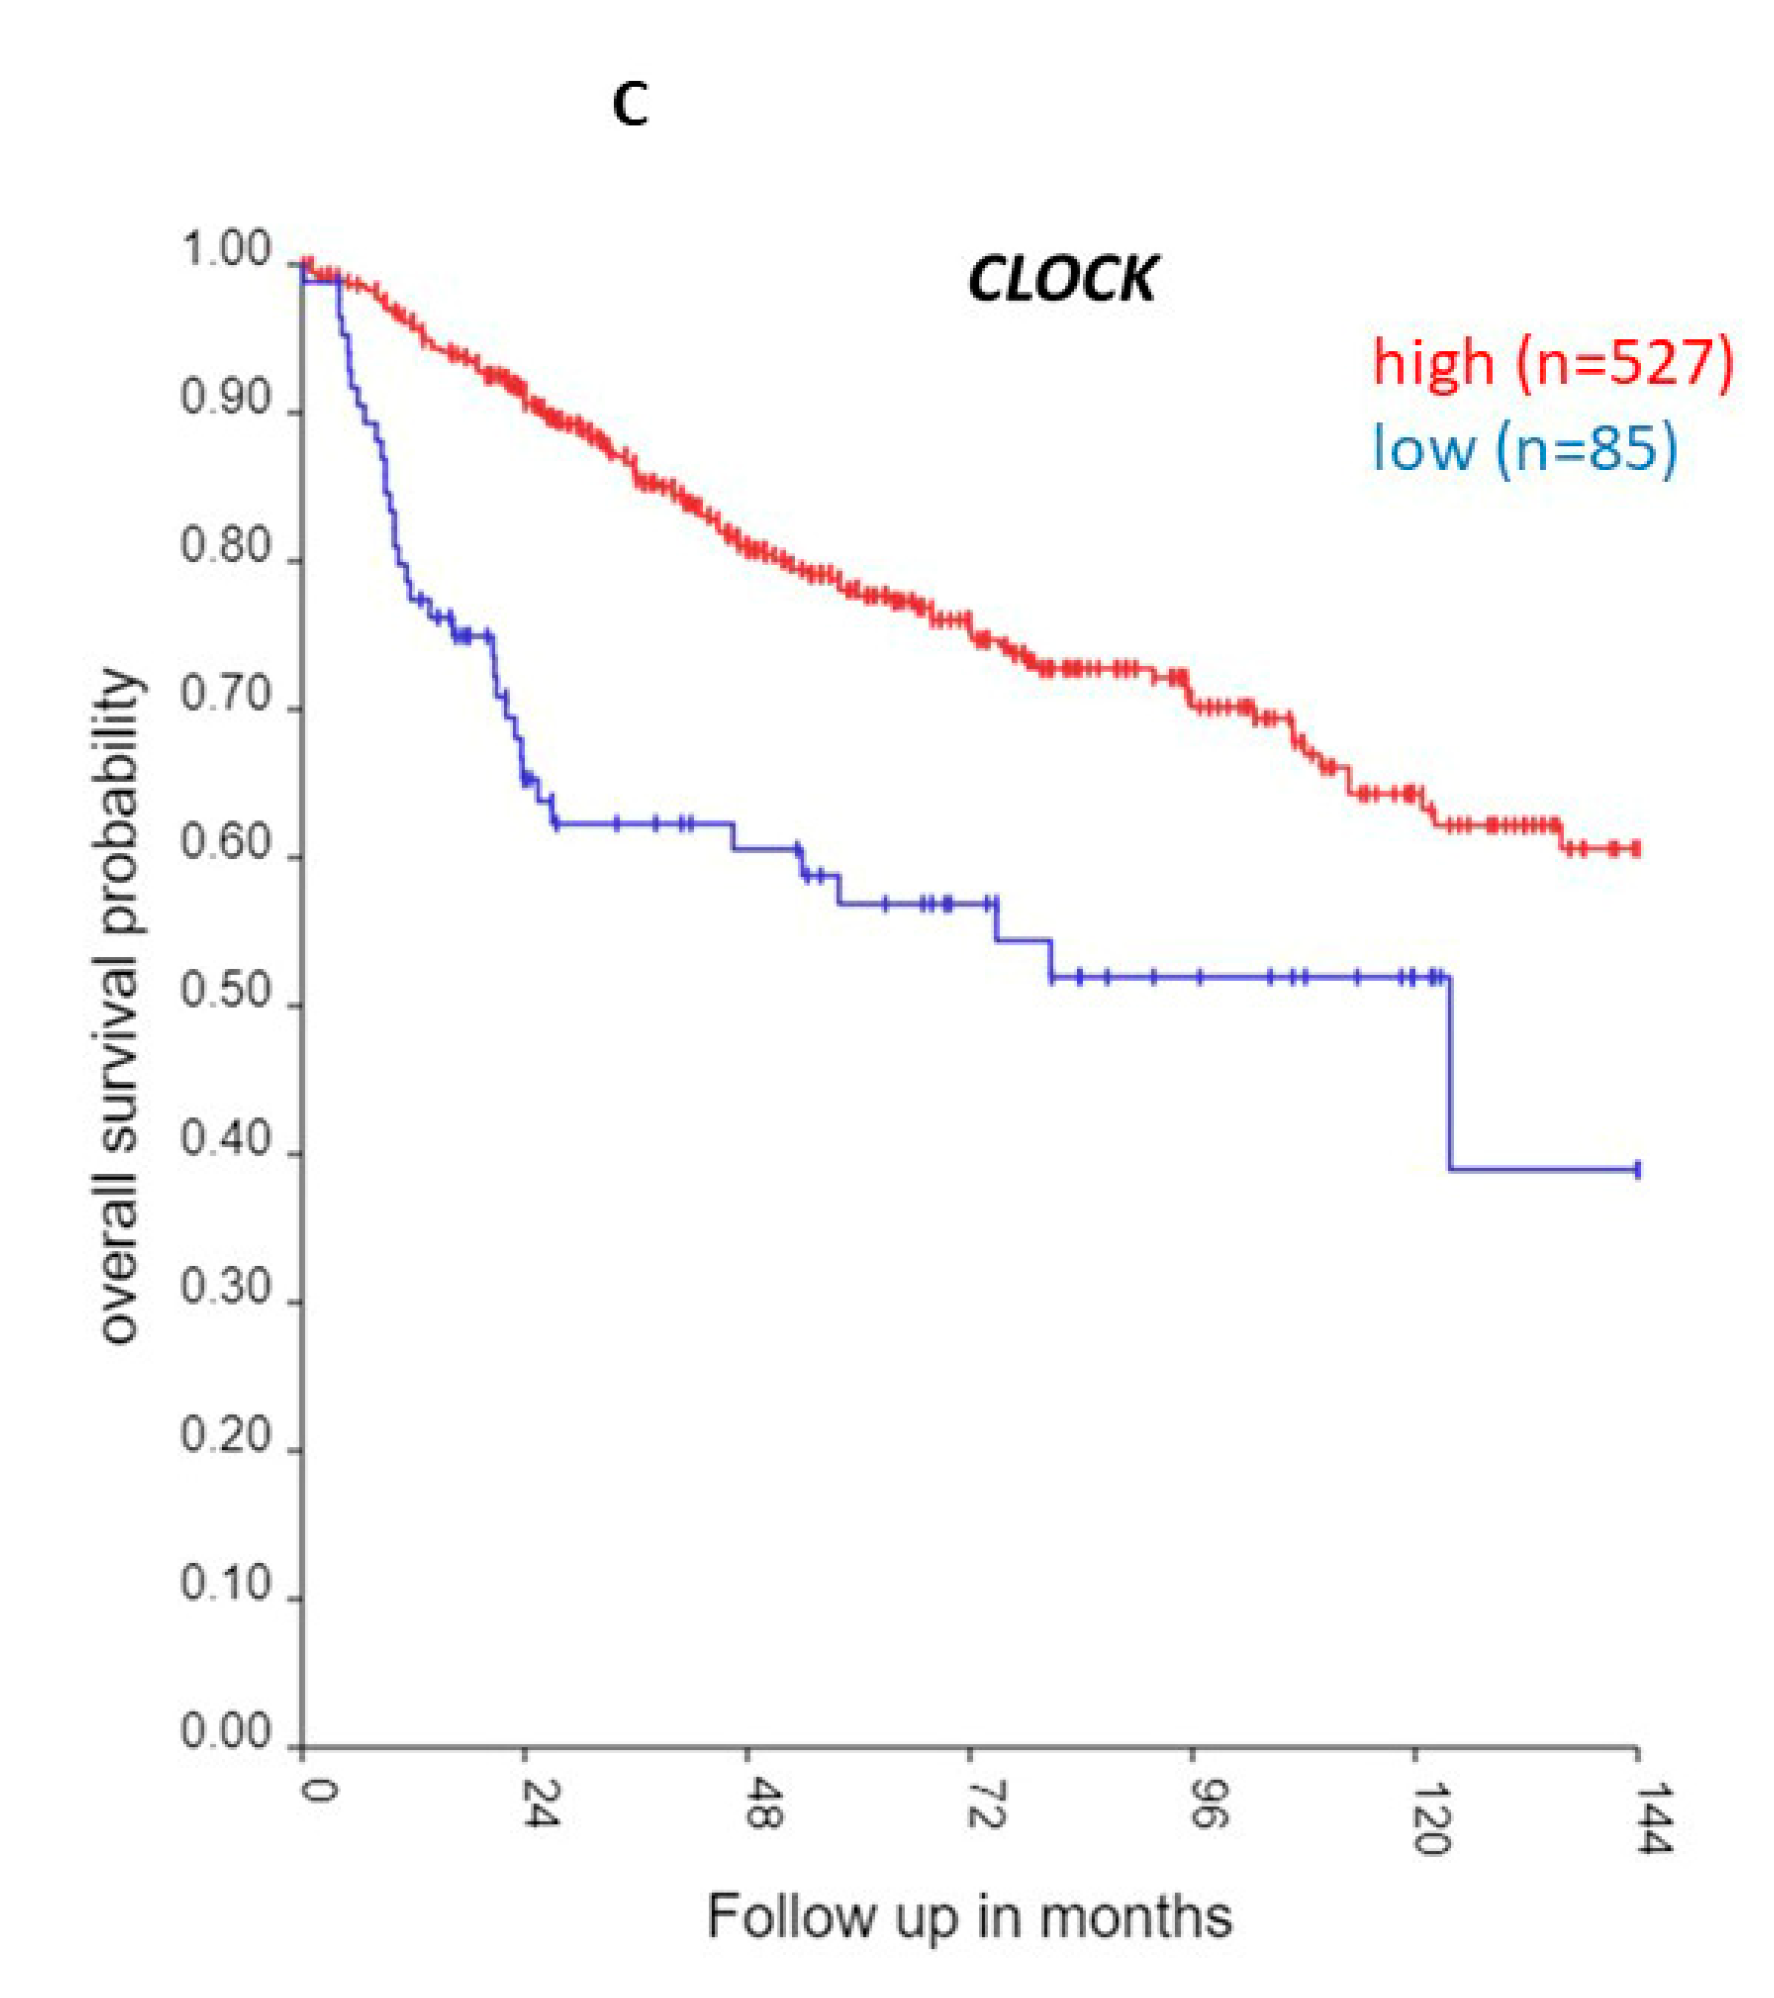
Table 1.
Clock genes: Differential expression in MB subgroups by analysis of variance.
| ‘CLOCK’ genes | F (anova) Cavalli 4 groups |
p | F (anova) Swartling 4 MB groups plus NT |
p |
|---|---|---|---|---|
| THRA/NR1D1 | 423.43 | 1.43 x 10-161 | 461.14 | 4.34 x 10-263 |
| CIPC (KIAA1737) | 379.47 | 1.67 x 10-150 | 486.84 | 3.39 x 10-273 |
| FBXL21 | 289.07 | 4.14 x 10-125 | Not found* | |
| USP2 | 271.01 | 1.57 x 10-119 | 508.57 | 1.63 x 10-281 |
| MYCBP2 (PAM) | 231.63 | 1.13 x 10-106 | 350.75 | 6..62 x 10-216 |
| CRY1 | 160.65 | 1.29 x 10-80 | 289.27 | 1.69 x 10-186 |
| BHLHE40 | 139.4 | 6.08 x 10-72 | 209.02 | 7.20 x 10-144 |
| CSNK1D | 112.9 | 1.88 x 10-60 | 159.17 | 1.91 x 10-114 |
| NFIL3 | 106.98 | 9.10 x 10-58 | Not found* | |
| PER2 | 101.21 | 4.08 x 10-55 | 118.11 | 6.79 x 10-129 |
| NPAS2 | 92.82 | 3.53 x 10-51 | 283.34 | 1.59 x 10-183 |
| BTRC | 83.47 | 1.11 x 10-46 | 164.35 | 1.26 x 10-117 |
| RORA | 78.39 | 3.52 x 10-44 | 85.84 | 5.18 x 10-66 |
| CLOCK | 77.07 | 1.59 x 10-43 | 126.36 | 1.32 x 10-93 |
| TIMELESS | 67.05 | 1.82 x 10-38 | 188.16 | 7.34 x 10-132 |
| ARNTL (BMAL1) | 59.29 | 1.91 x 10⁻³⁴ | 140.76 | 6.58 x 10-103 |
| FBXL15 | 57.12 | 2.67 x 10⁻³³ | 72.93 | 9.80 x 10-57 |
| DBP | 55.93 | 1.14 x 10⁻³² | 109.1 | 4.06 x 10-82 |
| KCNMA1 | 36.6 | 4.23 x 10⁻²² | Not found* | |
| CRY2 | 35.25 | 2.48 x 10⁻²¹ | 115.25 | 2.96 x 10-86 |
| PER3 | 34.22 | 9.45 x 10⁻²¹ | 100.54 | 2.81 x 10-76 |
| FBXL3 | 27.84 | 4.37 x 10⁻¹⁷ | 55.21 | 1.31 x 10-43 |
| FBXW7 | 22.21 | 8.55 x 10⁻¹⁴ | 71.21 | 1.74 x 10-55 |
| NR1D2 | 19.64 | 2.87 x 10⁻¹² | 40.21 | 4.14 x 10⁻³² |
| PER1 | 18.63 | 1.15 x 10⁻¹¹ | 39.35 | 1.93 x 10⁻³¹ |
| ARNTL2 (BMAL2) | 12.57 | 5.01 x 10-08 | 34.48 | 1.26 x 10⁻²⁷ |
| RORC | 9.86 | 2.20 x 10-06 | Not found | |
| RORB | 2.57 | 0.053 | 19.47 | 1.18 x 10⁻¹⁵ |
*Not found in Swartling dataset.
Table 2.
Survival analysis of Clock related genes; Kaplan-Meier and Cox Hazard ratios.
| Survival related ‘CLOCK’ genes | Chi squared | Kaplan-Meier p values | HR | Hazard ratio p values |
|
|---|---|---|---|---|---|
| CRY1 | 22.33 | 2.29 x 10-06 | high worse | 1.4 | 0.00094 |
| USP2 | 21.73 | 3.14 x 10-06 | high worse | 1.3 | 0.000035 |
| CLOCK | 20.21 | 6.96 x 10-06 | low worse | 0.61 | 0.024 |
| MYCBP2 (PAM) | 18.29 | 1.90x 10-05 | high worse | 1.5 | 0.018 |
| TIMELESS | 15.23 | 9.53 x 10-05 | high worse | ns | |
| UTS3/PER3** | 14.83 | 1.18 x 10-04 | low worse | 0.75 | 0.013 |
| FBXL21 | 13.63 | 2.23 x 10-04 | high worse | ns | |
| BTRC | 13.1 | 2.96 x 10-04 | low worse | ns | |
| ARNTL2 (BMAL2) | 12.91 | 3.27 x 10-04 | high worse | 1.5 | 0.0035 |
| CSNK1D | 11.5 | 6.95 x 10-04 | high worse | 2.2 | 0.0084 |
| BHLHE40 | 10.65 | 1.10 x 10-03 | low worse | ns | |
| NR1D2 | 10.62 | 1.12 x 10-03 | low worse | ns | |
| THRA/NR1D1** | 9.71 | 1.84 x 10-03 | high worse | ns | |
| RORA | 8.58 | 3.40 x 10-03 | high worse | ns | |
| RORB | 8.39 | 3.78 x 10-03 | high worse | 1.2 | 0.03 |
| PER1 | 8.25 | 4.08 x 10-03 | low worse | ns | |
| KCNMA1 | 6.96 | 8.35 x 10-03 | high worse | ns | |
| PER2 | 6.83 | 8.96 x 10-03 | high worse | ns | |
| NFIL3 | 6.67 | 9.80 x 10-03 | high worse | 1.3 | 0.034 |
| CRY2 | 6.15 | 1.3x 10-02 | high worse | ns | |
| DBP | 6.00 | 1.40 x 10-02 | high worse | ns | |
| FBXW7 | 5.76 | 1.60 x 10-02 | low worse | ns | |
| NPAS2 | 5.12 | 2.40 x 10-02 | high worse | ns | |
| AANAT | 4..95 | 2.60 x 10-02 | high worse | ns | |
| ARNTL (BMAL1) | 4.00 | 4.50 x10-02 | low worse | ns | |
| CIPC (KIAA1737) | 3.99 | 4.60 x10-02 | high worse | ns | |
| FBXL15 | 3.98 | 4.60 x 10-02 | low worse | ns | |
| LINGO4/RORC** | 3.16 | 0.76 x 10⁻¹ | ns | ns | |
| FBXL3 | 2.89 | 8.90 x 10-02 | ns | ns |
** same reporter listed for two genes.
Table 3.
Clock genes: Differential expression related to copy number gain of chromosome 17q.
| ‘CLOCK’ genes | Chromosomal location |
Means ± s.e. Normal |
Means ± s.e. Gain 17q |
p value for t-test |
|---|---|---|---|---|
| THRA/NR1D1 | 17q21.1 | 921.99 ± 16.44 | 1533.30 ± 22.89 | 1.57 x 10-84 |
| CIPC (KIAA1737) | 14q24.3 | 551.55 ± 10.71 | 891.27 ± 13.19 | 7.35 x 10-73 |
| CSNK1D | 17q25.3 | 647.89 ± 5.67 | 793.71 ± 5.70 | 9.19 x 10-60 |
| FBXL21 | 5q31.1 | 178.26 ± 12.47 | 525.69 ± 16.53 | 1.09 x 10-55 |
| MYCBP2/PAM | 13q22.3 | 530.72 ± 10.14 | 693.05 ± 8.66 | 2.08 x 10⁻²⁹ |
| PER2 | 2q37.3 | 212.53 ± 3.20 | 273.45 ± 4.29 | 8.03 x 10⁻²⁹ |
| NPAS2 | 2q11.2 | 188.29 ± 8.87 | 355.41 ± 12.84 | 2.41 x 10⁻²⁶ |
| NFIL3 | 9q22.31 | 123.99 ± 2.75 | 165.33 ± 2.42 | 6.50 x 10⁻²⁶ |
| CRY2 | 11p11.2 | 193.97 ± 2.33 | 236.28 ± 4.44 | 2.64 x 10⁻¹⁸ |
| BTRC | 10q24.32 | 329.77 ± 4.98 | 390.03 ± 5.61 | 3.80 x 10⁻¹⁵ |
| CLOCK | 4q12 | 425.20 ± 4.43 | 486.90 ± 6.79 | 1.06 x 10⁻¹⁴ |
| TIMELESS | 12q13.3 | 159.39 ± 3.22 | 189.19 ± 2.82 | 3.06 x 10⁻¹¹ |
| BHLHE40 | 3p26.1 | 250.49 ± 10.80 | 164.57 ± 4.88 | 7.11 x 10⁻¹¹ |
| DBP | 19q13.33 | 189.32 ± 3.99 | 230.81 ± 5.81 | 2.07 x 10-09 |
| PER1 | 17p13.1 | 137.78 ± 4.05 | 111.29 ± 2.51 | 2.67 x 10-07 |
| CRY1 | 12q23.3 | 224.89 ± 8.22 | 280.67 ± 8.54 | 3.52 x 10-06 |
| NR1D2 | 3p24.2 | 422.73 ± 6.49 | 463.72 ± 8.49 | 1.02 x 10-04 |
| USP2 | 11q23.3 | 276.55 ± 18.90 | 373.71 ± 14.59 | 1.11 x 10-04 |
| FBXL15 | 10q24.32 | 47.39 ± 0.46 | 49.86 ± 0.44 | 1.62 x 10-04 |
| FBXW7 | 4q31.3 | 260.54 ± 9.77 | 222.39 ± 3.97 | 1.08 x 10-03 |
| FBXL3 | 13q22.3 | 387.40 ± 4.54 | 409.41 ± 5.47 | 1.88 x 10-03 |
| ARNTL2 | 12p11.23 | 59.71 ± 1.30 | 64.99 ± 1.70 | 1.23 x 10-02 |
| KCNMA1 | 10q22.3 | 288.29 ± 11.66 | 326.16 ± 10.74 | 2.02 x 10-02 |
| AANAT | 17q25.1 | 45.16 ± 1.35 | 42.35 ± 0.94 | 8.14 x 10-02 ns |
| ARNTL | 11p15.3 | 96.57 ± 4.40 | 89.08 ± 2.77 | 1.78 x 10-01 ns |
| RORA | 15q22.2 | 283.04 ± 8.28 | 299.43 ± 8.91 | 1.81 x 10-01 ns |
| RORB | 9q21.13 | 61.65 ± 3.43 | 60.31 ± 3.03 | 7.76 x 10-01 ns |
*no KEGG pathway detected at cutoff of r > 0..
Disclaimer/Publisher’s Note: The statements, opinions and data contained in all publications are solely those of the individual author(s) and contributor(s) and not of MDPI and/or the editor(s). MDPI and/or the editor(s) disclaim responsibility for any injury to people or property resulting from any ideas, methods, instructions or products referred to in the content. |
© 2024 by the authors. Licensee MDPI, Basel, Switzerland. This article is an open access article distributed under the terms and conditions of the Creative Commons Attribution (CC BY) license (http://creativecommons.org/licenses/by/4.0/).
Copyright: This open access article is published under a Creative Commons CC BY 4.0 license, which permit the free download, distribution, and reuse, provided that the author and preprint are cited in any reuse.


