
Submitted:
15 December 2024
Posted:
16 December 2024
You are already at the latest version
Abstract
Human Cytomegalovirus (HCMV) is a ubiquitous pathogen that establishes lifelong infections by evading the host immune system, particularly through targeting Class I Major Histocompatibility Complex (MHC-I) molecules. This immune evasion is mediated by a subset of viral proteins, including unique short (US) and unique long (UL) glycoproteins, which disrupt MHC-I antigen presentation and impair cytotoxic T-cell responses. In this study, we conducted an in-depth bioinformatics analysis of five key HCMV proteins (US2, US3, US6, US10, and US11) to investigate their structural and functional characteristics, focusing on their interactions with MHC-I molecules. Through homology modelling, binding affinity predictions, and structural comparisons, we identified unique features that enhance the ability of these viral proteins to inhibit immune recognition. Notably, structural adaptations in US6 and US10 suggest specialized roles in antigen processing interference. These findings provide new insights into the molecular mechanisms of HCMV immune evasion and offer potential avenues for developing targeted antiviral therapies.
Keywords:
Human Cytomegalovirus (HCMV)
; human herpesvirus 5 (HHV-5)
; Major Histocompatibility Complex (MHC) molecules
; Protein structure and function
; Viral bioinformatics
Introduction:
Human Cytomegalovirus (HCMV), a member of the Herpesviridae family and Betaherpesvirinae subfamily, establishes lifelong infections in its host, persisting indefinitely after initial exposure. Most HCMV infections are asymptomatic or cause mild, non-specific symptoms, such as fever, body aches, or swollen lymph nodes. Following primary infection, which often goes unnoticed, the virus enters a latent phase, persisting silently within host cells[1,2]. During latency, HCMV remains dormant in host cells, asymptomatic until periodic reactivation triggers viral replication and clinical symptoms. Neonatal HCMV infections often result from exposure during delivery and pose significant risks, with congenital infections affecting 10 out of 100,000 live births globally[3,4,5]. Neonates face the highest risk of congenital CMV (cCMV) infection through vertical transmission[6,7]. Congenital CMV (cCMV) infection occurs in 0.3–1.2% of births, often resulting from maternal primary infection during pregnancy. HCMV can cause severe complications in immunocompromised individuals and is transmitted through bodily fluids, including saliva, blood, urine, and genital secretions[8,9,10].
The HCMV genome, comprising approximately 235 kb of linear double-stranded DNA, is the largest among human herpesviruses, encoding over 200 open reading frames (ORFs)[11,12]. The HCMV genome contains various major unique long (UL) and unique short (US) gene families. US6, US7, US12, US22; and UL14, UL18, UL25, UL82, UL120 play important roles in infection. HCMV also contains more than 751 translated ORFs[13,14]. A study by Balazs et al. (2017) found that among the viral transcripts, 282 were actively translated into proteins and one-third of the viral poly-A RNA transcripts were protein-coding[15]. It encodes four major long non-coding RNAs (RNA1.2, RNA2.7, RNA4.9, and RNA5.0), at least 16 pre-miRNAs and 26 mature miRNAs which are responsible for gene expression and viral infection[16,17,18]. A mature HCMV envelope comprises a lipid bilayer containing approximately eleven viral glycoproteins, intrinsic membrane proteins, and a capsid surrounded by a protein layer called the tegument, which aids in viral replication and spread[19,20,21,22]. Glycoproteins of HCMV like glycoprotein B (gB), glycoprotein H (gH), glycoprotein L (gL), glycoprotein D (gD), and glycoprotein M (gM) play key roles in infecting the host. These glycoproteins have specific shapes that fit into matching receptors on the surface of host cells, much like a key fitting into a lock. When the glycoprotein interacts with the host receptor, it binds together tightly[11,23]. This attachment is a crucial first step in the process of viral infection. HCMV replication occurs in diverse cell types including epithelial, endothelial, and mononuclear cells, particularly affecting salivary gland and renal epithelial cells[24,25].
For activation and function of cytotoxic effector cells, Class I Major Histocompatibility Complex (MHC-I) molecules are necessary molecular components in the innate and adaptive immune system, i.e., natural killer (NK) cells and CD8+ T cells. HCMV has developed mechanisms to downregulate peptide-presenting MHC class I molecules on the cell surface[26,27]. At the same time, leukocyte Ig-like receptors (LIRs) and killer cell immunoglobulin-like receptors (KIRs) are present in the human immune system and are responsible for the activation of natural killer (NK) cells through binding with class I MHC molecules. HCMV infection inhibits MHC-I expression, impairing antigen presentation and reducing the ability of immune cells to target infected cells. Therefore, MHC-I molecules are targeted by HCMV to direct their functions. In infected cells, antigen presentation pathways are also affected by the HCMV interruption during the process of maturation[28,29].
HCMV-encoded proteins such as US2, US3, US6, US10, and US11 are critical for evading host immunity by targeting the MHC-I antigen presentation pathway[30,31,32]. Specifically, US2 facilitates immune evasion by directing newly synthesized MHC-I molecules in the endoplasmic reticulum (ER) to degradation pathways. US2 targets newly synthesized MHC-I molecules in the endoplasmic reticulum (ER), redirecting them to the ER-associated degradation (ERAD) pathway for proteasomal degradation. As a result, there is a reduction in the available number of MHC class I molecules for presenting viral antigens on the cell surface[28,32]. These MHC class I proteins get broken down and removed. This reduces the availability of MHC-I molecules on the cell surface for presenting viral antigens. Consequently, the virus evades immune recognition and continues to spread within the host. US3 blocks the transport of MHC-I molecules from the ER to the Golgi apparatus, preventing their maturation and presentation on the cell surface to cytotoxic T lymphocytes (CTLs), thereby evading immune detection[30,33] US6, an HCMV glycoprotein homologous to glycoprotein I (gI), binds to MHC-I molecules in the ER and retains them, effectively preventing their transport to the cell surface. Its mechanism is similar to US3 but exhibits enhanced efficacy. This prevents the transport of class I MHC molecules to the cell surface, leading to decreased presentation of viral antigens to CTLs. US10, a protein encoded by HCMV, targets mature MHC-I molecules on the cell surface. Through specific interactions, US10 facilitates the internalization of these molecules via endocytosis, reducing their availability for antigen presentation[30,33,34]. US11 targets newly synthesized MHC class I molecules in the ER and inhibits their assembly with peptide antigens[13,35]. Multiple viral protein groups of HCMV are summarized in Table 1. In summary, HCMV-encoded proteins downregulate MHC expression, enabling the virus to evade immune detection, mature, and spread within host cells[36,37]. Identifying these viral molecules provides valuable insights into the molecular mechanisms, structures, and key checkpoints of the MHC-I antigen presentation pathway. This study uses bioinformatics to analyze the physicochemical, structural, and functional properties of key HCMV proteins, focusing on their binding affinities to MHC Class I molecules. Additionally, it highlights similarities among HCMV proteins that could be useful for vaccine design, with particular emphasis on the unique role of US10
Materials and methods:
Sequence Retrieval and Analysis of Biological Roles:
HCMV encoded US2, US3, US6, US10, US11, and sequence from human class I MHC molecules were retrieved from the National Centre for Biotechnology Information (NCBI) protein database. These sequences were acquired in FASTA format, a standard format for nucleotide or protein sequences. These sequences were compared using the NCBI Conserved Domains Database (NCBI-CDD) to identify conserved domains—regions of proteins that are structurally and functionally conserved across species. The protein sequences were reverse-translated into nucleotide sequences using Reverse Translate, and potential protein-coding regions were identified using ORF Finder. This analysis also highlighted the genetic makeup of the sequences.
Protein Secondary Structure Prediction and Analysis:
The protein sequences were submitted to the Phyre2 Protein Fold Recognition Server, a tool for predicting and analysing protein structures[38]. Phyre2 provided information on the predicted 3D structure, domain architecture, and functional annotations. Regions of disorder, related superfamilies and families were also detected by Phyre 2. Multiple Sequence Alignment (MSA) was conducted using Clustal omega to identify evolutionary relationships and conserved regions[39]. PSI-BLAST was used to identify homologous sequences for comparison, enabling the detection of structural similarities and differences. ExPASy (Expert Protein Analysis System) was employed to extract various physicochemical properties of the proteins, including length, molecular weight, theoretical isoelectric point (pI), instability index, aliphatic index, and GRAVY (grand average of hydropathicity)[40,41]. These parameters provided insights into the protein’s stability, solubility, and overall characteristics. A phylogenetic tree has been extracted for the protein from Clustal Omega to understand their evolutionary relationship. TMHMM 2.0 was used to predict transmembrane helices in each protein using a hidden Markov model. These integral membrane segments are less accessible to antibodies, making their identification crucial for epitope mapping[42,43]. Gene Threader was used to analyze FASTA sequences of MHC class I molecules retrieved from the NCBI database, determining pH values and amino acid composition. This information helps in understanding the stability and functional characteristics of MHC class I proteins[44,45,46].
Validation of Protein Structure: Structural Domains Prediction and Protein Properties Analysis:
Sequences were submitted to the Research Collaboratory for Structural Bioinformatics Protein Data Bank (RCSB-PDB) for a comprehensive study of protein structures. The RCSB-PDB provides detailed 3D structural information, including water molecules, ligands, and bonds. It also includes experimental data such as X-ray diffraction and crystallization[47,48]. The PDB files were analysed using PDBsum to obtain summaries of the protein structures with functional annotations. PDBsum provides additional context, such as the number of water molecules and the presence of pores, tunnels, and ligands, which are useful for identifying potential epitope regions[49]. Ramachandran plots from PDBsum were analyzed to examine phi and psi angle distributions within the protein This plot helps in understanding protein stability and identifying disallowed regions that could lead to unfavourable interactions. It also provides information on bond lengths and angles[50]. The PDB files were again analyzed by TM align for comparative protein studies, with homologous structures identified from PSI-BLAST. High TM-scores and low RMSD values indicate significant structural conservation, suggesting functional and evolutionary similarities[51]. Discovery Studio 2024 Client was employed for detailed analysis of protein structures obtained from TM-align. TM-align was also used to predict the binding affinity of the protein with human MHC molecules[52]. TM-score and RMSD (Root Mean Square Deviation) values were checked to assess structural similarity and predict the effectiveness of epitopes. Finally, PyMOL was used to re-analyze the structural results, confirming the findings and ensuring accuracy in protein structure and epitope predictions[53].
Results and Discussion:
Retrieved sequences of class-I MHC molecules from NCBI were analysed using Gene Threader to extract their physiochemical properties[54]. Extracted physicochemical properties revealed a broad range of acidic proteins and pH ranging from -4.96 (BDU99858.1) to -11.08 (BDU49430.1). The presence of alanine (ala) showed the highest value among all the proteins, ranging between 9.39 (BDU18538.1) and 10.84 (CAL85437.2). These findings suggest that the small and non-polar side chains of alanine contribute to structural stability and flexibility (Table 2). Among all proteins, asparagine (Asp) was found in the lowest proportions, followed by cysteine (Cys) and methionine (Met). These amino acid compositions can influence protein stability, binding interactions, and enzymatic activity[55,56].
Domain architecture analysis using NCBI-CDD revealed that all HCMV proteins contain unique short-region domains. US2 and US3 share the same domain family (pfam05963) and are modelled on the crystal structure template of the HCMV protein US2 bound to the MHC class I molecule HLA-A2/tax (Figure 1A, B). Both are endoplasmic reticulum (ER) resident glycoproteins that are capable of binding with MHC-I molecules. US2 had a bit score of 294.76 and an e-value of 1.32e-102, while US3 showed a slightly lower bit score of 248.54 and an e-value of 1.25e-84 Similar hypothesis was reorted by Lee et al., (2000) and Gewurz et al., (2001), They revealed that about 20% ER domain shares sequence similarities with the US3 and US2 glycoproteins and keeps MHC-I molecules in the ER at early HCMV infection[57,58]. US6 and US10 were classified under pfam17616 and pfam17617 respectively and they exhibit high domain significance with e-values of 3.35e-111 and 1.67e-125 respectively. The span residues of both proteins are ranging between 25 to 183 and 25 to 185. US6 protein is responsible for the inhibition of TAP-mediated peptide translocation to the ER[59]. US10 targets surface tri-leucine motif expression, binding to classical MHC-I molecules and delaying their trafficking. They have a tri-leucine motif in the cytoplasmic tail which is responsible for the down-regulation of HLA-G that makes it different from other proteins[60]. In our study, US11 was found to have a distinct domain architecture with low bit score of 51.73 and an e-value of 4.81e-08. The ORF analysis revealed that US2, US3, US6, US10, and US11 are encoded by ORFs 3, 4, 1, 2, and 2, respectively. A study on functional profiling of HCMV genes and their disease association was conducted by Kim et al. (2011) and Ye et al. (2020), and they reported that at least five glycoproteins (US2, US3, US6, US10, and US11) are encoded by the US2-US11 region. These proteins are smart enough for strategic interference of MHC-I during the early stage of HCMV infection and as a result, the expression of antigen peptides of CD8+T cells are lowered [13,61].
The physicochemical properties of the HCMV transmembrane proteins were analysed through the “Expasy-Swiss Bioinformatics Resource Portal” and distinct characteristics were identified. The protein lengths ranged from 183 to 215 amino acids, with molecular weights between 20,611.96 and 25,288.44 Daltons (Table 3). The theoretical isoelectric points (pI) ranged from 5.46 for US11 to 8.73 for US6, indicating significant differences in their charges at physiological pH. Tokmakov et al., (2021) described the variable pI of proteins ranging between 4.0 and 12.0, and this can help to classify and develop the protein isolation, separation, purification, and crystallisation methods[62]. Stability predictions based on the instability index indicated that US2 was relatively stable (28.71), whereas US11 was the least stable (56.46). The aliphatic index, an indicator of protein thermostability, ranged from 92.73 for US6 and 100.97 for US3, suggesting stable protein structure. The aliphatic index AI is directly associated with the mole fraction of some amino acids in proteins, which provides the degree of thermostability of proteins. A study conducted by Shafat et al., (2022) found the same in their research on Norway rat Hepatitis E Virus protein sequence and their structure analysis[63,64]. In an immunoinformatics study by Bhattacharya et al. (2022), subjected to design and characterize a peptide-based vaccine candidate with multiepitopes against monkeypox virus proteins. The study concluded that flexibility may instigate immune response[65]. The Grand Average of Hydropathicity (GRAVY) scores ranged from -0.138 for US6 to 0.131 for US2 (Figure 1C,1D), indicating variations in hydrophobicity and potential for membrane interactions. Proteins with high hydrophobicity are more prone to lipid interaction and facilitate membrane anchoring. Proteins like US2 interact with lipid bilayers, which is crucial for signalling, transport, and cellular interactions. Less hydrophobicity proteins such as US6 function more in an aqueous environment.
The structural modelling of HCMV transmembrane proteins was conducted using template-based methods in Phyre 2, which revealed their fold types and varying degrees of confidence and coverage (Figure 2A, B, C, D). Both US2 and US3 were modelled with 100% confidence using the immunoglobulin-like beta-sandwich fold template from HCMV protein US2, covering 48% and 47% of their sequences, respectively. These models highlighted significant beta-strand content (46% for US2 and 39% for US3) and alpha-helix presence (19% for US2 and 31% for US3). US6 is modelled based on vertebrate phospholipase A2 and showed 15.20% confidence with 52% coverage, predominantly featuring alpha-helical content (46%) and disordered regions (27%). The Phyre2 model for US10, based on PDB entry c3chxE, resembled the crystal structure of particulate methane monooxygenase (PMMO) from Methylosinus trichosporium OB3b, with 45% coverage and a confidence score of 6.1%. Alpha-helix and beta-strand content of US10 are 34% and 23% respectively. The structural prediction of US11 was matched with Saccharomyces cerevisiae autophagy-related protein 3 (Atg3) by 40% structural coverage with 12.6% confidence score following 28% alpha-helix and 32%beta-strand contents. 3D structures and detailed properties of the proteins were generated from RCSB(Figure 2E, F, G, H) the 1IM3 structure (Crystal structure of human cytomegalovirus protein US2 bound to MHC Class I molecule HLA-A2) of the US2 and US3 protein from HCMV bound to the MHC class I and has tetrameric nature and interaction with viral peptides. The 2NOT (NOTECHIS II-5) structure of US6, representing a neurotoxic phospholipase A2 highlights catalytic residues and structural motifs which are essential for its toxic activity. The 3CHX structure from US10, of particulate methane monooxygenase (pMMO) illustrates its complex three-domain architecture and multiple internal pores are crucial for methane oxidation processes. Lastly for US11, the 2DYT structure of autophagy-related protein 3 (Atg3), which has a role in autophagy, stabilized by sulfate ions and water molecules, with significant tunnels that may affect its functional dynamics. Collectively, these structures offer valuable insights into protein functions, interactions, and mechanisms. These physiochemical, structural and functional profiles may provide valuable insights into the roles of HCMV proteins, informing their interactions within the host and potential as therapeutic targets.
The TMHMM2.0 server was used to predict the topology of transmembrane helices in US2, US3, US6, US10, and US11 (Figure 3A, B, C, D). US2 and US11 features a single transmembrane helix spanning residues between 181 and 203. Loureiro and Ploegh (2006) analysed and discussed the similarities and dissimilarities between US2 and US11 pathways for interruption and deprivation of human MHS-I molecules utilized by murine herpes virus (MHV). Another research by Wiertz et al. (1996) explained that a US11-encoded single HCMV is sufficient to degrade the ER by downregulating MHC-I molecules by less than 1 minute [66,67]. Rests of the sequences are predicted to be outside or inside the membrane, suggesting a similar membrane-spanning configuration. Protein US3 contains a single transmembrane helix and differential residues coverage between 161 and 183. In contrast, US6 has a single transmembrane helix from residues 147 to 169, with a portion of the sequence predicted outside the membrane. Significantly, US10 showed the most complex membrane topology with two transmembrane helices, one from 127 to 149 residues and another from 159 to 181, highlighting the most complex membrane arrangement among all. Transmembrane helices allow the viral proteins to integrate into the host’s cell membrane. US10, having two transmembrane helices, may establish stronger and deeper interaction.
Ramachandran plots, based on phi-psi (φ-ψ) torsional angles, graphically depict allowable and disallowed combinations of these angles in protein residues. (Figure 3E, F, G, H). This analysis reveals the structural quality of the proteins. As mentioned above, US2 and US3 share the same PDB files therefore, they have plotted identically, and the statistics of structural quality showed that 90.3% of residues were in the most favoured regions and only 9.4% in the additional allowed regions, and no residues were found in the disallowed region. A total of 1916 residues, including 128 glycine (Gly) and 88 proline (Pro) residues. Glycine and proline residues are vital for any protein structure as glycine is a small and flexible amino acid residue that fits into tiny spaces and stabilizes sharp turns and loops, while proline has a rigid ring structure that breaks helices and stabilizes turns[68,69]. The distribution of “phi-psi” and “chi1-chi2” represented -0.29 and 0.08 points, respectively, whereas main-chain covalent forces were found as “main-chain bond lengths” of 0.58 and bond angles of 0.33 points. Analysis of the protein US6 has also found as good as the structural quality with 91.3% of residues in the most favoured regions, 8.3% in additional allowed regions, and 0.5% in generously allowed regions. It has a total of 238 residues, including 18 glycine and 10 proline residues. The “Phi-psi” distribution of the protein was -0.07, and the Chi1-Chi2 distribution of -0.12. Main-chain covalent forces (bond lengths of 0.54 and bond angles of -0.01). US10 displayed unusual results compared to the other proteins, with 88.4% of residues in the most favoured regions, 10.8% in additionally allowed regions, and 0.8% in generously allowed regions. A total 843 residues including 37 glycine (Gly) and 35 proline (Pro) residues, were distributed as -0.24 in “phi-psi” and “chi1-chi2” in -0.44 positions. Main-chain bond lengths was 0.37, and bond angles was 0.25. Finally, the protein US11 showed 91.5% residues in the most favoured regions, 8.5% in additional allowed regions, and no residues were found in the disallowed regions. It comprises 213 residues, including 6 glycines (Gly) and 10 proline (Pro) residues through the “phi-psi” and chi1-chi2 distribution as -0.11 and -0.07, with main-chain bond lengths of 0.66 and bond angles of 0.40. The G factor determines the quality of covalent bond and angle distance of a protein, which also measures how typical the backbone dihedral angles (phi and psi) and side chain dihedral angles (chi angles) are compared to known protein structures. Although, US2 and US3; US6; US10 and US11 were typically 0.25, 0.10, -0.10, 0.32 respectively. Therefore, it can be considered as the protein US10 was found to be a typical protein with the usual structure and it has to be further analysed.
The multiple sequence alignment (MSA) of the five proteins showed a combination of conserved and variable regions (Figure 4A). Several conserved regions were found visible around 60th to 70th position. Highly conserved regions exhibited around 120th to 140th position and conserved domain among the sequences were analysed. US6, US3, and US2 exhibit structural resemblance due to shared conserved regions. US10 has several gaps in the MSA result, resembling many insertions and deletions that had affected it. It has the shortest N terminal and a cystine-rich C terminal. Based on the phylogenetic tree shown in Figure 4B, it was determined that the US2 and US3 proteins form a sister group. US6 is also closely related to the group, followed by US11. US10 stands out as the most distantly related protein.
In this study, TM-align analysis revealed the variation of degrees between structural similarity among HCMV proteins compared to their controls summarized in Table 4. Protein US2 and US10 exhibit perfect alignment with TM-scores between 1.000 and RMSD value 0.00, which indicates identical structures. This analysis suggested that these proteins are highly conserved, sharing an evolutionary lineage. In contrast, samples US2, US6 and US11 showed moderate to low structural similarity, with notable differences in TM-scores and RMSD. Figure 5 provides a comprehensive analysis of the structural features and an in-depth comparison of the proteins. For US2 and US3, a single structure was generated with a dominating presence of beta barrels, which may be responsible for the stability of the protein. US6 has more alpha helix, which gives it a globular and compact structure. and can be crucial for transduction, molecular binding, and participation in t protein-protein interactions. US10 has a distinct and complex structure with extensive alpha helix and beta sheets. Interestingly, a long alpha-helical extended structure was observed in US11. This extended structure naturally allows a protein to adopt multiple conformations, enabling it to bind with multiple targets or molecules, which is very significant in host-pathogen interactions.
The HCMV proteins have been aligned with the MHC Class I molecules for comparative analysis (Table 5). MHC proteins exhibit a high structural similarity among themselves and with the 1im3 structure of US2 and US3. TM-scores among them have exceeded 0.9 and have a very low RMSD value. Based on the TM score and RMSD reading, it can be concluded that US6 have moderate structural similarity with MHC, with an average TM score, US10 has the least structural similarity with RMSD value exceeding 6 in most cases. US11 aligns slightly better than US10 and is given an RMSD value above 5. The TM scores for US10 and US11 are very low. In this study, alignments were performed between 10 different MHC Class I molecules and four HCMV proteins (US2, US6, US10, and US11), and a 40-alignment set was retrieved. The TM and RMSD values of interactions of each HCMV protein with different MHC molecules were nearly identical. Therefore, to concisely represent these results, a single alignment example from each protein-MHC interaction has been selected and shown in the paper (Figure 6).
Confidence of US2 and US3 proteins:
US2 and US3 belong to the same domain family (pfam05963). In phyre2, proteins gave the same structural image with high confidence (100%) with 48%, and 47% coverage respectively for US2 and US3 using the template immunoglobulin-like beta-sandwich fold template (Figure 1A and B). Both US2 and US3 proteins have been modelled in RCSB with 1im3. Both models were found as hetero-trimer (1-1-1-mer) states and involved the same ligands: LEU-LEU-PHE-GLY-TYR-PRO-VAL-TYR-VAL. The Ramachandran plots of US2 and US3 indicated that 90.3% of residues were situated in the favoured regions with a single transmembrane helix and high TM score as compared to 1im3. Overall, US2, US3, or both can be utilized as epitopes for designing effective vaccines or therapeutics
US10: A mystery still to be resolved:
The US10 is a unique protein in the life cycle of HCMV. The exact mechanism of the protein in host is still uncovered. It has been found that the expression of US10 at early in the HCMV infection cycle plays a critical role in immune modulation[13]. Interestingly, US10 does not degrade MHC-I molecules but instead slows the release of HLA-G, helping the virus evade NK cell-mediated responses. This downregulation involves a unique tri-leucine motif in its cytoplasmic tail, differentiating it from other US proteins[34]. Our study revealed that US10 is a 185 amino acid containing protein with a conserved domain (Pfam17617) and spanning residues from 25 to 185. Phyre2 predicted a low confidence structure (6.10%) with only 45% coverage. US10 features two transmembrane regions and a distinct evolutionary path. The Ramachandran plot indicates significant structural abnormalities, with a high density in the disallowed regions. Further experimental validation is required through techniques such as X-ray crystallography or NMR spectroscopy.
Conclusion:
This study provides valuable insights into the structural and functional properties of key HCMV proteins involved in immune evasion, particularly their interactions with MHC-I molecules. By highlighting the unique features of US10 and its potential role in modulating immune responses, this work underscores the importance of these viral proteins as targets for therapeutic development. These findings contribute to a deeper understanding of HCMV pathogenesis and open avenues for designing targeted antiviral strategies.
Author Contributions
Conceptualization, A.S., M.S. and B.B.; execution of methodology, B.B.; investigation, B.B. and A.S.; Writing-original draft preparation, B.B. and M.S..; writing-review and editing, A.S. and M.S. All authors have read and agreed to the published version of the manuscript.
Funding
No funds were available for this research.
Acknowledgements
The authors would like to thank Department of Biosciences, JIS University for providing high speed internet facility and additional lab support.
Conflicts of Interest
The authors reported no potential conflict of interest.
References
- Griffiths, P.; Reeves, M. Pathogenesis of Human Cytomegalovirus in the Immunocompromised Host. Nat. Rev. Microbiol. 2021, 19, 759–773. [Google Scholar] [CrossRef] [PubMed]
- Novelli, M.; Natale, F.; Di Norcia, A.; et al. Early Neurodevelopmental Outcomes in Children with Asymptomatic Congenital CMV Infection. Ital. J. Pediatr. 2022, 48, 203. [Google Scholar] [CrossRef] [PubMed]
- Turriziani Colonna, A.; Buonsenso, D.; Pata, D.; et al. Long-Term Clinical, Audiological, Visual, Neurocognitive, and Behavioral Outcomes in Children with Symptomatic and Asymptomatic Congenital Cytomegalovirus Infection Treated with Valganciclovir. Front. Med. (Lausanne) 2020, 7, 268. [Google Scholar] [CrossRef] [PubMed]
- Uematsu, M.; Haginoya, K.; Kikuchi, A.; et al. Asymptomatic Congenital Cytomegalovirus Infection with Neurological Sequelae: A Retrospective Study Using Umbilical Cord. Brain Dev. 2016, 38, 819–826. [Google Scholar] [CrossRef]
- Looker, K. J.; Magaret, A. S.; May, M. T.; et al. First Estimates of the Global and Regional Incidence of Neonatal Herpes Infection. Lancet Glob. Health 2017, 5, e300–e309. [Google Scholar] [CrossRef]
- Corey, L.; Wald, A. Maternal and Neonatal Herpes Simplex Virus Infections. N. Engl. J. Med. 2009, 361, 1376–1385. [Google Scholar] [CrossRef]
- Kimberlin, D. W. Herpes Simplex Virus Infections of the Newborn. Semin. Perinatol. 2007, 31, 19–25. [Google Scholar] [CrossRef]
- Carlson, A.; Norwitz, E. R.; Stiller, R. J. Cytomegalovirus Infection in Pregnancy: Should All Women Be Screened? Rev. Obstet. Gynecol. 2010, 3, 172–179 PMID: 21364849; PMCID: PMC3046747. [Google Scholar] [PubMed] [PubMed Central]
- Adler, A.; Nigro, G. Prevention of Maternal-Fetal Transmission of Cytomegalovirus. Clin. Infect. Dis. 2013, 57, S189–92. [Google Scholar] [CrossRef]
- Zheng, Q. Y.; Huynh, K. T.; van Zuylen, W. J.; et al. Cytomegalovirus Infection in Day Care Centres: A Systematic Review and Meta-Analysis of Prevalence of Infection in Children. Rev. Med. Virol. 2019, 29, e2011. [Google Scholar] [CrossRef]
- Davison, A. J.; Wilkie, N. M. Nucleotide Sequences of the Joint Between the L and S Segments of Herpes Simplex Virus Types 1 and 2. J. Gen. Virol. 1981, 55, 315–331. [Google Scholar] [CrossRef] [PubMed]
- Dolan, A.; Jamieson, F. E.; Cunningham, C.; et al. The Genome Sequence of Herpes Simplex Virus Type 2. J. Virol. 1998, 72, 2010–2021. [Google Scholar] [CrossRef] [PubMed]
- Ye, L.; Qian, Y.; Yu, W.; et al. Functional Profile of Human Cytomegalovirus Genes and Their Associated Diseases: A Review. Front. Microbiol. 2020, 11. [Google Scholar] [CrossRef] [PubMed]
- Stern-Ginossar, N.; Weisburd, B.; Michalski, A.; et al. Decoding Human Cytomegalovirus. Science 2012, 338, 1088–1093. [Google Scholar] [CrossRef]
- Balázs, Z.; Tombácz, D.; Szűcs, A.; et al. Long-Read Sequencing of Human Cytomegalovirus Transcriptome Reveals RNA Isoforms Carrying Distinct Coding Potentials. Sci. Rep. 2017, 7, 15989. [Google Scholar] [CrossRef]
- Gatherer, D.; Seirafian, S.; Cunningham, C.; et al. High-Resolution Human Cytomegalovirus Transcriptome. Proc. Natl. Acad. Sci. USA 2011, 108, 19755–19760. [Google Scholar] [CrossRef]
- Tai-Schmiedel, J.; Karniely, S.; Lau, B.; et al. Human Cytomegalovirus Long Noncoding RNA4.9 Regulates Viral DNA Replication. PLoS Pathog. 2020, 16, e1008390. [Google Scholar] [CrossRef]
- Zhang, L.; Yu, J.; Liu, Z. MicroRNAs Expressed by Human Cytomegalovirus. Virol. J. 2020, 17, 34. [Google Scholar] [CrossRef]
- Avitabile, E.; Lombardi, G.; Campadelli-Fiume, G. Herpes Simplex Virus Glycoprotein K, but Not Its Syncytial Allele, Inhibits Cell-Cell Fusion Mediated by the Four Fusogenic Glycoproteins, gD, gB, gH, and gL. J. Virol. 2003, 77, 6836–6844. [Google Scholar] [CrossRef]
- Heming, J. D.; Conway, J. F.; Homa, F. L. Herpesvirus Capsid Assembly and DNA Packaging. Adv. Anat. Embryol. Cell Biol. 2017, 223, 119–142. [Google Scholar] [CrossRef]
- Wildy, P.; Russell, W. C.; Horne, R. W. The Morphology of Herpes Virus. Virology 1960, 12, 204–222. [Google Scholar] [CrossRef] [PubMed]
- Brown, J. C.; Newcomb, W. W. Herpesvirus Capsid Assembly: Insights from Structural Analysis. Curr. Opin. Virol. 2011, 1, 142–149. [Google Scholar] [CrossRef] [PubMed]
- Nguyen, C. C.; Kamil, J. P. Pathogen at the Gates: Human Cytomegalovirus Entry and Cell Tropism. Viruses 2018, 10, 704. [Google Scholar] [CrossRef] [PubMed]
- Spear, P. G.; Roizman, B. Buoyant Density of Herpes Simplex Virus in Solutions of Caesium Chloride. Nature 1967, 214, 713–714. [Google Scholar] [CrossRef] [PubMed]
- Kinzler, E. R.; Compton, T. Characterization of Human Cytomegalovirus Glycoprotein-Induced Cell-Cell Fusion. J. Virol. 2005, 79, 7827–7837. [Google Scholar] [CrossRef]
- Halenius, A.; Gerke, C.; Hengel, H. Classical and Non-Classical MHC I Molecule Manipulation by Human Cytomegalovirus: So Many Targets—But How Many Arrows in the Quiver? Cell Mol. Immunol. 2015, 12, 139–153. [Google Scholar] [CrossRef]
- Ljunggren, H. G.; Kärre, K. In Search of the ‘Missing Self’: MHC Molecules and NK Cell Recognition. Immunol. Today 1990, 11, 237–244. [Google Scholar] [CrossRef]
- Hengel, H.; Flohr, T.; Hämmerling, G. J.; et al. Human Cytomegalovirus Inhibits Peptide Translocation into the Endoplasmic Reticulum for MHC Class I Assembly. J. Gen. Virol. 1996, 77, 2287–2296. [Google Scholar] [CrossRef]
- Hegde, S. N.; Johnson, D. C. Human Cytomegalovirus US2 Causes Similar Effects on Both Major Histocompatibility Complex Class I and II Proteins in Epithelial and Glial Cells. J. Virol. 2003, 77, 9287–9294. [Google Scholar] [CrossRef]
- Liu, W.; Zhao, Y.; Biegalke, B. J. Analysis of human cytomegalovirus US3 gene products. Virology 2002, 299, 49–59. [Google Scholar] [CrossRef]
- Lehner, P. J.; Karttunen, J. T.; Wilkinson, G. W.; et al. The human cytomegalovirus US6 glycoprotein inhibits transporter associated with antigen processing-dependent peptide translocation. Proc. Natl. Acad. Sci. USA 1997, 94, 6904–6909. [Google Scholar] [CrossRef] [PubMed]
- van der Wal, F. J.; Kikkert, M.; Wiertz, E. The HCMV gene products US2 and US11 target MHC class I molecules for degradation in the cytosol. Curr. Top. Microbiol. Immunol. 2002, 269, 37–55. [Google Scholar] [CrossRef] [PubMed]
- Huan, L.; Moritz, B.; Christian, F. The mode of action of tapasin on major histocompatibility class I (MHC-I) molecules. J. Biol. Chem. 2023, 299, 102987. [Google Scholar] [CrossRef]
- Bhattacharya, C.; Bauersfeld, L.; Schirmeister, I.; et al. Multimodal HLA-I Genotype Regulation by Human Cytomegalovirus US10 and Resulting Surface Patterning. Elife 2024, 13, e85560. [Google Scholar] [CrossRef]
- Tirosh, B.; Iwakoshi, N. N.; Lilley, B. N.; et al. Human cytomegalovirus protein US11 provokes an unfolded protein response that may facilitate the degradation of class I major histocompatibility complex products. J. Virol. 2005, 79, 2768–2779. [Google Scholar] [CrossRef]
- Gabor, F.; Jahn, G.; Sedmak, D. D.; et al. In vivo downregulation of MHC class I molecules by HCMV occurs during all phases of viral replication but is not always complete. Front. Cell. Infect. Microbiol. 2020, 10, 283. [Google Scholar] [CrossRef]
- Varnum, S. M.; Streblow, D. N.; Monroe, M. E.; et al. Identification of proteins in human cytomegalovirus (HCMV) particles: The HCMV proteome. J. Virol. 2004, 78, 10960–10966. [Google Scholar] [CrossRef]
- Kelley, L.; Mezulis, S.; Yates, C.; et al. The Phyre2 web portal for protein modeling, prediction, and analysis. Nat. Protoc. 2015, 10, 845–858. [Google Scholar] [CrossRef]
- Sievers, F.; Wilm, A.; Dineen, D.; et al. Fast, scalable generation of high-quality protein multiple sequence alignments using Clustal Omega. Mol. Syst. Biol. 2011, 7, 539. [Google Scholar] [CrossRef]
- Gasteiger, E.; Gattiker, A.; Hoogland, C.; et al. ExPASy: The proteomics server for in-depth protein knowledge and analysis. Nucleic Acids Res. 2003, 31, 3784–3788. [Google Scholar] [CrossRef]
- Walker, J. M. (Ed.) Protein identification and analysis tools on the ExPASy server. In The Proteomics Protocols.
- Eddy, S. R. What is a hidden Markov model? Nat. Biotechnol. 2004, 22, 1315–1316. [Google Scholar] [CrossRef] [PubMed]
- Krogh, A.; Larsson, B.; von Heijne, G.; et al. Predicting transmembrane protein topology with a hidden Markov model: Application to complete genomes. J. Mol. Biol. 2001, 305, 567–580. [Google Scholar] [CrossRef] [PubMed]
- Gremme, G.; Brendel, V.; Sparks, M. E.; et al. Engineering a software tool for gene structure prediction in higher organisms. Inf. Softw. Technol. 2005, 47, 965–978. [Google Scholar] [CrossRef]
- Zajac, P.; Pettersson, E.; Gry, M.; et al. Expression profiling of signature gene sets with trinucleotide threading. Genomics 2008, 91, 209–217. [Google Scholar] [CrossRef]
- Lobley, A.; Sadowski, M. I.; Jones, D. T. pGenTHREADER and pDomTHREADER: New methods for improved protein fold recognition and superfamily discrimination. Bioinformatics 2009, 25, 1761–1767. [Google Scholar] [CrossRef]
- Rose, P. W.; Bi, C.; Bluhm, W. F.; et al. The RCSB Protein Data Bank: New resources for research and education. Nucleic Acids Res. 2013. 43(Database issue), D345–56. [CrossRef]
- Bittrich, S.; Bhikadiya, C.; Bi, C.; et al. RCSB Protein Data Bank: Efficient Searching and Simultaneous Access to One Million Computed Structure Models Alongside the PDB Structures Enabled by Architectural Advances. J. Mol. Biol. 2023, 435. [Google Scholar] [CrossRef]
- Laskowski, R.A.; Jabłońska, J.; Pravda, L.; et al. PDBsum: Structural Summaries of PDB Entries. Protein Sci. 2018, 27, 129–134. [Google Scholar] [CrossRef]
- Wiltgen, M. Algorithms for Structure Comparison and Analysis: Homology Modelling of Proteins. In Encyclopedia of Bioinformatics and Computational Biology; Elsevier, 2019, 38–61.
- Zhang, Y.; Skolnick, J. TM-align: A Protein Structure Alignment Algorithm Based on the TM-score. Nucleic Acids Res. 2005, 33, 2302–2309. [Google Scholar] [CrossRef]
- Pawar, S.S.; Rohane, S.H. Review on Discovery Studio: An Important Tool for Molecular Docking. Asian J. Res. Chem. 2021, 14, 86–88. [Google Scholar] [CrossRef]
- Tomar, N.R.; Singh, V.; Marla, S.S.; et al. Molecular Docking Studies with Rabies Virus Glycoprotein to Design Viral Therapeutics. Indian J. Pharm. Sci. 2010, 72, 486–490. [Google Scholar] [CrossRef] [PubMed]
- McGuffin, L.J.; Jones, D.T. Improvement of the GenTHREADER Method for Genomic Fold Recognition. Bioinformatics 2003, 19, 874–881. [Google Scholar] [CrossRef] [PubMed]
- Lee, B.C.; Gladyshev, V.N. The Biological Significance of Methionine Sulfoxide Stereochemistry. Free Radic. Biol. Med. 2011, 50, 221–227. [Google Scholar] [CrossRef] [PubMed]
- Whitcomb, S.J.; Rakpenthai, A.; Brückner, F.; et al. Cysteine and Methionine Biosynthetic Enzymes Have Distinct Effects on Seed Nutritional Quality and on Molecular Phenotypes Associated with Accumulation of a Methionine-Rich Seed Storage Protein in Rice. Front. Plant Sci. 2020, 22, 1118. [Google Scholar] [CrossRef]
- Lee, S.; Yoon, J.; Park, B.; et al. Structural and Functional Dissection of Human Cytomegalovirus US3 in Binding Major Histocompatibility Complex Class I Molecules. J. Virol. 2000, 74, 11262–11269. [Google Scholar] [CrossRef]
- Gewurz, B.E.; Wang, E.W.; Tortorella, D.; et al. Human Cytomegalovirus US2 Endoplasmic Reticulum-Lumenal Domain Dictates Association with Major Histocompatibility Complex Class I in a Locus-Specific Manner. J. Virol. 2001, 75, 5197–5204. [Google Scholar] [CrossRef]
- Lehner, P.J.; Karttunen, J.T.; Wilkinson, G.W.; et al. The Human Cytomegalovirus US6 Glycoprotein Inhibits Transporter Associated with Antigen Processing-Dependent Peptide Translocation. Proc. Natl. Acad. Sci. USA 1997, 94, 6904–6909. [Google Scholar] [CrossRef]
- Park, B.; Spooner, E.; Houser, B.L.; et al. The HCMV Membrane Glycoprotein US10 Selectively Targets HLA-G for Degradation. J. Exp. Med. 2010, 207, 2033–2041. [Google Scholar] [CrossRef]
- Kim, S.; Lee, S.; Shin, J.; et al. Human Cytomegalovirus MicroRNA miR-US4-1 Inhibits CD8(+) T Cell Responses by Targeting the Aminopeptidase ERAP1. Nat. Immunol. 2011, 12, 984–991. [Google Scholar] [CrossRef]
- Tokmakov, A.A.; Kurotani, A.; Sato, K.I. Protein pI and Intracellular Localization. Front. Mol. Biosci. 2021, 8, 775736. [Google Scholar] [CrossRef]
- Ikai, A. Thermostability and Aliphatic Index of Globular Proteins. J. Biochem. 1980, 88, 1895–1898 PMID: 7462208. [Google Scholar] [PubMed]
- Shafat, Z.; Ahmed, A.; Parvez, M.K.; et al. Sequence to Structural Analysis of ORF5 Protein in Norway Rat Hepatitis E Virus. Bioinformation 2022, 18, 19–25. [Google Scholar] [CrossRef] [PubMed]
- Bhattacharya, M.; Chatterjee, S.; Nag, S.; et al. Designing, Characterization, and Immune Stimulation of a Novel Multi-Epitopic Peptide-Based Potential Vaccine Candidate Against Monkeypox Virus Through Screening Its Whole Genome Encoded Proteins: An Immunoinformatics Approach. Travel Med. Infect. Dis. 2022, 50, 102481. [Google Scholar] [CrossRef] [PubMed]
- Loureiro, J.; Ploegh, H.L. Antigen Presentation and the Ubiquitin-Proteasome System in Host-Pathogen Interactions. Adv. Immunol. 2006, 92, 225–305. [Google Scholar] [CrossRef] [PubMed]
- Wiertz, E.J.; Jones, T.R.; Sun, L.; et al. The Human Cytomegalovirus US11 Gene Product Dislocates MHC Class I Heavy Chains from the Endoplasmic Reticulum to the Cytosol. Cell 1996, 84, 769–779. [Google Scholar] [CrossRef]
- Trevino, S.R.; Schaefer, S.; Scholtz, J.M.; et al. Increasing Protein Conformational Stability by Optimizing Beta-Turn Sequence. J. Mol. Biol. 2007, 373, 211–218. [Google Scholar] [CrossRef]
- Krieger, F.; Möglich, A.; Kiefhaber, T. Effect of Proline and Glycine Residues on Dynamics and Barriers of Loop Formation in Polypeptide Chains. J. Am. Chem. Soc. 2005, 127, 3346–3352. [Google Scholar] [CrossRef]
Figure 1.
The figure depicts the alignment and hydropathicity among HCMV proteins . A, showing the glycoprotein US2 modelled using 1im3.1. Conserved and variable regions of the proteins are featured with colours: blue denotes the N-terminal, green for conserved regions, orange for shorter aligned regions, and red for terminal regions. US2 shares a close conserved core with the 1im3 template; B, US3 shows a less aligned sequence with 1im3 compared to US2. Gaps in US3 reflect insertions or deletions have impacted the alignment; C, US6 has the lowest hydropathicity (-0.138) among the HCMV proteins. A hydrophobic pocket, which is visible in a lighter shade, resembles affinity for lipid bilayers; D, US2 has the highest hydropathicity (0.131); the dominant blue regions in the image indicate hydrophilic residues.

Figure 2.
Illustrates the domain characterization and 3D structures of the HCMV protein models. A, Glycoproteins US2 and US3 belong to the Cytomega_US3 family (Pfam05963 and cl05493,); B, Glycoproteins US6 is modelled based on the US6 superfamily (cl38875); C, US10 is modelled in the US10 domain (Pfam17617); D, US11 is modelled with a part of the CMV_US superfamily (cl06851); E, US2 is modelled as the HCMV protein bound to MHC Class I, highlighting its role in immune evasion; F, US6 is based on a neurotoxic phospholipase A2 from Notechis scutatus, significant for venom activity; G, US10 is modelled on particulate methane monooxygenase (pMMO) from the Methylosinus trichosporium, which is an enzyme, responsible for methane oxidation; H, US11 is based on Atg3 from Saccharomyces cerevisiae, a ligase vital for the autophagy process.
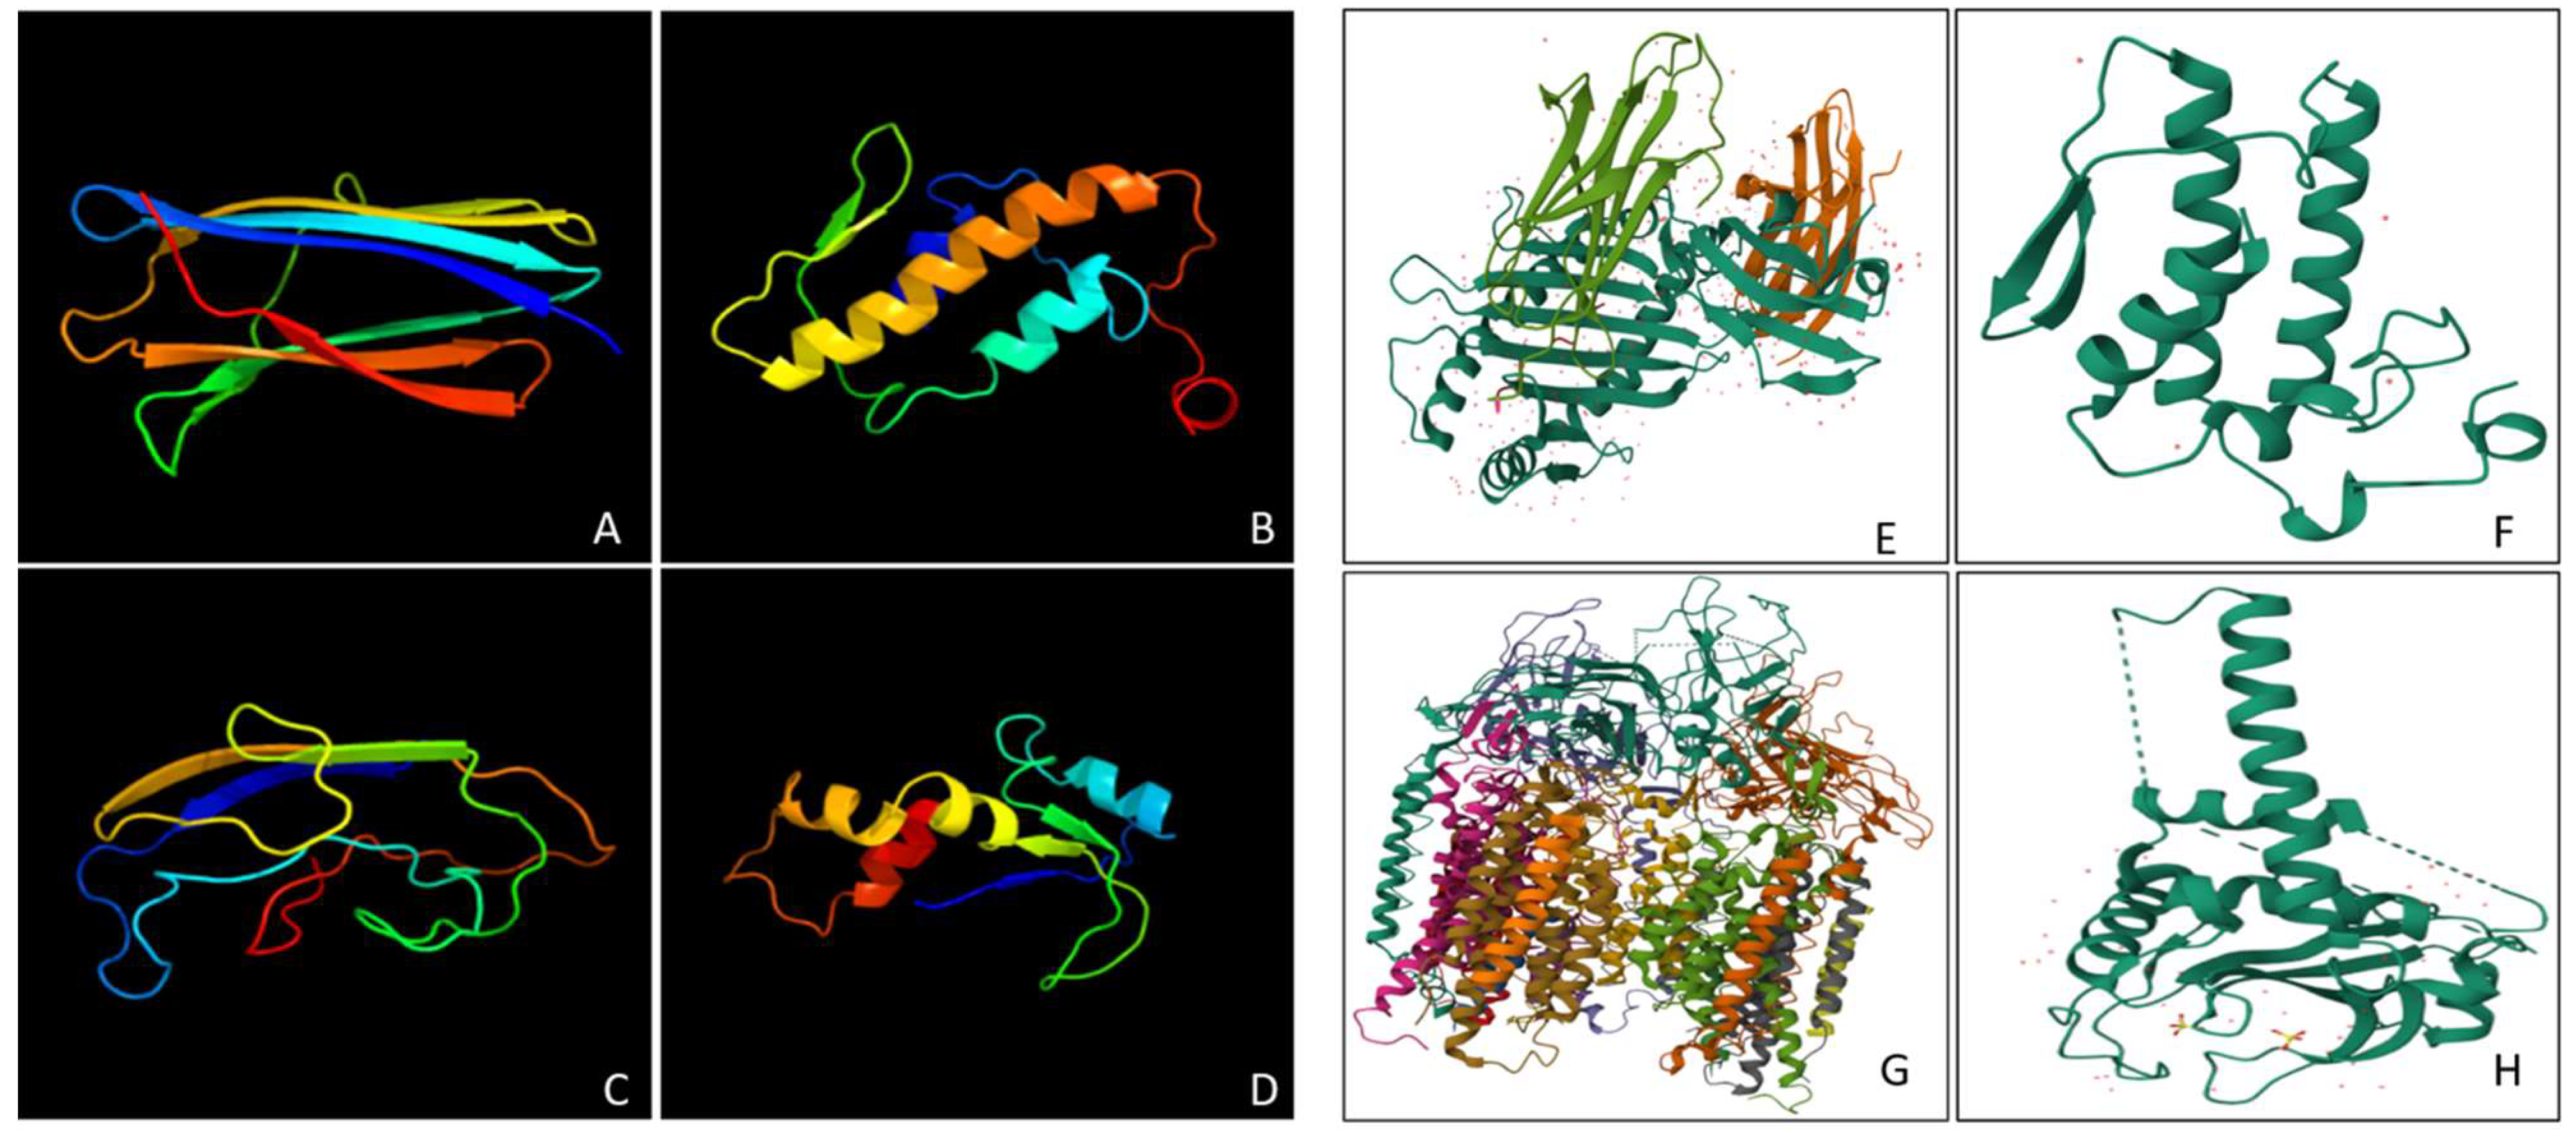
Figure 3.
Represents the transmembrane helices and Ramachandran plot of the HCMV proteins. A, Glycoproteins US2 (199 amino acids) and US3 (186 amino acids) have nearly identical transmembrane helices (spanning residues 162-184 for US2 and 161-183 for US3); B, US6 (183 amino acids) contains one transmembrane helix spanning residues in 147-169 position; C, US10, the longest protein (185 amino acids) contains two transmembrane helices, located between 127-149 and 159-181 residues; D, US11 (215 amino acids) contains one transmembrane helix between residues 181-203; E, US2 & US3 have 90.3% residues in the most favoured regions and minimal in the disallowed region. This shows their high stability and well-folded structures; F, The US6 protein shows fewer residues in the favoured regions (91.3%), with 8.3% in allowed regions; G, US10, has 88.4% of residues in favoured regions; H, US11 gives 91.5% in the favoured regions, implying a high-quality structure.
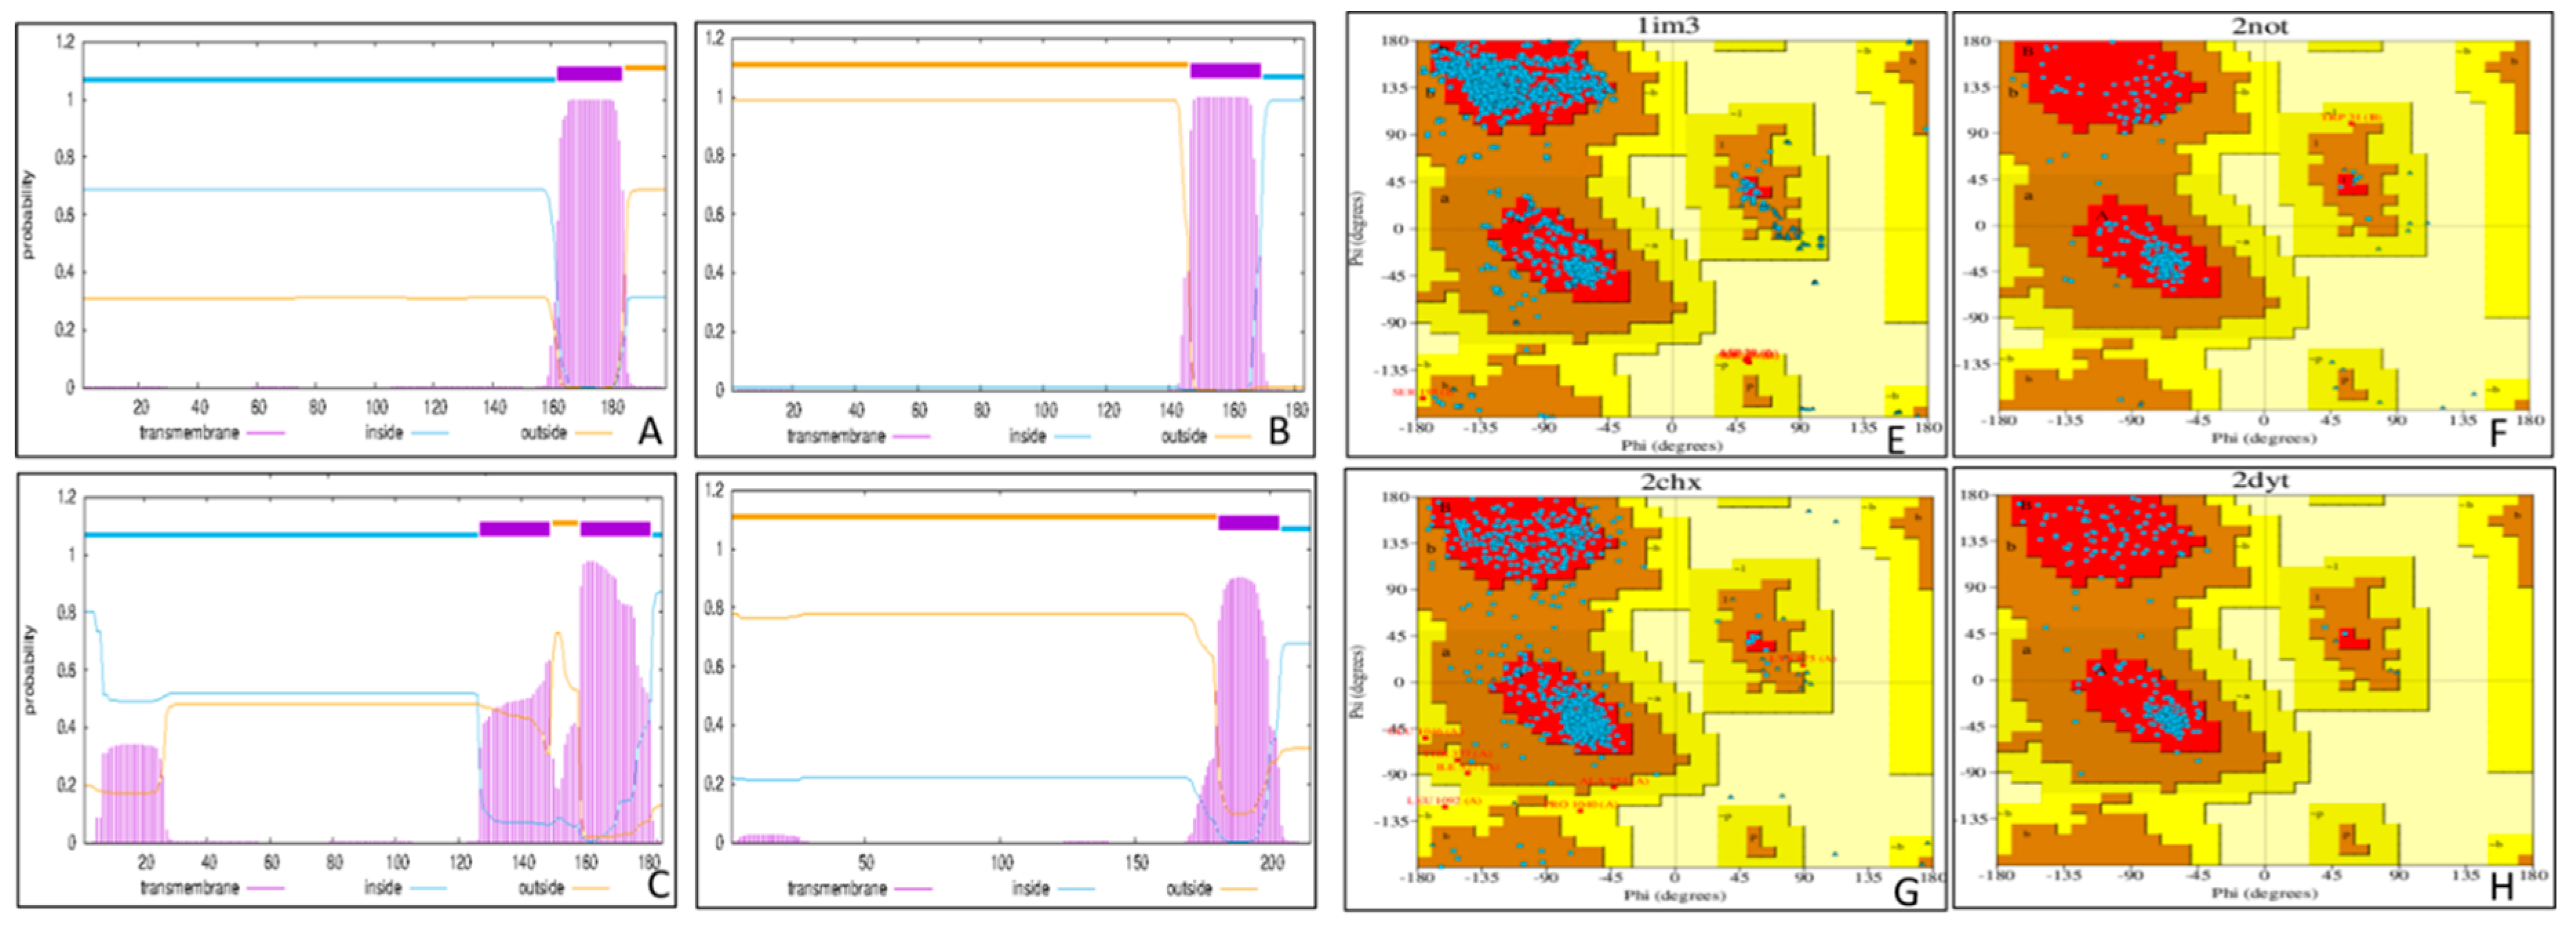
Figure 4.
The image depicts the MSA and phylogenetic tree of HCMV proteins US10 (YP_081595.1), US11 (AAS49004.1), US6 (YP_081596.1), US2 (QNT12687.1), and US3 (AAS49002.1). A, The multiple sequence alignment (MSA) highlights conserved regions (*), semi-conserved residues (:), and gaps (-) among the sequences. Structural similarities were observed in US2, US3, and US6, which suggest their evolution from a common ancestor. Further analysis supported the data analyzed by phylogenetic tree analysis. The most conserved region is marked with a black box. Regular deletions and insertions have taken place in the sequence of US10 (marked in green boxes). US10 has the shortest N terminal and has the most gaps compared to other sequences, suggesting lots of motifs and loops similar to the structure depicted by Phyre 2; B, This phylogenetic tree illustrates the evolutionary relationships among HCMV proteins US2, US3, US6, US10, and US11. US2 and US3 formed a sister group, while US6 and US11 also share a common ancestor, suggesting the four proteins are closely related. In contrast, US10 is positioned at a distance from other proteins, showing a divergent evolutionary path.
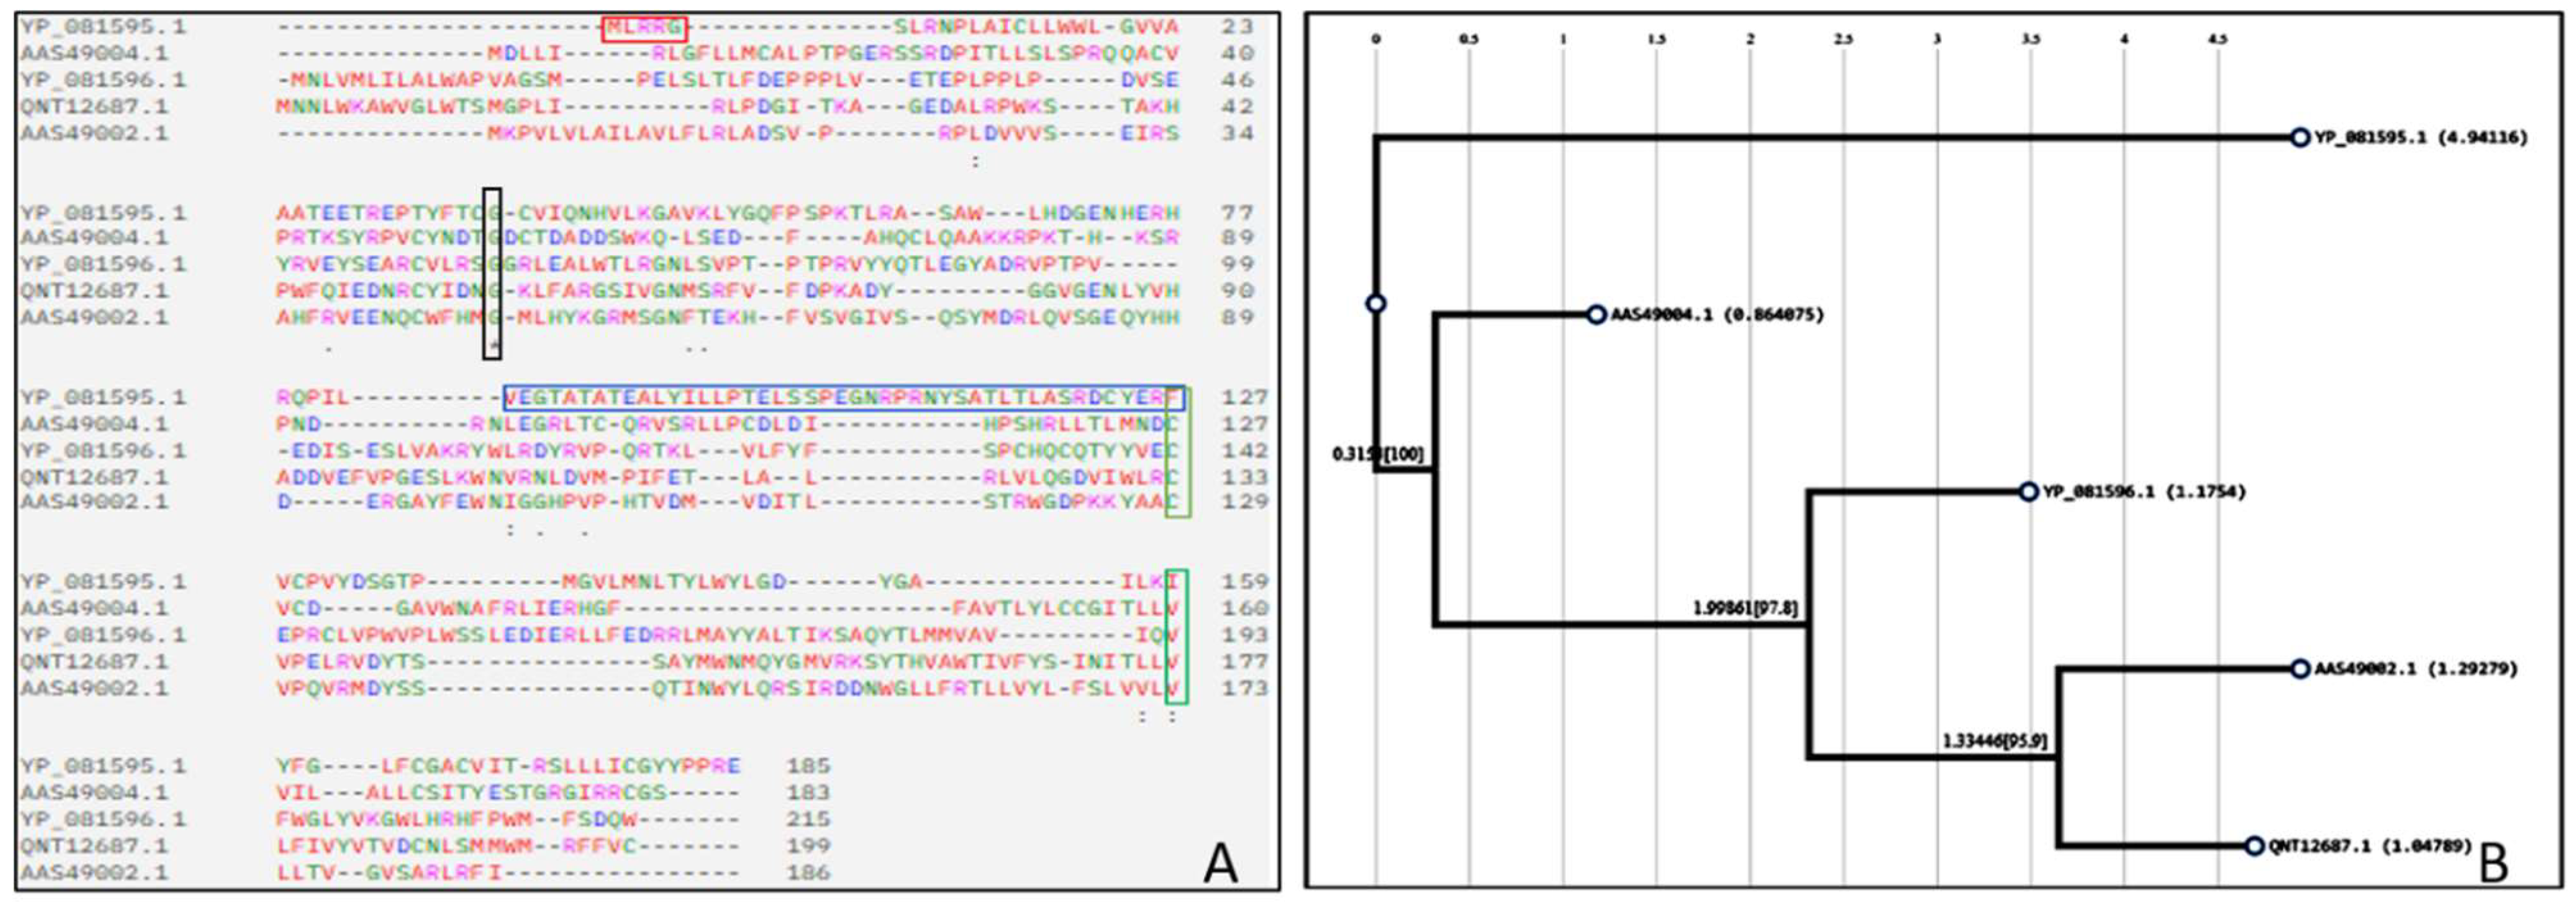
Figure 5.
Represents the structural comparison of the HCMV proteins US2, US3, US6, US10, and US11. A, US2 and US3 have presented identical PDB files with a dominating presence of ß-helix compared to α-helix; B, US6 shows a compact and globular structure composed of dominant α-helices, giving it a rigid conformation; C, US10 has a larger and more complex structure with an extensive combination of α-helices and ß-sheets; D, US11 has a long extended structure responsible for providing flexibility to the protein.
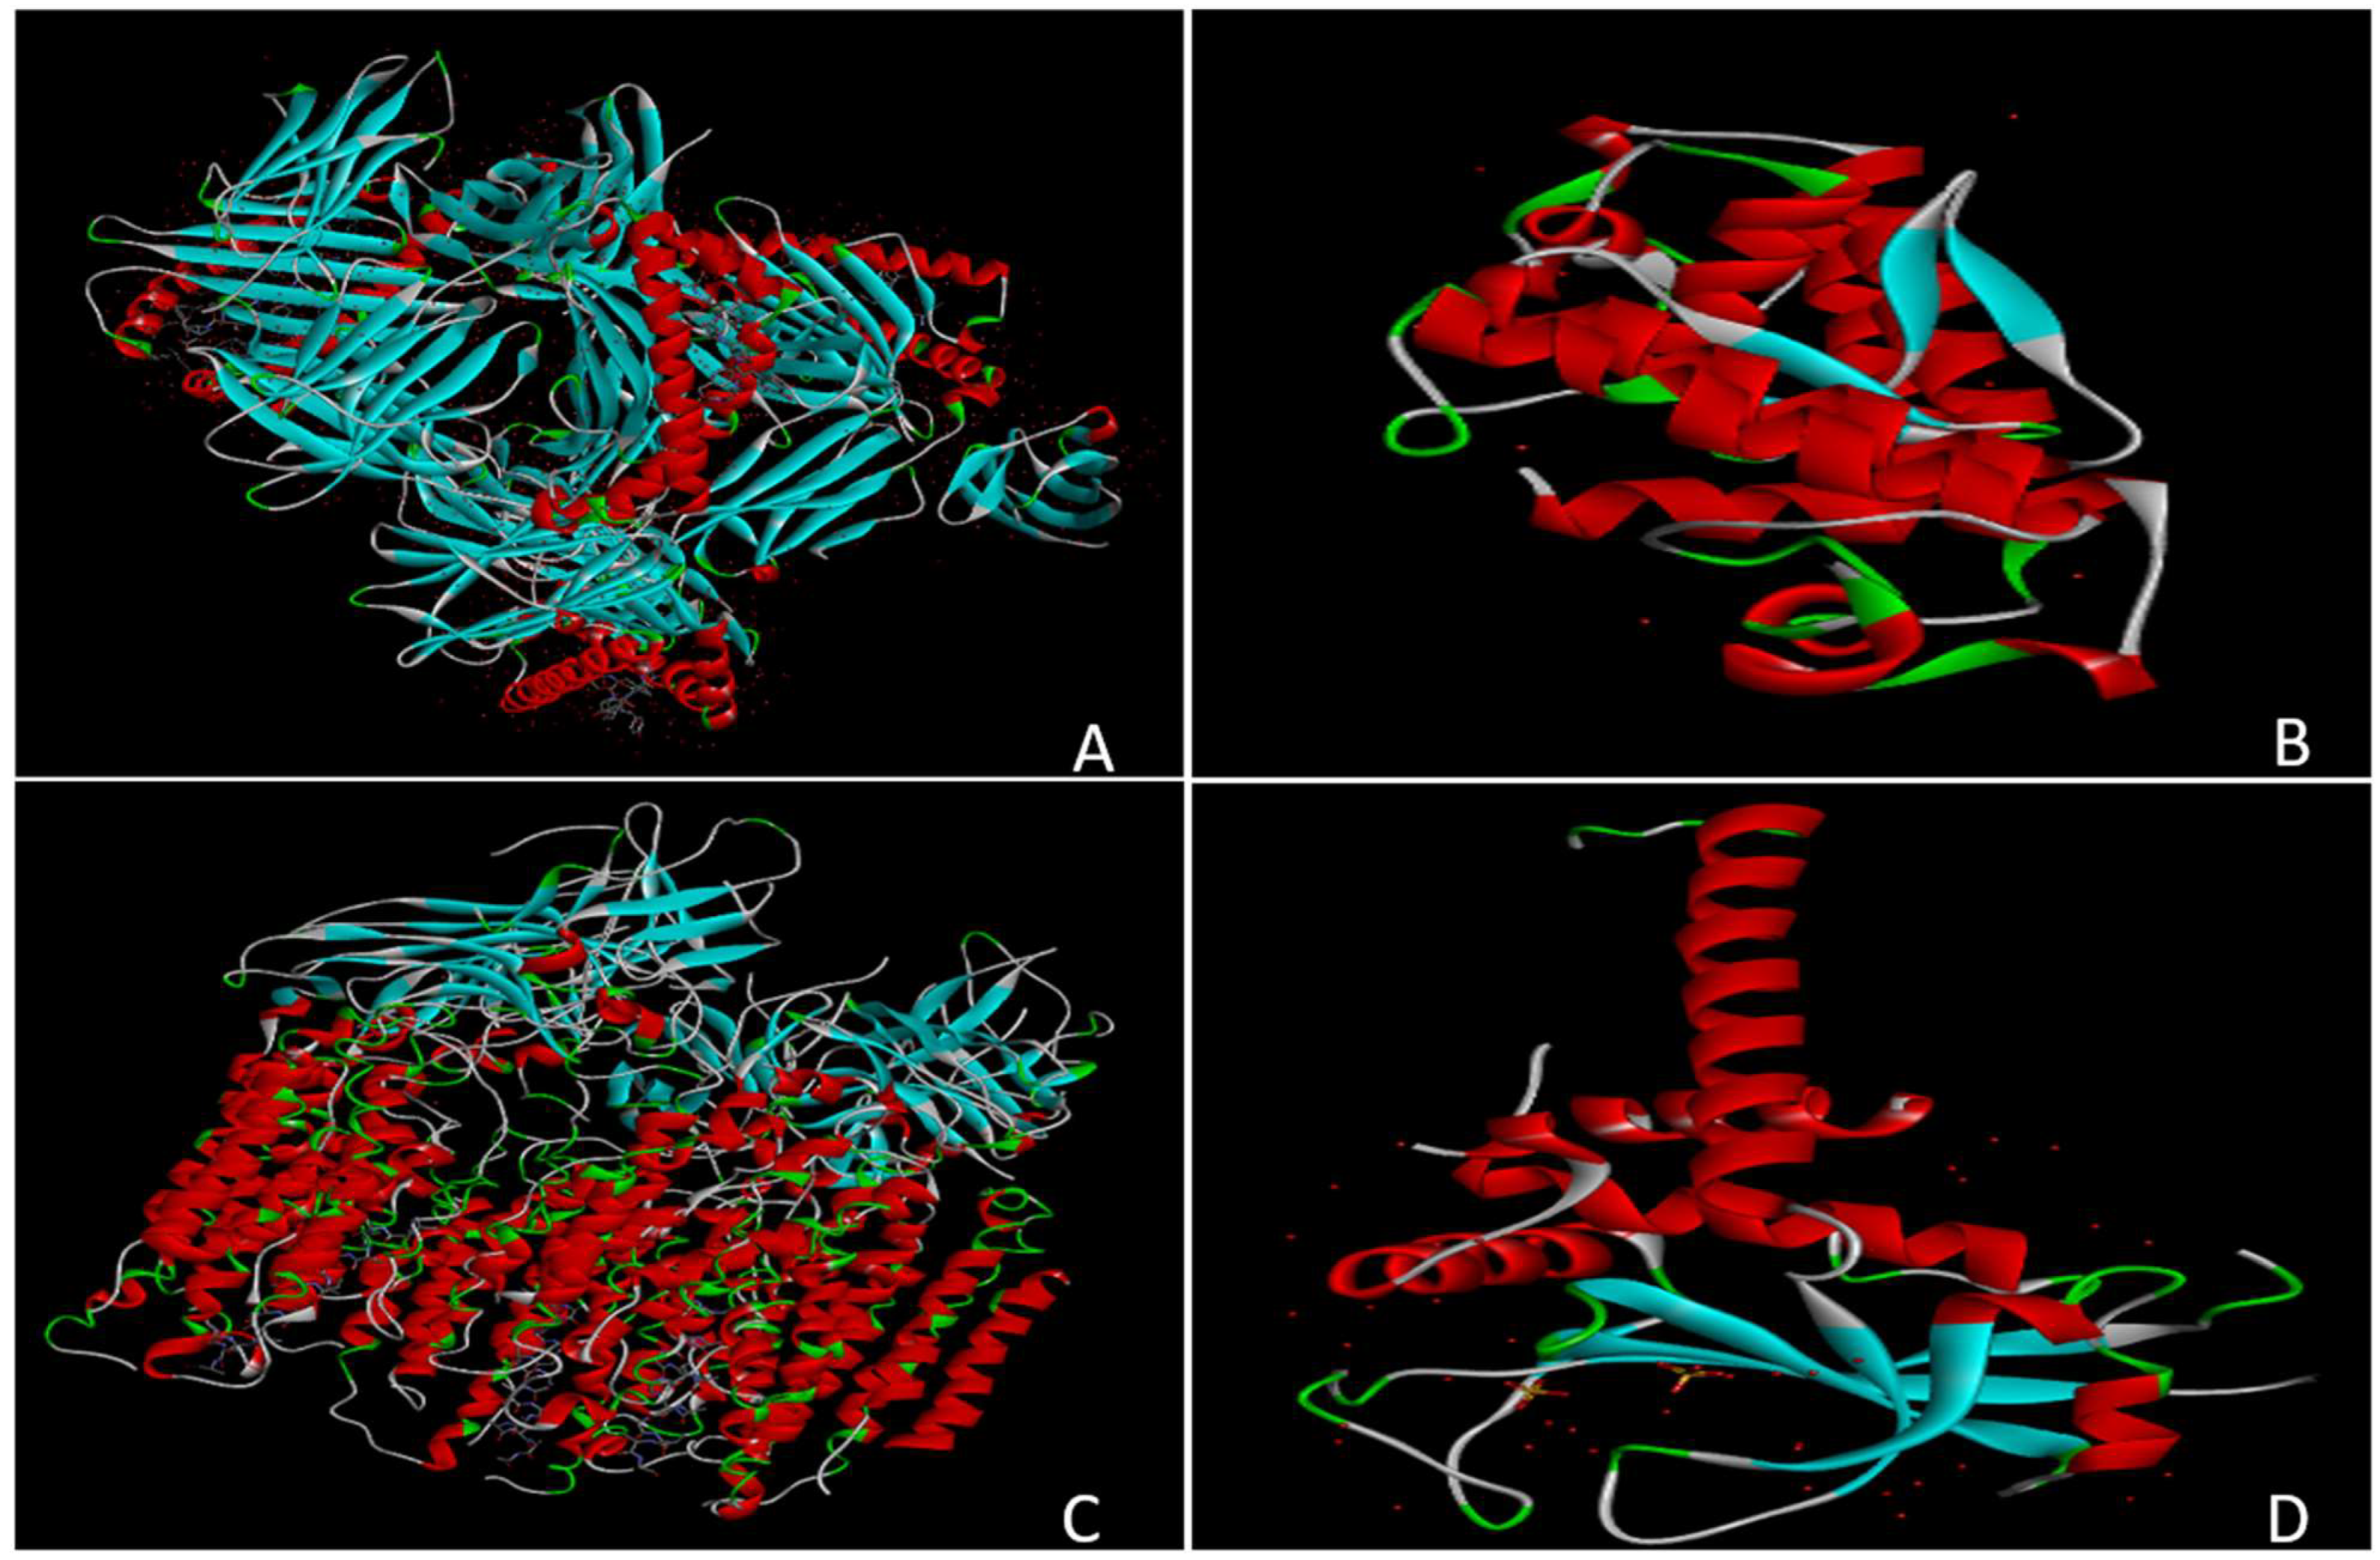
Figure 6.
Depicts the structural superimposition between MHC Class I molecules and HCMV proteins US2, US6, US10, and US11. The blue region denotes HCMV proteins, and the red region represents MHC molecules. A, Stable and aligned structure has been generated by US2/US3 and MHC molecules; B, Protein US6 is rigidly bound to the core of MHC molecules; C, Each MHC Class I poorly binds to US10, with a very low TM and a high RMSD value.; D, US11 moderately aligns with MHC molecules, indicating a less stable structure.
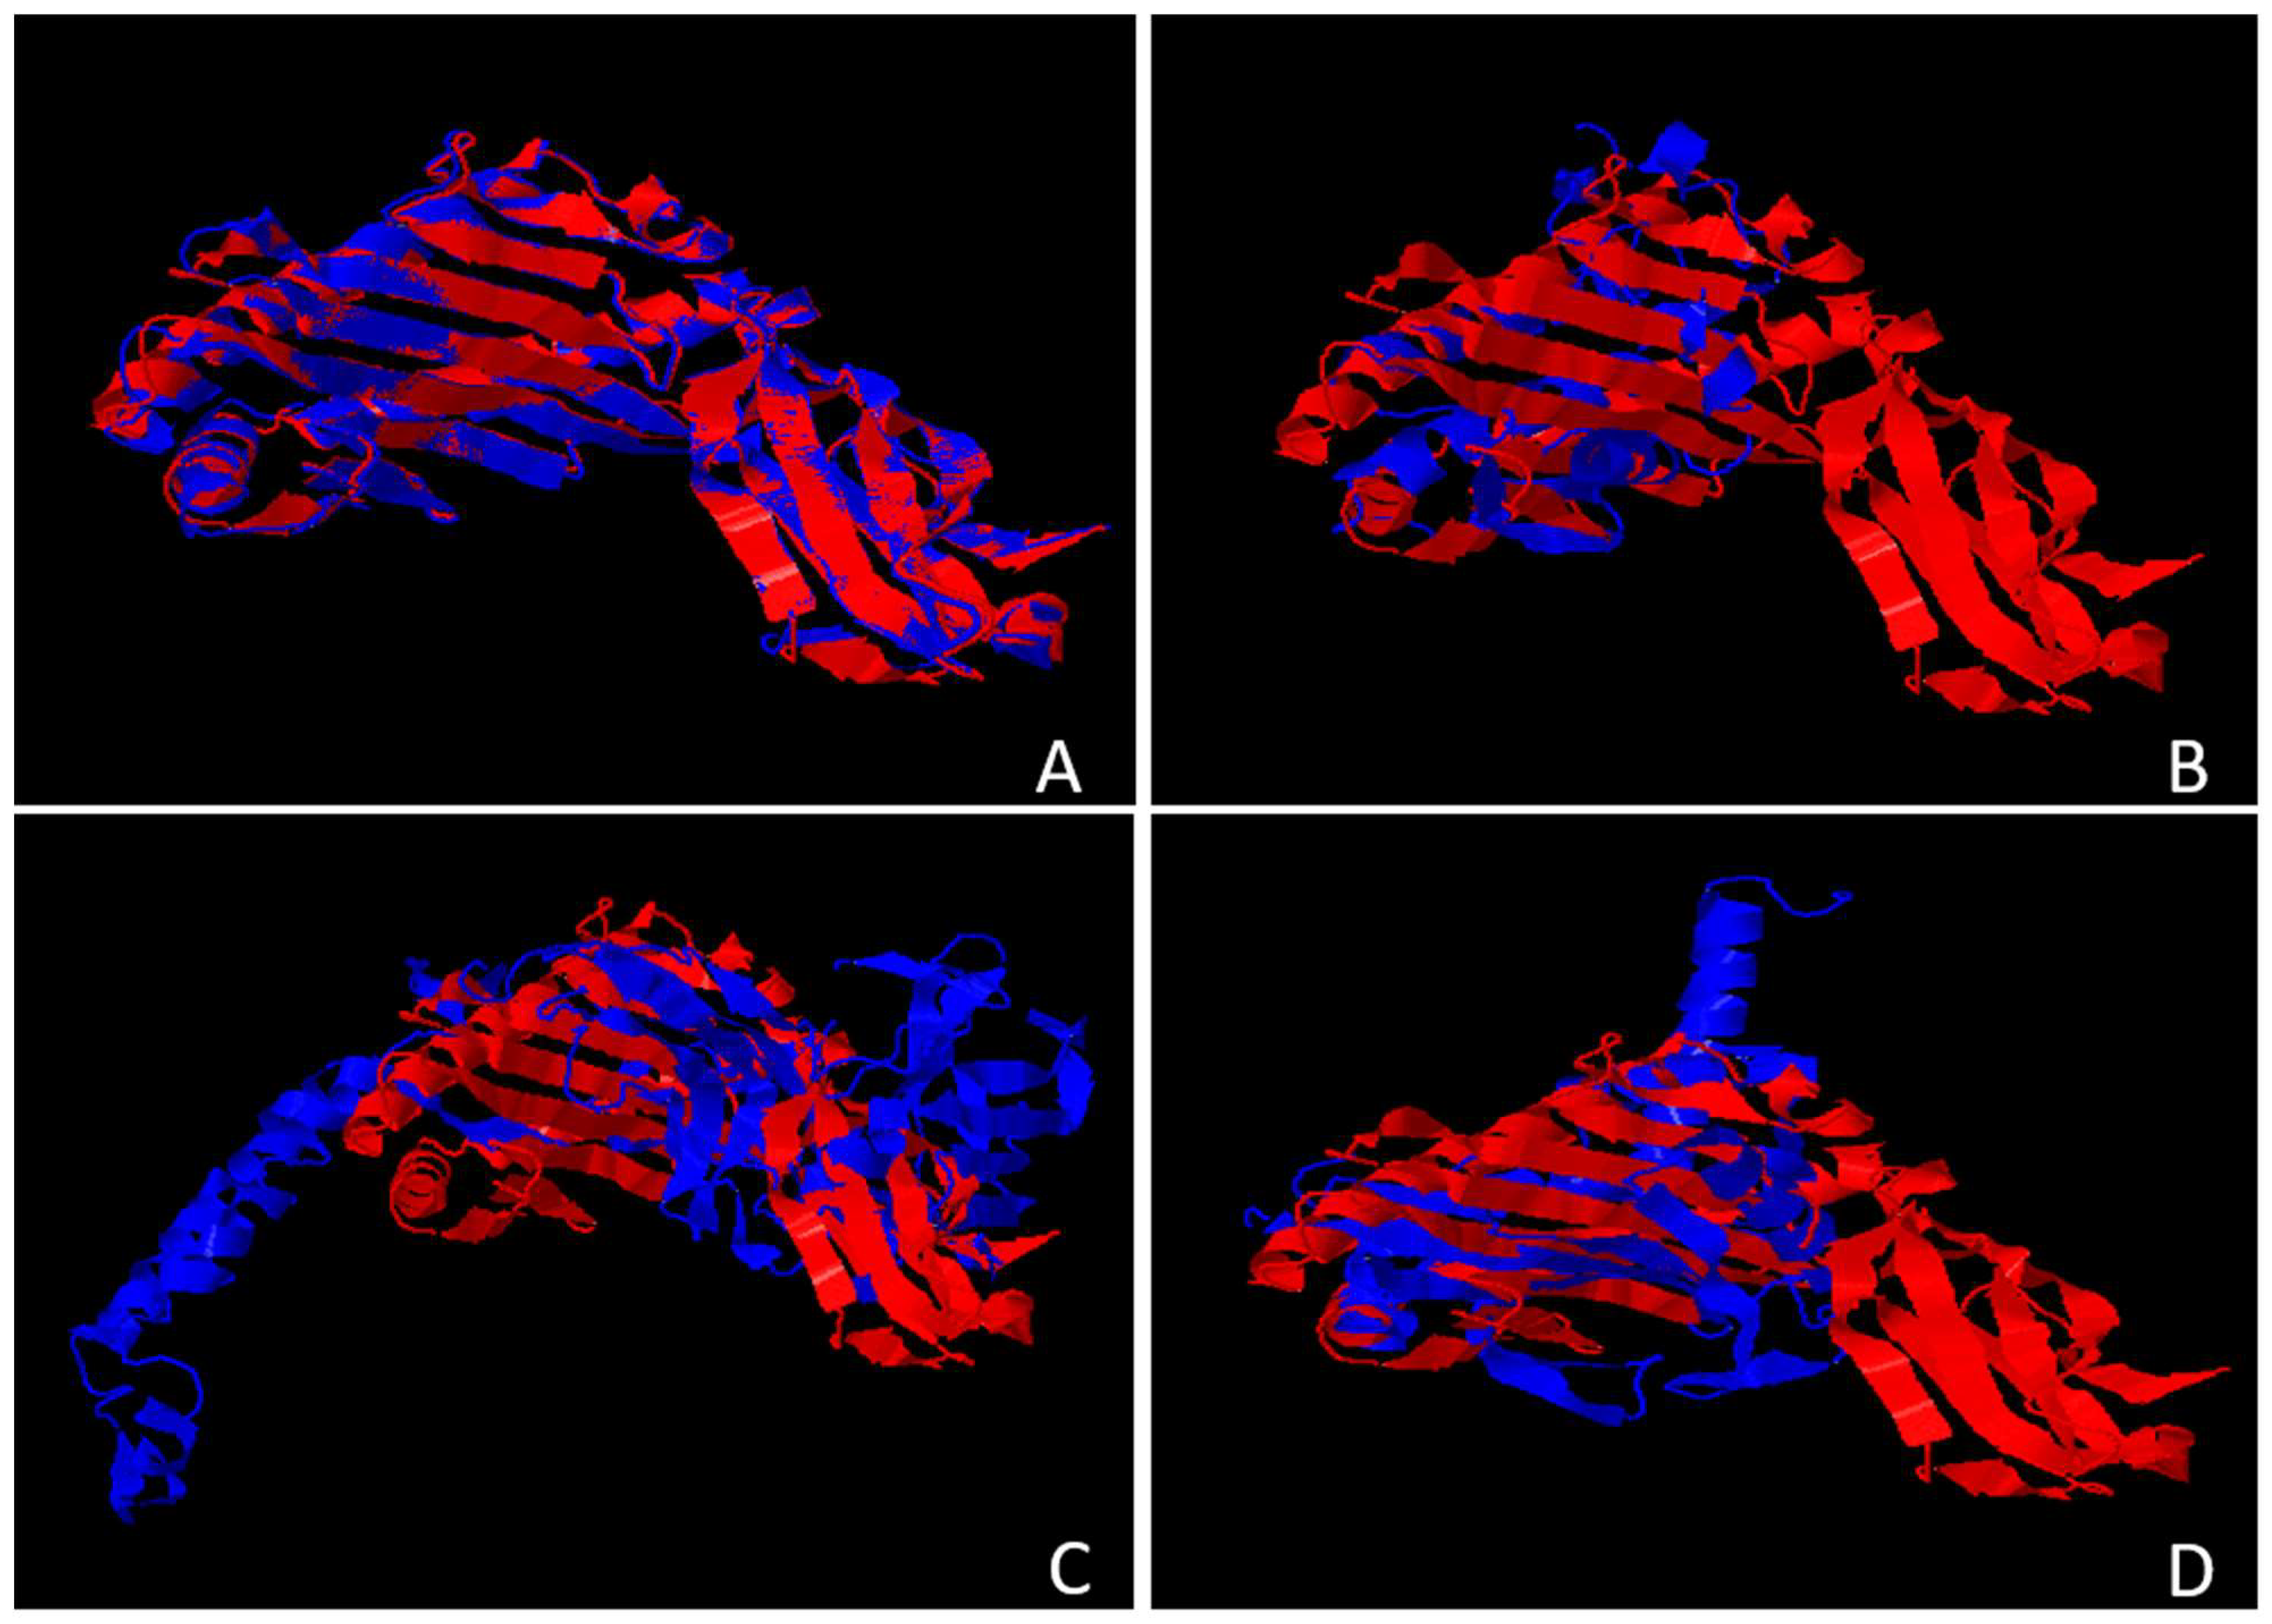

Table 1.
HCMV proteins identified by LC-MS/MS and/or by FTICR from virions and dense bodies (89). asterisks indicate proteins whose LC-MS/MS SEQUEST scores were lower than our cut-off values; however, the proteins were identified with the more sensitive FTICR.
Table 1.
HCMV proteins identified by LC-MS/MS and/or by FTICR from virions and dense bodies (89). asterisks indicate proteins whose LC-MS/MS SEQUEST scores were lower than our cut-off values; however, the proteins were identified with the more sensitive FTICR.
| Viral protein group | HCMV ORF | LC-MS/MS | FTICR | Coverage (%) | |
| No. of peptides | Max XCorr | No. of peptides | |||
| Virion proteins | |||||
| Capsid | UL46 | 20 | 5.30 | 14 | 44.8 |
| UL48-49 | 8 | 6.52 | 5 | 54.7 | |
| UL80 | 37 | 6.36 | 30 | 35.6 | |
| UL85 | 21 | 6.73 | 22 | 63.1 | |
| UL86 | 149 | 3.97 | 123 | 71.0 | |
| Tegument | UL24 | 8 | 5.06 | 9 | 38.3 |
| UL25 | 60 | 7.04 | 59 | 59.2 | |
| UL26 | 9 | 4.77 | 10 | 53.7 | |
| UL32 | 135 | 3.01 | 100 | 70.5 | |
| UL43 | 7 | 5.50 | 10 | 28.1 | |
| UL47 | 53 | 6.10 | 64 | 57.5 | |
| UL48 | 111 | 4.29 | 109 | 56.8 | |
| UL82 | 70 | 6.39 | 47 | 69.3 | |
| UL83 | 123 | 5.44 | 86 | 92.0 | |
| UL94 | 10 | 5.08 | 12 | 26.4 | |
| UL99 | 8 | 5.87 | 9 | 64.7 | |
| US22 | 2 | 3.16 | 2 | 5.4 | |
| US23 | 1 | 2.61 | 1 | 4.6 | |
| US24 | 1 | 4.83 | 2 | 7.0 | |
| Glycoproteins | RL10 | 5 | 2.36 | 4 | 22.8 |
| TRL14 | *a | 1 | 7.5 | ||
| UL5 | * | 1 | 5.4 | ||
| UL22A | 1 | 5.04 | 1 | 19.4 | |
| UL33 | 4 | 6.11 | 4 | 14.1 | |
| UL38 | * | 1 | 5.7 | ||
| UL41A | 2 | 5.72 | 2 | 25.6 | |
| UL50 | 1 | 2.82 | 4 | 10.6 | |
| UL55 | 21 | 6.16 | 23 | 24.8 | |
| UL73 | 2 | 3.47 | 2 | 6.5 | |
| UL74 | 4 | 5.07 | 4 | 13.5 | |
| UL75 | 21 | 6.15 | 22 | 35.7 | |
| UL77 | 14 | 5.65 | 12 | 31.2 | |
| UL93 | 15 | 5.35 | 14 | 31.7 | |
| UL100 | 13 | 5.24 | 7 | 15.9 | |
| UL115 | 11 | 4.73 | 9 | 47.1 | |
| UL119 | 2 | 2.23 | 1 | 4.6 | |
| UL132 | 8 | 5.89 | 8 | 47.0 | |
| US27 | 4 | 4.25 | 2 | 7.7 | |
| Transcription-replication machinery | IRS1 | 15 | 6.01 | 17 | 25.8 |
| TRS1 | 10 | 6.92 | 23 | 34.7 | |
| UL44 | 1 | 4.32 | 9 | 31.0 | |
| UL45 | 43 | 5.85 | 52 | 52.2 | |
| UL54 | * | 1 | 1.6 | ||
| UL57 | * | 1 | 0.4 | ||
| UL69 | 6 | 4.17 | 7 | 19.0 | |
| UL72 | * | 1 | 4.6 | ||
| UL84 | 1 | 2.50 | 3 | 12.8 | |
| UL89 | * | 1 | 3.1 | ||
| UL97 | 13 | 5.95 | 9 | 32.1 | |
| UL122 | 2 | 4.26 | 4 | 11.7 | |
| Uncharacterized | UL35 | 42 | 6.27 | 40 | 56.1 |
| UL51 | * | 1 | 3.2 | ||
| UL71 | 12 | 6.32 | 11 | 40.4 | |
| UL79 | * | 1 | 10.9 | ||
| UL88 | 14 | 6.8 | 17 | 33.6 | |
| UL96 | 1 | 4.46 | 1 | 19.7 | |
| UL103 | 8 | 5.18 | 8 | 37.0 | |
| UL104 | 9 | 4.68 | 9 | 23.0 | |
| UL112 | 1 | 3.30 | 4 | 4.7 | |
| Dense body proteins | |||||
| Capsid | UL46 | 1 | 3.6 | 6 | |
| UL48-49 | 2 | 5.8 | 1 | ||
| UL80 | 1 | 6.1 | 2 | ||
| UL85 | 4 | 5.0 | 4 | ||
| UL86 | 22 | 5.0 | 19 | ||
| Tegument | UL25 | 17 | 6.3 | 13 | |
| UL26 | 3 | 3.6 | 3 | ||
| UL32 | 11 | 5.4 | 15 | ||
| UL35 | 5 | 5.6 | 9 | ||
| UL47 | 2 | 4.3 | 6 | ||
| UL48 | 7 | 5.4 | 12 | ||
| UL82 | 9 | 5.1 | 6 | ||
| UL83 | 40 | 6.3 | 14 | ||
| UL75 | 4 | 5.6 | 2 | ||
| Transcription-replication machinery | UL45 | 2 | 4.3 | 6 | |
| IRS1 | 3 | 5.6 | 2 | ||
| TRS1 | 1 | 4.7 | 5 | ||
Table 2.
This table illustrates the pH values along with the highest and lowest amino acid values for the MHC Class I proteins. Each protein is identified by an accession number. The proteins have a wide range of charge with pI values ranging from -11.08 to -4.96, suggesting the extremely acidic nature. Alanine consistently shows high value in all proteins, giving stability to the proteins, whereas asparagine, cysteine, or methionine are frequently low.
| Sl. No. | Protein | pH | Highest | Value | Lowest | Value |
| 1. | ACR55720.1 | -6.06 | Alanine | 10.14 | Asparagine | 1.1 |
| 2. | CAL85437.2 | -9.47 | Alanine | 10.84 | Asparagine | 10.84 |
| 3. | UPW16506.1 | -6.63 | Alanine | 9.94 | Cysteine | 1.38 |
| 4. | BDU99860.1 | -7.86 | Alanine | 10.66 | Methionine Asparagine | 1.37 |
| 5. | BDU99859.1 | -5.64 | Alanine | 10.22 | Asparagine Cysteine | 1.38 |
| 6. | BDU99858.1 | -4.96 | Alanine | 9.39 | Methionine | 1.1 |
| 7. | BDU99857.1 | -7.64 | Alanine | 9.86 | Asparagine | 1.1 |
| 8. | BDU49430.1 | -11.08 | Alanine | 10.11 | Asparagine | 1.37 |
| 9. | BDU18538.1 | -5.68 | Alanine | 9.39 | Methionine | 1.1 |
| 10. | BDU18537.1 | -5.64 | Alanine | 9.94 | Cysteine | 1.38 |
Table 3.
The table provides the physicochemical characteristics of the five HCMV proteins. The PI value suggests that US2 and US11 are acidic proteins, whereas the rest are basic proteins. It can be observed that US2 has high stability due to a low index value. US11 protein has an index value of 56.46, which is more prone to degradation. GRAVY (Grand Average of Hydropathicity) measures the hydrophobicity of the protein; a high positive value of US2 resembles it as hydrophobic, maybe membrane-associated, and a negative value means hydrophilic. Extinction Coefficient (Cys-Cys) measures the protein’s light absorbance at 280 nm in the presence of disulfide bonds, and again US2 has the highest disulfide bonds.
| Protein | NCBI Reference Sequence | Number of Amino Acids | Molecular Weight (Da) | Theoretical pI | Instability Index | GRAVY | Total Atom Number | Extinction Coefficient (Cys-Cys) | Extinction Coefficient (Reduced Cys) |
| US2 | QNT12687.1 | 199 | 23110.95 | 6.82 | 28.71 | 0.131 | 3236 | 68660 | 68410 |
| US3 | AAS49002.1 | 186 | 21514.98 | 8.59 | 44.20 | 0.076 | 3032 | 39545 | 39420 |
| US6 | AAS49004.1 | 183 | 20611.96 | 8.73 | 45.66 | -0.138 | 2889 | 17710 | 16960 |
| US10 | YP_081595.1 | 185 | 20771.09 | 8.1 | 47.21 | 0.051 | 2918 | 40380 | 39880 |
| US11 | YP_081596.1 | 215 | 25288.44 | 5.46 | 56.46 | -0.029 | 3558 | 70610 | 70360 |
Table 4.
Sample HCMV proteins were analyzed in TM-align with their respective control. US3 and US10 showed the highest alignment. However, US10 made it perfect, followed by US6 and US2 moderately aligned, and US11 gave the lowest alignment value. Root mean square deviation (RMSD) is a measurement of the distance between atoms in superimposed proteins. The lower the RMSD value, the higher the similarity between the two compared structures, and US10 gives a perfect value of “0.” This comparison can be useful in extracting the evolutionary value of proteins as well as drug design.
| Proteins | Sample Acc. No. | Control Acc. No. | Length of Chain_1 | Length of Chain_2 | Aligned Length | RMSD | Seq_ID | TM-score (Chain_1) | TM-score (Chain_2) |
| US2 | A398799 | B398799 | 275 | 613 | 159 | 6.55 | 0.031 | 0.32891 | 0.18085 |
| US3 | A768951 | B768951 | 275 | 275 | 275 | 0.00 | 1.000 | 1.00000 | 1.00000 |
| US6 | A627561 | B627561 | 119 | 738 | 90 | 4.86 | 0.056 | 0.41385 | 0.09977 |
| US10 | A456694 | B456694 | 362 | 362 | 362 | 0.00 | 1.000 | 1.00000 | 1.00000 |
| US11 | A342978 | B342978 | 119 | 213 | 62 | 4.70 | 0.065 | 0.30271 | 0.19793 |
Table 5.
The table illustrates a detailed comparison of the alignment of the HCMV proteins that were superimposed in TM Align with ten different MHC Class I molecules and analyzed in Discovery Studio. US2 and US3 gave identical PDB file: name 1m3, 2not: US6, 3chx : US10 and 2dyt: US11.
Table 5.
The table illustrates a detailed comparison of the alignment of the HCMV proteins that were superimposed in TM Align with ten different MHC Class I molecules and analyzed in Discovery Studio. US2 and US3 gave identical PDB file: name 1m3, 2not: US6, 3chx : US10 and 2dyt: US11.
| Sl. No. | MHC CLASS I molecules | HCMV proiens | Chain 1 | Chain 2 | Aligned Length | RMSD | TM-Score 1 | TM-Score 2 |
| 1. | 8rbu | 1im3 | A39262 | B39262 | 275 | 1.09 | 0.97375 | 0.97375 |
| 8rbu | 2not | A43136 | B43136 | 87 | 4.52 | 0.22385 | 0.41101 | |
| 8rbu | 3chx | A775119 | B775119 | 125 | 6.17 | 0.26921 | 0.22068 | |
| 8rbu | 2dyt | A225357 | B225357 | 93 | 5.54 | 0.21168 | 0.253 | |
| 2. | 6at5 | 1im3 | A915955 | B915955 | 275 | 0.93 | 0.97831 | 0.97831 |
| 6at5 | 2not | A76528 | B76528 | 62 | 4.12 | 0.16994 | 0.32446 | |
| 6at5 | 3chx | A375128 | B375128 | 125 | 6.26 | 0.26725 | 0.21876 | |
| 6at5 | 2dyt | A938623 | B938623 | 94 | 5.84 | 0.20983 | 0.25083 | |
| 3. | 8rh6 | 1im3 | A830088 | B830088 | 275 | 1.07 | 0.97431 | 0.97431 |
| 8rh6 | 2not | A265052 | B265052 | 84 | 4.97 | 0.20479 | 0.36051 | |
| 8rh6 | 3chx | A770980 | B770980 | 128 | 6.7 | 0.25794 | 0.21251 | |
| 8rh6 | 2dyt | A614219 | B614219 | 94 | 5.79 | 0.21694 | 0.26199 | |
| 4. | 6avf | 1im3 | A995997 | B995997 | 91 | 1.98 | 0.80504 | 0.30499 |
| 6avf | 2not | A823717 | B823717 | 49 | 4.38 | 0.27706 | 0.23798 | |
| 6avf | 3chx | A162769 | B162769 | 86 | 3.95 | 0.52829 | 0.1888 | |
| 6avf | 2dyt | A849825 | B849825 | 73 | 4.34 | 0.43199 | 0.23963 | |
| 5. | 8rcv | 1im3 | A567132 | B567132 | 275 | 0.97 | 0.97318 | 0.97665 |
| 8rcv | 2not | A710917 | B710917 | 84 | 5.11 | 0.20065 | 0.34949 | |
| 8rcv | 3chx | A206273 | B206273 | 125 | 6.16 | 0.26646 | 0.21923 | |
| 8rcv | 2dyt | A261797 | B261797 | 96 | 5.59 | 0.22061 | 0.26591 | |
| 6. | 8ref | 1im3 | A38683 | B38683 | 275 | 0.87 | 0.97754 | 0.98104 |
| 8ref | 2not | A657214 | B657214 | 83 | 5.02 | 0.19822 | 0.34421 | |
| 8ref | 3chx | A651801 | B651801 | 125 | 6.1 | 0.26846 | 0.22067 | |
| 8ref | 2dyt | A845288 | B845288 | 94 | 5.46 | 0.21787 | 0.26214 | |
| 7. | 7tlt | 1im3 | A790795 | B790795 | 272 | 0.89 | 0.97686 | 0.96987 |
| 7tlt | 2not | A643556 | B643556 | 77 | 5.31 | 0.18021 | 0.30753 | |
| 7tlt | 3chx | A272931 | B272931 | 132 | 6.67 | 0.26233 | 0.21609 | |
| 7tlt | 2dyt | A736837 | B736837 | 96 | 5.9 | 0.21743 | 0.25974 | |
| 8. | 6avg | 1im3 | A319539 | B319539 | 94 | 2.16 | 0.79055 | 0.31365 |
| 6avg | 2not | A665036 | B665036 | 52 | 4.81 | 0.25042 | 0.22573 | |
| 6avg | 3chx | A103048 | B103048 | 90 | 3.94 | 0.53554 | 0.19852 | |
| 6avg | 2dyt | A7491 | B7491 | 72 | 4.24 | 0.42602 | 0.24219 | |
| 9. | 7tlt | 1im3 | A893416 | B893416 | 275 | 0.95 | 0.97705 | 0.97705 |
| 7tlt | 2not | A267335 | B267335 | 82 | 4.91 | 0.20548 | 0.3755 | |
| 7tlt | 3chx | A269864 | B269864 | 126 | 6.24 | 0.27106 | 0.22162 | |
| 7tlt | 2dyt | A521269 | B521269 | 94 | 5.88 | 0.21576 | 0.26075 | |
| 10. | 7rtd | 1im3 | A549898 | B549898 | 274 | 0.73 | 0.98646 | 0.98292 |
| 7rtd | 2not | A424143 | B424143 | 84 | 5.03 | 0.20322 | 0.35317 | |
| 7rtd | 3chx | A510367 | B510367 | 122 | 6.1 | 0.26341 | 0.21552 | |
| 7rtd | 2dyt | A172716 | B172716 | 100 | 5.76 | 0.22927 | 0.27483 |
Disclaimer/Publisher’s Note: The statements, opinions and data contained in all publications are solely those of the individual author(s) and contributor(s) and not of MDPI and/or the editor(s). MDPI and/or the editor(s) disclaim responsibility for any injury to people or property resulting from any ideas, methods, instructions or products referred to in the content. |
© 2024 by the authors. Licensee MDPI, Basel, Switzerland. This article is an open access article distributed under the terms and conditions of the Creative Commons Attribution (CC BY) license (http://creativecommons.org/licenses/by/4.0/).
Copyright: This open access article is published under a Creative Commons CC BY 4.0 license, which permit the free download, distribution, and reuse, provided that the author and preprint are cited in any reuse.


