
Submitted:
13 December 2024
Posted:
16 December 2024
You are already at the latest version
Abstract
Rotavirus alphagastroenteritidis are the major causative agent of acute gastroenteritis in both children under the age of 5 and young mammals and birds globally. RVAs are non-enveloped viruses with a genome comprising 11 double-stranded RNA segments. In 2008, the Rotavirus Classification Working Group pioneered a comprehensive and complete RVA genome classification system, establishing specific threshold, which measure the genetic distances between homologous genes. The aim of this study was to perform an updated systematic analysis of the genetic variability across all RVA genes. Our investigation involved assessing established cutoff values for each RVA genome segment and determine the need for any updates. To achieve this objective, multiple sequence alignments were constructed for all 11 genes and one for each genotype with discrepancies. Also, pairwise distances along with cutoff values were evaluated. The analyses provided insights into the current relevance of cutoff values, which remain applicable for the majority of genotypes. In conclusion, this study fortifies the current classification system by highlighting its robustness and accurate genotyping of Rotavirus alphagastroenteritidis.
Keywords:
RVA strain classification
; strain reference
; pairwise distance comparison
; phylogeny
1. Introduction
Rotavirus alphagastroenteritidis (RVA) are major pathogens associated with acute gastroenteritis in children, young mammals, and birds worldwide [1]. RVA has a segmented double-stranded RNA genome which consists of 11 genome segments enclosed in a triple-layered icosahedral capsid [2]. The 11 genome segments encode six viral structural proteins (VP1 to VP4, VP6, and VP7) and six nonstructural proteins (NSP1 to NSP6) [3]. Each genome segment, with the exception of gene 11 that encodes two protein (NSP5 and NSP6), codes for a single viral protein [4]. The inner layer of the rotavirus virion is mainly composed of VP2, which encases VP1, the viral RNA-dependent RNA polymerase, VP3, the viral capping enzyme and the viral genome [2]. The middle layer of the virion comprises VP6 trimmers exclusively; VP7 and spikes of VP4 compose the outer layer [2]. VP7 and VP4 were the initial basis of a binary classification system defining the G types (glycoprotein) and P types (protease sensitive), respectively. VP7 and VP4 are capable of independently eliciting neutralizing antibodies, initially used to define rotavirus G and P serotypes [4].
For human strains, three genogroups have been established: two major genogroups represented by the reference Wa and DS-1 strains and one minor genogroup represented by reference AU-1 strain [5]. These genogroups were historically determined by hybridization techniques [5], and later confirmed by sequencing, establishing particular “genotype constellations” in line with these genogroups. Sequencing of rotavirus genomes and phylogenetic and phylodynamic analyses are critical for the understanding of the patterns of virus evolution. One method that is frequently used to study the genetic distances between virus strains consists of the pairwise sequence identity comparisons [6]. Studying evolutionary patterns, the main generator of diversity in rotavirus appears to be point mutations. These occur continuously due the high error rate of the RVA polymerase [7]. In addition, viral genome reassortments occur between co-infecting strains, often involving zoonotic transmission [1]. During reassortment events certain RVA genes apparently co-segregate, suggesting an important degree of gene linkage [8]. Furthermore, when host restriction has been observed, only RVAs of particular gene constellations can efficiently infect certain hosts. In fact, a detailed look at the RVA genome constellations shows a restricted gene pattern in different animal species, with just a few promiscuous genotypes able to infect multiple species [9,10,11].
In the past decades, specific rotavirus strains were associated with specific animal species; however, after the implementation of the new classification system, the host species’ descriptions were improved [9]. Human RVA strains that possess genes commonly found in animal rotaviruses have been isolated from infected children [9]. Strains such as G3 (found commonly in species such as cats, dogs, monkeys, pigs, mice, rabbits and horses), G5 (pigs), G6 and G8 (cattle), G9 (pigs) and G10 (cattle) have been isolated from the human population throughout the world [9,12,13,14]. On the other hand, the most common RVA genotypes circulating in humans worldwide are G1P[8], G2P[4], G3P[8], G4P[8], G9P[8], and G12P[8] [15]. In a recent review of RVA distribution in animals, it was observed that reassortment occurs frequently. Many genotypes are combined constantly and new reassortant appear continuously [9]. These new reassortants may be transfered to other species, leading to unpredictable outcomes and opening the possibility for the emergence of new virulent variants with unforeseen impacts [9].
Nucleotide composition is the simplest way of characterizing genomes [16], and it is essential to the study of viral evolution, particularly the interplay between viruses and host cells [17]. On the other hand, mutation rate estimates vary considerably, even for the same virus [18,19]. Since viral mutation rates have implications for epidemiological surveillance, pathogenesis [20,21], vaccine development [22,23] antiviral therapy [24], and disease management [25,26], it is important to have accurate data at molecular level [27].
To properly study the evolution of rotaviruses, the establishment of a classification system in which individual genes fall into defined clusters/genotypes based on reliable percentage identity cutoff values is crucial [6]. In the last decades, multiple rotavirus strains have been analyzed and compared to one another by partial or complete sequencing of all 11 gene segments as this approach has allowed to determine direct genetic relationships [6]. The introduction of a new classification system and the creation of the Rotavirus Classification Working Group (RCWG) marked a significant milestone. This system relied on nucleotide sequence identity cutoff percentages for each of the 11 RVA genome segments [28]. Genetic identity refers to the degree of similarity between two genetic sequences.
To denote the different encoding genes, the proposed notation was employed (Table 1), providing a valuable tool for studying complete rotavirus genomes, also known as genome constellations, that infect various animal species and humans. This approach greatly enhanced our understanding of host restriction, interspecies transmission events, the emergence of reassortant strains post-vaccination, and the overall evolution of RVA.
The identity cutoff percentages were initially determined based on all available strains in 2008. However, since then, a multitude of new strains have been sequenced, leading to the discovery of new genotypes (Table 1). These genotypes have a reference, usually the first reported. The reference strains were listed by Matthijnssens et al. in 2008 [28] and then the RCWG continued reporting new reference strains in their webpage [29]. The updated list of the reference strains is presented in Table 2.
In this study, our objective was to explore the rigor of the classification system for all 11 RVA genome segments by conducting phylogenetic analyses and constructing pairwise sequence identity profiles following the RCWG recommendations. In detail, we aimed to test the current classification system using the cutoff values established in 2008.
2. Materials and Methods
2.1. Matrix Construction and Alignment
In February 2020, we obtained nucleotide sequences of RVA genes from the National Center for Biotechnology Information (www.1ncbi.nlm.nih.gov/genbank/). The search was made using the words ”rotavirus A“, “VP7 gene”, for example to download all the VP7 strains sequences available, then were searched ”rotavirus A“, “VP4 gene”, to download all the VP4 strains sequences available, and so on. To ensure the integrity of our dataset, we made a “depuration process”, which means we meticulously manually filtered out partial sequences lacking a complete open reading frame (ORF), as well as those containing repeated sequences and uncertainties such as ambiguous nucleotides. In instances where only limited data (only a few or even one sequence) were available for specific genotypes, sequences lacking a complete ORF were still included to maintain a comprehensive representation.
To enhance the accuracy and reliability of our analyses, matrix editions (alignments of all sequences, selection of the ORF, etc.) were carried out using AliView v1.26 [22] and Bioedit v7.2.5 [23]. Sequences were meticulously labeled to include genotype, accession number, host, country of origin, and year of collection, providing a detailed context for each sequence.
Subsequently, a multiple sequence alignment (MSA) was constructed for each gene using the online server MAFT (https://mafft.cbrc.jp/alignment/server/index.html) with default settings. The resulting matrices underwent further refinement and manual editing using AliView and BioEdit to ensure precise alignment. This comprehensive approach to matrix construction and alignment serves as a robust foundation for our subsequent analyses and contributes to the overall reliability of our findings.
This matrix compared genetic identities between all possible pair of sequences of a given genotype. Thus, for each genotype, we have the distances between all sequences that compound it. In an ideal case, each identity corresponding to a pair of sequences belonging to the same genotype should be greater than the cutoff value, described in Table 1 for each gene. For the p-Distance analysis, the criterium we used to consider a single strain to be “out of the cutoff” is that a genetic distance greater than the cutoff value was obtained with any other strain inside that genotype. However, for divergent strains the decision to classify it as a new genotype should be analyzed by the expert committee. On the other hand, for the K2P analysis we consider the cutoff value only to determine if they are closely related (if the genetic distance is minor than the cutoff value) or they are diverging (if the genetic distance is greater than the cutoff value). In other words, the cutoff value in K2P analysis only has an evolutionary interpretation, and is not for classification purposes.
2.2. Genetic Variation
Pairwise genetic distances were analyzed with p-distance model using MegaX software [30] with default settings. To assess genetic similarity, we calculated similarities both within genotypes (intra-genotype) and between genotypes (inter-genotype). These results were used to construct frequency histograms of identities, where the y-axis denotes the identities between each pair of sequences, while the x-axis represents the number of measured sequence pairs. Additionally, we calculated the evolutionary model better fit with the data to construct the phylogenetic trees and for the pairwise genetic distances including base and substitutions frequencies (Table A1).
2.2.1. Data Quality: Evolution Model, Nucleotide Frequency, Nucleotide Substitution and Phylogenetic Information Estimation
Before conducting phylogenetic analyses, a thorough assessment of the dataset information was carried out. Quality analysis revealed key parameters, including base frequency and nucleotide substitution rate, as outlined in Table 3. The results of this analysis guided the selection of the evolutionary model, with the General Time Reversible (GTR) model featuring Empirical base frequencies (+F) and reversibility (R) identified as the most suitable [25], as detailed in Table 3.
Furthermore, the presence of a phylogenetic signal was systematically assessed using the likelihood mapping method [28], implemented in IQ-Tree [29]. This methodological step ensured the reliability of the dataset for subsequent phylogenetic analyses by confirming the presence of informative signals in the genetic data.
2.2.2. Phylogenetic Analysis
The construction of phylogenetic trees was executed through the maximum likelihood method utilizing IQ-Tree. To enhance the accuracy of our analyses, we selected the models that best fit each of the eleven data sets, as detailed in Table 3. This approach ensured that the chosen models were tailored to the specific characteristics of each dataset, contributing to a more precise representation of evolutionary relationships.
In assessing the robustness of the phylogenetic tree branches, we employed 10,000 ultrafast bootstrap replicates [30]. This statistical support method provides a reliable estimation of branch confidence, offering a thorough and statistically rigorous evaluation of the inferred phylogenetic relationships.
By incorporating these methodologies, our phylogenetic tree construction process not only utilized advanced computational techniques but also ensured that the selected models and statistical support measures were optimized for the unique features of each dataset. This comprehensive approach enhances the reliability and significance of the phylogenetic inferences drawn from the analyses conducted with IQ-Tree.
Finally, the constructed phylogenetic trees were visually presented using Figtree software (http://tree.bio.ed.ac.uk/software/figtree/), offering an intuitive and comprehensive visualization of the evolutionary relationships inferred from the dataset. This meticulous approach to dataset assessment and subsequent phylogenetic analysis contributes to the robustness and reliability of the evolutionary insights derived from the study.
3. Results
3.1. Classification System
The full classification analyses were carried out based on a total of 26,537 nucleotide sequences which fulfilled the inclusion criteria. These sequence were obtained from the GenBank database. We included nucleotide sequences of VP7 (3172), VP4 (2771), VP6 (2463), VP1 (1495), VP2 (2754), VP3 (1507), NSP1 (2208), NSP2 (2358), NSP3 (2294), NSP4 (3183) and NSP5 (2332) (Figure 1). Table 1 show the increment of strains between 2008 and the moment this work was performed (February 2020). The column “Current Genotype” indicates the number of genotypes at the moment this paper is written (may 2024), it shows that its number increases quickly. The sum of all genotypes included in this study is 299.
The relative abundance of genotype for each gene were also calculated (Figure A2). This Figure depicts the dominace of the genotypes 1, 2 over the rest of the genotypes in all genes but VP7 and VP4, were a major diversity can be observed.
The genotyping system was tested with two models: the previously established model which uses p-Distance and is used by the RCWG to classify the new strains, and the model suggested by the sofware that better fit our dataset (mainly K2P). Histograms of pair identities were constructed with p-Distance and Histograms pair identities and phylogenentic trees with K2P model. We will analyze the results separately.
3.1. p-Distance Analysis
The p-Distance Histograms reveal a clear differentiation between intra an inter genotype distances (Figure 2 and Figure 3). It can be observed as the inter and intra genotype distances are clearly differentiated and very little overlap is observed. This is evidenced when we observed that the number of strains which falls “outside of the cutoff value” (Table 4) was only 169 for the p-Distance model. This represents 0.63% (169/26,537) of the total analyzed pairwise identifies. Of these, 44.9% (76/169) respresents NSP4 outliers. On the other hand VP7 has only one strain out of the cutoff value (D86277) corresponding to the G3 genotype. Meanwhile P[8] has 10 strains out of the cutoff value (representing the 0.64% of the strains included in these genotype), P[15] genotype has only one strain out of the cutoff value and VP1, VP3 and NSP1 has no strains outside of the cutoff. On the other hand, for NSP4, E3 genotype has 19.5% (15/77) strains out of the cutoff value, and for NSP5 H10 (5/5), H14 (2/2) and H15 (2/2) 100% of the strains are out of the cutoff value although only a few strains were analyzed for this genotypes.
3.2. K2P Analysis: Outer Capsid Proteins (VP7, VP4 and VP6)
Among the genotypes described for VP7, 89% (32/36) of the genotypes showed that their strains are closely related according to our analysis. 11% (4/36 genotypes) exhibited strains with identities ranging from 0.80 to 0.62. These genotypes were G3 with 17% (66/384) of strains, G6 with 73% (64/87), G8 with 42% (63/148) and G10 with 22% (20/88). All genotypes, except for G3, maintain a monophyletic origin within the phylogenetic tree (Figure A3).
Among the genotypes described for VP4, 92% (47/51 genotypes) showed a consistent distances according to our analysis (Figure 2). However, 8% (4/51 genotypes) exhibited strains with identities ranging from 0.79 to 0.73. These genotypes were P[1] with 26% (9/34) of the strains, P[3] with 83% (20/24), P[13] with 35% (5/14) and P[14] with 12% (6/49). Evolutionary relationships between groups are shown with a middle point root of VP4, where all groups are clearly defined (Figure A4). P[4], P[6] and P[8], all described in humans, are group together on the tree and all the rest of genotypes represent a heterogeneous group with a broad range of hosts (data not shown). Concerning to P[13], Figure A4 show that is a polyphyletic group. The strains corresponds to oriental porcine strains mainly, but one human strain from belgium and one porcine strain from spain were also reported.
Among the genotypes described for VP6, the 88% (23/26) showed a consistent distance according to our analysis (Figure 2). Only 12% (3 out of 26 genotypes) exhibited strains with identities ranging from 0.851 to 0.78. These genotypes were I2 with 9% (72/773) of the strains, I3 with 28% (12/43) and I12 with 67% (11/17) as shows Figure A2. VP6 phylogenetic tree with a middle point root in Figure A5 show all their genotypes has a monophyletic origins.
3.3. K2P Analysis: Inner Capsid Proteins (VP1, VP2 and VP3)
Among the genotypes described for VP1, the 87% (19/22 genotypes) showed a consistent distancy with the classification method (Figure 2). The 13% (3/22 genotypes) exhibited strains with low identities ranging from 0.831 to 0.79. These genotypes were R1 with 7% (65/830) of the strains out the cutoff value, R2 with 31% (181/571) and R3 with 35% (16/45). VP1 phylogenetic tree is shown in Figure A6. Two major groups are observed: R4, R6, R14, R17, R20 and R21 were together in one branch and the rest of the genotypes in another branch.
Among the genotypes described for VP2, 90% (18/20) showed a consistent distances according to our analysis (Figure 2). The 10% (2/20 genotypes) exhibited strains with low identities in a range of 0.841 to 0.69 (Table 3). These genotypes were C2 with 22% (195/868) of the strains and C4 with 33% (4/12). We also observed that strain RVA/Cow-wt/SVN/SI-B17/2004/G6P[11] (access number JX402792) showed distances higher to the cutoff value with most of C2 strains. The VP2 phylogenetic tree shows two branches, one contains C1, C2, C3, C5, C9, C11 and C12 and the other branch contains the rest of the genotypes (Figure A7).
Among the genotypes described for VP3, 90% (18/20 genotypes) showed a consistent distances according to our analysis (Figure 2). The 10% (2/20 genotypes) exhibited strains with low identities in a range of 0.811 to 0.76 (Table 3). These genotypes were M2 with 25% (137/557) of the strains and M3 with 39% (28/71). The phylogenetic tree show M16 as a separate far away group of the rest of genotypes in Figure A8.
3.4. Other Models Analysis: Non-Structural Proteins
Among the genotypes described for NSP1, 71% (25/31 genotypes) showed a consistent distaces according to our analysis (Figure 3). The 29% (6/31 genotypes) exhibited strains with low identities in a range of 0.791 to 0.57. These genotypes were A1 with 28% (395/1,405) of the strains, A3 with 51% (43/84), A8 with 52% (38/73), A9 with 48% (16/33), A11 with 20% (5/25) and A19 with 100% (6/6). Phylogenetic tree shows six branches. A27 genotype includes only one sequence, which is far away from the others genotypes (Figure A9).
Among the genotypes described for NSP2, 77% (17/22 genotypes) showed a consistent distances according to our analysis (Figure 3). Only 23% (5/22 genotypes) exhibited strains with low identities ranging from 0.84 to 0.65. These genotypes were N1 with 36% (587/1,600) of the strains, N2 with 95% (616/643), N3 with 62% (23/37), N4 with 14% (2/14) and N10 with 75% (6/8). Phylogenetic tree shows that most N-genotypes are monophyletic branches (Figure A10), while N2, N3 and N10 are polyphyletic groups. N2 shows two lineages: N2-A and N2-B. N9 genotype is clustering as a branch within the N2-A lineage. N3 has two lineages: N3-A and N3-B, with N5 genotype as a related branch to these two lineages. N10 has two lineages: N10-A and N10-B, and N6 as a related branch these two lineages (Figure 7).
Among the genotypes described for NSP3, 73% (16/22 genotypes) showed a consistent cutoff value according to our analysis (Figure 3). The 27% (6/22 genotypes) exhibited strains with low identities in a range of 0.851 to 0.66. These genotypes were T1 with 8% (127/1,496) of the strains, T3 with 77% (54/70), T4 with 60% (6/10), T6 with 80% (65/81), T7 with 4% (2/48, strains RVA/Pig-wt/ESP/F456/2017/G5P[13] (MH238143) and RVA/dog-tc/CHN/SCCD-A/2017/G9P[23] (MH910071)) and T14 with 60% (3/5). In the phylogenetic tree, T4, T8, T16 and T21 form a branch. On the other hand, T18 were in a branch separate from all other genotypes (Figure A11).
Among the genotypes described for NSP4, 74% (20/27 genotypes) showed a consistent distances according to our analysis (Figure 3). The 26% (7/27 genotypes) exhibited strains with low identities in a range of 0.851 to 0.63. These genotypes were E1 with 11% (216/1,952) of the strains, E2 with 87% (772/881), E3 with 48% (37/76), E4 with 33% (2/6, strains RVA/dove-wt/JPN/PO-13/2001/G18P[17] (AB009627) and RVA/VelvetScoter-tc/JPN/RK1/1989/G18P[17] (LC088105)), E7 with 4% (1/24, strain RVA/mice/USA/EC/1997/GxP[x] (U96337)), E9 with 9% (1/11, strain RVA/Pig-wt/ESP/F438/2017/G5P[19] (MH238162)) and E11 with 1% (1/103, strain RVA/Chicken-tc/xxx/BRS-115/xxx/G7P[35] (KJ725026)). Some other points to mentions, about NSP4 genotypes are that in E18 and E20 genotypes there were only two strains in each genotype, and the distance between them is out of the cutoff value (strains RVA/Rat-wt/ITA/Rat14/2015/G3P[3] (KX398368) and RVA/Rat-wt/GER/KS-11-573/2011/G3P[3] (KJ879457) for E18 and RVA/Bat-wt/CRC/KCR10-93/2010/G20P[47] (MN551607) and RVA/Human-wt/SUR/2014735512/2013/G20P[28] (KX257412) for E20). We also observed that RVA/cat-wt/JPN/FRV70/2001/G3P[3] (AB048196) and RVA/cat-wt/JPN/FRV303/2001/G3P[3] (AB048199), which belong to E3 genotype, showed low identities with all E3 strains. Phylogenetic tree shows group together between E1 and E9, between E12 and E15, between E4 and E19, E21 and 26 and between E3 and E13, E16, E17 and E24 (Figure A12).
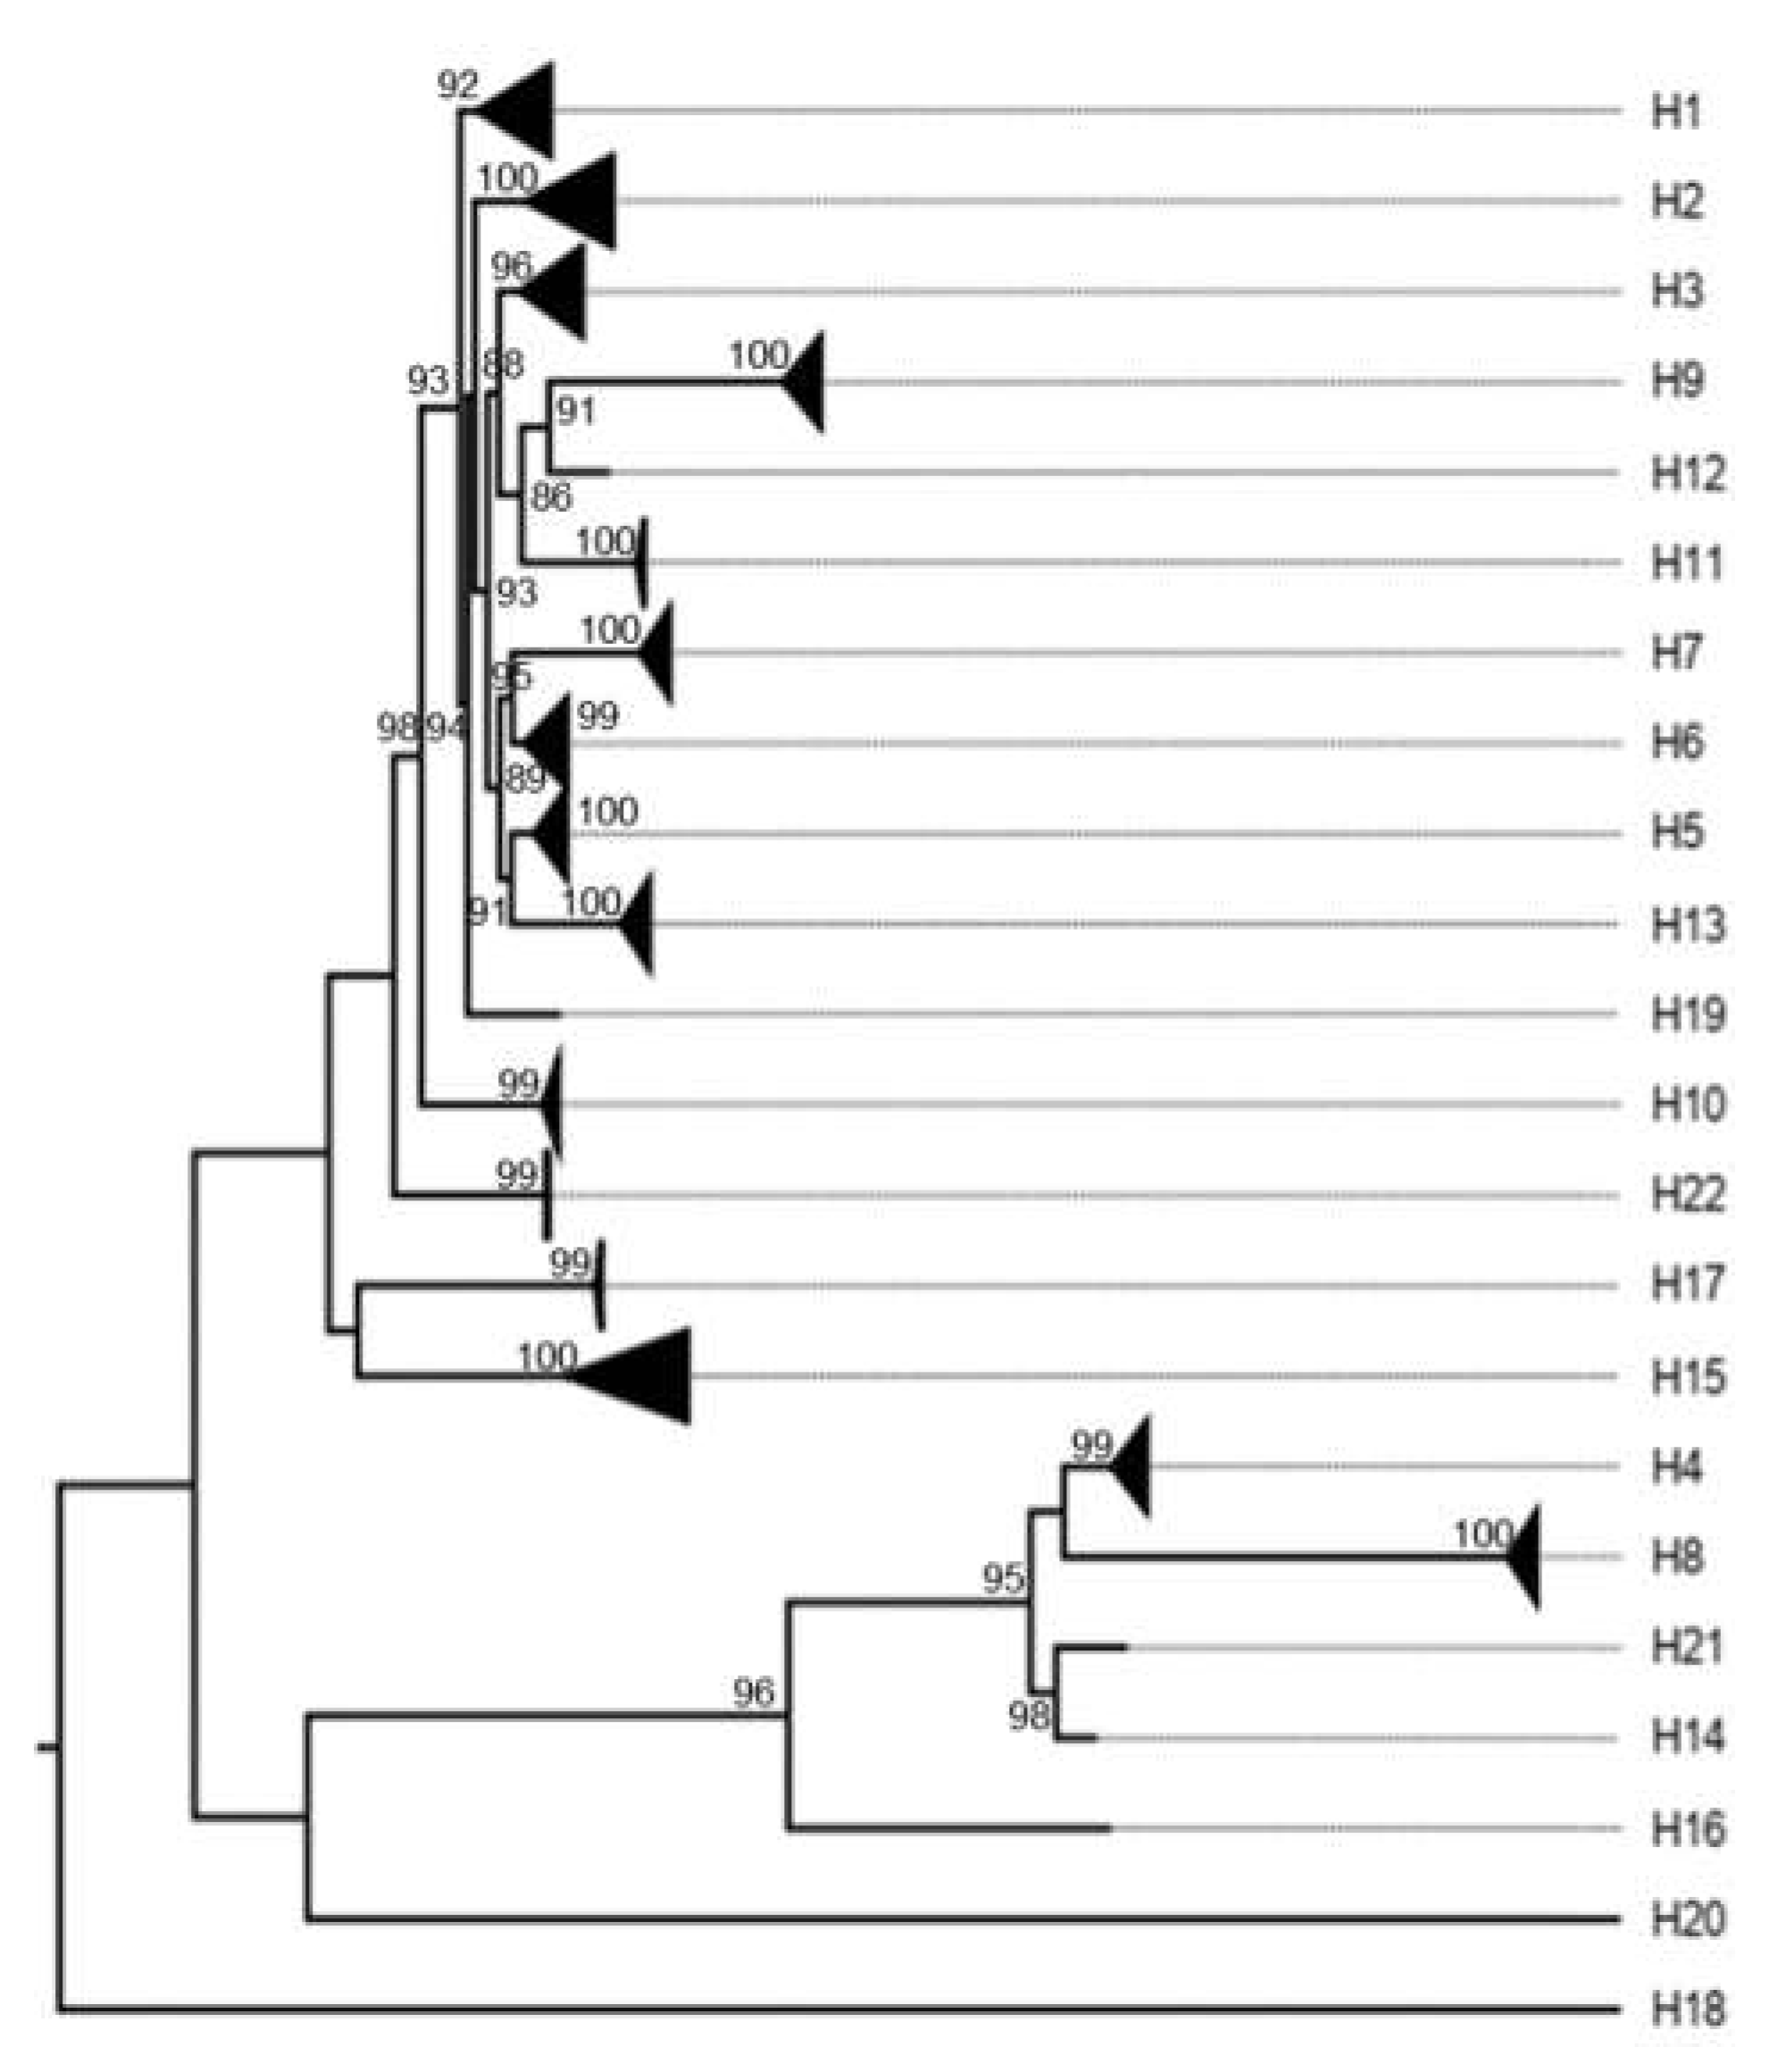
Among the genotypes described for NSP5, 77% (17/22 genotypes) showed a consistent distances according to our analysis (Figure 3). The 23% (5/22 genotypes) exhibited strains with low identities in a range of 0.911 to 0.45. These genotypes were H1 with 12% (194/1,580) of the strains, H2 with 1% (7/514), H3 with 28% (41/147), H4 with 45% (5/11), H6 with 45% (5/11) and H10 with 100% (5/5). We observed that H14 and H15 genotypes had only two strains each one and showed low identities. We also found that strain KP258408, which belongs to H3 genotype, showed distances above the cutoff value with all H3 strains. In the phylogenetic tree, we observed one branch which contains H4, H8, H14, H16 and H21, H18 in a branch separate for the others, and the rest of genotypes in another branch (Figure A13).
3.5. Comparison Between the p-Distance and K2P
We compares the of the p-Distance and K2P models. The results were summarized in Table 5. We used the cutoff value stablished by Matthijnssens et al., in 2008 to determined if K2P results were consistent.
4. Discussion
In this study we tested the classification system for all 11 RVA genome segments by constructing pairwise sequence identity profiles with p-Distance and K2P models, then conducting phylogenetic analyses using the information available to 2021. Our objective was to determine whether the current cutoff values remain up to date. Whit this purpose we selected a dataset of 26,537 strain nucleotide sequences belonging to 299 genotypes obtained from the GenBank database. We found that most genotypes (99.4%) for each gene segment exhibited high consistency of their cutoff value based on the analysis and only a small percentage of genotypes showed strains with identities out of the cutoff value (0.63% of strains).
4.1. p-Distance Model vs. K2P
The established genotyping system demonstrated high efficacy in classifying rotavirus strains. A total of 93.4% of the genotypes (20/299) exhibited cutoff values consistent with those analyzed using the p-distance model, suggesting that the current classification framework remains applicable for most RVA genes. Additionally, 6.6% of the strains had 99% of their values aligned with the established cutoffs. Table 5 summarizes the performance of the p-distance model for classification purposes. This model effectively distinguishes nearly all RVA strains in their respective genotypes, even with limited sequence information this model uses. All the evidence we found indicated that p-distance model is more suitable for classification compared to other models (K2P), as the classification performance based on the p-distance model was superior than K2P, shown in Figure 2 and Figure 3.
4.2. K2P Model
The strains analyzed with K2P and the other models, indicate the presence of genetic variations, this could be originated by point mutations or other mechanism [33]. Phylogenetic analysis provided additional insights into the evolutionary relationships of the genotypes [6]. In some cases, the phylogenetic trees confirmed the monophyletic nature of the genotypes [31,34], while in others, the trees revealed polyphyletic or heterogeneous clustering, suggesting the existence of distinct lineages within those genotypes and also genotypes that fall inside other genotypes, then becoming lineages in a prior genotype as the case of G3 with G14 which are more closely related to each other serologically than different genotypes usually are [35]. Other genotypes phylogenetically closely related are G13, G16 and G29, P[13] with P[22], N2 with N9, N3 with N5, N10 with N6, E1 and E9, E12 and E15, E3 with E13, E8, E16, E17 and E24, E4 with E19, E21 and E26. Antigenic analysis as virus neutralization test could be carry out in order to response these questions, at least for VP7 and VP4.
The viral proteins (VP) and the non-structural proteins (NPS) will be discus in the order from the simplest to the most complex to analyze.
4.2.1. Proteins Forming the Triple Layer Particles
Only three VP6 genotypes demonstrated low identities: I2, I3, and I12. Many studies use the phylogeny to identify the genotype of VP6 strains in combination with the pair idienties, and high identities were observed [36,37,38,39,40,41,42,43,44].
VP1, VP2 and VP3 show close relationships between the strains belonging to each genotype. The phylogentic tree show that no polyphyletic groups are present.
VP7 presents only four genotypes (G3, G6, G8, and G10) with low identities. We identify G3 as a poliphyletic group, in accordance with previous studies [42,44,45]. A molecular analysis to examine the genetic variation within the VP7 of 27 G3 human and animal rotavirus strains was performed more than three decades ago by Nishikawa et al., 1989 and showed an overall sequence identity of 85% or higher [31]. A higher degree of overall VP7 sequence similarity was observed among strains from the same animal species when compared to strains from different animal species, suggesting that were VP7 species-specific sequences. Moreover, VP7 serotype-specific regions, where genetic variation was identified among strains of different serotypes were highly conserved among G3 from the same species [31]. Furthermore, Nishikawa et al. found that varying reactivities of anti-VP7 monoclonal antibodies with 27 strains studied was consistent with the occurrence of antigenic variation among serotype 3 strains. The corresponding phylogenetic tree suggested that G3 rotavirus strains from different animal species were more closely related to each other than to rotavirus strains of different G genotypes [31]. This finding poses the query regarding the classification of this strains. The phylogenetic analysis is a useful supporting tool for the classification for all genotypes except G3, which is the most variable genotype.
Notably, prior research identified three lineages within G5 [46] using 28 strains, while our study, encompassing 48 strains, reaffirms the monophyletic nature of G5. Various studies have explored VP7 genotypes and strains (G6, G5, G3, G8, G9, G12), primarily for classification purposes [36,38,40,43,45,47,48,49]. Interestingly, a previous study tentatively designated some G3 strains exceeding the cutoff value as G16 [6]. However, our findings identify distinct strains – both human and porcine variants – then G16 must be subjected to further studies to determine the evolutionary relationship with G3. Additionally, G6 displayed substantial intragenotype diversity in prior studies, were 5 lineages were observed, including G15 as a lineage of G6 and not a separated G-type [39].
Concerning VP4, only four genotypes (P[1], P[3], P[13], and P[14]) possesses strains with low identities. These strains share a monophyletic origin within the phylogenetic tree, with the exception of P[13]. Other studies focused in P[3] [40,44] and P[13] [39,42,45] did not find any subgroups or polyphyletic origin for these genotypes. The exclusion of identities between closely related P[4] and P[8] genotypes, consistent with the methodology employed by Matthijnssens in 2008 [4], who find identities between P[8] and P[4] ranged from 84% to 89%, completely above the 80% cutoff value, reinforcing the idea that P[8] and P[4] are not only closely related P genotypes but are also subtypes corresponding to the distinct serotypes P1A and P1B, respectively, which were initially thought to be part of a single P serotype (P1) in turn of one serotype (P1) [50,51,52]. This exclusion significantly influences the accurate classification of new segments. Prior research has extensively investigated P[4] and P[8] genotypes, along with their respective alleles, contributing valuable insights to the understanding of these genomic elements [36,37,40,43,49].
4.2.2. Nonstructural Proteins
NSP5 exhibits the highest cutoff among all RVA genes, this depicts that is the most conserved gene. We found that 5 out of 22 genotypes possesses strains with low identities. Specifically, genotypes H1 and H2 exhibited 12% and 1% of their strains, respectively, with high genetic distances. H10 need further analysis, because the identities that exhibit their sequences are lower than 0.78. Previous studies did not find polyphyletic origin or groups within this genotype [37,38,39,40,42,43,44].
Concerning NSP3, 6 genotypes (27%) showed low identities. Of these, T3 with 77% (54/70), T4 with 60% (6/10), T6 with 80% (65/81). Further evolutionary analysis is needed to determine why many strains of this gene showed low identities. Previous studies did not find polyphyletic origin or groups within this genotype, possibly because the low number of strains used [37,38,39,40,42,43,44].
In the case of NSP1, we found a large peak of inter genotypes pair identities (between 0.62 and 0.80 in Figure 3). NSP1´s cutoff stands at 0.79, the lowest among all genes, being the most variable of the 11 genes. This gene also needs deeper evolutionary analysis. Previous studies were conducted in NSP1 to compare local strains with other, but no polyphyletic groups were observed [37,38,39,40,42,43,44,49].
Previous studies used the classification system with NSP2, but did not find polyphyletic origin or groups within this genotype [37,38,39,40,42,43,44]. This could be due to these works has classification purposes, and just a few strains were used.
Concerning NSP4, three genotypes, E1, E2, and E3, comprise numerous strains with low identities. This gene presents high variability and the phylogenetic three show three polyphyletic groups: E3, E10 and E12. It shows that these strains are closely related and the genotypes are changing over time. Previous study conducted on NSP4 find that is a monophyletic group [36,37,38,39,40,41,42,43,44].
Overall, as new strains are sequenced and more genetic data become available it is importance of regularly check and update the classification system for RVA classification. It is crucial to reassess the cutoff values and refine the classification system to accurately reflect the genetic diversity and evolutionary relationships of the rotavirus strains when is needed [6].
Additional investigations are imperative to explore strains with high genetic distances and assess whether these strains are diverging into novel subtypes (lineages). A more in-depth analysis of the evolutionary path for specific strains, such as G3 with G13, G14, G16 and G29, P[13] with P[22], N2 with N9, N3 with N5, N10 with N6, E1 and E9, E12 and E15, E3 with E13, E8, E16, E17 and E24, E4 with E19, E21 and E26. The rationale behind this inquiry is rooted in the observation that all these genotypes harbor strains with low identities, and the phylogenetic analysis indicates their inclusion within other genotypes. This nuanced exploration will contribute to a deeper understanding of the genetic diversity and relationships among these strains, potentially leading to the identification of novel genotypic distinctions or subtypes.
Additionally, ongoing surveillance and sequencing efforts will continue to contribute to our understanding of rotavirus evolution and the impact of vaccination on strain diversity [6,15,53,54]. This study employed a large dataset of rotavirus nucleotide sequences to investigate the genotype diversity and evolutionary relationships of various gene segments. The analysis revealed variations in genotype diversity among different genes, with VP7 and VP4 showing the highest diversity as expected for the neutralizing antigens of the virus. It is remarkable the consistency with the established cutoff values that have served as an excellent tool for RVA classification over the last fifteen years.
5. Conclusions
In conclusion, the application of this classification system to numerous rotavirus strains enabled precise differentiation of all genotypes within each gene, tracking their divergence along distinct evolutionary paths. Moreover, the system facilitates the detection of multiple reassortment events and interspecies transmission, allowing to trace the origins of this variability and identify the parental strains of emerging variants, whether of human or animal origin. Our study provides valuable insights into the classification system of rotavirus genotypes by testing its robustness and examining the evolving landscape of rotavirus strains.
Supplementary Materials
The following supporting information can be downloaded at the website of this paper posted on Preprints.org. Strains with distances out of the cutoff value.
Author Contributions
Conceptualization, S.M. and V.P.; Methodology, E.G.Q., K.A.S. and S.M.; Validation, R.G.D.A.; Formal Analysis, S.M., D.J.L. and R.G.D.A.; Investigation, E.G.Q, R.G.D.A.; Data Curation, E.G.Q., R.G.D.A.; Writing—Original Draft Preparation, R.G.D.A. and K.A.S. Writing—Review and Editing, S.M., Liotta D.J.L., R.G.D.A. and V.P.; Visualization, S.M., D.J.L. and R.G.D.A.; Supervision, V.P., S.M. and D.J.L.; Project Administration, S.M. and V.P.; Funding Acquisition, D.J.L. All authors have read and agreed to the published version of the manuscript.
Funding
This research was funded by CONICET grant, Instituto Nacional de Tecnología Agropecuaria (INTA) PE-I044, RIST-111 and APC waive was given.
Institutional Review Board Statement
Not applicable.
Informed Consent Statement
Not applicable.
Data Availability Statement
Not applicable.
Acknowledgments
Thanks to Jonathan Aguilera and Analía Sanchez for collaboration in the data analysis and to Jelle Matthijnssens, Ulrich Desselberger and Max Ciarlet for reviewing the draft.
Conflicts of Interest
The authors declare no conflict of interest.
Appendix A

Table A1.
Base frequency and substitution rate of all sequences included in this study for each protein and the average values. The substitution rate for each pair of nucleotides was calculated. The evolution model used to construct the trees and the distance matrix. The gamma parameter used to correct the variation in the rate of substitution were estimated with Bootstrap resampling with 1,000 replicates to assess statistical robustness.
| Base frequency and substitution rate of all genes and evolution models suggested by MegaX. | |||||||||||||
| Gene | Base frequency % | Nucleotide substitution frequencies | Evolution Model* | Gamma parameter | |||||||||
| G | A | T | C | G - T | G - A | G - C | A - T | A - C | T - C | Tree | Distance Matrix | ||
| VP7 | 31 | 36 | 18 | 15 | 1 | 9.2 | 1.0 | 0.8 | 1.6 | 11.1 | GTR + F + R8 | Kimura 2-parameter | 4 |
| VP4 | 30 | 37 | 18 | 15 | 1 | 9.5 | 1.2 | 0.7 | 1.9 | 12.2 | GTR + F + R7 | Kimura 2-parameter | 4 |
| VP6 | 30 | 34 | 19 | 17 | 1 | 12.6 | 0.7 | 0.9 | 2.0 | 16.3 | GTR + F + R5 | Kimura 2-parameter | 4 |
| VP1 | 30 | 38 | 17 | 15 | 1 | 14.0 | 0.9 | 0.6 | 2.0 | 20.7 | GTR + F + R10 | Kimura 2-parameter | 4 |
| VP2 | 29 | 38 | 18 | 15 | 1 | 14.3 | 0.9 | 0.8 | 2.2 | 22.3 | GTR + F + R8 | Kimura 2-parameter | 4 |
| VP3 | 32 | 38 | 16 | 14 | 1 | 14.3 | 1.0 | 0.5 | 2.0 | 20.7 | GTR + F + R10 | Kimura 2-parameter | 4 |
| NSP1 | 37 | 17 | 33 | 13 | 1 | 10.0 | 1.1 | 0.5 | 2.1 | 14.4 | GTR + F + R10 | Tamura 3-parameter | 0.88 |
| NSP2 | 37 | 18 | 31 | 14 | 1 | 12.0 | 0.7 | 0.7 | 1.9 | 16.5 | GTR + F + R10 | Tamura 3-parameter | 0.48 |
| NSP3 | 38 | 19 | 31 | 12 | 1 | 10.9 | 1.0 | 0.6 | 2.0 | 17.4 | GTR + F + R10 | Tamura 3-parameter | 0.56 |
| NSP4 | 39 | 19 | 27 | 15 | 1 | 8.0 | 0.5 | 0.6 | 1.0 | 10.6 | GTR + F + R10 | Tamura-Nei | 0.72 |
| NSP5 | 35 | 19 | 29 | 17 | 1 | 8.8 | 0.8 | 0.9 | 1.6 | 10.4 | GTR + F + R10 | Tamura 3-parameter | 0.51 |
| Average | 33.5 | 28.5 | 23.4 | 14.7 | 1.0 | 11.2 | 0.9 | 0.7 | 1.9 | 15.7 | |||
| * The evolutionary model used to construct the phylogenetic tree or the distance matrix. | |||||||||||||
Figure A2.
Genotype composition for each gene. It shows that genotype 1 and 2 are often the most numerous, except for VP7 and VP4.
Figure A2.
Genotype composition for each gene. It shows that genotype 1 and 2 are often the most numerous, except for VP7 and VP4.
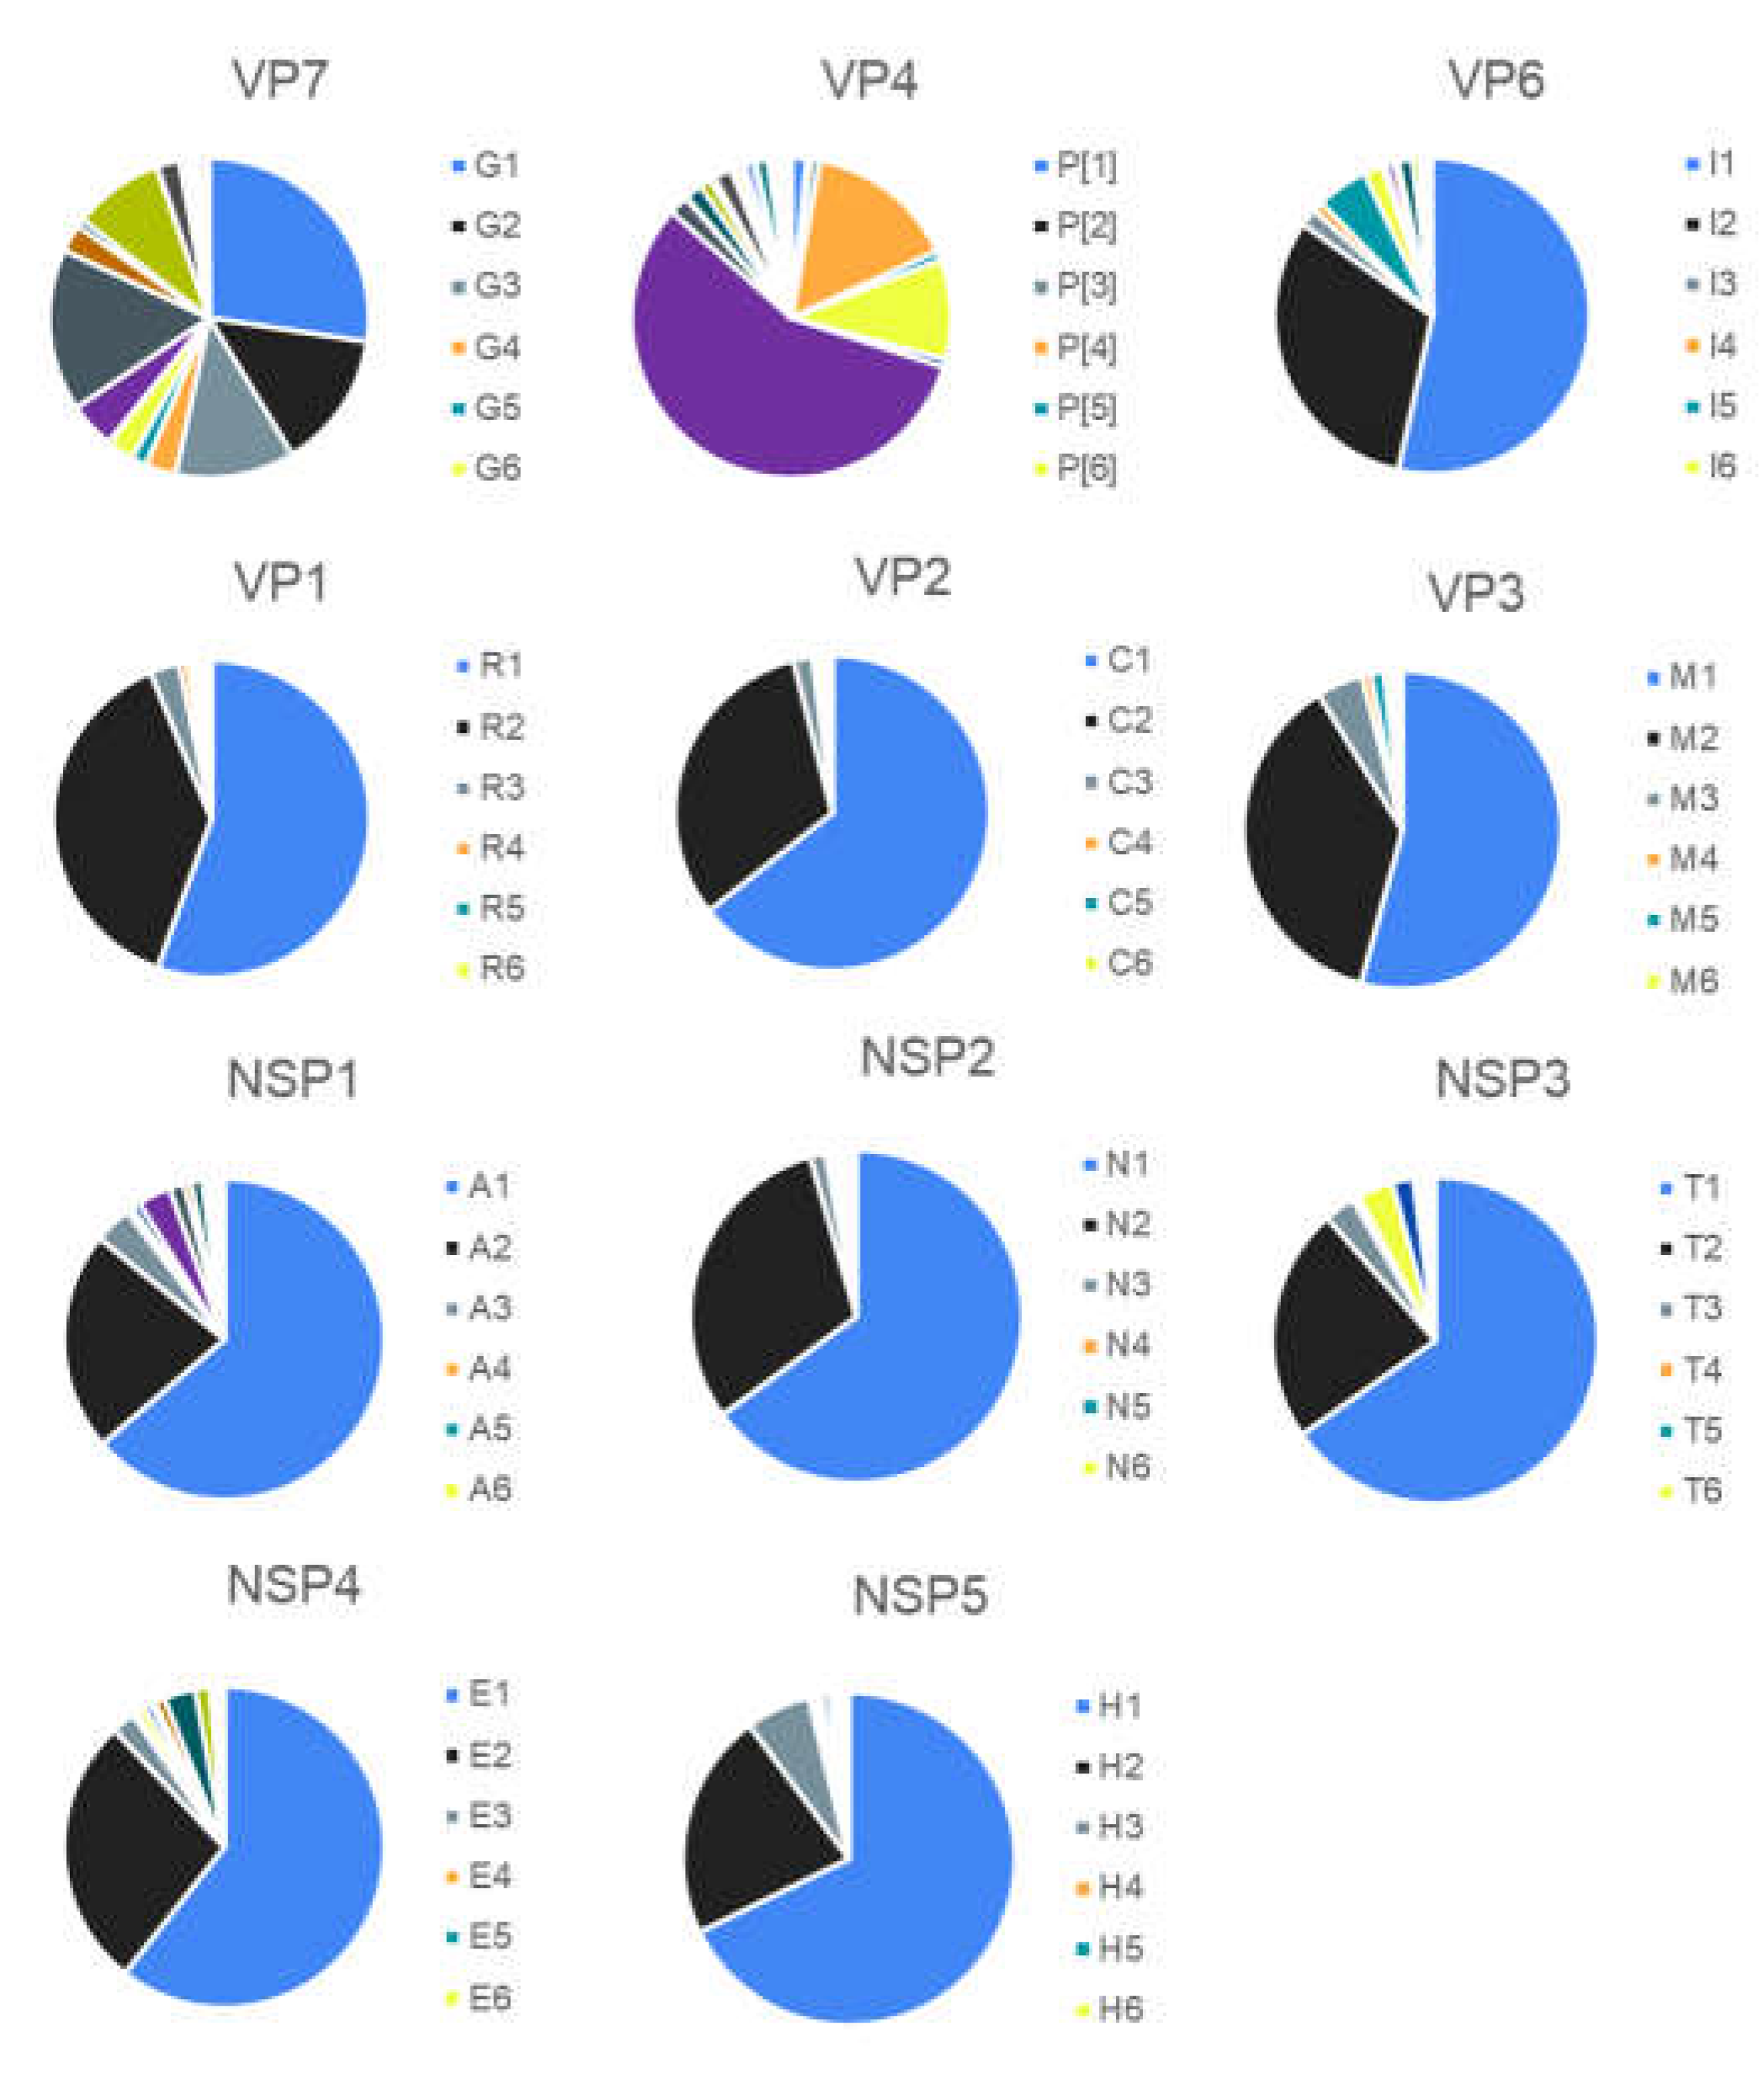
Figure A3.
VP7 Middle point rooted phylogenetic tree. G3 showed two principal branches, G3-A with close phylogenetic relationships with G16 and G29 and, G3-B related to G13 and G14,.
Figure A3.
VP7 Middle point rooted phylogenetic tree. G3 showed two principal branches, G3-A with close phylogenetic relationships with G16 and G29 and, G3-B related to G13 and G14,.
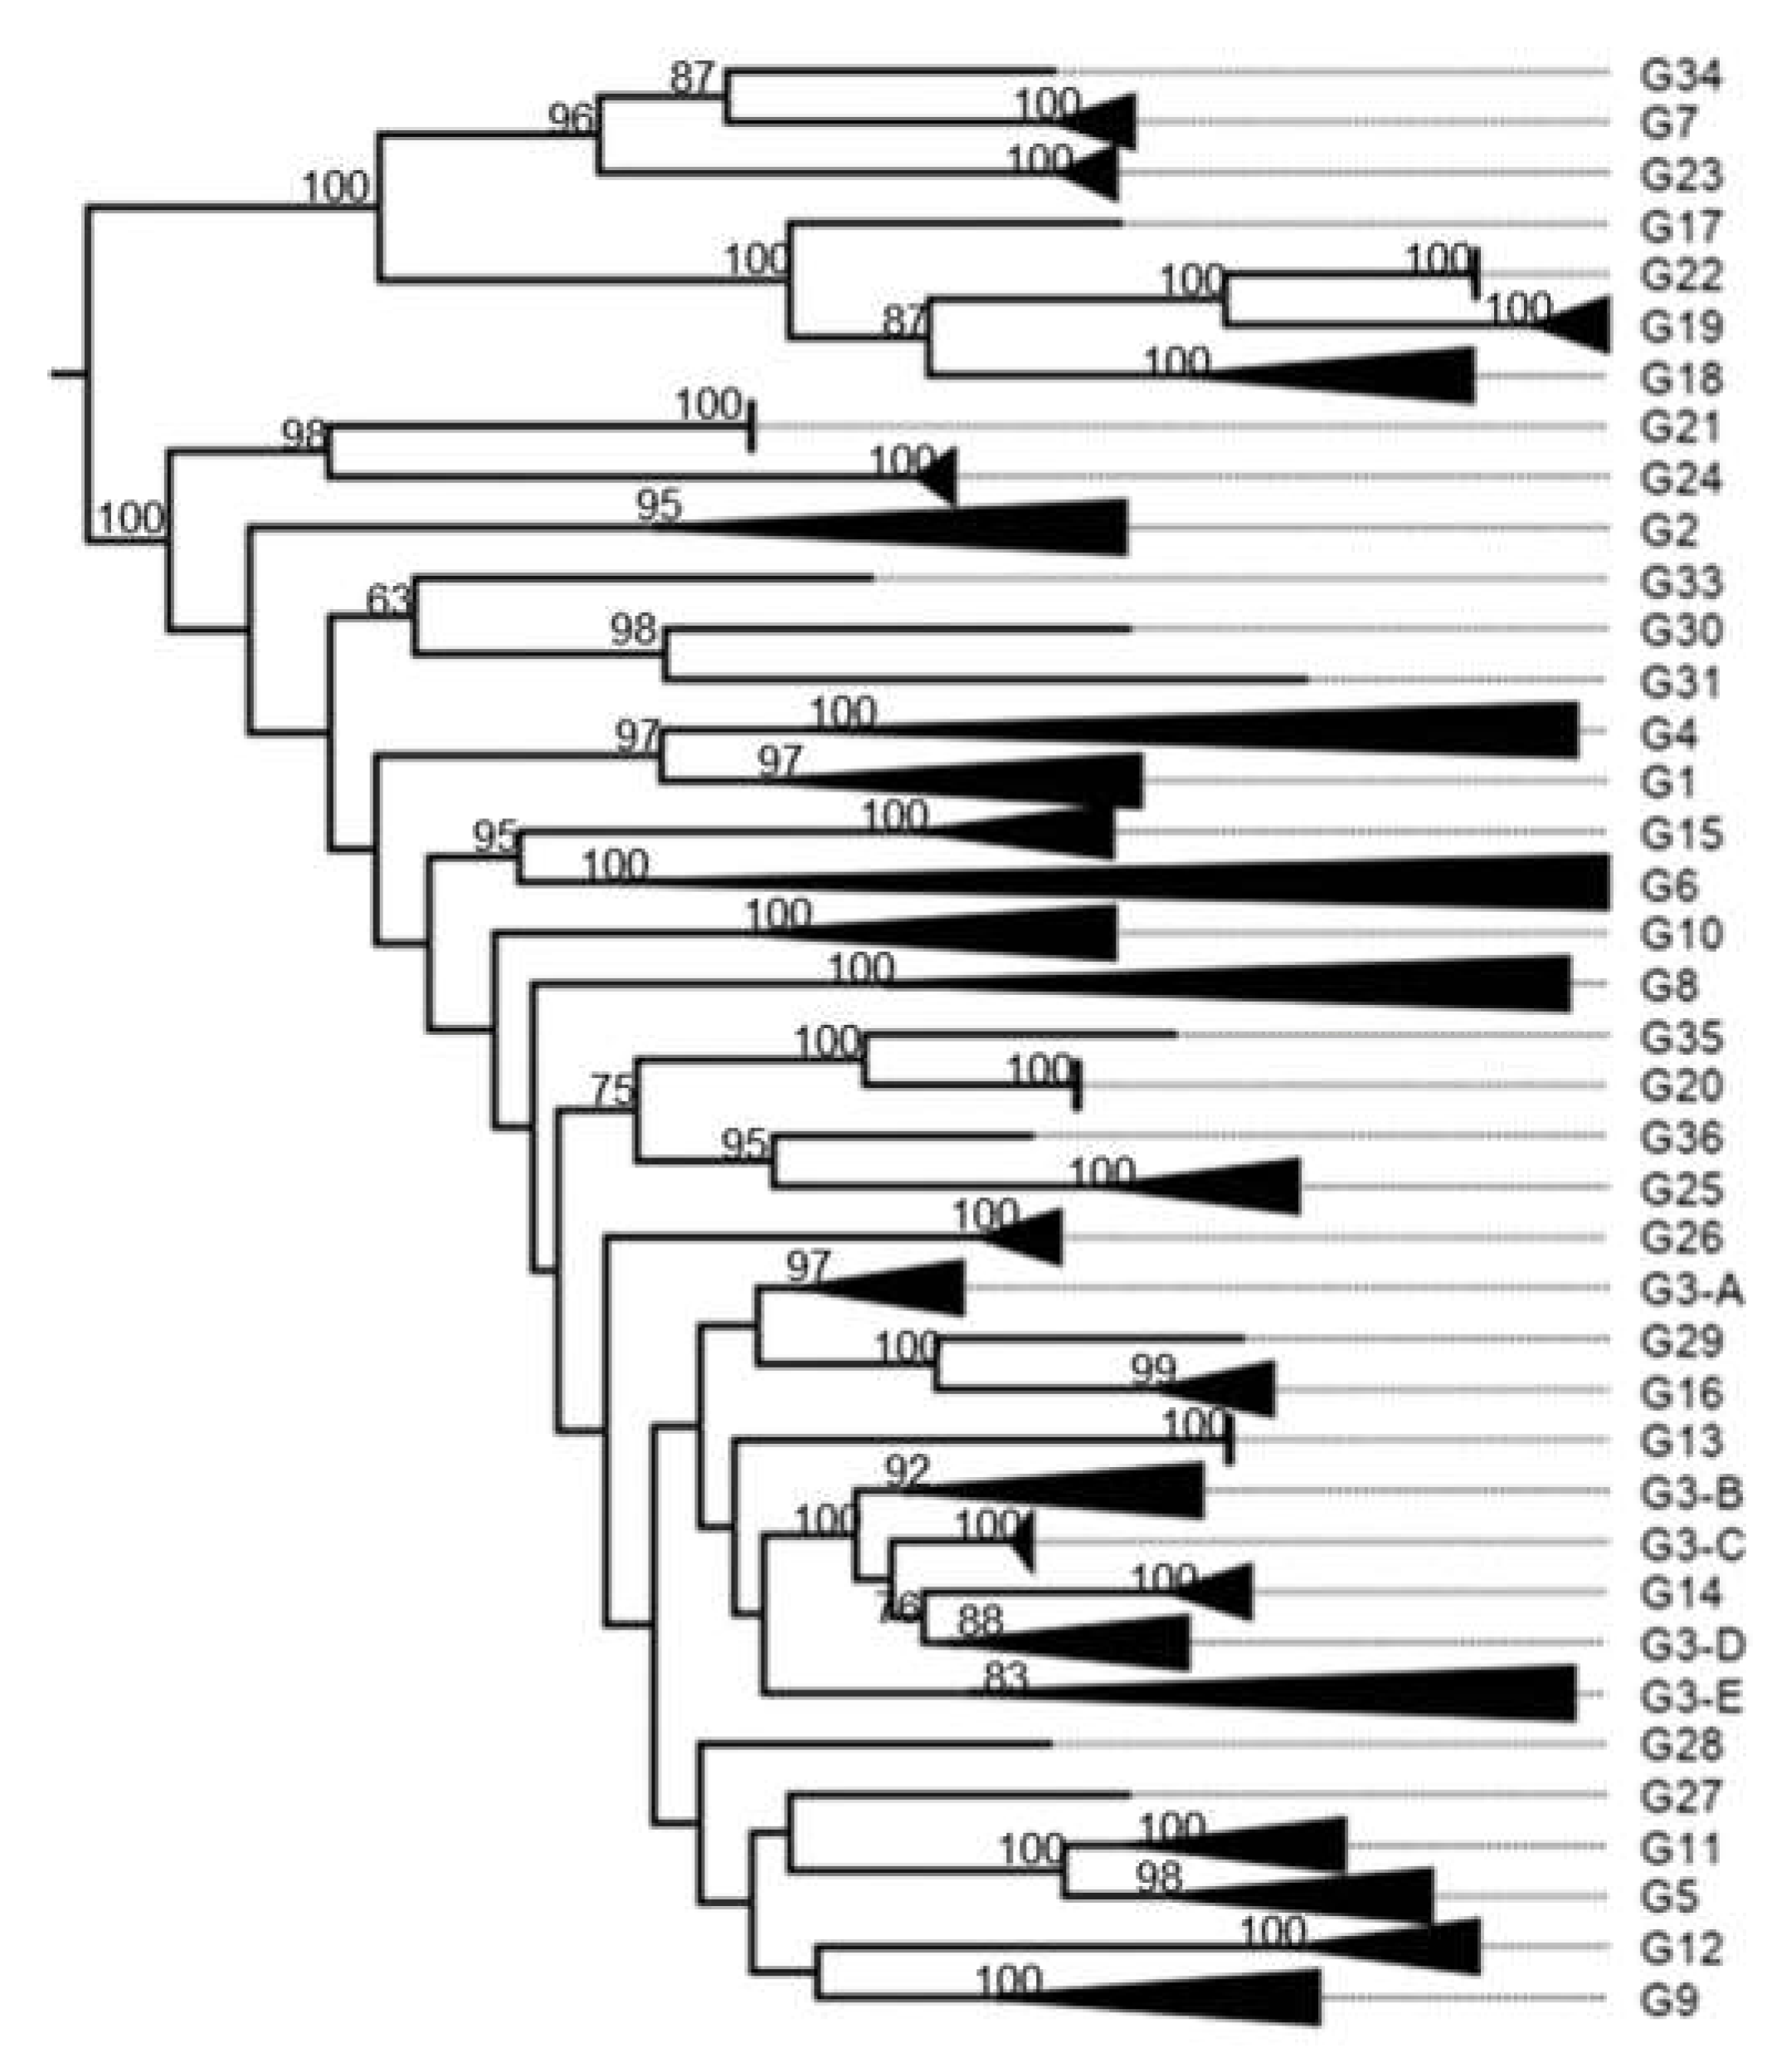
Figure A4.
VP4 Middle point rooted phylogenetic tree. P[13] showed close relationships with P[22] and P[41].
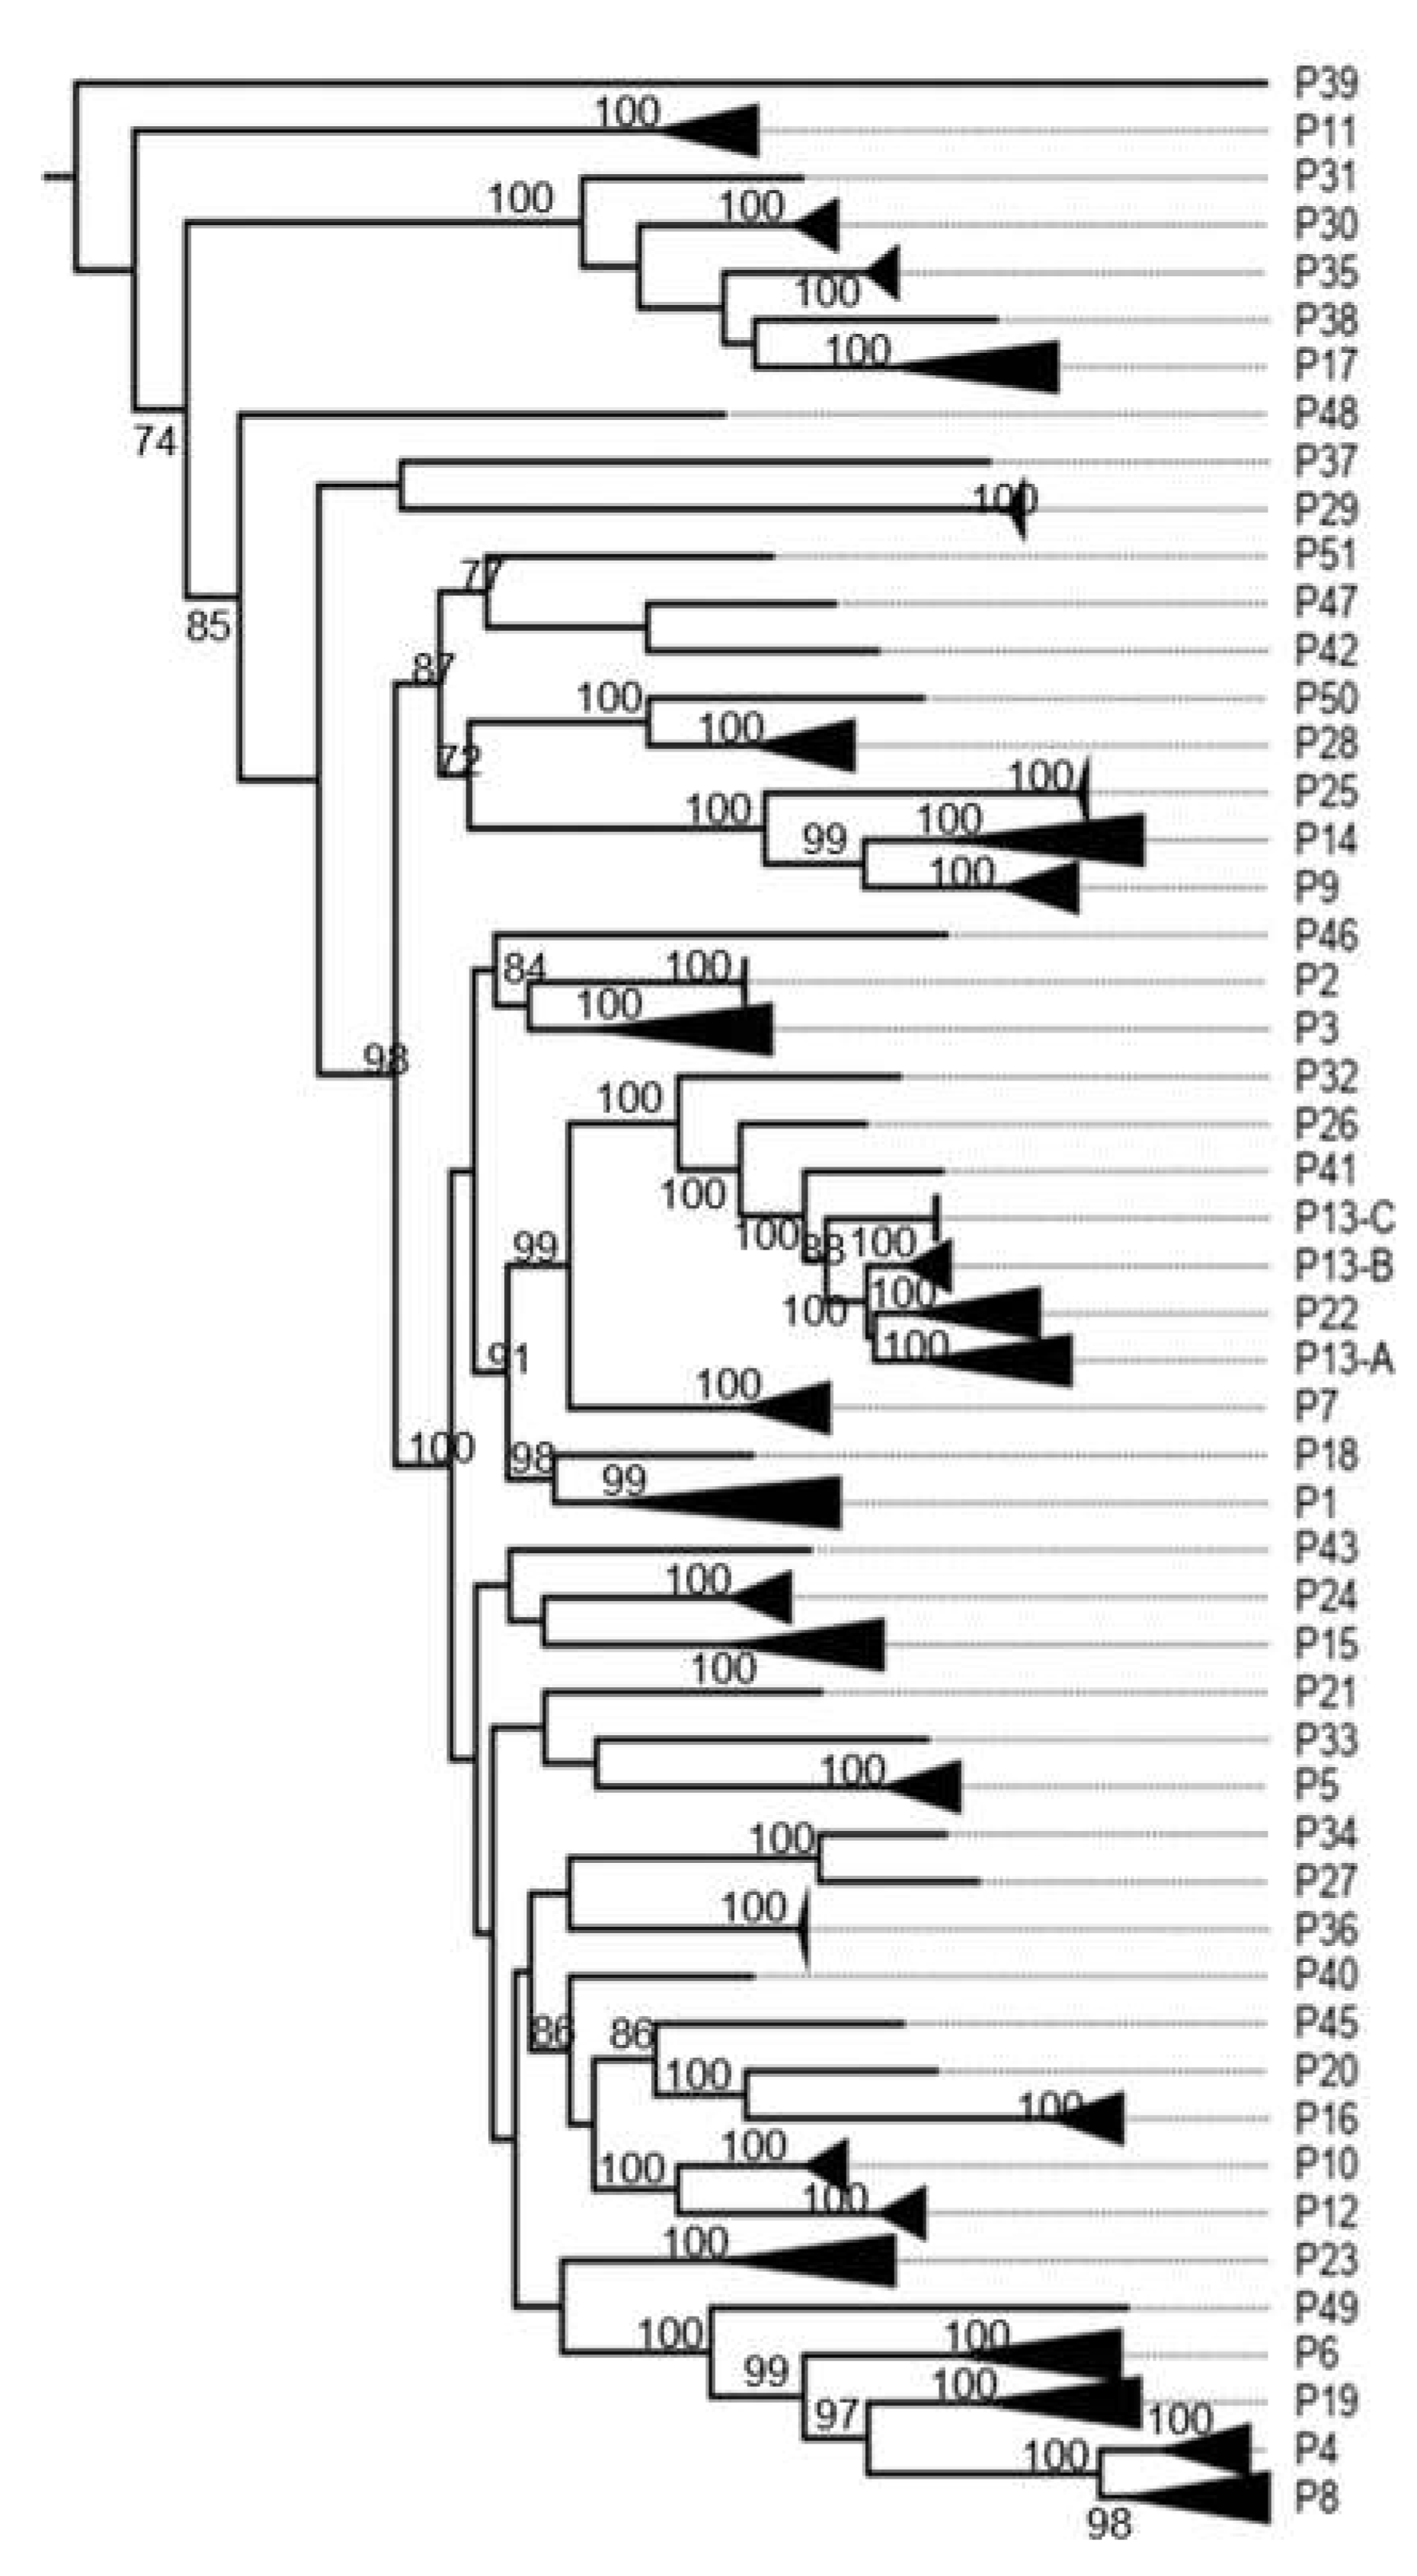
Figure A5.
VP6 Middle point rooted phylogenetic tree.
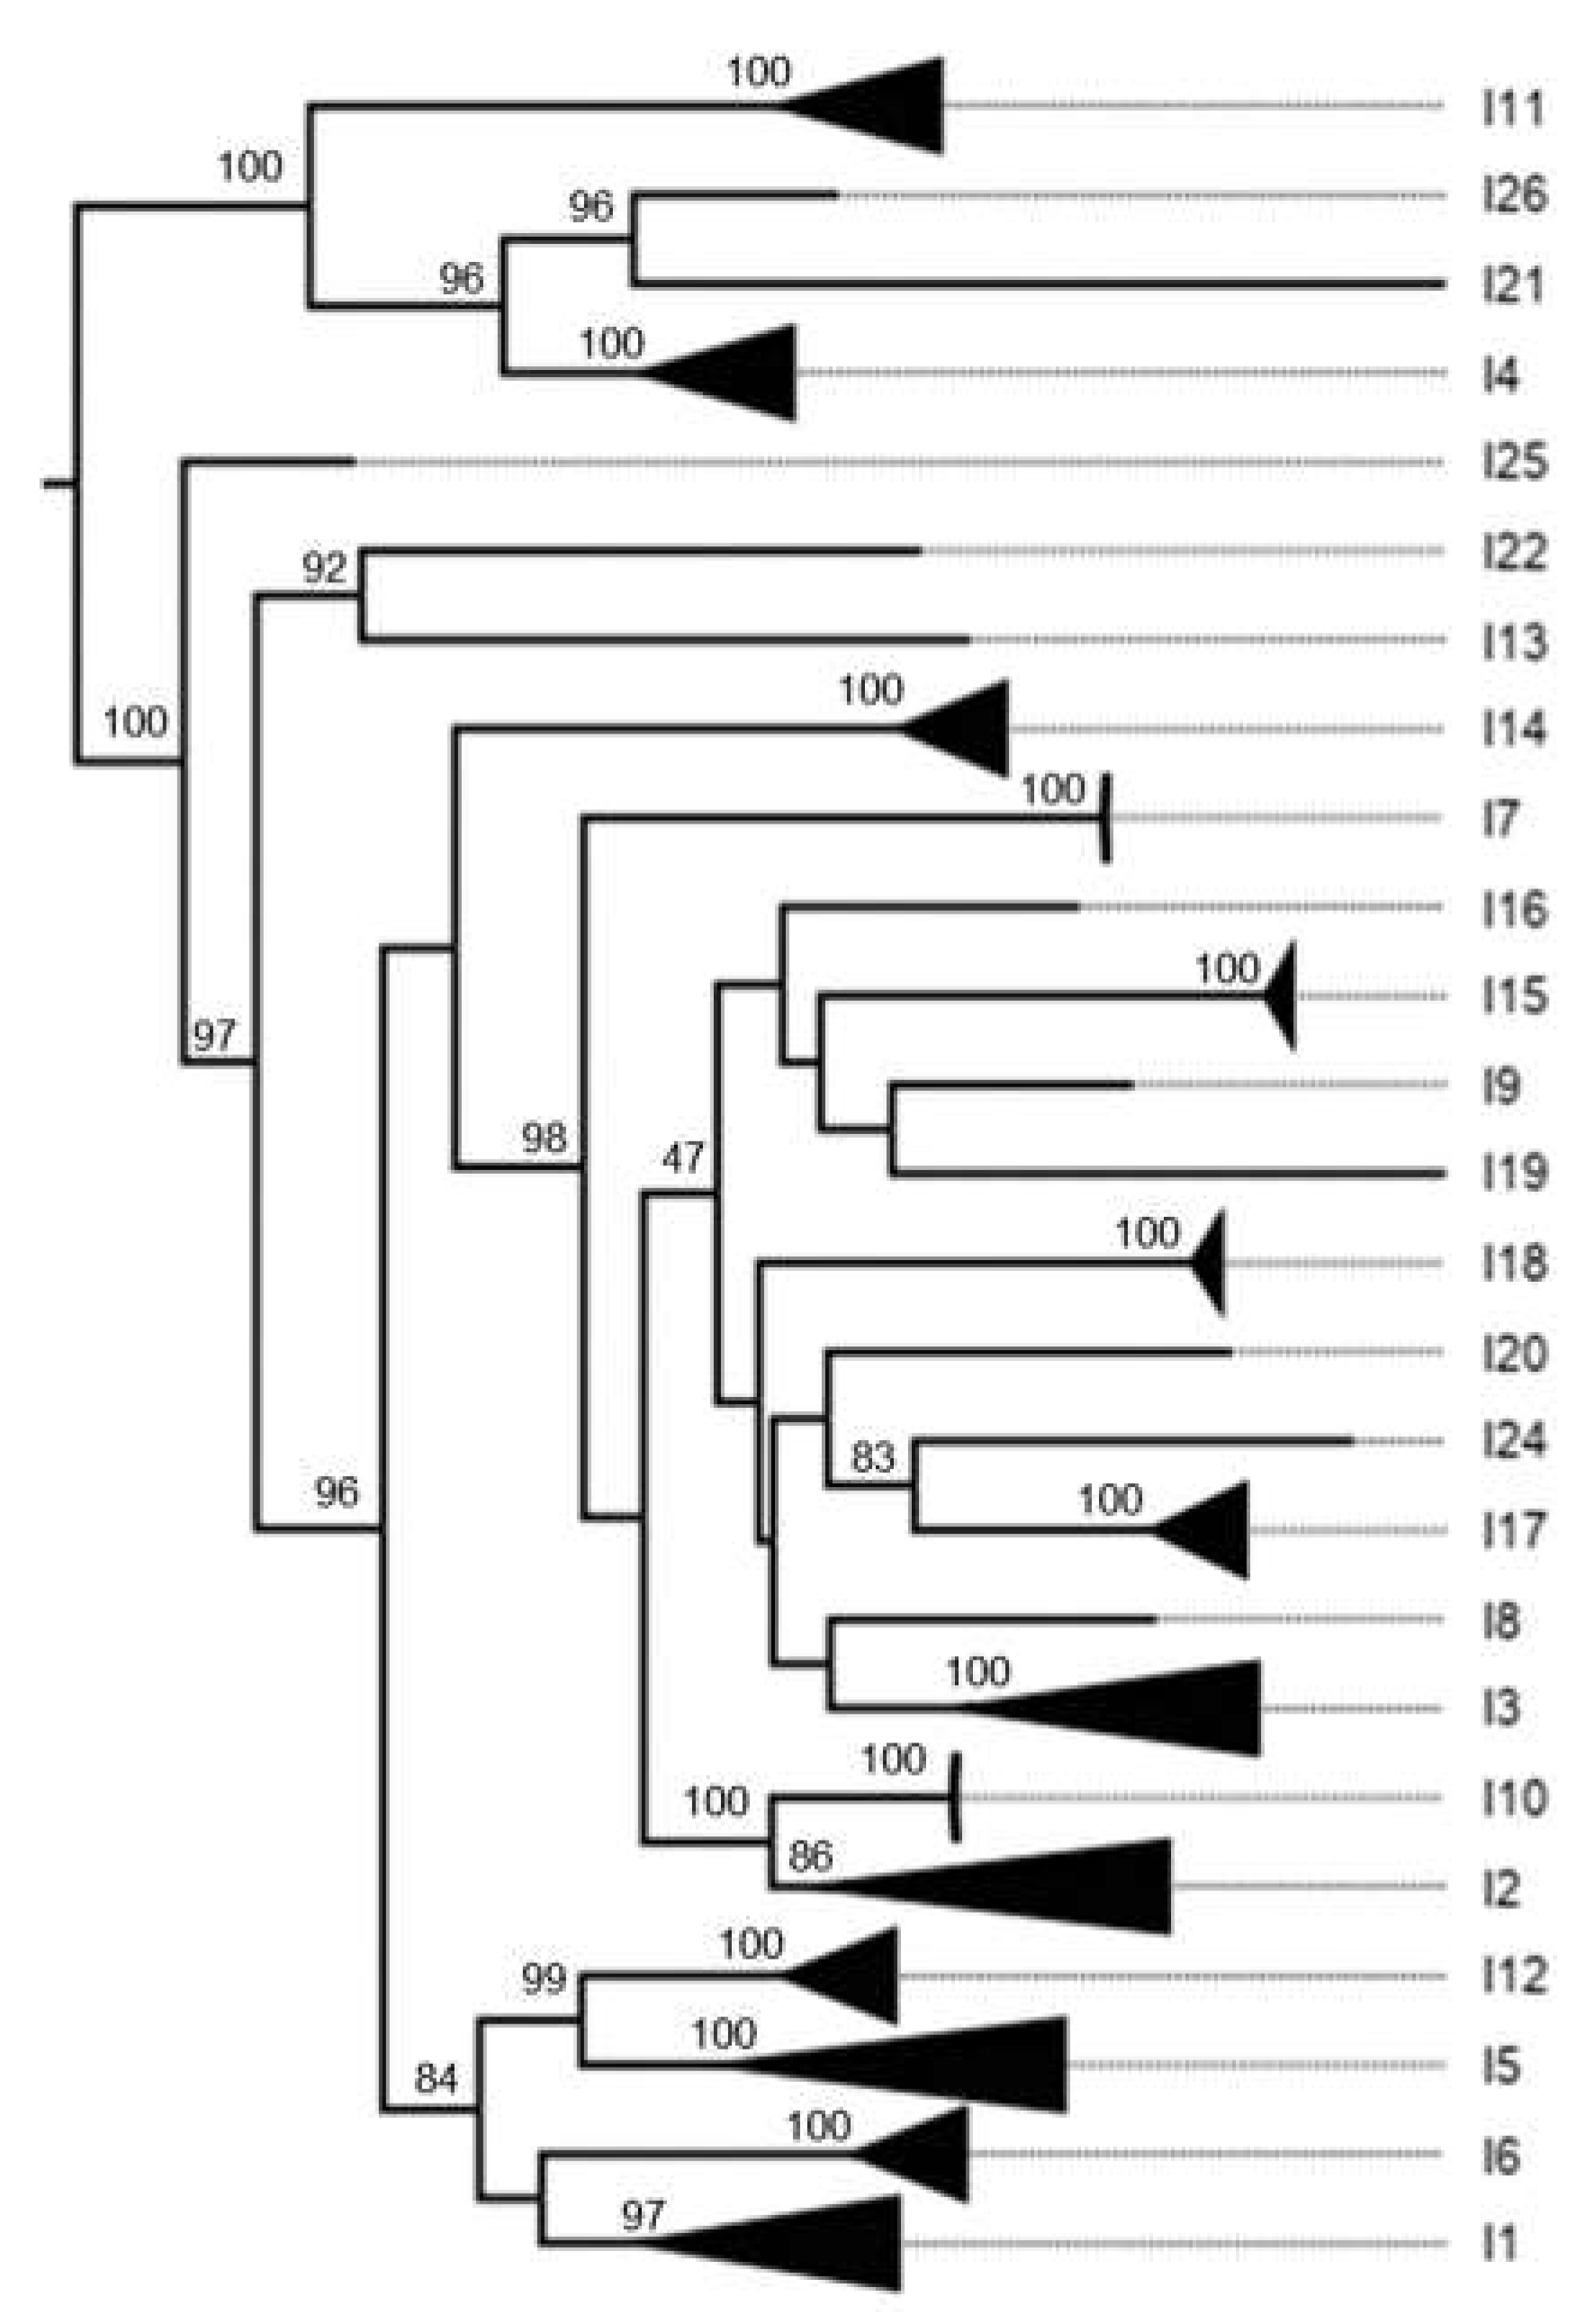
Figure A6.
VP1 Middle point rooted phylogenetic tree.
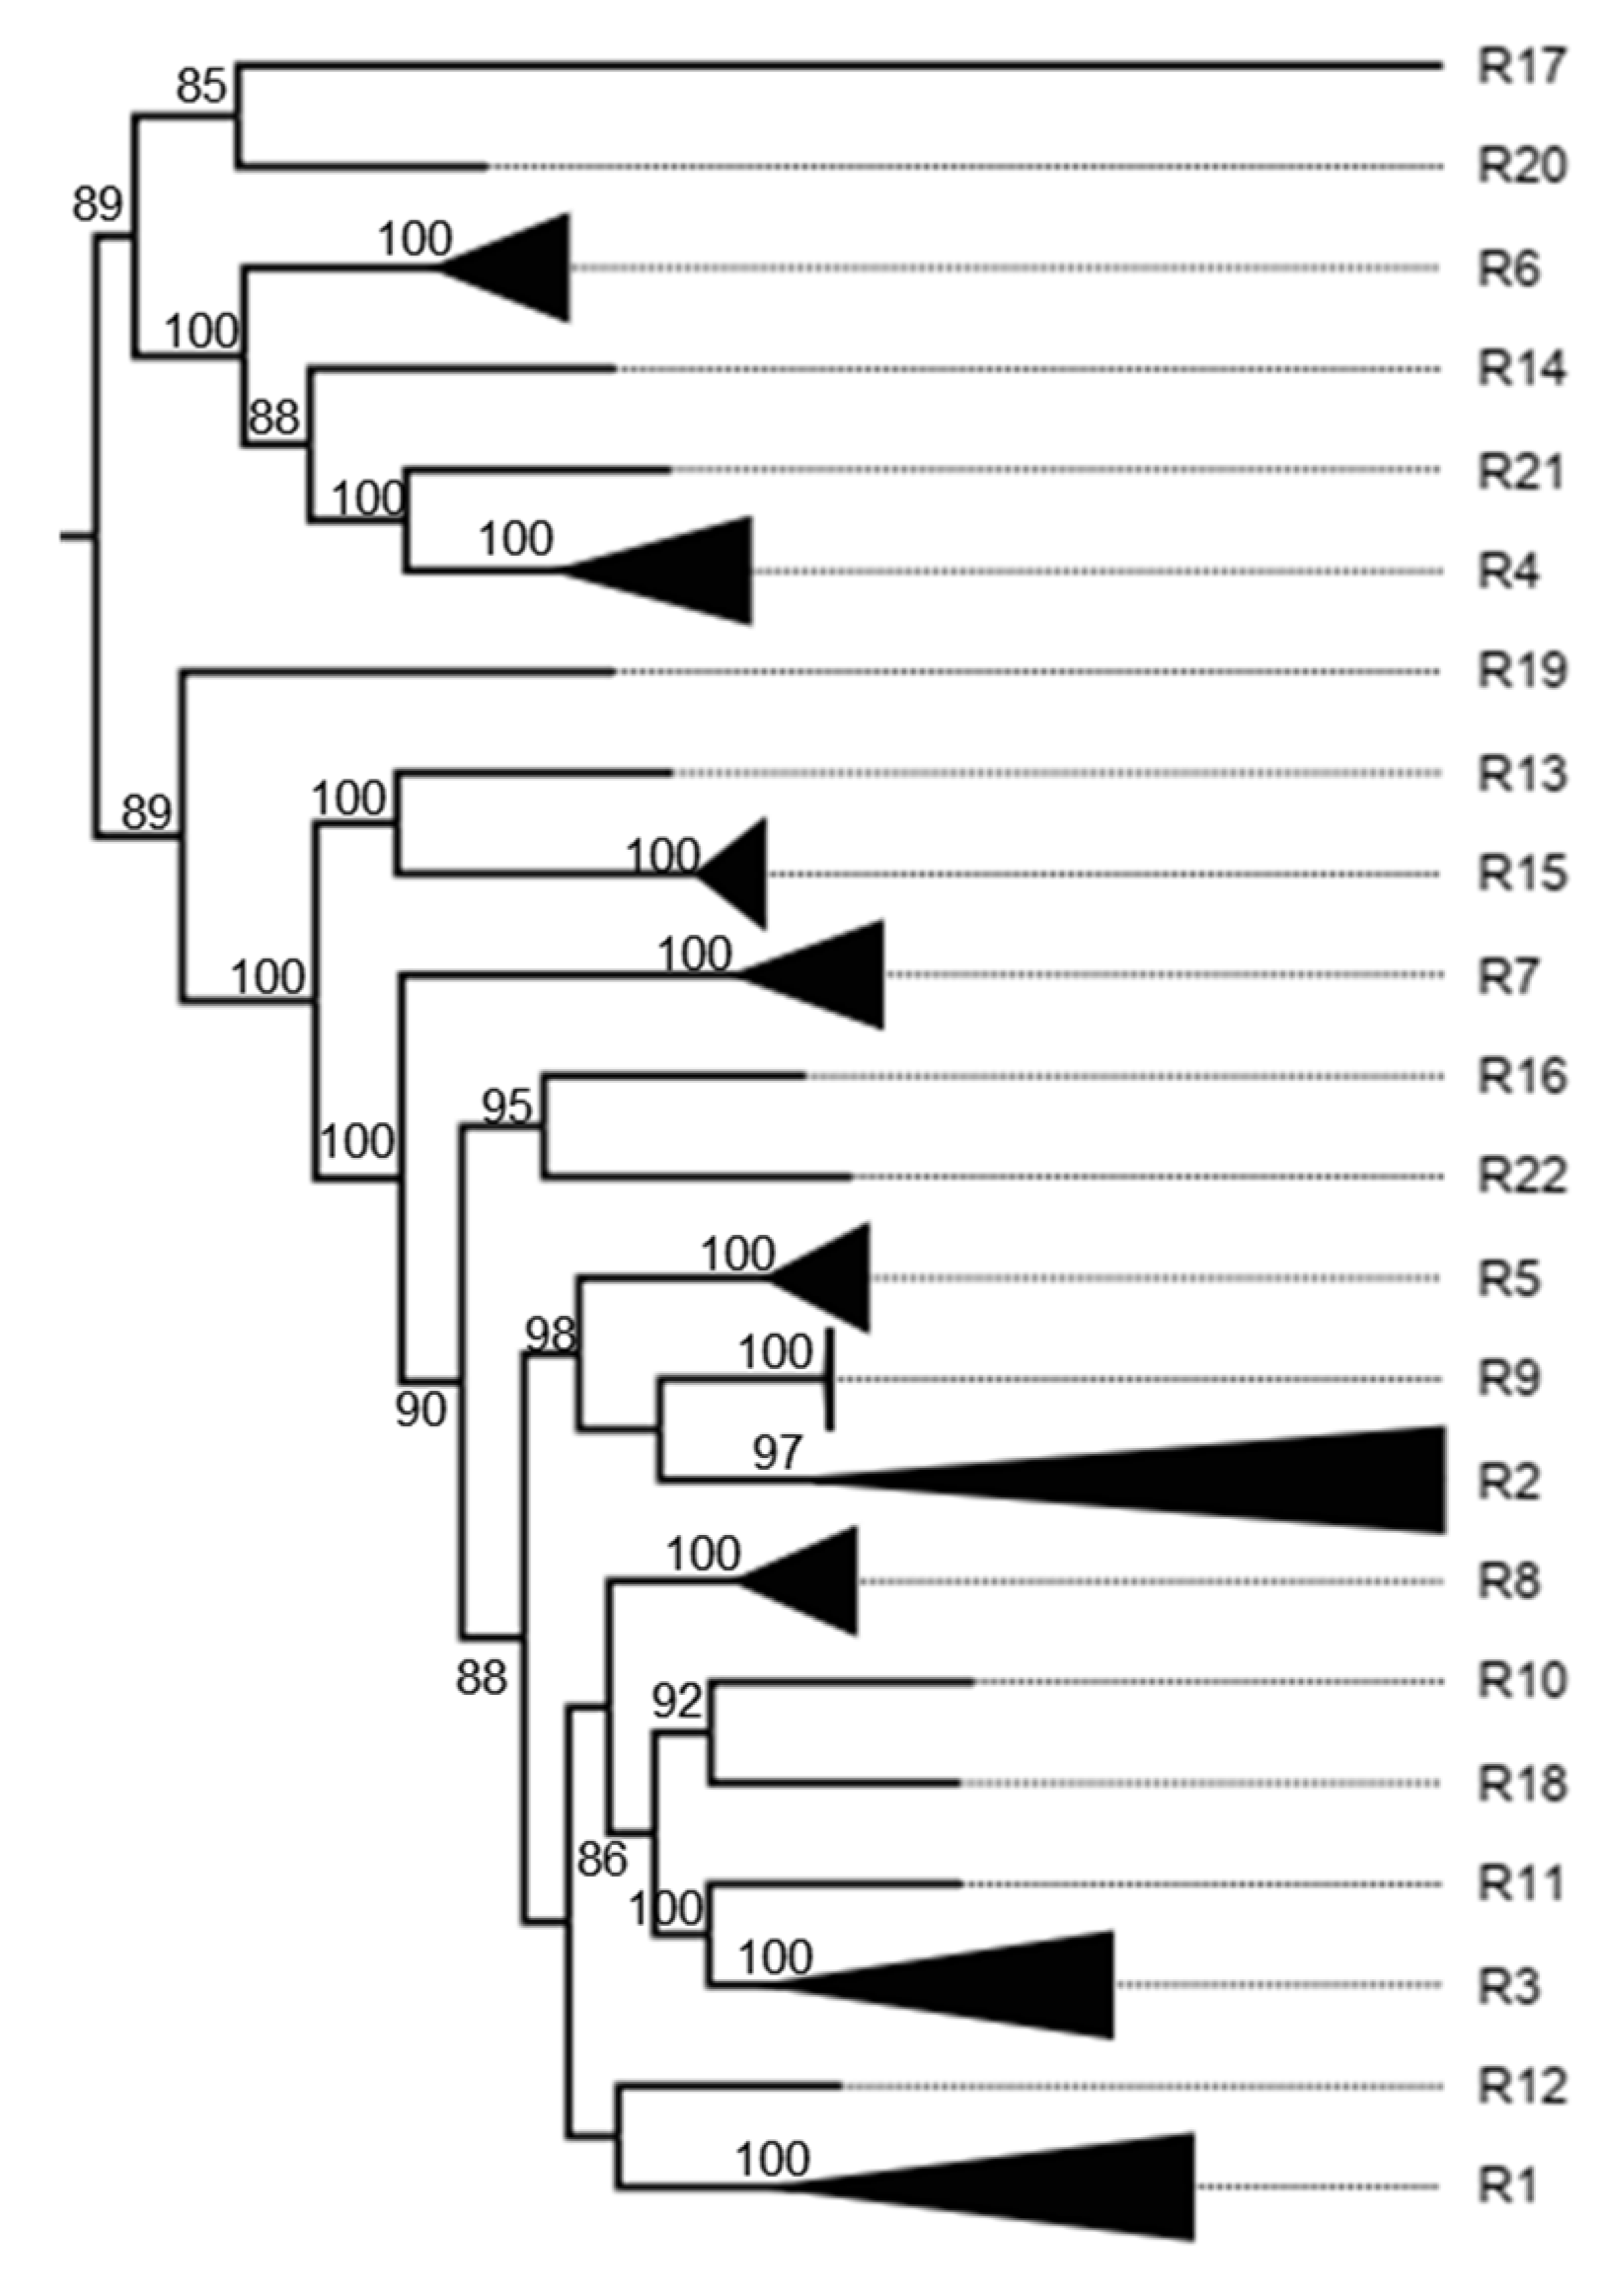
Figure A7.
VP2 Middle point rooted phylogenetic tree.
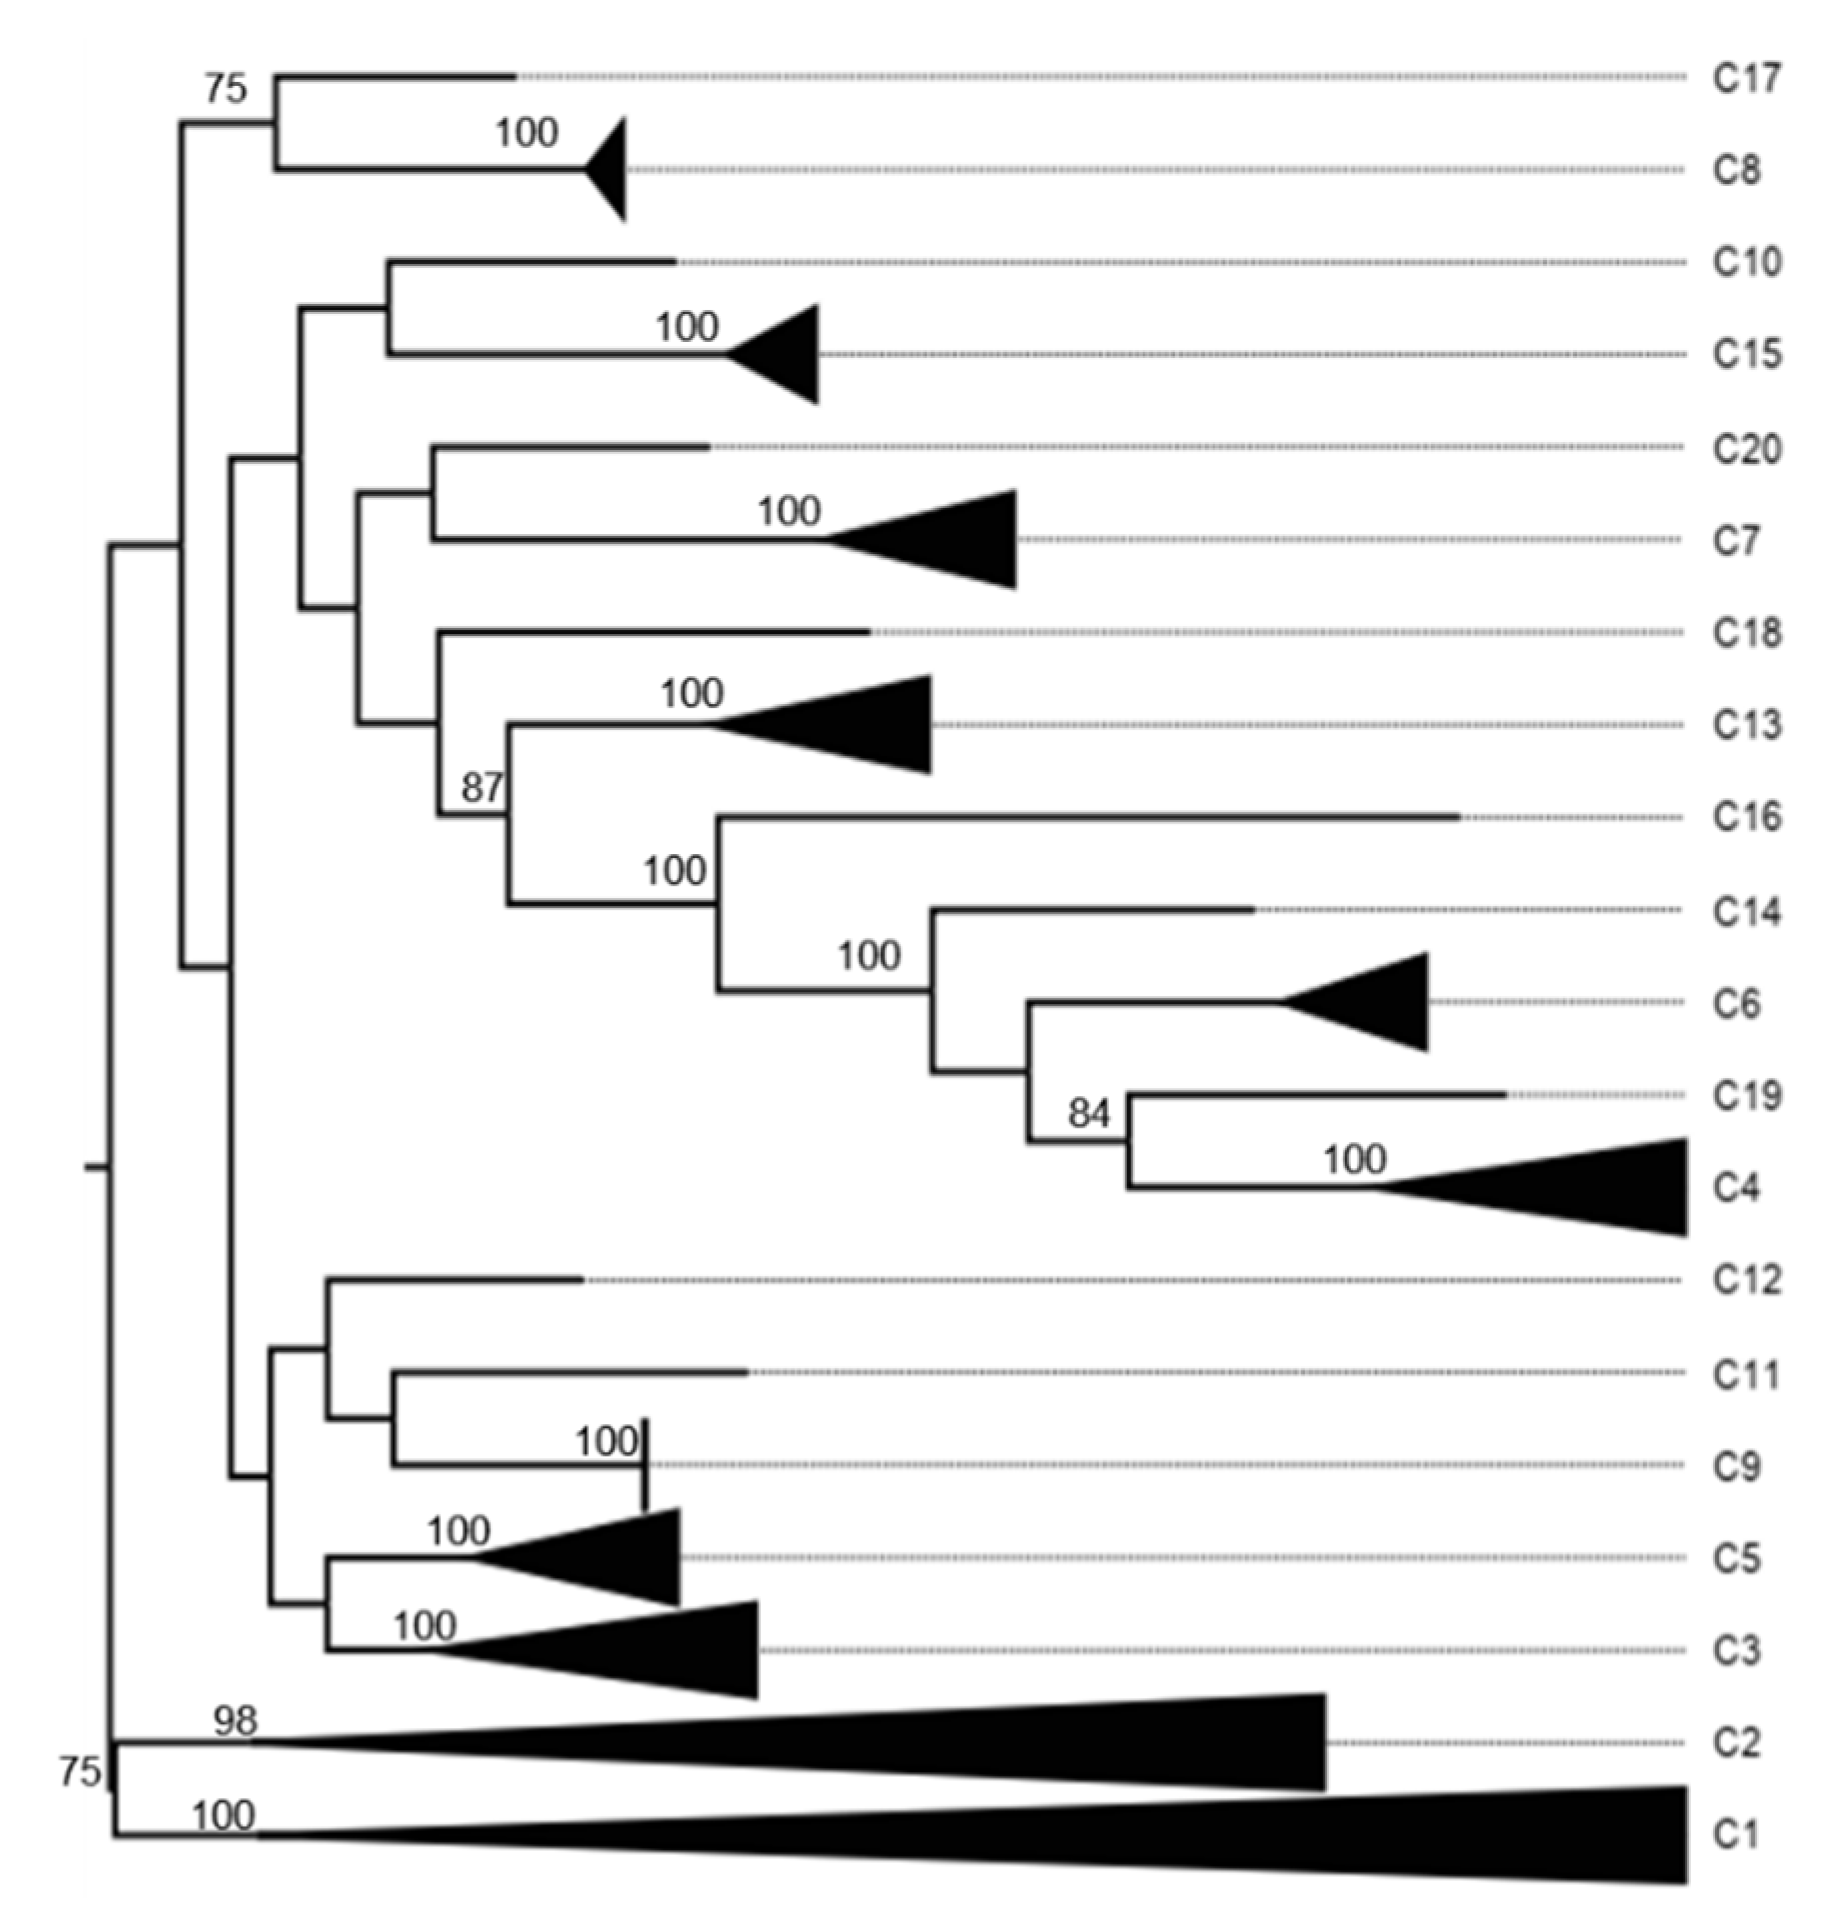
Figure A8.
VP3 Middle point rooted phylogenetic tree.
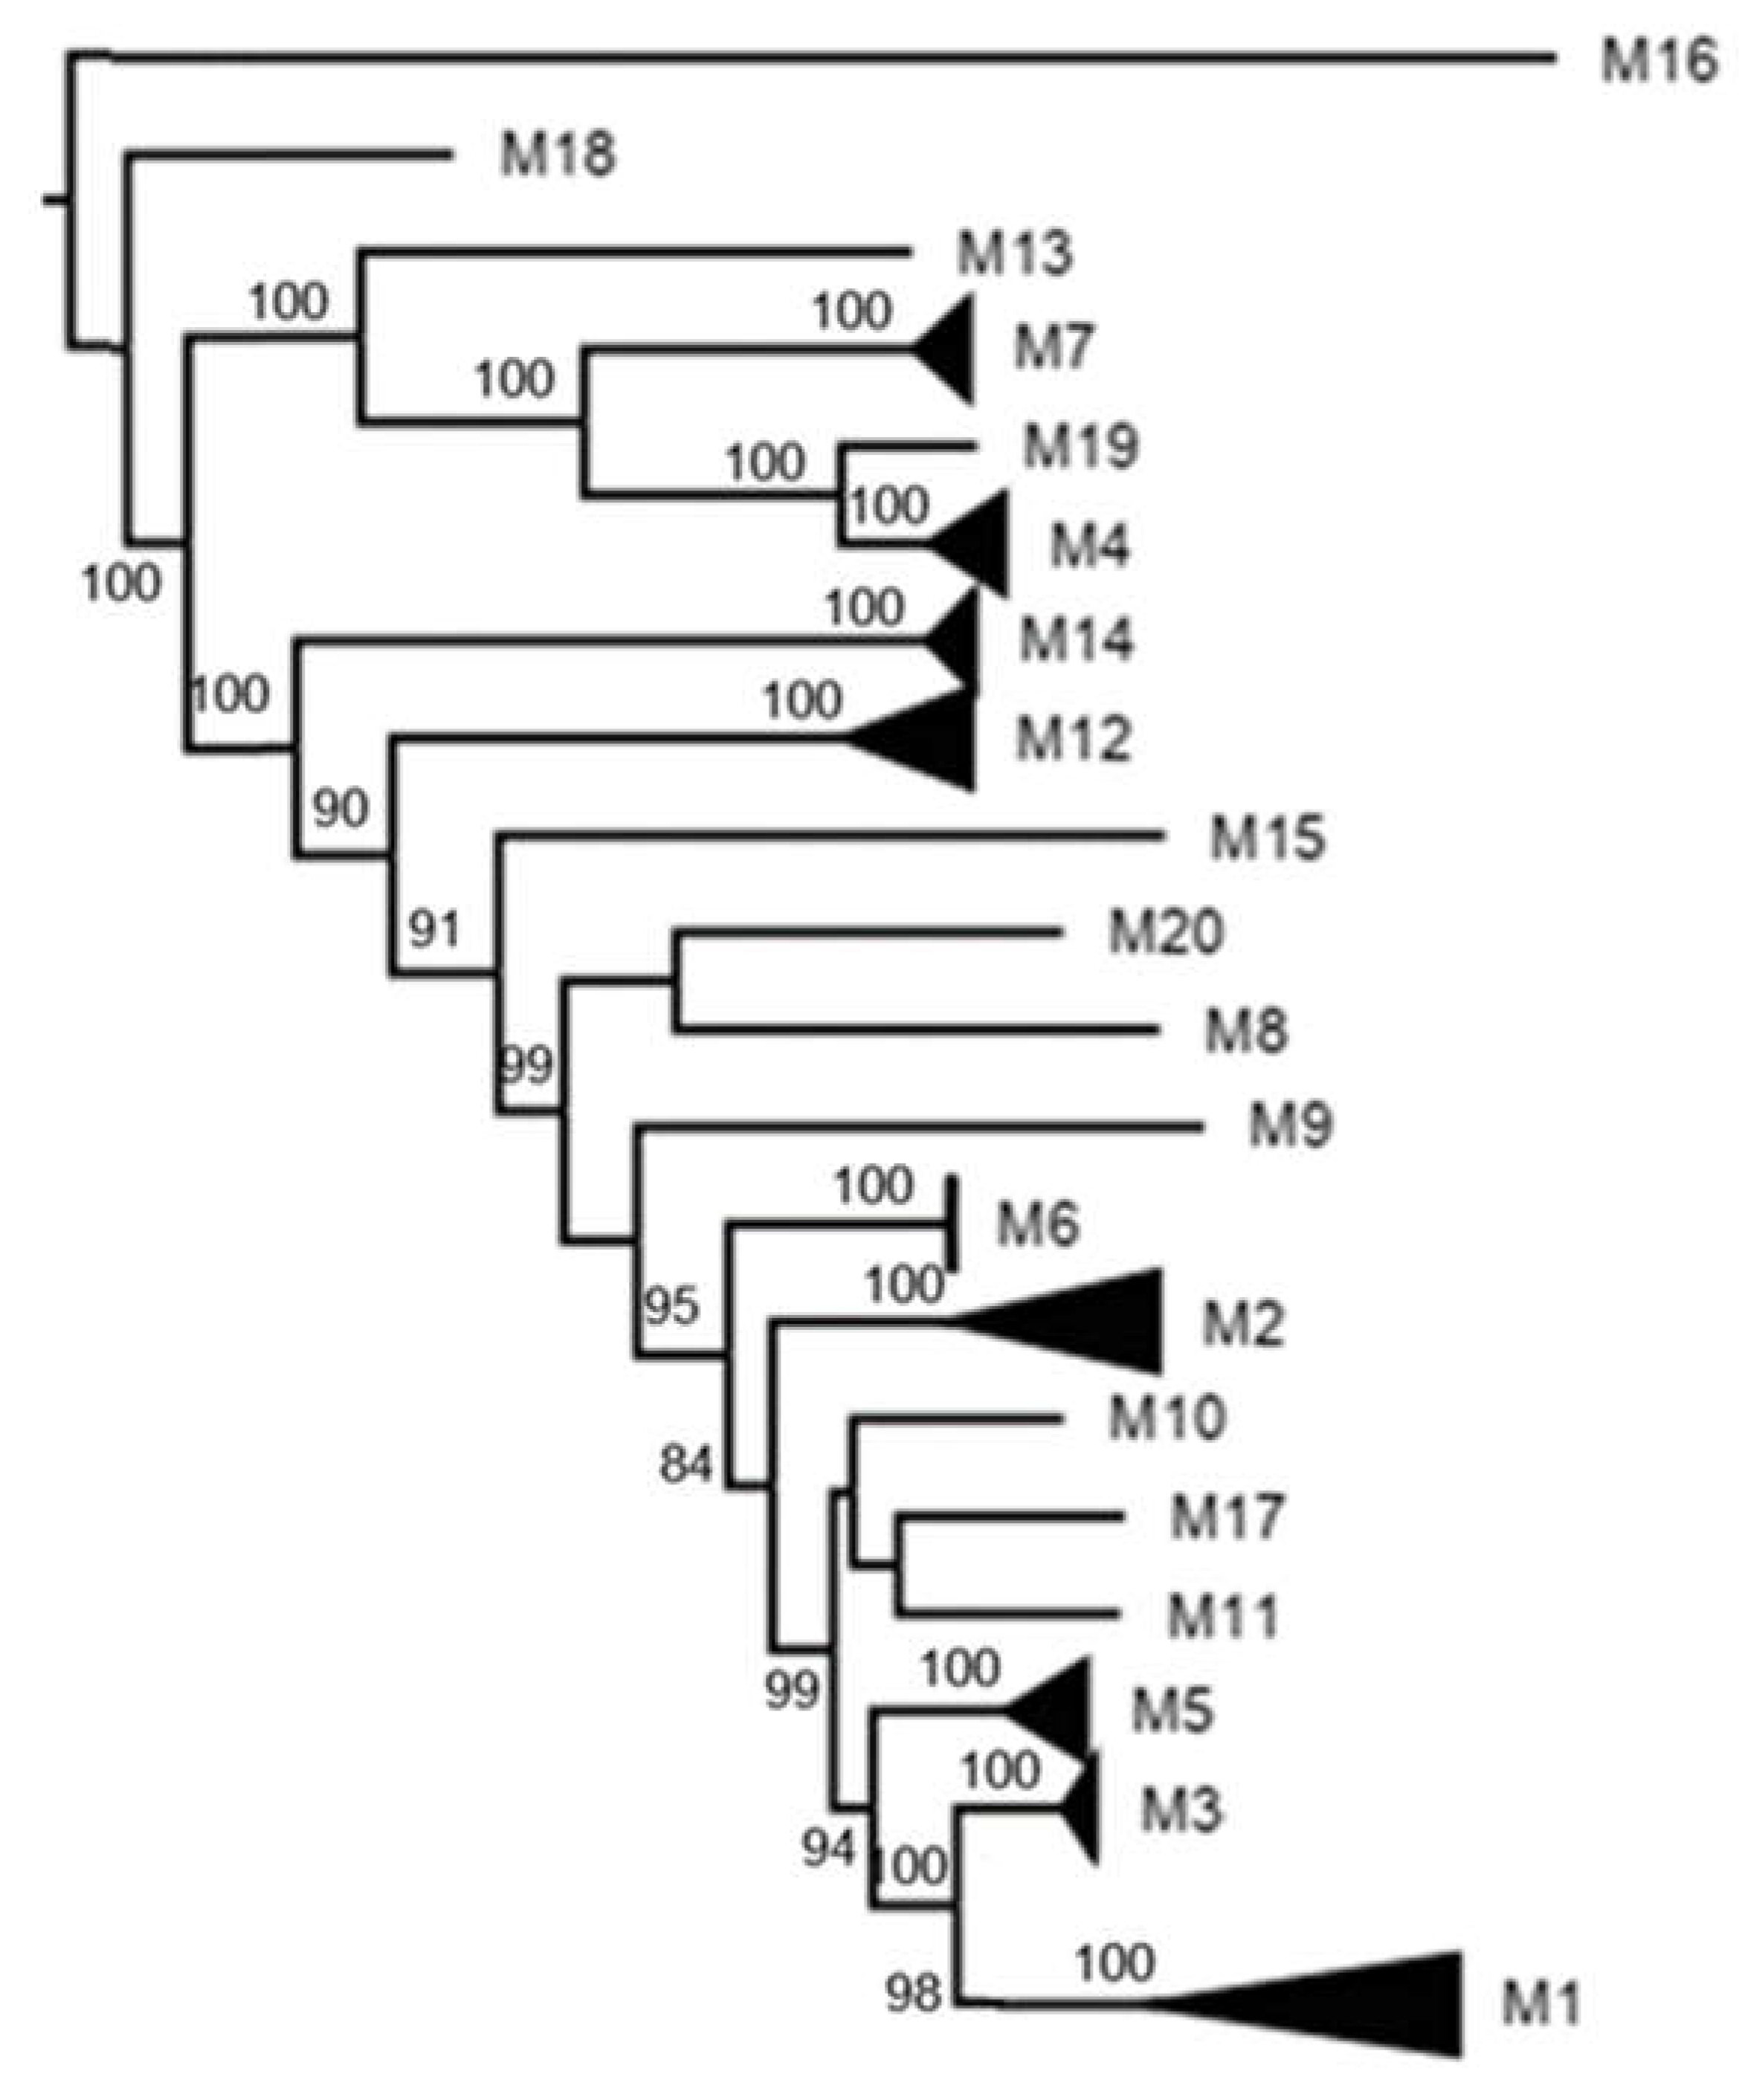
Figure A9.
NSP1 Middle point rooted phylogenetic tree.
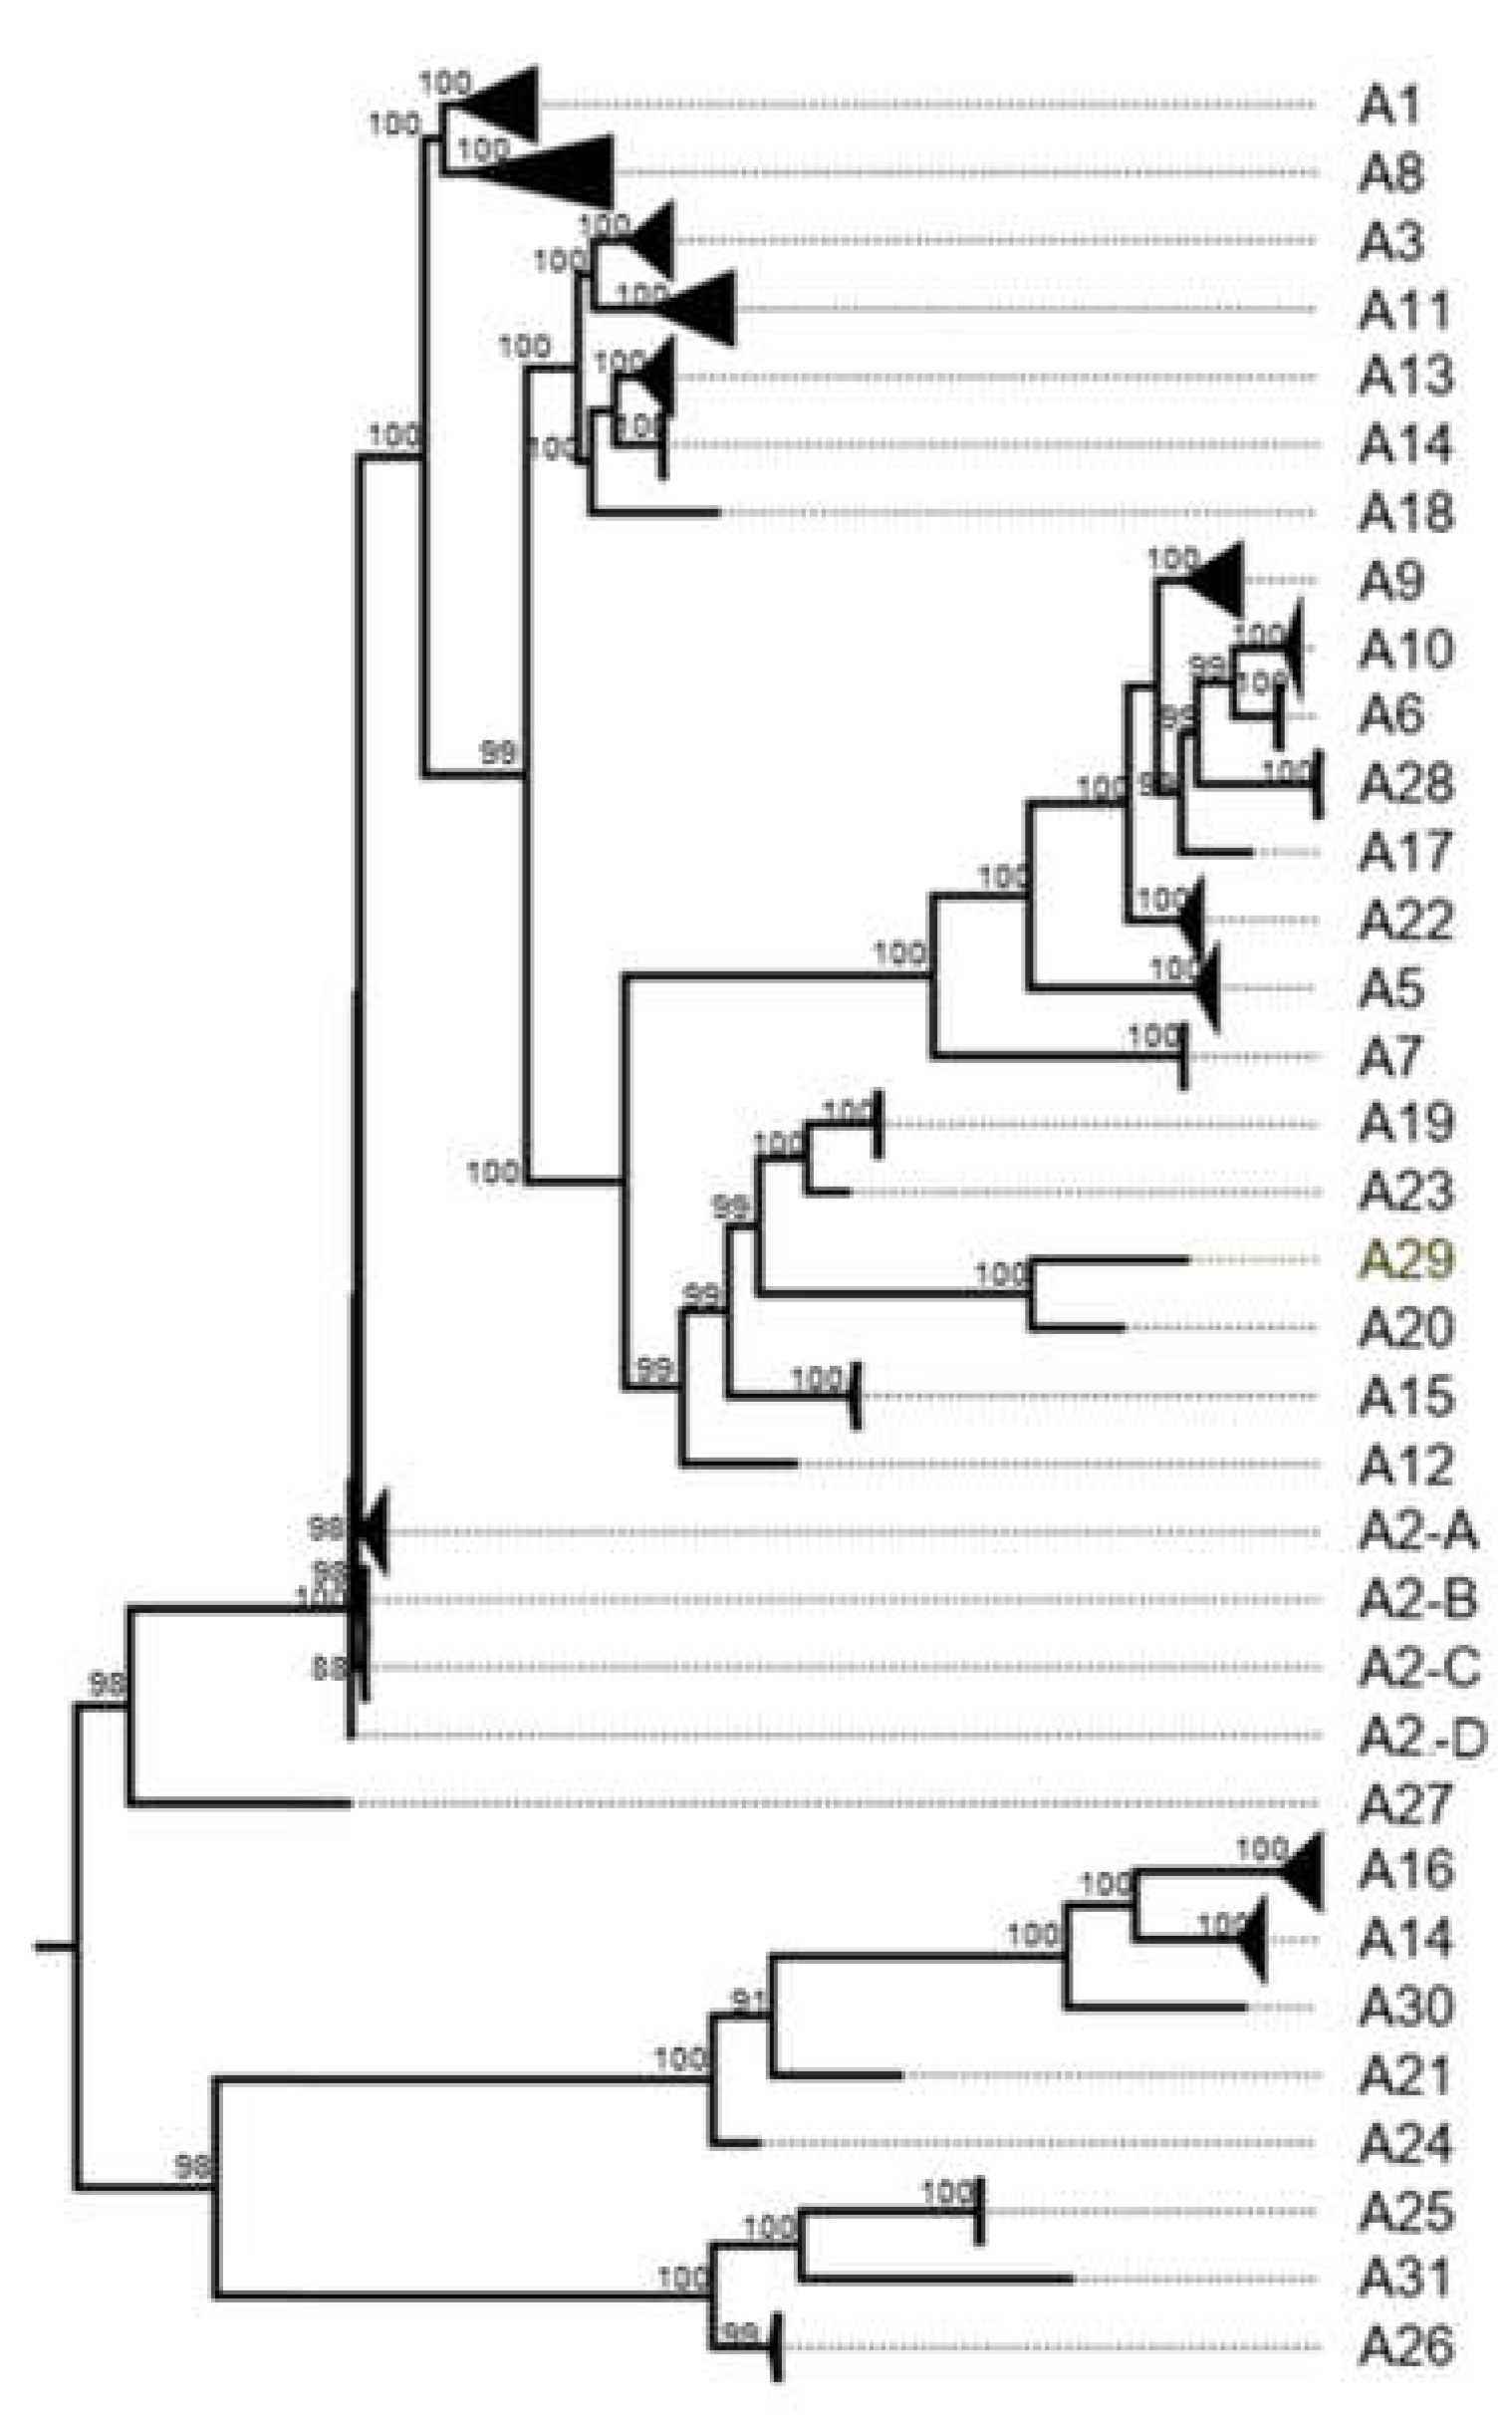
Figure A10.
NSP2 Middle point rooted phylogenetic tree. N2 showed close relationship with N9. N3 showed close relationship whit N5. N10 showed close relationship whit N6.
Figure A10.
NSP2 Middle point rooted phylogenetic tree. N2 showed close relationship with N9. N3 showed close relationship whit N5. N10 showed close relationship whit N6.
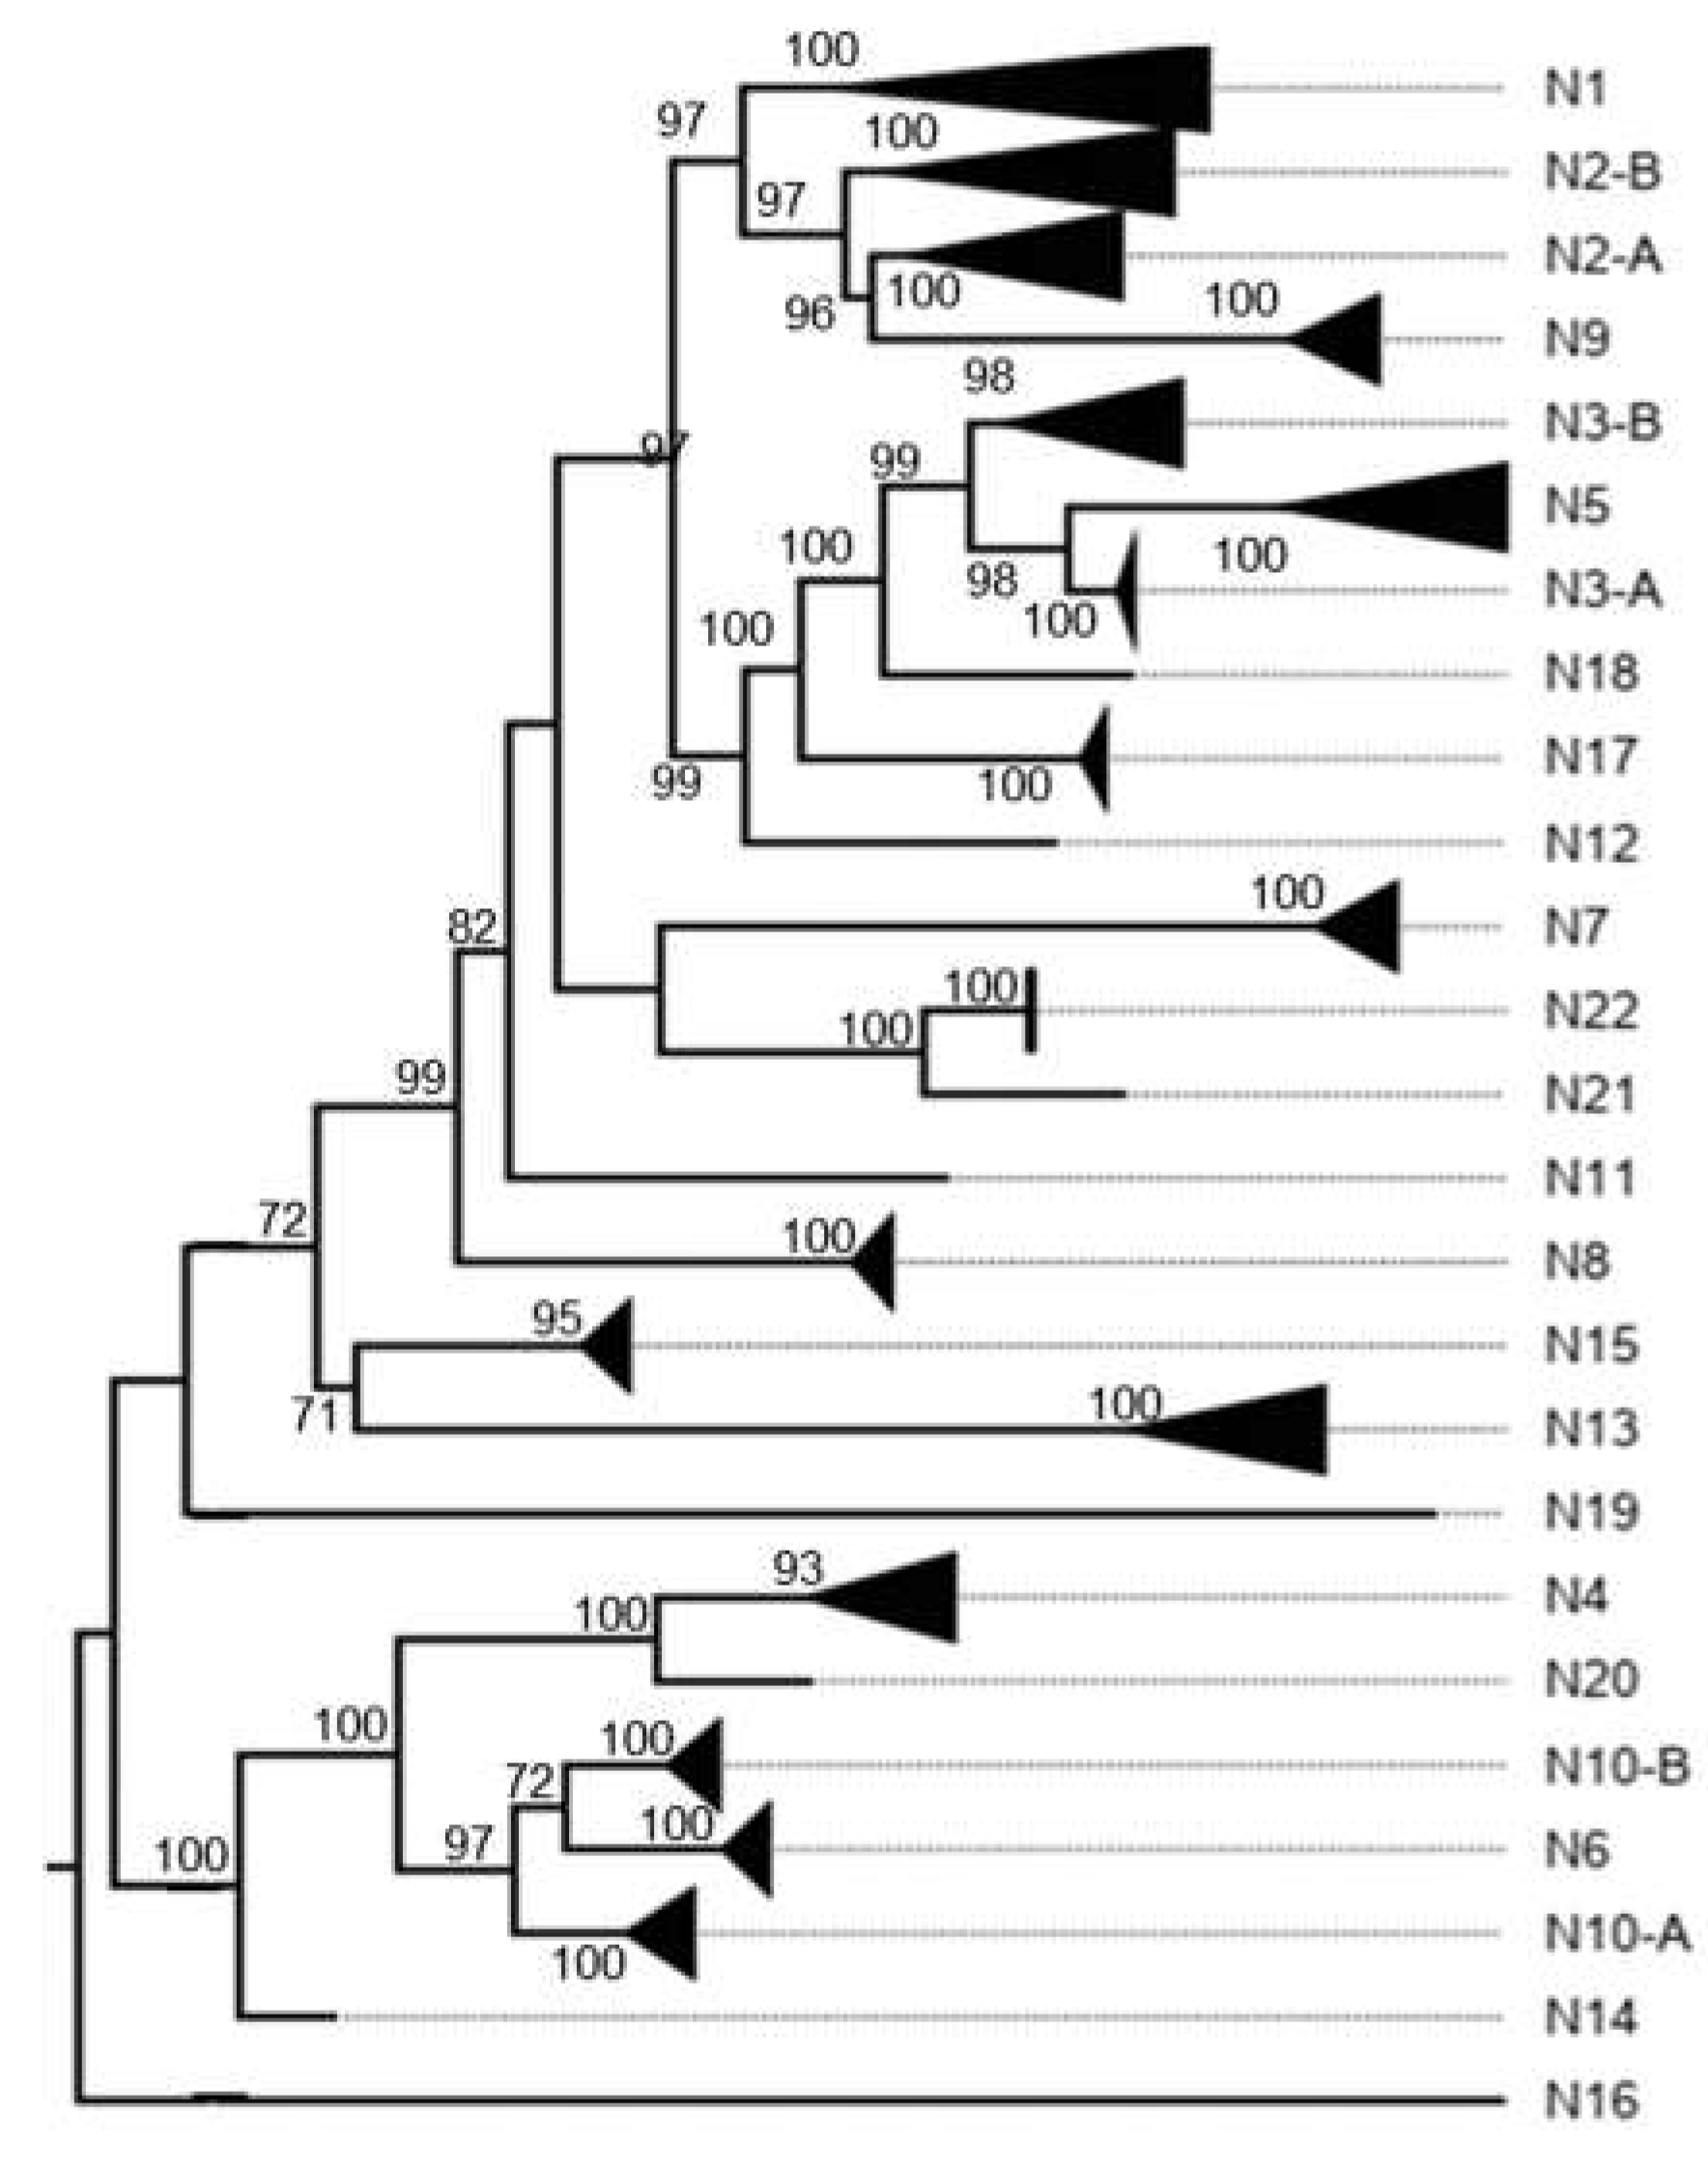
Figure A11.
NSP3 Middle point rooted phylogenetic tree.
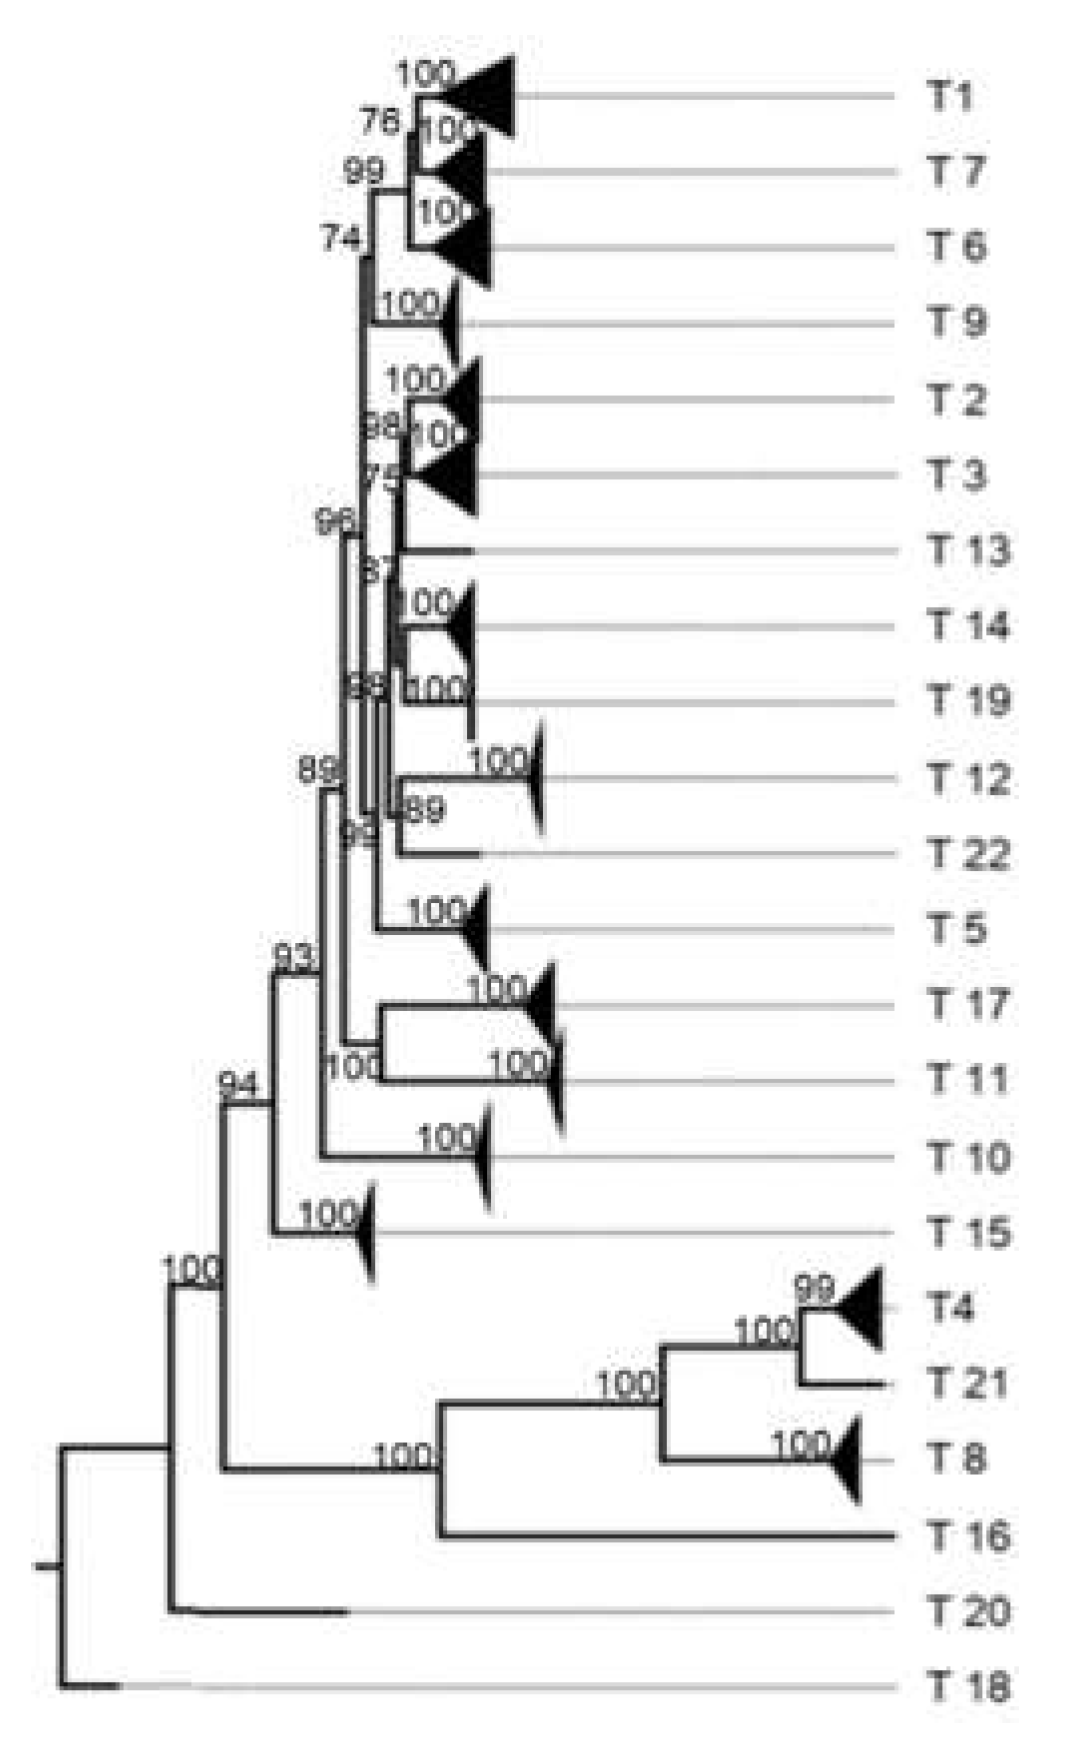
Figure A12.
NSP4 Middle point rooted phylogenetic tree. E1 showed close relationship with E9. E3 showed close relationship with E13, E16, E17 and E24. E4 showed close relationship with E19, E21 and E23.
Figure A12.
NSP4 Middle point rooted phylogenetic tree. E1 showed close relationship with E9. E3 showed close relationship with E13, E16, E17 and E24. E4 showed close relationship with E19, E21 and E23.
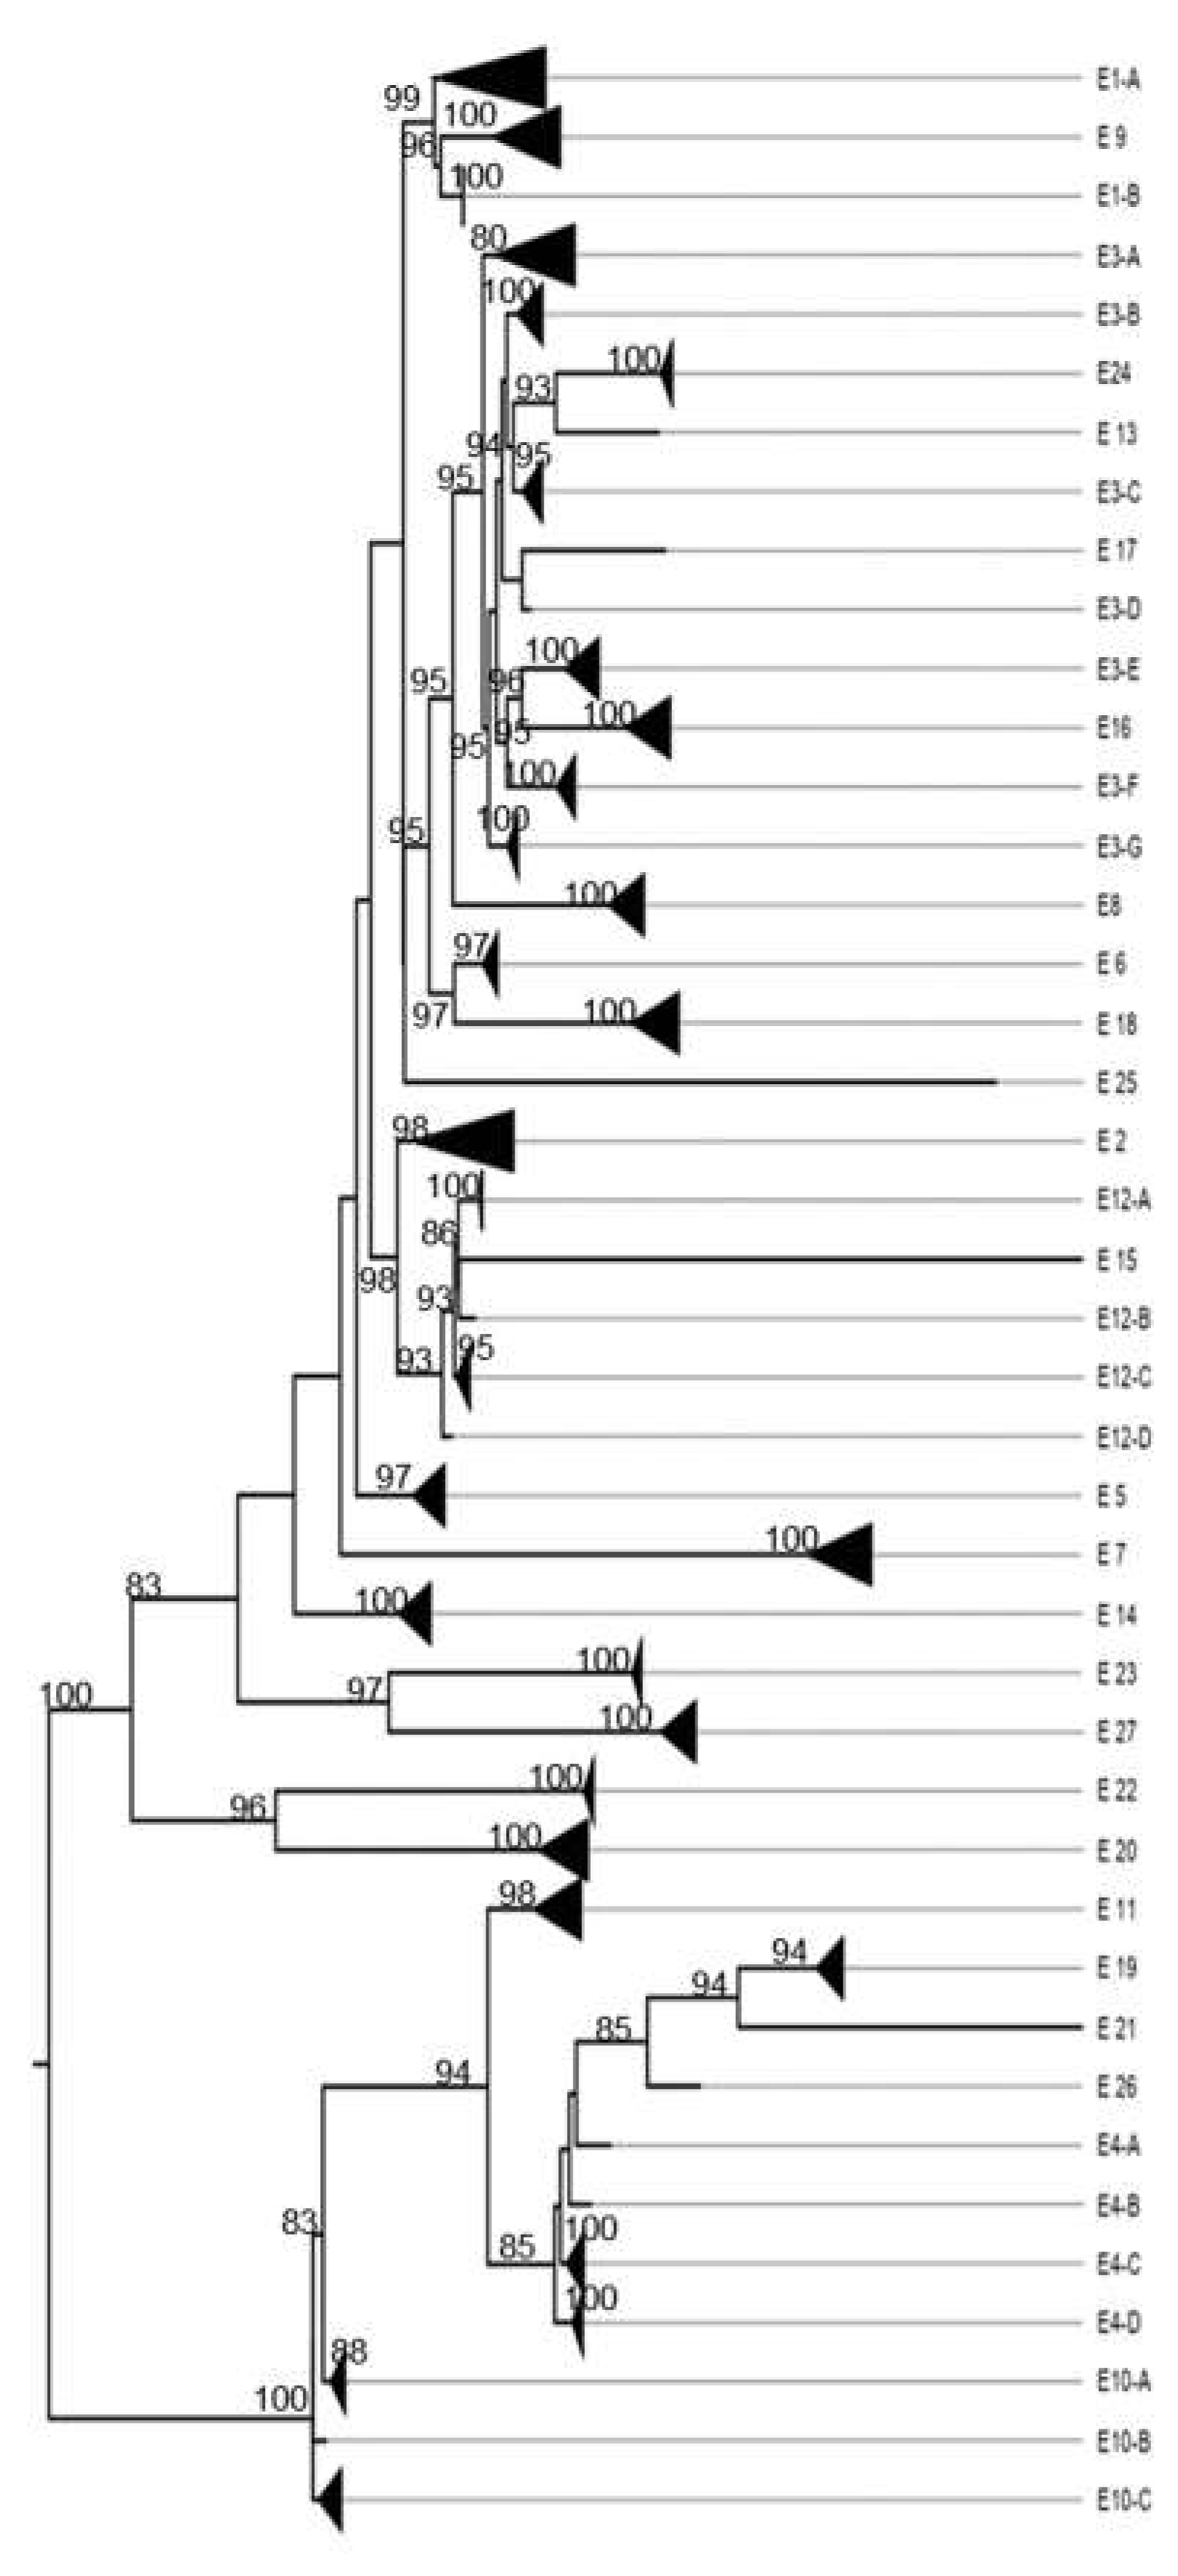
Figure A13.
NSP5 Middle point rooted phylogenetic tree.
References
- Desselberger, U. Rotaviruses. Virus Res 2014, 190, 75–96. [Google Scholar] [CrossRef] [PubMed]
- Knipe, D.M.; Howley, P.M.; Griffin, D.E.; Lamb, A.R.; Martin, M.A.; Roizman, B.; Straus, S.E. Rotavirus. In Fields Virology; Knipe, D.M., Howley, P.M., Eds.; Philadelphia, 2013; pp. 1347–1401.
- Guglielmi K, M.J.D.P.C.M.P.J. Genus Rotavirus: Type Species A. In Virus Taxonomy: Classification and Nomenclature of Viruses; Fauquet, C., Mayo, M., Maniloff, J., Desselberger, U., Ball, A., Eds.; Elsevier Academic Press, Holland.: Amsterdam, 2011; pp. 484–499. [Google Scholar]
- Ciarlet M, E.M. Rotaviruses: Basic Biology, Epidemiology and Methodologies. In Encyclopedia of Environmental Microbiology; Bitton, G, Ed.; John Wiley & Sons, USA: New York, 2002; pp. 2753–2773. [Google Scholar]
- Nakagomi, O.; Nakagomi, T.; Akatani, K.; Ikegami, N. Identification of Rotavirus Genogroups by RNA-RNA Hybridization. Mol Cell Probes 1989, 3, 251–261. [Google Scholar] [CrossRef] [PubMed]
- Matthijnssens, J.; Ciarlet, M.; Heiman, E.; Arijs, I.; Delbeke, T.; McDonald, S.M.; Palombo, E.A.; Iturriza-Gómara, M.; Maes, P.; Patton, J.T.; et al. Full Genome-Based Classification of Rotaviruses Reveals a Common Origin between Human Wa-Like and Porcine Rotavirus Strains and Human DS-1-Like and Bovine Rotavirus Strains. J Virol 2008, 82, 3204–3219. [Google Scholar] [CrossRef] [PubMed]
- Blackhall, J.; Fuentes, A.; Magnusson, G. Genetic Stability of a Porcine Rotavirus RNA Segment during Repeated Plaque Isolation. Virology 1996, 225, 181–190. [Google Scholar] [CrossRef]
- Miño, S.; Barrandeguy, M.; Parreño, V.; Parra, G.I. Genetic Linkage of Capsid Protein-Encoding RNA Segments in Group A Equine Rotaviruses. Journal of General Virology 2016, 97, 912–921. [Google Scholar] [CrossRef]
- Díaz Alarcón, R.G.; Liotta, D.J.; Miño, S. Zoonotic RVA: State of the Art and Distribution in the Animal World. Viruses 2022, 14, 2554. [Google Scholar] [CrossRef] [PubMed]
- Martella, V.; Bányai, K.; Matthijnssens, J.; Buonavoglia, C.; Ciarlet, M. Zoonotic Aspects of Rotaviruses. Vet Microbiol 2010, 140, 246–255. [Google Scholar] [CrossRef] [PubMed]
- Cook, N.; Bridger, J.; Kendall, K.; Gomara, M.I.; El-Attar, L.; Gray, J. The Zoonotic Potential of Rotavirus. Journal of Infection 2004, 48, 289–302. [Google Scholar] [CrossRef]
- Papp, H.; Matthijnssens, J.; Martella, V.; Ciarlet, M.; Bányai, K. Global Distribution of Group A Rotavirus Strains in Horses: A Systematic Review. Vaccine 2013, 31, 5627–5633. [Google Scholar] [CrossRef] [PubMed]
- Papp, H.; László, B.; Jakab, F.; Ganesh, B.; De Grazia, S.; Matthijnssens, J.; Ciarlet, M.; Martella, V.; Bányai, K. Review of Group A Rotavirus Strains Reported in Swine and Cattle. Vet Microbiol 2013, 165, 190–199. [Google Scholar] [CrossRef] [PubMed]
- Ghosh, S.; Kobayashi, N. Exotic Rotaviruses in Animals and Rotaviruses in Exotic Animals. Virusdisease 2014, 25, 158–172. [Google Scholar] [CrossRef]
- Dóró, R.; László, B.; Martella, V.; Leshem, E.; Gentsch, J.; Parashar, U.; Bányai, K. Review of Global Rotavirus Strain Prevalence Data from Six Years Post Vaccine Licensure Surveillance: Is There Evidence of Strain Selection from Vaccine Pressure? Infect Genet Evol 2014, 28, 446–461. [Google Scholar] [CrossRef] [PubMed]
- Simón, D.; Cristina, J.; Musto, H. Nucleotide Composition and Codon Usage Across Viruses and Their Respective Hosts. Front Microbiol 2021, 12. [Google Scholar] [CrossRef] [PubMed]
- Shackelton, L.A.; Parrish, C.R.; Holmes, E.C. Evolutionary Basis of Codon Usage and Nucleotide Composition Bias in Vertebrate DNA Viruses. J Mol Evol 2006, 62, 551–563. [Google Scholar] [CrossRef] [PubMed]
- Duffy, S.; Shackelton, L.A.; Holmes, E.C. Rates of Evolutionary Change in Viruses: Patterns and Determinants. Nat Rev Genet 2008, 9, 267–276. [Google Scholar] [CrossRef]
- Sanjuán, R.; Nebot, M.R.; Chirico, N.; Mansky, L.M.; Belshaw, R. Viral Mutation Rates. J Virol 2010, 84, 9733–9748. [Google Scholar] [CrossRef]
- Pfeiffer, J.K.; Kirkegaard, K. Increased Fidelity Reduces Poliovirus Fitness and Virulence under Selective Pressure in Mice. PLoS Pathog 2005, 1, 0102–0110. [Google Scholar] [CrossRef] [PubMed]
- Vignuzzi, M.; Stone, J.K.; Arnold, J.J.; Cameron, C.E.; Andino, R. Quasispecies Diversity Determines Pathogenesis through Cooperative Interactions in a Viral Population. Nature 2006, 439, 344–348. [Google Scholar] [CrossRef]
- Vignuzzi, M.; Wendt, E.; Andino, R. Engineering Attenuated Virus Vaccines by Controlling Replication Fidelity. Nat Med 2008, 14, 154–161. [Google Scholar] [CrossRef]
- Weeks, S.A.; Lee, C.A.; Zhao, Y.; Smidansky, E.D.; August, A.; Arnold, J.J.; Cameron, C.E. A Polymerase Mechanism-Based Strategy for Viral Attenuation and Vaccine Development. Journal of Biological Chemistry 2012, 287, 31618–31622. [Google Scholar] [CrossRef] [PubMed]
- Anderson, J.P.; Daifuku, R.; Loeb, L.A. Viral Error Catastrophe by Mutagenic Nucleosides. Annu Rev Microbiol 2004, 58, 183–205. [Google Scholar] [CrossRef] [PubMed]
- Holmes, E.C. Evolutionary History and Phylogeography of Human Viruses. Annu Rev Microbiol 2008, 62, 307–328. [Google Scholar] [CrossRef]
- Woolhouse, M.; Gaunt, E. Ecological Origins of Novel Human Pathogens. Crit Rev Microbiol 2007, 33, 231–242. [Google Scholar] [CrossRef] [PubMed]
- Combe, M.; Sanjuán, R. Variation in RNA Virus Mutation Rates across Host Cells. PLoS Pathog 2014, 10. [Google Scholar] [CrossRef]
- Matthijnssens, J.; Ciarlet, M.; Rahman, M.; Attoui, H.; Estes, M.K.; Gentsch, J.R.; Iturriza-gómara, M.; Kirkwood, C.; Mertens, P.P.C.; Nakagomi, O.; et al. Recommendations for the Classification of Group A Rotaviruses Using All 11 Genomic RNA Segments. Arch Virol 2008, 153, 1621–1629. [Google Scholar] [CrossRef]
- Rotavirus Classification Working Group: RCWG Home page [https://rega.kuleuven.be/cev/viralmetagenomics/virus-classification/rcwg] Newly Assigned Genotypes, List of accepted genotypes.
- Kumar, S.; Stecher, G.; Li, M.; Knyaz, C.; Tamura, K. MEGA X: Molecular Evolutionary Genetics Analysis across Computing Platforms. Mol Biol Evol 2018, 35, 1547–1549. [Google Scholar] [CrossRef]
- Nlshikawa, K.; Hoshino, Y.; Taniguchi, K.; Green, K.Y.; Greenberg, H.B.; Kapikian, A.; Chanock, R.M.; Gorziglia, M. Rotavirus VP7 Neutralization Epitopes of Serotype 3 Strains. Virology 1989, 171, 503–515. [Google Scholar] [CrossRef] [PubMed]
- Lemey, P.; Salemi, M.; Vandamme, A.-M. The Phylogenetic Handbook, 2nd ed.; Cambridge University Press: Cambridge, 2009; Volume 6, ISBN 9786021018187. [Google Scholar]
- Bonkoungou, I.J.O.; Damanka, S.; Sanou, I.; Tiendrebeogo, F.; Coulibaly, S.O.; Bon, F.; Haukka, K.; Traore, A.S.; Barro, N.; Armah, G.E. Genotype Diversity of Group A Rotavirus Strains in Children With Acute Diarrhea in Urban Burkina Faso, 2008-2010. J Med Virol 2011, 83, 1485–1490. [Google Scholar] [CrossRef] [PubMed]
- Ciarlet, M.; Hoshino, Y.; Liprandi, F. Single Point Mutations May Affect the Serotype Reactivity of Serotype G11 Porcine Rotavirus Strains: A Widening Spectrum? J Virol 1997, 71, 8213–8220. [Google Scholar] [CrossRef] [PubMed]
- Ciarlet, M.; Reggeti, F.; Pina, ’ C.I.; Liprandil, F. Equine Rotaviruses with G14 Serotype Specificity Circulate among Venezuelan Horses. J Clin Microbiol 1994, 2609–2612. [Google Scholar] [CrossRef] [PubMed]
- Morozova, O. V.; Sashina, T.A.; Epifanova, N. V.; Zverev, V. V.; Kashnikov, A.U.; Novikova, N.A. Phylogenetic Comparison of the VP7, VP4, VP6, and NSP4 Genes of Rotaviruses Isolated from Children in Nizhny Novgorod, Russia, 2015–2016, with Cogent Genes of the Rotarix and RotaTeq Vaccine Strains. Virus Genes 2018, 54, 225–235. [Google Scholar] [CrossRef] [PubMed]
- Tatte, V.S.; Maran, D.; Walimbe, A.M.; Gopalkrishna, V. Rotavirus G9P[4], G9P[6] and G1P[6] Strains Isolated from Children with Acute Gastroenteritis in Pune, Western India, 2013–2015: Evidence for Recombination in Genes Encoding VP3, VP4 and NSP1. Journal of General Virology 2019, 100, 1605–1630. [Google Scholar] [CrossRef]
- Sircar, S.; Malik, Y.S.; Kumar, P.; Ansari, M.I.; Bhat, S.; Shanmuganathan, S.; Kattoor, J.J.; Vinodhkumar, O.R.; Rishi, N.; Touil, N.; et al. Genomic Analysis of an Indian G8P[1] Caprine Rotavirus-A Strain Revealing Artiodactyl and DS-1-Like Human Multispecies Reassortment. Front Vet Sci 2021, 7, 1–11. [Google Scholar] [CrossRef] [PubMed]
- Ghosh, S.; Navarro, R.; Malik, Y.S.; Willingham, A.L.; Kobayashi, N. Whole Genomic Analysis of a Porcine G6P[13] Rotavirus Strain. Vet Microbiol 2015, 180, 286–298. [Google Scholar] [CrossRef] [PubMed]
- Ianiro, G.; Di Bartolo, I.; De Sabato, L.; Pampiglione, G.; Ruggeri, F.M.; Ostanello, F. Detection of Uncommon G3P[3] Rotavirus A (RVA) Strain in Rat Possessing a Human RVA-like VP6 and a Novel NSP2 Genotype. Infection, Genetics and Evolution 2017, 53, 206–211. [Google Scholar] [CrossRef]
- Tamim, S.; Matthijnssens, J.; Heylen, E.; Zeller, M.; Van Ranst, M.; Salman, M.; Hasan, F. Evidence of Zoonotic Transmission of VP6 and NSP4 Genes into Human Species A Rotaviruses Isolated in Pakistan in 2010. Arch Virol 2019, 164, 1781–1791. [Google Scholar] [CrossRef]
- Yan, N.; Yue, H.; Wang, Y.; Zhang, B.; Tang, C. Genomic Analysis Reveals G3P[13] Porcine Rotavirus A Interspecific Transmission to Human from Pigs in a Swine Farm with Diarrhoea Outbreak. Journal of General Virology 2021, 102, 1–9. [Google Scholar] [CrossRef] [PubMed]
- Peng, R.; Li, D.; Wang, J.; Xiong, G.; Wang, M.; Liu, D.; Wei, Y.; Pang, L.; Sun, X.; Li, H.; et al. Reassortment and Genomic Analysis of a G9P[8]-E2 Rotavirus Isolated in China. Virol J 2023, 20, 1–15. [Google Scholar] [CrossRef] [PubMed]
- Pathak, A.; Gulati, B.R.; Maan, S.; Mor, S.; Kumar, D.; Soman, R.; Punia, S.; Chaudhary, D.; Khurana, S.K. Complete Genome Sequencing Reveals Unusual Equine Rotavirus A of Bat Origin from India. J Virol 2022, 96, 1–10. [Google Scholar] [CrossRef]
- Jing, Z.; Zhang, X.; Shi, H.; Chen, J.; Shi, D.; Dong, H.; Feng, L. A G3P[13] Porcine Group A Rotavirus Emerging in China Is a Reassortant and a Natural Recombinant in the VP4 Gene. Transbound Emerg Dis 2018, 65, e317–e328. [Google Scholar] [CrossRef] [PubMed]
- Da Silva, M.F.M.; Tort, L.F.L.; Goméa, M.M.; Assis, R.M.S.; Volotão, E. de M.; De Mendonça, M.C.L.; Bello, G.; Leite, J.P.G. VP7 Gene of Human Rotavirus A Genotype G5: Phylogenetic Analysis Reveals the Existence of Three Different Lineages Worldwide. J Med Virol 2011, 83, 357–366. [Google Scholar] [CrossRef] [PubMed]
- Gupta, S.; Gauhar, M.; Bubber, P.; Ray, P. Phylogenetic Analysis of VP7 and VP4 Genes of the Most Predominant Human Group A Rotavirus G12 Identified in Children with Acute Gastroenteritis in Himachal Pradesh, India during 2013–2016. J Med Virol 2021, 93, 6200–6209. [Google Scholar] [CrossRef]
- Degiuseppe, J.I.; Martelli, A.; Barrios Mathieur, C.; Stupka, J.A. Genetic Diversity of Rotavirus A in Argentina during 2019-2022: Detection of G6 Strains and Insights Regarding Its Dissemination. Arch Virol 2023, 168, 251. [Google Scholar] [CrossRef] [PubMed]
- Takatsuki, H.; Agbemabiese, C.A.; Nakagomi, T.; Pun, S.B.; Gauchan, P.; Muto, H.; Masumoto, H.; Atarashi, R.; Nakagomi, O.; Pandey, B.D. Whole Genome Characterisation of G11P[25] and G9P[19] Rotavirus A Strains from Adult Patients with Diarrhoea in Nepal. Infection, Genetics and Evolution 2019, 69, 246–254. [Google Scholar] [CrossRef] [PubMed]
- Estes, M.K.Z. Rotaviruses and Their Replication. In Fields virology; B. N. Fields, D. M. Knipe, P. M. Howley, D. E. Griffin, R. A. Lamb, M. A. Martin, B. Roizman, S. E. Straus, Eds.; Lippincott, Williams and Wilkins, Philadelphia, 2007; pp. 1917–1974.
- Yasutaka Hoshino; Ronald W. Jones; Robert M. Chanock; Albert Z. Kapikian Generation and Characterization of Six Single VP4 Gene Substitution Reassortant Rotavirus Vaccine Candidates: Each Bears a Single Human Rotavirus VP4 Gene Encoding P Serotype 1A[8] or 1B[4] and the Remaining 10 Genes of Rhesus Monkey Rotavirus MMU18006 or Bovine Rotavirus UK. Vaccine 2002, 20, 3576–3584. [Google Scholar] [CrossRef]
- Gorziglia, M.; Larralde, G.; Kapikian, A.Z.; Chanock, R.M. Antigenic Relationships among Human Rotaviruses as Determined by Outer Capsid Protein VP4 (Rotavirus VP4 Expression/Rotavirus VP4 Serotypes/Rotavirus VP8/Rotavirus VP5); 1990; Vol. 87.
- Chen, J.; Grow, S.; Iturriza-Gómara, M.; Hausdorff, W.P.; Fix, A.; Kirkwood, C.D. The Challenges and Opportunities of Next-Generation Rotavirus Vaccines: Summary of an Expert Meeting with Vaccine Developers. Viruses 2022, 14, 2565. [Google Scholar] [CrossRef] [PubMed]
- Dhama, K.; Saminathan, M.; Karthik, K.; Tiwari, R.; Shabbir, M.Z.; Kumar, N.; Malik, Y.S.; Singh, R.K. Avian Rotavirus Enteritis – an Updated Review. Veterinary Quarterly 2015, 35, 142–158. [Google Scholar] [CrossRef]
Figure 1.
Strains selection criteria and number of strains included in the study.
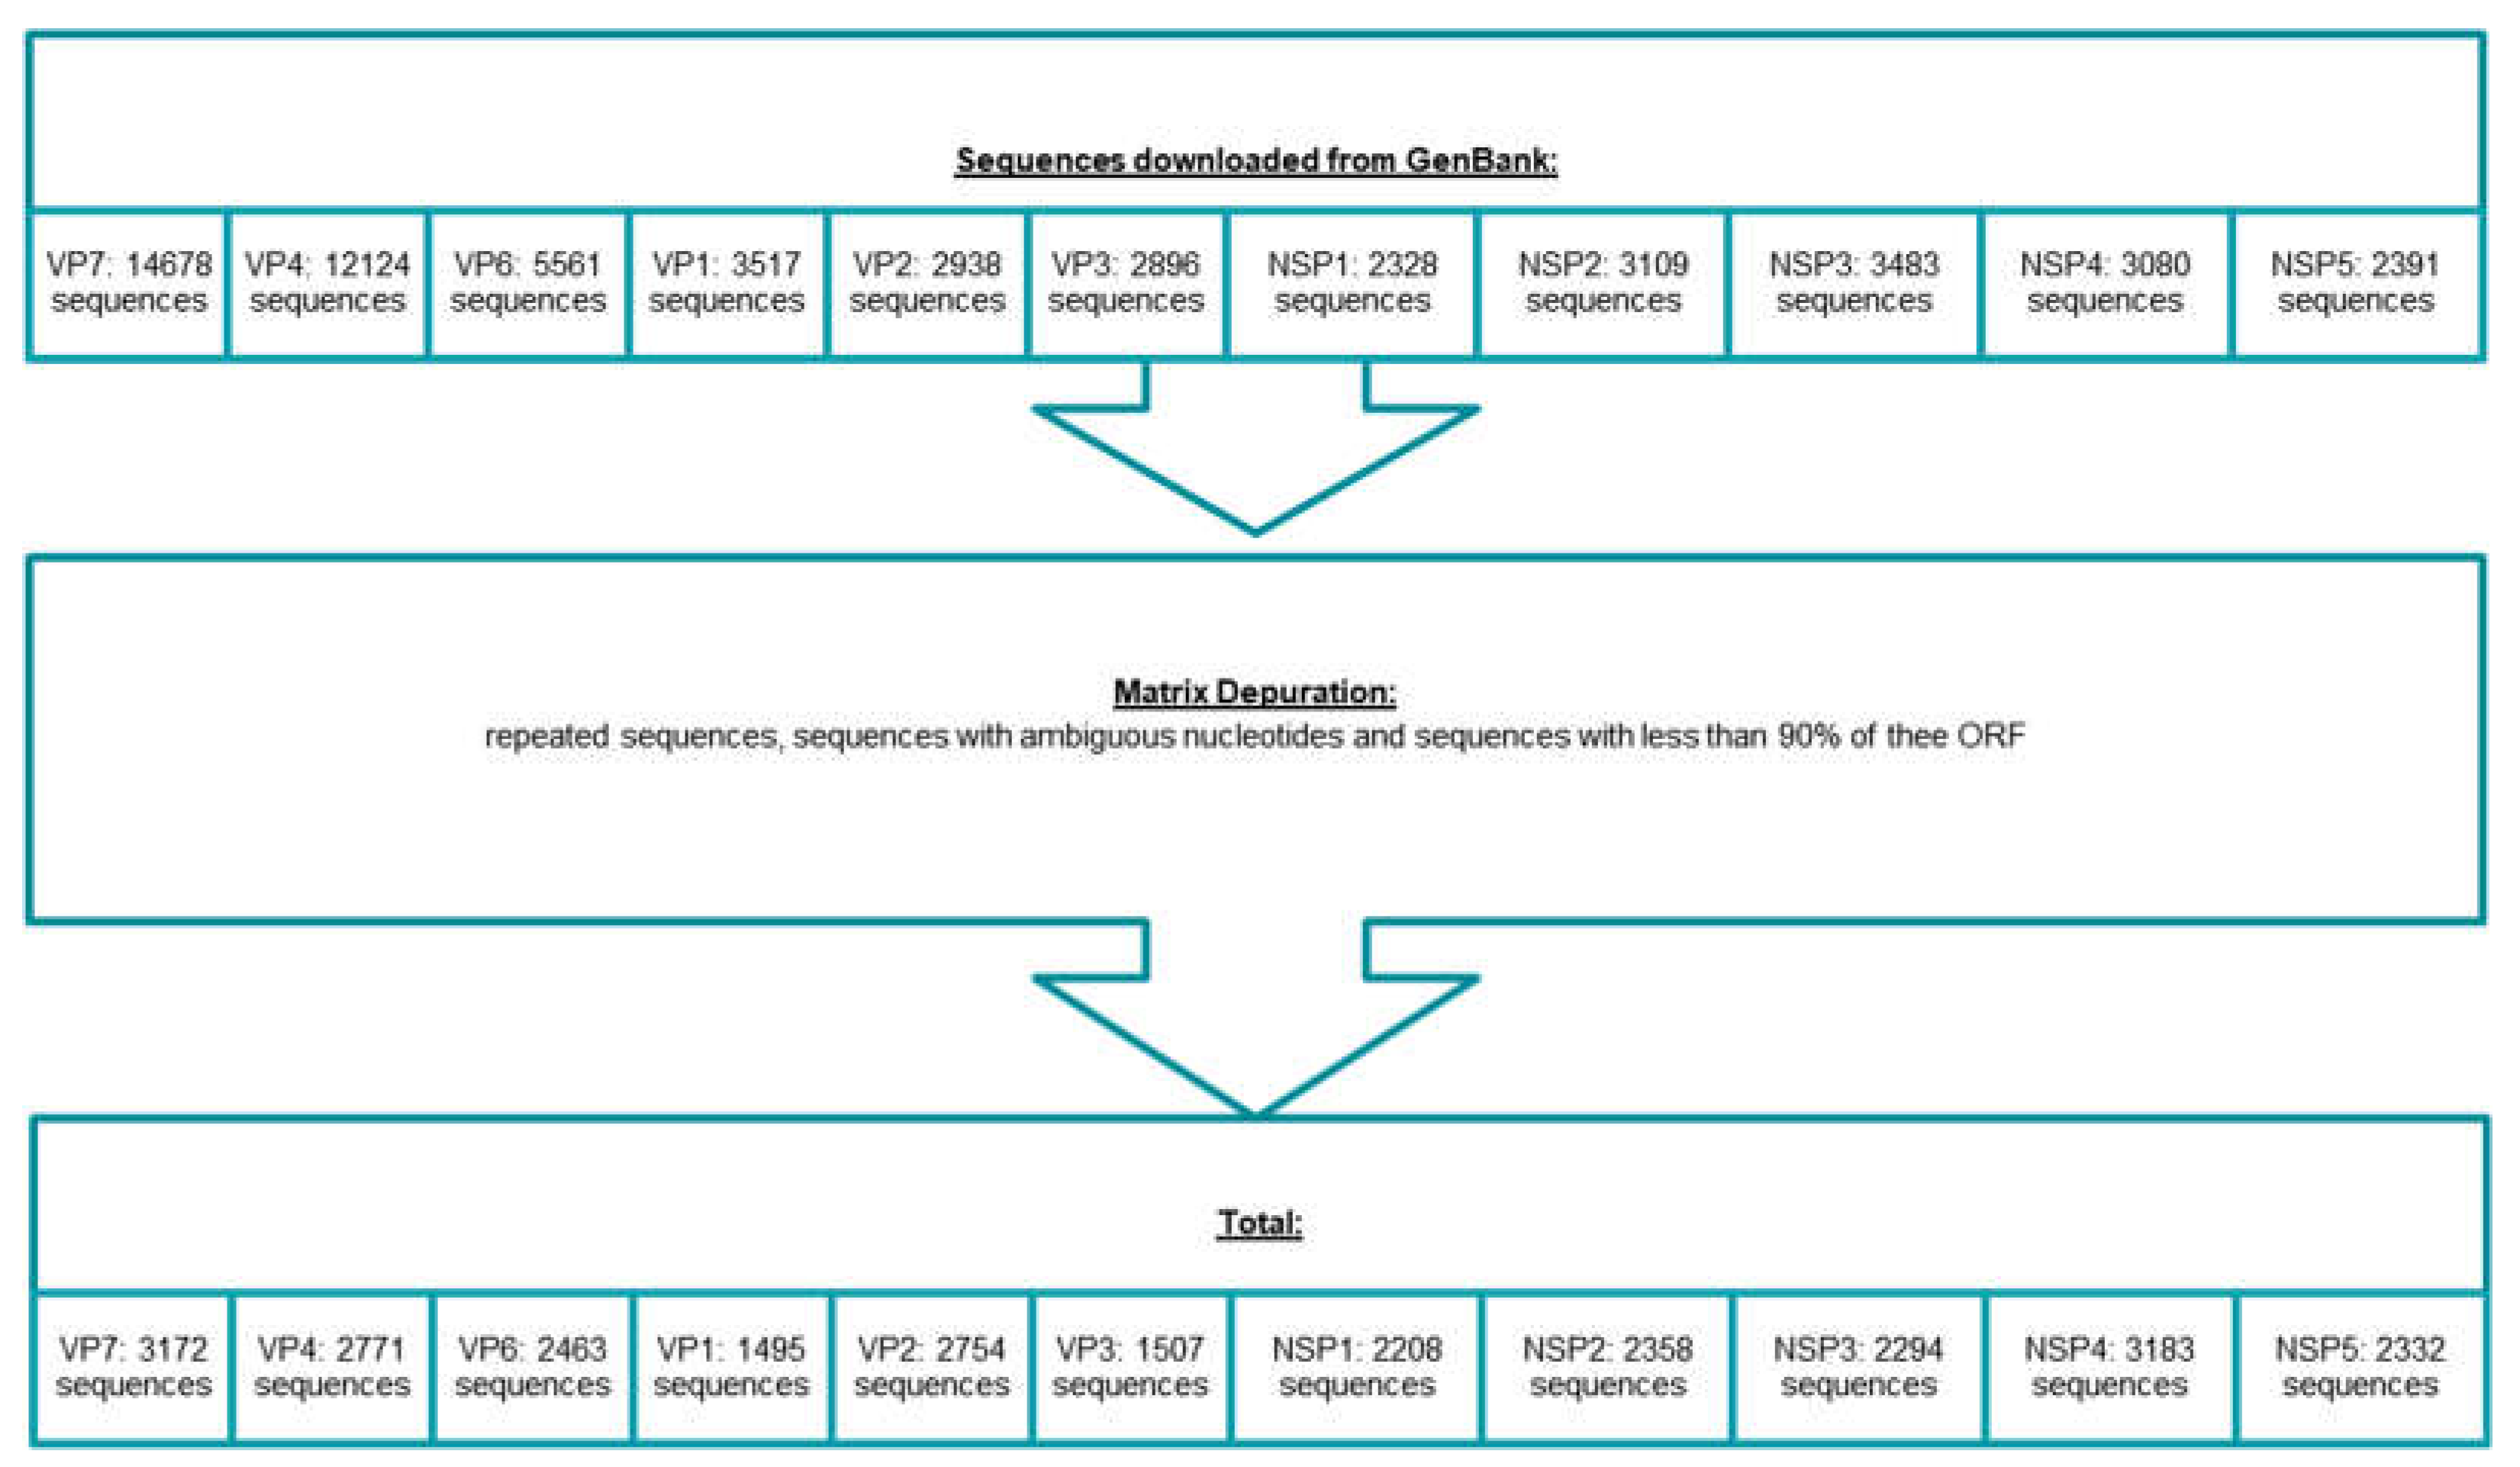
Figure 2.
Histograms of pair identities for each Viral Protein (VP). In the ordinates are the identities between each pair of sequences and the abscise represents the number of pairs of sequences measured. P-distance histograms are at the left, intra genotype identities are represented in red and inter genotype identities in green. K2P histograms are at the right, intra genotype identities are represented in grey and inter genotype identities in light blue. Dotted lines represent the cutoff value proposed by Matthijnssens et al. in 2008 [28].
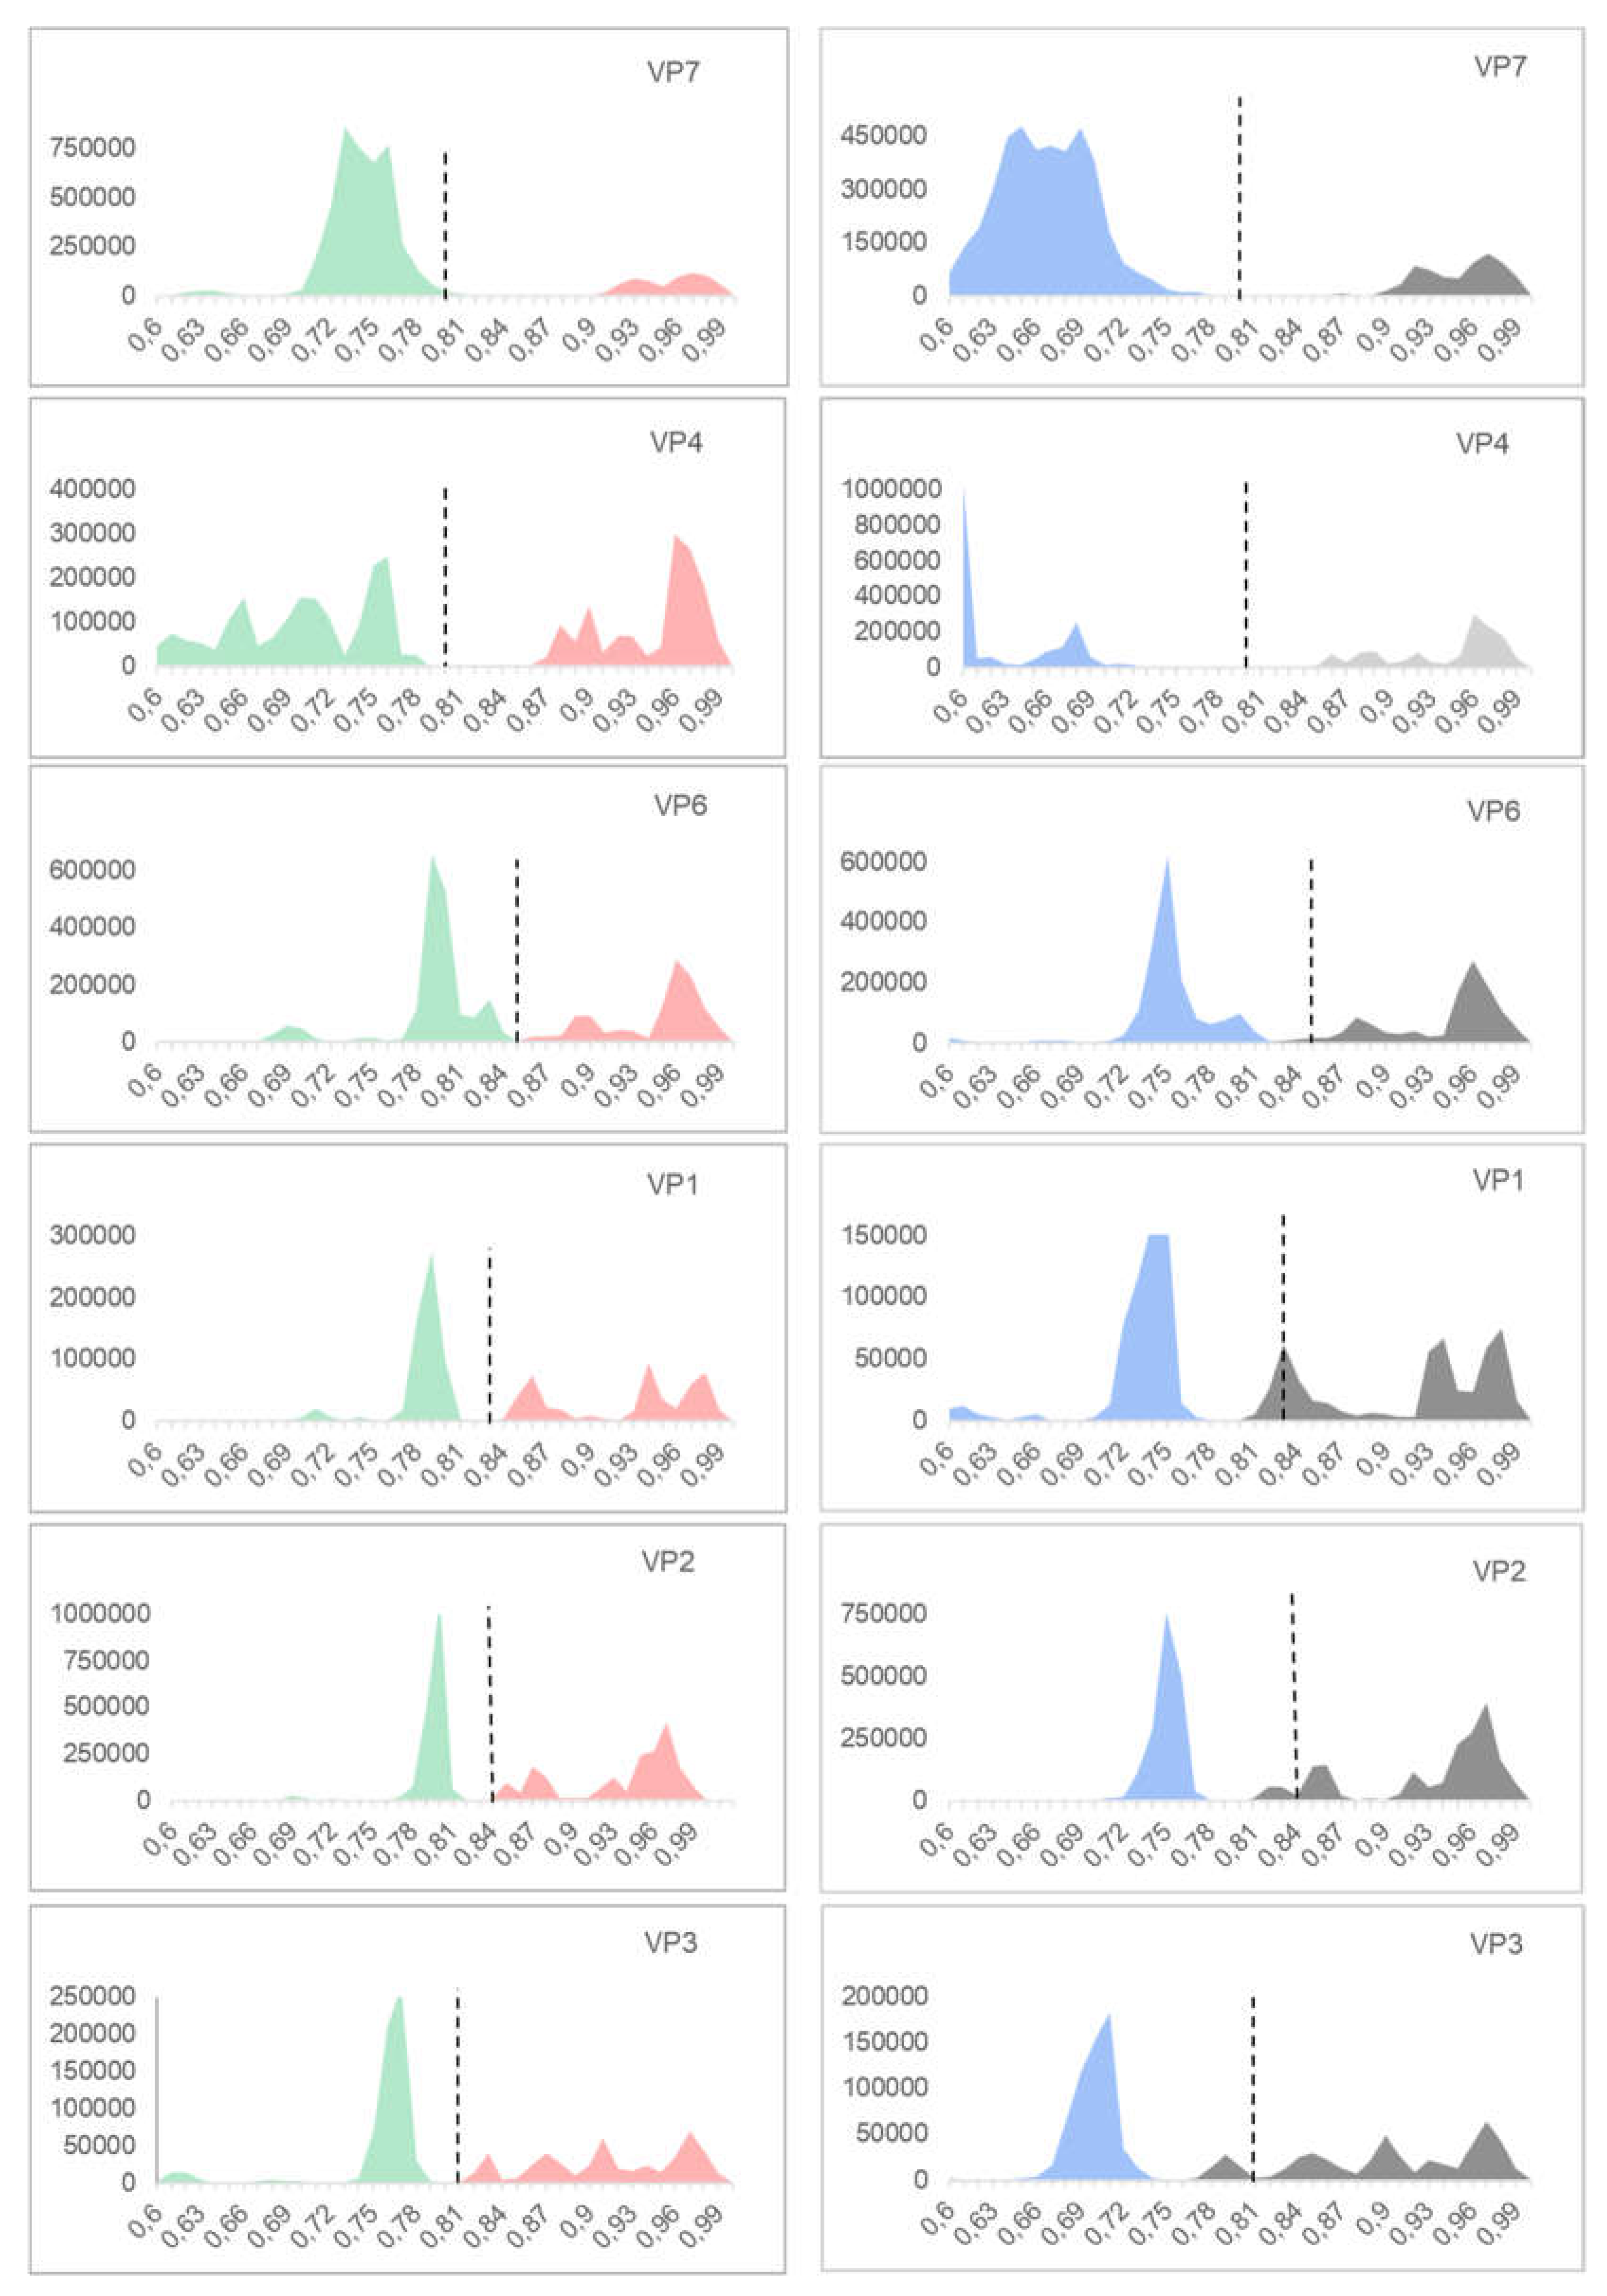
Figure 3.
Histograms of pair identities for each Non-structural Protein (NSP). In the ordinates the identities and in the abscise the number of pairs of sequences measured are shown. P-distance histograms are at the left, intra genotype identities are represented in red and inter genotype identities in green. K2P histograms ath the right, intra genotype identities are represented in grey and inter genotype identities in light blue. Dotted lines represent the cutoff value proposed by Matthijnssens et al. in 2008 [28].
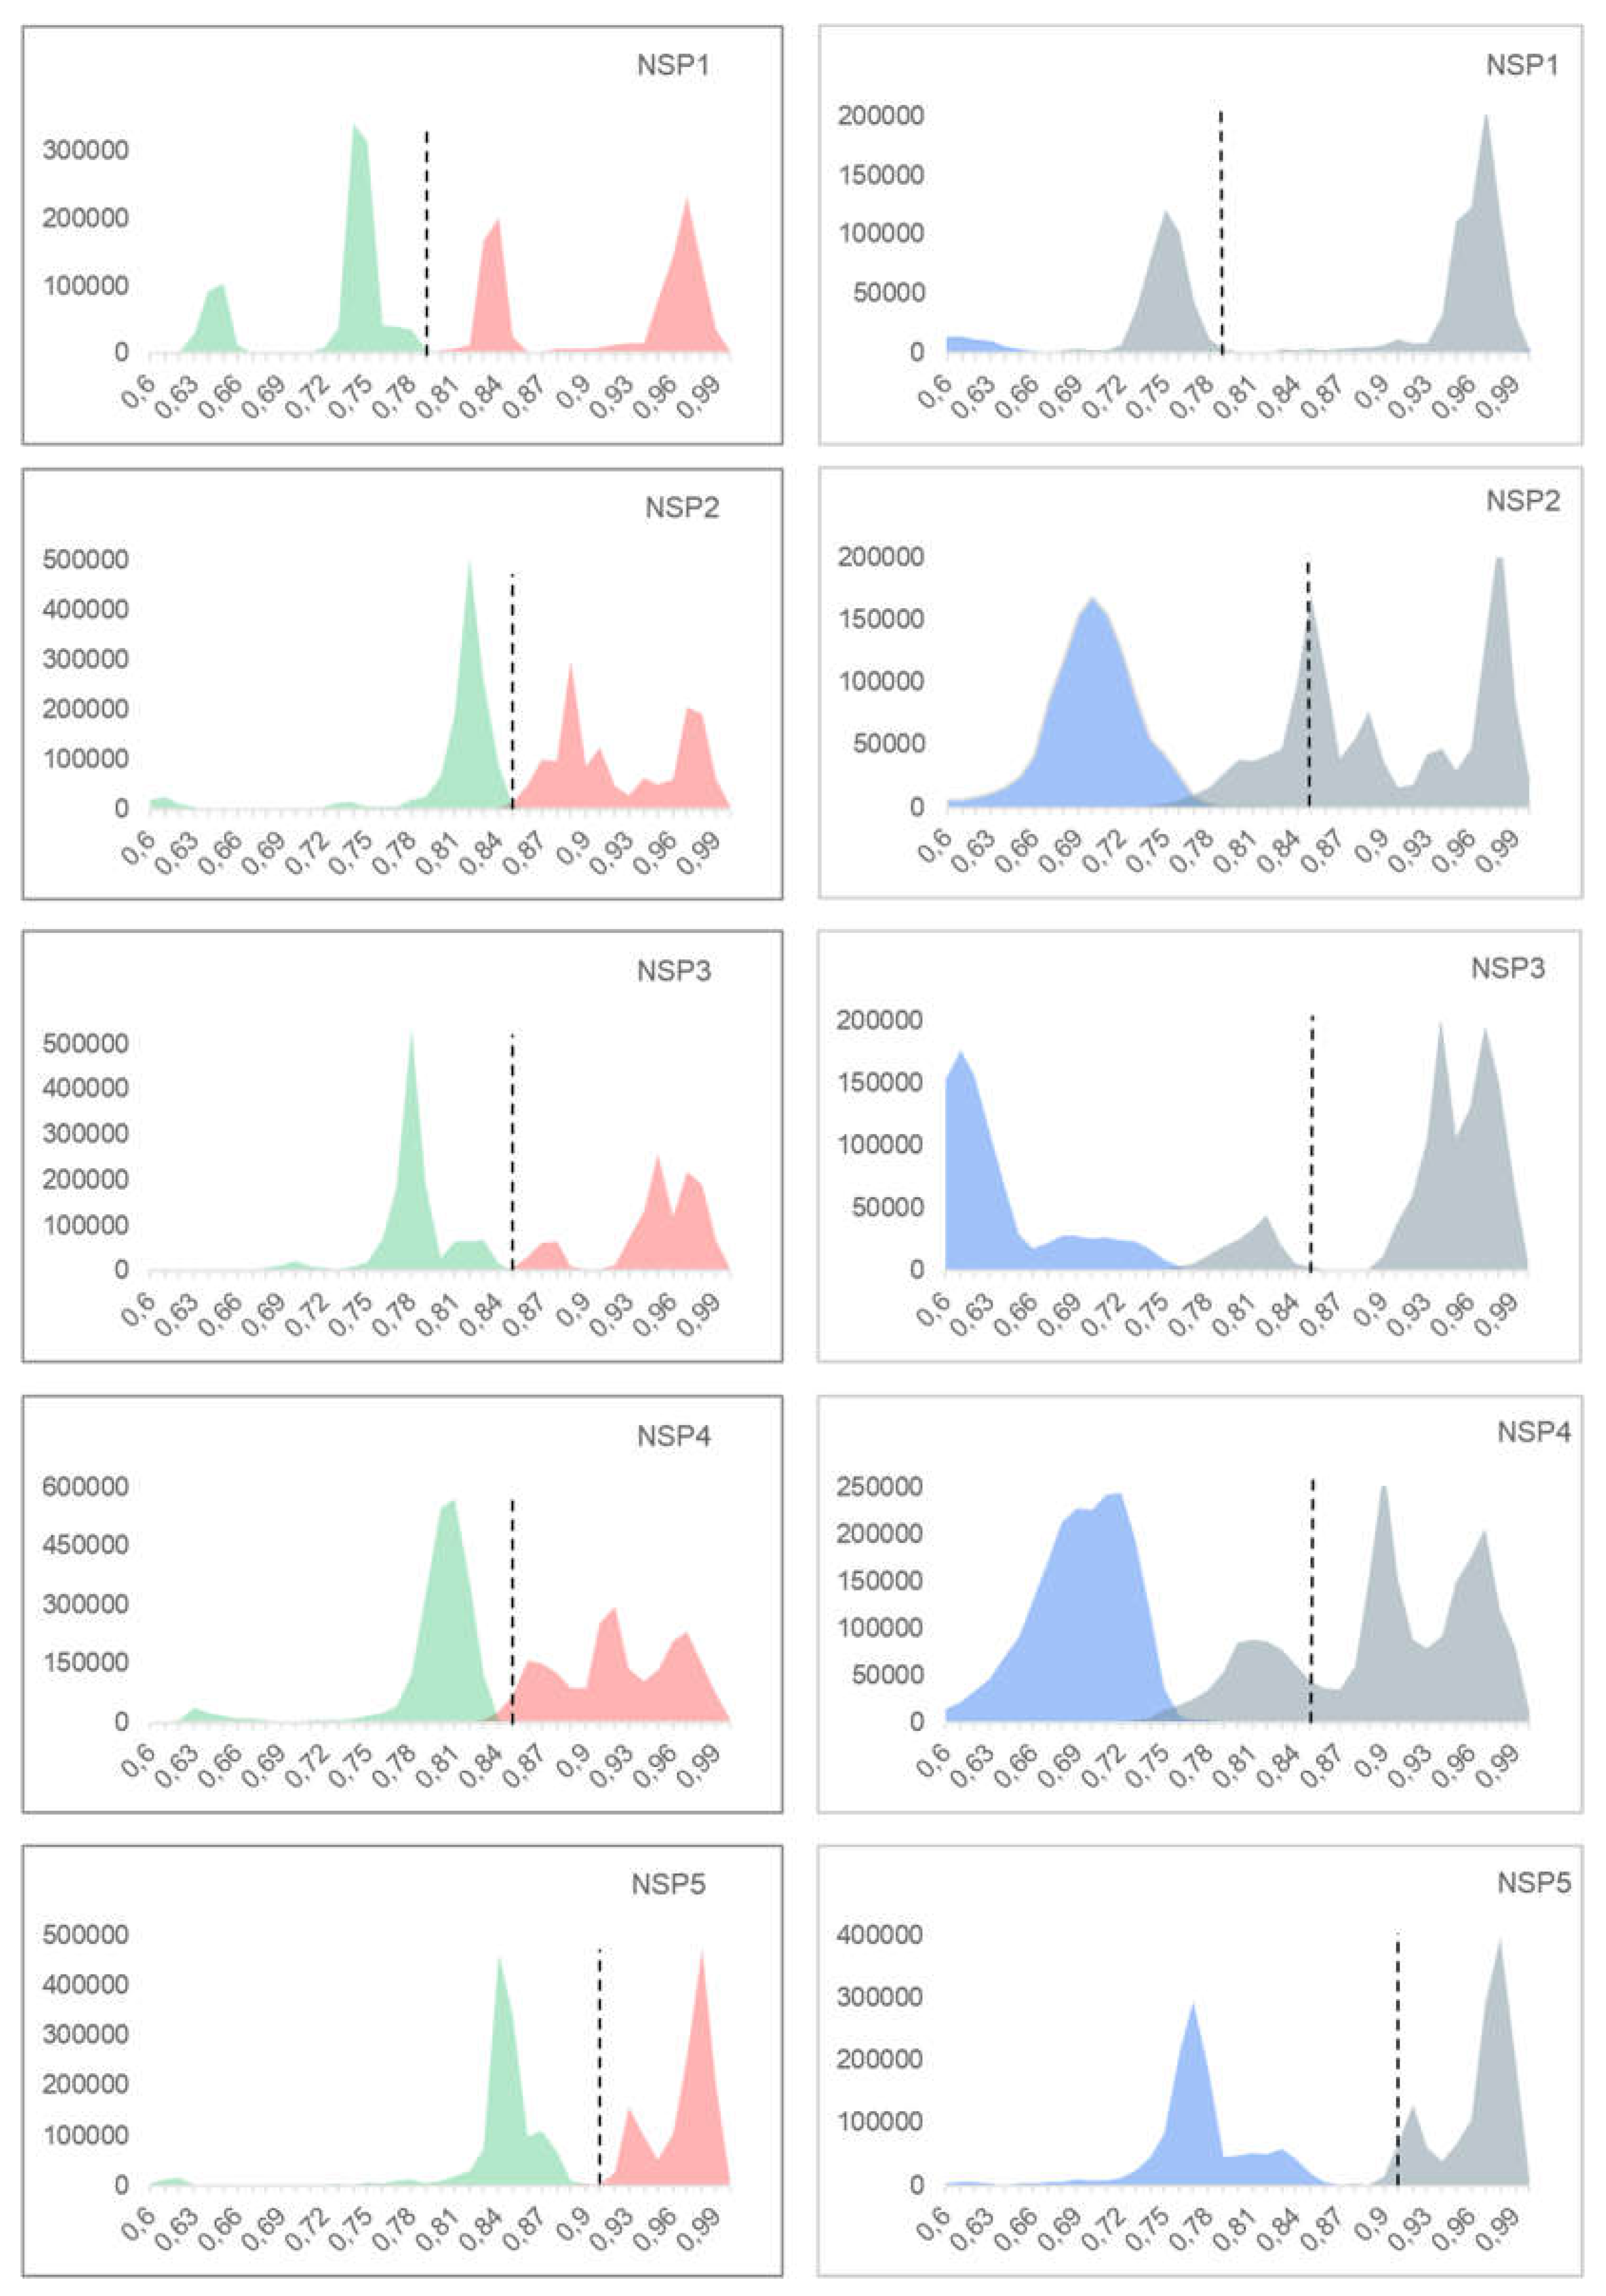
Table 1.
Information about the encoded proteins of RVA. The classification notations used, the number of sequences analyzed in the previous work (2008), the present work (2024) and the current number of genotypes [29].
Table 1.
Information about the encoded proteins of RVA. The classification notations used, the number of sequences analyzed in the previous work (2008), the present work (2024) and the current number of genotypes [29].
| Comparison between Previous and Present Work | ||||||||
| Gene | Encoded protein | Notation | Cutoff Value | 2008* | This work (2024) | Current Genotype | ||
| Strains | Genotypes | Strains | Genotypes | |||||
| VP7 | Glycosylated | G | 80 | 1,000 | 15 | 3172 | 36 | 42 |
| VP4 | Protease-sensitive | P | 80 | 190 | 27 | 2771 | 51 | 58 |
| VP6 | Inner capsid | I | 85 | 142 | 10 | 2463 | 26 | 32 |
| VP1 | RNA- polymerase | R | 83 | 58 | 4 | 1495 | 22 | 28 |
| VP2 | Core protein | C | 84 | 58 | 5 | 2754 | 20 | 24 |
| VP3 | Methyltransferase | M | 81 | 67 | 6 | 1507 | 20 | 23 |
| NSP1 | Interferon Antagonist | A | 79 | 100 | 14 | 2208 | 31 | 39 |
| NSP2 | NTPase | N | 85 | 71 | 5 | 2358 | 22 | 28 |
| NSP3 | Translation enhancer | T | 85 | 77 | 7 | 2294 | 22 | 28 |
| NSP4 | Enterotoxin | E | 85 | 100 | 6 | 3183 | 27 | 32 |
| NSP5 | pHosphoprotein | H | 91 | 113 | 6 | 2332 | 22 | 28 |
* Work of 2008, where the cutoff values were stablished [4].
Table 2.
Reference strains of all genes. The highlighted genotypes represent the reference for that genotype. The first 41 strains were taken from Matthijnssens et al. in 2008 [28] and the others from the RCWG homepage, accessed in July 2024 [29].
| Reference Strains for Each Genotypes | |||||||||||
| Strain name | VP7 | VP4 | VP6 | VP1 | VP2 | VP3 | NSP1 | NSP2 | NSP3 | NSP4 | NSP5 |
| RVA/Human-tc/USA/WaCS/1974/G1P[8] | G1 | P[8] | I1 | R1 | C1 | M1 | A1 | N1 | T1 | E1 | H1 |
| RVA/Human-tc/USA/DS-1/1976/G2P[4] | G2 | P[4] | I2 | R2 | C2 | M2 | A2 | N2 | T2 | E2 | H2 |
| RVA/Human-tc/JPN/AU-1/1982/G3P[9] | G3 | P[9] | I3 | R3 | C3 | M3 | A3 | N3 | T3 | E3 | H3 |
| RVA/Human-tc/GBR/ST3/1975/G4P2A[6] | G4 | P[6] | I1 | R1 | C1 | M1 | A1 | N1 | T1 | E1 | H1 |
| RVA/Pig-tc/USA/Gottfried/1983/G4P[6] | G4 | P[6] | I1 | R1 | C1 | M1 | A8 | N1 | T1 | E1 | H1 |
| RVA/Pig-tc/USA/OSU/1975/G5P[7] | G5 | P[7] | I5 | R1 | C1 | M1 | A1 | N1 | T1 | E1 | H1 |
| RVA/Cow-tc/USA/NCDV-Lincoln/1971/G6P[1] | G6 | P[1] | I2 | R2 | C2 | M2 | - | N2 | T6 | E2 | - |
| RVA/Human-wt/HUN/Hun5/1997/G6P[14] | G6 | P[14] | I2 | R2 | C2 | M2 | A11 | N2 | T6 | E2 | H3 |
| RVA/Turkey-tc/IRL/Ty-3/1979/G7P[35] | G7 | P[35] | I4 | R4 | C4 | M4 | A16 | N4 | T4 | E11 | H14 |
| RVA/Human-wt/COD/DRC86/2003/G8P[6] | G8 | P[6] | I2 | R2 | C2 | M2 | A2 | N2 | T2 | E2 | H2 |
| RVA/Human-tc/USA/WI61/1983/G9P1A[8] | G9 | P[8] | I1 | R1 | C1 | M1 | A1 | N1 | T1 | E1 | H1 |
| RVA/Human/IND/I321/1996/G10P[11] | G10 | P[11] | I2 | - | - | - | A1 | N2 | T1 | E2 | - |
| RVA/Human-wt/BGD/Dhaka6/2001/G11P[25] | G11 | P[25] | I1 | R1 | C1 | M1 | A1 | N1 | T1 | E1 | H1 |
| RVA/Human-tc/PHL/L26/1987/G12P[4] | G12 | P[4] | I2 | R2 | C2 | M2 | A2 | N1 | T2 | E2 | H1 |
| RVA/Human-tc/THA/T152/1998/G12P[9] | G12 | P[9] | I3 | R3 | C3 | M3 | A12 | N3 | T3 | E3 | H6 |
| RVA/Horse-tc/GBR/L338/1991/G13P[18] | G13 | P[18] | I6 | R9 | C9 | M6 | A6 | N9 | T12 | E14 | H11 |
| RVA/Horse-tc/USA/FI23/1981/G14P[12] | G14 | P[12] | I2 | R2 | C2 | M3 | A10 | N2 | T3 | E2 | H7 |
| RVA/Cow/IND/Hg18/XXXX/G15P[21] | G15 | P[21] | - | - | - | - | - | - | - | E2 | - |
| RVA/Mouse-tc/USA/EDIM/XXXX/G16P[16] | G16 | P[16] | I7 | R7 | C7 | M8 | A7 | N7 | T10 | E7 | H9 |
| RVA/Turkey-tc/IRL/Ty-1/1979/G17P[38] | G17 | P[38] | I4 | R4 | C4 | M4 | A16 | N4 | T4 | E4 | H4 |
| RVA/Pigeon-tc/PO-13/1983/G18P[17] | G18 | P[17] | I4 | R4 | C4 | M4 | A4 | N4 | T4 | E4 | H4 |
| RVA/Chicken-tc/DEU/06V0661/2006/G19P[31] | G19 | P[31] | I11 | - | - | - | - | - | - | - | H8 |
| RVA/Chicken-tc/IRL/Ch-1/1979/G19P[30] | G19 | P[17] | I10 | - | - | - | - | - | - | - | H10 |
| RVA/Simian-tc/ZAF/SA11-H96/1958/G3P[2] | G3 | P[2] | I2 | R2 | C5 | M5 | A5 | N5 | T5 | E2 | H5 |
| RVA/Cat-tc/AUS/Cat97/1984/G3P[3] | G3 | P[3] | I3 | R3 | C2 | M3 | A9 | N2 | T3 | E3 | H6 |
| RVA/Cow-tc/USA/WC3/1981/G6P[5] | G6 | P[5] | I2 | R2 | C2 | M2 | A3 | N2 | T6 | E2 | H3 |
| RVA/Human-tc/GBR/ST3/1975/G4P2A[6] | G4 | P[6] | I1 | R1 | C1 | M1 | A1 | N1 | T1 | E1 | H1 |
| RVA/Cat-tc/AUS/Cat2/1984/G3P[9] | G3 | P[9] | I3 | R3 | C2 | M3 | A3 | N1 | T6 | E3 | H3 |
| RVA/Human-tc/IDN/69M/1980/G8P4[10] | G8 | P[10] | I2 | R2 | C2 | M2 | A2 | N2 | T2 | E2 | H2 |
| RVA/Cow-tc/THA/A5-13/1988/G8P[1] | G8 | P[1] | - | - | - | - | A14 | - | - | - | - |
| RVA/Cow-tc/USA/B223/1983/G10P[11] | G10 | P[11] | I2 | R2 | C2 | M2 | A13 | N2 | T6 | E2 | H3 |
| RVA/Horse-tc/GBR/H-2/1976/G3P[12] | G3 | P[12] | I6 | R2 | C2 | M3 | A10 | N2 | T3 | E2 | H7 |
| RVA/Human-wt/IND/HP140/1987/G6P[13] | G6 | P[13] | I2 | - | - | - | - | - | - | E1 | H1 |
| RVA/Sheep-tc/ESP/OVR762/2002/G8P[14] | G8 | P[14] | I2 | R2 | C2 | M2 | A11 | N2 | T6 | E2 | H3 |
| RVA/Ovine/CHN/Lp14/1981/G10P[15] | G10 | P[15] | I2 | - | - | - | - | - | - | E2 | H3 |
| RVA/Human/IND/RMC321/1989/G9P[19] | G9 | P[19] | I5 | - | - | - | A1 | N1 | T1 | E1 | H1 |
| RVA/Mouse/Brazil/EHP/1981/G16P[20 | G16 | P[20] | - | - | - | - | A7 | - | - | E7 | - |
| RVA/Rabbit/ITA/160-01/2002/G3P[22] | G3 | P[22] | - | - | - | - | - | - | - | E5 | - |
| RVA/Pig-wt/ESP/34461-4/2003/G2P[23] | G2 | P[23] | I5 | - | - | - | - | - | - | E1 | H1 |
| RVA/Rhesus-wt/USA/TUCH/2002/G3P[24] | G3 | P[24] | I9 | R3 | C3 | M3 | A9 | N1 | T3 | E3 | H6 |
| RVA/Human-wt/NPL/KTM368/2004/G11P[25] | G11 | P[25] | I12 | R1 | C1 | M1 | A1 | N1 | T1 | E1 | H1 |
| RVA/Human-tc/ITA/PA260-97/1997/G3P[3] | G3 | P[3] | I3 | R3 | C3 | M3 | A15 | N2 | T3 | E3 | H6 |
| RVA/Cow-wt/ARG/B383/1998/G15P[11] | G15 | P[11] | I2 | R5 | C2 | M2 | A13 | N2 | T6 | E12 | H3 |
| RVA/Horse-wt/ARG/E30/1993/G3P[12] | G3 | P[12] | I6 | R2 | C2 | M3 | A10 | N2 | T3 | E12 | H7 |
| RVA/Pig/ITA/134/04-15/2003/G5P[26] | G5 | P[26] | I5 | - | - | - | - | - | - | E1 | - |
| RVA/Dog-tc/ITA/RV198-95/1995/G3P[3] | G3 | P[3] | - | - | - | - | - | - | - | E8 | - |
| RVA/Pig/THA/CMP034/2000/G20P[27] | G2 | P[27] | I5 | - | - | - | - | - | - | E9 | H1 |
| RVA/Human-wt/ECU/Ecu534/2006/G20P[28] | G20 | P[28] | I13 | R13 | C13 | M12 | A23 | N13 | T15 | E20 | H15 |
| RVA/Cow-wt/JPN/Azuk-1/2006/G21P[29] | G21 | P[29] | I2 | R2 | C2 | M2 | A13 | N2 | T9 | E2 | H3 |
| RVA/Turkey-tc/DEU/03V0002E10/2003/G22P[35] | G22 | P[35] | I4 | R4 | C4 | M4 | A16 | N4 | T4 | E11 | H4 |
| RVA/Chicken-tc/DEU/02V0002G3/2002/G19P[30] | G19 | P[30] | I11 | R6 | C6 | M7 | A16 | N6 | T8 | E10 | H8 |
| RVA/Pig-wt/IRL/61-07-ire/2007/G2P[32] | G2 | P[32] | - | - | - | - | - | - | - | - | - |
| RVA/Pheasant-wt/HUN/Phea14246/2008/G23P[x] | G23 | - | - | - | - | - | - | - | - | - | - |
| RVA/Pig-wt/CAN/CE-M-06-0003/2005/G2P[27] | G2 | P[27] | I14 | - | - | - | - | - | - | - | - |
| RVA/Cow-tc/JPN/Dai-10/2007/G24P[33] | G24 | P[33] | I2 | R2 | C2 | M2 | A13 | N2 | T9 | E2 | H3 |
| RVA/Cow-wt/JPN/Azuk-1/2006/G21P[29] | G21 | P[29] | I2 | R2 | C2 | M2 | A13 | N2 | T9 | E2 | H3 |
| RVA/Mouse-tc/USA/ETD_822/XXXX/G16P[16] | G16 | P[16] | I7 | R7 | C7 | M8 | A7 | N7 | T10 | E7 | H9 |
| RVA/Bat-wt/KEN/KE4852/07/2007/G25P[6] | G25 | P[6] | I15 | - | C8 | - | - | N8 | T11 | E2 | H10 |
| RVA/Pig-wt/JPN/FGP51/2009/G4P[34] | G4 | P[34] | - | - | - | - | - | - | - | - | - |
| RVA/Human-tc/KEN/B10/1987/G3P[2] | G3 | P[2] | I16 | R8 | C5 | M5 | A5 | N5 | T5 | E13 | H5 |
| RVA/Pig-wt/JPN/TJ4-1/2010/G26P[X] | G26 | - | - | - | - | - | - | - | - | - | - |
| RVA/SugarGlider-tc/JPN/SG385/2012/G27P[36] | G27 | P[36] | I19 | R10 | C10 | M9 | A20 | N11 | T13 | E17 | H12 |
| RVA/Camel-wt/KUW/21s/2010/G10P[15] | G10 | P[15] | I1 | R1 | C2 | - | - | N2 | T2 | E15 | H3 |
| RVA/vicugna-wt/ARG/C75/2010/G8P[14] | G8 | P[14] | I2 | R2 | C2 | M2 | - | N2 | T6 | E16 | - |
| RVA/Rabbit-tc/CHN/N5/1992/G3P[14] | G3 | P[14] | I17 | R3 | C3 | M3 | A9 | N1 | T1 | E3 | H2 |
| RVA/Alpaca-wt/PER/356/2010/G3P[14] | G3 | P[14] | I2 | R5 | C3 | M3 | A17 | N3 | T6 | E3 | H3 |
| RVA/Pheasant-tc/GER/10V0112H5/2010/G23P[37] | G23 | P[37] | I4 | R4 | C4 | M4 | A16 | N10 | T4 | E4 | H4 |
| RVA/Camel-wt/SDN/MRC-DPRU447/2004/G8P[11] | G8 | P[11] | I2 | R2 | C2 | M2 | A18 | N2 | T6 | E2 | H3 |
| RVA/Human-wt/BRA/QUI-35-F5/2010/G3P[9] | G3 | P[9] | I18 | R3 | C3 | M3 | A19 | N3 | T3 | E3 | H6 |
| RVA/VelvetScoter-tc/JPN/RK1/1989/G18P[17] | G18 | P[17] | I4 | R4 | C4 | M4 | A21 | N4 | T4 | E4 | H4 |
| RVA/Rat-wt/GER/KS-11-573/2011/G3P[3] | G3 | P[3] | I20 | R11 | C11 | M10 | A22 | N2 | T14 | E18 | H13 |
| RVA/Fox-wt/ITA/288356/2011/G18P[17] | G18 | P[17] | I4 | R4 | C4 | M4 | A16 | N4 | T4 | E19 | H4 |
| RVA/Turkey-tc/IRL/Ty-3/1979/G7P[17] | G7 | P[17] | I4 | R4 | C4 | M4 | A16 | N4 | T4 | E11 | H14 |
| RVA/Human-wt/ITA/ME848-12/2012/G12P[8] | G12 | P[8] | I17 | R12 | C12 | M11 | A12 | N12 | T7 | E6 | H2 |
| RVA/Human-wt/SUR/2014735512/2013/G20P[28] | G20 | P[28] | R13 | C13 | M12 | A23 | N13 | T15 | E20 | H15 | |
| RVA/Common_Gull-wt/JPN/Ho374/2013/G28P[39] | G28 | P[39] | I21 | R14 | C14 | M13 | A24 | N14 | T16 | E21 | H16 |
| RVA/Alpaca-tc/PER/SA44/2014/G3P[40] | G3 | P[40] | I8 | R3 | C3 | M3 | A9 | N3 | T3 | E3 | H6 |
| RVA/Human-wt/BEL/BEF06018/2014/G29P[41] | G29 | P[41] | I2 | R2 | C2 | M2 | A3 | N2 | T6 | E2 | H3 |
| Strain name | VP7 | VP4 | VP6 | VP1 | VP2 | VP3 | NSP1 | NSP2 | NSP3 | NSP4 | NSP5 |
| RVA/Bat-wt/CMR/BatLi09/2014/G30P[42] | G30 | P[42] | I22 | R15 | C15 | M14 | A25 | N15 | T17 | E22 | H17 |
| RVA/Bat-wt/CMR/BatLi08/2014/G31P[42] | G31 | P[42] | I22 | R15 | C15 | M14 | A25 | N15 | T17 | E22 | H17 |
| RVA/Bat-wt/CMR/BatLi10/2014/G30P[42] | G30 | P[42] | I23 | R15 | C15 | M14 | A25 | N15 | T17 | E22 | H17 |
| RVA/Bat-wt/CMR/BatLy03/2014/G25P[43] | G25 | P[43] | I15 | R16 | C8 | M15 | A26 | N8 | T11 | E23 | H10 |
| RVA/Bat-wt/NLD/NPpipi1/2014/GxP[44] | - | P[44] | I23 | R17 | C16 | M16 | A27 | N16 | T18 | - | H18 |
| RVA/Rat-wt/CHN/RA116/2013/G3P[45] | G3 | P[45] | I3 | R3 | C3 | M10 | A22 | N3 | T3 | E3 | H13 |
| RVA/Shrew-wt/CHN/LW9/2013/G32P[46] | G32 | P[46] | I24 | R18 | C17 | M17 | A28 | N17 | T19 | E24 | H19 |
| RVA/Bat-wt/CMR/BatLy17/2014/G30P[47] | G30 | P[47] | I22 | R15 | C15 | M14 | A25 | N15 | T17 | E22 | H17 |
| RVA/Rat-wt/ITA/Rat14/2015/G3P[3] | G3 | P[3] | I1 | R11 | C11 | M10 | A22 | N18 | T14 | E18 | H13 |
| RVA/Bat-wt/CHN/GLRL1/2005/G33P[48] | G33 | P[48] | I25 | R19 | C18 | M18 | - | N19 | T20 | E25 | H20 |
| RVA/Bat-wt/CHN/YSSK5/2015/G3P[3] | G3 | P[3] | I8 | R20 | C2 | M1 | A9 | N3 | T3 | E3 | H6 |
| RVA/Bat-wt/CHN/BSTM70/2015/G3P[3] | G3 | P[3] | I8 | R3 | C3 | M3 | A29 | N3 | T3 | E3 | H6 |
| RVA/Raccoon-wt/JPN/Rac-311/2011/G34P[17] | G34 | P[17] | I26 | R21 | C19 | M19 | A30 | N20 | T21 | E26 | H21 |
| RVA/Pig-wt/BGD/214016006/2014/G9P[49] | G9 | P[49] | - | - | - | - | - | - | - | - | - |
| RVA/Alpaca-wt/PER/Alp11B/2010/G35P[50] | G35 | P[50] | I13 | - | - | - | - | - | - | E16 | H6 |
| RVA/Bat-wt/ZMB/ZFB14-126/2014/GxP[x] | - | - | I22 | - | - | - | - | N21 | T17 | E27 | - |
| RVA/Bat-wt/KEN/BATp39/2015/G36P[51] | G36 | P[51] | I16 | R22 | C20 | M20 | A31 | N22 | T22 | E27 | H22 |
| RVA/Bat/CRC/KCR10-93/2010/G20P[47] | G20 | P[47] | I13 | R13 | C13 | M12 | A32 | N13 | T23 | E20 | - |
| RVA/Bat/GAB/GKS-929/2009/G3P[2] | G3 | P[2] | I30 | R8 | C5 | M5 | A36 | N23 | T5 | E28 | H5 |
| RVA/Bovine-wt/UMN-VDL/2018/G37P[52] | G37 | P[52] | - | - | - | - | - | - | - | - | - |
| RVA/common-shrew/KS-11-2281/2011/GXP[X] | - | - | I27 | R23 | - | - | - | - | - | - | H23 |
| RVA/Bat-wt/KEN/11/2008/G30P[53] | G30 | P[53] | - | - | - | - | A33 | - | - | - | H24 |
| RVA/Bat-wt/GTM/56/2010/G38P[54] | G38 | P[54] | I28 | R24 | C21 | M21 | A34 | N24 | T24 | E29 | H25 |
| RVA/Bat-wt/NGA/59/2011/GXP[2] | - | P[2] | I16 | R8 | C3 | M5 | A35 | N3 | T3 | - | - |
| RVA/Bat-wt/GTM/53/2009/GxPx | - | - | I29 | R25 | - | - | - | N25 | T25 | - | - |
| RVA/Shrew-wt/GER/KS14-269/2014/G39P[55] | G39 | P[55] | - | R26 | C22 | M22 | A37 | N26 | T26 | E30 | H26 |
| RVA/JungleCrow-wt/JPN/JC-105/2019/G40P[56] | G40 | P[56] | I26 | R21 | C19 | M19 | A30 | N20 | T21 | E26 | H21 |
| RVA/MultimammateMouse-wt/ZMB/MpR12/2012/G41P[57] | G41 | P[57] | I31 | R27 | C23 | M23 | A38 | N27 | T27 | E31 | H27 |
| RVA/Shrew-wt/GER/KS11-0893/2010/G42P[58] | G42 | P[58] | I32 | R28 | C24 | L24 | A39 | N28 | T28 | E32 | H28 |
Table 4.
Strains out of the cutoff value calculated with the p-Distance model. Here we compared the number of stains out of the cutoff value for each genotype, the number of strains out of the cutoff value for each gene, and the total of strains analyzed included in each particular gene.
Table 4.
Strains out of the cutoff value calculated with the p-Distance model. Here we compared the number of stains out of the cutoff value for each genotype, the number of strains out of the cutoff value for each gene, and the total of strains analyzed included in each particular gene.
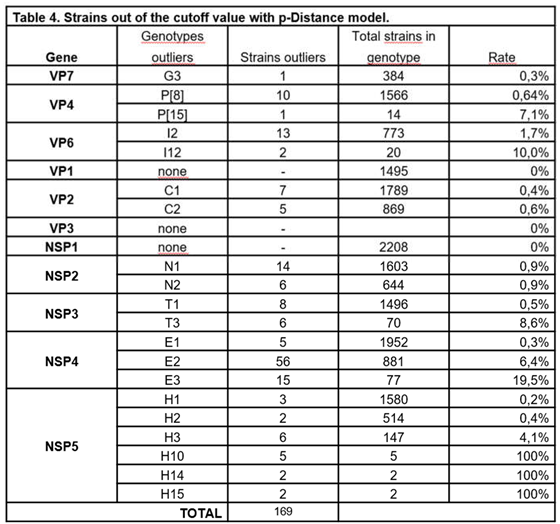
Table 5.
Compared results of RVA strains cutoff analysis. We compared the number of sequences analized in 2008 with the two models used in this study. In the columns are the number of strains out of the cutoff value. In caso of 2008, there are the number of strains analized.
Table 5.
Compared results of RVA strains cutoff analysis. We compared the number of sequences analized in 2008 with the two models used in this study. In the columns are the number of strains out of the cutoff value. In caso of 2008, there are the number of strains analized.
| Comparison between Models | ||||
| Gene | 2008* | This work | ||
| Strains Analyzed | Strains Analyzed |
P-Distyance Out the Cutoff |
K2P Out the Cutoff |
|
| VP7 | 1,000 | 3172 | 1 | 215 |
| VP4 | 190 | 2771 | 11 | 45 |
| VP6 | 142 | 2463 | 15 | 95 |
| VP1 | 58 | 1495 | - | 262 |
| VP2 | 58 | 2754 | 12 | 199 |
| VP3 | 67 | 1507 | - | 165 |
| NSP1 | 100 | 2208 | - | 502 |
| NSP2 | 71 | 2358 | 20 | 1234 |
| NSP3 | 77 | 2294 | 14 | 255 |
| NSP4 | 100 | 3183 | 76 | 1025 |
| NSP5 | 113 | 2332 | 20 | 252 |
| *Work of 2008 [4]. | ||||
Disclaimer/Publisher’s Note: The statements, opinions and data contained in all publications are solely those of the individual author(s) and contributor(s) and not of MDPI and/or the editor(s). MDPI and/or the editor(s) disclaim responsibility for any injury to people or property resulting from any ideas, methods, instructions or products referred to in the content. |
© 2024 by the authors. Licensee MDPI, Basel, Switzerland. This article is an open access article distributed under the terms and conditions of the Creative Commons Attribution (CC BY) license (http://creativecommons.org/licenses/by/4.0/).
Copyright: This open access article is published under a Creative Commons CC BY 4.0 license, which permit the free download, distribution, and reuse, provided that the author and preprint are cited in any reuse.


