1. Introduction
The global population, currently estimated at 7.7 billion, is anticipated to reach 9.7 billion by 2050 [
1], placing unprecedented pressure on food production systems. Feeding this growing population sustainably is one of humanity’s most pressing challenges in the coming decades. Among the numerous challenges faced by agriculture, weeds represent as a significant and pervasive threat to global food security. Competing directly with crops for vital resources such as light, water, and nutrients [
2], weeds not only reduce yields but also affect the efficiency of agricultural inputs. It is estimated that that weeds can potentially reduce crop yields by 34% [
3], translating to a staggering global economic losses of over
$100 billion annually. To mitigate these losses, farmers worldwide rely heavily on herbicides, with the market for these chemicals exceeding US
$25 billion per year [
4]. However, this reliance on chemical weed control raises concerns about environmental and human health, including issues such as herbicide resistance, soil and water contamination, and impacts on non-target organisms. This level of crop loss represents a formidable challenge to global food security, particularly in regions where agricultural productivity is already under pressure due to climate change and population growth. The most effective way to address this issue is through a multi-faceted approach, beginning with a comprehensive understanding of weed population dynamics. By studying how weed populations grow, compete and adapt over time under varying environmental and management conditions, researchers and farmers can develop predictive models that anticipate weed responses to diverse control strategies [
5].
Numerous field studies have been conducted on weed biology and its population dynamics and used to model long-term evolution of weed population under different management strategies [
6,
7]. Nonetheless, many of these studies have been carried out over short to medium experimental timeframes (< 8 years), which can limit their ability to identify long-term trends for several reasons. First, changes in management practices may be cumulative over time and may not produce immediate effects on the weed community in a short-medium experimental period [
8,
9]. For instance, research has demonstrated that the influence of different tillage systems on weed communities often takes several years to stabilize and reveal clear patterns [
10]. Second, many weed species produce long-lived seeds that persist in the soil and exhibit complex patterns of seedling emergence [
11,
12]. This dynamic complicates efforts to accurately capture the full scope of population responses in studies limited to shorter durations. Therefore, analyzing long-term data is essential for identifying underlying trends in weed populations and understanding the cumulative impacts of agricultural practices and environmental changes. Long-term studies enable researchers to observe variations and patterns that may not be apparent in shorter studies, providing a more comprehensive understanding of the ecological and evolutionary processes that govern weed behavior. Furthermore, these extended analyses help identify the resilience and adaptability of weed species, informing more effective and sustainable weed management strategies. By examining prolonged data sets, such as herbicide applications or crop rotation, researchers can also better assess the consequences of shifting agricultural practices and climate change on weed dynamics, leading to improved predictions and interventions for future agricultural sustainability [
13].
This paper addresses these challenges by analyzing data from a 26-year-long field experiment conducted in a biennial cereal-legume rotation system in central Spain. The extended duration of this experiment and the use of a novel methodological approach in weed science provide a unique opportunity to explore species-specific patterns in time-series population abundance, with a focus on identifying consistent common trends (CTs) across multiple weed species. These CTs are crucial for understanding the collective responses of weed populations to long-term agricultural and environmental influences. Furthermore, it examines the extent to which these trends are modulated by local such as temperature and precipitation, and global climatic drivers, including the North Atlantic Oscillation (NAO). By linking population dynamics to climatic influences, the research provides valuable insights into how environmental variability interacts with agricultural practices to shape weed community structure over time.
2. Materials and Methods
2.1. Site and Sampling
A data set from a 26-year study (1985-2011) carried out at El Encin Experimental Station (Alcala de Henares, Madrid, Spain; latitude, 40° 29’ N, Longitude, 3° 22' W; Altitude, 610 m) was analyzed. The experimental site has a Mediterranean climate with mild, wet winters and warm to hot, dry summers. The average annual rainfall during the 26-year study period was 430 mm and the average annual temperature was 13.8 ºC. The soil of the experimental field is alfisol xeralf, from the caciortic-molic subgroup, with a pH 7.8 and 1.2% organic matter. The cropping system involve a biennial 2-year rotation of cereal and legumes under conventional tillage practices. In the wheat rotation phase, fertilizers were applied at relatively high rates (76 kg N, 120 kg P, 40 kg K ha-1), and post-emergence herbicide were used to control dicotyledonous weeds at the tillering stage. In the legume rotation phase, no fertilizers or herbicides were applied.
The density of weed species was recorded on an annual basis. Data were collected from 10 samples (30 × 33 cm) each year, with the exception of the initial three years, during which only five samples were taken, and 1995, during which 20 samples were collected. The sampling was arranged in an M-shaped pattern, with a distance of approximately 15 m between samples and at least 3 m from the plot edges. Sampling occurred between February and April and always conducted prior to herbicide application, aligning with the crop development stages of mid-tillering for wheat and stem elongation for legume. The experiment consisted of four different blocks (20 m × 30 m) following a random block design. Detailed information about the experiment is given in [
14,
15].
In this study, eight core weed species were selected based on their consistent presence in the experimental dataset, having been recorded in at least 95% of the 26 years: whitebuttons (
Anacyclus clavatus Desf Pers.), common orache (
Atriplex patula L.), Shepherd´s purse (
Capsella bursa-pastoris L. Medik.), flixweed (
Descurainia sophia (L.) Webb. Ex. Prantl.), fumitory (
Fumaria officinalis L.), henbit (
Lamium amplexicaule L.), common poppy (
Papaver rhoeas L.) and ivyleaf speedwell (
Veronica hederifolia L.). These species are relatively ubiquitous in winter cereal cropping systems across Mediterranean regions, where they are well-adapted to the climatic and agronomic conditions prevalent in these areas [
16,
17]. Given their prevalence and the significance of their ecological and economic impact, these species represent ideal candidates for the study of long-term population dynamics and trends.
2.2. Dynamic Factor Analysis
Dynamic Factor Analysis (DFA) is a powerful statistical technique designed for the analysis of short, multivariate, non-stationary time series data. It is particularly effective in situations where traditional time-series methods struggle to handle the complexity and noise inherent in real-world datasets. DFA operates by postulating that a small number of latent (unobservable) factors can adequately capture and explain the shared dynamics underlying a larger set of observed time series. In agricultural systems, DFA can reveal how shared environmental or management factors influence the dynamics of weed populations or crop yields, providing actionable insights for improving long-term sustainability and productivity.
Dynamic Factor Analysis (DFA) constructs Dynamic Factor Models (DFMs) that leverage collective patterns and explanatory factors to capture the underlying structure of multivariate time series data. These models identify latent variables, or factors, that represent shared dynamics across multiple observed time series, simplifying the complexity of the data while retaining essential information [
18,
19,
20]. In the present context, this means that DFA searches for underlying common trends of covariation among weed species across years.
The DFM can be written as:
The equation consists of three terms, combining the common trends, explanatory variables, and noise to model the behavior of the weed populations over time.
The first term is a linear combination of M common trends, the second term represents the explanatory variables and the third term is the noise. sn(t) is the value of the weed populations at time t., where αm(t) is a length M (1 ≤ m ≤ M) vector containing the common unknown trends at time t. ϒm,n are the factor loadings or weighting coefficients for each αm(t) trend. The second term represents the explanatory variables, where βk,n indicates the fitted regression parameters for the kth (for 1 ≤ k ≤ K) explanatory variable xk(t) and the third term is the noise, composed of independent Gaussian noise with zero mean and unknown diagonal covariance matrix denoted by εn(t) and ηm(t), respectively.
The degree of association between each weed species and the common trends was assessed using canonical correlation coefficients. The strength of correlation between a given response variable and the common trends can be determined by the magnitude of the coefficient, with a coefficient closer to unity indicating a stronger correlation [
18]. The descriptions "strong," "moderate," and "weak," are respectively assigned to canonical correlation coefficients with absolute values greater than 0.75, between 0.75 and 0.3, and less than 0.3.
The Dynamic factor analysis was conducted using the statistical software Brodgar Version 2.6.6 (Highland Statistics Ltd., Newburgh, UK) [
19]. The analysis was performed with a maximum of 1500 iterations, and the stopping criterion was established at 0.00001 to assess changes in likelihood [
18].
2.3. Explanatory Variables
In this study, both local and global weather patterns were employed as explanatory variables, allowing for a comprehensive analysis of the influence of various atmospheric conditions on potential long-term trends in weed population dynamics. By integrating local weather data (temperature and precipitation) with broader global climate trends, we aimed to elucidate the intricate relationships and interactions occurring at different climatic scales. We assessed local weather using mean seasonal temperature (MST; ºC) (the season is defined as October to April), mean seasonal precipitation (MSP; mm) and global weather with the North Atlantic Oscillation (NAO). The latter is a major determinant of weather and climate variability in Europe [
21]. MST and MSP were collected from the meteorological station situated at El Encin experimental station. The NAO index was obtained from the Climate Predictions Center (USA) [
22]. The integration of both local and global weather data allowed us to investigate how atmospheric conditions, operating at different scales, interact to influence long-term trends in weed population abundance. For instance, variations in MST and MSP can directly affect germination rates, growth cycles, and seed production, while broader NAO-driven climatic shifts can modulate the overall suitability of the environment for specific weed species. These combined factors provide a holistic understanding of how climatic and environmental variability shapes weed population dynamics over extended timescales.
The NAO index plays a significant role in shaping temperature and precipitation patterns across Europe, including the study region [
23]. Positive phases of the NAO index are associated with a strengthened polar jet stream, leading to mild and wet climates in Northern Europe. Conversely, negative NAO phases result in weaker westerly winds and a weakened polar jet stream, producing colder and drier conditions, particularly in Western Europe. These variations in weather patterns influence soil moisture availability, temperature regimes, and growing conditions, which are critical factors for plant growth, seed dormancy, and seedling emergence [
24,
25].
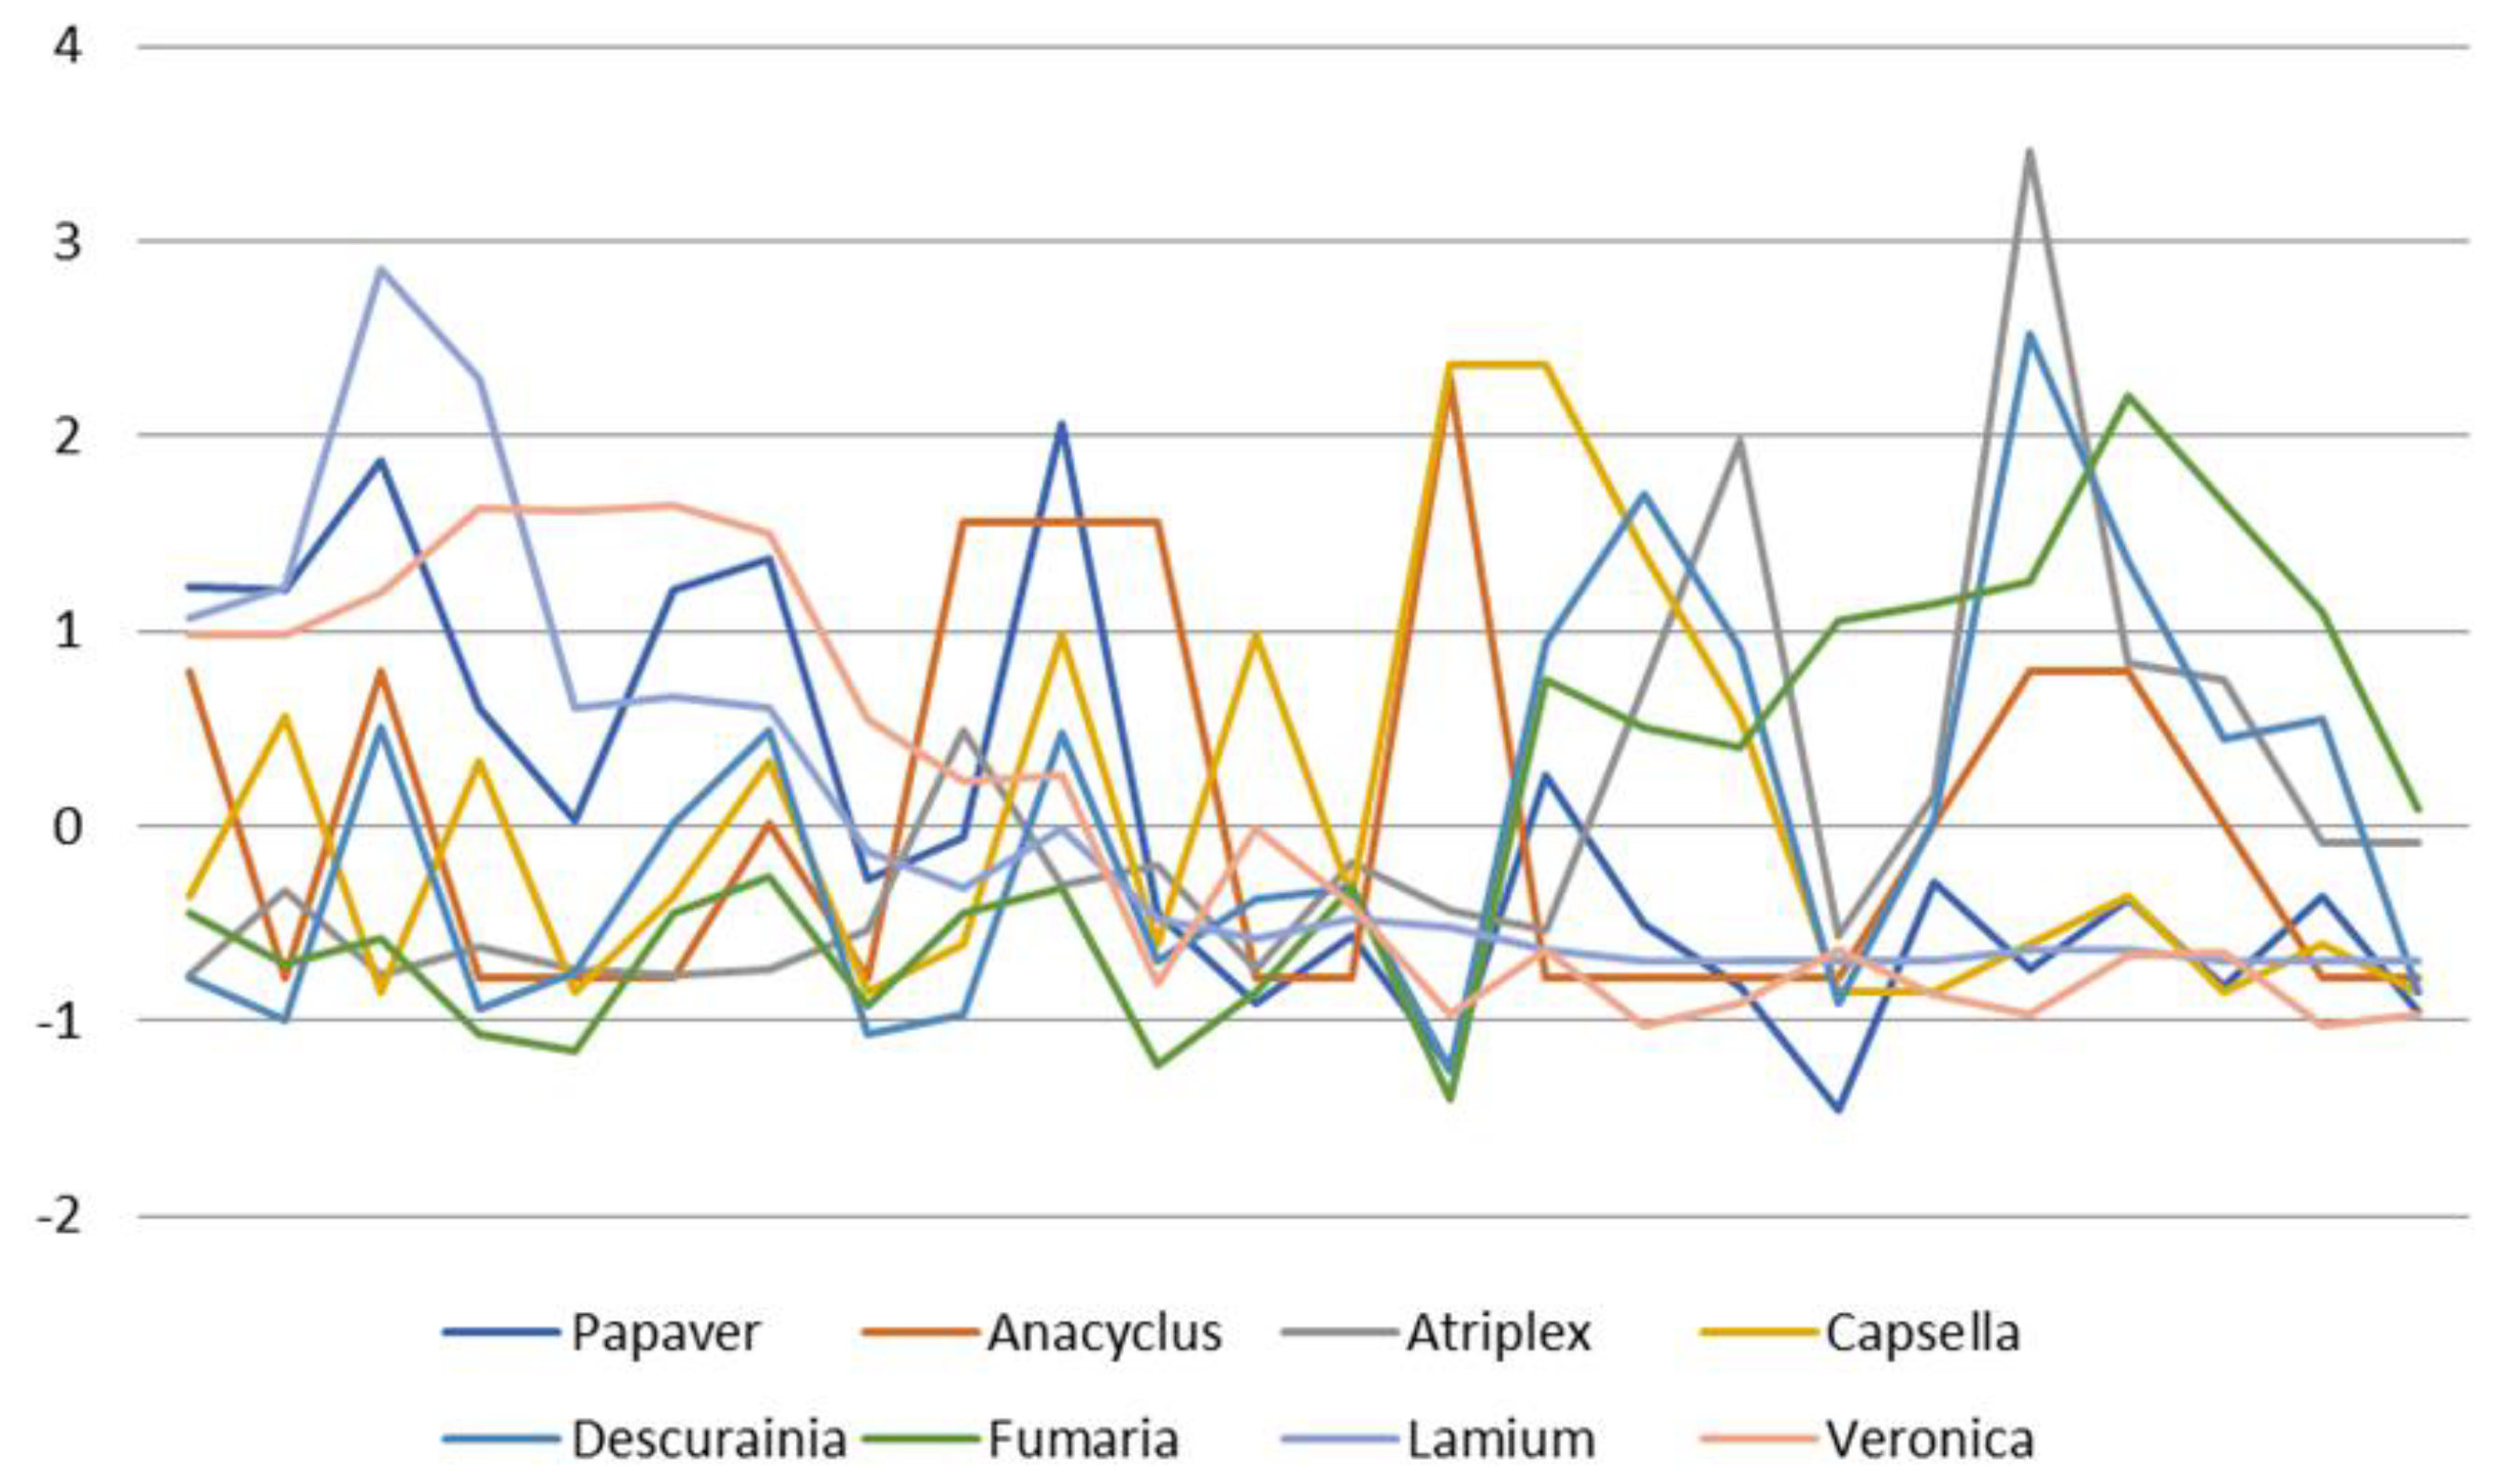
Each dataset was logarithmically transformed and standardized by subtracting its mean and dividing by its standard deviation. This resulted in each series being centered around zero with a variance of one, thus ensuring that all time series were on the same scale (
Figure 1).
The analysis unfolded in two separate phases. During the first phase, multiple models were compared by varying the number of common trends (M). The best model was identified using the Akaike Information Criterion (AIC), with the model exhibiting the lowest AIC value deemed the best. Akaike Information Criterion (AIC) was used to choose the best model [
26]. It is calculated as: AIC = –2(log–likelihood)+2k, where k is the number of parameters estimated in the model, with the model exhibiting the lowest AIC value deemed the best. For small sample sizes, the corrected Akaike Information Criterion (AICc) should be used: AICc = AIC+(2k(k+1))/(n–k–1), where n is the sample size. Although the best model is that with the lowest AIC value, it can be very useful to rank the models’ subject to the values of AICc. It may show whether there are other plausible model(s) among the group of models studied. The models can be ranked using ∆i, which is calculated as: ∆i = AICc–minAICc. ∆i can easily be interpreted using the following rule of thumb [
23]. ∆i ≤ 2 indicates a strongly plausible model; ∆i values between 3 and 7 indicate a plausible model; and ∆i > 10 indicates a very unlikely model. Akaike weights (w
i) provide another measure of the strength of evidence for each model:
The Akaike weights show the probability that a model is the best among the whole set (n) of candidate models.
In the second phase, additional models were constructed based on the selected model, integrating various explanatory variables and their combinations. These models were then compared using AIC (
Table 1).
3. Results and Discussion
The primary objective of this study was to identify long-term temporal trends in a weed community growing in a biennial cereal-legume rotation and to explore their relationship with climate factors. DFA was fitted assuming either 1 to 3 common trends. AIC
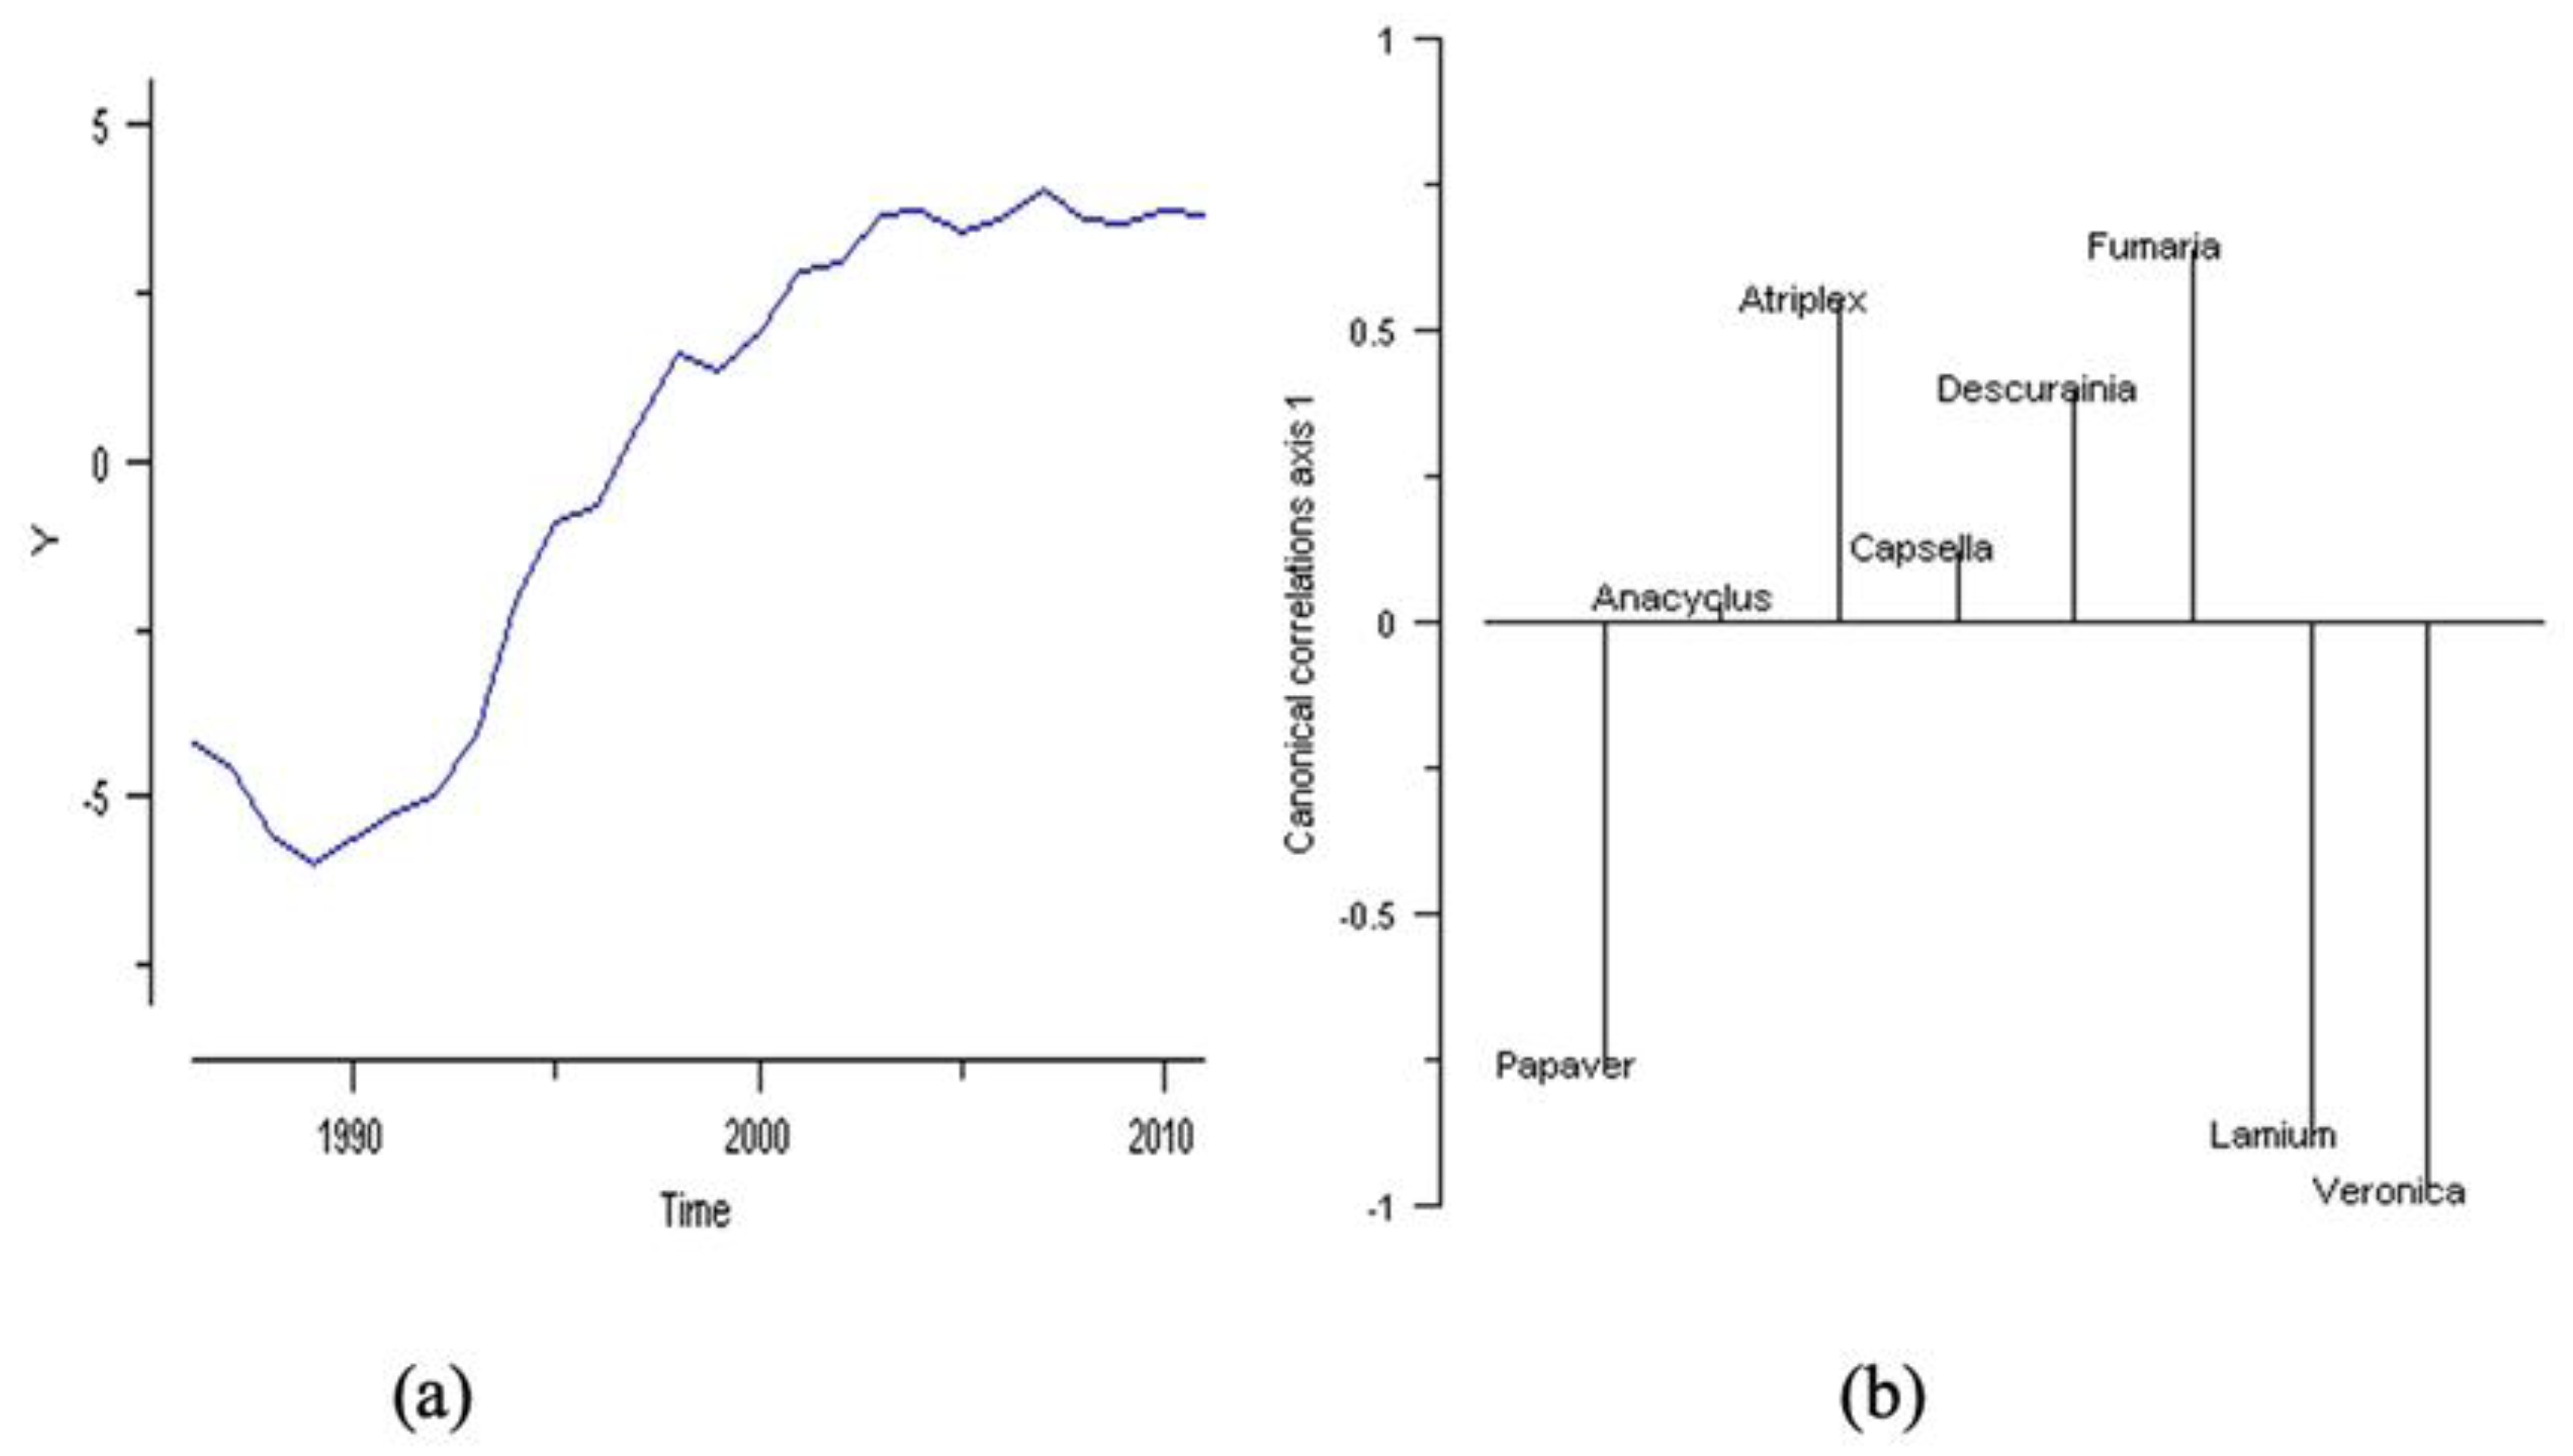
c values indicated that the optimal model consisted of a single common trend (data not shown), revealing a consistent underlying trend that significantly influences the temporal dynamics of the weed community. This trend exhibited a slight decline between 1986 and 1989, followed by a sharp increase from 1990 to 2005, ultimately stabilizing thereafter (
Figure 2a). While the precise causes of these fluctuations remain uncertain, the existence of this common trend implies that shared underlying factors are impacting all observed weed time series. This phenomenon can be regarded as a "black box", suggesting that the potential explanation is shared across all the weed time series.
The influence of the common trend on each weed time series was assessed using canonical correlation coefficients (
Figure 2b). The analysis showed a strong negative correlation (> 0.75) with
P. rhoeas,
L. amplexicaule, and
V. hederifolia (
Figure 2b). In contrast, a moderate positive correlation was observed with
A. patula,
D. sophia, and
F. officinalis, while
A. clavatus and
C. bursa-pastori exhibited a weak positive correlation (
Figure 2b).
Incorporating explanatory variables into the Dynamic Factor Model (DFM) can enhance our understanding of the unexplained variability by accounting for fluctuations related to known physical processes, such as those represented by the explanatory time series. According to the AIC-based model selection, the North Atlantic Oscillation (NAO) presented the better AIC
c (
Table 1). The Akaike weight for the NAO model further underscored its robustness, showing a 98.8% probability of being the best model to explain the observed common trend (
Table 1). This high probability suggests that the NAO model provides a more reliable and parsimonious explanation for the variation in the dataset compared to alternative models.
The local weather variables considered did not play a significant role in explaining the common observed trend (
Table 1). This finding is particularly unexpected, given that temperature and precipitation are widely recognized as key factors influencing weed emergence [
27]. This is particularly the case in Mediterranean climates, where the combination of high summer temperatures and low rainfall makes water availability the most significant environmental constraint [
28]. The limited long-term influence of local weather variables, such as seasonal temperature and precipitation, on the observed common trend can be explained by the broader spatial and temporal scale of the forcing mechanisms like NAO. The NAO represents a large-scale atmospheric circulation pattern that can modulate regional and even hemispheric climatic conditions over extended periods. In contrast, local weather variables often exhibit higher spatial and temporal variability, which can dilute their impact on long-term trends. Moreover, while local weather conditions fluctuate seasonally or annually due to short-term atmospheric processes, the NAO operates on decadal timescales, exerting a more persistent influence. This consistency allows it to shape overarching climatic patterns that govern ecosystems and large-scale environmental processes. Additionally, local weather factors are influenced by more localized phenomena, such as microclimatic effects, which might not align systematically with the broader common trends being observed. Therefore, their contributions are overshadowed by the more dominant and integrated effects of the NAO on the trend under investigation.
Conversely, the North Atlantic Oscillation (NAO) index exhibited a significant relationship with the weed community (
Figure 2b). Specifically, it showed a positive correlation with
A. patula,
C. bursa-pastoris,
D. sophia, and
F. officinalis, while being negatively correlated with
P. rhoeas,
V. hederifolia, and
L. amplexicaule (
Figure 2b). This suggests that the higher abundance of
A. patula,
C. bursa-pastoris,
D. sophia, and
F. officinalis during the 1990s coincided with a decline in the abundance of
P. rhoeas,
V. hederifolia, and
L. amplexicaule during the same period. The relationship between NAO and weed communities can be understood through the framework of density-independent regulation, where climate-driven factors influence plant populations regardless of their density. These factors, which include variations in temperature, precipitation patterns, and seasonal timing driven by climatic oscillations, play a pivotal role in shaping the abundance, distribution, and reproductive success of plant species. This dynamic is consistent with existing literature that emphasises the significance of both endogenous factors, such as intrinsic growth rates and species-specific traits, and exogenous factors, including environmental variability and disturbance regimes, in driving the long-term dynamics of plant populations [
9,
15].
The impact of the NAO on plant growth and survival has been demonstrated by numerous researchers [
24,
29]. The findings of this study indicate that the NAO represents a long-term trend that exerts a determining influence on the dynamics of the studied weed community. This conclusion aligns with the results reported by Lima et al. [
30]. These authors demonstrate that the long-term population dynamics of
D. sophia and
V. hederifolia are influenced by the NAO to varying degrees, with a stronger effect observed for D. sophia than for
V. hederifolia. Additionally, they emphasize that the type of management determines the extent to which the NAO influences weed communities. For instance, the aforementioned authors show that the NAO exerts a more pronounced influence in systems with minimum tillage compared to no-tillage. On the other hand, the efficacy of herbicide applications is affected by NAO-induced variability in climate. For instance, wetter conditions linked to a positive NAO phase may result in reduced herbicide absorption due to runoff or dilution, thereby necessitating adjustments in application timing and dosage [
31]. Conversely, during drier periods linked to a negative NAO, water-stressed weeds may exhibit reduced herbicide uptake, necessitating the implementation of alternative control strategies. These effects serve to illustrate the significance of climate-adaptive approaches in the context of weed management under changing NAO conditions.
It is important to note that while the NAO explains a significant portion of the observed variability in the weed community studied, it does not account for all of it (
Figure 2b). This indicates that there are additional factors not included in the model that may affect the weed community over the long term. For example, some studies [
32] suggest that factors such as fertilization and sowing date are more significant than climate, while others disagree (e.g., [
33]).
The results demonstrate the necessity of considering global climate oscillations (e.g. NAO, El Niño, etc.) in weed management. In particular, NAO is closely associated with climate factors that influence vegetation development. For instance, [
34] observed that a positive NAO during the winter is frequently linked to enhanced vegetation growth in spring across Eurasia.
Our findings underscore the existence of a long-term common trend within the weed community associated with a biennial cereal-legume rotations, revealing latent effects that shape the dynamics of all species within this system. Notably, this common trend, which is correlated with NAO, demonstrates a significant relationship with the weed community, suggesting that these global environmental fluctuations may play a crucial role in influencing weed dynamics over time.
The implications of our study extend beyond the immediate findings, as they contribute to a more comprehensive understanding of the ecological interactions within agricultural systems. By elucidating the connections between NAO and the weed community long-term trends, we emphasize the need for adaptive management strategies that consider these broader environmental influences.
Moreover, we hope that this research serves as a foundation for future investigations into the specific mechanisms by which teleconnections, such as the North Atlantic Oscillation (NAO) and El Niño, impact weed populations. Further research could investigate the direct and indirect pathways through which global climatic variability affects weed ecology. These pathways might include changes in nutrient availability, shifts in plant competition dynamics, alterations in soil moisture regimes, and phenological responses of both crops and weeds. By building on these insights, researchers and practitioners can refine weed management strategies to better adapt to evolving environmental conditions. This, in turn, would strengthen the resilience of agricultural systems, promoting not only the sustainability of weed management practices but also ensuring the long-term viability of crop production in a changing climate.
4. Conclusions
The findings of this study indicate the presence of a single long-term common trend in the dynamics of weed communities within a biennial cereal-legume rotation system. This highlights the influence of systemic factors on population trajectories across multiple species. The trend exhibited a distinct pattern, with an initial decline followed by an increase and eventual stabilization over decades. A key driver of these dynamics was the North Atlantic Oscillation (NAO). The positive phases of the NAO were found to be associated with higher abundances of species such as A. patula, D. sophia, and F. officinalis, while negative phases correlated with reduced abundances of species like P. rhoeas, V. hederifolia, and L. amplexicaule. Consequently, the findings reinforce the significance of the NAO as a key predictor, offering valuable insights for understanding and forecasting associated environmental processes. In contrast, local weather variables, including seasonal temperature and precipitation, showed limited long-term influence on the observed common trend. This suggests that the effects observed in short-term studies may be less significant over extended periods or be influenced by broader climatic and anthropogenic factors, such as agricultural management practices. These findings emphasize the importance of integrating global climatic elements, such as the NAO, into adaptive weed management strategies. Accounting for these factors can facilitate more accurate predictions of weed population dynamics, thereby enabling the implementation of more effective and sustainable agricultural practices in response to changing environmental conditions.
Further research should investigate additional drivers of long-term weed dynamics, such as fertilization regimes, planting schedules, and other climate teleconnections like El Niño. Furthermore, exploring the mechanisms through which global climate patterns interact with local ecological processes, such as nutrient cycling and interspecies competition, could provide deeper insights. This knowledge will enhance the capacity to develop adaptive strategies that promote sustainable crop production and resilient agroecosystems in the face of global climate change.