
Submitted:
13 December 2024
Posted:
16 December 2024
You are already at the latest version
Abstract
Enhancing the flame retardancy of biobased rigid polyurethane foams is a crucial step towards improving the sustainability of the polyurethane industry. In this work, we systematically analyzed the effect of increasing the isocyanate index (NCOindex) and the flame retardant content using a polyol with high renewable content (>97 wt.%). We found outstanding results regarding the CO(g)/CO2(g) index, the most important safety parameter in terms of human safety, whereas a significant reduction of 78% and 69.6 % was observed as a function of increasing the NCOindex and flame retardant (FR) content, respectively. In addition, the FR did not cause an increase of the total smoke produced (TSP), on the contrary, it decreased up to 31.4% after increasing the FR concentration. The MAHRE parameter was also substantially improved, up to 40.6%, indicating the formation of a thicker char layer which protected the foam during burning. This was achieved simultaneously with outstanding improvements of the specific compressive strength of up to +155%. The studies were substantiated by a comprehensive physico-chemical characterization using TGA analysis, water absorption, initial thermal conductivity, FTIR analysis and cell geometry using SEM. These results are of paramount importance to promote the use of biobased rigid polyurethane foams with enhanced fire retardancy.
Keywords:
rigid polyisocyanurate foams
; flammability
; soybased polyols
; isocyanate index
; flame retardant
; smoke emissions
1. Introduction
Rigid polyurethane foams (RPUFs) are well-known in the industry for their high flammability. To address this limitation, two prominent strategies stand out: the development of rigid polyisocyanurate foams (PIR) and the incorporation of flame retardants, either as reactive components or additives, into the polyurethane formulation[1].
Regarding the PIR foams, these rely on the stability of the isocyanurate ring[1], a key molecular backbone which is induced by the trimerization of isocyanates present in a polyurethane foam formulation. To achieve it, a high isocyanate index (NCOindex) is necessary so as to promote isocyanate trimerization. However, this approach might lead to unwanted issues, such as scorching, friability as well as a decrease in the sustainability of the formulation. These problems have been addressed by stabilizing the microstructure using urethane linkages or other similar approaches[1]. In this regard, the use of aromatic polyols obtained from the transesterification of PET residues has been one of the most implemented solutions, bringing down the environmental impact by increasing the recycled content of the formulation[2]. However, if an increase of sustainability is desirable, the development of biobased polyols, particularly from vegetable oils, has been one of the most promising paths[2,3,4]. In recent years, there have been several efforts to increase sustainability by introducing biobased polyols[5,6,7,8,9] or biomass[10,11] in the microstructure of PIR foams.
On the other hand, several types of flame retardants (FRs) are also a widely applied solution in industry for the improvement of fire retardancy[12,13,14]. Unfortunately, the best performance is usually achieved with halogenated FRs, which are known to induce the formation of toxic gases during combustion[13,15]. In addition, several countries are imposing stricter regulations on the use of these FRs, due to their environmental and health impacts. Due to the fact that the emitted smoke poses the greatest threat in the event of a fire, the reduction of these emissions becomes a very important issue.
In this regard, the use of highly ignitible hydrocarbons, such as n-pentane, as physical blowing agents has also led to a reduced flame retardancy. For these reasons, the improvement of the fire retardancy and the reduction of smoke emissions of polyurethane foams obtained from biobased polyols is gaining attention as evidenced from very recent studies[7,8,16].
The early work of Javni et al. [17] showed the promising properties of PIR foams prepared from a soybased polyol with an hydroxyl value of 173 mg KOH.g-1 and by increasing the isocyanate index from 110 up to 350. A very recent study of Zhang et al.[8] replaced a conventional polyether polyol with up to 20 wt.% of a soybased polyol obtaining improvements of the total peak heat release rate (pHRR) as well as lower gaseous emissions. On the other hand, Chen et al.[18] studied the incorporation of soybased polyols containing a phosphorous functionality, attaining substantial improvements of flame retardancy with respect to a control PIR synthesized from a petrochemical polyol. In a similar approach, Zhang et al.[19] found that phosphorus soybased polyols also helped to inhibit flame by the formation of a phosphorous-rich char layer. Other studies also emphasize the relevance of attaining higher flammability of soybased RPUFs[8,19,20,21].
As it can be seen from these studies, even though several strategies have been successfully applied to improve flame retardancy, these are usually not combined with basic studies regarding the microstructure of these foams, a non trivial aspect because these studies help to understand the underlying microstructure of the foam. For example, most of the previously cited studies did not disclose how the isocyanurate yield changed by performing basic infrared studies. Furthermore, to the best of our knowledge, we have not found any study which combined the use of TCPP as flame retardant, hydrocarbon as flame retardant and a polyol entirely obtained from soybean oil. Only studies using other natural biobased polyols have been conducted before[13,15,22,23,24,25].
In this work, we have studied the effect of increasing the isocyanate index from 100 up to 250 as well as the incorporation of flame retardant (TCPP) up to 20 pbw for a polyurethane-isocyanurate formulation based exclusively on a polyol mixture obtained mostly from soybean oil. We used both chemical (water) and physical (n-pentane) blowing agents to achieve apparent densities of polyurethanes typically applied as insulation boardstock, that is, ranging at 30-40 Kg.m-3. Even though the main focus of the study was the flammability and smoke emission studies performed using the cone calorimeter method, we also report an extensive physico-chemical characterization testing the compressive mechanical properties, thermogravimetric analysis (TGA) in nitrogen and air atmospheres, water absorption of the foams, initial thermal conductivity, infrared analysis to determine the microstructure of the resulting foams emphasizing on the isocyanurate yield as well as cell geometry and structure using electronic microscopy (SEM).
2. Materials and Methods
2.1. Materials and Sample Manufacture
For all the tested formulations, we used a polymeric methylene diphenyl diisocyanate (pMDI), denominated commercially as Suprasec 5005 (Huntsman), which had an isocyanate number of 31.0 and a functionality of 2.70. N-pentane (Biopack, analytical standard) was used as the physical blowing agent. Distilled water was used as the chemical blowing agent.
A polyester soybean-based polyol, obtained from Varteco under the trade name OHE290P, was used also as the main polyol. It had an equivalent OH# of 290 mg KOH.g-1 and an average functionality of 2.9. The manufacturer stated that the polyol had at least 97% renewable carbon content (from soybean oil).
An aromatic polyol, commercially known as Stepanpol PS2352, with an hydroxyl value of 230-250 mg KOH-g-1 was kindly provided by Quimidroga. A polydimethylsiloxane, known commercially as Matestab AK8805, was used as surfactant. Dibutyltin dilaurate, known commercially as DABCO T120 (Evonik industries) was used as the gelling catalyst. Dimethylcyclohexylamine (Rubitherm LR18412, Huntsman) was used as the blowing catalyst.
Tris(2-chloroisopropyl)phosphate (TCPP), provided from Bisley international, was used as the flame retardant. Potassium carboxylate (Duroct) and potassium acetate (Dricat), both at 15% vol. in diethylene glycol were purchased from Durachemicals.
2.2. Experimental Methods
Apparent density was measured following the guidelines of ASTM D1622. Six cubic samples with linear dimensions of 25 mm were extracted from the larger foamed blocks and used for the apparent density measurements.
Compressive mechanical properties were measured following the guidelines of ASTM D1621. For each formulation, three cubic samples were tested in both the longitudinal (L) and transverse (T) growth directions at a crosshead speed of 2.5 mm/min. The samples were conditioned by maintaining them at room temperature for at least a week before testing. The ratio of strength in the L-direction to the T-direction was defined as the anisotropic factor (AF).
Thermogravimetric analysis was performed using a Shimadzu TGA60 equipped with a platinum pan. The thermal program started at room temperature and went up to 700°C at a rate of 10°C.min-1 under a continuous nitrogen and air atmosphere.
Water absorption experiments were performed following the guidelines of the ASTM D2842. We used a higher area per unit volume aspect ratio of 2.4 cm-1 so as to induce a higher absorption at a fixed temperature of 25°C. Weight measurements were carried out at intervals of 4 hours and the reported value was associated with the stabilized region[26].
Initial thermal conductivity was measured using the method developed by Harikrishnan et al. [27] and following an identical approach of a previous work of our group [26]. Special care was taken so as to take samples which were representative to the type of measurement conducted, that is, initial thermal conductivity. To this effect, all the polyurethane foams were manufactured the same day and tested a day after, so as to specifically measure the initial thermal conductivity. In this work we will not focus on studying the aging of the foams, a subject which can be consulted elsewhere [26,28].
Fourier transform infrared analysis (FTIR) was performed using a Shimadzu IRAffinity-1 instrument using the absorption mode by preparing thin (approximately 100 µm) slices of the manufactured foams. Each spectrum was recorded by taking 40 scans with a resolution of 4.0 cm-1 at ambient temperature. The quantitative analysis of the absorption bands was based on at least 15 random samples and by using the phenyl absorption band (1590 cm-1) to normalize the spectra. In this work we have focus on the obtention of the concentration of urethane (carbonyl stretching centered at 1710 cm-1), isocyanate (stretching vibration of the nitrogen double bond centered at 2270 cm-1) and isocyanurate (stretching vibration of the triazine ring centered at 1410 cm-1) bonds through the quantification of the areas in the spectra. Hence, the normalized areas reported in Table 3 were adimensional. The complete spectra of the samples tested in this work is available upon reasonable request to the authors of this work. Unless otherwise stated, the FTIR measurements were performed on samples which were not subjected to a post-cure cycle.
The foams were prepared using the one-shot method [29], whereas the polyol and all the other components (except the isocyanate) were mixed using a cowles disperser beforehand, a mixture known as polmix. Then, the polmix was introduced into a high density polyethylene cylindrical mould with an internal diameter of 70 mm and the isocyanate was poured in and mixed intensively at 2500 rpm for 25”. The foams were left to cure at least a week before making any characterization.
Fire and smoke emission properties were tested using a cone calorimeter manufactured by Fire Testing Technology (UK) in accordance with the standard ISO 5660:2015. Standardized samples with dimensions of 100 mm by length, 100 width and 50 mm thickness were exposed to thermal radiation emitted by a hot cone. Thermokinetic quantities were determined based on the theory of calorimetry on oxygen consumption. This method is based on the theory that approximately 13.1 kJ of heat is released from each 1 g of oxygen consumed with an accuracy of ± 5%. The samples to be tested were placed in a horizontal position, and the reaction was initiated by igniting the vapors generated above the material as a result of the heat stream emitted by the heated cone. The intensity of thermal radiation to which the samples were exposed was 35 kW/m2. The end of flame combustion was equivalent to the end of material testing. The results obtained during a single test were the following ones. Time to ignition (TTI) was the time in which volatile products released during the action of the heat flow emitted from the cone are ignited by the spark igniter. Time to flameout (TTF) was the time after which the sample will automatically extinguish despite the heat emitted by the cone, or time after which the sample will burn completely. Heat release rate (HRR) was the average heat release rate during the entire test. Peak of heat release rate (pHHR) was defined as the maximum rate of heat release an the time to achieve pHRR was denominated as tpHRR- The total heat release (THR) was the total heat released as a result of combustion of the sample. The effective heat of combustion (EHC) was defined to be the total amount of energy released in a fire in the form of heat. The mass loss rate (MLR) represented the rate at which an object loses mass due to combustion, in a similar way to the mass lost. The total smoke production (TSP) was the total amount of smoke released during the test, a measurement based on the Bouguer's law, which describes the attenuation of a light beam in combustion products. The specific extinction area (SEA) described the amount of smoke generated per 1 kg of fuel during combustion. The total smoke release (TSR) was a parameter related to the rate of smoke emission and the maximum average heat release rate (MARHE) involved the integration of the complete HRR curve rather than the simple ratio of pHRR to time, taking into account the average and cumulative effects of heat release during combustion.
3. Results and Discussion
3.1. Apparent Density
The apparent densities of the foams tested in this study are reported in Table 2. The densities ranged from 31.3 kg/m³ to 44.6 kg/m³. Comparing the results of F2 with F3 revealed a slight increase in apparent density by 8.63%. Additionally, increasing the isocyanate index (NCO index) from 150 to 250 (in formulations F3, F4, and F5) resulted in a consistent increase in apparent density, culminating in a maximum value of 44.6 kg/m³—a total increase of 31.1%. Finally, the addition of a flame retardant in the F7 formulation led to a modest 3.82% increase in apparent density.
The increase in apparent density with a higher isocyanate index was expected because the trimerization reaction competes with the blowing reaction. A higher index accelerated the overall polymerization kinetics, shifting the reaction balance toward polymerization (gelling) at the expense of the blowing process. The slight increase of apparent density as a function of increasing TCPP content was also expected due to the same reason, a fact which was reported before [15]. When comparing the F2 to the F3, we observed a slight increase in apparent density. Although the formulation F3, with its higher concentration of physical blowing agents, would typically lead to a decrease in density, this effect was counteracted by its higher isocyanate index.
3.2. Compressive Mechanical Tests
As already explained in the method section, the results of the compressive mechanical tests are presented in terms of the longitudinal (RCspL), transverse specific properties (RCspT) as well as the anisotropy factor (AF). All the values of these properties can be consulted in Table 2.
The specific compressive strength in the longitudinal direction (RCspL) as a function of the formulation type is depicted in Fig. 1. As it can be deduced, an increase in the isocyanate index caused a substantial increase in the RCspL, with an outstanding improvement of +155% for the highest isocyanate index, i.e. 250. On the other hand, the effect of adding TCPP in the formulation had a negligible effect for the case of 10pbW but an increase of 24.8% for 20pbw. Comparing the RCspL of the biobased formulations with respect to the baseline (F1), we can infer that all the reported values were sensibly lower, except for the case of the F5, where the RCspL was only 11.6% lower. Finally, the anisotropy factor (AF) of the tested formulations is reported in Table 2. As it can be seen, most of the tested formulations gave a relatively higher AF with respect to the baseline formulation, particularly for the F5.
Figure 1.
Specific compressive strength (RcspL) as a function of formulation type.
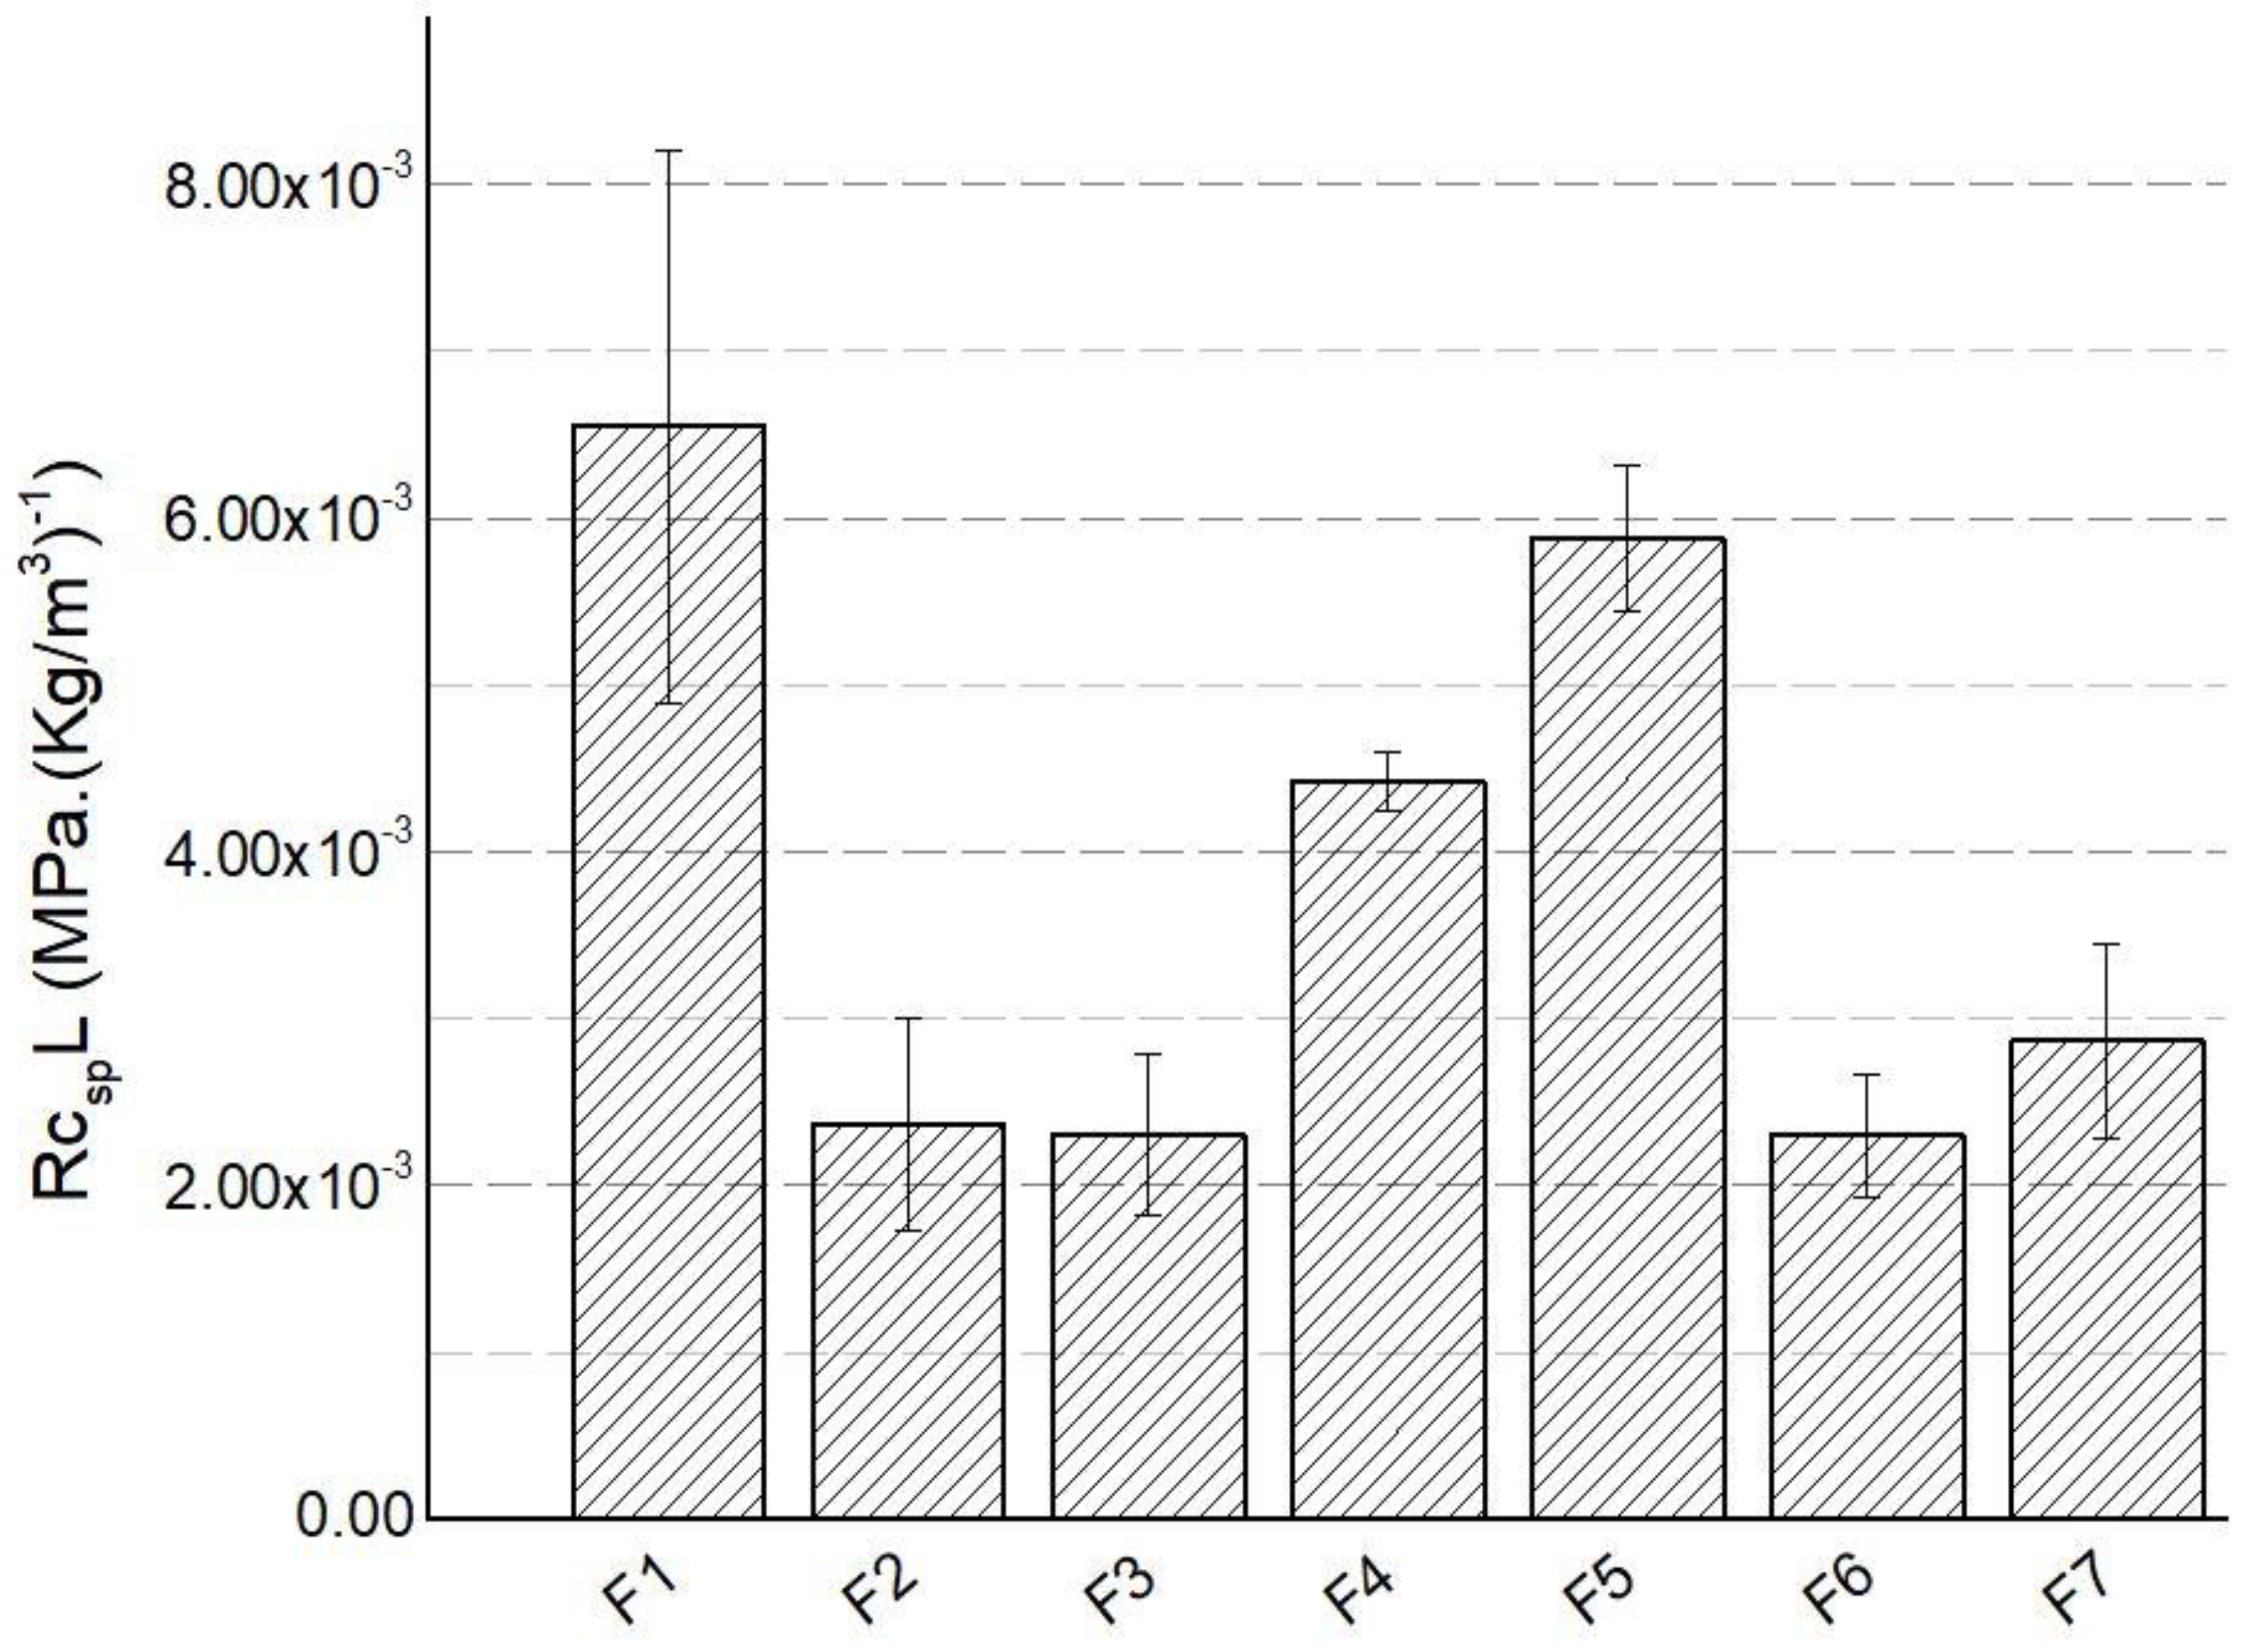
The results presented in the previous paragraph can be deduced from the expected microstructure of the foams developed in this work. For example, the outstanding improvement of RCspL can be attributed to the formation of higher amounts of isocyanurate bonds, which are essential for attaining a PIR foam. This hypothesis can be supported by the FTIR analysis provided in section 3.6, whereas an increase in the isocyanate index was also followed by an increase of the normalized amount of isocyanurate bonds. In addition, the incorporation of TCPP in the formulation was also corroborated by this analysis. Finally, the effect of having a higher AF of the tested formulations was associated with the amount blowing catalyst. As it can be seen in Table 1, all of the tested formulations had a 1 pbw of DMCHA, causing a significant catalysis of the blowing reaction. Taking into account the low reactivity of soybased polyols[30], it was important to increase the amount of blowing catalyst so as to balance the overall foaming catalysis.

Table 1.
Composition of the formulations tested in this work.
| Formulation | pMDI (pbw) | PS2352 (pbw) | TCPP (pbw) | AK8805 (pbW) | DMCHA (pbW) | DBTDL (pbW) | OHE290P(pbW) | Dricat (pbW) | Duroct (pbW) | H2O (pbW) | n-Pentane (pbW) |
| F1 | 205 | 100 | 10 | 2 | 0.4 | 0 | 0 | 0.5 | 3.5 | 0.5 | 20 |
| F2 | 159 | 0 | 0 | 2 | 1 | 1 | 100 | 3.8 | 0 | 5 | 5 |
| F3 | 239 | 0 | 0 | 2 | 1 | 1 | 100 | 3.8 | 0 | 5 | 5 |
| F4 | 319 | 0 | 0 | 2 | 1 | 1 | 100 | 3.8 | 0 | 5 | 5 |
| F5 | 398 | 0 | 0 | 2 | 1 | 1 | 100 | 3.8 | 0 | 5 | 5 |
| F6 | 239 | 0 | 10 | 2 | 1 | 1 | 100 | 3.8 | 0 | 5 | 5 |
| F7 | 239 | 0 | 20 | 2 | 1 | 1 | 100 | 3.8 | 0 | 5 | 5 |
Table 2.
Physical properties of the foams. Part 1.
| Formulation | Apparent density (kg/m3) | RcspL (MPa.( Kg/m3)-1) | RcspT (MPa.( Kg/m3)-1) | AF | Water absorption (Vol.%) | Initial thermal conductivity (mW·K⁻¹·m⁻¹) |
| F1 | 32.6 +/- 0.954 | 6.55.10-3 +/- 1.65.10-4 | 5.12.10-3 +/- 1.05.10-4 | 1.29 +/- 9.08.10-2 | 2.38 | 19.7 |
| F2 | 31.3 +/- 2.26 | 2.37.10-3 +/- 6.37.10-4 | 1.26.10-3 +/- 3.17.10-4 | 2.00 +/- 7.56.10-3 | 1.06 | 21.88 |
| F3 | 34.0 +/- 1.65 | 2.30.10-3 +/- 4.83.10-4 | 1.41.10-3 +/- 2.83.10-4 | 1.61 +/- 4.88.10-2 | 1.71 | 22.3 |
| F4 | 37.6 +/- 1.58 | 4.42.10-3 +/- 1.77.10-4 | 3.54.10-3 +/- 2.83.10-4 | 1.22 +/- 1.11.10-1 | 1.38 | 23.4 |
| F5 | 44.6 +/- 0.694 | 5.87.10-3 +/- 4.36.10-4 | 4.28.10-3 +/- 1.60.10-4 | 1.93 +/- 4.00.10-1 | 1.48 | 23.0 |
| F6 | 33.5 +/- 1.26 | 2.30.10-3 +/- 3.66.10-4 | 1.54.10-3 +/- 3.38.10-4 | 1.33 +/- 1.90.10-1 | 1.97 | 22.6 |
| F7 | 35.3 +/- 1.28 | 2.87.10-3 +/- 5.82.10-4 | 1.72.10-3 +/- 4.53.10-4 | 1.37 +/- 4.05.10-2 | 1.91 | 22.9 |
Table 3.
: Physical properties of the foams. Part 2.
| Formulation | Urethane normalized area | Isocyanurate normalized area | Isocyanate normalized area | Cell size L (um) | Cell size T (um) |
| F1 | 10.39 +/-4.08 | 5.73 +/- 2.38 | 0.405 +/- 0.387 | 386 +/- 41.1 | 193 +/- 16.7 |
| F2 | 4.17 +/- 0.909 | 0.48 +/- 0.0515 | 2.83 +/- 0.656 | 266 +/- 26.0 | 170 +/- 11.6 |
| F3 | 6.10 +/- 4.27 | 0.729 +/-0.523 | 1.88 +/- 0.997 | 472 +/- 40.6 | 223 +/- 16.0 |
| F4 | 10.38 +/- 7.20 | 1.45 +/- 0.901 | 8.36 +/- 5.62 | 494 +/- 36.4 | 265 +/- 12.1 |
| F5 | 11.2 +/- 5.32 | 2.47 +/- 1.37 | 9.33 +/- 4.25 | 421 +/- 16.0 | 261 +/- 17.4 |
| F6 | 8.11 +/- 6.65 | 0.891 +/- 0.745 | 6.43 +/- 5.56 | 390 +/- 14.0 | 238 +/- 6.35 |
| F7 | 8.12 +/- 4.48 | 0.949 +/- 0.457 | 6.03 +/- 3.31 | 407 +/- 62.7 | 211 +/- 12.7 |
3.3. Thermogravimetric Analysis in Nitrogen and Air Atmospheres
The weight residue (WR) and the differential weight residue (DWR) as a function of temperature for the tested formulations in nitrogen and air atmospheres are depicted in Fig. 2. For the case of the nitrogen atmosphere (Fig. 2A and Fig. 2C), the degradation was characterized by several stages, where the most important was the one centered at approximately 326°C (F1). According to previous studies[7,17], this region is associated with the thermal degradation of the rigid segment of the foam, composed mainly of chemical groups such as urethane and urea. From Fig. 2C, it can be deduced that the F1 formulation was associated with the highest thermal degradation rate (see Fig. 2C), in the sense that for this formulation the WR had the strongest decrease at a fixed temperature. In addition, the peak was also centered at the highest temperature (326°C), indicating also that the peak of thermal decomposition was shifted to a higher temperature with respect to all the biobased formulations. For these formulations, we can also notice that an increase of the isocyanate index caused a shift of the degradation peak from 294°C (F3) to 322°C (F5), reaching levels similar to the baseline formulation F1. A similar trend was observed for the effect of increasing the flame retardant concentration, but reaching a peak of 335°C (F7), slightly higher than the baseline formulation F1. Additional degradation stages were also found for higher temperatures, but these degradation stages didn´t show any significant changes as a function of the studied variables. Finally, another relevant aspect to notice was the WR at 700°C, which was 23.3% for the case of the F1 while it reached up to 35% for the case of the F5, suggesting that under a nitrogen atmosphere a higher char should be expected from the biobased formulations.
Figure 2.
Thermogravimetric analysis in nitrogen and air atmospheres as a function of formulation type.
Figure 2.
Thermogravimetric analysis in nitrogen and air atmospheres as a function of formulation type.
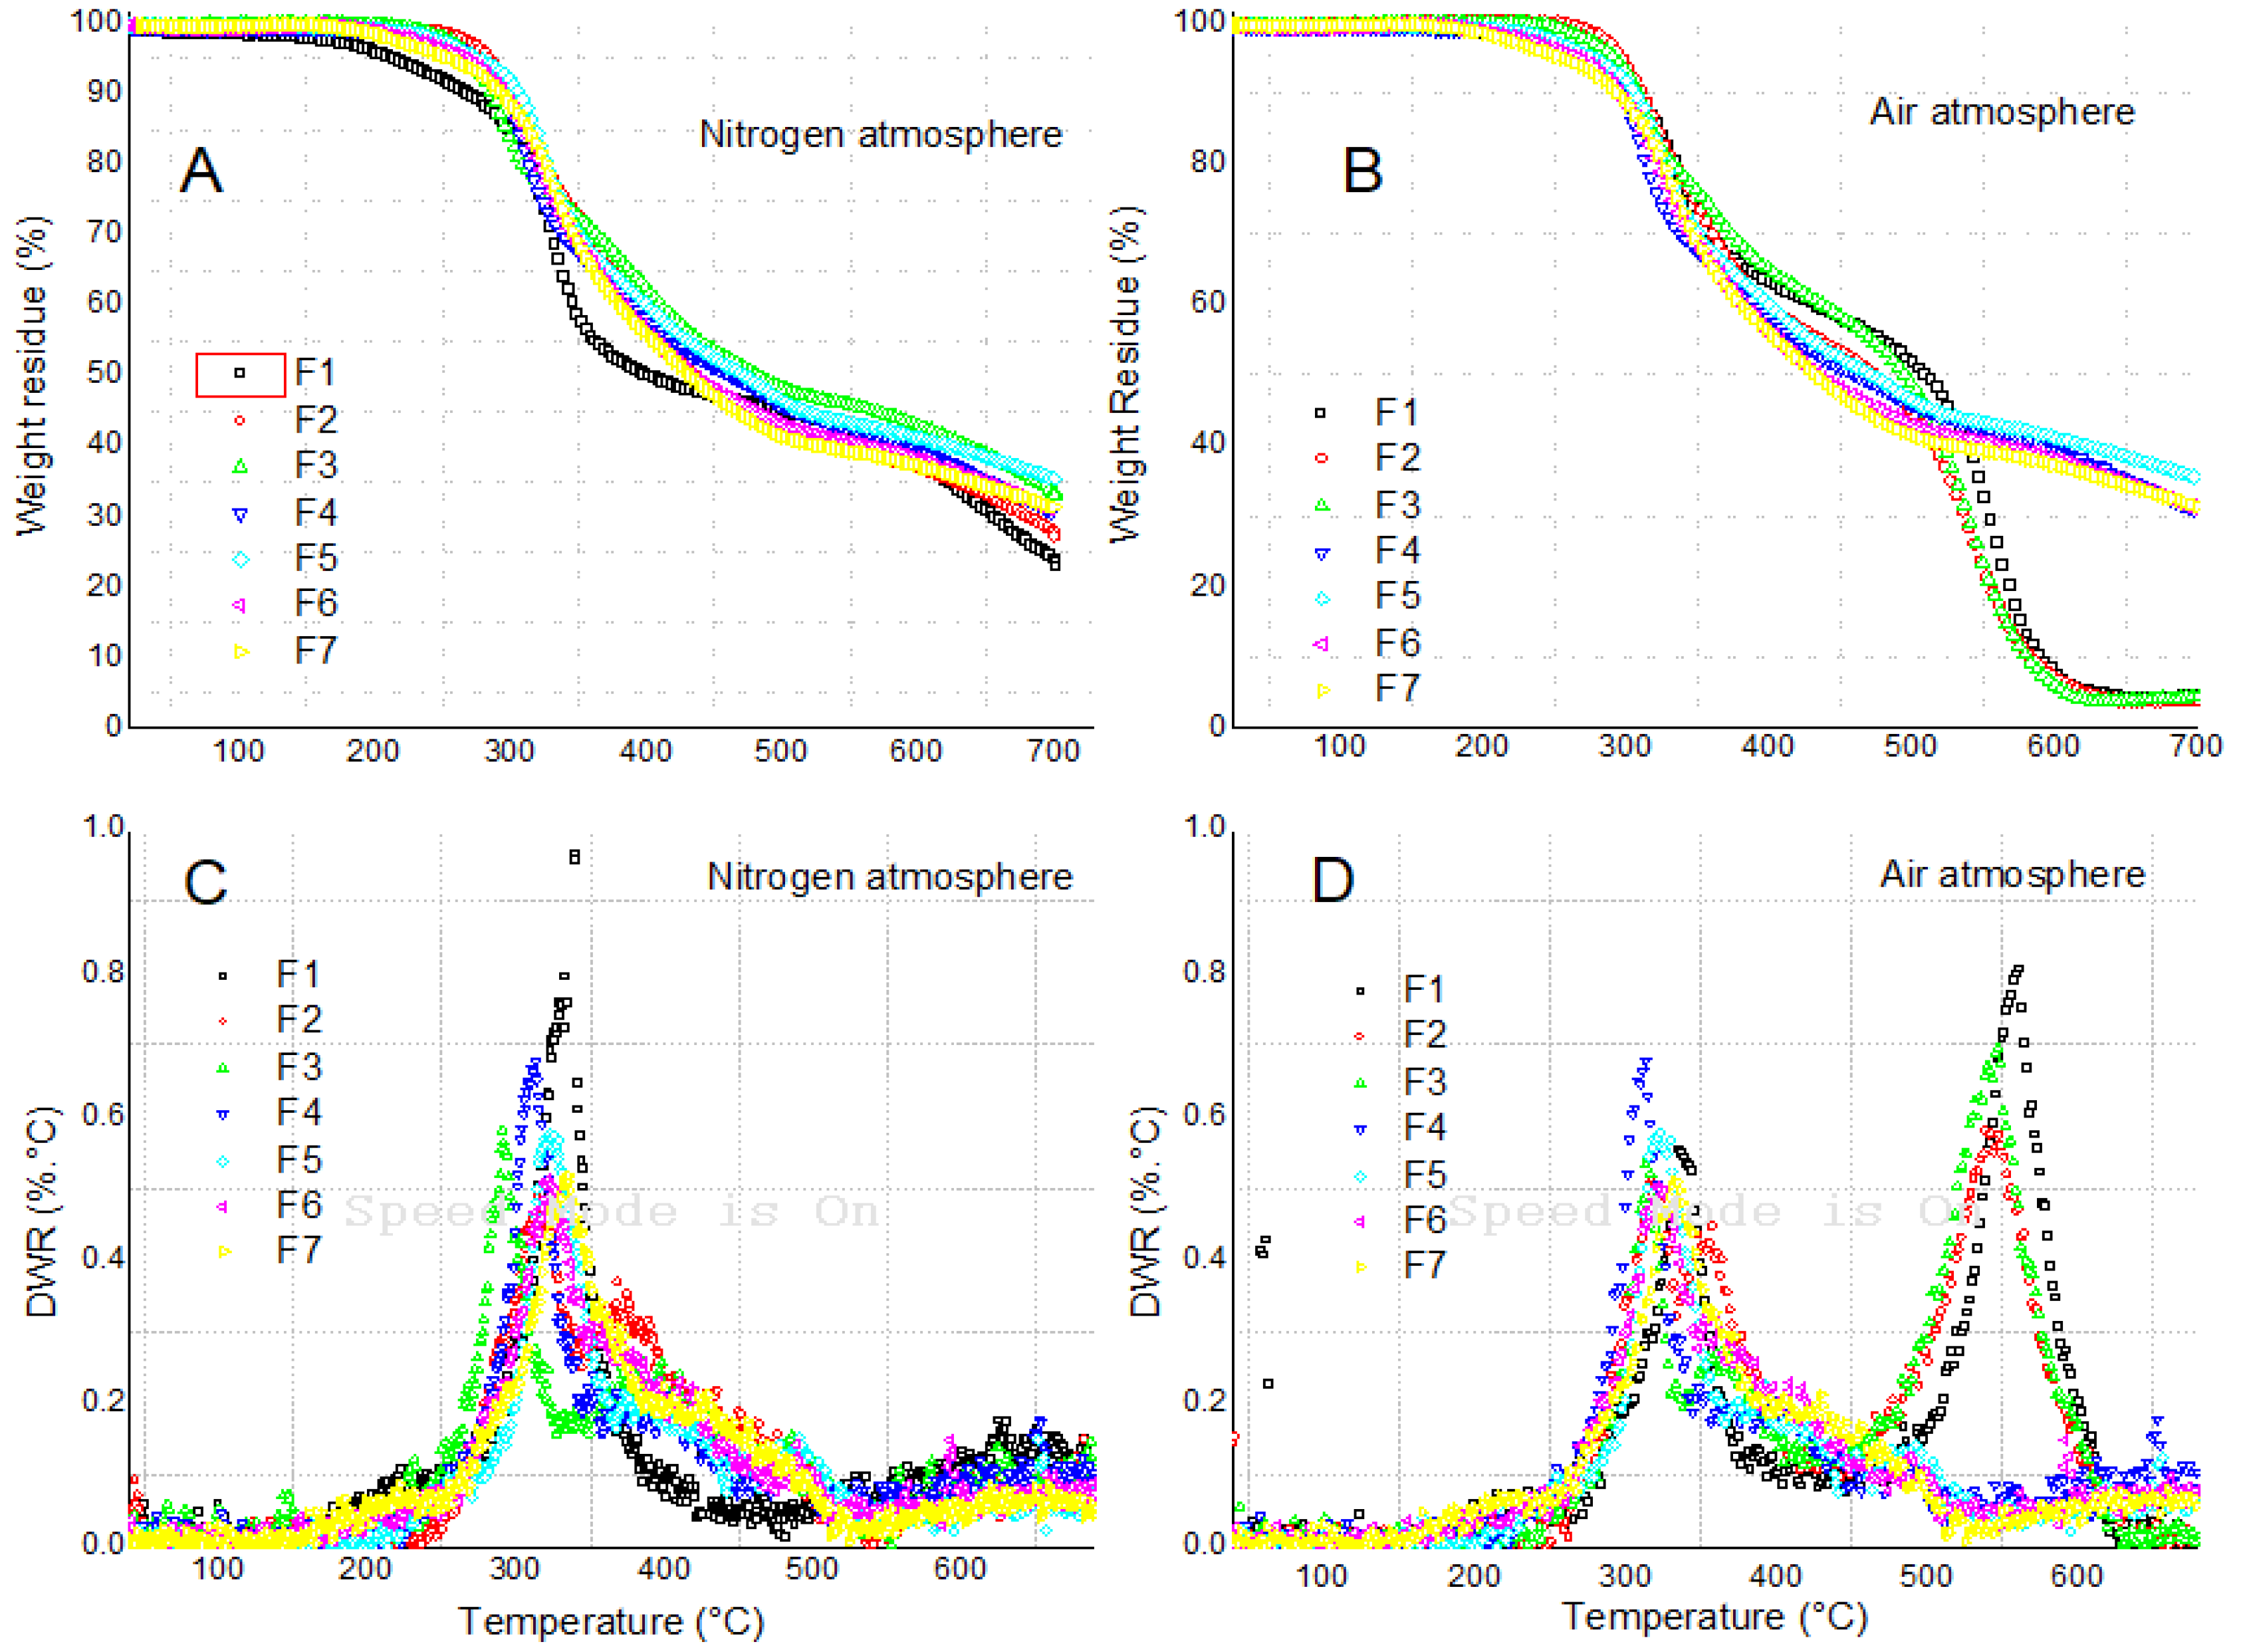
For the case of the air atmosphere, we found similar results as the ones with nitrogen, except that a much more relevant thermal degradation stage was observed at a temperature range of 550°C, but only for the case of the F1, F2 and F3 formulations. Taking into account that in these formulations the formation of carbodiimide groups (isocyanate dimerization) is feasible, it was expected to have that thermal degradation stage. In addition, FTIR analysis confirmed the presence of the carbodiimide group, a doublet found at an absorption centered at 2150 cm-1. Finally, the WR at 700°C was significantly higher for the case of the formulations F4 up to F5, within the range of 35 wt.%, suggesting that the increase of the NCOindex and the addition of TCPP into the formulation caused the formation of a higher char. As a final note, it is important to highlight that the processes of foam degradation in air and combustion occur to completely different mechanisms, a direct correlation between these might not be the best approach to analyze the fire retardancy in real fire situations [31].
3.4. Water Absorption Experiments
The volumetric water absorption (VWA) of the tested formulations is reported in Table 2. As it can be seen, all the soybased formulations developed in this work had a significant lower volumetric absorption with respect to F1, being the lowest value for the F2 foam at 1.06 vol %. In addition, an increase of the isocyanate index caused an increase of the VWA, reaching a maximum of 1.71 vol% for the F3 foam. Furthermore, the incorporation of TCPP also caused an increase in the VWA, reaching a constant value ranging 1.97 vol%.
The VWA experiments are extremely useful to understand how the foam will behave as a function of time. It is known that a higher VWA will be translated into a poor aging performance, particularly in the increase of thermal conductivity as a function of time [26]. Taking into account the results presented in the last paragraph, we can deduce that all the soybased formulations had a better performance with respect to the conventional PIR foam, hence, we would expect to have an improved aging. In addition, the formulation F5, which was the one which had the highest isocyanurate content, had also a very low VWA, indicating the suitability of applying these formulations in the development of PIR foams.
3.5. Initial Thermal Conductivity
The initial thermal conductivity (λi) is reported in Table 2. As shown by the results, the λi of all the tested formulations ranged from 19.7 mW·K⁻¹·m⁻¹ to 23.4 mW·K⁻¹·m⁻¹. The lowest value was observed in the F1 formulation, which was logical considering that this formulation contained the highest concentration of physical blowing agent. Conversely, all soy-based formulations exhibited higher thermal conductivity, consistent with the lower amount of physical blowing agent in these formulations (see Table 1). Additionally, both increasing the isocyanate index and the TCPP content had a very small effect on the λi, as expected, since no changes in gas phase composition were induced.
3.6. Infrared Absorption Analysis (FTIR)
The FTIR absorption spectra is an excellent tool to evaluate the microstructure of the cured rigid polyurethane foam. Taking into account that the foams developed in this work are mostly PIR foams, the focus on this analysis was centered on the quantification of the isocyanate, urethane and isocyanurate groups. A summary of the results obtained for all the formulations tested in this work is reported in Table 3. As it can be noticed from the values, increasing amounts of isocyanurate groups were found for the formulations as a function of increasing NCOindex, clearly reflecting the fact that the intended effect of increasing the NCOindex was translated into more isocyanurate groups. However, it was also noticed that the isocyanate content also increased as a function of increasing NCOindex. On the one hand, it should be noted that it is usual for polyurethane formulations to have a small excess of isocyanate equivalents, typically in the order of 0.5%. Then, it should be expected to have a small isocyanate absorption mainly due to this intended effect. However, as we can corroborate from Table 3, the area under the isocyanate band increased monotonously as a function of increasing NCOindex, clearly reflecting the fact that even though more isocyanurate bonds were formed, the total amount could be even higher due to the presence of that tendency. On the other hand, the effect of adding flame retardant in the formulation, that is F2 versus F6 and F7 caused also an increase in the free isocyanate while maintaining similar values of the isocyanurate groups. This effect can be explained due to the fact that the incorporation of flame retardant in the formulation might have changed the cure kinetics, requiring a higher degree of cure induced by a post-cure temperature cycle. This concept was also corroborated when analyzing the urethane content as a function of increasing NCOindex. As it can be noticed by comparing F2 versus F3,F4 and F5, higher urethane concentrations were found, a fact which can be associated with a higher cure due to the higher temperatures achieved during foaming.
Comparing the biobased formulations with the baseline PIR (F1), we can conclude that a higher concentration of isocyanurate as well as urethane groups were present in its microstructure in combination with a very small isocyanate concentration. This reflected the fact that the highest concentration of isocyanurate groups of the tested formulations is the F1, which would indicate that this formulation should have the best flammability performance.
Finally, it might be argued that a post-cure cycle should be performed in order to attain a higher isocyanate conversion. To this effect, we performed a post-cure cycle to corroborate if the unreacted isocyanate reported in Table 2 can further react to form isocyanurate groups. We performed two post-cure cycles on the F4 formulation, one at 50°C and another at 100°C, both for 4 hours. After analyzing the normalized isocyanurate area, we observed an increase of +31.7% and 36.5%, respectively. In addition, the isocyanate normalized areas also showed a consistent decrease, indicating that unreacted isocyanates contributed to further trimerize the microstructure. However, we also observed a substantial standard deviation of the obtained results, indicating a heterogeneous structure. These results supported the hypothesis that an improved post-cure cycle or a change of the trimerization catalyst might lead to an increase of the flame retardancy of the biobased foams.
3.7. Cell Geometry and Integrity Using Electronic Microscopy (SEM)
The results of the cell dimensions in the longitudinal (cell size L) and the transverse (cell size T) foam growth direction are reported in Table 2. In addition, representative micrographs of the cell structure of the foams tested in this work are also depicted in Fig. 3. The longitudinal cell size ranged from 266 µm (F2) up to 494 µm (F4), whereas the baseline formulation (F1) had a cell size of 386 µm. The effect of increasing the NCOindex in the formulation had the effect of increasing cell size, both at the L and the T directions. The highest increase was measured for the F4, whereas an increase of 81.0% was measured. On the other hand, the incorporation of flame retardant had also the effect of increasing cell size, but to a lower extent.
Figure 3.
: Electronic micrographs of the cross-section of the foams as a function of formulation type.
Figure 3.
: Electronic micrographs of the cross-section of the foams as a function of formulation type.
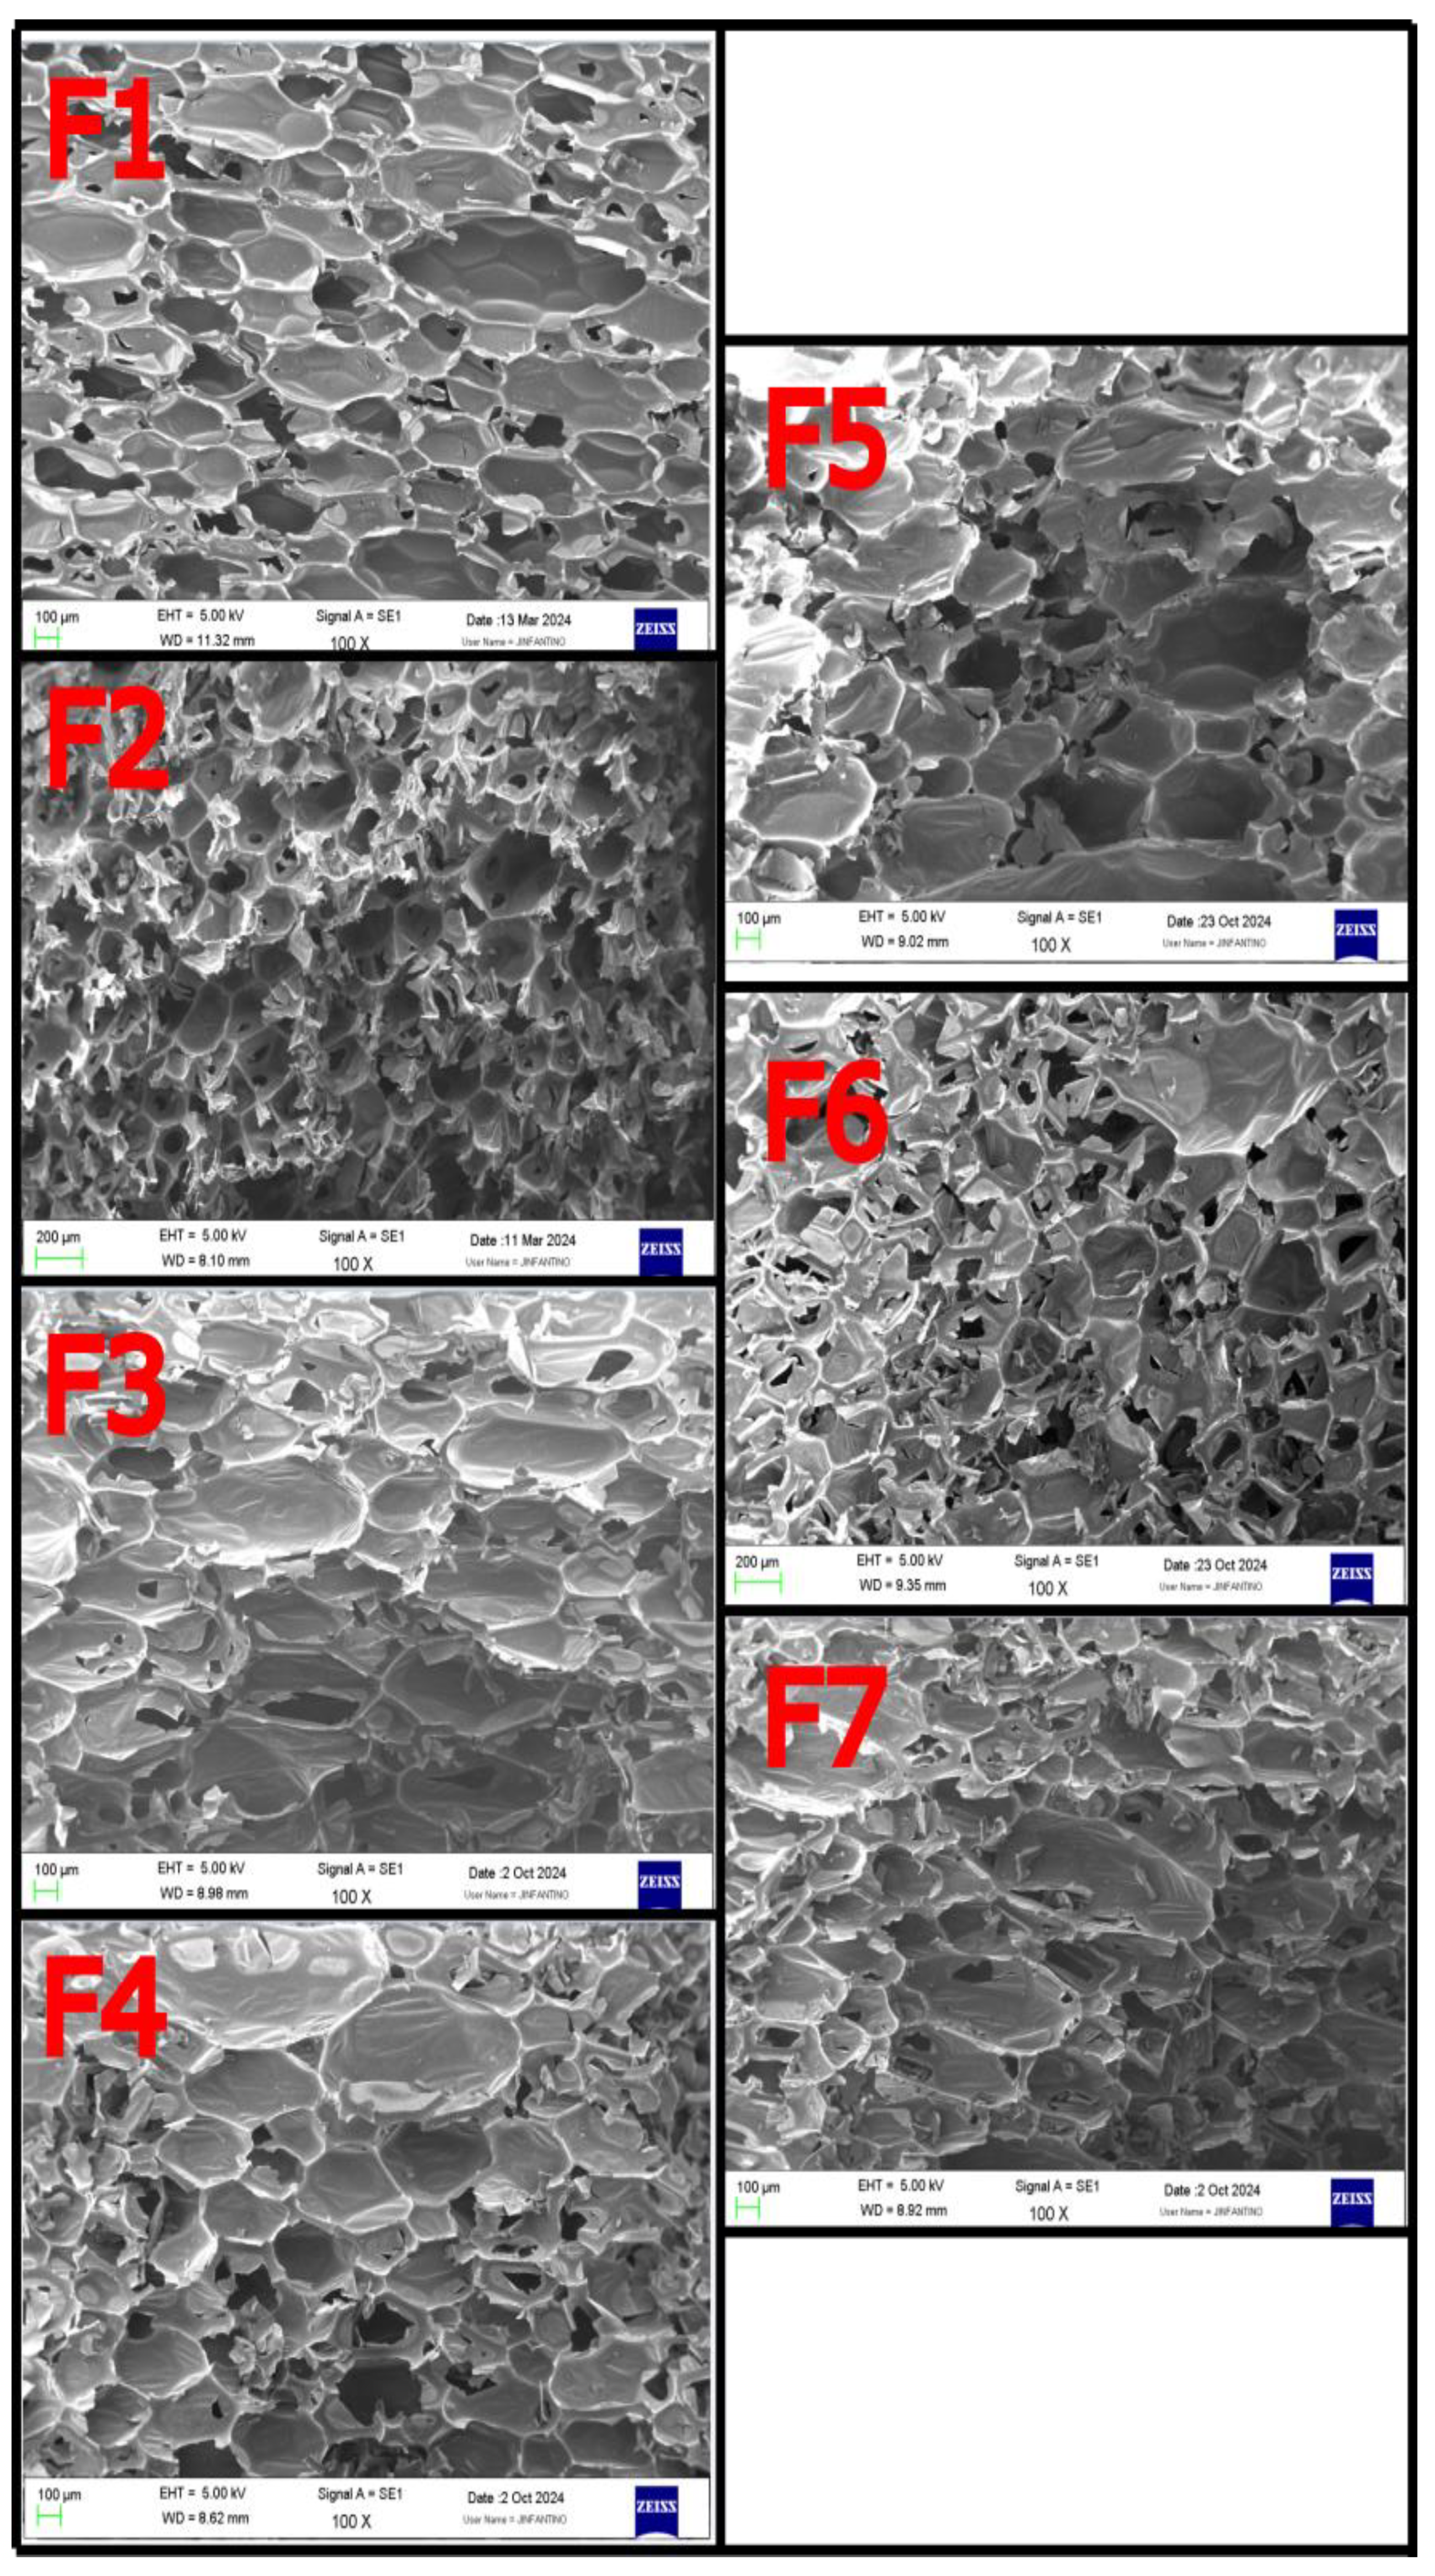
Taking into account the results, it can be concluded that both the NCOindex as well as the flame retardant had a strong effect on decreasing the nucleation efficiency during the blowing reaction. The work of Bose et. al[32] highlighted the relevance of the selection of the surfactant as well as the catalyst so as to improve this relevant issue for the case of biobased polyols. Further studies using the previously mentioned work should also help to improve this aspect.
3.8. Flammability and Smoke-Emission Tests
The formulations reported in Table 1 were subjected to flammability and smoke-emission tests using a cone calorimeter. The analysis was based on the study of the effect of two variables, being the first one the increase of the isocyanate index (NCOindex) and the second one the increase of the flame retardant content. In the first analysis, the NCOindex increased from 100, foam F2, 150 for foam F3, 200 for foam F4 and 250 for foam F5. The foam denoted as F1 was used as a reference, due to the fact that it was manufactured using a commercial aromatic polyol from the company Stepanpol.
3.8.1. The Influence of the NCOindex on the Flammability and Smoke-Emission of PUR-PIR Foams
The analysis of the influence of the NCOindex on the fire and smoke-emission properties is reported in Table 4. The times to ignition (TTIs) of all samples were constant at 2 s, indicating a null effect of the type of polyol or isocyanate index on this parameter. This was due to the fact that materials with a porous structure are much more easily degraded after contact with a heat flux, significantly decreasing the TTIs value[33].
The times to flameout (TTFs) were extended from 202 s for foam F2 with an isocyanate index of 100 to 310 s for foam F5 with an isocyanate index of 250, an improvement of +53%. The increase in the value of this parameter was associated with a slower combustion of the sample during the test. It was a consequence of the formation of a char layer on the material surface, which prevented a faster combustion. This time was 562 s for the reference foam F1, indicating that this foam burned the slowest of all the tested samples. As it can be deduced from the work of Huang et al. [34], this was associated with the formation of a much more compact char layer on the sample surface. A very important parameter that provides a lot of information about the flammability of a material is the total heat release (THR). The total heat released (THR) increased from 32.65 MJ/m² for an isocyanate index of 100 to 40.10 MJ/m² for an isocyanate index of 250, an improvement of +22.5%. This is due to the fact that the sample burned slower but longer, which had an impact on the total amount of released heat during the test. Thus, the increase in the isocyanate index influenced the increase in THR. In the case of F1 foam, the value of this parameter was 12.15 MJ/m². The reason for the low value of this parameter is complex. In the case of F1 foam, a classic synergistic effect of isocyanurate rings (IR) and TCPP is observed, which provides a flame retardant effect in both the gaseous and condensed phases. An additional role in this material is played by aromatic rings contained in the Stepanpol polyol, a fact which is known in the state of the art [35,36]. Its presence additionally contributes to the formation of a thicker char layer on the surface of the burning material. At the same time supporting the synergistic effect of TCPP and IR. Therefore, most of the fire and smoke-emission parameters of the F1 foam are more favorable than those of modified foams and can be a certain reference point for the properties that should be aimed at when modifying the formulation. However, it should be remembered that this formulation is based solely on raw materials of petrochemical origin, which is why it is necessary to seek alternatives that will allow the use of more sustainable and green raw materials.
The mass loss rates (MLRs) of all samples based on soy-polyol were at a similar level. This parameter did not change despite the extended burning time of samples with higher isocyanate indices. The effective heat of combustion (EHC) decreased from 22.36 MJ/kg to 18.98 MJ/kg for foam with the higher isocyanate index. This meant that foams with higher isocyanate indices had a lower calorific value, which meant that they were less flammable. This was a consequence of the higher content of isocyanurate rings. The presence of these groups during combustion causes the formation of a char layer on the foam surface, which cuts off the flame's access to the interior of the foam[37]. A large proportion of nitrogen atoms, which are classified as elements that reduce flammability, also have a positive effect on reducing flammability. The release of this gas during the combustion process affects the dilution of the flame's oxidizing atmosphere[38]. It is worth noting that the EHC values of the foam with the highest isocyanate index were at a similar level to those of the F1 foam. The average heat release rate (HRR) decreased from 99.71 kW/m² to 79.09 kW/m² with increasing isocyanate index, confirming the mechanisms mentioned earlier. The peak of maximum heat release rate (pHRR) also decreased from 338 kW/m² to 254.12 kW/m² with increasing isocyanate index. This meant that with increasing isocyanate index foams burned longer but the maximum unit released heat was significantly lower than when the foam burned faster. Reducing this parameter is very beneficial because it also means that the foams burn slower and less intensely, which can reduce the intensity of the entire fire, making it easier to extinguish[39]. The key parameter of the flammability test is the MARHE parameter. During the measurement, it decreased from 286.75 kW/m² to 230.35 kW/m² with the increase of the isocyanate index - such a relationship confirms that foams with a higher isocyanate index were less flammable than those with a lower isocyanate index.
Comparison of smoke emission parameters showed significant differences between soy-polyol based foams and the F1. Total smoke release (TSR) related to the smoke emission rate increased from 1135.05 m²/m² for the isocyanate index of 100 to 1377.40 m²/m² for the isocyanate index of 250, while total smoke production (TSP) also increased from 10.00 m² to 12.20 m² with the increase in the isocyanate index. This was related to the fact that the foams burned longer with the increasing isocyanate index, which measurably extended the smoke emission time. The measurement of TSP and TSR was not directly related to the sample mass, but to the optical parameters of the analyzed smoke. The longer the sample burns emitting smoke, the longer the instrument records it and converts it into both of these parameters. This was related to the fact that the foams burned longer with the increasing isocyanate index, which measurably extended the smoke emission time. The measurement of TSR was not directly related to the sample mass, but to the optical parameters of the analyzed smoke. The longer the sample burns emitting smoke, the longer the instrument records it and converts it into this parameter. The amount of released CO slightly decreased with the increase in the isocyanate index. The increase in the isocyanate index limited the incomplete combustion of the carbon contained in the material, which was beneficial because it limited the emission of toxic carbon monoxide. In turn the amount of carbon dioxide released in all samples was at a similar level. However, from the point of view of toxicity hazard, the ratio of emitted CO to CO2, the so-called CO/CO2 index, is very important. The lower this parameter, the less toxic CO is in the emitted smoke. This is very important, because smoke poisoning is the most common cause of fire casualties. In the case of comparing the results of emitted CO, CO2 and the CO/CO2 index of foams modified with soy-based bio-polyol and petrochemical polyol, significant differences can be seen in favor of foams obtained based on bio-based raw material. The synergy effect of TCPP, IR and aromatic rings measurably reduces the flammability of materials based on aromatic polyester. However, the smoke emitted by this material during combustion is much more dangerous in terms of the amount of carbon monoxide contained in it. The increase in the content of this toxic gas is caused by cutting off the access of the oxidizing atmosphere to the sample, which causes incomplete oxidation of the carbon contained in the polymer matrix[40].
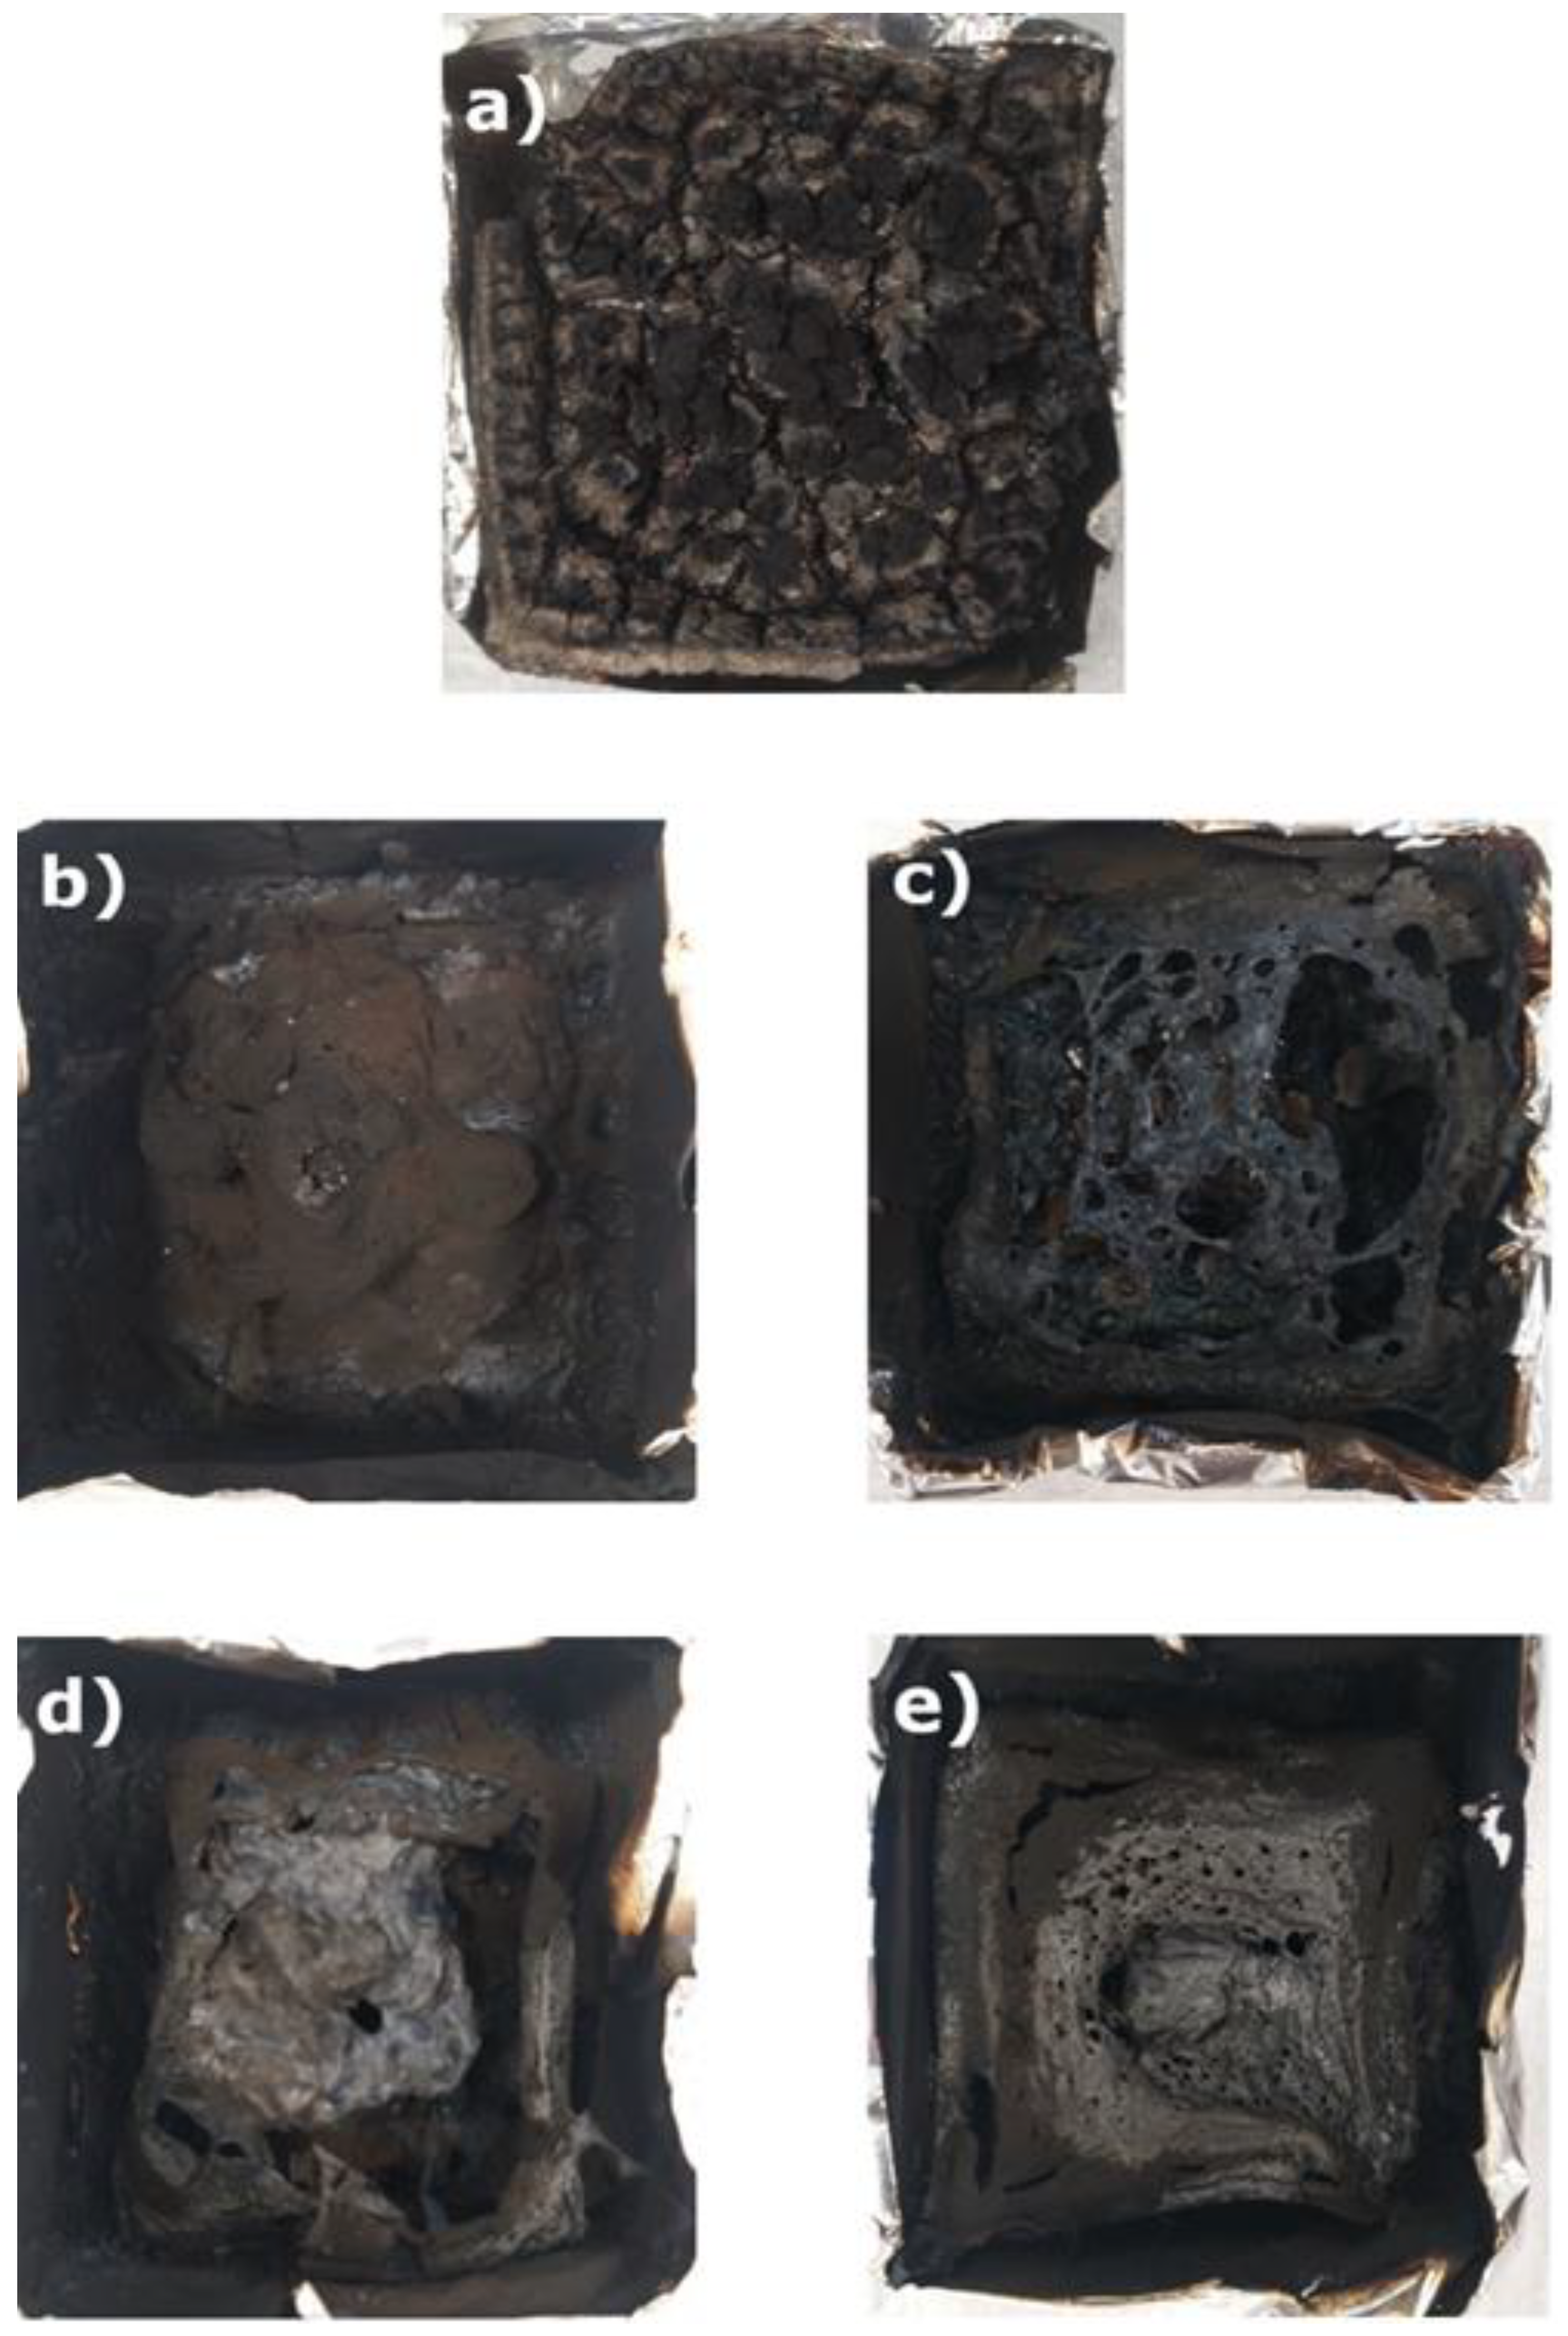
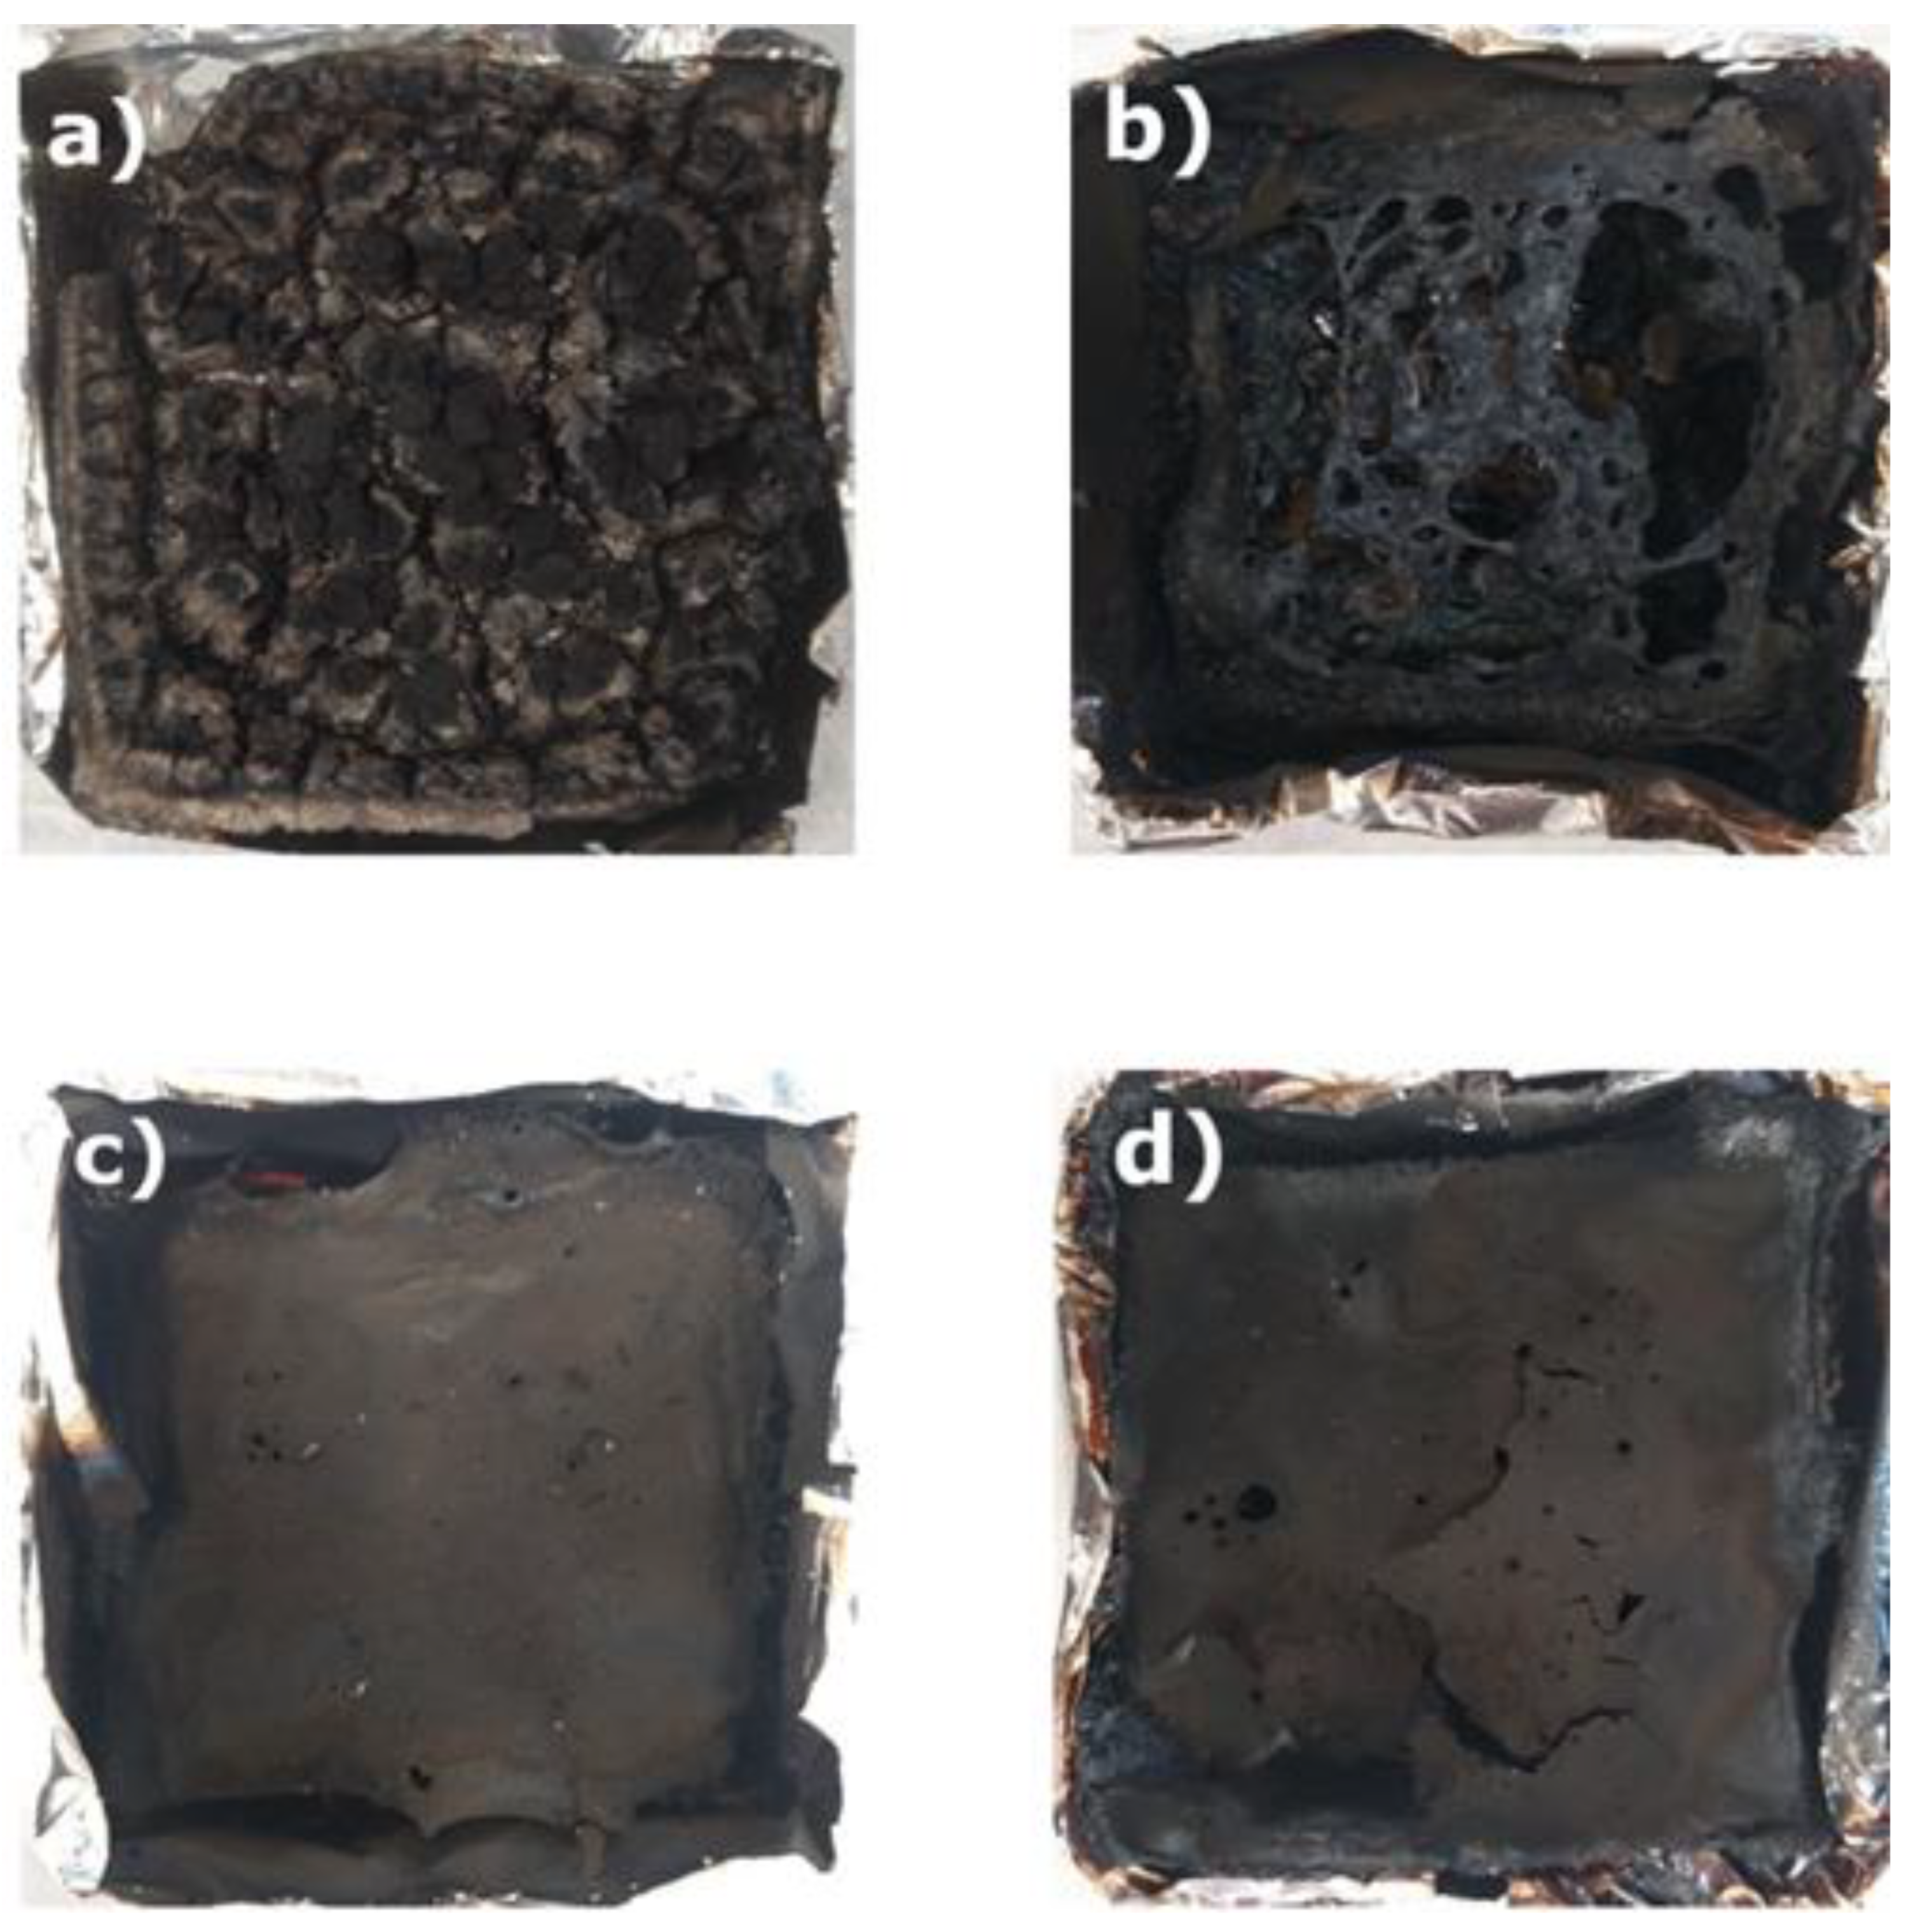
There is another very important aspect that is not directly measurable by the cone calorimeter. This is the residue after combustion. To analyze it, optical images of the burnt samples are depicted in Fig. 4. As it can be deduced a practical burnout of the sample was noted for the bio based foams (b-e). The residue after the test was slightly larger as the isocyanate index increased. However, its appearance suggested a complete burnout. No residue of initial foam under the char layer was noted. This means that the char layer that formed on the surface was insufficient to prevent the flame from penetrating deeper layers of the foam. There may be more reasons for this. They may be related to the used raw materials and their high flammability, e.g. bio-polyol based on vegetable oil or pentane contained in foam cells. In the case of aromatic polyester foam, the synergistic mechanism of TCPP, IR and aromatic rings was confirmed. It led to the formation of a tight char layer. This layer cut off the access of the flame's oxidizing atmosphere to the interior of the foam, which contributed to the preservation of foam residues beneath the char layer.
Figure 4.
Optical micrographs of char residue of the formulations: a) F1, b) F2, c) F3, d) F4 and e) F5 after combustion in the cone calorimeter.
Figure 4.
Optical micrographs of char residue of the formulations: a) F1, b) F2, c) F3, d) F4 and e) F5 after combustion in the cone calorimeter.
When comparing the commercial reference foam to other foams with different isocyanate index values, it was found that the fire parameters of the reference foam are better than those of the obtained foam materials. As the isocyanate index increases, the content of thermally resistant isocyanurate rings increases. As a result, the fire properties of these foams are improved, but they are still weaker than the reference foam (F1). The presence of isocyanurate rings is too small to match the thermal properties of the reference foam, which additionally contains a flame retardant. A similar relationship was observed for smoke-emission parameters. The reference foam was characterized by better smoke parameters such as: TSR, TSP and amount of released CO2. The most important thing for human safety during a fire in the case of toxic CO emissions is that this parameter was better for foams with different isocyanate index contents than for petrochemical-based foam.
3.8.2. The Influence of Flame Retardant Content on the Flammability and Smoke-Emission of PUR-PIR Foams
The analysis of the effect of TCPP on the fire and smoke-emission properties of PIR foams was performed on samples with an isocyanate index of 150: F3 (0 pbw TCPP), F6 (10 pbw TCPP) and F7 (20 pbw TCPP). The F1 foam, which was obtained from a petrochemical polyol, was also used as a reference for the obtained foams. The obtained results are reported in Table 5.
Similarly to the study of the effect of the isocyanate index, the use of TCPP in the formulation did not affect the time to ignition of the tested foams. TTIs of all samples were constant at 2 s. Times to flameout (TTFs) of foams with TCPP are lower than in the case of foam without TCPP. A decrease of this parameter was noted from 204 s for foam without TCPP to 168 s for foam with 20 pbw of TCPP. This is a consequence of the presence of a flame retardant in the material, which leads to faster flame extinction according to the mechanism mentioned in the previous section. Comparing the results of bio-polyol based foams to the results for Stepanpol based foams, it was found that the burning time of modified foams is significantly shorter. Shortening this parameter can be a positive feature if the other fire parameters are also reduced. Then, reducing this parameter means cutting off the material from the flame without the possibility of its further spread[41]. Total heat release (THR) was significantly reduced from 32.30 MJ/m2 to 17.20 MJ/m2 in comparison with the foam without TCPP. This proved the correct functioning of the flame retardant and the appropriateness of its use in combination with isocyanurate rings in material. The use of 20 pbw of TCPP significantly reduced THR, which approached the value of this parameter for the F1 foam, which was 12.15 MJ/m2. The effective heat of combustion (EHC) also decreased significantly from 22.36 MJ/kg for the foam without TCPP to 17.96 MJ/kg for the foam with 20 pbw of TCPP. The increase in the TCPP content in the foams significantly reduced the value of this parameter. The EHC value of the F7 foam was very close to the value of this parameter for the F1 foam. The HRR decreased significantly with the increase in TCPP content from 88.29 kW/m2 for the foam without TCPP to 60.38 kW/m2 for the foam with 20 pbw of TCPP. A reduction of this parameter by almost 30% was a very important achievement proving the reduction of the flammability of this material. The pHRR also decreased significantly from 338 kW/m2 for the foam without TCPP to 248.20 kW/m2 for the foam with 20 pbw. Similarly to the case of foams with different isocyanate index, in this case too it is very beneficial. However, there is a significant difference between the HRR and pHRR of the F3, F6, F7 foams and the F1 reference foam. Despite the use of only 10 pbw of TCPP in the F1 formulation, it shows significantly better fire properties than the F7 foam containing 20 pbw of TCPP. This is due to the previously mentioned synergy effect of the aromatic rings from the polyol, the produced isocyanurate rings and the chlorine and phosphorus atoms from TCPP. The combination of these 3 components provides better fire protection than using just two of them[42]. The results of the mass changes during the combustion process also confirmed this. It is also worth noting that the MARHE parameter decreased significantly from 282.2 kW/m2 for the foam without TCPP to 200.53 kW/m2 for the foam with 20 pbw of TCPP. This confirmed that TCPP-based materials are less flammable and more fire-resistant than those without TCPP.
The total smoke release (TSR) and total smoke production (TSP) were reduced by up to 30% after the use of TCPP in comparison with foam without its participation. This is a very interesting relationship. According to literature data[43] with the increase in the amount of TCPP, the amount of smoke emitted should increase. In this case, we have an inverse relationship, which is very beneficial for these materials. It was assumed that this may be influenced by bio-polyol raw material used in the foam formulation. It could work synergistically with TCPP, causing a reduction in parameters related to smoke emission. This may be confirmed by the fact that in the case of the analysis of the effect of the isocyanate index (where TCPP was not used), the opposite relationship was noted. The use of TCPP influenced the change in the amount of emitted CO and CO2 in the smoke. The increase in the amount of TCPP caused an increase in CO emissions at the expense of CO2. This is an action that is a consequence of using halogen-based flame retardants. Of course, the increase in CO emissions is not beneficial. However, this increase is not high enough to speak of an increase in the risk during combustion of these materials. In particular, the CO/CO2 index increased slightly after the addition of TCPP from 0.05 to 0.07. The value of this index for the foam containing 20 pbw of TCPP was still more than three times lower than the value of this parameter for the F1 foam, which was undoubtedly very beneficial.
A char layer was formed on the surface of each foam as in the case of foams with different isocyanate indexes. However, this layer did not completely cut off the flame and oxidizing atmosphere from entering the foam in each case. In the photos of the residues after combustion of foams modified by bio-polyol (Fig. 5b-d), it can be seen places where the flame penetrated the interior of the foam. Due to this, the material also burned inside. After analyzing the residues after combustion, it can be seen that increasing TCPP improves the appearance of the produced char layer. Perhaps increasing the TCPP content in the formulation would have a positive effect on this foam. The creation of a tight char layer would cut off the flame's access to the foam interior and preserve some of it without complete combustion, like in the case of F1 foam (Figure 5a).
Figure 5.
Optical micrographs of char residue of the formulations: a) F1, b) F3, c) F6 and d) F7 after combustion in the cone calorimeter.
Figure 5.
Optical micrographs of char residue of the formulations: a) F1, b) F3, c) F6 and d) F7 after combustion in the cone calorimeter.
Foams after using TCPP in the formulation are much more resistant to fire. Characteristic parameters have been significantly reduced, which indicates that with the increase in TCPP, the fire resistance of these materials increases. Smoke emission is also reduced, which is a very beneficial feature. Comparing the synthesized foams based on bio-polyol with different TCPP content with the reference foam, it turned out that the most important fire parameters such as: THR, EHC and HRR were reduced and significantly approached the values obtained by the foam based on aromatic polyester. This was also confirmed by the MARHE parameter, where the lower its value, the safer the material is in terms of fire resistance. The reference foam was characterized by lower smoke-emission parameters such as: TSR, TSP and amount of released CO2. In turn, foams obtained from bio-polyols with different contents of TCPP flame retardant were characterized by significantly lower emissions of toxic carbon monoxide compared to the reference foam.
4. Conclusions
Rigid polyisocyanurate foams were manufactured using a soybased polyol with a high renewable content (97%) where the blowing agent consisted of a mixture of water (chemical blowing agent) and n-pentane (physical blowing agent), performing a systematic study of the effect of increasing the isocyanate index (NCOindex) and the incorporation of flame retardant into the formulation. The results were compared with a baseline foam (F1) which was a formulation comprising an aromatic polyol with a PIR microstructure obtained from polyols derived from non-renewable resources.
On the one hand, the increase of isocyanate index from 100 to 250 caused a significant increase of the RCspL, reaching an improvement of +155 % for the highest isocyanate index. TGA analysis in the nitrogen and air atmosphere revealed a positive shift of the degradation peaks of the hard segment thermal degradation stage, suggesting an improvement in the thermal properties of the foams. It was also observed that the char formed at 700°C was substantially higher as a function of increasing index. Water absorption experiments showed an increase as a function of increasing index, but the values remained much lower than the baseline F1, suggesting a good cell integrity. Initial thermal conductivity of the foams retained values of approximately 23.4 mW·K⁻¹·m⁻¹, an excellent result taking into account the concentration of n-pentane in the formulation. FTIR analysis served to give strong support to the formation of isocyanurate groups as a function of increasing NCOindex and its dependence with the post-cure cycle. A lower amount of isocyanurate groups with respect to the baseline F1 suggested that a strong improvement could be achieved if a higher isocyanurate conversion was achieved. Regarding the flammability tests, the EHC values of the F5 (NCOindex = 250) were similar to the baseline F1 foam. The MARHE parameter decreased by 19.7% as a function of increasing index, but remained high in contrast to the baseline F1, suggesting an improvement in the fire retardancy of the foam. In addition, the amount of released CO(g) slightly decreased as a function of increasing isocyanate index, limiting the emission of toxic carbon monoxide. Comparing the CO(g)/CO2(g) index, a significant reduction of 78% was observed in favour of the biobased foams, clearly indicating an improvement with respect to the baseline F1. Finally, optical images of the foams after burnout indicated no char layer remnants, suggesting that the char was insufficient to prevent the flame from penetrating to deeper layers of the foam.
On the other hand, the effect of increasing the flame retardant content in the biobased formulation also had an improvement in the RCspL, reaching up to 24.8%. The most important result was associated with the flammability properties, for example, the CO(g)/CO2(g) ratio had a significant improvement of 69.6 % with a simultaneous decrease of the TSP of 31.4%, clearly indicating that the incorporation of flame retardant (TCPP) did not generate an increase in the emission of toxic gases. In addition, a much more compact and thicker char layer on the sample surface was formed, substantiated with the important reduction of the MAHRE parameter, up to 40.6% for a 20 pbw of flame retardant. This clearly indicated a synergistic effect of the isocyanurate rings (IR) and the flame retardants, which provided a retardancy effect in both the gaseous and condensed phases.
As can be deduced from the results, the incorporation of flame retardant had a stronger effect on improving the overall flame retardancy of the biobased polyurethane foam. A combination of both effects might also have a more synergistic effect, provided that a higher isocyanurate yield is achieved. Further research in this area will focus on the replacement of the halogenated flame retardant with another one which does not contain chlorine or other halogen.
Acknowledgments
The authors would like to acknowledge Diego Garcia Touza, Carlos Casas and Leonel Luna from Varteco for their financial and technical support. Joaquin Infantino (ITBA) for SEM analysis, Hugo Nazareno Príncipe Lopez and Luciano Ariel Lonardi (ITPN) for their technical support. -Quimidroga for chemicals.
References
- Ashida, K. Polyurethane and Related Foams: Chemistry and Technology; CRC press, 2006.
- Sardon, H.; Mecerreyes, D.; Basterretxea, A.; Averous, L.; Jehanno, C. From Lab to Market: Current Strategies for the Production of Biobased Polyols. ACS Sustain. Chem. Eng. 2021, 9, 10664–10677. [Google Scholar] [CrossRef]
- Dukarska, D.; Mirski, R. Current Trends in the Use of Biomass in the Manufacture of Rigid Polyurethane Foams: A Review. J. Compos. Sci. 2024, 8, 286. [Google Scholar] [CrossRef]
- Kaikade, D.S.; Sabnis, A.S. Polyurethane Foams from Vegetable Oil-Based Polyols: A Review. Polym. Bull. 2023, 80, 2239–2261. [Google Scholar] [CrossRef]
- Akdogan, E.; Erdem, M. Environmentally-Benign Rigid Polyurethane Foam Produced from a Reactive and Phosphorus-Functionalized Biopolyol: Assessment of Physicomechanical and Flame-Retardant Properties. React. Funct. Polym. 2022, 177, 105320. [Google Scholar] [CrossRef]
- Henry, C.; Gondaliya, A.; Thies, M.; Nejad, M. Studying the Suitability of Nineteen Lignins as Partial Polyol Replacement in Rigid Polyurethane/Polyisocyanurate Foam. Molecules 2022, 27, 2535. [Google Scholar] [CrossRef] [PubMed]
- Olszewski, A.; Kosmela, P.; Vēvere, L.; Kirpluks, M.; Cabulis, U.; Piszczyk, Ł. Effect of Bio-Polyol Molecular Weight on the Structure and Properties of Polyurethane-Polyisocyanurate (PUR-PIR) Foams. Sci. Rep. 2024, 14, 812. [Google Scholar] [CrossRef] [PubMed]
- Zhang, X.; Wang, Z.; Sun, S.; Wang, Z.; Xie, H. Preparation of Bio-based Soybean Oil Polyol Modified 3630 Polyol-based Rigid Polyurethane Foam and Its Improved Thermal Stability, Flame Retardant, and Smoke Suppression Performances. Polym. Adv. Technol. 2024, 35, e6343. [Google Scholar] [CrossRef]
- Paciorek-Sadowska, J.; Borowicz, M.; Czupryński, B.; Tomaszewska, E.; Liszkowska, J. Oenothera Biennis Seed Oil as an Alternative Raw Material for Production of Bio-Polyol for Rigid Polyurethane-Polyisocyanurate Foams. Ind. Crops Prod. 2018, 126, 208–217. [Google Scholar] [CrossRef]
- Borowicz, M.; Paciorek-Sadowska, J.; Lubczak, J.; Czupryński, B. Biodegradable, Flame-Retardant, and Bio-Based Rigid Polyurethane/Polyisocyanurate Foams for Thermal Insulation Application. Polymers 2019, 11, 1816. [Google Scholar] [CrossRef]
- Kosmela, P.; Hejna, A.; Suchorzewski, J.; Piszczyk, Ł.; Haponiuk, J.T. Study on the Structure-Property Dependences of Rigid PUR-PIR Foams Obtained from Marine Biomass-Based Biopolyol. Materials 2020, 13, 1257. [Google Scholar] [CrossRef]
- Singh, H.; Jain, A. Ignition, Combustion, Toxicity, and Fire Retardancy of Polyurethane Foams: A Comprehensive Review. J. Appl. Polym. Sci. 2009, 111, 1115–1143. [Google Scholar] [CrossRef]
- Yadav, A.; de Souza, F.M.; Dawsey, T.; Gupta, R.K. Recent Advancements in Flame-Retardant Polyurethane Foams: A Review. Ind. Eng. Chem. Res. 2022, 61, 15046–15065. [Google Scholar] [CrossRef]
- Weil, E.D.; Levchik, S.V. Commercial Flame Retardancy of Polyurethanes. J. Fire Sci. 2004, 22, 183–210. [Google Scholar] [CrossRef]
- Gürkan, E.H.; Yaman, B. Comparative Evaluation of Flame Retardant Performance in Rigid Polyurethane Foams: TCPP, TDCP MP, and ATH as Promising Additives. J. Taibah Univ. Sci. 2023, 17, 2233757. [Google Scholar] [CrossRef]
- Mort, R.; Peters, E.; Griffin, E.; Curtzwiler, G.; Vorst, K.; Jiang, S. Low-Isocyanate Polyurethane Foams with Improved Stability and Compression Modulus Prepared from Biosourced and Landfill-Diverted Materials. ACS Appl. Polym. Mater. 2023, 5, 7602–7613. [Google Scholar] [CrossRef]
- Javni, I.; Zhang, W.; Petrović, Z. Soybean-Oil-Based Polyisocyanurate Rigid Foams. J. Polym. Environ. 2004, 12, 123–129. [Google Scholar] [CrossRef]
- Chen, M.-J.; Wang, X.; Tao, M.-C.; Liu, X.-Y.; Liu, Z.-G.; Zhang, Y.; Zhao, C.-S.; Wang, J.-S. Full Substitution of Petroleum-Based Polyols by Phosphorus-Containing Soy-Based Polyols for Fabricating Highly Flame-Retardant Polyisocyanurate Foams. Polym. Degrad. Stab. 2018, 154, 312–322. [Google Scholar] [CrossRef]
- Zhang, K.; Hong, Y.; Wang, N.; Wang, Y. Flame Retardant Polyurethane Foam Prepared from Compatible Blends of Soybean Oil-based Polyol and Phosphorus Containing Polyol. J. Appl. Polym. Sci. 2018, 135, 45779. [Google Scholar] [CrossRef]
- Tang, G.; Liu, M.; Deng, D.; Zhao, R.; Liu, X.; Yang, Y.; Yang, S.; Liu, X. Phosphorus-Containing Soybean Oil-Derived Polyols for Flame-Retardant and Smoke-Suppressant Rigid Polyurethane Foams. Polym. Degrad. Stab. 2021, 191, 109701. [Google Scholar] [CrossRef]
- Dhaliwal, G.S.; Bajwa, D.S.; Bajwa, S. Fabrication and Testing of Soy-Based Polyurethane Foam with Flame Retardant Properties. J. Polym. Environ. 2021, 29, 1153–1161. [Google Scholar] [CrossRef]
- Uram, K.; Prociak, A.; Vevere, L.; Pomilovskis, R.; Cabulis, U.; Kirpluks, M. Natural Oil-Based Rigid Polyurethane Foam Thermal Insulation Applicable at Cryogenic Temperatures. Polymers 2021, 13, 4276. [Google Scholar] [CrossRef]
- Kirpluks, M.; Vanags, E.; Abolins, A.; Michalowski, S.; Fridrihsone, A.; Cabulis, U. High Functionality Bio-Polyols from Tall Oil and Rigid Polyurethane Foams Formulated Solely Using Bio-Polyols. Materials 2020, 13, 1985. [Google Scholar] [CrossRef] [PubMed]
- Beverte, I.; Shtrauss, V.; Kalpinsh, A.; Lomanovskis, U.; Cabulis, U.; Sevastyanova, I.; Gaidukovs, S. Dielectric Permittivity of Rigid Rapeseed Oil Polyol Polyurethane Biofoams and Petrochemical Foams at Low Frequencies. J. Renew. Mater. 2020, 8, 1151–1170. [Google Scholar] [CrossRef]
- Kirpluks, M.; Kalnbunde, D.; Walterova, Z.; Cabulis, U. Rapeseed Oil as Feedstock for High Functionality Polyol Synthesis. J. Renew. Mater. 2017, 5, 258–270. [Google Scholar] [CrossRef]
- Diaz, T.J.; Cerrutti, P.; Chiacchiarelli, L.M. In-situ Thermal Aging of Biobased and Conventional Rigid Polyurethane Foams Nanostructured with Bacterial Nanocellulose. J. Appl. Polym. Sci. 2022, 139, 51824. [Google Scholar] [CrossRef]
- Harikrishnan, G.; Macosko, C.; Jeung, H.C.; Bischof, J.; Singh, S. Journal of Cellular Plastics: A Simple Transient Method for Measurement of Thermal Conductivity of Rigid Polyurethane Foams. Cell. Polym. 2009, 28, 162–163. [Google Scholar]
- Berardi, U. The Impact of Aging and Environmental Conditions on the Effective Thermal Conductivity of Several Foam Materials. Energy 2019, 182, 777–794. [Google Scholar] [CrossRef]
- Sonnenschein, M.F. Polyurethanes: Science, Technology, Markets, and Trends; John Wiley & Sons, 2021.
- Ionescu, M. Chemistry and Technology of Polyols for Polyurethanes; iSmithers Rapra Publishing, 2005.
- Prager, F.H.; Rosteck, H. Polyurethane and Fire: Fire Performance Testing under Real Conditions; John Wiley & Sons, 2006.
- Bose, M.; Dhaliwal, G.; Chandrashekhara, K.; Nam, P. Role of Additives in Fabrication of Soy-based Rigid Polyurethane Foam for Structural and Thermal Insulation Applications. J. Appl. Polym. Sci. 2021, 138, 51325. [Google Scholar] [CrossRef]
- Wang, J.; Zhang, C.; Deng, Y.; Zhang, P. A Review of Research on the Effect of Temperature on the Properties of Polyurethane Foams. Polymers 2022, 14, 4586. [Google Scholar] [CrossRef] [PubMed]
- Huang, Y.; Jiang, S.; Liang, R.; Liao, Z.; You, G. A Green Highly-Effective Surface Flame-Retardant Strategy for Rigid Polyurethane Foam: Transforming UV-Cured Coating into Intumescent Self-Extinguishing Layer. Compos. Part Appl. Sci. Manuf. 2019, 125, 105534. [Google Scholar] [CrossRef]
- Duval, A.; Sarazin, J.; de Haas, C.; Sarbu, A.; Bourbigot, S.; Avérous, L. Influence of the Chemical Structure of Polyester Polyols on the Properties and Fire Resistance of Polyisocyanurate Foams. Eur. Polym. J. 2024, 210, 112938. [Google Scholar] [CrossRef]
- Viswanathan, G.; Maiorana, A.; Kukkala, P.; Malhotra, V.; Sendijarevic, I. Novel Nitrogen Containing Aromatic Polyols for Rigid Polyurethane Foams; 2018.
- Parcheta-Szwindowska, P.; Habaj, J.; Krzemińska, I.; Datta, J. A Comprehensive Review of Reactive Flame Retardants for Polyurethane Materials: Current Development and Future Opportunities in an Environmentally Friendly Direction. Int. J. Mol. Sci. 2024, 25, 5512. [Google Scholar] [CrossRef] [PubMed]
- Jefferson Andrew, J.; Sain, M.; Ramakrishna, S.; Jawaid, M.; Dhakal, H.N. Environmentally Friendly Fire Retardant Natural Fibre Composites: A Review. Int. Mater. Rev. 2024, 69, 267–308. [Google Scholar] [CrossRef]
- Baguian, A.F.; Ouiminga, S.K.; Longuet, C.; Caro-Bretelle, A.-S.; Corn, S.; Bere, A.; Sonnier, R. Influence of Density on Foam Collapse under Burning. Polymers 2020, 13, 13. [Google Scholar] [CrossRef] [PubMed]
- McKenna, S.T.; Hull, T.R. The Fire Toxicity of Polyurethane Foams. Fire Sci. Rev. 2016, 5, 1–27. [Google Scholar] [CrossRef]
- Stec, A.A.; Hull, T.R.; Purser, D.A.; Purser, J.A. Fire Toxicity Assessment: Comparison of Asphyxiant Yields from Laboratory and Large Scale Flaming Fires. Fire Saf. Sci. 2014, 11, p404–418. [Google Scholar] [CrossRef]
- Olcay, H.; Gul, C.; Kocak, E.D. Synergism in Nitrogen- and Phosphorus-Based Flame Retardants. In Materials and Chemistry of Flame-Retardant Polyurethanes Volume 2: Green Flame Retardants; ACS Symposium Series; American Chemical Society, 2021; Vol. 1400, pp 213–247. [CrossRef]
- Hoehn, R.M.; Jahl, L.G.; Herkert, N.J.; Hoffman, K.; Soehl, A.; Diamond, M.L.; Blum, A.; Stapleton, H.M. Flame Retardant Exposure in Vehicles Is Influenced by Use in Seat Foam and Temperature. Environ. Sci. Technol. 2024, 58, 8825–8834. [Google Scholar] [CrossRef] [PubMed]
Table 4.
Results of flammability and smoke emission tests of the foams as a function of isocyanate index.
Table 4.
Results of flammability and smoke emission tests of the foams as a function of isocyanate index.
| Parameter | F1 | F2 | F3 | F4 | F5 |
| Fire parameters | |||||
| TTI (s) | 2 ± 0 | 2 ± 0 | 2 ± 0 | 2 ± 0 | 2 ± 0 |
| TTF (s) | 562 ± 36 | 202 ± 0 | 204 ± 17 | 298 ± 18 | 306 ± 6 |
| THR (MJ/m2) | 12.15 ± 1.7 | 32.65 ± 0.64 | 32.30 ± 0.36 | 37.65 ± 2.90 | 40.21 ± 0.16 |
| MLR (g/(m2·s)) | 7.13 ± 0.57 | 4.47 ± 0.17 | 3.64 ± 0.80 | 4.25 ± 0.37 | 4.17 ± 0.07 |
| EHC (MJ/kg) | 17.77 ± 2.06 | 21.87 ± 0.13 | 22.36 ± 0.76 | 21.71 ± 0.74 | 18.98 ± 4.97 |
| HRR (kW/m2) | 17.25 ±1.65 | 97.69 ± 4.33 | 99.71 ± 3.76 | 84.53 ± 2.83 | 79.09 ± 5.43 |
| pHRR (kW/m2) | 107.58 ± 2.61 | 318.04 ± 27.64 | 338.00 ± 34.28 | 270.68 ± 36.71 | 254.12 ± 11.68 |
| tpHRR (s) | 5 ± 0 | 5 ± 0 | 18 ± 4 | 40 ± 4 | 38 ± 4 |
| Mass lost (g/m2) | 784.24 ± 117.66 | 1444.90 ± 39.60 | 1427.03 ± 55.78 | 1718.70 ± 53.60 | 1625.65 ± 181.51 |
| MARHE (kW/m2) | 133.97 ± 5.95 | 286.75 ± 11.24 | 282.20 ± 28.35 | 231.25 ± 21.57 | 230.35 ± 13.51 |
| Smoke-emission parameters | |||||
| TSR (m2/m2) | 122.13 ± 31.67 | 1135.05 ± 65.12 | 1140.80 ± 51.20 | 1341.30 ± 75.24 | 1377.40 ± 221.75 |
| TSP (m2) | 0.90 ± 0.00 | 10.00 ± 0.57 | 10.07 ± 0.45 | 11.85 ± 0.64 | 12.20 ± 1.98 |
| SEA (m2/kg) | 1320.38 ± 254.81 | 787.02 ± 24.70 | 805.64 ± 28.52 | 787.50 ± 15.13 | 848.42 ± 41.42 |
| Amount of released CO (kg/kg) | 0.2729 ± 0.0295 | 0.0699 ± 0.0023 | 0.0713 ± 0.0043 | 0.0709 ± 0.0036 | 0.0673 ± 0.0052 |
| Peak of Amount of released CO (kg/kg) | 7.6204 ± 2.1119 | 2.0586 ± 0.8994 | 0.9025 ± 0.4176 | 0.3938 ± 0.1777 | 1.0886 ± 0.3622 |
| Amount of released CO2 (kg/kg) | 1.17 ± 0.09 | 1.50 ± 0.01 | 1.49 ± 0.02 | 1.49 ± 0.04 | 1.53 ± 0.01 |
| Peak of amount of released CO2 (kg/kg) | 20.74 ± 5.95 | 7.68 ± 0.09 | 7.28 ± 0.25 | 4.48 ± 0.30 | 11.29 ± 0.28 |
| CO/CO2 (-) | 0.23 | 0.05 | 0.05 | 0.05 | 0.04 |
Table 5.
Results of flammability and smoke emission tests of the foams as a function of flame retardant content.
Table 5.
Results of flammability and smoke emission tests of the foams as a function of flame retardant content.
| Parameter | F1 | F3 | F6 | F7 |
| Fire parameters | ||||
| TTI (s) | 2 ± 0 | 2 ± 0 | 2 ± 0 | 2 ± 0 |
| TTF (s) | 562 ± 36 | 204 ± 17 | 144 ± 8 | 168 ± 14 |
| THR (MJ/m2) | 12.15 ± 1.7 | 32.30 ± 0.36 | 20.07 ± 1.99 | 17.20 ± 0.50 |
| MLR (g/(m2·s)) | 7.13 ± 0.57 | 3.64 ± 0.80 | 3.91 ± 0.42 | 3.57 ± 0.21 |
| EHC (MJ/kg) | 17.77 ± 2.06 | 22.36 ± 0.76 | 19.56 ± 0.28 | 17.96 ± 0.04 |
| HRR (kW/m2) | 17.25 ±1.65 | 99.71 ± 3.76 | 72.34 ± 6.09 | 60.38 ± 3.04 |
| pHRR (kW/m2) | 107.58 ± 2.61 | 338.00 ± 34.28 | 288.23 ± 12.85 | 248.20 ± 8.49 |
| tpHRR (s) | 5 ± 0 | 18 ± 4 | 5 ± 0 | 5 ± 0 |
| Mass lost (g/m2) | 784.24 ± 117.66 | 1427.03 ± 55.78 | 1037.77 ± 41.23 | 983.33 ± 85.52 |
| MARHE (kW/m2) | 133.97 ± 5.95 | 282.20 ± 28.35 | 257.87 ± 12.27 | 200.53 ± 11.48 |
| Smoke-emission parameters | ||||
| TSR (m2/m2) | 122.13 ± 31.67 | 1140.80 ± 51.20 | 842.50 ± 42.33 | 778.70 ± 97.23 |
| TSP (m2) | 0.90 ± 0.00 | 10.07 ± 0.45 | 7.43 ± 0.40 | 6.90 ± 0.87 |
| SEA (m2/kg) | 1320.38 ± 254.81 | 805.64 ± 28.52 | 811.44 ± 12.53 | 792.14 ± 30.88 |
| Amount of released CO (kg/kg) | 0.2729 ± 0.0295 | 0.0713 ± 0.0043 | 0.0849 ± 0.0044 | 0.0876 ± 0.0096 |
| Peak of Amount of released CO (kg/kg) | 7.6204 ± 2.1119 | 0.9025 ± 0.4176 | 3.8653 ± 0.6330 | 0.9312 ± 0.3434 |
| Amount of released CO2 (kg/kg) | 1.17 ± 0.09 | 1.49 ± 0.02 | 1.25 ± 0.02 | 1.20 ± 0.03 |
| Peak of amount of released CO2 (kg/kg) | 20.74 ± 5.95 | 7.28 ± 0.25 | 4.85 ± 0.04 | 8.79 ± 0.16 |
| CO/CO2 (-) | 0.23 | 0.05 | 0.07 | 0.07 |
Disclaimer/Publisher’s Note: The statements, opinions and data contained in all publications are solely those of the individual author(s) and contributor(s) and not of MDPI and/or the editor(s). MDPI and/or the editor(s) disclaim responsibility for any injury to people or property resulting from any ideas, methods, instructions or products referred to in the content. |
© 2024 by the authors. Licensee MDPI, Basel, Switzerland. This article is an open access article distributed under the terms and conditions of the Creative Commons Attribution (CC BY) license (http://creativecommons.org/licenses/by/4.0/).
Copyright: This open access article is published under a Creative Commons CC BY 4.0 license, which permit the free download, distribution, and reuse, provided that the author and preprint are cited in any reuse.


