
Submitted:
13 December 2024
Posted:
16 December 2024
You are already at the latest version
Abstract
This paper aims to determine the optimal construction strategies for new build houses in the UK to minimise heating energy demand and discomfort hours. The research utilises a previously calibrated model of "The Future Home" in Energy House 2.0's environmental chamber. Eight design variables were optimised including multiple building fabric specifications, air permeability rates, and heating setpoint temperatures. Three optimisation scenarios were investigated: fixed heating setpoints, variable heating setpoints, and variable setpoints with comfort constraints. The analysis revealed that while fixed heating setpoints showed limited optimization potential, variable setpoint scenarios identified three distinct clusters of optimal solutions. The optimization consistently favored superior building fabric parameters, though air permeability solutions became more nuanced with variable heating control. When constrained to maximum 400 discomfort hours, solutions required elevated heating setpoints (22-23 °C) while maintaining high fabric specifications. These findings advance building optimization methodology by demonstrating the importance of heating control flexibility and comfort constraints in achieving optimal performance, while the use of a calibrated model in controlled conditions overcomes the limitations of previous studies that relied on uncalibrated or hypothetical models.
Keywords:
multi-objective optimization
; dynamic thermal simulation
; thermal comfort
; controlled conditions
; future home standard
1. Introduction
The residential building sector is a significant contributor to the UK’s carbon emissions, driving the development of increasingly stringent building standards and regulations. While the PassivHaus standard has long been recognised as a gold standard for energy-efficient building design, its widespread adoption has been limited by cost implications [1]. The UK government has proposed the Future Homes Standard (FHS) through consultation documents [2], with planned implementation in 2025, aiming to establish more practical yet effective requirements for low-carbon residential buildings. These standards primarily govern building fabric performance through specifications for U-values of external walls, roofs, ground floors, and windows, as well as air permeability rates. However, the relationship between increasing insulation levels and energy performance is not linear, with studies suggesting diminishing returns beyond certain thresholds [3,4,5]. While previous studies have explored building fabric optimization, their results often face uncertainties due to variable environmental conditions and occupancy patterns in real-world settings [6,7]. This research addresses these limitations by utilising Energy House 2.0, a state-of-the-art research facility featuring two environmental chambers capable of simulating extreme weather conditions from -20 °C to +40 °C, including wind, rain, snow, and solar radiation.
For instance, determining a building's Heat Transfer Coefficient (HTC) through coheating tests traditionally requires extensive measures to control environmental factors, such as using aluminium foil to eliminate solar radiation effects [8], and necessitates the building being unoccupied. In contrast, the controlled environment of Energy House 2.0 allows these tests to be completed efficiently with lower uncertainty within several days. This facility contains “The Future Home” (TFH) in environmental chamber one, a prototype house constructed by Bellway Homes to demonstrate anticipated FHS compliance, which serves as the case study for this research [9]. Recent experimental studies have established comprehensive baseline performance data for TFH through co-heating tests, heat-flux measurements, and air permeability testing under these controlled conditions [9].
Using TFH as a case study, these precisely measured parameters enable the development of a calibrated Dynamic Thermal Simulation (DTS) model using DesignBuilder [10]. The resulting multi-objective optimization study within the controlled environment of Energy House 2.0 therefore offers unprecedented reliability, as it reduces the uncertainties typically associated with real-world conditions. This unique setup provides an opportunity to conduct reliable optimization studies that can directly inform industry practices, particularly as UK housebuilders target the construction of 300,000 homes annually under the forthcoming FHS requirements [2]. This approach represents a significant advancement in building performance optimization methodology, bridging the gap between theoretical models and practical applications.
2. Literature Review
2.1. Multi-Objective Optimization for Building Performance Simulation
Multi-objective optimization (MOO) has gained significant attention in building performance simulation due to its ability to handle complex, often conflicting objectives. In design optimization, researchers have successfully applied MOO to optimize building envelope parameters, Heating Ventilation and Air-Conditioning (HVAC) systems, and renewable energy integration. For instance, Nguyen et al. demonstrated the application of MOO in optimizing window-to-wall ratio and insulation thickness to balance energy consumption and thermal comfort [11]. Similarly, Ascione et al. employed MOO for cost optimal retrofitting strategies, considering both energy savings and investment costs [12]. Asadi et al. investigated various retrofit measures including insulation materials, window types, and HVAC systems to minimize energy consumption, retrofit cost, and thermal discomfort hours [13]. Wang et al. implemented MOO to optimize building retrofitting measures and their quantities to maximise energy savings and economic benefits while minimising payback period and life cycle costs [14]. Similarly, Asadi et al. applied a multi-objective optimization model towards minimising energy consumption and investment costs by optimizing window types, insulation materials, and solar collector configurations in residential buildings [15]. Delgarm et al. optimized building energy performance and thermal comfort, considering variables such as room rotation, window size, setpoint temperatures, and envelope properties in different climate regions of Iran [16]. More recently, Rosso et al. developed a comprehensive framework to optimize building retrofit in Mediterranean climate, examining eleven different variables including envelope systems, solar technologies and shading strategies to simultaneously minimise investment cost, energy cost, energy consumption and carbon dioxide emissions [17]. D’Agostino et al. utilised MOO to optimize building envelope, HVAC system configurations and renewable energy sources to minimise cooling demand, heating demand and investment costs while ensuring Nearly Zero Energy Buildings (NZEB) guidance [18]. Finaly, Benincá et al. employed MOO to optimize solar orientation of two residential building shapes ("H" and linear) to simultaneously minimise cooling and heating demands in Southern Brazil [19].
2.2. Multi-Objective Optimization Algorithms
The most widely adopted approach is the Non-dominated Sorting Genetic Algorithm II (NSGA-II), developed by Deb et al. [20], which offers a balance between solution convergence and distribution. This algorithm is implemented in commercial software like DesignBuilder, providing a fast and elitist multi-objective optimization method.
As Jankovic explains, NSGA-II operates through genetic operations of crossover, mutation, and reproduction [7]. The algorithm combines building performance parameters into chromosomes and manipulates these using genetic operations. Starting with random population initialization, the solution space is "peppered" with the starting chromosomes. Through successive generations, chromosomes are paired and split at random positions (crossover), occasionally mutated to explore new parts of the solution space, and selected based on fitness criteria (reproduction).
The efficiency of NSGA-II is demonstrated in Jankovic's study, where it reduced the search space from 920,000 potential cases to 737 cases while maintaining high accuracy in building performance prediction. While DesignBuilder notes a limitation in NSGA-II's constraint handling capability [21], the algorithm's proven effectiveness in ranking competing objectives makes it valuable for building optimization problems.
3. Materials and Methods
3.1. Energy House 2.0 and TFH Experimental Study
The experimental study evaluated the fabric performance of TFH and identified performance gaps between the design intent and actual measured results [9] (Figure 1). These gaps, representing differences between design models, based on the Standard Assessment Procedure (SAP) and real-world performance, were assessed using measurements of the HTC [22,23,24], U-values [25], and airtightness [26] .
The overall fabric heat loss of TFH was 7.7% higher than predicted, increasing the Dwelling Fabric Energy Efficiency (DFEE) by 3.54 kWh/m²/year. The main issue was an airtightness value of 4 m³/h·m², 61% worse than the design target of 2.5 m³/h·m², caused by additional sockets, service penetrations, and insulation gaps at key junctions. Thermal imaging confirmed these issues.
The roof underperformed by 56% due to poorly installed insulation and a large loft decking area that hindered inspection. By contrast, the external walls performed well, with the rendered wall meeting design expectations thanks to continuous PIR insulation that minimised thermal bridging.
A metric called "Point Thermal Transmittance" (PTT) was developed [9] to account for the numerous variables influencing the U-value of ground floors, including thermal bridging, air brick impact, perimeter effect, and insulation geometry. This accounts for the limitations of comparing average heat flux plates measurements to design U-values. As stated in the report, the PTT calculation method mirrors the formula, presenting a range of PTTs (U-values) rather than the average [9]. Ground floor PTT-value were broadly consistent with the design, though challenges in measuring suspended floors highlighted a need for standardised methods.
Windows and doors performed as expected, though limited manufacturer data constrained the analysis. Centre-pane measurements aligned with specifications, while the front door overperformed by 29%, likely due to simplified U-value calculations.
3.2. TFH and Building Standards Context
The optimization study utilises TFH as its case study. Table 1 presents the building's thermal performance specifications alongside relevant UK standards for context. The values listed under UK Building Regulations represent the maximum permitted values for new dwellings [27]. PassivHaus standards represent a more stringent voluntary standard, it specified a maximum U-value of 0.15 W/m²K for all opaque building envelope components (external walls, loft ceiling and ground floor) [28]. The design values of TFH demonstrate compliance with the UK FHS requirements. For comprehensive details of the experimental testing methodology and results, readers are referred to Fitton et al. [9]. The development and calibration process of the DTS model used in this study is fully documented in Tsang et al. [10].
3.3. Selection of Variables for Multi-Objective Optimization
Eight building parameters were selected for multi-objective optimization to minimise heating energy consumption and thermal discomfort in TFH (Table 2). These parameters were chosen based on three criteria: significant discrepancies between design and as-built values, potential for practical improvements through retrofit measures, and varying recommendations across different standards. The parameters include envelope U-values (walls, loft, windows, French doors), air permeability, and heating setpoints for living and other zones. Each parameter underwent multiple iterations to evaluate its performance impact. The following sections detail the selection rationale and range for each variable.
3.3.1. External Walls
External wall U-value was selected as a design variable due to its significant impact on thermal performance and retrofit potential, specifically through the existing 63 mm ventilated cavity which offers an opportunity for additional insulation. The current wall assembly consists of brickwork, the 63 mm ventilated cavity, OSB board, insulated timber frame, PIR insulation board, service void, and plasterboard, achieving an as-built U-value of 0.17 W/m²K [9].
The optimization range (0.12-0.20 W/m²K) explores various cavity insulation scenarios by filling this existing 63 mm void. The lower bound (0.12 W/m²K) represents increased levels of thermal insulation, while intermediate values correspond to commercial options, such as high-performance glass wool (0.14 W/m²K), Knauf Supafil CarbonPlus (0.15 W/m²K) [9], and enhanced mineral wool (0.16 W/m²K). The upper range (0.19-0.20 W/m²K) accounts for potential non-uniform insulation distribution. Values above 0.20 W/m²K were excluded despite the UK building regulation limit of 0.26 W/m²K, as they are improbable with the existing construction.
3.3.2. Loft Ceiling
Loft ceiling U-value was selected as a design variable due to significant deviation between design (0.09 W/m²K) and as-built performance (0.14 W/m²K), primarily caused by disturbed and non-uniform insulation distribution, inconsistent thickness throughout the loft space, and potential air infiltration issues identified through thermographic imaging [9]. The optimization potential is particularly relevant as approximately 50% of the loft area is decked, limiting intervention options.
The optimization range (0.09-0.16 W/m²K) explores various remediation scenarios. The lower bound (0.09 W/m²K) represents the original design specification, achievable through comprehensive remediation of installation issues. Intermediate values (0.10-0.13 W/m²K) correspond to incremental improvements through insulation redistribution, thermal bridging reduction, and air sealing measures. The upper range extends to 0.16 W/m²K, aligning with UK building regulations, while accounting for scenarios with reduced insulation thickness from design specification. This range reflects both practical constraints of the decked loft space and technically feasible improvements
3.3.3. Windows and French Door
Window upgrades present significant retrofit potential in TFH. The current installation features double-glazed windows with a manufacturer-specified combined U-value (frame and glazing) of 1.2 W/m²K, meeting the FHS requirements but offering potential for enhancement [9].
The optimization range (0.8-1.6 W/m²K) explores various glazing technologies. The lower bound (0.8 W/m²K) aligns with PassivHaus standards and represents enhanced triple glazing with low-emissivity coatings and inert gas filling. Intermediate U-values of 1.0 W/m²K represents standard triple glazing according to UK SAP calculations [29]. The upper range extends to 1.6 W/m²K, aligning with current UK building regulations, to account for potential performance variations. Similarly, French doors follow a complementary optimization range (1.0-1.8 W/m²K), with the current installation having a manufacturer-specified combined U-value of 1.4 W/m²K. This coordinated approach enables evaluation of whole-house glazing strategies while maintaining technical feasibility.
3.3.4. Air Permeability Rate
Air permeability rate shows significant scope for improvement, with current measured performance of 4.0 m³/h·m² at 50 Pa deviating from the design value of 2.5 m³/h·m². This difference is primarily attributed to additional service penetrations installed for research purposes [9].
The optimization range (2.5-5.0 m³/h·m²) explores various airtightness scenarios. While the PassivHaus standard recommends 0.6 m³/h·m², and values below 1.5 m³/h·m² are technically achievable, such low air permeability rates would require enhanced sealing techniques and potentially Mechanical Ventilation with Heat Recovery (MVHR). Therefore, the lower bound (2.5 m³/h·m²) represents the design value. The upper range extends to 5.0 m³/h·m², representing the maximum allowable value under FHS. This range allows for analysis of various performance scenarios within practical and regulatory constraints.
3.3.5. Ground Floor
Ground floor thermal performance shows complexity in assessment, with an as-built PTT-value of 0.14 W/m²K exceeding the design value of 0.11 W/m²K. The optimization range (0.11-0.18 W/m²K) explores various performance scenarios. The lower bound (0.11 W/m²K) represents potential improvement to design stage performance, while the upper bound aligns with UK building regulations maximum allowable value. Intermediate values account for potential performance variations due to thermal bridging effects, air movement through ventilation bricks, and insulation distribution patterns.
3.3.6. Heating Setpoint Temperatures
Heating setpoint temperatures were differentiated between living room at 21 °C and other zones at 18 °C, based on varying occupancy patterns and comfort requirements. These baseline values follow DesignBuilder default guidance [21].
The optimization ranges consider multiple standards: SAP recommends 21 °C for living areas and 18 °C for other zones, PassivHaus standard specifies a consistent 20 °C [28], CIBSE suggests 20 °C for living areas and 18 °C for bedrooms [30], while ASHRAE defines comfort zones of 20-24 °C for living areas and 18-21°C for bedrooms [31]. The living room range of 19-22 °C and other zones range of 18-21°C explore this variation while maintaining zonal temperature differences. These ranges enable evaluation of energy demand and comfort trade-offs across four discrete temperature steps, with constant heating setpoints assumed throughout each zone except storage areas.
3.4. Running Multi-Objective Optimization
Multi-objective optimization was performed using the calibrated energy model from Tsang et al. to evaluate three scenarios: fixed heating setpoints, variable heating setpoints, and variable heating setpoints with a 400-hour thermal discomfort constraint. The optimization targeted two objectives: minimising heating energy demand and thermal discomfort hours, with the latter defined by exceedance of ASHRAE 55-2004 winter clothing comfort boundaries based on zone humidity ratio and operative temperature [32].
The optimization utilised DesignBuilder's default genetic algorithm settings with maximum generations of 100, convergence criteria of 5 generations, and initial population size of 20. The solution space of 8,211,456 combinations was explored until convergence was achieved, with all simulations performed on an HP ZBook (i9-13950HX processor, 64GB RAM).
4. Results and Discussion
4.1. Fixed Heating Set-Point Optimization Analysis
The results, as illustrated in Figure 2, demonstrate a distinct linear correlation between electric heating demand and winter clothing discomfort hours when the heating setpoint was fixed. The simulation achieved convergence after 37 generations with 669 iterations, yet a true Pareto front was not established, suggesting limited optimization potential under these constraints. The simulation shows only 5 optimal designs (red square).
Furthermore, the findings underscore the complexities of building performance optimization when constraining individual variables. The interdependence of building parameters suggests that fixing any single variable may significantly limit the available trade-off options for designers. Of particular concern is the potential for cross-compensation among variables, whereby the optimization algorithm may suggest building physics properties that deviate from realistic values to compensate for the constrained parameter.
Given the UK's heating-dominated climate, the analysis used a constant winter clothing insulation value throughout the annual simulation period. While this approach could resulted in relatively high observed discomfort hours (1750-2080 hours), previous research has demonstrated that incorporating adaptive clothing behaviours into thermal comfort simulations yields substantially improved results [8], highlighting a potential limitation in the current methodology.
Notably, the single Pareto solution suggests an optimization tendency towards maximizing building envelope performance, indicating that optimal designs favour superior external wall, loft ceiling, and window constructions, combined with minimal air permeability rates. This finding aligns with established building physics principles but may not fully capture the economic and practical constraints of real-world applications.
4.2. Variable Heating Set-Point Optimization Analysis
The multi-objective optimization with variable heating set-points demonstrated robust convergence after 66 generations, encompassing 1,289 iterations (Figure 3). The results revealed a well-defined Pareto front, clearly illustrating the inherent trade-offs between occupant thermal discomfort and heating energy consumption. This trade-off relationship manifests in three distinct clusters of optimal solutions, suggesting multiple viable design strategies. The simulation shows 78 optimal designs (red squares).
Similarly to the fixed set-point analysis, the optimal designs consistently favoured superior external wall, loft ceiling, and window constructions, confirming these elements as crucial parameters for simultaneously minimising both discomfort hours and heating demand. However, a notable departure from the fixed set-point scenario emerged in the air permeability optimization. Rather than consistently driving towards minimum air permeability rates, the variable set-point optimization revealed more nuanced solutions, suggesting a more complex interaction between ventilation and thermal performance when heating control strategies can adapt.
These findings highlight the limitations of conventional design processes that rely on limited simulation iterations. Such restricted exploration of the solution space risks converging on sub-optimal solutions, potentially resulting in buildings that underperform throughout their lifecycle.
4.3. Constrained Optimization Analysis with Maximum Discomfort Threshold
The multi-objective optimization process, operating under a constraint of 400 discomfort hours, achieved robust convergence after 79 generations and 1,487 iterations. The analysis yielded a well-defined Pareto front, similar to the results shown in Figure 2. However, the increased number of generations required for convergence suggests inherent variability in the optimization process, highlighting the stochastic nature of the algorithm.
When implementing a constraint of 400 discomfort hours, the optimization results yielded a significantly reduced solution space, with only 43 optimum designs, shown as Pareto points, meeting the comfort criterion (Figure 4).
This constraint effectively filtered out a substantial portion of the previously viable solutions from the analysis in Figure 3. The remaining optimal solutions exhibited similar trends to the unconstrained analysis, particularly in terms of building envelope specifications. However, a distinctive characteristic emerged in the heating control strategy, with optimal solutions consistently favouring higher heating set-points of 22 °C to 23 °C. This finding emphasises that maintaining elevated heating set-points becomes crucial for achieving occupant thermal comfort requirements in the UK climate context.
The Pareto front in Figure 4 represents a design decision making tool, which generally shows that higher heating energy consumption results in lower discomfort hours and vice versa. To investigate this in more detail, a quantified summary taken from the two extremes of the Pareto front, is shown in Table 3.
As it can be seen from this table, the increase of 372 kWh of heating energy from the lover to the upper extreme contributes to 101 discomfort hours reduction. This coincides with air permeability rates increase from 2.5 m3/hm2 to 5.0 m3/hm2, and with the increase glazing U-value from 0.8 W/m2K to 1.6 W/m2K. The heating set-point temperatures of 22 oC for the living room and the other rooms was constant throughout this range, except for a single occurrence of 23 oC as shown in Table 3. The constant set-temperatures indicate that temperature uniformity across all rooms leads to better thermal comfort. Whilst the increased glazing U-value is a counter-intuitive contributor to the decrease of thermal discomfort hours, this could be one of the causes of increased heating, which in turn leads to better thermal comfort. Similarly, the increased air-permeability rate is a counter-intuitive contributor to the increase of thermal discomfort hours, but this could also be one of the causes of increased heating that leads to better thermal comfort. It can be argued that the increased air-permeability rate also leads to the increased amount of fresh air per person and to better internal air quality, although this is not accounted for under discomfort hours. These few counter-intuitive matters will be investigated in future research in controlled laboratory conditions.
5. Conclusions
This study employed multi-objective optimization on a calibrated model of TFH in the controlled environment in Energy House 2.0 to determine optimal construction strategies for new UK homes. The optimization analysis revealed several key insights: 1) fixed heating setpoints demonstrated limited optimization potential, while the optimization consistently favoured superior building fabric across all scenarios. 2) Variable setpoint scenarios produced three distinct clusters of optimal solutions and showed more nuanced air permeability solutions compared to the fixed setpoint's drive toward minimum rates. 3) When constrained to maximum 400 discomfort hours, solutions required elevated heating setpoints of 22-23 °C while maintaining superior building fabric.
The Pareto front shown in this analysis represents a range of trade-off solutions that designers and developers can use in order to achieve different design objectives with confidence. Otherwise, design solutions will not be rigorously tested and could lead to inferior building performance. The few counter-intuitive occurrences of the results reported in the previous section will be investigated in future research.
Future research will extend this work through parallel optimization of another case study in Energy House 2.0 called "eHome2" [33], incorporating additional design variables such as building orientation, heat pump Coefficient of Performance (COP), lighting, and Photovoltaic panel sizing. Additional objectives such as carbon emissions and building costs could be evaluated, while further constraints like summer overheating hours could be introduced to enhance the optimization framework.
Nomenclature
| FHS | - | Future Homes Standard |
| HTC | - | Heat transfer Coefficient |
| DTS | - | Dynamic Thermal Simulation |
| MOO | - | Multi-objective optimisation |
| HVAC | - | Heating, ventilation and air-conditioning |
| NZEB | - | Net Zero Energy Building |
| NSGA-II | - | Non-dominated Sorting Genetic Algorithm |
| TFH | - | The Future Home in Energy House Labs Environmental Chamber 1 developed in collaboration between Bellway Homes and the University of Salford |
| MVHR | - | Mechanical Ventilation and Heat Recovery |
| PTT | - | Point Thermal Transmittance |
| eHome2 | - | Experimental house in Energy House Labs Environmental Chamber 1 developed in collaboration between Barratt Developments, Saint-Gobain, and the University of Salford. |
Author Contributions
Conceptualization, C.T. and L.J.; methodology, C.T. and L.J.; validation, C.T.; investigation, C.T. and L.J.; resources, R.F.; data curation, G.H.; writing—original draft preparation, C.T. and L.J.; writing—review and editing, All; supervision, L.J. and R.F. All authors have read and agreed to the published version of the manuscript.
Funding
This work was undertaken as part of a Future Homes project, funded by the Innovate UK, which aims to create a globally competitive centre for research and innovation in net zero housing in Greater Manchester. The project is a collaboration between Barratt Developments, Bellway Homes, the Energy Innovation Agency, Q-bot, RED Cooperative, RSK Environment, Saint-Gobain, The University of Manchester, and the University of Salford.
Data Availability Statement
Models and data are available on request.
Conflicts of Interest
The authors declare no conflicts of interest.
References
- Hines, J.; Godber, S.; Butcher, B.; Siddall, M.; Jennings, P.; Grant, N.; Clarke, A.; Mead, K.; Parsons, C. How to Build a Passivhaus: Rules of Thumb; Passivhaus Trust: London, UK, 2015.
- HM Government The Future Homes and Buildings Standards: 2023 Consultation; Department for Levelling Up, Housing and Communities, 2023.
- Kaynakli, O. A Review of the Economical and Optimum Thermal Insulation Thickness for Building Applications. Renewable and Sustainable Energy Reviews 2012, 16, 415–425. [CrossRef]
- Nematchoua, M.K.; Raminosoa, C.R.R.; Mamiharijaona, R.; René, T.; Orosa, J.A.; Elvis, W.; Meukam, P. Study of the Economical and Optimum Thermal Insulation Thickness for Buildings in a Wet and Hot Tropical Climate: Case of Cameroon. Renewable and Sustainable Energy Reviews 2015, 50, 1192–1202. [CrossRef]
- Tsang, C.; Spentzou, E.; Lomas, K.J.; He, M. Reducing Energy Consumption and Improving Comfort by Retrofitting Residential Buildings in the Hot Summer and Cold Winter Zone of China. 2022.
- Jankovic, L. Lessons Learnt from Design, off-Site Construction and Performance Analysis of Deep Energy Retrofit of Residential Buildings. Energy and Buildings 2019, 186, 319–338. [CrossRef]
- Jankovic, L. Improving Building Energy Efficiency through Measurement of Building Physics Properties Using Dynamic Heating Tests. Energies 2019, 12, 1450. [CrossRef]
- Jankovic, L. Designing Zero Carbon Buildings Using Dynamic Simulation Methods; 2nd ed.; Routledge: London, 2017; ISBN 978-1-315-62090-9.
- Fitton, R.; Diaz, H.; Farmer, D.; Henshaw, G.; Sitmalidis, A.; Swan, W. Bellway Homes “The Future Home” Baseline Performance Report; Salford: ERDF & Innovate UK, 2024;
- Tsang, C.; Fitton, R.; Hernandez, H.D.; Henshaw, G.; Sitmalidis, A. Pioneering Net Zero Homes: A Study of Bellway “The Future Home” Simulation Calibration.; 2024.
- Nguyen, A.-T.; Reiter, S.; Rigo, P. A Review on Simulation-Based Optimization Methods Applied to Building Performance Analysis. Applied Energy 2014, 113, 1043–1058. [CrossRef]
- Ascione, F.; Bianco, N.; De Stasio, C.; Mauro, G.M.; Vanoli, G.P. Multi-Stage and Multi-Objective Optimization for Energy Retrofitting a Developed Hospital Reference Building: A New Approach to Assess Cost-Optimality. Applied Energy 2016, 174, 37–68. [CrossRef]
- Asadi, E.; Silva, M.G. da; Antunes, C.H.; Dias, L.; Glicksman, L. Multi-Objective Optimization for Building Retrofit: A Model Using Genetic Algorithm and Artificial Neural Network and an Application. Energy and Buildings 2014, 81, 444–456. [CrossRef]
- Wang, B.; Xia, X.; Zhang, J. A Multi-Objective Optimization Model for the Life-Cycle Cost Analysis and Retrofitting Planning of Buildings. Energy and Buildings 2014, 77, 227–235. [CrossRef]
- Asadi, E.; da Silva, M.G.; Antunes, C.H.; Dias, L. Multi-Objective Optimization for Building Retrofit Strategies: A Model and an Application. Energy and Buildings 2012, 44, 81–87. [CrossRef]
- Delgarm, N.; Sajadi, B.; Delgarm, S. Multi-Objective Optimization of Building Energy Performance and Indoor Thermal Comfort: A New Method Using Artificial Bee Colony (ABC). Energy and Buildings 2016, 131, 42–53. [CrossRef]
- Rosso, F.; Ciancio, V.; Dell’Olmo, J.; Salata, F. Multi-Objective Optimization of Building Retrofit in the Mediterranean Climate by Means of Genetic Algorithm Application. Energy and Buildings 2020, 216, 109945. [CrossRef]
- D’Agostino, D.; Minelli, F.; Minichiello, F. New Genetic Algorithm-Based Workflow for Multi-Objective Optimization of Net Zero Energy Buildings Integrating Robustness Assessment. Energy and Buildings 2023, 284, 112841. [CrossRef]
- Benincá, L.; Crespo Sánchez, E.; Passuello, A.; Karini Leitzke, R.; Grala da Cunha, E.; Maria González Barroso, J. Multi-Objective Optimization of the Solar Orientation of Two Residential Multifamily Buildings in South Brazil. Energy and Buildings 2023, 285, 112838. [CrossRef]
- Deb, K.; Pratap, A.; Agarwal, S.; Meyarivan, T. A Fast and Elitist Multiobjective Genetic Algorithm: NSGA-II. IEEE Transactions on Evolutionary Computation 2002, 6, 182–197. [CrossRef]
- DesignBuilder DesignBuilder Software 2022.
- Johnston, D.; Miles-Shenton, D.; Wingfield, J.; Farmer, D.; Bell, M. Whole House Heat Loss Test Method (Coheating); Leeds Metropolitan University: Leeds, UK, 2012;
- Alzetto, F.; Pandraud, G.; Fitton, R.; Heusler, I.; Sinnesbichler, H. QUB: A Fast Dynamic Method for in-Situ Measurement of the Whole Building Heat Loss. Energy and Buildings 2018, 174, 124–133. [CrossRef]
- Veritherm Veritherm Testing Available online: https://veritherm.co.uk/testing/ (accessed on 17 July 2023).
- ISO ISO 9869-1:2014 Thermal Insulation — Building Elements — In-Situ Measurement of Thermal Resistance and Thermal Transmittance Part 1: Heat Flow Meter Method; 2014.
- ATTMA ATTMA Technical Standard L1. Measuring the Air Permeability of Building Envelopes (Dwellings); Air Tightness Testing and Measurement Association: Northampton, 2010;
- HM Government RIBA Publishing Ltd. UK Building Regulations. Part L1A: Conservation of Fuel and Power in New Dwellings; London, UK, 2023.
- Passivhaus Institute Passive House Institute. Criteria for Buildings: Passive House - EnerPHit - PHI Low Energy Building; Darmstadt, Germany, 2023.
- HM Government BEIS. SAP 10.2: The Government’s Standard Assessment Procedure for Energy Rating of Dwellings; BRE Garston, Watford, WD25 9XX, 2023.
- CIBSE CIBSE Guide A: Environmental Design; London, UK, 2015; ISBN 978-0-240-81224-3.
- ASHRAE ASHRAE. ASHRAE Handbook Fundamentals. ASHRAE Standard; 1791 Tullie Circle NE, Atlanta, GA 30329, 2018.
- ASHRAE ASHRAE. ASHRAE Standard 55-2004: Thermal Environmental Conditions for Human Occupancy; 1791 Tullie Circle NE, Atlanta, GA 30329, 2004.
- Fitton, R.; Diaz, H.; Farmer, D.; Henshaw, G.; Sitmalidis, A.; Swan, W. Saint Gobain & Barratt Developments “eHome2” Baseline Performance Report; Salford: ERDF & Innovate UK, 2024;
Figure 1.
Front elevation of TFH in Energy House 2.0 Environmental Chamber one (left) and TFH modelled in DesignBuilder (right).
Figure 1.
Front elevation of TFH in Energy House 2.0 Environmental Chamber one (left) and TFH modelled in DesignBuilder (right).
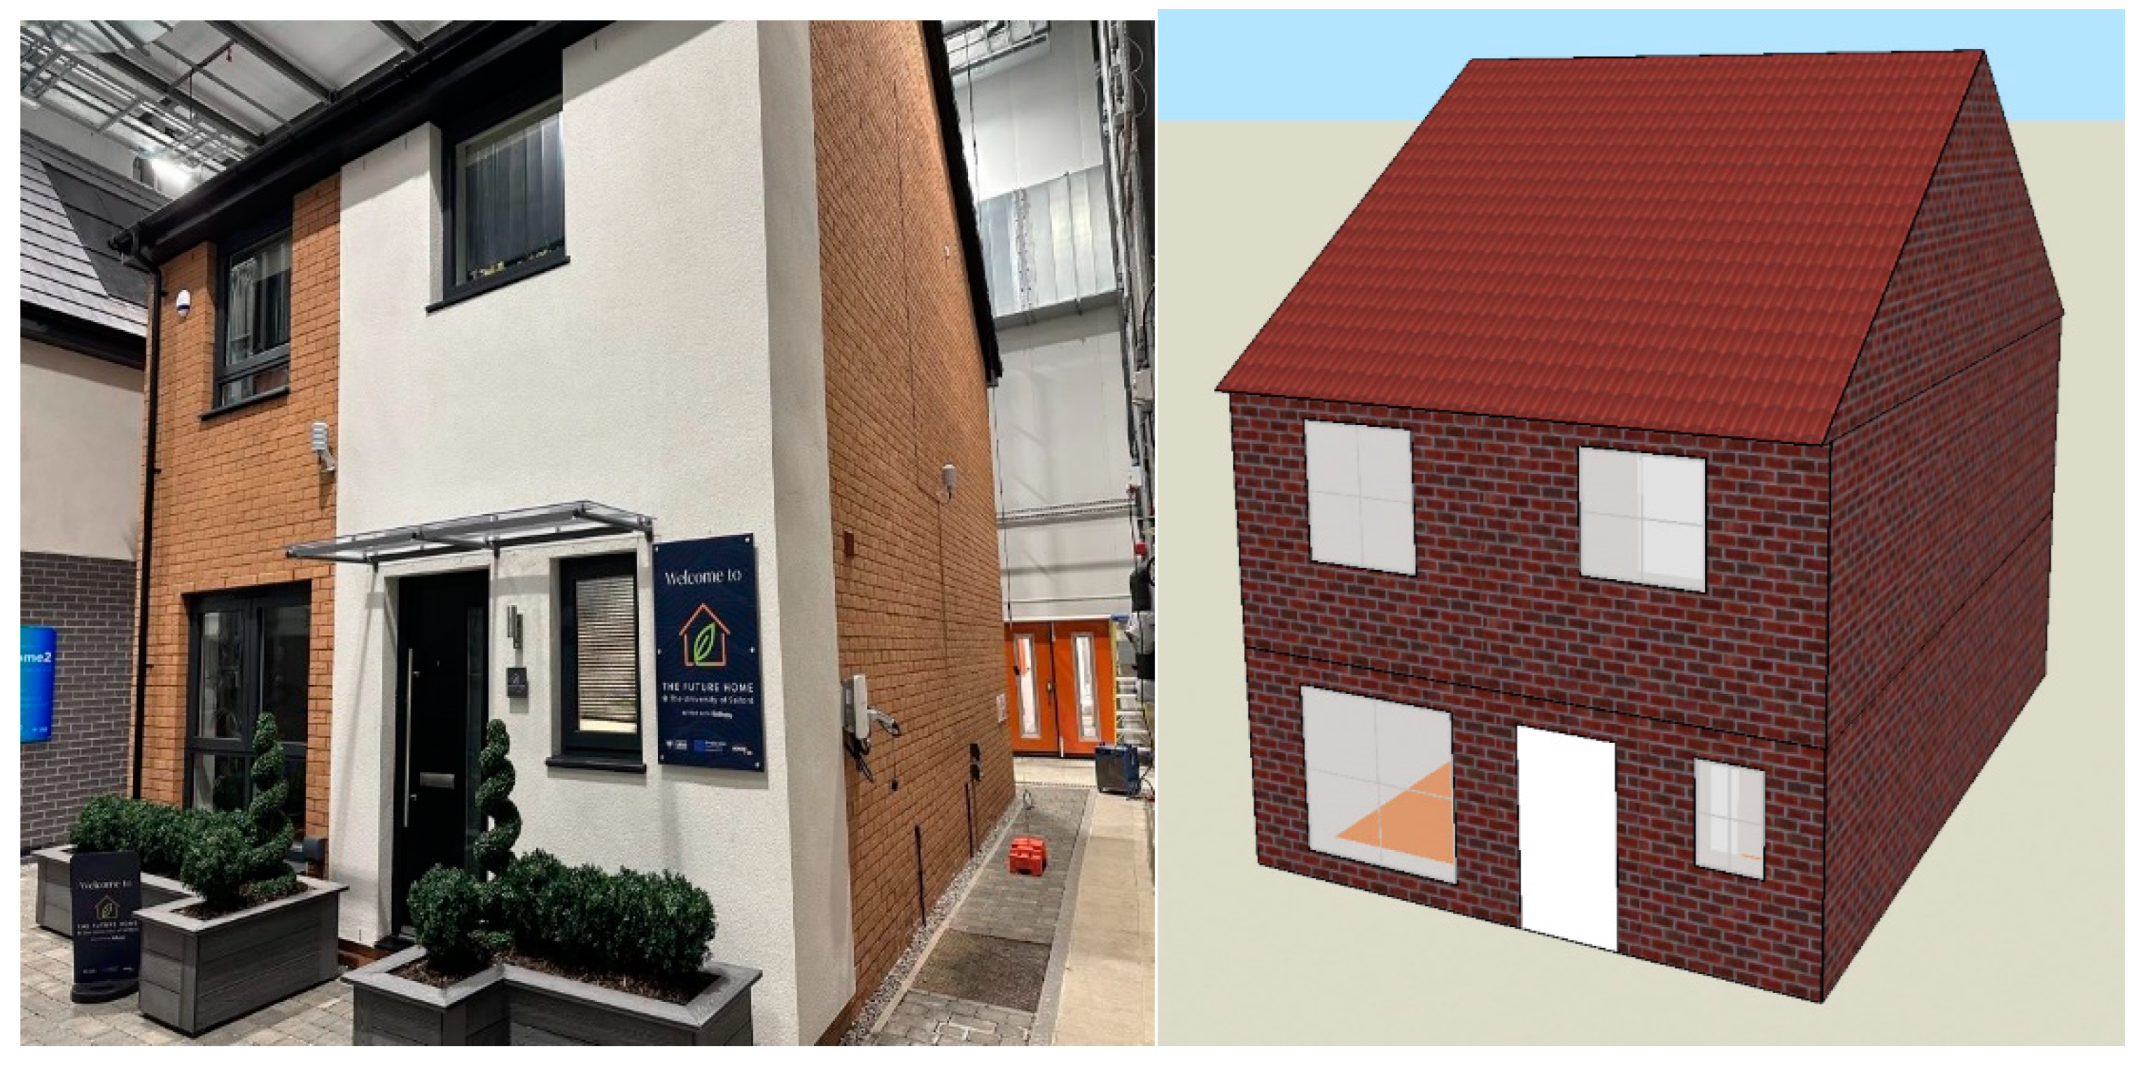
Figure 2.
Optimization results of electric heating demand versus winter clothing discomfort hours. Grey dots: previous generations; red square: Pareto solution (37 generations).
Figure 2.
Optimization results of electric heating demand versus winter clothing discomfort hours. Grey dots: previous generations; red square: Pareto solution (37 generations).
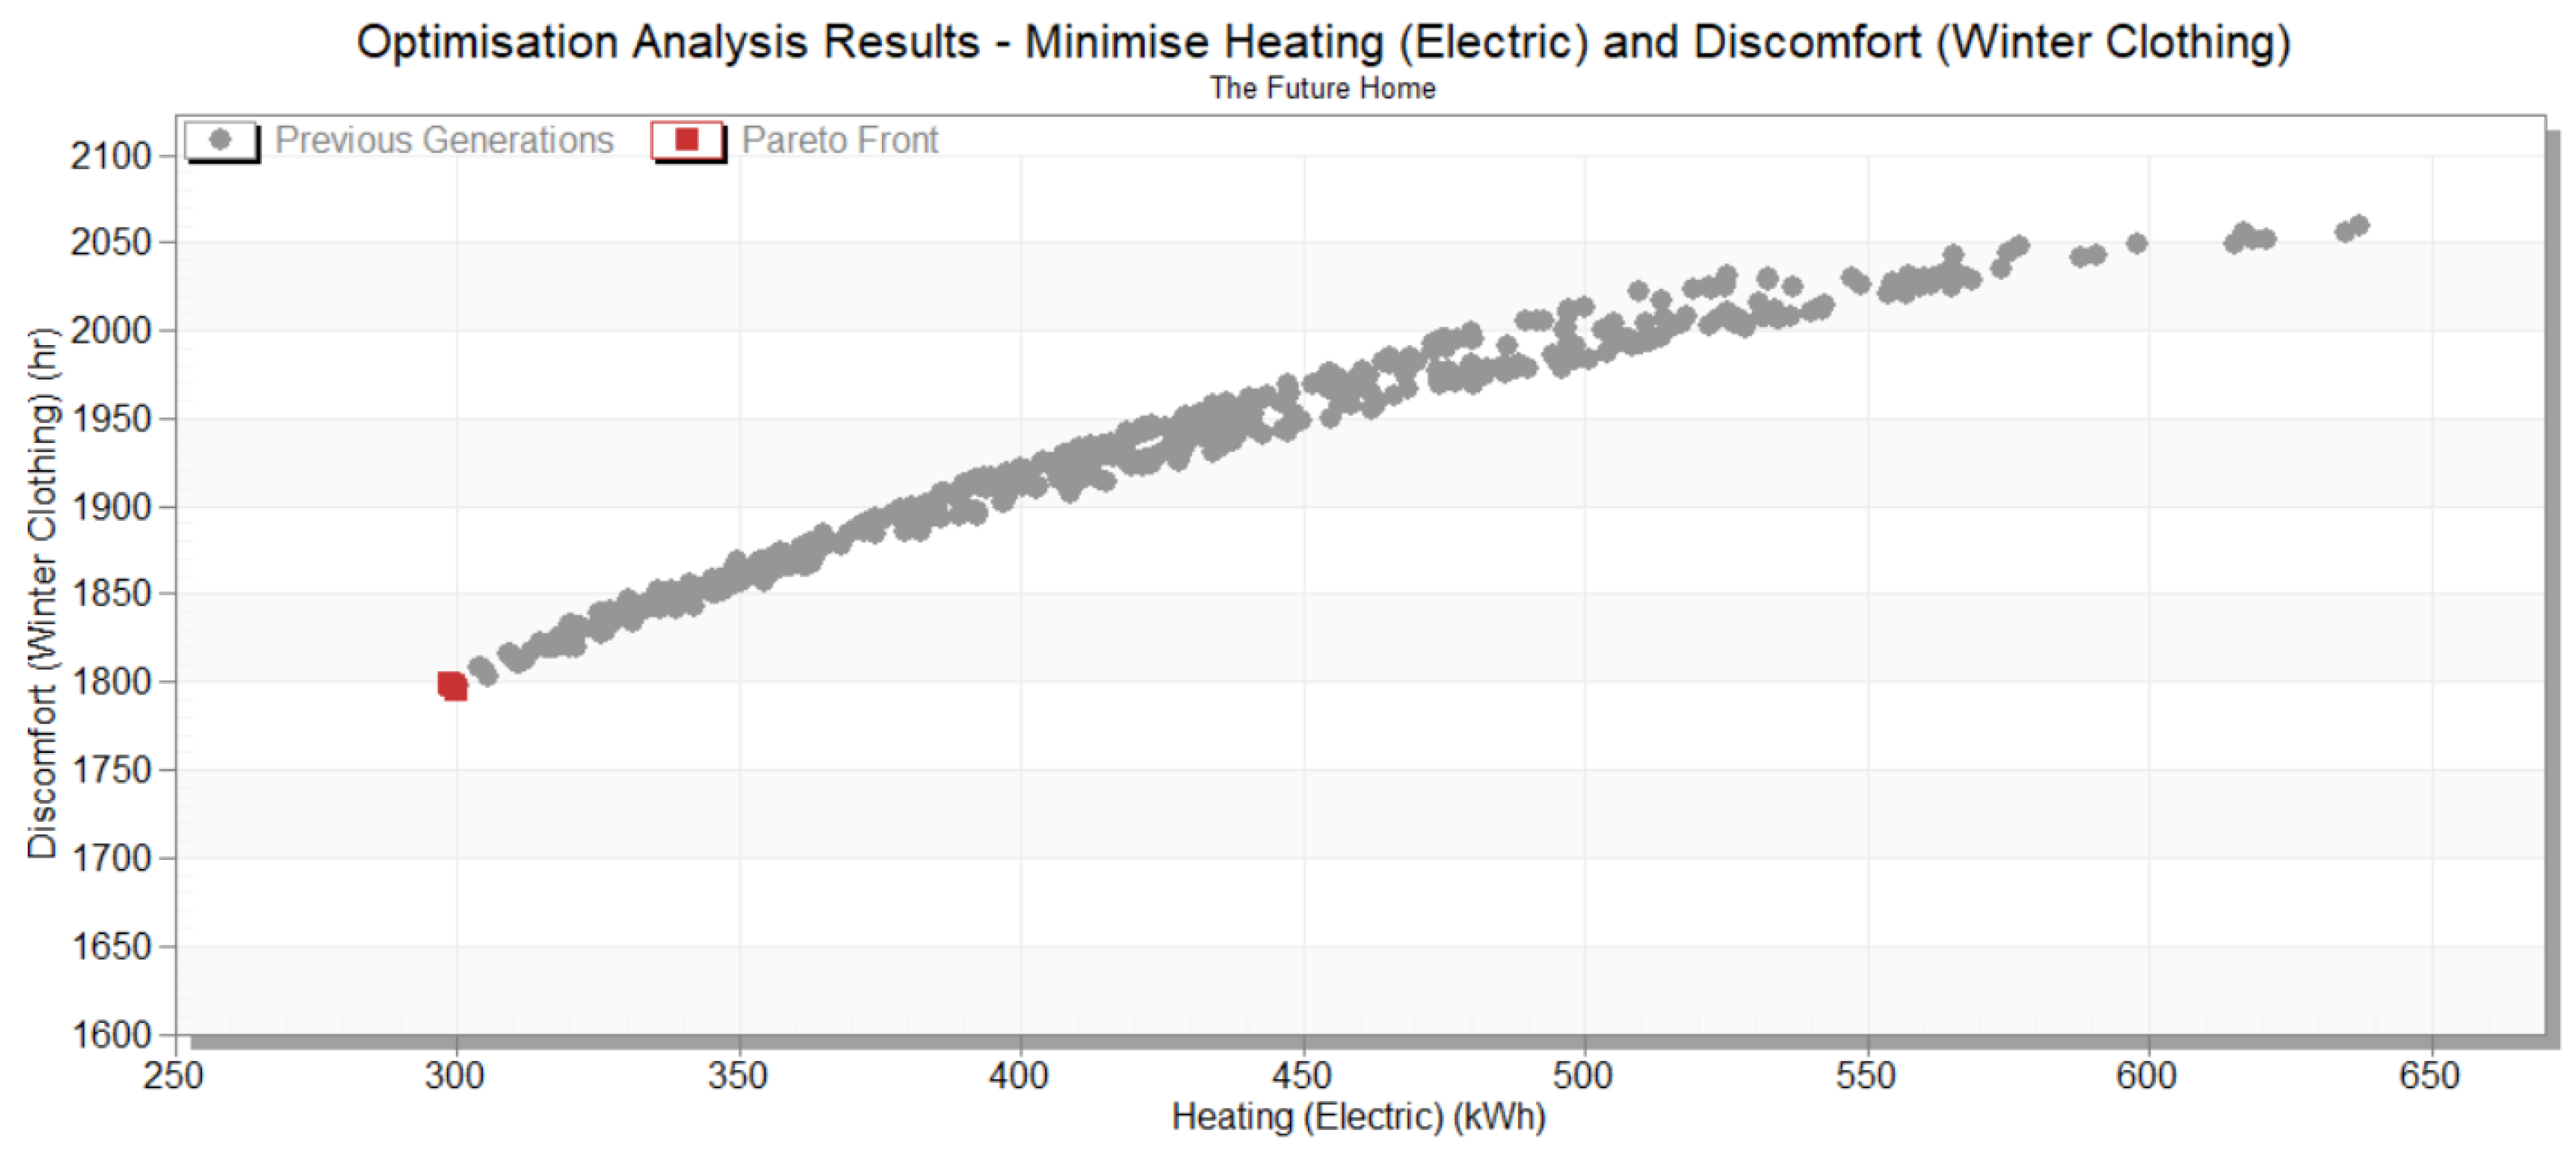
Figure 3.
Optimization results of electric heating demand versus winter clothing discomfort hours, showing Pareto front evolution. Grey dots: previous generations; red squares: Pareto solutions (66 generations).
Figure 3.
Optimization results of electric heating demand versus winter clothing discomfort hours, showing Pareto front evolution. Grey dots: previous generations; red squares: Pareto solutions (66 generations).
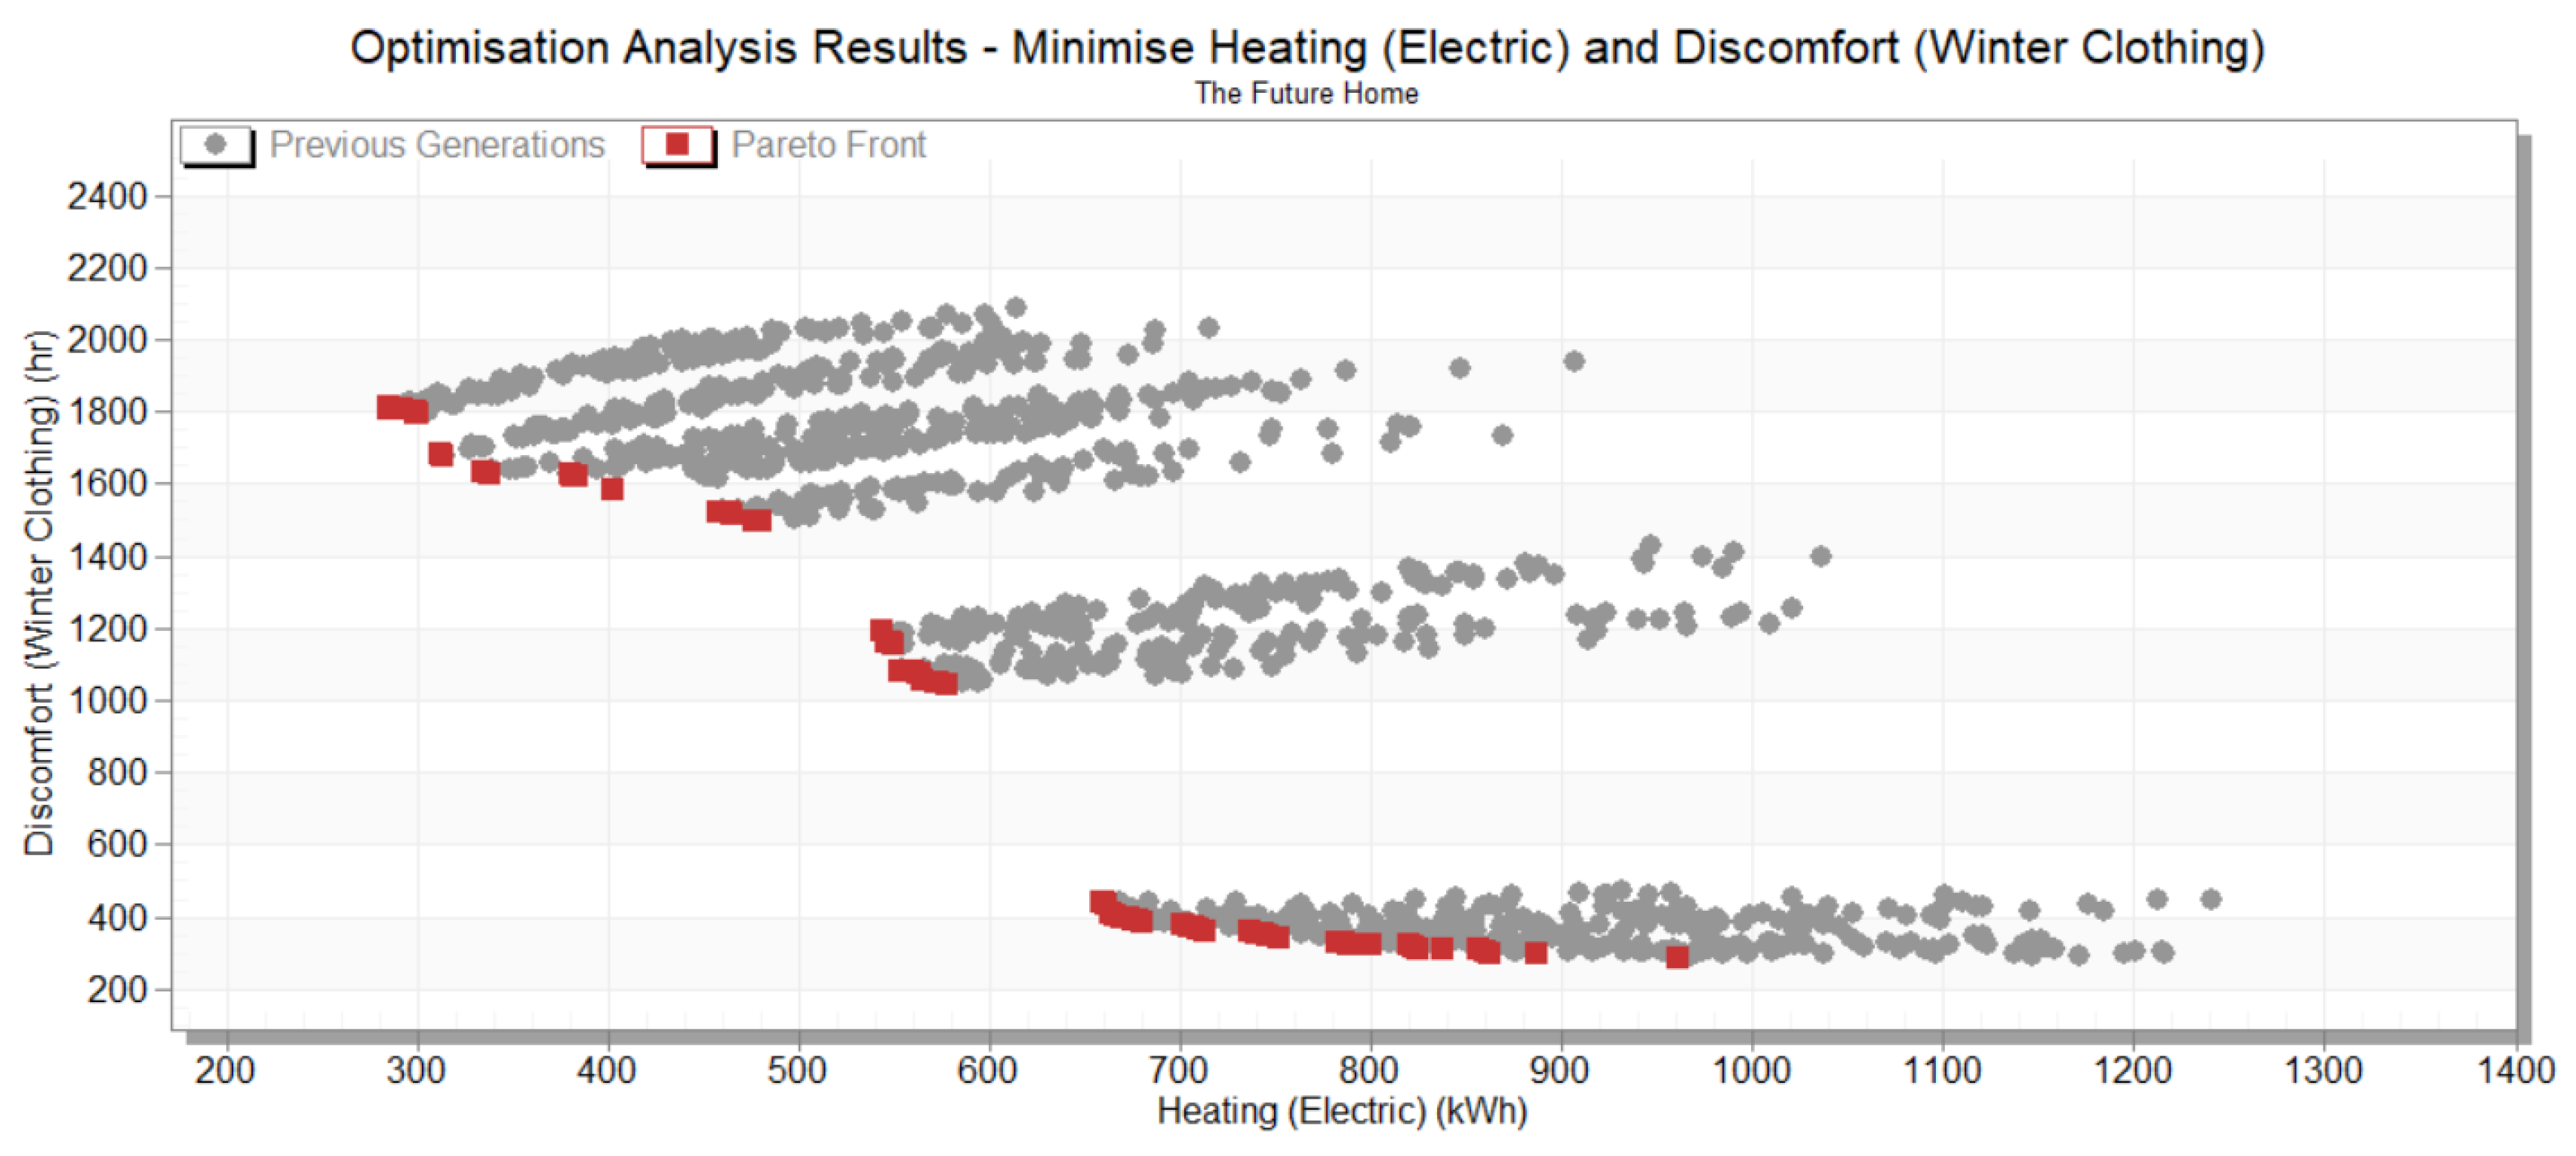
Figure 4.
Optimization results of electric heating demand versus winter clothing discomfort hours, showing Pareto front evolution. Grey dots: previous generations; red squares: Pareto solutions (79 generations); yellow squares: rejected solutions due to constraint.
Figure 4.
Optimization results of electric heating demand versus winter clothing discomfort hours, showing Pareto front evolution. Grey dots: previous generations; red squares: Pareto solutions (79 generations); yellow squares: rejected solutions due to constraint.
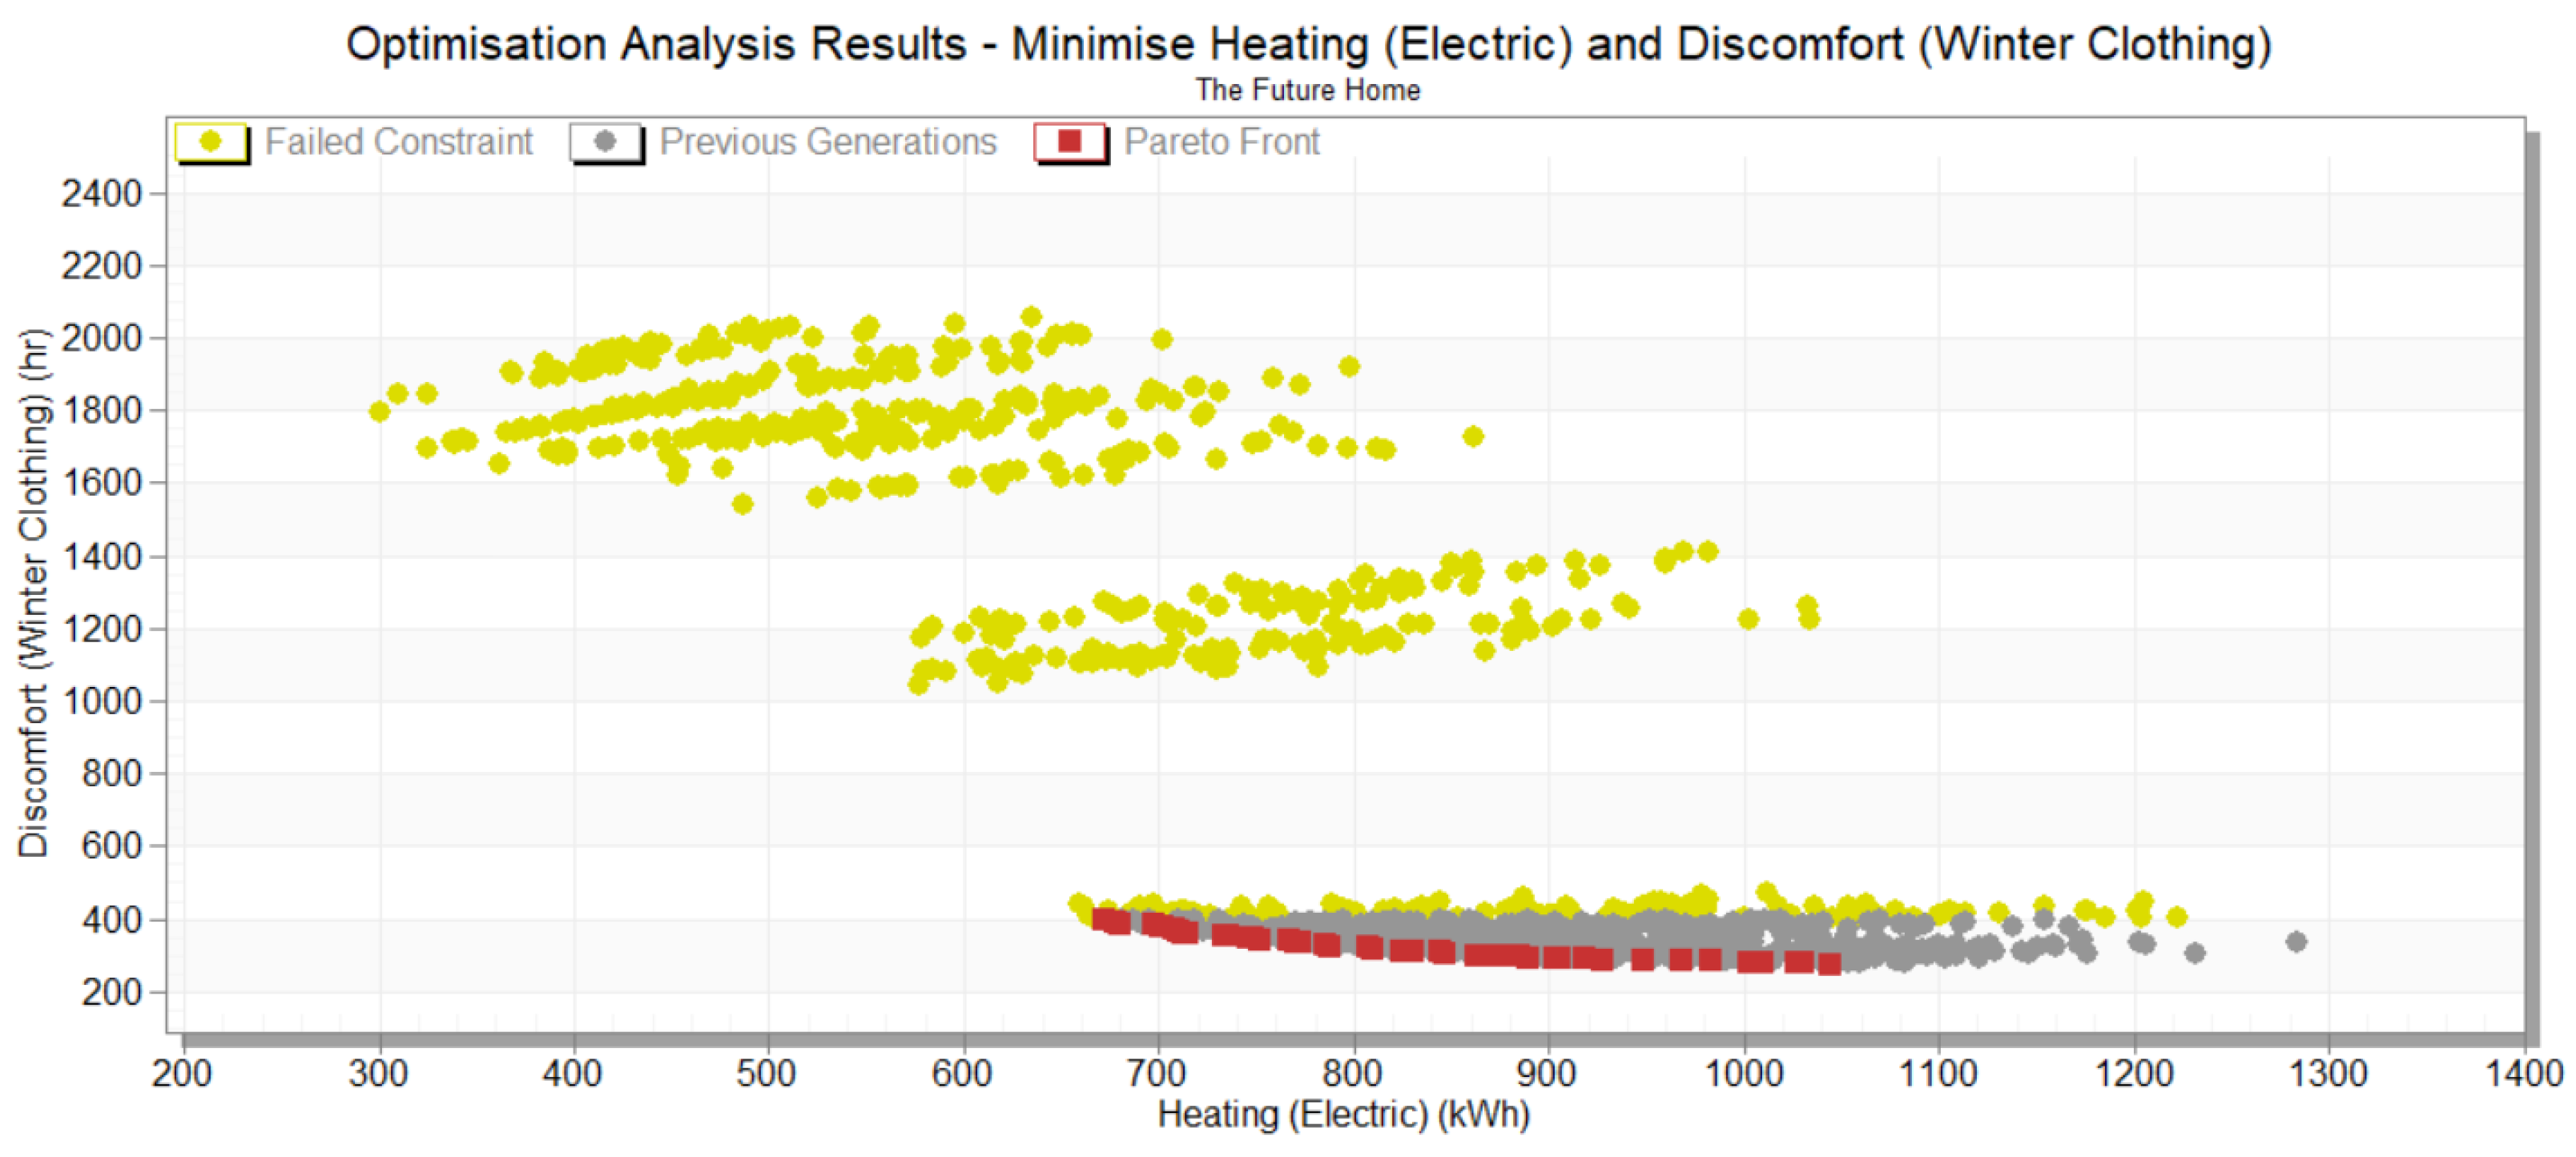

Table 1.
Thermal performance parameters comparison between TFH design specifications, as-built measurements, and relevant UK and international building standards.
Table 1.
Thermal performance parameters comparison between TFH design specifications, as-built measurements, and relevant UK and international building standards.
| Building fabric element | Design | As-built | UK FHS | UK Building regulations | PassivHaus standard |
|---|---|---|---|---|---|
| External wall U-value (W/m2K) | 0.18 | 0.17 | 0.18 | 0.26 | 0.15 |
| Loft ceiling U-value (W/m2K) | 0.09 | 0.14 | 0.11 | 0.16 | 0.15 |
| Ground floor PTT-value (W/m2K) | 0.11 | 0.14 | 0.13 | 0.18 | 0.15 |
| Windows U-value (W/m2K) | 1.20 | - | 1.20 | 1.60 | 0.80 |
| French Door U-value (W/m2K) | 1.40 | - | 1.20 | - | - |
| External Door U-value (W/m2K) | 1.00 | - | 1.00 | 1.60 | 0.80 |
| Air infiltration rate @50 Pa (m3/hm2) | 2.50 | 4.00 | 5.00 | 8.00 | 0.60 |
Table 2.
Summary of design variables perturbations used in multi-objective optimization.
| Variable | Baseline | Perturbations | Iterations |
| External wall U-value (W/m2K) | 0.17 | 0.12, 0.13, 0.14, 0.15, 0.16, 0.17, 0.18, 0.19, 0.20 | 9 |
| Loft ceiling U-value (W/m2K) | 0.14 | 0.09, 0.10, 0.11, 0.12, 0.13, 0.14, 0.15, 0.16 | 8 |
| Window U-values (W/m2K) | 1.2 | 0.8, 0.9, 1.0, 1.1, 1.2, 1.3, 1.4, 1.5, 1.6 | 9 |
| French door U-value (W/m2K) | 1.4 | 1.0, 1.1, 1.2, 1.3, 1.4, 1.5, 1.6, 1.7, 1.8 | 9 |
| Air permeability rate @50 Pa (m3/hm2) | 4.0 | 2.5, 3.0, 3.5, 4.0, 4.5, 5.0 | 6 |
| Ground floor PTT-value (W/m2K) | 0.14 | 0.11, 0.12, 0.13, 0.14, 0.15, 0.16, 0.17, 0.18 | 8 |
| Living room heating set-point (°C) | 21 | 19, 20, 21, 22 | 4 |
| Other zone heating set-point (°C) | 18 | 18, 19, 20, 21 | 4 |
Table 3.
Summary of extremes of design parameters from the Pareto front.
| Pareto extreme |
Heating (Electric) (kWh) | Discomfort (Winter Clothing) (hr) | Air permeability rate @50 Pa (m3/hm2) | Glazing U-value (W/m2K) |
Living Room Heating set-point temperature (oC) | Other Rooms Heating set-point temperature (oC) |
| (1) | 672 | 397 | 2.5 | 0.8 | 22 | 22 |
| (2) | 1044 | 276 | 5.0 | 1.6 | 22 (23)* | 22 |
| Difference (2)-(1) | 372 | -101 | 2.5 | 0.8 | 0 (1)* | 0 |
*in the case of the living room there is only a single occurrence of 23 oC set-point temperature within the 43 Pareto points.
Disclaimer/Publisher’s Note: The statements, opinions and data contained in all publications are solely those of the individual author(s) and contributor(s) and not of MDPI and/or the editor(s). MDPI and/or the editor(s) disclaim responsibility for any injury to people or property resulting from any ideas, methods, instructions or products referred to in the content. |
© 2024 by the authors. Licensee MDPI, Basel, Switzerland. This article is an open access article distributed under the terms and conditions of the Creative Commons Attribution (CC BY) license (http://creativecommons.org/licenses/by/4.0/).
Copyright: This open access article is published under a Creative Commons CC BY 4.0 license, which permit the free download, distribution, and reuse, provided that the author and preprint are cited in any reuse.


