Submitted:
11 December 2024
Posted:
13 December 2024
Read the latest preprint version here
Abstract
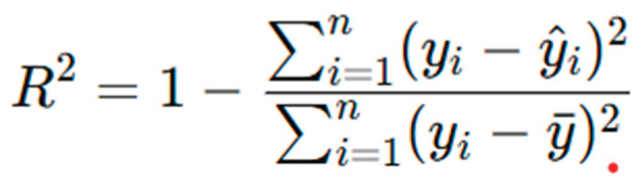
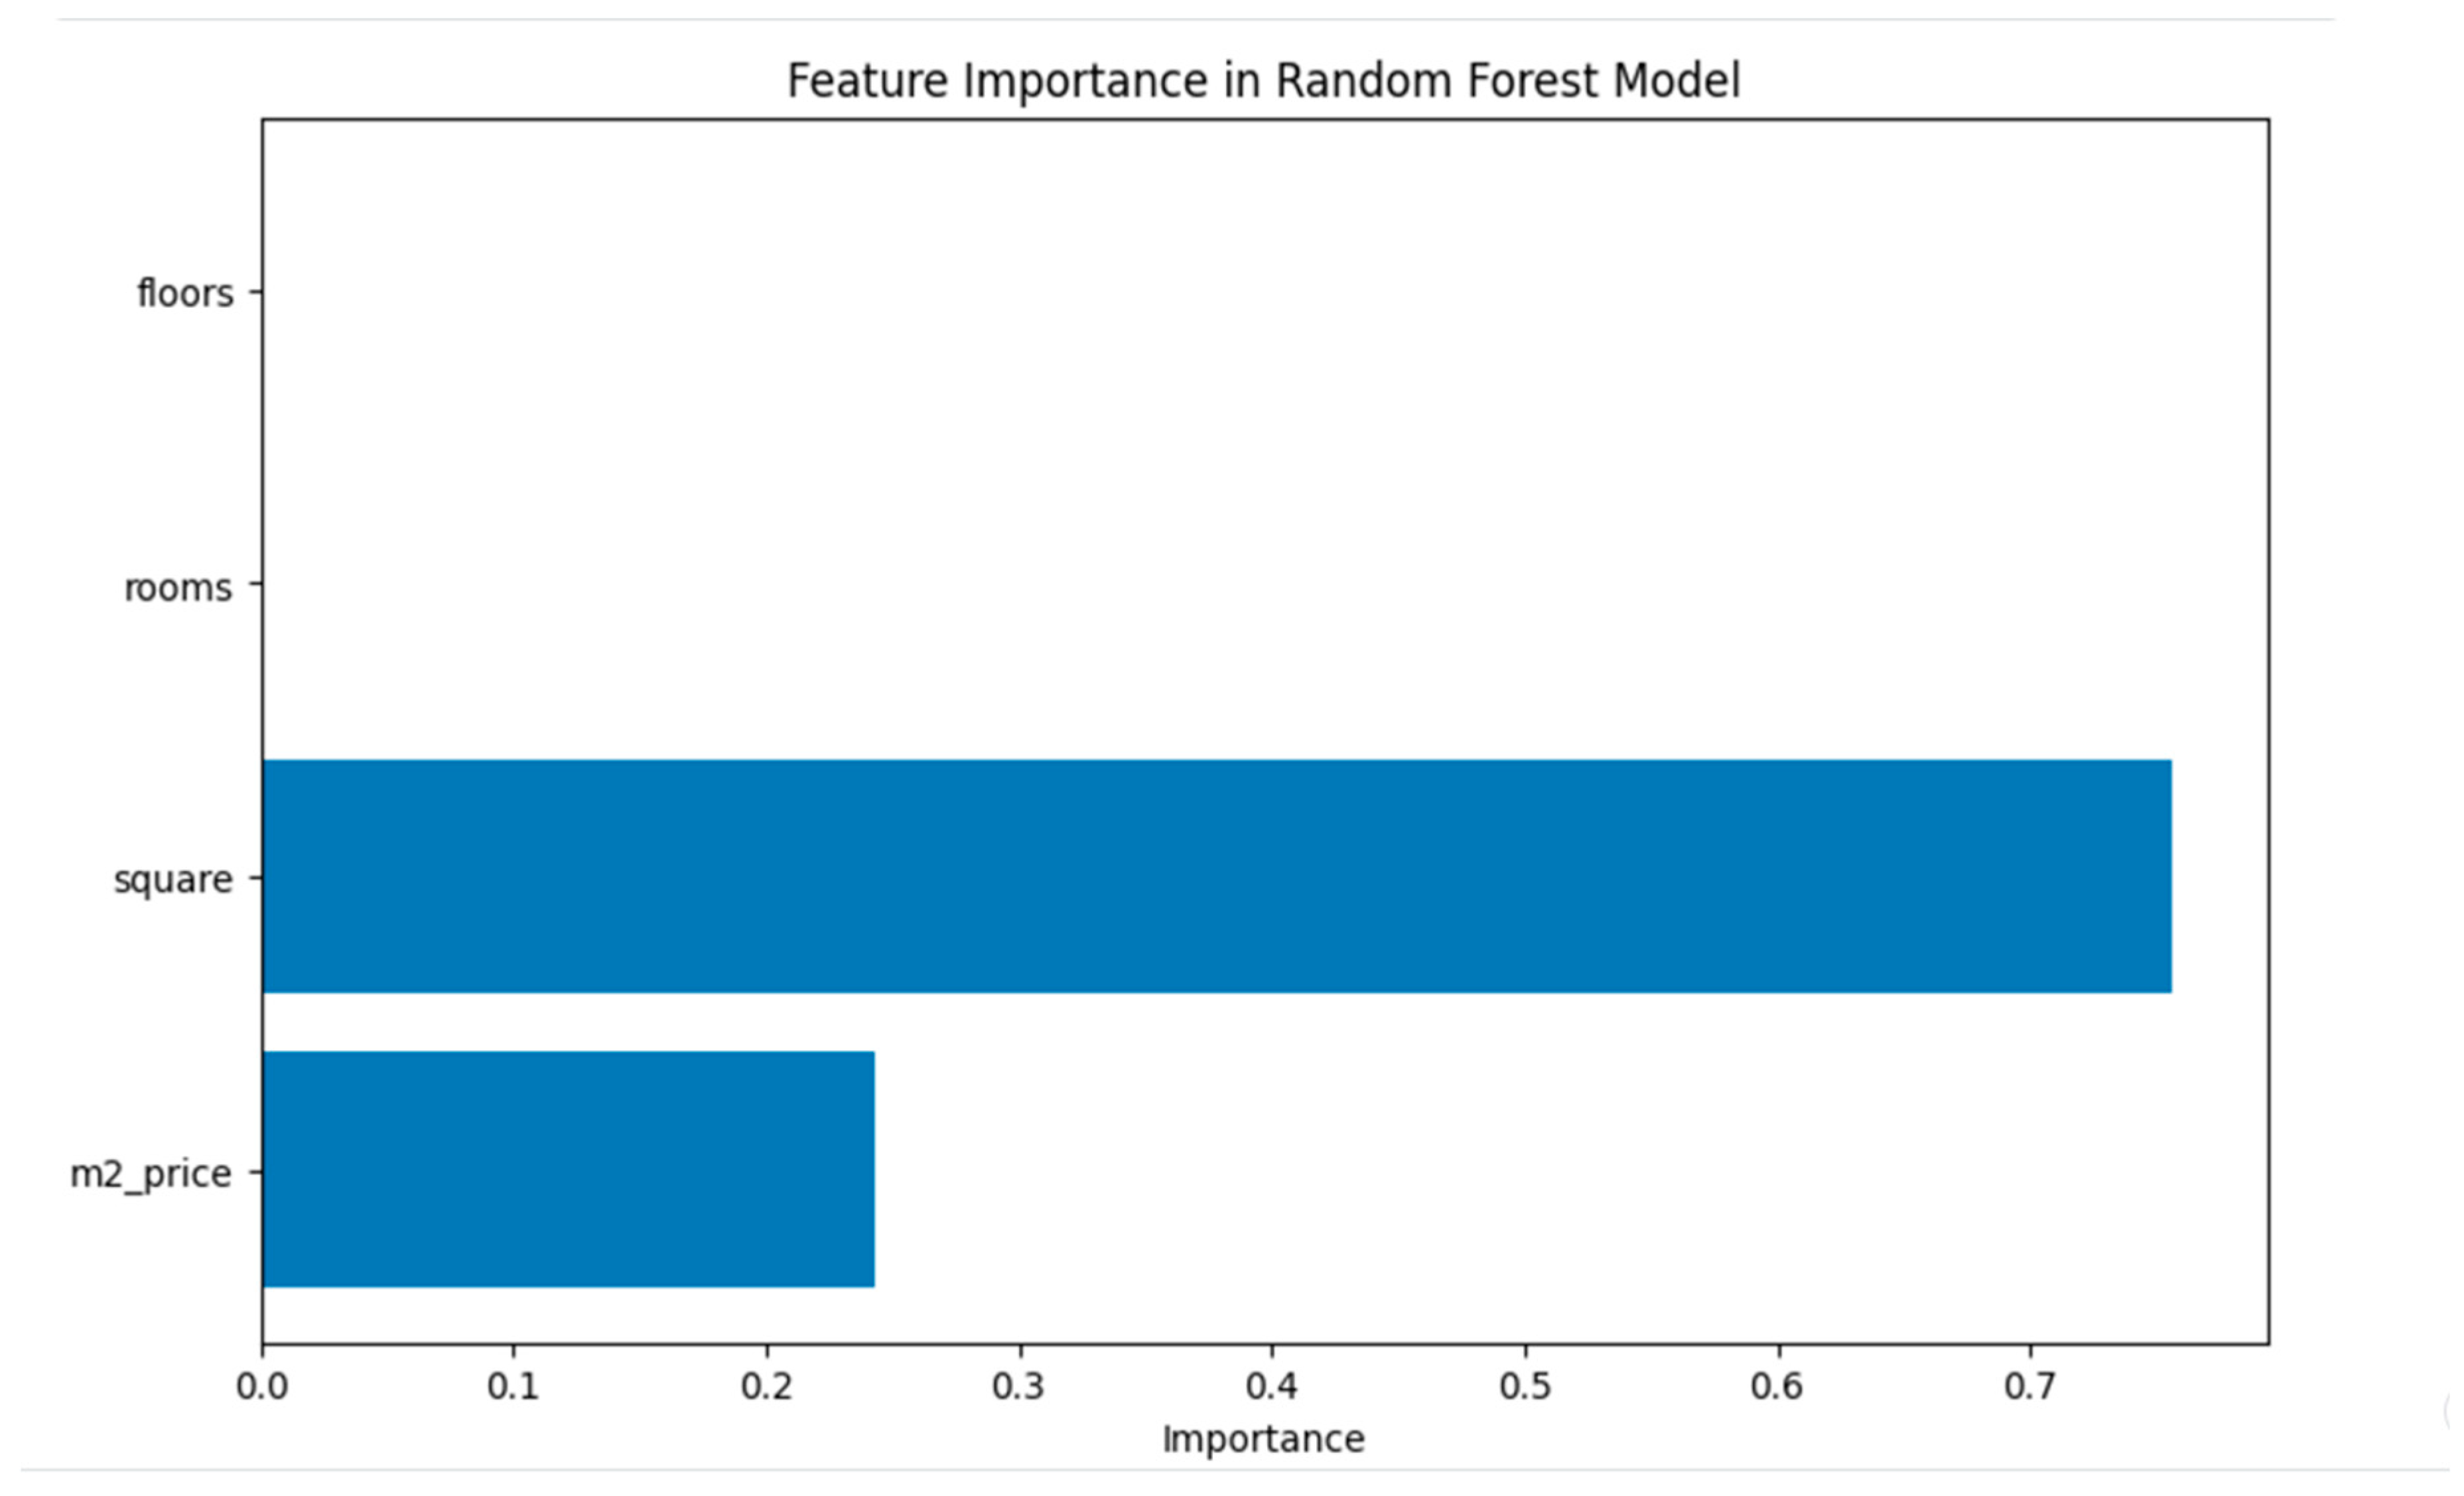
There are problems in the Kyrgyz real estate market, such as a shortage of available data and there are also limitations in the use of analytical tools.Due to these problems, investors, sellers and buyers find it difficult to make decisions when choosing and purchasing real estate.This study is aimed at analyzing and forecasting real estate prices using machine learning methods.One of the first real estate House Price Prediction analyzing in Kyrgyzstan.A set of real estate data was collected, cleaned and processed, cleaned and prepared, and then a model was built and trained.Using a machine learning method such as random forest regression, key factors influencing prices were identified: the size of the object, the price per square meter and the number of rooms.The random forest model demonstrated high accuracy of forecasts with a coefficient of determination R^2 = 99%.Regression is deeply investigated even nowadays, to the point of still being worth of consideration in top journals (Jaqaman & Danuser, 2006; Altman & Krzywinski, 2015; Krzywinski & Altman, 2015).What Is R-Squared? R-squared (R2) is defined as a number that tells you how well the independent variable(s) in a statistical model explains the variation in the dependent variable. It ranges from 0 to 1, where 1 indicates a perfect fit of the model to the data.Numeracy, Maths and Statistics - Academic Skills Kit This study shows how machine learning can help to better analyze the real estate market in countries such as Kyrgyzstan.
Keywords:
House Price Prediction
; Neural Networks
; Machine Learning
; Predictive Analytics
; Random Forest Regressor
What Is R-Squared?
R-squared (R2) is defined as a number that tells you how well the independent variable(s) in a statistical model explains the variation in the dependent variable. It ranges from 0 to 1, where 1 indicates a perfect fit of the model to the data.Numeracy, Maths and Statistics - Academic Skills Kit
This study shows how machine learning can help to better analyze the real estate market in countries such as Kyrgyzstan.
Introduction
The algorithm selects random variables and creates hundreds of trees..The real estate market plays a huge role in the economy of any country, as well as in Kyrgyzstan.Many developed countries have long used modern technologies such as machine learning to analyze the market and predict prices.
However, these technologies have only just begun to be implemented in Kyrgyzstan.
Forecasting real estate prices is an important task that helps people better understand the market and make informed decisions about buying a home or investing.
For example, if you know in advance how much a house or apartment will cost, you can more accurately plan your budget and organize housing. This is especially true for countries such as Kyrgyzstan, where there is insufficient information about the real estate market. In developed countries, such studies have been conducted for a long time and complex models are often created there to analyze many factors. However, in Kyrgyzstan, the situation is different: due to the smaller amount of data, simpler methods can be used that make it possible to interpret information and achieve changes much easier than, for example, in Turkey (Tekin, Mert & Uçal Sarı, İrem. (2022). Real Estate Market Price Prediction Model of Istanbul. Real Estate Management and Valuation. 30. 1-16. 10.2478/remav-2022-0025).
Machine learning models have produced good results in our work.It can be used in completely different fields, such as computer engineering, ecology or even medicine.For example, significant progress has been made in the field of morphological classification of galaxies using SpinalNet [11]. Artificial intelligence is also used to generate images using datasets and the Image-to-Image function [12], as mentioned earlier, machine learning methods are effectively used to predict ecological problems [13] or some diseases[14].
One of the most basic investment tools for Kyrgyz residents is real estate.The country has a very developed construction industry, which is why people buy housing not only for living, but also consider it a good investment.The valuation of the house might have a leading impact on the portfolio of the household (Case et al., 2004).This study examines the indicators of the Kyrgyz real estate market.
Why did I choose the Random Forest method?
I chose the random forest method for predicting real estate prices because it is simple, reliable and well suited for my research.
1.High precision.A random forest makes accurate predictions because it uses many small models.These models work together to take into account different things that affect the price, such as the size of the house, the cost per square meter and the condition of the property.
2.Working with incomplete data.There is often a lack of information in the real estate market. For example, ads may not contain the exact year of construction or details about the condition of the house. Random forest is able to work with such incomplete data and it does not affect accuracy.
3. It is well protected from errors, even if there is not much data. It does not attach too much to the training data and gives stable results, which is especially important for this analysis of real estate in Kyrgyzstan, given their lack.
Let's say you want to know how much a house will cost. The neural network studies all the data: the size of the house, location, condition, and even such small things as finishing materials. It finds the connection between these parameters and the price herself, and then makes an accurate forecast.Here we also showed Feature
The purpose of this study is to create a machine learning model for forecasting real estate prices in Kyrgyzstan. To do this, information was collected from available sources such as House kg Analytics of real estate prices by districts of Bishkek on the House. (n.d.). and Lalafo.kg Lalafo. (n.d.-a) , it was cleaned and prepared, and then a model was built.
The study examines the main factors influencing prices, such as area, year of construction, number of floors and condition of the house.
Literature Review
1. Nghiep and Al (2001)compared the performance of artificial neural networks and multiple regression analysis on single-family residential properties in Rutherford County, Tennessee. As a result, artificial neural networks performed better than multiple regression analyses on their data.
2.Annamoradnejad, Rahimberdi & Annamoradnejad, Issa. (2022). Machine Learning for Housing Price Prediction. 10.4018/978-1-7998-9220-5.ch163. This paper suggests proper ways to design steady and accurate models in relation to previous methods and approaches for predicting housing prices.
3.Vathana, D. & Patel, Rohan & Bargoti, Mohit. (2022). Real Estate Price Prediction Using Machine Learning Algorithm. 10.1007/978-981-19-0825-5_47.
This paper indicates importance of ML methods and their techniques.In this paper, various machine learning model is proposing for automatically prediction of house sale price.
4.Anand G. Rawool , Dattatray V. Rogye , Sainath G. Rane , Dr. Vinayak A. Bharadi "House Price Prediction Using Machine Learning" Iconic Research And Engineering Journals, 4(11).
5.In 2020, Ashutosh, Pranav, Deeksha, and Shreya completed a paper (Sharma et al.). Where they are using machine learning to build a system for forecasting and recommending House price prediction. Also, they are using linear regression as an algorithm to predict house prices.
6. Similarly, Ben Jabeur et al. (2020) applied a combination of ML models such as LightGBM, CatBoost, XGBoost, and Random Forest to predict oil prices during the COVID-19 pandemic. These approaches have demonstrated the effectiveness of ML techniques in forecasting and understanding economic variables.
Data Collection and Methods
Our focus is on machine learning tehniques.Here is an overview of the data collection process.
Data Collection
In order for the data to be suitable for analysis, we did the cleaning and visualization in advance.
| Price | The price of the house indicated by the seller. |
| Square footage (m²): | The total area of the property in square meters. |
| Price per square meter (m²_price): | The cost of one square meter of real estate. |
| Number of rooms | The total number of rooms. |
| Number of floors: | The number of floors in the building. |
| Location | Geographical data, such as a neighborhood or neighborhood. |
How feature importance affects the price is clearly shown on the bar chart:
Removing Duplicates and Missing, Textual Values:
Some columns contained duplicate objects or missing values. To fix this, we either filled in the gaps with average values, or used the lowest possible values when it was logically justified (for example, for the number of rooms).
Converting text data to numeric data:
Some columns, such as the number of rooms, had text descriptions (for example, "6 or more"). We have converted them to numeric values to simplify further analysis.
We have left only those signs that are related to the price of real estate.The area of the house, the floor, the price per square meter and the total number of rooms.
Model training:
| Parameters | Sum | Description |
| n_estimators | 100 | Number of trees in the forest |
| max_depth | 10 | Maximum depth of each tree to avoid overfitting. |
| min_samples_split | 10 | Minimum number of samples required to split an internal node. |
| min_samples_leaf | 5 | Minimum number of samples that a leaf node must have. |
Data splitting
To build a model which can predict well on unseen data, we do the following to the original dataset.
| Training set: | We used to let model "learn" the relationships between the characteristics |
| Test set: | Used to check how well the model can predict on data it has never seen |
Why do we have to split the data?
If a model is trained on only one dataset and then tested on the same data, it can overfit and show very good results on the training data. But otherwise, it will perform worse on new data with another columns.Because of the presence of noise, the limited size of training set, and the complexity of classifiers, overfitting happens[16].To avoid overfitting, we have separated the data.
The train_test_split method is an important part of the machine learning model-building process because it helps avoid overfitting and tests the model's ability to work with data it has not seen before.
Accuracy score
After training, we tested the model on data that it had not seen before to make sure it is effective.Coefficient of determination is an indicator of how well the model explains the data.In our case, the model revealed an accuracy of 99%.
Cross-validation
The focus is on k-fold cross-validation and its variants, including stratified cross validation, repeated cross-validation, nested cross-validation, and leave-one-out cross-validation.Berrar, D. (2019). Cross-validation.
To prevent overfitting, we used cross-validation with 5 folds.
Step 1: Divide the dataset into 5 equally sized parts.Each fold contains approximately 20% of the data.
Step 2: Train the model on 4 of these folds (80% of the data).
Step 3: Repeat this process 5 times, with each fold serving as the test set once.
Step 4: After all 5 iterations, R² are averaged to provide a more reliable estimate of the model's overall performance.
This will help to check the model and make sure it is stable.
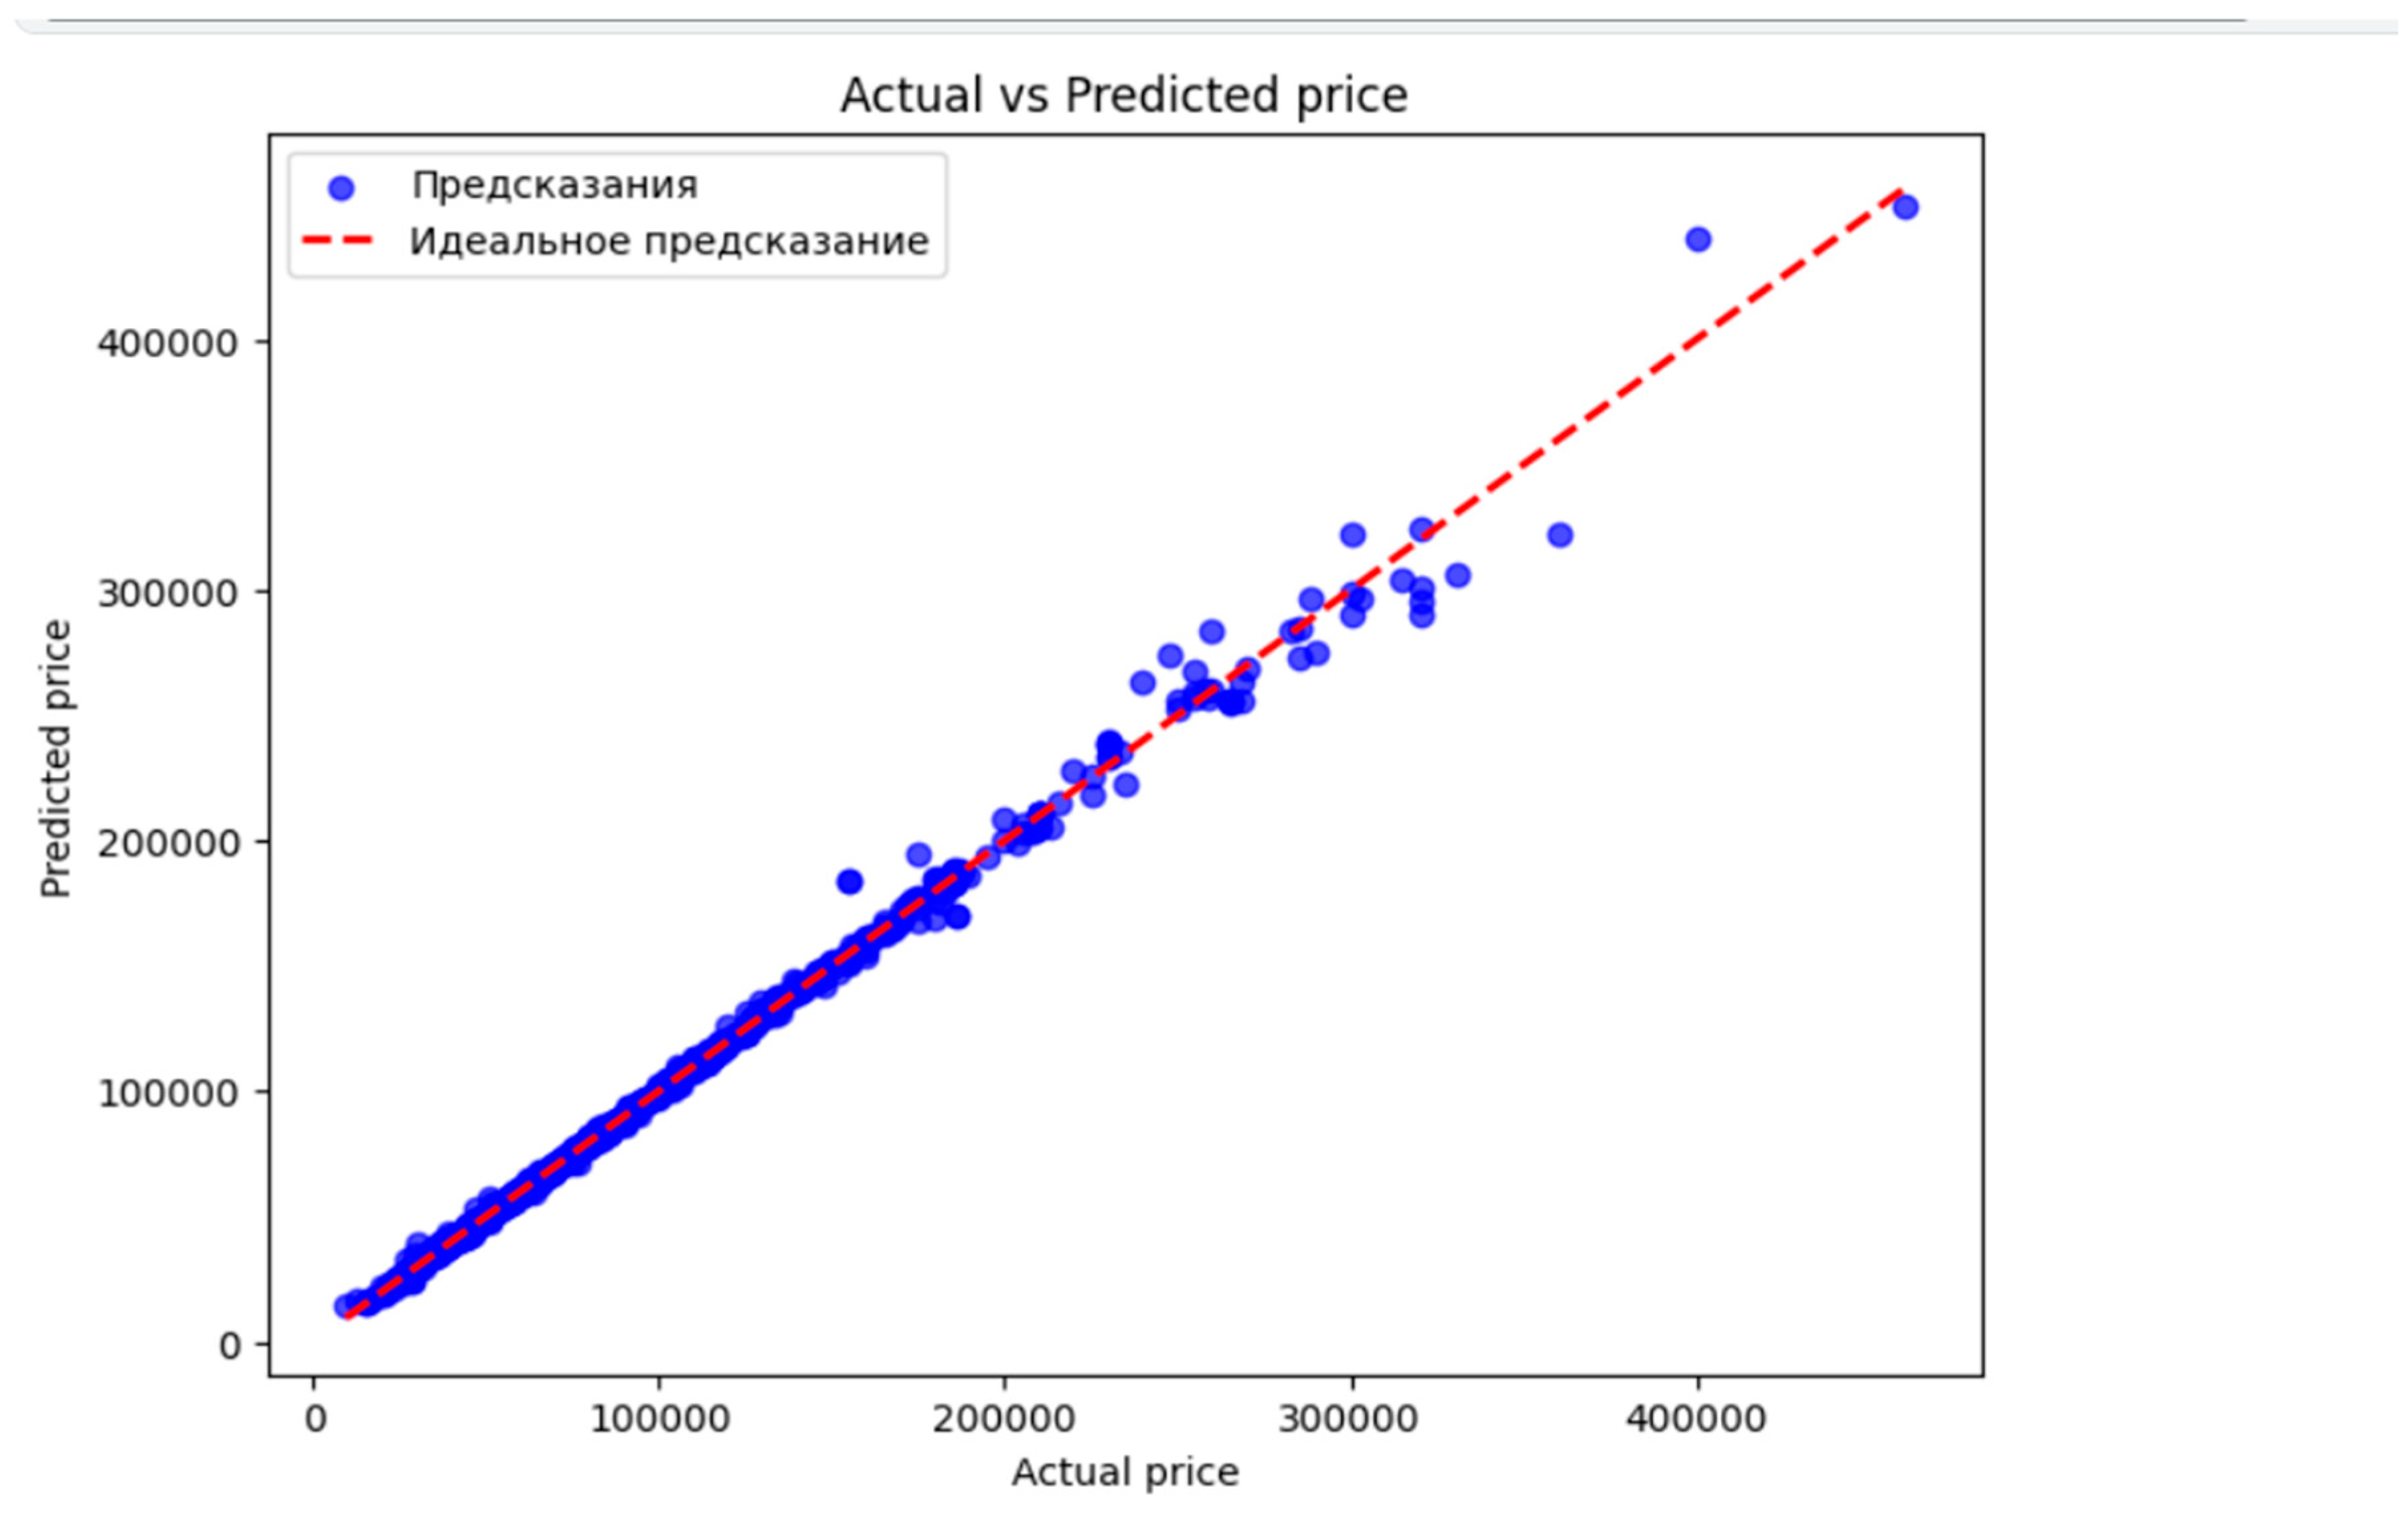
And also,was created a scatter plot to show how model works on Actual vs Predicted prices:
Cross-validation
Keywords:
House Price Prediction,Neural Networks,Machine Learning,Predictive Analytics,Random Forest Regressor.
UDC Classification:332.6,004.8
Result
The Random Forest Regressor model showed high accuracy in predicting real estate prices in Kyrgyzstan.
As a result of this study,with training a model using Random Forest Regression we got good result of MAE and R2
1.The R² score on the training set was 0.9968, while on the test set, it was 0.9961
2.The Mean Absolute Error (MAE) on the training set was 503.15, and on the test set, it was 635.40.
In conclusion,the model showed excellent results and predicted accurate and reliable prices.
References
- Nguyen, N.; Cripps, A. Predicting Housing Value: A Comparison of Multiple Regression Analysis and Artificial Neural Networks. Journal of Real Estate Research. 2001, 22, 313–336. [Google Scholar] [CrossRef]
- Selim, H. Determinants of house prices in Turkey: Hedonic regression vs. artificial neural network. Expert Systems with Applications 2009, 36(2), 2843–2852. [Google Scholar] [CrossRef]
- Kavitha, V.; Punithavalli, M.; Lalithamani, N. Analyzing the use of data mining techniques for predicting house prices. International Journal of Computer Applications 2010, 13(3), 15–19. [Google Scholar]
- Mohd, T.; Jamil, N. S.; Johari, N.; Abdullah, L.; Masrom, S. n.d.; An Overview of Real Estate Modelling Techniques for House Price Prediction; Springer eBooks.
- Borde, S.; Rane, A.; Shende, G.; Shetty, S. Real Estate Investment Advising Using Machine Learning; [Publisher or Source if available]; 2017. [Google Scholar]
- Abigail Bola Adetunji, Oluwatobi Noah Akande, Funmilola Alaba Ajala, Ololade Oyewo, Yetunde Faith Akande, Gbenle Oluwadara, House Price Prediction using Random Forest Machine Learning Technique.
- Partners, P. How to do Real Estate Market Analysis Like a Pro; Proven Partners, 18 October 2024. [Google Scholar]
- Tekin, M.; Sari, I.U. Real Estate Market Price Prediction Model of Istanbul. Real Estate Management and Valuation 2022, 30, 1–16. [Google Scholar] [CrossRef]
- Truong, Q.; Nguyen, M.; Dang, H.; Mei, B.; Truong, Q.; Nguyen, M.; Dang, H.; Mei, B. Housing Price Prediction via Improved Machine Learning Techniques. Procedia Computer Science 2020, 174, 433–442. [Google Scholar] [CrossRef]
- Agha, K.; Alzoubi, H. M.; Alshurideh, M. T. Measuring reliability and validity instruments of technologically driven cognitive intrusion towards work-life balance. In The International Conference on Artificial Intelligence and Computer Vision; Springer, 2021; pp. 601–614. [Google Scholar]
- Shaiakhmetov, D.; Mekuria, R. R.; Isaev, R.; Unsal, F. Unsal, "Morphological Classification of Galaxies Using SpinalNet. In 2021 16th International Conference on Electronics Computer and Computation (ICECCO); Kaskelen, Kazakhstan, 2021. [Google Scholar]
- Toktosunova, Akbiike, Ergeshov. Developing an Artificial Intelligence Tool for Image Generation Using a Unique Dataset with Image-to-Image Functionality, 2024.
- Jaqaman, K.; Danuser, G. Linking data to models: data regression. Nat Rev Mol Cell Biol 2006, 7, 813–819. [Google Scholar] [CrossRef] [PubMed]
- Ying, X. An overview of overfitting and its solutions. In Journal of physics: Conference series; p. 022022, IOP Publishing, February 2019; Vol. 1168. [Google Scholar]
- Berrar, D. Cross-validation, 2019.
- Sadriddin, Z.; Mekuria, R. R.; Gaso, M. S. Machine Learning Models for Advanced Air Quality Prediction. In Proceedings of the International Conference on Computer Systems and Technologies 2024; June 2024; pp. 51–56. [Google Scholar]
- Gaso, M. S.; Mekuria, R. R.; Khan, A.; Gulbarga, M. I.; Tologonov, I.; Sadriddin, Z. Utilizing Machine and Deep Learning Techniques for Predicting Re-admission Cases in Diabetes Patients. In Proceedings of the International Conference on Computer Systems and Technologies 2024; June 2024; pp. 76–81. [Google Scholar]
Disclaimer/Publisher’s Note: The statements, opinions and data contained in all publications are solely those of the individual author(s) and contributor(s) and not of MDPI and/or the editor(s). MDPI and/or the editor(s) disclaim responsibility for any injury to people or property resulting from any ideas, methods, instructions or products referred to in the content. |
© 2024 by the authors. Licensee MDPI, Basel, Switzerland. This article is an open access article distributed under the terms and conditions of the Creative Commons Attribution (CC BY) license (http://creativecommons.org/licenses/by/4.0/).
Copyright: This open access article is published under a Creative Commons CC BY 4.0 license, which permit the free download, distribution, and reuse, provided that the author and preprint are cited in any reuse.


