Submitted:
03 April 2024
Posted:
04 April 2024
You are already at the latest version
Abstract
The development of reliable predictive algorithm for house price as the housing market is a stand-out among the most involved regarding valuing the price and continues to fluctuate, is constantly a need for socio-economic advancement and welfare of citizen. In this paper, we develop machine learning algorithms for forecasting UK housing Price, and find an optimal algorithm that forecasts housing price accurately on the premises of the presence of many features or covariates. After applying correlation analysis to remove correlated variables in order to avoid multicollinearity, thereby increasing the statistical power, a novel method of using regression analysis to first of all understand and select statistically significant features for the various regions in England based on North South divide is adopted. These features are then used in the machine learning algorithm to further increase the statistical power of the algorithm, increase the level of accuracy for each of them and ultimately increase the predictive values for the algorithms.
The model construction involves 3 stages: 1- correlation analysis to identify and remove correlated variables thereby avoiding multicollinearity and increasing the statistical power of the linear regression, 2 - using linear regression to determine variables that are statistically significant and 3 - building the machine learning algorithms based on the variables that are statistically significant from the linear regression. A comprehensive dataset of UK Paid housing Price from 2010 to 2019 was linked to a number of other datasets to generate a total 21 variables or features used for the models. Catboost, Gradient Boosting, Bagging, Random Forest, Extra Tree all achieved the excellent models performance result in all the regions considered. The comparison of the seven models showed that Extra Tree algorithm consistently achieved the best performance in term of level of accuracy in all the regions. K-Nearest Neighbours (KNN) is the only algorithm with less than 50% level of accuracy. Noticeably, the regions considered had varying or differing insignificant variables, implying that although many variables are common (statistically significant) to all the regions, there are regional differences and impact when modelling or predicting housing prices. This study validates the practicability of developing a machine learning methodology for the prediction of housing price. This research offers a reference for future house price prediction based on machine learning.
Keywords:
House pricing
; Catboost
; Gradient Boosting
; Bagging
; Random Forest
; Extra Tree
; KNN
; ANN
; UK paid housing price
1. Introduction
The prediction of housing prices for a given period of time is a challenge to the various stakeholders within the real estate sector. The various stakeholders include prospective home owners, property mortgage lenders, evaluators, real estate agents, property advisors and developers, fund administrators and financiers, decision makers to name a few. Hence, the stakeholders that include participants, consumers and sellers are certainly interested in knowing and understanding the factors, features and attributes that could likely affect the housing price. This project aims to provide answer to the question of the variables, features or attributes that that are likely to affect housing prices in England.
Inferring from past review of literatures, no agreement has been reached on the particular machine learning algorithm or algorithms are the best or most appropriate for forecasting housing prices. Although, there some level of agreement that typical linear methodologies performance inferiorly when compared to machine learning models. On the basis of this reason, this research is proposing these two aims. The first aim or objective is to use linear regression to identify possible variables or features that are statistically significant that are to be taken as features for the proposed machine learning algorithms to be used in this study. The second objective is the identification of the best performing machine learning model in the prediction of housing prices.
It is also imperative that the developing a housing price estimation algorithm would momentously help in the extrapolation of housing prices in the future as well as in the formation of housing policies. This study uses machine learning algorithms as a research methodology to develop a housing price prediction model and attempts to understand if there is regional (or other geodemographic variable) variation or influence in house price. More precisely, this research work aims to provide answers to these questions:
- What are the dynamics (features affecting) of housing price in the UK? Are these dynamics same by geographies (regions within England)?
- Is it possible to use machine learning algorithms as a research methodology to develop a housing price prediction model?
“Machine learning is required to make the computers sophisticatedly perform the task without any intervention of human beings on the basis of learning and constantly increasing experience to understand the problem complexity and need for adaptability ”[1] Machine learning algorithms use computational techniques to “learn” information from data without depending on a pre-specified statistical equation or model [2]. The algorithms adaptively increase their performance as the number of trials available for learning increases [3]. There is an unmatched surge of concentration in the subject matter of machine learning as a result accessibility of big data from many sources coupled with the development in algorithms and exponential increase in computing capability [3]. Also, they state that machine learning algorithms for regression, clustering and classification are currently successfully applied and deployed on daily basis.
This paper will attempt to apply seven of the modern machine learning algorithms comparing their efficiency in the prediction of house prices choosing four regions from the South – North divide of England. Also, we shall attempt to determine correlated variables using correlation analysis in order to avoid “Multicollinearity” which diminishes the accuracy of the projected coefficients that deteriorates the statistical power of the regression algorithm. Lastly, this research is developed an innovative approach, the first of its kind, to first of all use regression analysis to select the features or variables that are statistically significant and then take forward these variables to the seven algorithms.
The remaining part of this article is organised as follows. The literature review is in Section II. Section III contain the methodology of the machine learning algorithm applied in the article. In Section IV is the Results and Observations. Discussion and Conclusion in Section V and Finally, References in Section VI.
2. Literature Review
Housing market is being revolutionised through the provision of accessible land date online. He also postulates that with big data concepts, machine learning algorithms, machine data visualisation tools and software, homeowners will have access to an unprecedented level of property data, as estate agents seek to partner with online services [4]. In this research, various machine algorithms will be explored to assert this hypothesis. Instead of exhausting themselves trying to navigate the research needed for buying land, developers are now able to access all the information they need in one user-friendly place. The data-driven maps these companies produce not only save their clients time, but also remove the burden of data sharing from local authorities, which previously had to offer these services.
A complete outline for categorising and estimating household choices for school and neighbourhood characteristics was developed in the past [5]. It embeds a border discontinuity strategy in a diverse model of housing selection to solve the endogeneity of school and neighbourhood characteristics. The model is assessed by means of controlled access Census data from a great municipal area, producing some new outcomes. Households are ready to pay lower than 1% more in housing prices, significantly less than preceding estimates, when there is 5% increase in the local school average performance. There is a relationship between a variation in house prices and the result of Ofsted. This relationship states house owners in wealthy areas get an overnight windfall when a nearby school is given an improved Ofsted rating [6].
Machine learning, classification and predictive analytics are believed to be lacking behind in real estate and foresees a more progressive prediction within the domain in the future is anticipated [7]. I am in total agreement with the researcher as a result of the recent improvements in the studies of big data, structured and unstructured data, supervised and unsupervised learning and machine algorithms. Also, I firmly believe such questions as ‘What will the multi-family housing market be 5 or 10 years from now? How should I invest today if I want such returns in 5 years?’ will easily be answered in the future. I intend to work in these directions in this current study. This study will also be looking at the big pictures or perspectives, in agreement with the researcher’s belief of the ability and capability of machine learning to produce extensive time duration and greater granularity of the forecasts.
Using Machine Learning models to develop predictive model for house dataset in Iowa from 2006 and 2010, it was discovered that the highest level of accuracy of 84.6% and the lowest of 60.3% were gotten from decision tree and Lasso models respectively. Also, decision tree had the least RMSE (best) value of 217, while Lasso (worst) had the highest value of 34245 [8]. Using Light GBM, Random Forest, XGBoost, Hybrid Regression and Stacked Generalisation algorithms and recognised which of these models is best for forecasting housing prices based UK Price Paid Data and other linked dataset. They concluded that that the covered introduction of new variety of features, such as rail stations, supermarkets and bus stops would lead to performance improvement of 50% in the models [9]. Using four machine learning algorithms: kriging, inverse distance weighting, random forests and neural networks to analyse housing data from Seoul in South Korea. They concluded that random forests and neural networks provided better estimation and prediction than the kriging, inverse distance weighting method with random forest performing relatively better than the neural networks [10]. Multi-variate regression models were used to analyse 112 provincial capitals of Italy dataset determine if immigration within the regional divide in the housing dataset is correlated. They concluded that larger immigrant populations correlate with precipitous house price slopes on a nation-wide scale. Also, they concluded this correlation differs for different geographies (urban) [11].
Although, the researchers used same machine learning algorithms, there is no consensus on the best machine learning algorithms for housing prices prediction. Also, an attempt has never been made to first to all identify potentially statistically significant variables or features before applying them to selected machine learning algorithms. Furthermore, the use of regression analysis to establish the varying house price dynamics (features) between the regions of the North South divide of England has never been applied.
3. Methods and Data
The aim of this research is to employ machine learning techniques and machine learning to forecast housing price. The methodology adopted for this research work is as follow: 1) data collection, 2) data processing, 3) One way analysis: this include correlation analysis to identify and remove correlated variables thereby avoiding multicollinearity and increasing the statistical power of the linear regression and using linear regression to determine variables that are statistically significant; and 4) Building the machine learning algorithms on the basis of the variables that are statistically significant from the linear regression. These stages or processes are clearly depicted in Figure 1 below.
Figure 1 shows the summarised methodology or approach adopted in this research. It shows the summarised step by step visualisation of the methodology of the research.
3.1. Data Collection
All the datasets to be used for this project are secondary datasets.
UK House Price Paid (PPD) for Wales and England from January 1995 to August 2019:The UK House Price Paid Data is a record of house sales in Wales and England that are submitted for registration to HM Land Registry. It contains raw data on a monthly basis and is the main dataset for this research work.
Regional Gross Disposable Household Income (GDHI): This dataset contains information on the disposable income of households in the UK from 1997 to 2015. It covers the amount of money that individuals have available for saving or spending after taxes, including national insurance deductions. The data is broken down by local areas, regions, and sub-regions. The Office of National Statistics (ONS) is the source of this dataset.
List of Output Areas in England and Wales: This dataset includes all output areas in England and Wales, and is required for linking and analysis.
List of Regions in England and Wales: This dataset covers all regions in England and Wales and is sourced from the Office of National Statistics (ONS) for analytical and linkage purposes.
Table 1 gives the various data sets available for this research work, together with their sources and geographic hierarchy.
Table 2 shows the variables or features available in all the combined datasets that are available for selection.
3.2. Data Linkage
To access the required data sets, the first step was to download them into Excel worksheets, starting with the yearly UK house Paid Data for England and Wales. A Python programming code was developed to perform the following tasks: Import all the yearly UK house Paid Data for England and Wales Excel worksheets from 2010 to 2019 and combine them to form one dataset. All the observations without postcodes and prices were removed from the UK house Paid Data for England and Wales dataset. All other listed data sets in worksheet format were imported into SAS data set format. The Output Area for England and Wales dataset was merged with the Regional dataset for England and Wales by a common geographical variable OA11CD (Output Area). The new combined dataset of both the Output area and Regional variables of England and Wales was merged with regional gross disposable household income by a common regional variable. Finally, this merged dataset was merged with the UK house price dataset by a common postcode variable to form a massive data set. This dataset was used for descriptive statistics, data visualization, and machine learning analysis. Date cleansing was employed to remove records without a house price.
3.3. Data Cleansing
The process of accessing the data sets from their source locations involved downloading them into Excel worksheets. This began with the yearly UK house Paid Data for England and Wales. A Python programming code was then created to perform the following tasks: importing all the yearly UK house Paid Data for England and Wales Excel worksheets from 2010 to 2019 to form a single dataset, deleting all observations without postcodes and price from the UK house Paid Data for England and Wales dataset, importing all other listed data sets in worksheet format into SAS data set format, linking/merging the Output Area for England and Wales dataset with the Regional dataset for England and Wales using a common variable or geographic variable OA11CD (Output Area), merging/combining the new data set of both the Output area and Regional variables of England and Wales with regional gross disposable household income using a common regional variable, and finally, linking/merging this merged data set with the UK house paid price data set by a common postcode variable to create one massive data set for use in descriptive statistics, data visualization, and analysis.
3.4. Determination of Variables or Features
In statistical analysis, the price variable is considered the dependent variable. The other variables are independent variables. A correlation analysis was conducted to identify correlated variables and determine which variables to drop. Regression analysis was also performed to determine which variables are statistically significant and should be used in the machine learning algorithm.
3.5. Data Visualization
The study used histograms to show the frequency distribution of the features of each region, and heat maps to display the correlation analysis of the features for all regions. Histograms were used to represent continuous or interval data, where the data values were grouped into intervals or bins. Heat maps are graphical representations of data where values in a matrix are represented as colours. Typically, heat maps are used to visualize data in two dimensions.
3.6. Correlational Analysis
In order to avoid multicollinearity amongst the features to be used and ultimately increase the predictive power of the linear regression and machine learning algorithms applied, correlation analysis was performed. The correction (heatmaps) graphs for each the four chosen regions are shown in Figure 2, Figure 3, Figure 4 and Figure 5.
Figure 2 is the heatmap shows features having correlated values from .50 (50%) in the South East of England region. On the basis of these correlated values as displayed in this figure, the following variables or features were removed:
- Households, as it has a high correlation with Population.
- Postcode_Area, as it is highly correlated with Postcode.
- Price per Square Area, as it is highly correlated with Price (the dependent variable).
- Number of rooms, as it has a high correlation with Total Floor area.
- Latitude and Longitude, as they are correlated with Postcode.
- Average Income, as it is correlated with Postcode, Index of Multiple Deprivation, and Postcode Area.
- Average Distance Field, as it is correlated with Average Distance Park.
In Figure 3, we can observe the heatmap that shows the correlation between different features in the Yorkshire region. The features having a correlation value of 50% or more were analyzed, and following variables were dropped based on the heatmap analysis:
- -
- Households: As it is highly correlated with Population.
- -
- Postcode_Area: As it is highly correlated with Postcode.
- -
- Index Of Multiple Deprivation: As it is highly correlated with Average Income.
- -
- Price per square area: As it is highly correlated with Price (the dependent variable).
- -
- Number of rooms: As it is highly correlated with Total Floor area.
- -
- Latitude and Longitude: As they are correlated with Postcode.
In Figure 4, a heatmap is presented which displays the correlation between different variables in the London region. Any features having a correlation value of 50% or higher are shown on the heatmap. Based on this figure, the following variables have been dropped due to high correlation with other features:
- -
- Household, due to high correlation with Population
- -
- Postcode_Area, due to high correlation with Postcode
- -
- Index Of Multiple Deprivation, due to high correlation with Average Income
- -
- Price per square area, due to high correlation with Price (which is the dependent variable)
- -
- Number of rooms, due to high correlation with Total Floor area
- -
- Latitude and Longitude, due to their correlation with Postcode.
In Figure 5, a heatmap displays features that have correlated values of at least 50% in the London region. Based on this, the following variables or features were dropped:
- -
- Households, due to its high correlation with Population.
- -
- Postcode_Area, due to its high correlation with Postcode.
- -
- Price per square area, due to its high correlation with Price, which is the dependent variable.
- -
- Number of rooms, due to its high correlation with Total Floor area.
- -
- Latitude and Longitude, as they are correlated with Postcode.
- -
- LSOA, as it was correlated with Postcode.
- -
- Average Distance Field, due to its correlation with Average Distance Parks.
Apart from this correlation analysis, preliminary graphs of these risk factors or features. Below are some of these graphs:
Figure 3.
1: The Frequency Distribution of the features: North East of England.
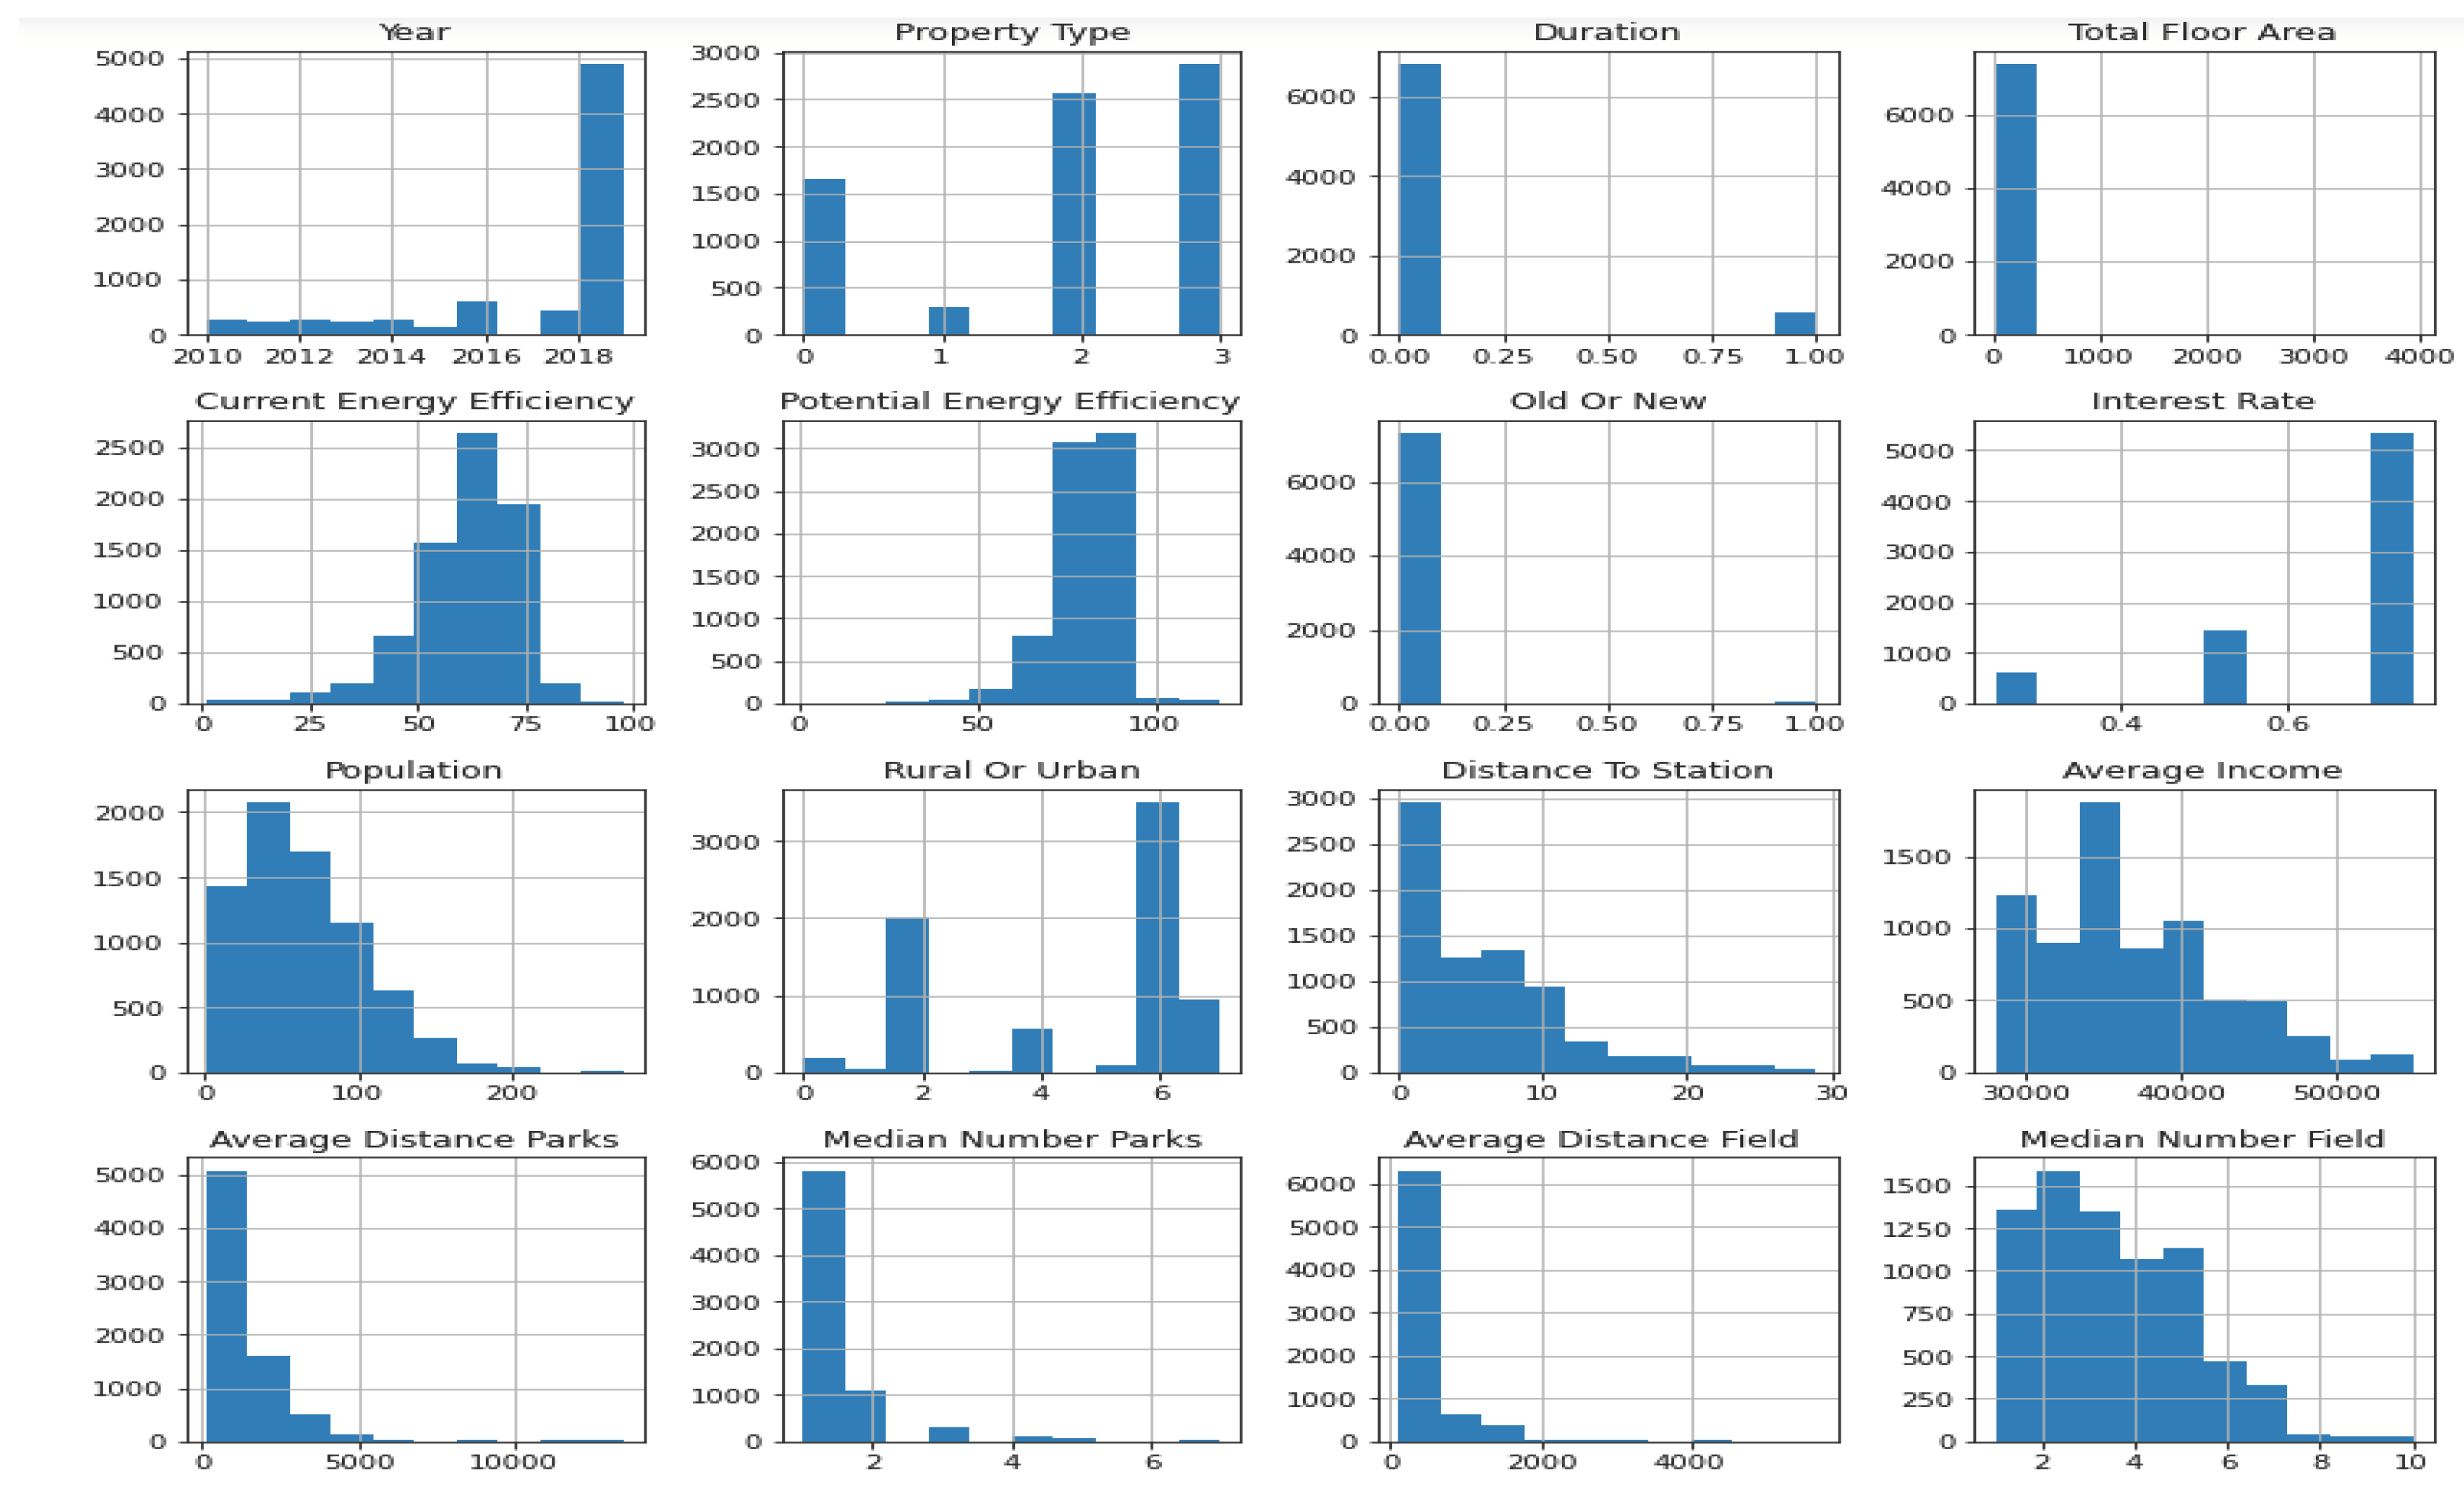
Figure 6,Figure 7,Figure 8, Figure 9 are the histograms of frequency Distribution of the features for North East of England, Yorkshire, South East of England and London respectively. Funnily enough, each of the feature for each region as shown above have similar shape with differences not particularly noticeable.
3.7. Linear Regression
Multiple linear regression model was used to identify statistically significant variables for each region. Variables that did not meet the statistical significance criteria were removed, and a second regression model was performed to ensure that all variables included in the machine learning models were statistically significant.
The R-squared value for the multiple linear model was found to be very high, indicating that this model is an excellent fit for identifying significant variables that should be included in the machine learning model. The results are shown in Table 3.
3.8. Machine Learning Algorithms
Following are the Seven Machine learning algorithms were used in this study.
3.8.1. K-NEAREST NEIGHBOUR (KNN)
The K-Nearest Neighbour (KNN) algorithm was first introduced by Fix and Hodges and has since been widely used in non-parametric density and regression approximation and discrimination [12,13,14]. KNN is an algorithm that categorizes data values or points based on the values or points that are most similar to them [15]. It uses test data points to make an "educated guess" about how an uncategorized point should be categorized. KNN does not actually learn anything; it simply classifies objects based on input variables' similarity. The K value represents the sum of the nearest neighbours [15], and the distance between the test point and the label points trained needs to be calculated.
KNN is a non-parametric model and is an example of lazy learning [15, 16]. This means that it makes no rules or assumptions and that the model is based solely on the dataset given to it, rather than assuming its distribution [15]. Lazy learning also means that the model makes no generalizations and requires little training [13,14,15]. As a result, all of the training data is used in testing when using KNN. The advantages of KNN include its ease of use, fast calculation time, and its ability to handle multi-label classes. However, the disadvantages of KNN include its laziness and computational expense, as well as its inability to perform well for skewed data and data with outliers.
3.8.2. Gradient Boosting
The main concept of this algorithm is to leverage the patterns or trends in "residuals" repeatedly, in order to create a model with strong predictions and improve it. This is done by using gradient descent methodology to minimize loss when adding new algorithms. To prevent overfitting, modelling is stopped when there are no longer any trends or patterns in the residuals that can be modelled.
The first step is to model the data using simple models and analyse the data for errors. The errors indicate problematic dataset points or observations that cannot be easily modelled with a simple model. At this stage, modelling is focused on the hard or problematic data in order to ensure it is modelled correctly. Finally, all the predictors are combined by assigning weight to each predictor.
The major advantage of gradient boosting is that it builds trees one at a time, correcting mistakes made by previous trained trees with subsequent trees. With each additional tree, the gradient boosting model becomes more expressive and has more hyperparameters to tune, making it perform better than a random forest. However, it is susceptible to overfitting, and the gradient boosting models are tougher to get accurately. Training with gradient boosting generally takes longer because trees are built sequentially [17,18].
3.8.3. XGBoost Modelling
XGBoost, also known as Extreme Gradient Boosting, is a popular machine learning library that uses gradient-boosted decision trees. It is used for both classification and regression, as well as ranking problems. The library offers advanced tree boosting, which combines multiple decision trees to improve prediction accuracy. XGBoost is known for its high level of accuracy and precision, making it a good choice for problems requiring such qualities. It can be used for various machine learning problems, including regression, ranking, and classification, and is compatible with multiple programming languages like R and Python [20,21].
3.8.4. Random Forest
A Random Forest is an ensemble model that grows multiple trees and classifies objects based on the "votes" of all the trees. This means that an object is assigned to a class that has the most votes from all the trees. This technique helps alleviate the problem of high bias, or overfitting. The random forest classifier is a meta estimator that fits many decision trees on several subsamples of datasets. It uses averaging to improve the forecasting precision of the algorithm and regulates overfitting. The subsample magnitude is normally similar to the initial input sample magnitude, using sampling with replacement.
The random forest classifier has a number of advantages. It is able to handle large datasets with high dimensionality, output Importance of Variable, and useful to explore the data. Additionally, it can handle missing data while upholding precision. However, the random forest classifier also has some disadvantages. It can be like a black box, meaning that users have little control over what the model does [17,18].
3.8.5. Extra Tree
The ExtraTrees model is a type of ensemble machine learning algorithm that is believed to be faster than Random Forest, while having an equal level of accuracy. Extra Trees are considerably faster, almost three times faster than the random forest method, at least in the Scikit-learn implementation [20]. This algorithm is implemented by creating a large number of unpruned decision trees from the training dataset [22]. When using Extra Trees for classification, prediction is done using majority voting, while for regression cases, prediction is done by finding the average of the decision trees. Extra Trees are also known as extremely randomised trees, and like random forests, they generate numerous decision trees. However, Extra Trees use random sampling without replacement for each tree to create unique samples for each tree. There are two main differences between Extra Trees and other tree-based ensemble algorithms: (1) the nodes are split by randomly choosing cut points, and (2) this algorithm utilises all the learning data to grow the trees.
3.8.6. Bagging Tree
The algorithm known as Bootstrap Aggregation, or "Bagging", is an ensemble machine learning technique. It aims to create a high-performing algorithm by combining multiple algorithms [22, 23]. The Bagging Tree machine learning algorithm uses many weak algorithms that make extrapolations to select the best forecast. Each weak algorithm specializes in different segments of the covariate space, allowing the Bagging Tree algorithm to leverage forecasts from every algorithm to achieve the best possible outcome. One advantage of the Bagging Tree algorithm is that it allows numerous weak learners to combine to outperform a single, stronger learner. Additionally, the Bagging method can reduce variance and prevent overfitting [23]. However, one of the drawbacks of bagging tree is that it reduces the interpretability of the model.
3.8.7. Artificial Neutral Network
Artificial Neural Network (ANN) is a computing system that is inspired by biological neural networks found in animal brains. It utilizes the brain's processing power to create models that can be used to model complex patterns and predict problems. ANN, also known as neural nets or neural networks, can learn and test non-linear and intricate relationships. Once it has learned from early inputs and their associations, it can generalize hidden associations on hidden data, and infer and forecast on hidden data.
ANN is composed of artificial neurons that are connected units or nodes. These artificial neurons model biological neurons present in the brain. Typically, neurons are grouped into layers, and different layers can perform different transformations on their inputs. Signals travel from the input layer to the output layer, possibly after traversing the layers multiple times [24,25].
3.9. Data Splitting
In the field of data analytics and machine learning, it is a common practice to divide a dataset into two parts. The first part, known as the training dataset, is typically the larger portion and is used to train the machine learning models. The second part, which is called the test dataset, is smaller and is used to evaluate the performance of the models.
For this research project, we will also be dividing the dataset into two parts. The first part will be 70% of the entire dataset and will be used as the training dataset. The remaining 30% will be the test dataset.
4. Results
4.1. Model Prediction
This methodology was successful in achieving low mean square error for all the algorithms used, resulting in a high level of predictive precision. In conclusion, this approach can consistently achieve high levels of accuracy and predictive precision when modelling housing prices. It is important to account for regional variability and differences when using machine learning algorithms to model housing prices in the UK. This study validates the practicality of developing a machine learning methodology for predicting housing prices and provides a reference for future research in this area.
Table 4 shows that for each region the R-squared for the regression analysis is very high implying that these features adequately explain the housing prices dynamics in the UK. This is total agreements with figures 3.1 to 3.4.
Table 5 shows the features or variables that are statistically significant for each region using regression model. These features are then applied in the machine learning algorithms used in this research work.
Table 6 shows the features or variables that are not statistically significant for each region using regression model. These features were dropped for each region and were not used in the machine learning algorithms.
4.2. Performance Metrics
- Accuracy
Accuracy otherwise called R2 score or R-Square for ML regression models. For a given dataset, accuracy shows how closely fitted or accurate is the line fitted performs. In other words, accuracy shows the level of closeness or otherwise of the data points of a dataset to the fitted forecasted line
- 2.
- Mean Absolute Error
Mean Absolute Error of an algorithm denotes the mean of the absolute values of each forecast error on all occurrences of the test dataset. Forecast error is the difference between the actual value and the projected value for that instance. Statistically, MAE is the result of calculating the difference between two continuous variables. MAE measures the average magnitude of the errors in a set of forecasts, without considering their direction. It measures accuracy for continuous variable [18].
After comparing all the models, the researcher will select the best model based on the measures stated above, especially the model with minimum value for Type 2 error
- 3.
- Mean Square Error (MSE) and Root Mean Square Error (RMSE)
MSE of an algorithm computes the “amount of error” in that algorithm. MSE measures the average squared difference between the observed and predicted values [18].
RMSE is the square root of the Mean Square Error. The consequence of each error on Root Mean Square Error is certainly proportionate to the magnitude of the Mean Square Error; thus larger errors have a disproportionately large effect on RMSD. Consequently, RMSD is sensitive to outlier [18].
The section below shows the results of all the machine learning algorithms by each region.
Table 7, Table 8, Table 9 and Table 10 are the performance metrics results machines algorithms used in this research work for London, North East of England, Yorkshire and South East of England respectively. Extra Tree Modelling consistently outperformed all the other models in all the regions with 0.99 achieved in each of the regions. Also, all the ensemble and bagging models (Catboost, Gradient Boosting, Random Forest, Bagging and Extra Tree models) performed excellently well in each of these regions with each of them achieving over 90% accuracy level. K Nearest and Artificial Neural Network did not perform very well in virtually all the region considered. They equally have the highest, MAE and MSE values across all the regions.
5. Discussion and Conclusion
5.1. Discussion
The novelty of this research is that existing studies compares a few ML algorithms, which could not offer a full picture of the utility of ML in house price modelling and prediction. This research work will compare a number of popular ML algorithms to evaluate the utility of ML in housing prices modelling and prediction. Additionally, most of existing studies focus mainly on individual-level (property-level) price. This study focuses focus on area-level (post-code-level) aggregate-level pricing modelling and prediction.
In addition, most literatures on regional housing prices focus on ripple effects and convergence of regional housing prices in contrast to this research work. The cardinal focuses are (1) comparing and contrasting the dynamics (features) of housing prices on regional divide; namely South and North divide using 2 regions each from each of 2 divides and (2) understanding the practically of developing machine learning algorithms and artificial intelligence based on focus (1). Table 3a: the variables that are statistically significant by regions. These variables are the one selected for each machine selected and applied for each of the 4 regions.
Considering region as a factor that influences the housing prices, houses are cheaper in North East England, and Yorkshire and the Humber regions than South East England and London regions, where houses are quite expensive. London has the highest yearly housing price, followed by South East of England with Yorkshire and the Humber and North East of England have almost the same or similar yearly price range. This implies that the variables that are significant in London significantly contributed to the house prices in London region. North East England had the least R-squared value 0.835, followed by South East England with 0.908 and then York with 0.913.
As a result of similarities of the housing prices patterns in London and the South East of England regions as established in features that are statistically significant, the ripple effect hypothesises that variations in housing prices in the United Kingdom are first observed in vibrant cities like London and the South East of England before they spread to other regions (Cook and Watson, 2016; Grigoryeva, 2017) should be further investigated
This journal examines various machine learning algorithms models for forecasting the price of house in four regions of England. Interestingly, all these algorithms (with the exception of K-NN and ANN that performed poorly in North East of England) achieved good results in each of the regions considered. Catboost Modelling and Gradient Boosting Modelling consistently had the lowest error - MAE, MSE and RMSE for all the regions. The ensemble models (Catboost, Gradient Boosting, Random Forest, Bagging and Extra Tree) consistently performed very well achieving over 90% level of accuracy both for training and test datasets for all the regions. This implies any of these 5 models could be applied. The Extra Tree Model outperformed all the other model achieving 99% for both training and test datasets for all the regions. Artificial neural network (ANN) and K Nearest Neighbour had the poorest results (KNN had the poorer of these models and the overall poorest of all the models) for all the regions. Noticeably, the regions considered had varying or differing insignificant variables, implying that although many variables are common (statistically significant) to all the regions, there are regional differences and impact when modelling or predicting housing prices. Most variables were statistically significant in London, more than the other regions considered. Strangely enough, the R-squared value gotten for London (0.926) was the highest considered to other regions. This implied that the variables that are significant in London significantly contribution to the house prices in the UK. North East England had the least R-squared value 0.835, followed by South East England with 0.908 and then York with 0.913.
5.2. Conclusion
After using correlation analysis to remove multicollinearity, a novel approach to first of all use regression analysis to identify the statistically significant features was adopted. Firstly, with this novel approach a prior knowledge or information to identify and understand the features that are statistically significant (similar to Bayesian approach) for each region. Secondly this prior information then form the basis for our machine learning features applications. The end products of this approach or steps 1 and 2 areas follow is that high level of accuracy were achieved for many of the algorithms applied for this study. Also, this approach empowered the achievement of low mean square error for all these algorithms and lastly a high level of predictive precision. Conclusively, there is that highly likelihood to always achieve high level of accuracy and high predictive precision using this approach or methodology when modelling housing prices. Also, regional variability and differences must be accounted for when modelling housing price in UK using machine learning algorithms. This study validates the practicability of developing a machine learning methodology for the prediction of housing price. This research offers a reference for future house price prediction based on machine learning.
References
- Jafar, A. et al. (2018): Machine Learning for a London Housing Price Prediction Mobile Application, BEng in Electronics and Information Engineering, Imperial College London.
- Aaron (2015): Machine Learning for a London Housing Price Prediction Mobile Application, BEng in Electronics and Information Engineering, Imperial College London.
- Schmidt, J. , Mário R. G. M., Silvana B. and Miguel A. L. M. (2019): Recent advances and applications of machine learning in solid-state materials science, npj Computational Materials volume 5, Article number: 83 (2019).
- Zhou, L. Machine Learning on Big Data: Opportunities and Challenges . 2017. [Google Scholar]
- https://who.rocq.inria.fr/Vassilis.Christophides/Big/local_copy/intro/BigDataOpportunitiesanChallenges.pdf.
- Ferreira, F. et al. (2007): A Unified Framework for Measuring Preferences for Schools and Neighbourhoods, Journal of Political Economy, Vol. 115, No. 4 (07), pp. 588-638.
- Hussain, I (2016); Do Consumers Respond to Short-Term Innovations in School Productivity? Evidence from the Housing Market and Parents’ School Choices: University oSussex.
- Rutzen, M. (2018): Urban Tech on the Rise: Big Data Disrupts the Real Estate Industry, built Hoizonshttps://medium.com/built-horizons/urban-tech-on-the-rise-big-data-disrupts-the-real-estate-industry-492d9e15aba5.
- Shinde, N, and Gawande, K. (2017): Kaggle Competition: Predicting House Prices in Ames, Iowa.
- https://nycdatascience.com/blog/student-works/machine-learning/kaggle-ompetition- house-pricing-in-ames-iowa/.
- Awonaike, A. et al. A Machine Learning Framework for House Price.
- Estimation, Journal of Network and Innovative Computing, ISSN 2160-2174 Volume 10 (2022) pp. 028-035. www.mirlabs.net/jnic/index.htm.
- Kim, J. et al. A Comparative Study of Machine Learning and Spatial Interpolation Methods for Predicting House Prices, 2022. [Google Scholar] [CrossRef]
- Antoniucci, V and Marella, G. Immigrants and the City: The Relevance of Immigration on Housing Price Gradient Buildings, 2017. [CrossRef]
- Fix and Hodges (1951): An Important Contribution to Nonparametric Discriminant Analysis and Density Estimation,.
- https://www.jstor.org/stable/pdf/1403796.pdf?refreqid=excelsior%3Ad656fb48118218644479bd4a21660be5&ab_segments=&origin=&initiator=&acceptTC=1.
- COVER, T. M. (1968). Rates of Convergence for Nearest Neighbor procedures. In Proceedings of the Hawaii International Conference on System Sciences (B. K. Kinariwala and F. F. Kuo, eds.) 413–415. Univ. Hawaii Press, Honolulu.
- Cover, T. M. and Hart, P. E. (1967). Nearest Neighbor Pattern Classification. IEEE Trans. Inform. Theory 13 21–27.
- Band, A. (2020): How to find the optimal value of K in KNN?https://towardsdatascience.com/how-to-find-the-optimal-value-of-k-in-knn-35d936e554eb#:~:text=The%20optimal%20K%20value%20usually,be%20aware%20of%20the%20outliers.
- Schott, M. K-Nearest Neighbors (KNN) Algorithm for Machine Learning.https://medium.com/capital-one-tech/k-nearest-neighbors-knn-algorithm-for-machine-learning-e883219c8f26.
- Gupta, P. (2017): Decision Trees in Machine Learning.
- https://towardsdatascience.com/decision-trees-in-machine-learning-641b9c4e8052.
- Gahukar, G. (2018): Classification Algorithms in Machine Learning…. https://medium.com/datadriveninvestor/classification-algorithms-in-machine-learning-85c0ab65ff4.
- Kangane, P. et al. (2021): International Journal of Engineering Applied Sciences and Technology, 2021 Vol. 5, Issue 11, ISSN No. 2455-2143, Pages 247-254Published Online 21 in IJEAST (http://www.ijeast.com).
- Scikit learn 1.2.1 documentation.
- https://scikit-learn.org/stable/modules/ensemble.html.
- Kaggle.
- https://www.kaggle.com/code/dansbecker/xgboost.
- Brownlee, J. How to Develop an Extra Trees Ensemble with Python. 2021. [Google Scholar]
- https://machinelearningmastery.com/extra-trees-ensemble-with-python.
- CFI Team (2022): Bagging (Bootstrap Aggregation).
- https://corporatefinanceinstitute.com/resources/data-science/bagging-bootstrap-ggregation/.
- Agatonovic-Kustrin, S. , Beresford, R. (2000): Basic concepts of artificial neural network (ANN) modeling and its application in pharmaceutical research, J Pharm Biomed Anal. 2000 Jun;22(5):717-27. [CrossRef]
- https://pubmed.ncbi.nlm.nih.gov/10815714/.
- Nagyfi, R. . (2018): The differences between Artificial and Biological Neural Networks.
- https://towardsdatascience.com/the-differences-between-artificial-and-biological-neural-networks-a8b46db828b7.
Figure 1.
The Schematised Methodology.
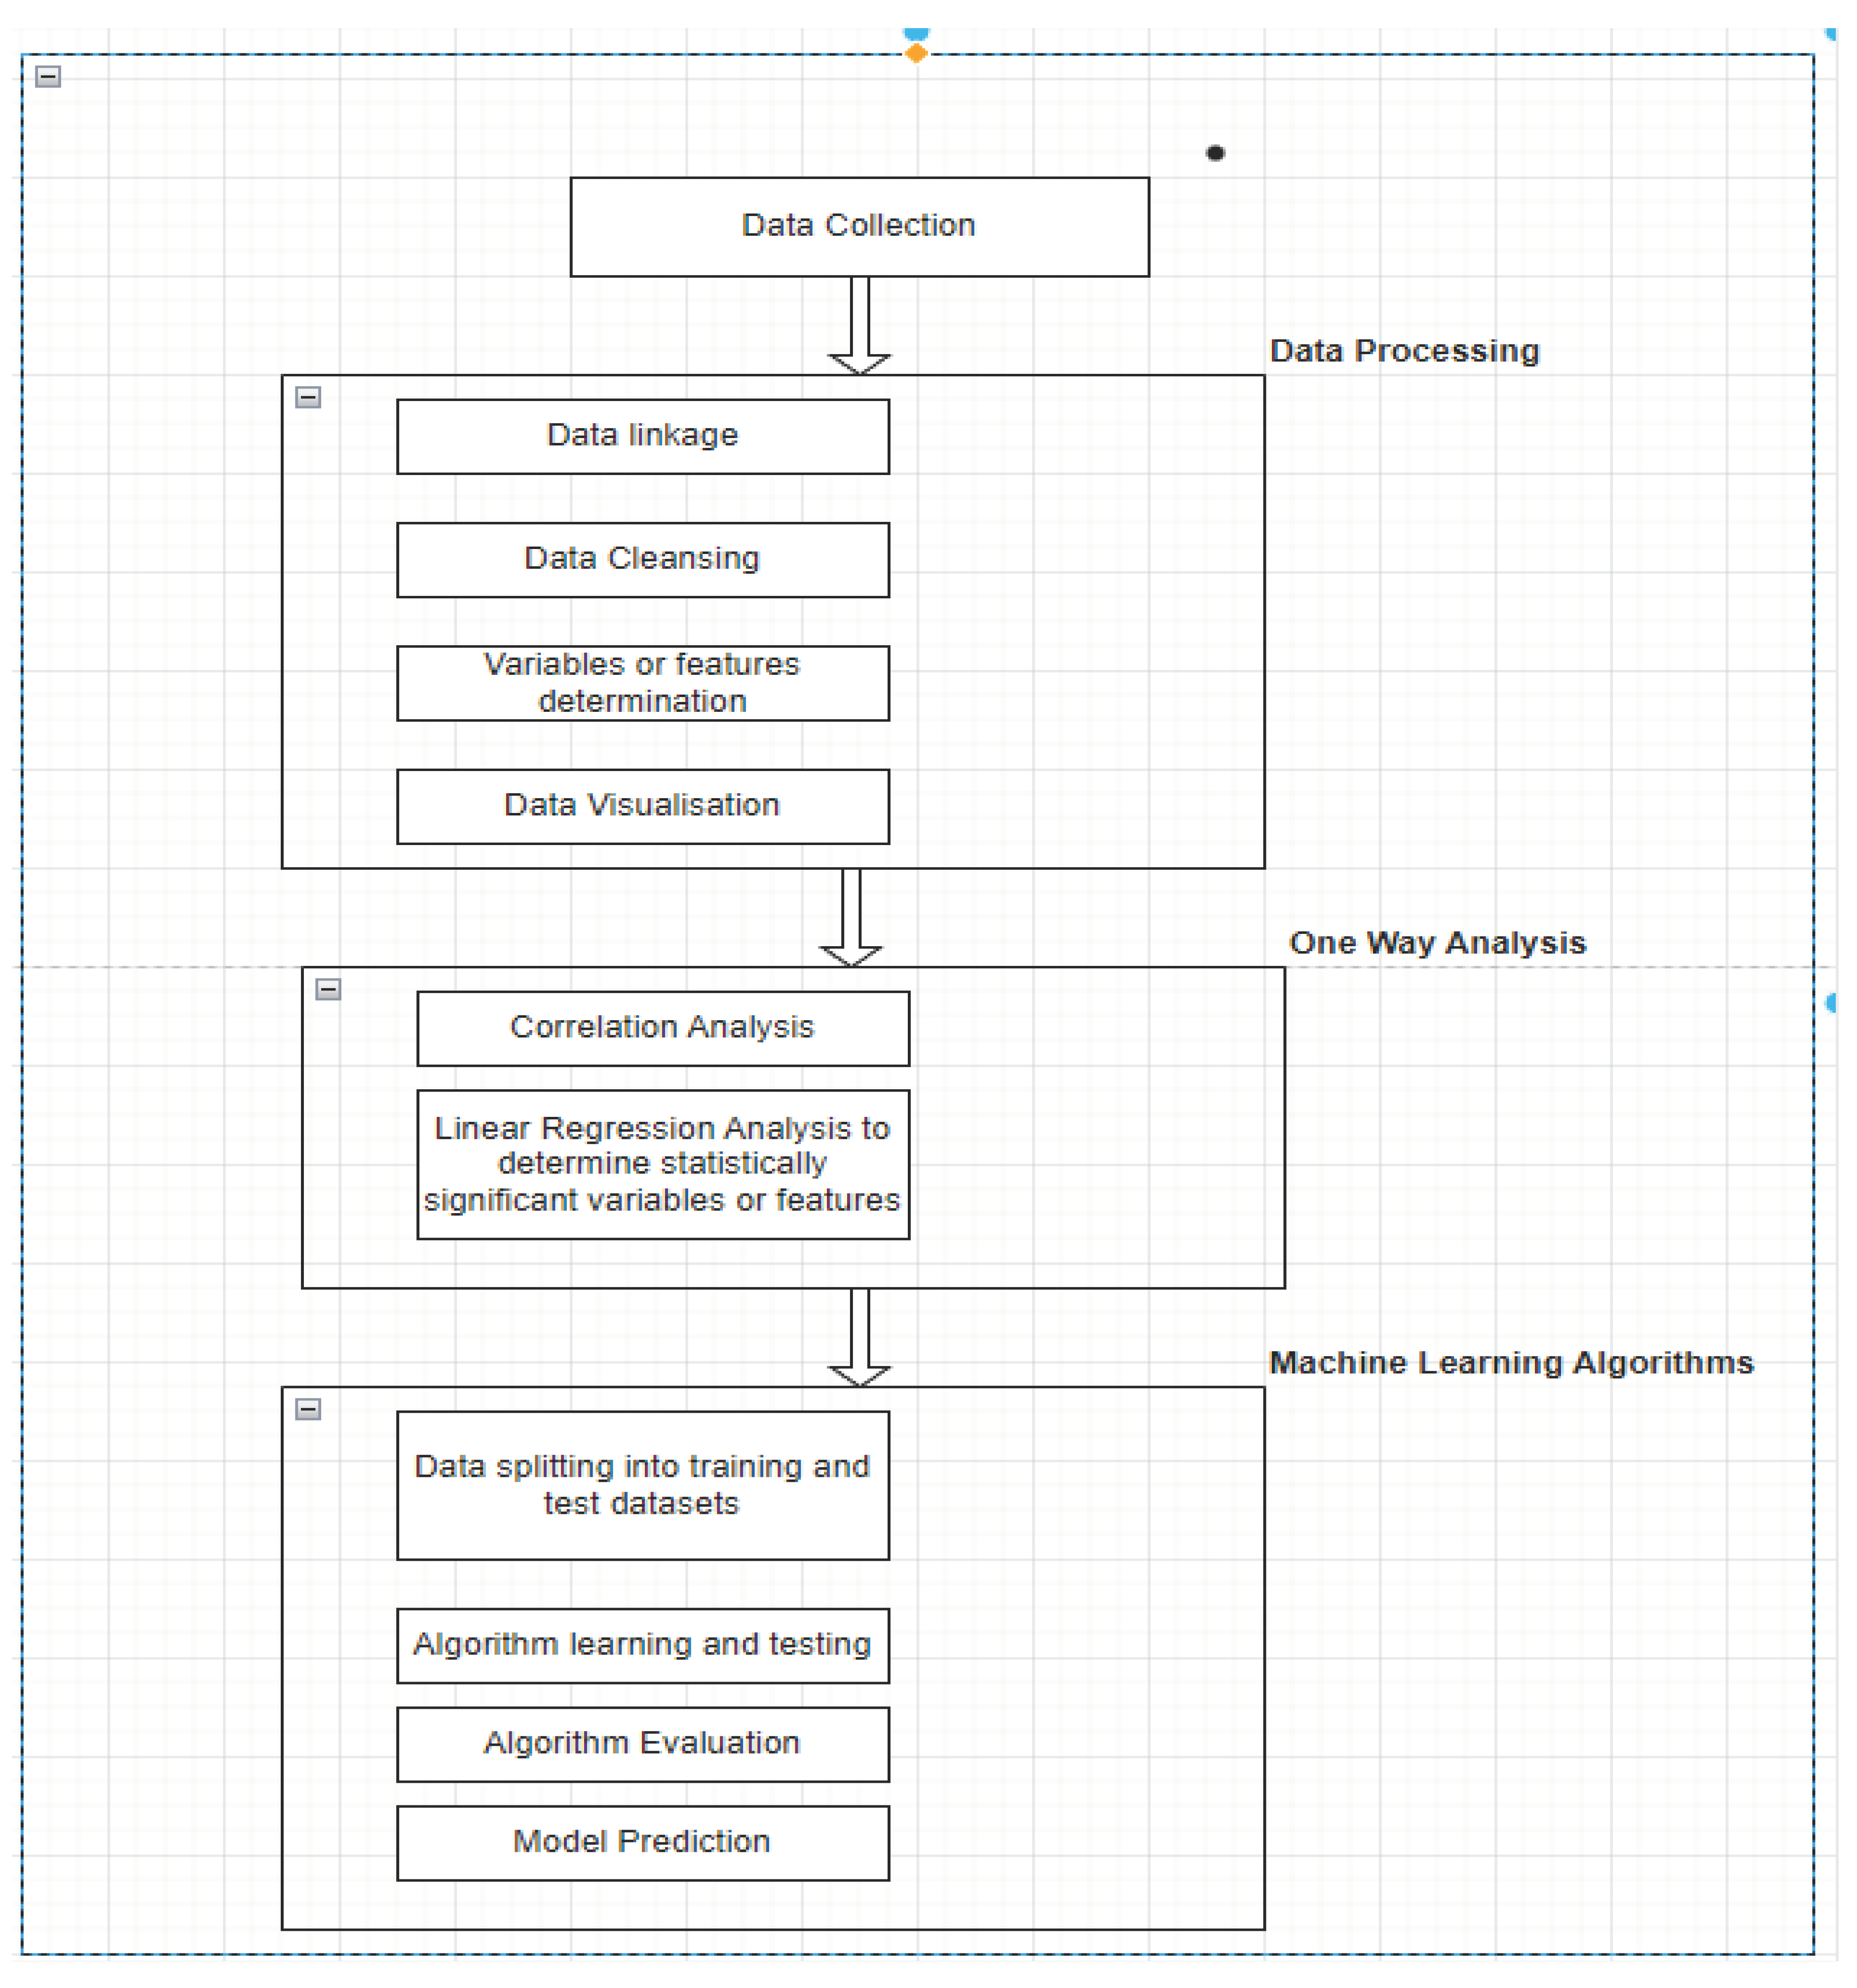
Figure 2.
Variables with 0.50 (50%) and above correlation values in South East of England.
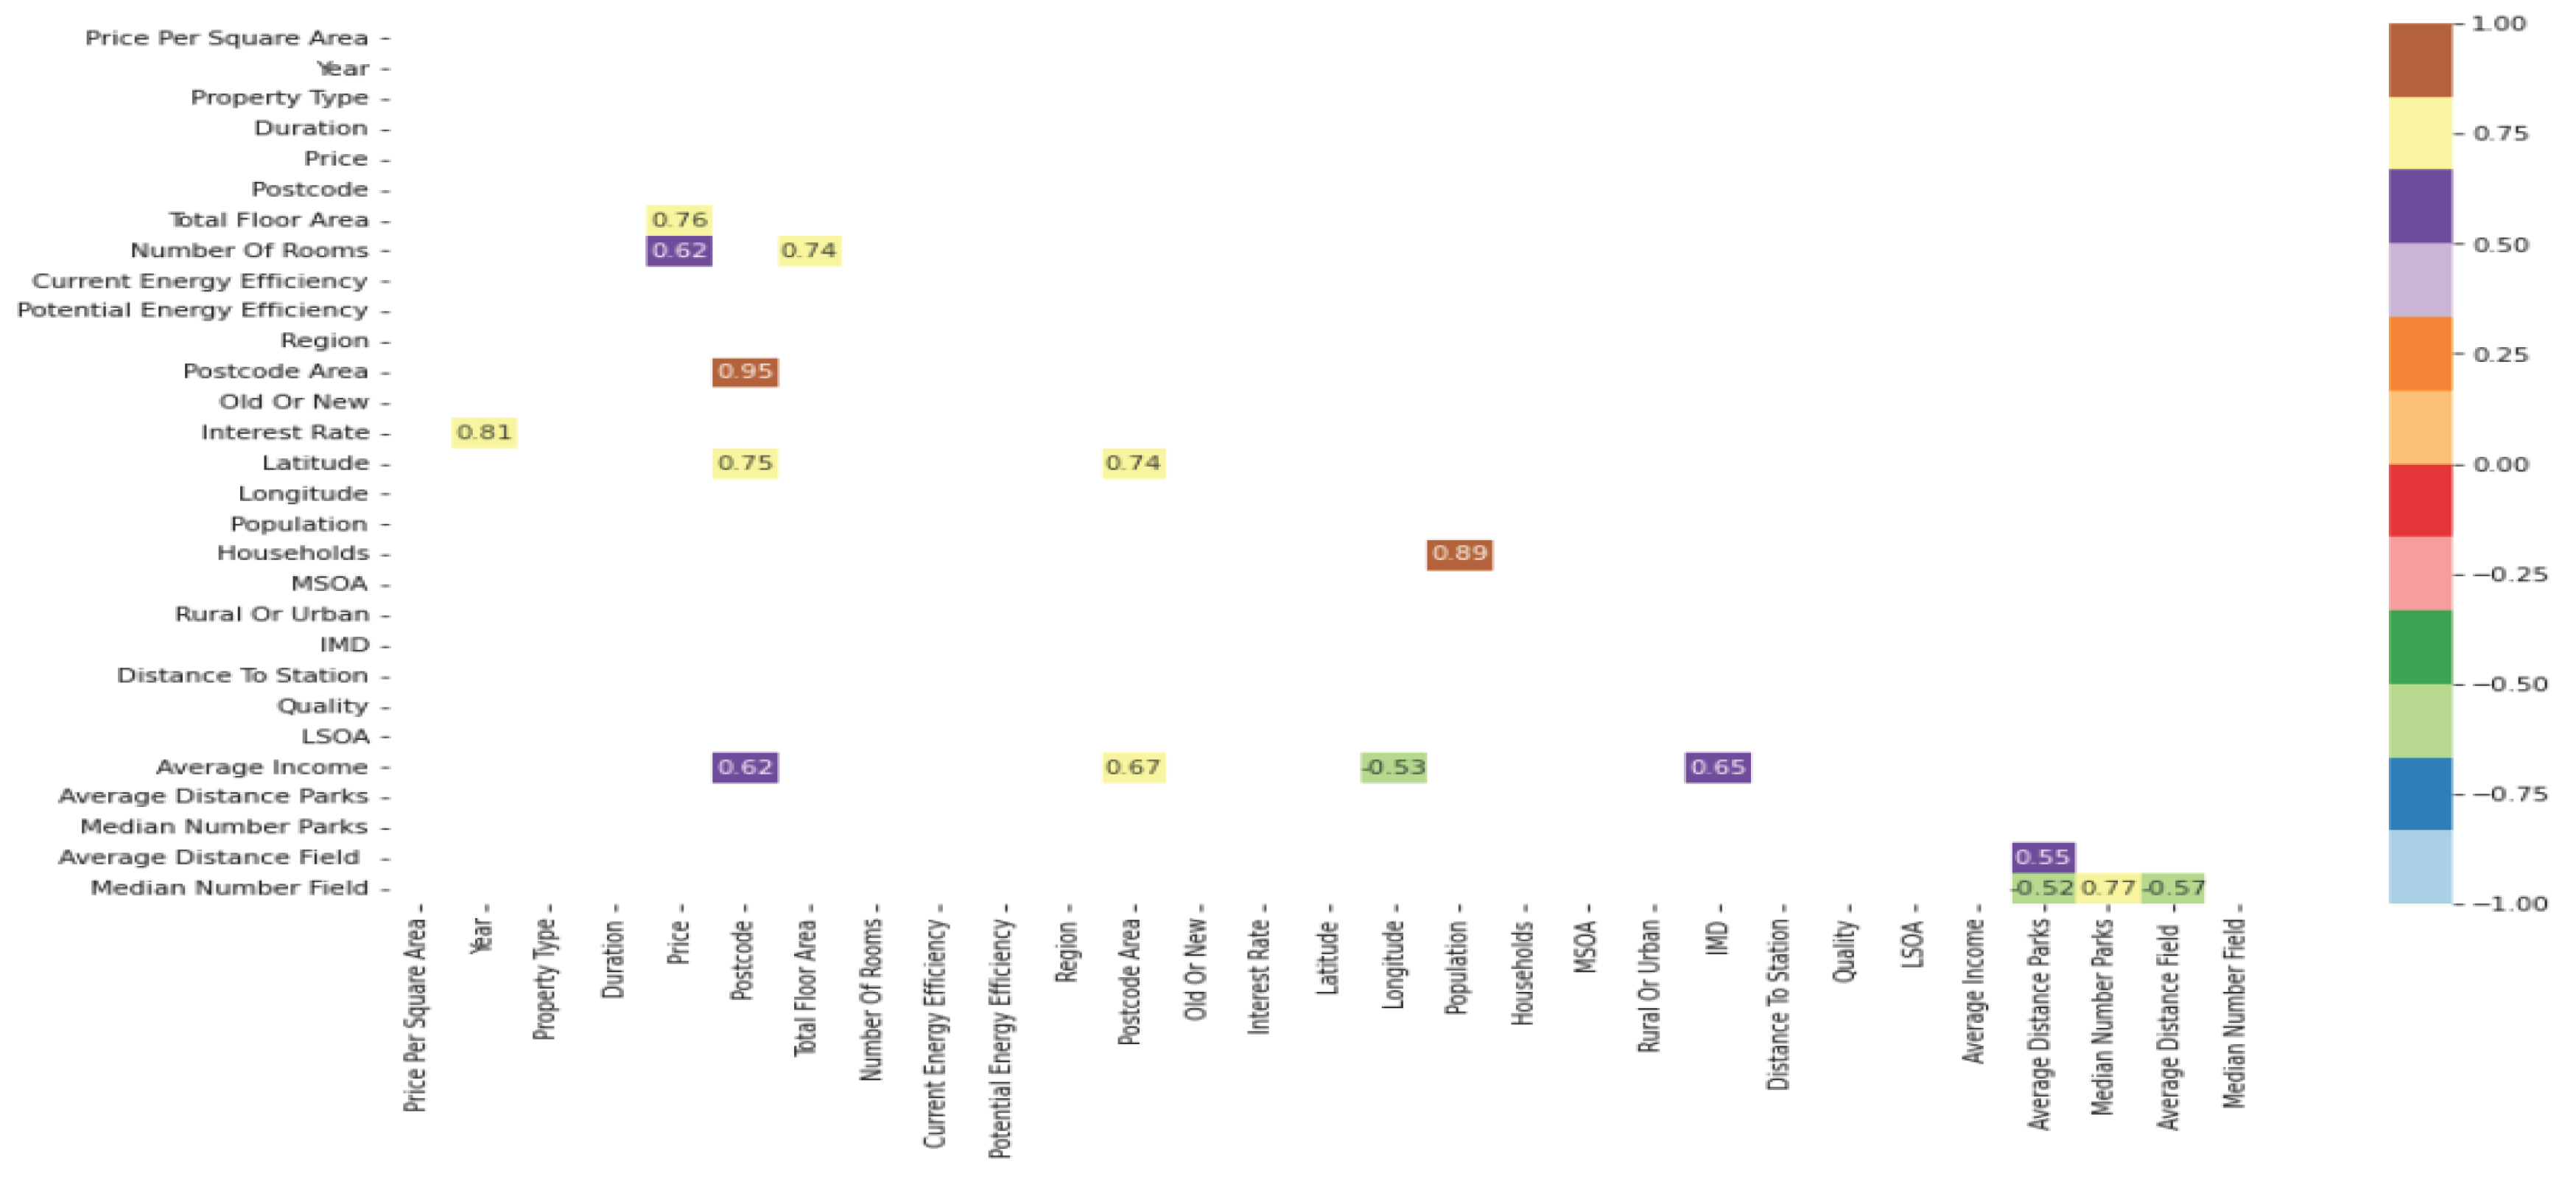
Figure 3.
Variables with 0.50 (50%) and above correlation values in Yorkshire.
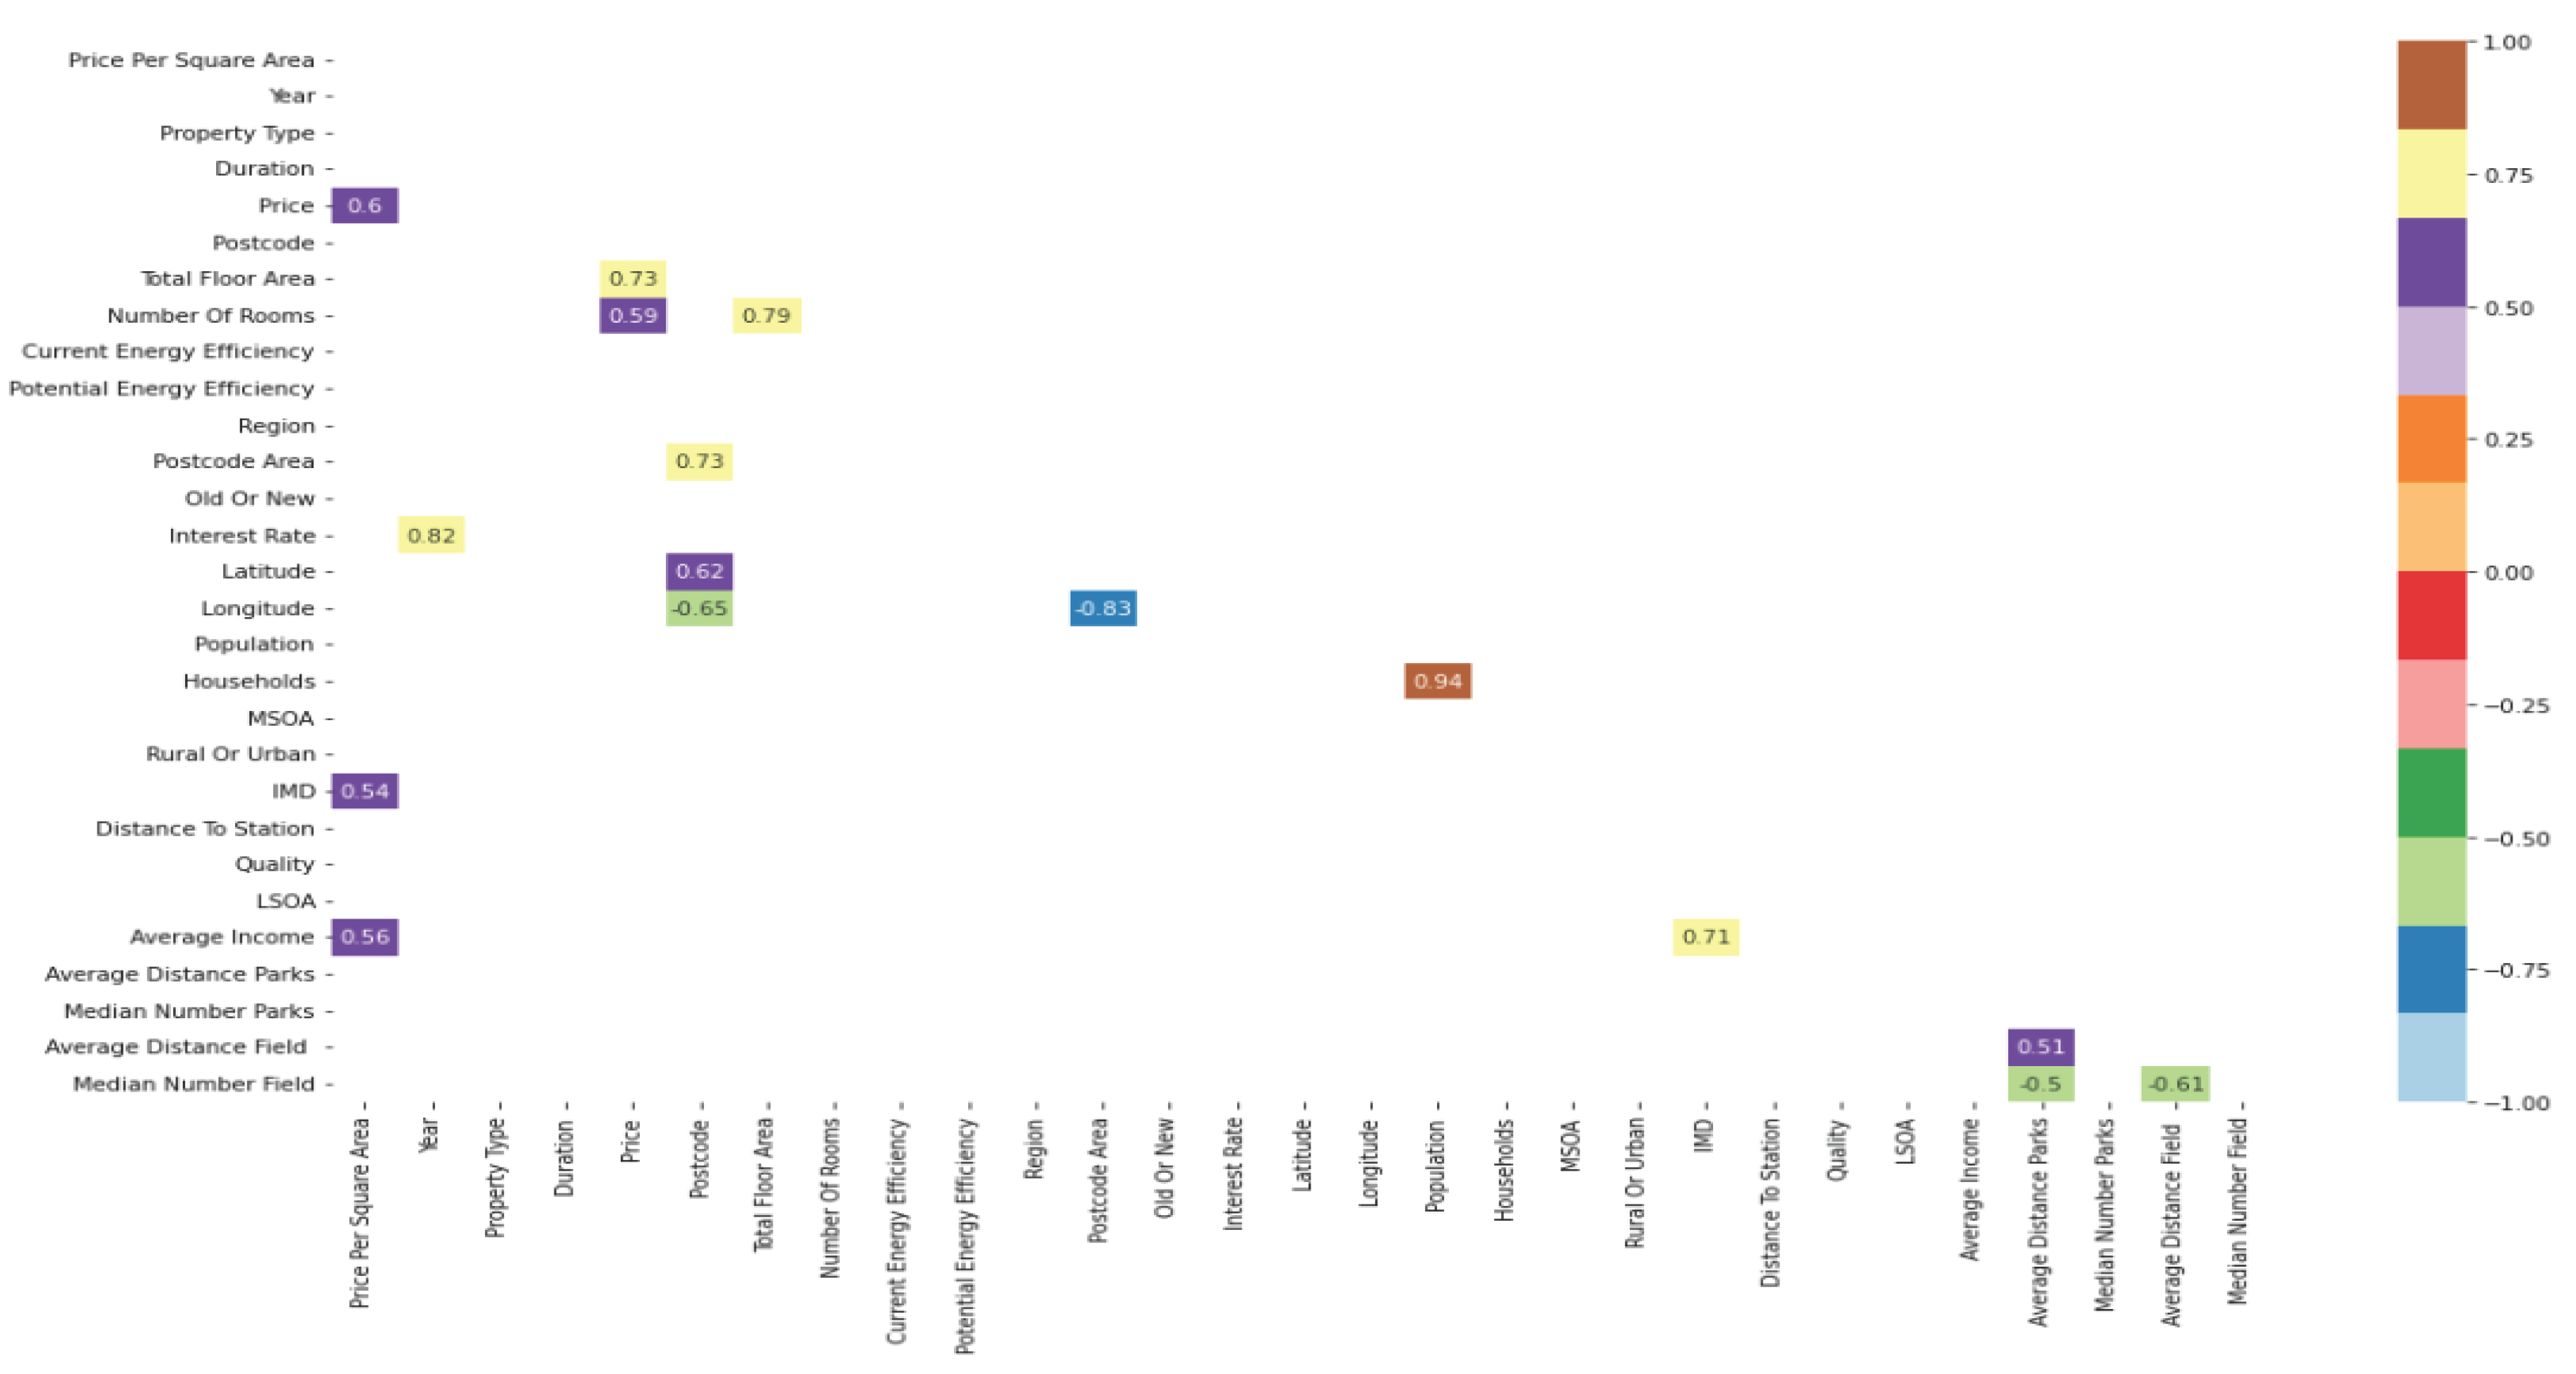
Figure 4.
Variables with 0.50 (50%) and above correlation values in London.
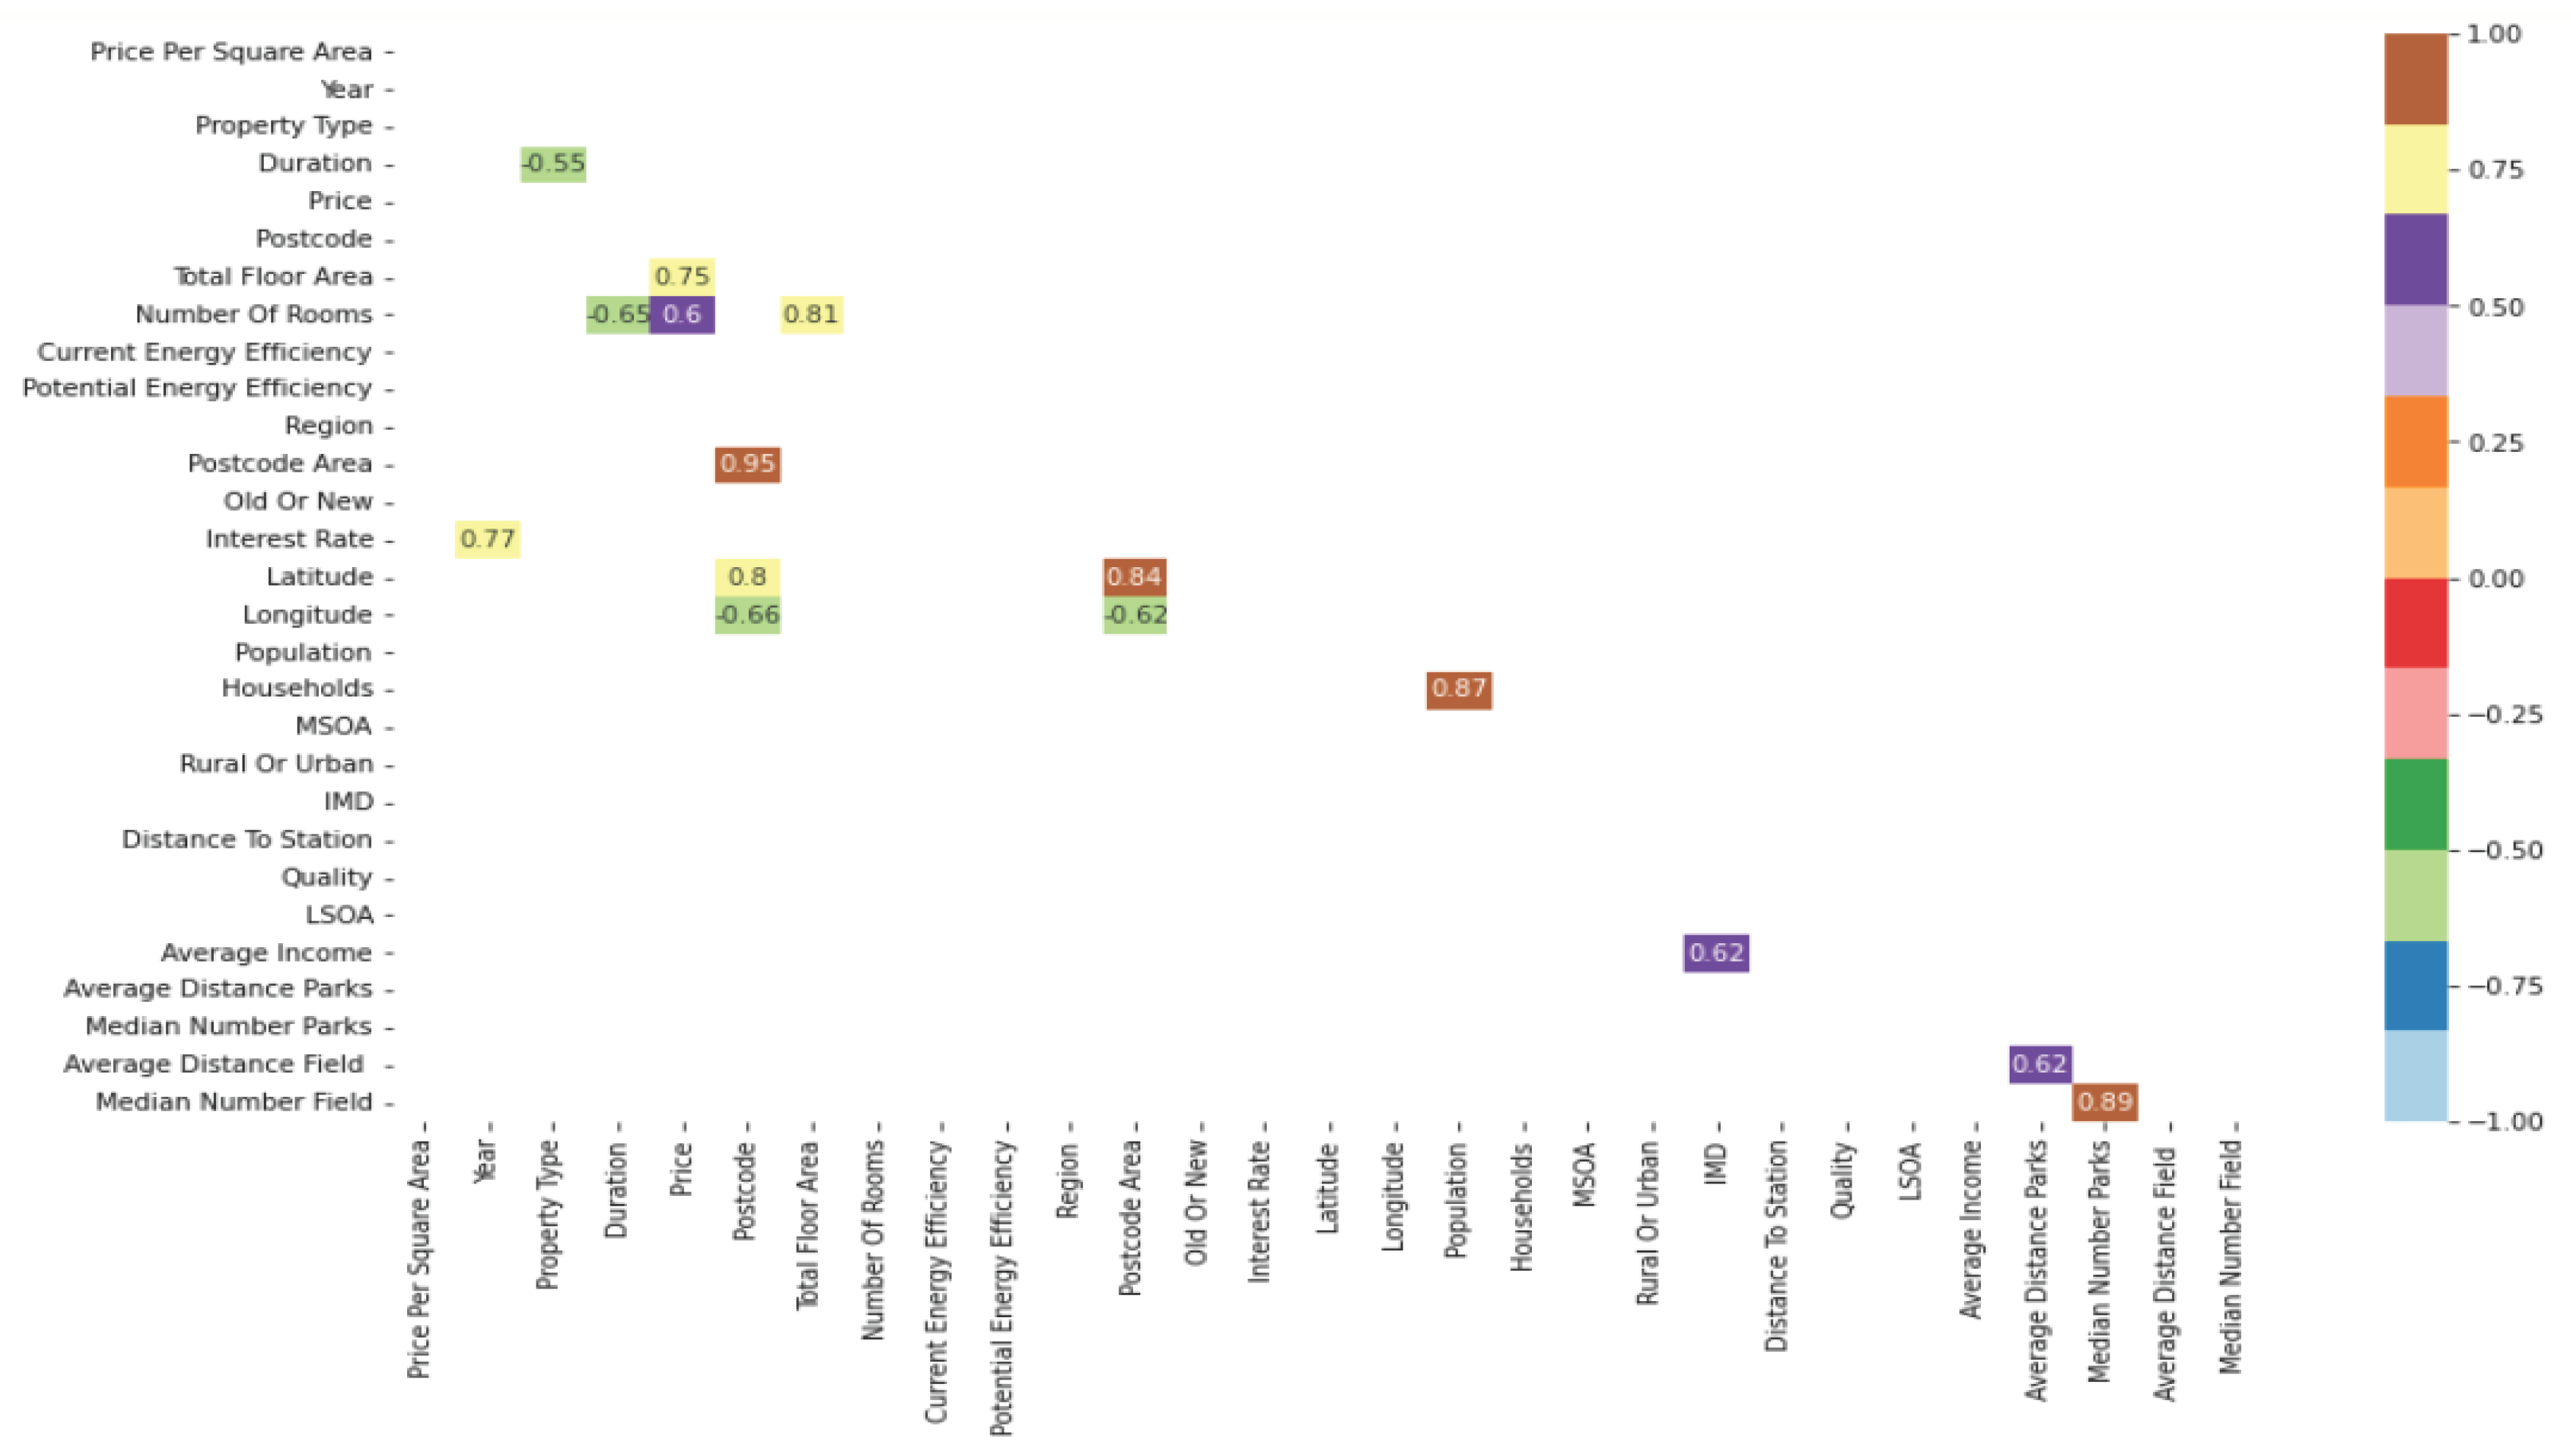
Figure 5.
Variables with 0.50 (50%) and above correlation values in North East of England.
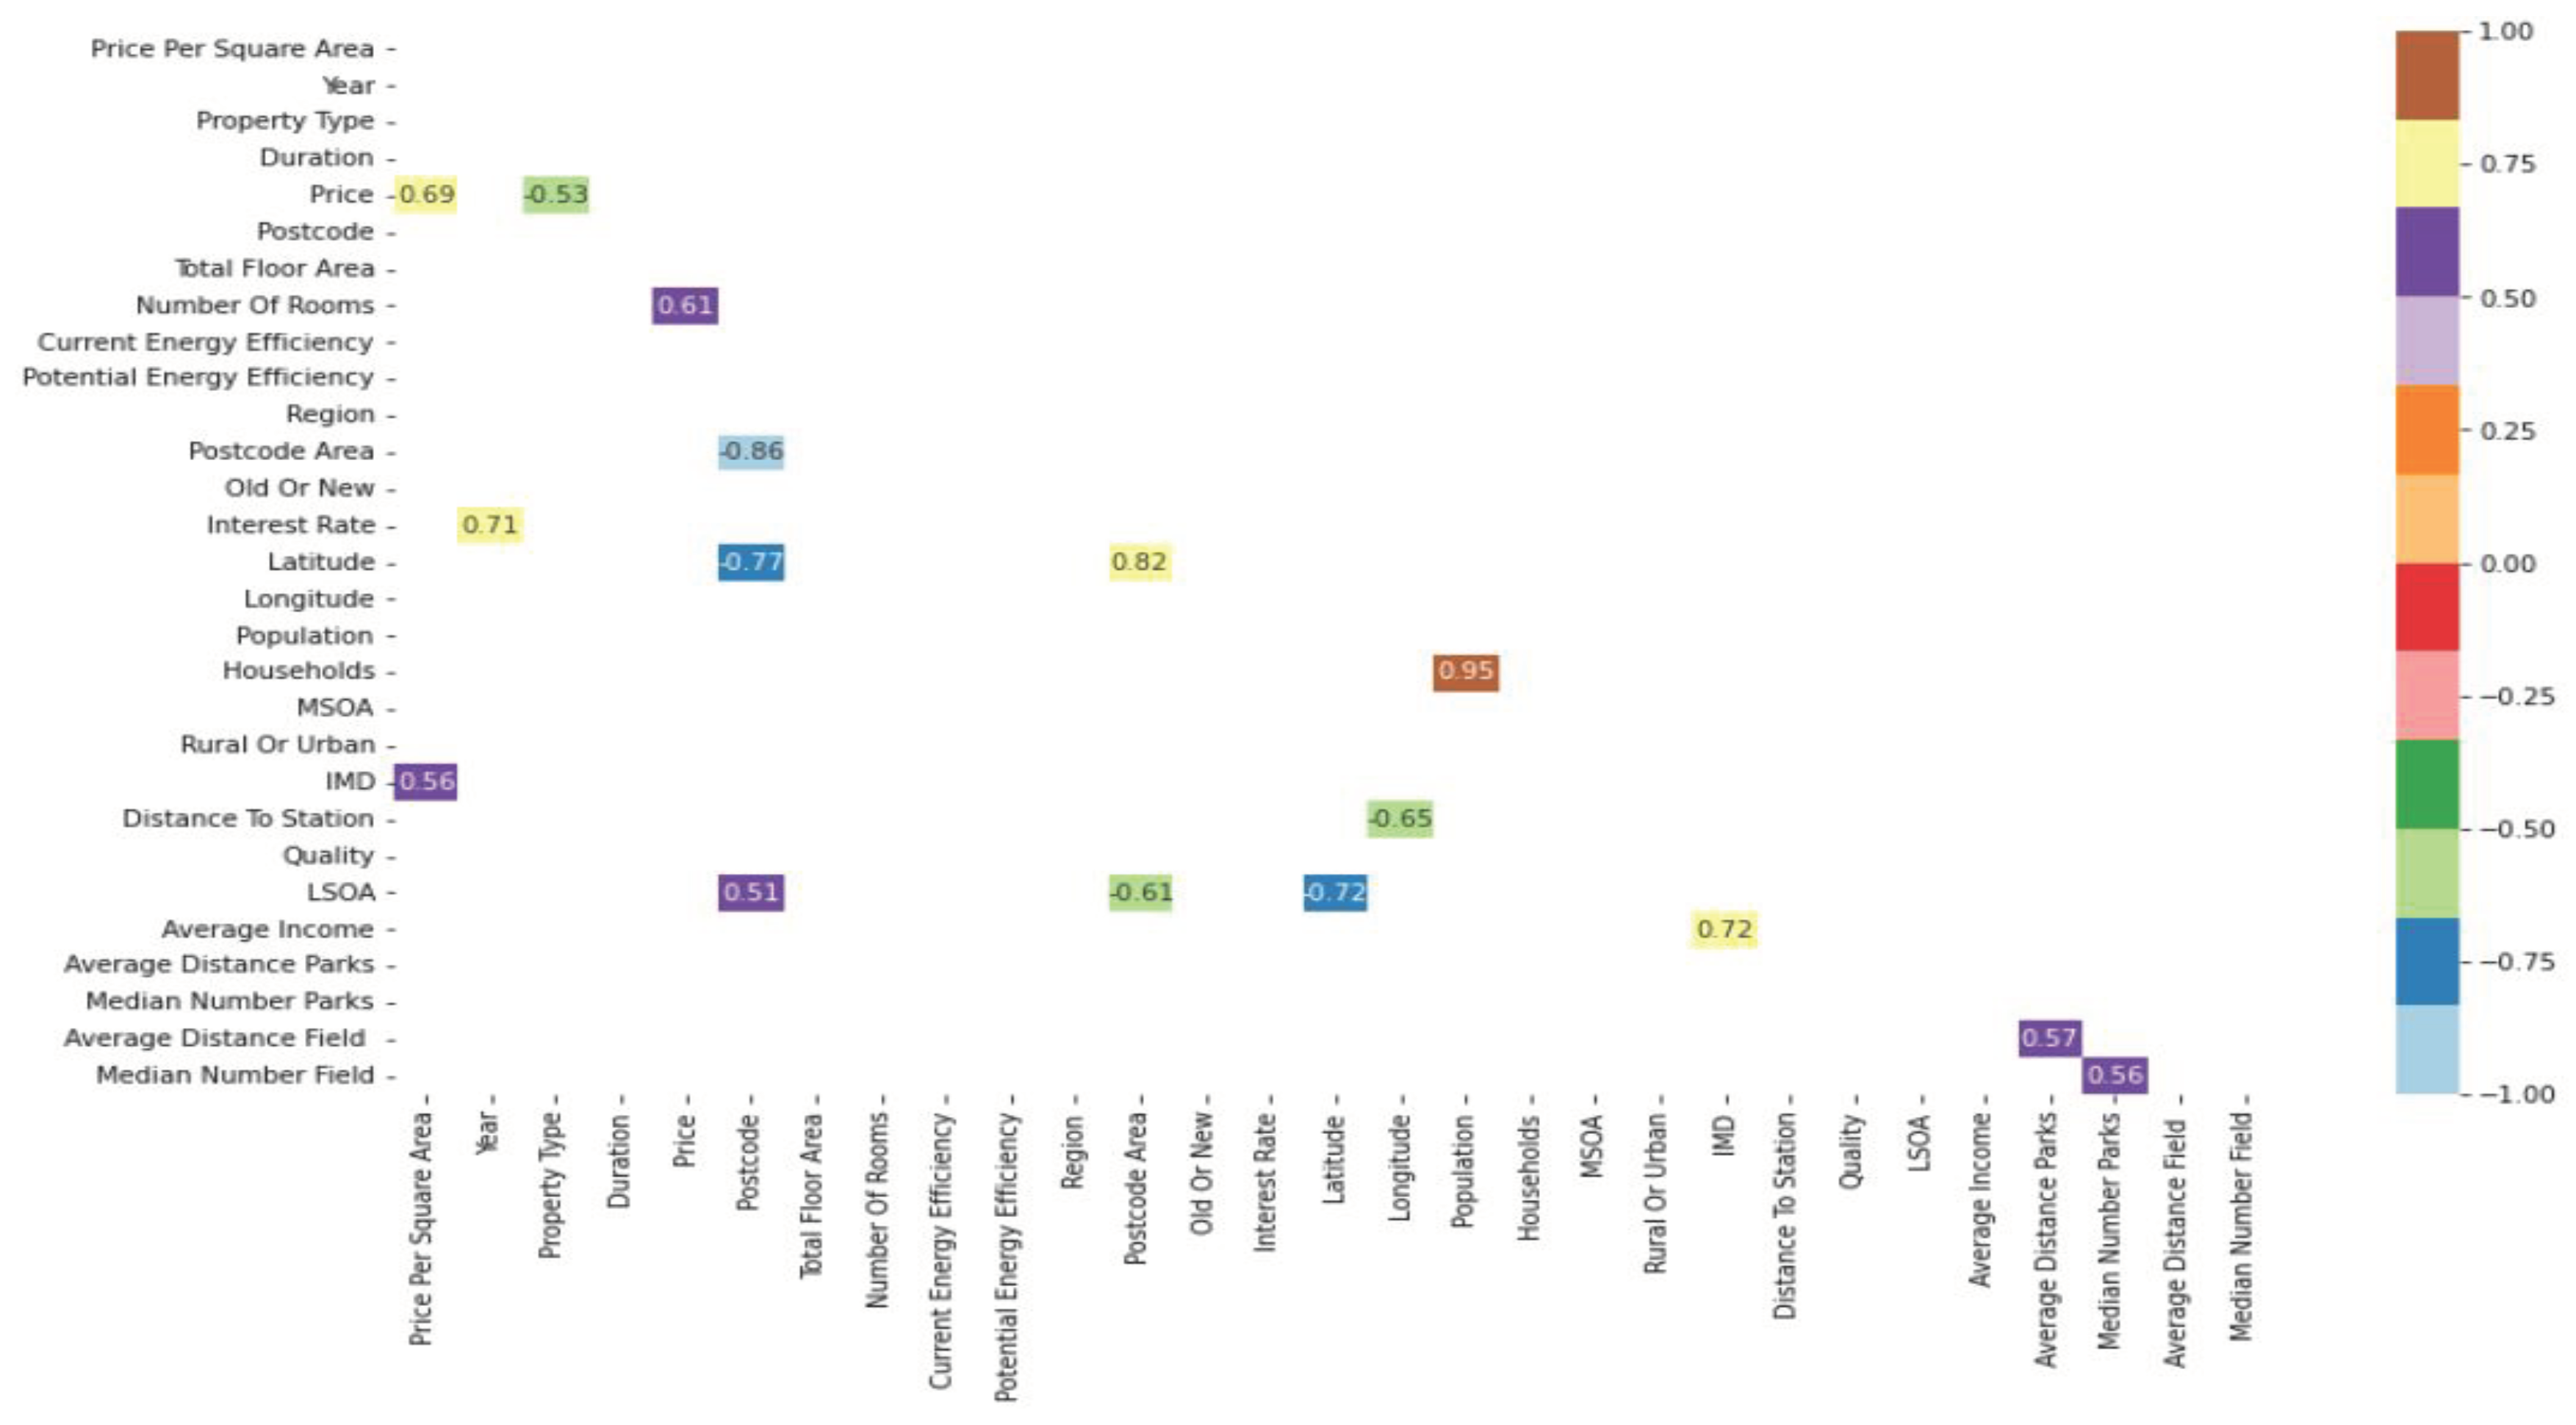
Figure 6.
The Frequency Distribution of the features: Yorkshire.
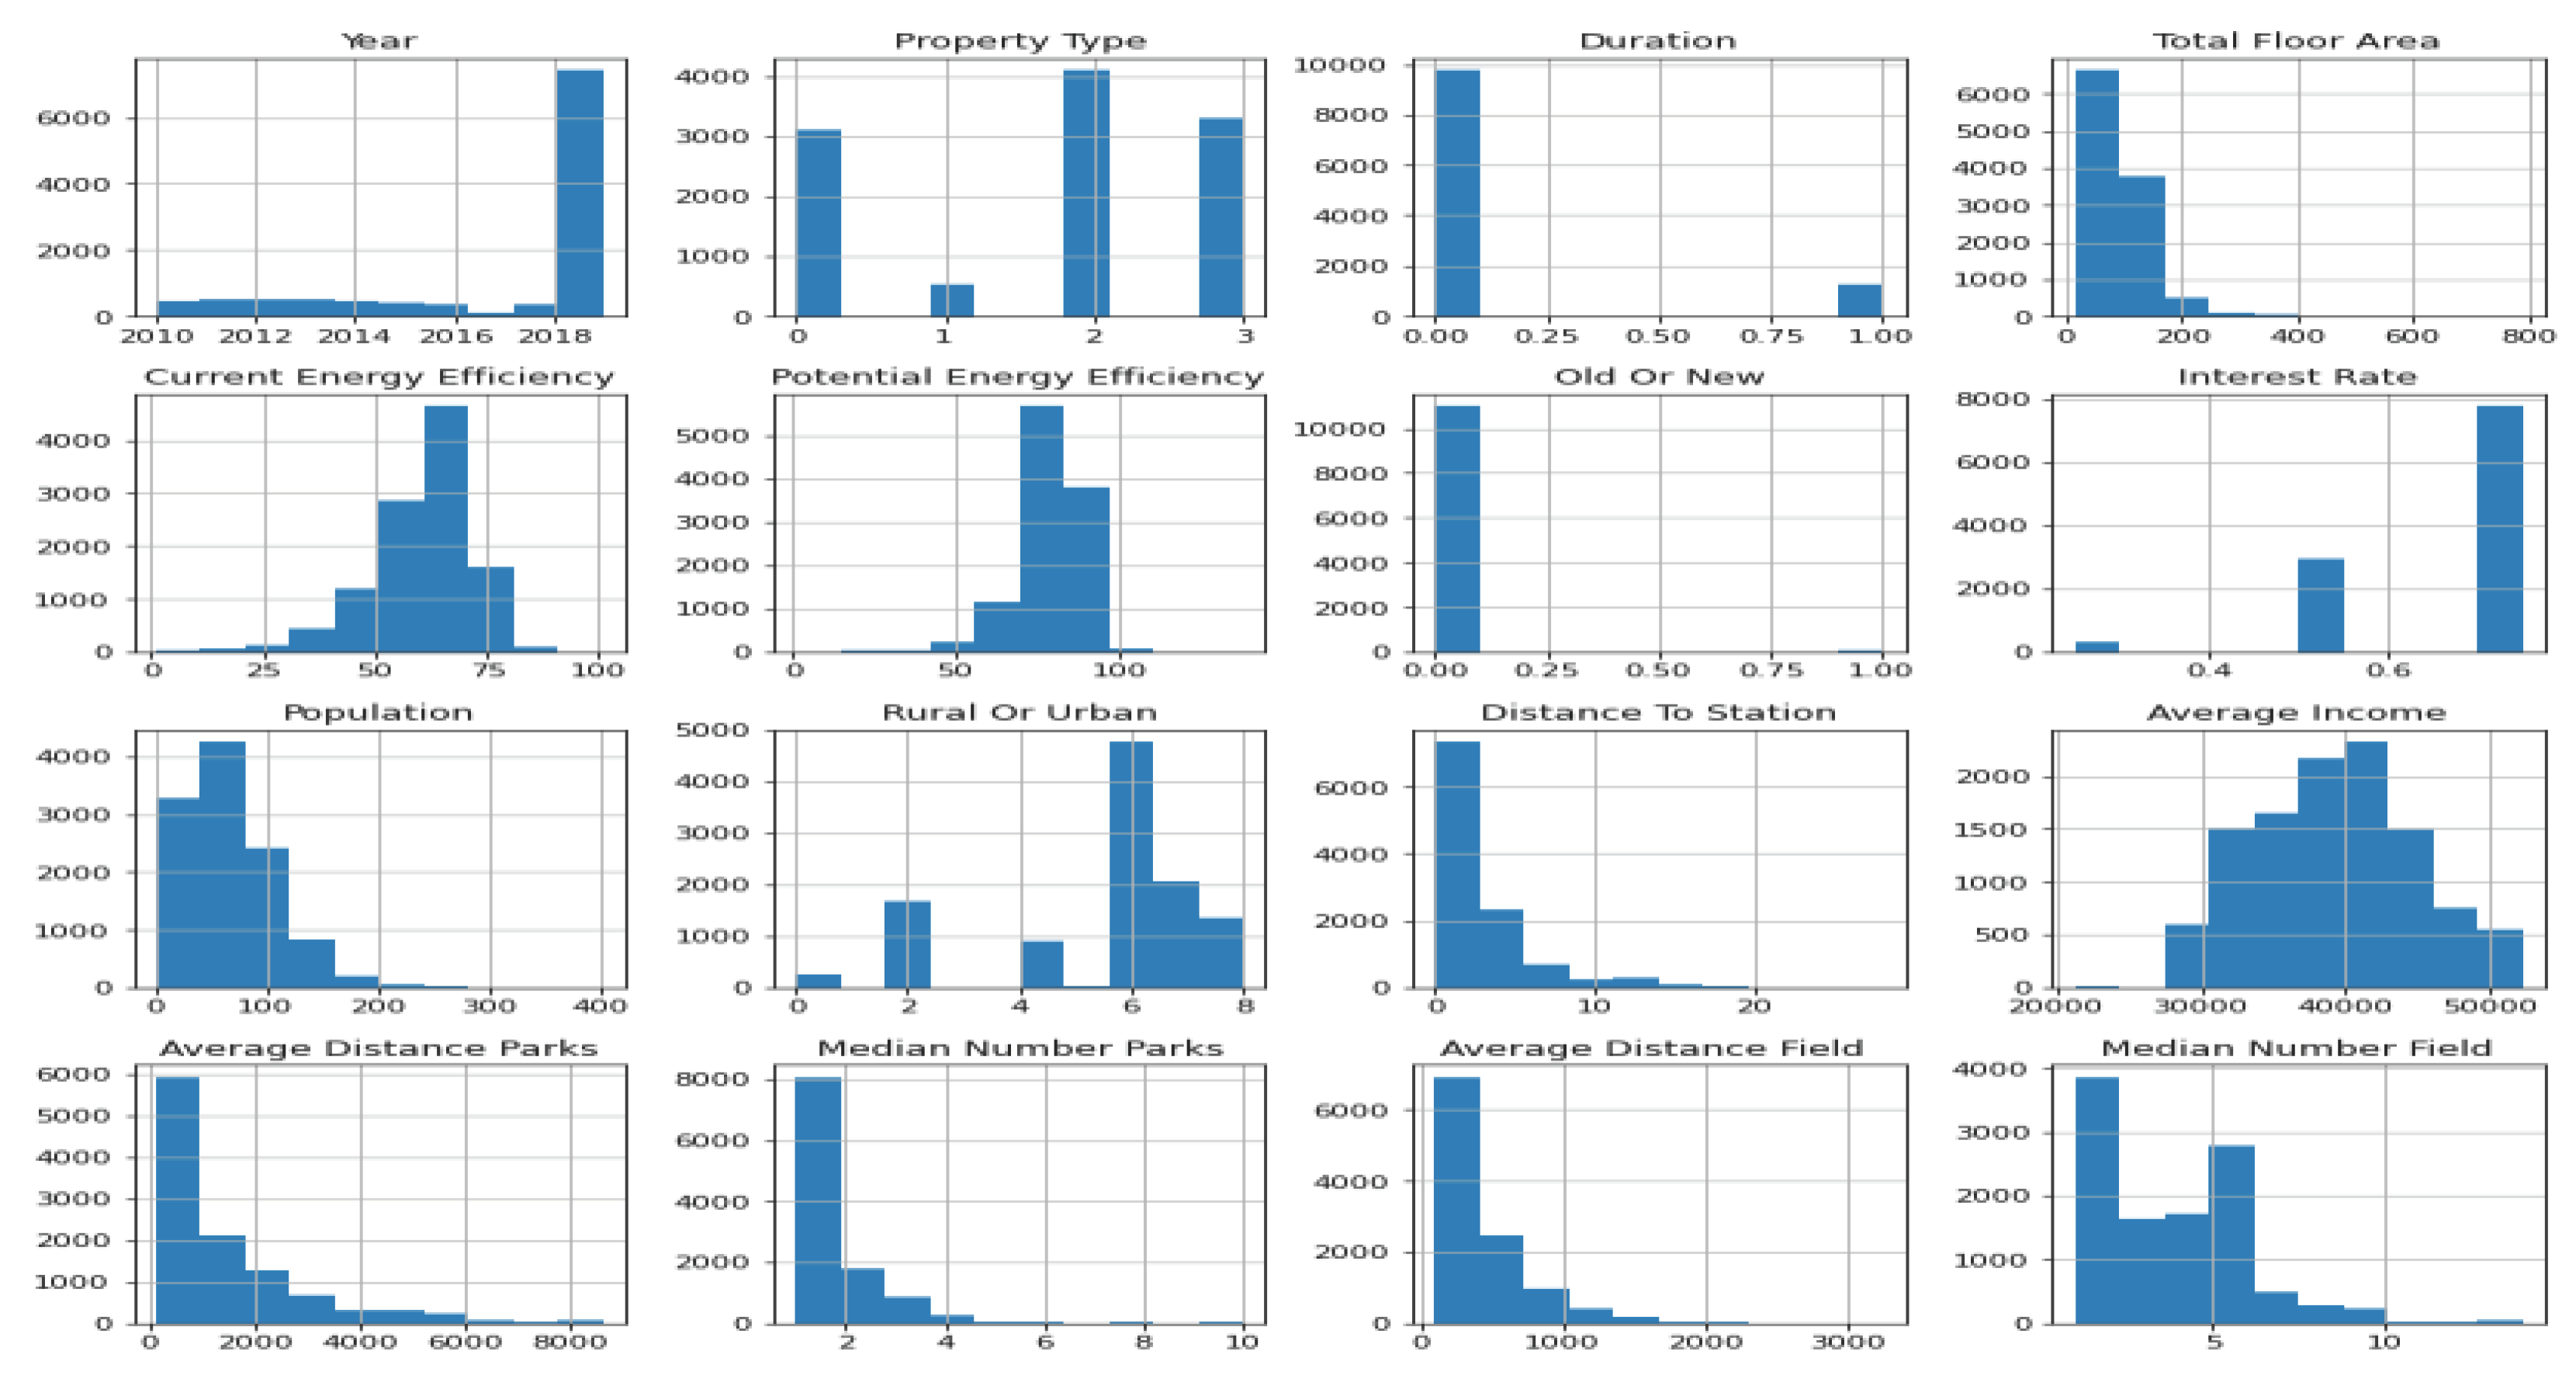
Figure 7.
The Frequency Distribution of the features: South East of England.
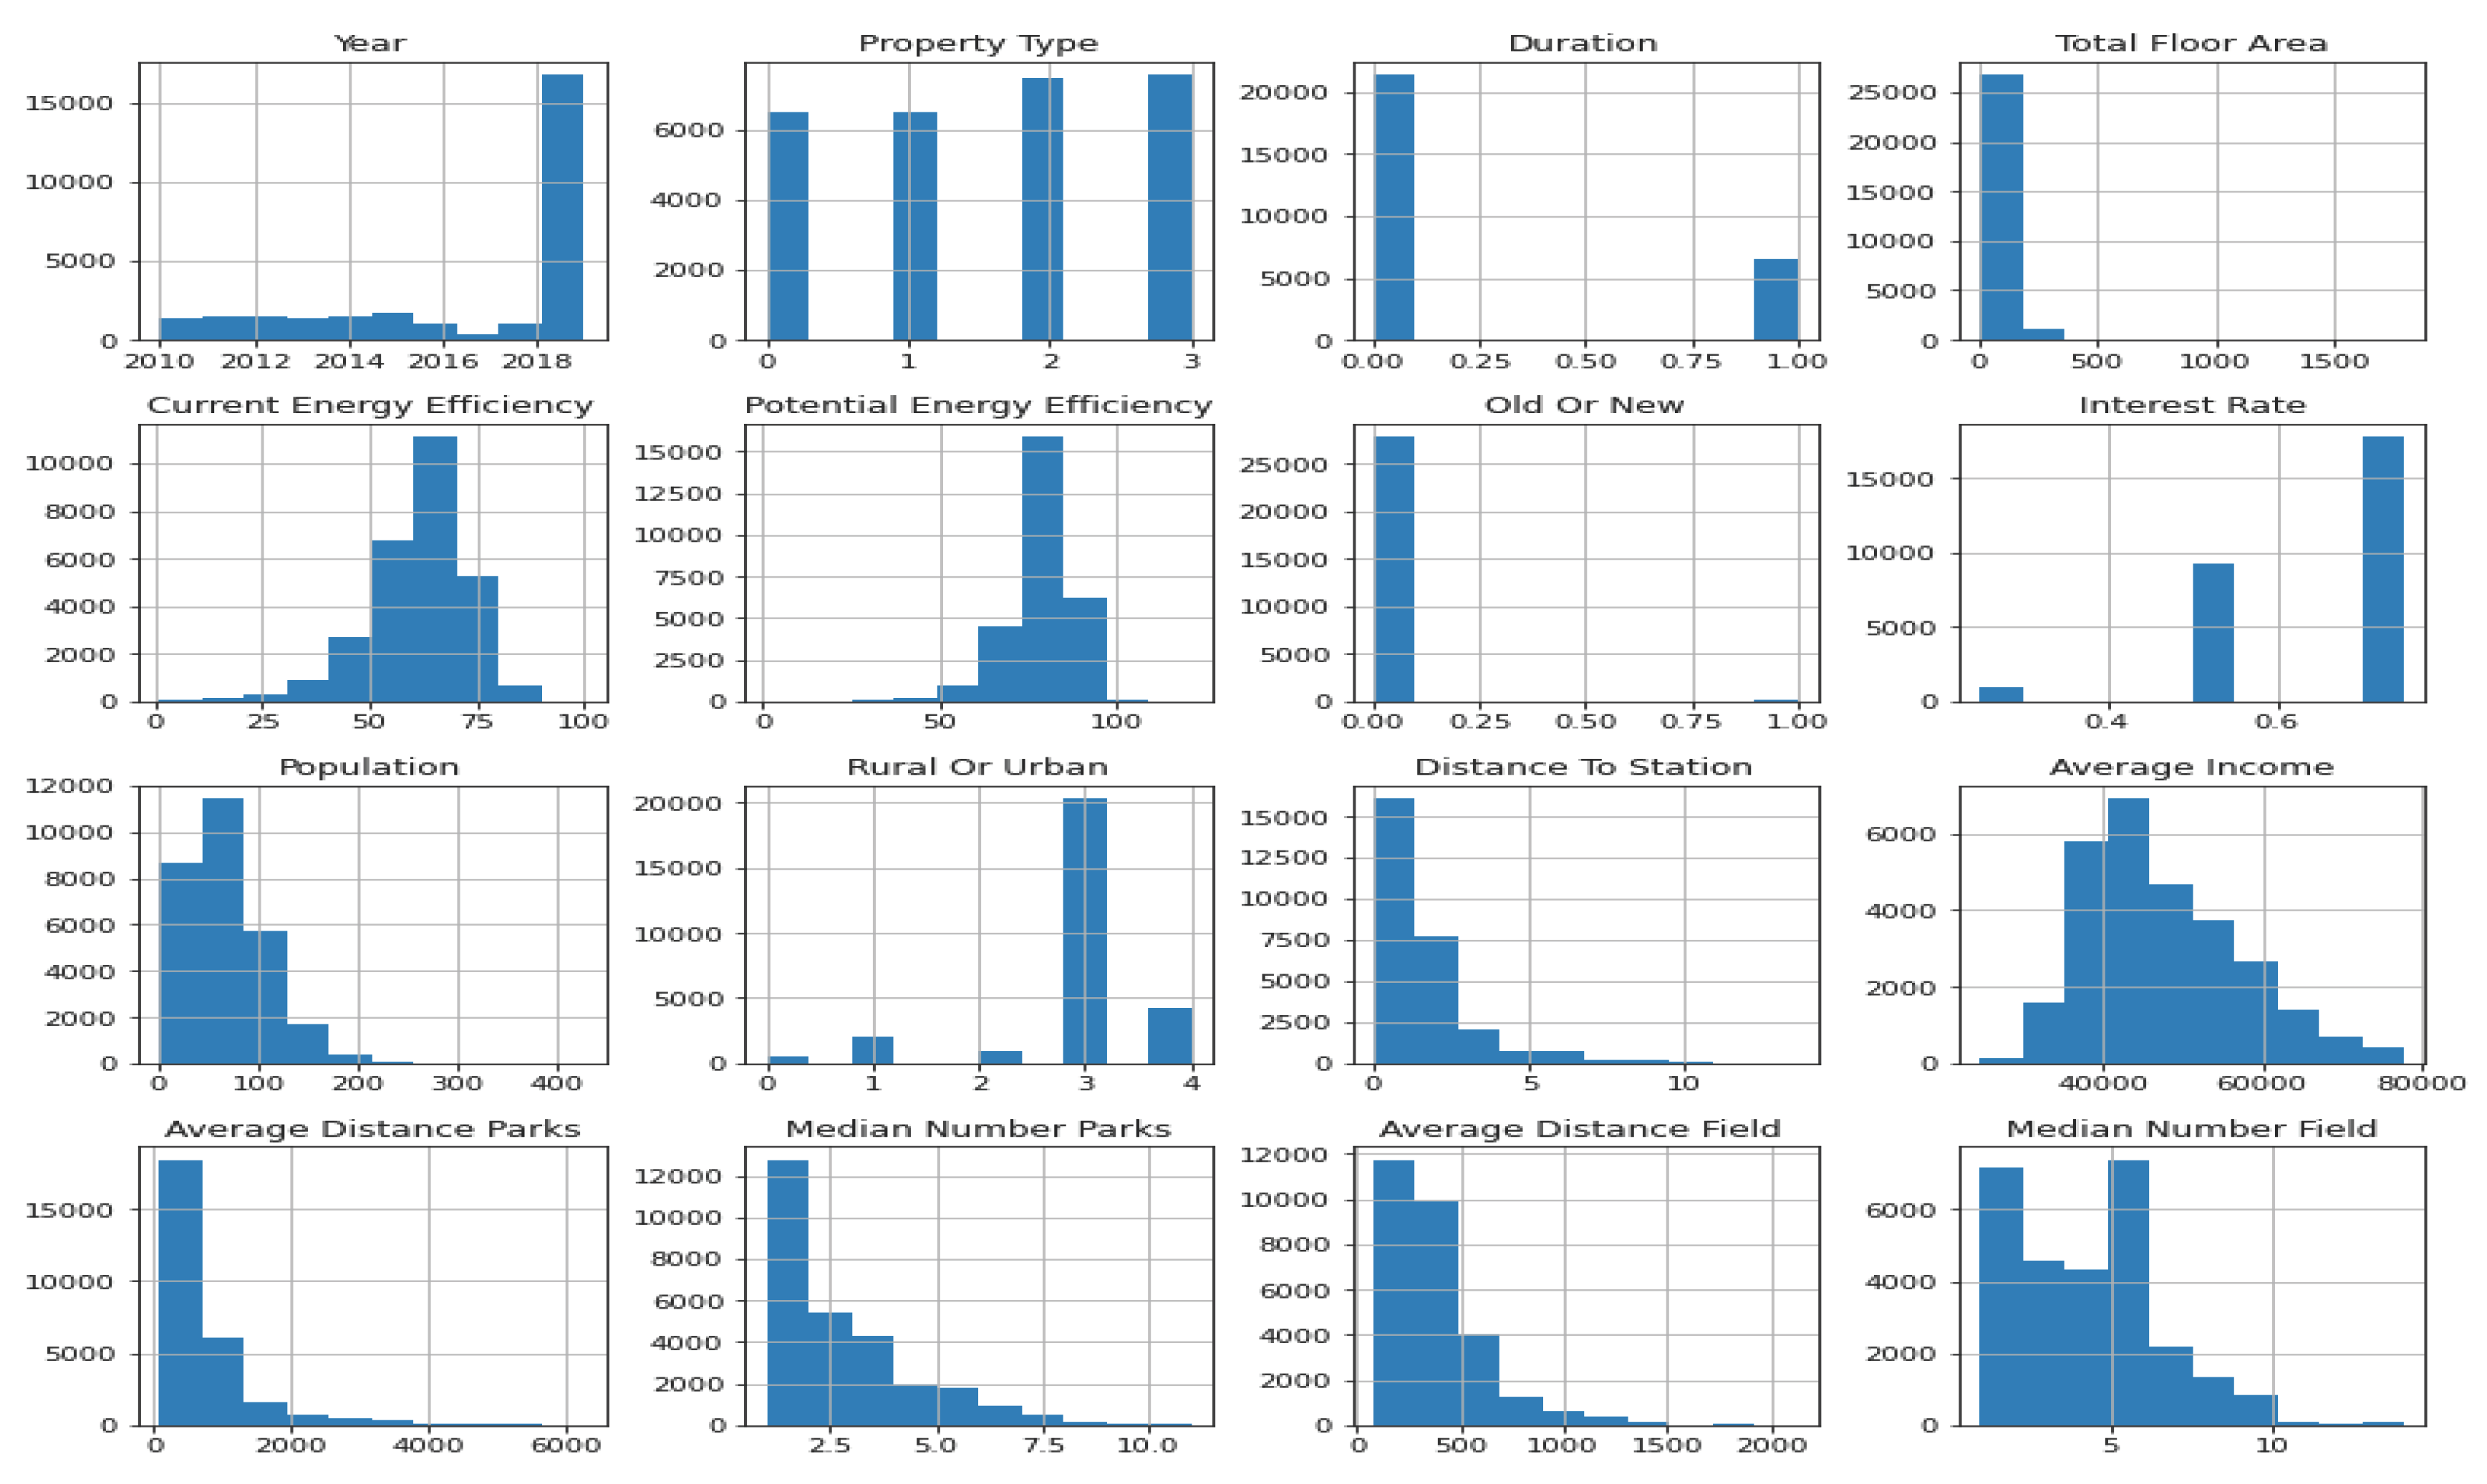
Figure 8.
The Frequency Distribution of the features: London.
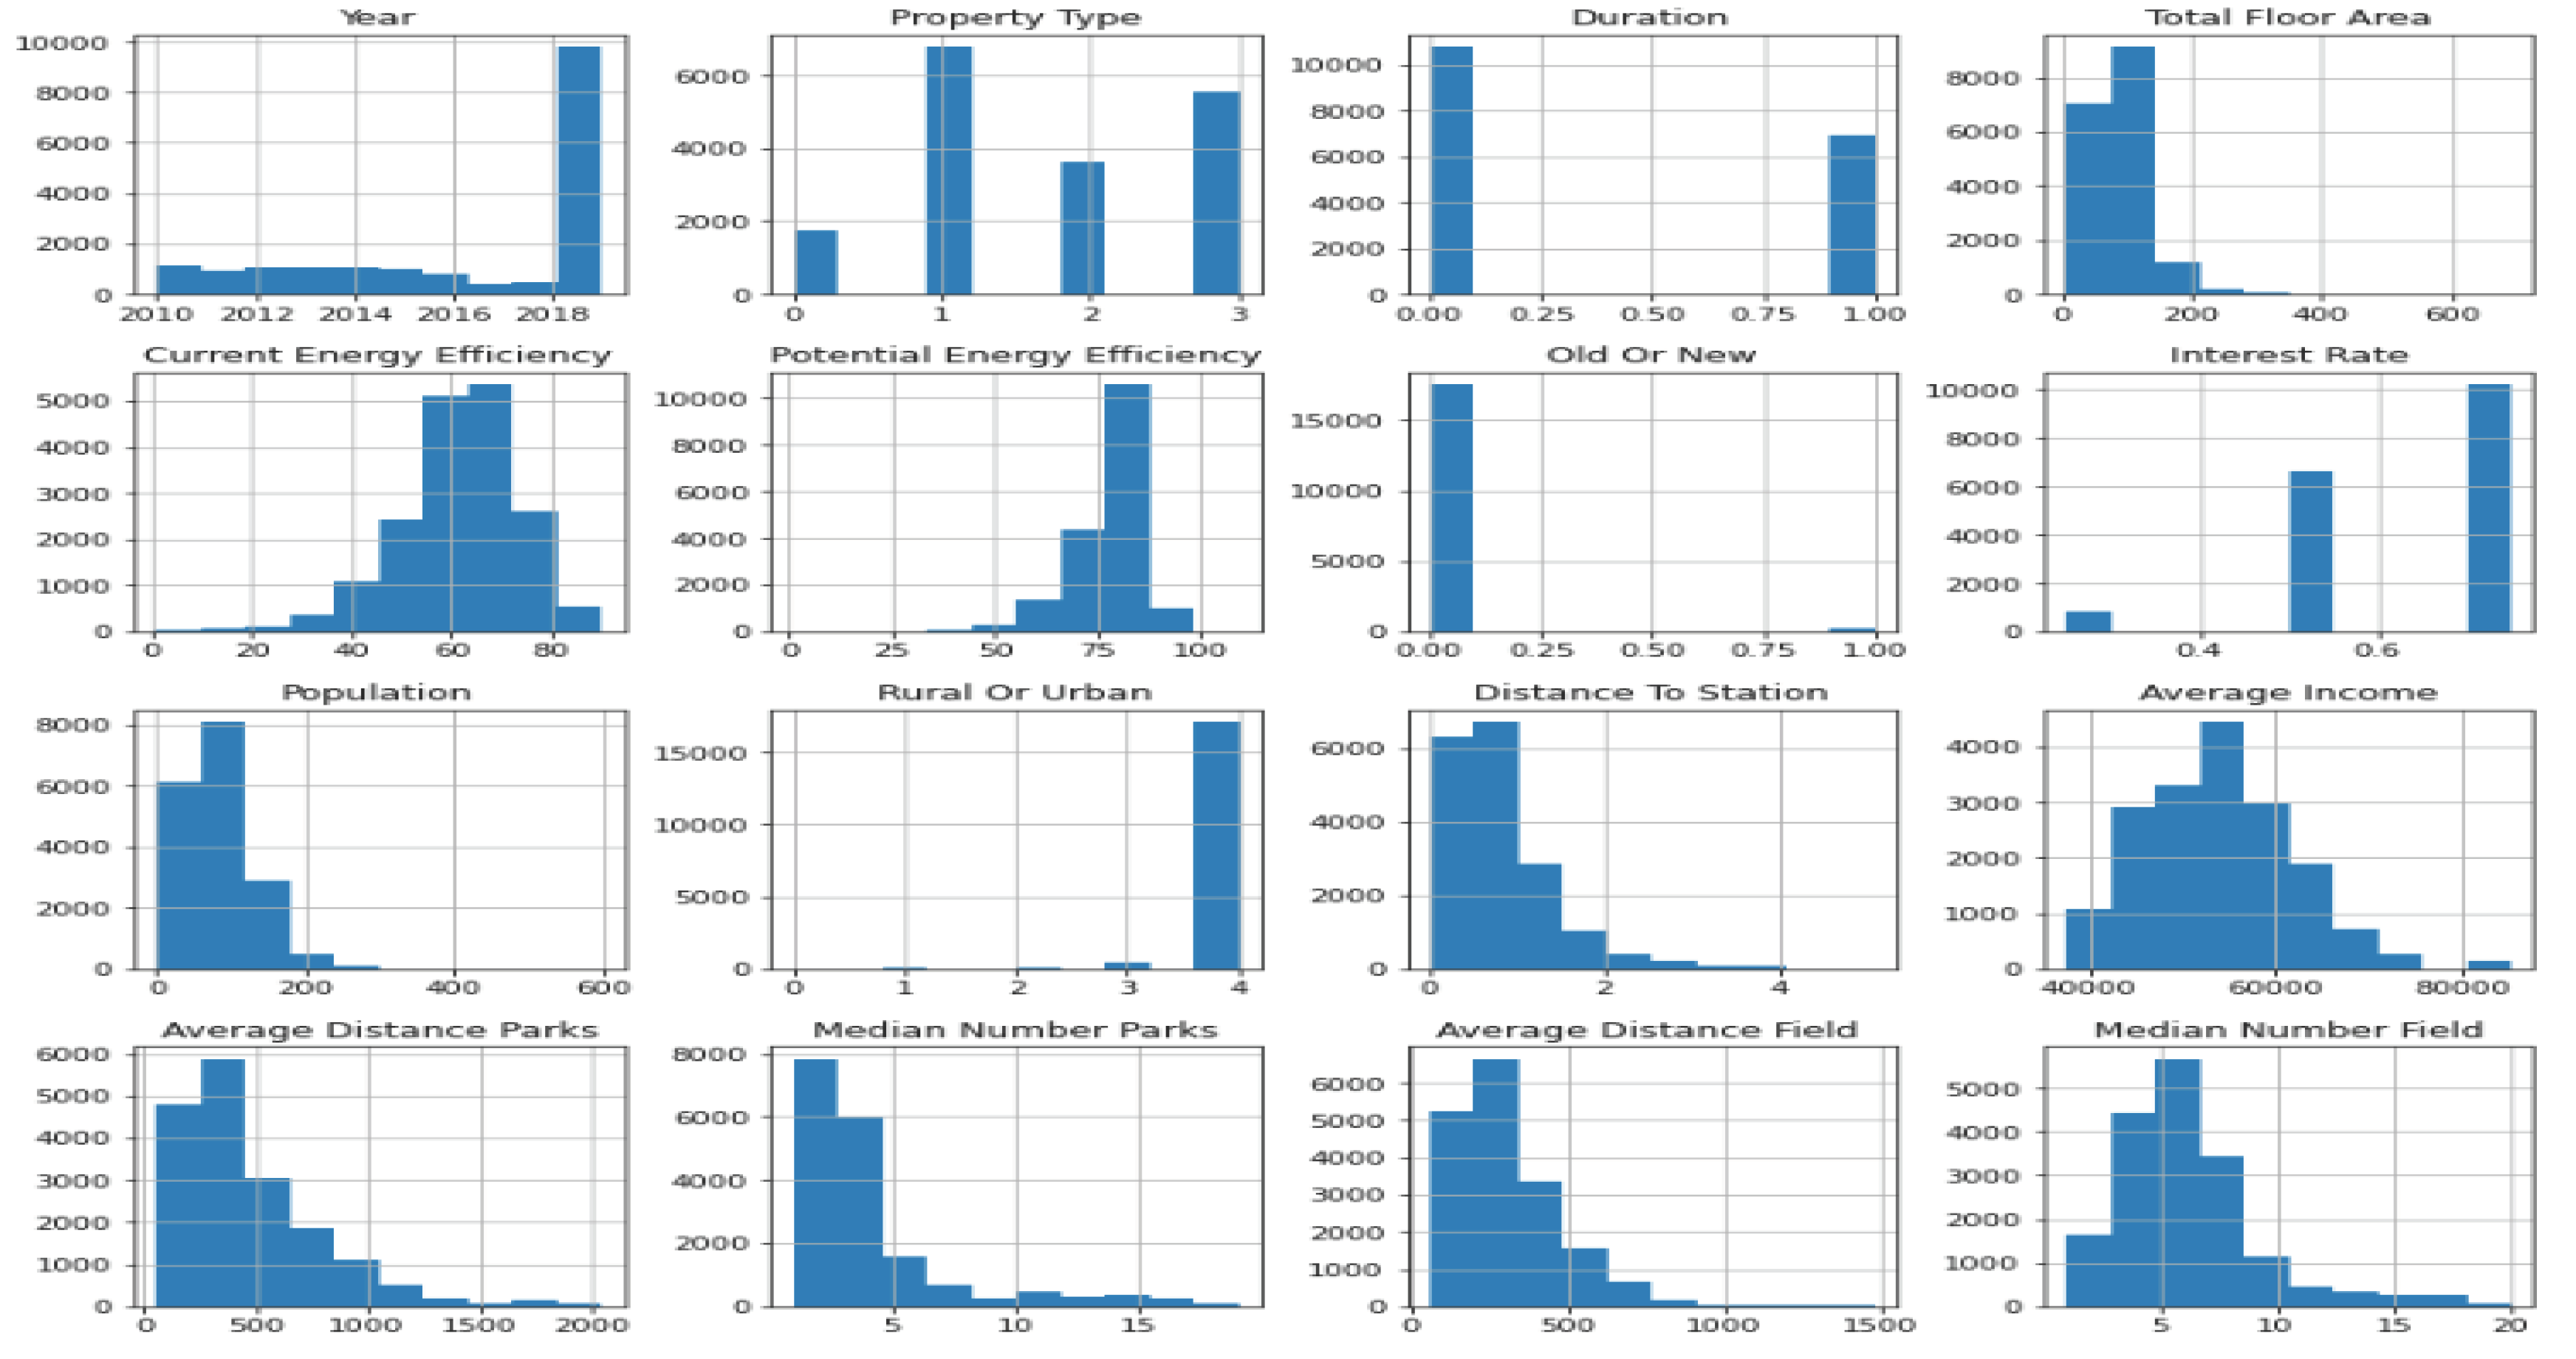

Table 1.
List of Data Set.
| Number | Name of table | Source | Geographic hierarchy |
|---|---|---|---|
| 1 | UK House Price from 1995 to 2017 | Land Registry https://www.gov.uk/guidance/about-the-price-paid-data |
Postcode |
| 2 | England base rate 1979-2017 Bank of England | Bank of England Official Bank Rate History https://www.bankofengland.co.uk/boeapps/database/Bank-Rate.asp |
|
| 3 | Gross Disposable Household Income (GDHI) per head of population at current basic price (1997 to 2017). | Office for National Statistics (ONS, 2021) https://www.ons.gov.uk/economy/regionalaccounts/grossdisposablehouseholdincome/bulletins/regionalgrossdisposablehouseholdincomegdhi/1997to2017 |
Regional Level |
| 4 | Postcode Headcounts and Household Estimates - 2011 Census | Office for National Statistics https://www.ons.gov.uk/peoplepopulationandcommunity/populationandmigration/populationestimates/datasets/2011censusheadcountsandhouseholdestimatesforpostcodesinenglandandwales |
Postcode |
Table 2.
All the features or Variables for the machine learning algorithms.
| Data item | Explanation (where appropriate) |
|---|---|
| Price Per Square Area | in square meters |
| Price | Housing sale price specified on the transfer deed. |
| Year | Completion date of the house sale as recorded on the transfer deed. |
| Postcode | It is the post code recorded at the time of the Sale. |
| Property Type | D = Detached, S = Semi-Detached, T = Terraced, F = Flats/Maisonettes, O = Other |
| Old Or New | Specifies the age of the house and relates to all price paid sales, non-residential and residential Y = a newly built house, N = an established residential building |
| Duration | This has to do with the tenure: L= Leasehold, F = Freehold etc. |
| Total Floor Area | in square meters |
| Number Of Rooms | |
| Latitude | |
| Longitude | |
| Population | in tenth |
| Households | |
| MSOA | Middle Layer Super Output Area |
| Rural Or Urban | |
| IMD | Index Of Multiple Deprivation |
| Distance To Station | |
| Quality | |
| LSOA | Lower Layer Super Output Area |
| Average Income | pound |
| Average Distance Parks | Average distance to nearest park or public garden (m) |
| Median Number Parks | Median number of parks and public gardens in 1,000 m radius |
| Average Distance Field | Average distance to nearest park or public garden or playing field (m) |
| Median Number Field | Median number of parks and public gardens and playing fields within 1,000 m radius |
| Potential Energy Efficiency | |
| Current Energy Efficiency | |
| Region | |
| Postcode Area | |
| Interest Rate |
Table 3.
The R_Squared values for the 4 regions considered in England.
| Regions | R-squared |
|---|---|
| York | 0.913 |
| South East England | 0.908 |
| North East England | 0.845 |
| London | 0.926 |
Table 4.
The variables that are statistically significant by regions.
| York | South East England | North East England | London |
|---|---|---|---|
| Year | Year | Property Type | Year |
| Property Type | Property Type | Duration | Property Type |
| Duration | Duration | Total Floor Area | Duration |
| Postcode | Total Floor Area | Current Energy Efficiency | Postcode |
| Total Floor Area | Current Energy Efficiency | Potential Energy Efficiency | Total Floor Area |
| Current Energy Efficiency | Potential Energy Efficiency | Interest Rate | Current Energy Efficiency |
| Interest Rate | Interest Rate | Population | Potential Energy Efficiency |
| Population | Population | MSOA | Old or New |
| LSOA | MSOA | Distance To Station | Interest Rate |
| Average Income | Rural Or Urban | LSOA | Population |
| Average Distance Parks | LSOA | Average Income | MSOA |
| Median Number Parks | Average Income | Average Distance Field | Rural Or Urban |
| Average Distance Field | Median Number Parks | Distance To Station | |
| Median Number Field | Average Distance Field | LSOA | |
| Median Number Field | Average Income | ||
| Average Distance Parks | |||
| Median Number Parks | |||
| Average Distance Field | |||
| Median Number Field[DP1] |
Table 6.
The variables that are not statistically significant by regions.
| York | South East England | North East England | London |
|---|---|---|---|
| Old Or New | Old Or New | Old Or New | Population |
| MSOA | Postcode | Postcode | Rural Or Urban |
| Distance To Station | Distance To Station | Year | |
| Potential_Energy_Efficiency | Average Distance Parks | Average Distance Parks | |
| Rural Or Urban | Rural Or Urban | ||
| Median Number Parks | |||
| Median Number Field | |||
Table 7.
The Performance metrics result of London.
| Accuracy Training Dataset | Accuracy Test Dataset | MAE | MSE | RMSE | |
|---|---|---|---|---|---|
| Catboost Modelling | 0.93 | 0.92 | 57206.13 | 8634971075.26 | 92924.55 |
| Gradient Boosting Modelling | 0.95 | 0.94 | 58100.19 | 9039008051.25 | 95073.70 |
| Random Forest Modelling | 0.97 | 0.97 | 63472.69 | 11412995478.65 | 106831.62 |
| Bagging Modelling | 0.96 | 0.96 | 67157.41 | 12478228588.71 | 111705.99 |
| Extra Tree Modelling | 0.99995742 | 0.99996333 | 62722.57 | 10594822494.29 | 102931.15 |
| K Nearest Neighbour | 0.42 | 0.36 | 105393.98 | 23500114089.14 | 153297.47 |
| Artificial neural network (ANN) | 0.69 | 0.70 | 72055.89 | 13692922445.71 | 117016.76 |
Table 8.
The Performance metrics result of North East of England.
| Accuracy Training Dataset | Accuracy Test Dataset | MAE | MSE | RMSE | |
|---|---|---|---|---|---|
| Catboost Modelling | 0.94 | 0.93 | 27949.50 | 2045005470.94 | 92924.55 |
| Gradient Boosting Modelling | 0.96 | 0.96 | 27941.77 | 2078620579.04 | 45591.89 |
| Random Forest Modelling | 0.96 | 0.96 | 29216.17 | 2546272818.35 | 50460.61 |
| Bagging Modelling | 0.95 | 0.94 | 31351.48 | 2922195661.99 | 54057.34 |
| Extra Tree Modelling | 0.999 | 0.999 | 28581.57 | 2319013654.12 | 48156.14 |
| K Nearest Neighbour | 0.46 | 0.40 | 40591.47 | 4561387630.17 | 67538.05 |
| Artificial neural network (ANN) | 0.10 | 0.23 | 36507.80 | 4451194801.00 | 66717.28 |
Table 9.
The Performance metrics result of Yorkshire.
| Accuracy Training Dataset | Accuracy Test Dataset | MAE | MSE | RMSE | |
|---|---|---|---|---|---|
| Catboost Modelling | 0.94 | 0.94 | 29800.33 | 2235504818.96 | 47281.13 |
| Gradient Boosting Modelling | 0.96 | 0.96 | 29860.13 | 2385737831.62 | 48844.02 |
| Random Forest Modelling | 0.97 | 0.98 | 30835.19 | 2410152520.95 | 49093.30 |
| Bagging Modelling | 0.96 | 0.97 | 32369.18 | 2749485237.01 | 52435.53 |
| Extra Tree Modelling | 0.9998 | 0.9999 | 30532.97 | 2358225634.50 | 48561.57 |
| K Nearest Neighbour | 0.42 | 0.36 | 44280.62 | 5446350837.94 | 73799.40 |
| Artificial neural network (ANN) | 0.80 | 0.77 | 32067.49 | 2630997906.78 | 51293.25 |
Table 10.
The Performance metrics result of South East of England.
| Accuracy Training Dataset | Accuracy Test Dataset | MAE | MSE | RMSE | |
|---|---|---|---|---|---|
| Catboost Modelling | 0.92 | 0.92 | 46672.64 | 7892542250.45 | 88839.98 |
| Gradient Boosting Modelling | 0.95 | 0.94 | 46572.09 | 7965198433.66 | 89247.96 |
| Random Forest Modelling | 0.97 | 0.97 | 51823.78 | 9703789163.98 | 98507.81 |
| Bagging Modelling | 0.96 | 0.96 | 54467.37 | 10018417668.38 | 100092.05 |
| Extra Tree Modelling | 0.9999 | 0.9999 | 52019.27 | 9921407318.15 | 99606.26 |
| K Nearest Neighbour | 0.52 | 0.46 | 76937.46 | 16912925841.32 | 130049.71 |
| Artificial neural network (ANN) | 0.65 | 0.61 | 58174.53 | 10562884875.36 | 102775.90 |
Disclaimer/Publisher’s Note: The statements, opinions and data contained in all publications are solely those of the individual author(s) and contributor(s) and not of MDPI and/or the editor(s). MDPI and/or the editor(s) disclaim responsibility for any injury to people or property resulting from any ideas, methods, instructions or products referred to in the content. |
© 2024 by the authors. Licensee MDPI, Basel, Switzerland. This article is an open access article distributed under the terms and conditions of the Creative Commons Attribution (CC BY) license (http://creativecommons.org/licenses/by/4.0/).
Copyright: This open access article is published under a Creative Commons CC BY 4.0 license, which permit the free download, distribution, and reuse, provided that the author and preprint are cited in any reuse.


