
Submitted:
10 December 2024
Posted:
11 December 2024
You are already at the latest version
Abstract
Two related P-type ATPases designated as ATPase1 and ATPase3 have been identified in Plasmodium falciparum. These two ATPases exhibit very similar gene and protein structures and are most similar to P5B-ATPases. There are some differences in the predicted substrate-binding sites of ATPase1 and ATPase3 which suggest different functions for these two ATPases. Orthologues of ATPase3 were identified in all Plasmodium species including the related Hepatocystis and Haemoproteus. ATPase3 orthologues could also be identified in all apicomplexan species, but no clear orthologues were identified outside of the Apicomplexa. In contrast, ATPase1 orthologues were only found in the Laverania, avian Plasmodium species, and Haemoproteus. ATPase1 likely arose from a duplication of the ATPase3 gene early in the evolution of malaria parasites. These results support a model in which early malaria parasites split into two clades. One clade consists of mammalian malaria parasites and Hepatocystis but excludes P. falciparum and related Laverania. The other clade includes Haemoproteus, avian Plasmodium species, and Laverania. This contrasts to recent models which suggest all mammalian malaria parasites form a phylogenetic group and all avian malaria parasites form a separate phylogenetic group. ATPase1 may be a useful taxonomic/phylogenetic character for the phylogeny of Haemosporidia.
Keywords:
P-type ATPase
; Plasmodium
; Laverania
; Haemoproteus
; Hemosporidia
; Apicomplexa
; malaria parasite
; phylogeny
; evolution
1. Introduction
P-type ATPases are part of a large and ubiquitous family of membrane proteins that move substances, especially cations and lipids, across biological membranes using the hydrolysis of ATP to provide the motive force [1]. The name P-type refers to transient phosphorylation of a specific aspartate residue during ATP hydrolysis. This switching between the phosphorylated and unphosphorylated states results in conformation changes that move substrates across the membranes. Thus, P-type ATPases are also known as E1-E2 ATPases in reference to the distinct molecular states that are involved in transport.
P-type ATPases are defined by distinct structural domains that include six core transmembrane helices (cTM), an actuator (A) domain, a phosphorylation (P) domain, and a nucleotide-binding (N) domain. Other domains that are not universally found in all P-type ATPases include a variable number of supporting transmembrane helices (sTM), N-terminal domains, or C-terminal domains. The helices of the cTM domain are numbered sequentially 1-6 and they form a channel that opens to the luminal or extracellular side of the membrane and serves as the substrate-binding site. The fourth cTM helix is disrupted in the middle with a highly conserved proline and this disruption, or kink, in the helix forms part of the substrate-binding site. A conformation change during the phosphorylation-dephosphorylation cycles allows passage of the substrate through this kink to the cytoplasmic side of the membrane. The A-domain contains the intrinsic phosphatase activity and is composed of sequence on the N-terminal side of cTM helix 1 (cTM1) and sequence between cTM2 and cTM3. The P- and N-domains are formed by a large loop between cTM4 and cTM5. The P-domain consists of sequences closest to these two transmembrane helices and the N-domain lies between the two parts of the P-domain. A defining feature of P-type ATPases is the phosphorylated aspartate (D) site which has the highly conserved motif of DKTGT.
P-type ATPases are classified into six distinct types based on sequence homology, configuration of the sTM domains, presence or absence of N-terminal or C-terminal domains, and substrate specificity [1,2]. These types are numbered 1-6 and subtypes are designated with capital letters. The sequence homology is based on eight highly conserved regions, designated as cores A-H [2]. Core D is equivalent to cTM4. Outside of the core sequences and cTM helices, the different types of P-type ATPases exhibit distinct features. For example, P5-ATPases have four sTM helices on the C-terminal side of the cTM and additional membrane associated helices on the N-terminal side of the cTM. These N-terminal membrane helices form a loop (nMHL) that consists of two or three short helices which do not traverse the lipid bilayer. In addition, between the nMHL and cTM1 is a region called the N-terminal domain (NTD). P5-ATPases are divided into two subclasses designated as P5A and P5B [3].
Plasmodium falciparum has at least two P5-ATPases which are designated as PfATPase1 [4] and PfATPase3 [5]. An orthologue of ATPase3 has also been identified in P. yoelii [6]. Both of these ATPases are type-P5B [3]. Based on immunofluorescence ATPase 3 is expressed predominantly in gametocytes in both P. falciparum [5] and P. yoelii [6]. However, ATPase3 mRNA expression appears to be expressed in the asexual stages [5,7]. ATPase1 is also expressed in blood-stage asexual parasites [4]. Immunofluorescence studies reveal a diffuse staining throughout the cytoplasm of the parasite for both ATPase1 and ATPase3 [4,5,6] which suggests an association with a cytoplasmic organelle.
Further characterization of these two Plasmodium ATPases reveal that ATPase3 is found in all apicomplexan species, whereas ATPase1 is only found in the subgenus Laverania and avian malaria parasites including Haemoproteus. Laverania consists of P. falciparum and several species of parasites that infect chimpanzees and gorillas [8]. The relationship of Laverania to mammalian or avian parasites has been long debated [9]. Characterization of the synteny, phylogeny and structures of these two Plasmodium P5B-ATPases indicate that ATPase1 likely arose from a duplicative transposition of ATPase3 early in the evolution of the malaria parasite. These results support a shared common ancestor between Laverania and avian haemosporidian parasites.
2. Results
2.1. ATPase1
The first P-type ATPase to be cloned and sequenced from the human malaria parasite P. falciparum was designated as PfATPase1 (X65738) [4]. Complete orthologues of this gene were identified from seven species of the Laverania subgenus, the avian parasites P. gallinaceum and P. relictum, and Haemoproteus tartakovskyi. However, no orthologues of ATPase1 in other mammalian malaria parasites nor Hepatocystis were found. There were inconsistencies in the proposed introns of the genes from P. billcollinsi and P. praefalciparum, and these sequences were not used in alignments. Alignment of the other five Laverania sequences, the two avian parasite sequences, and the H. tartakovskyi sequence revealed common features of P-type ATPases including the eight P-type ATPase sequence cores (A-H) and the six core transmembrane helices (Supplemental Figure S1). As previously noted [5], ATPase1 is most similar to the type-P5 ATPases due to the configuration of the supporting transmembrane helices and conserved amino acids. A membrane associated loop is found at the N-terminus and four supporting transmembrane helices are found at the C-terminus. In addition, ATPase1 has an extended phosphorylation sequence motif (FDKTGT[L/I]T), typical of the type-P5 ATPases [2], and ATPase1 has a PPxxP motif in the kink of cTM4, as is observed in many type-P5 ATPases [1]. In general, the conversed regions are most consistent with the type-P5B ATPases as previously noted [3].
Four rather large variable regions on the cytoplasmic face of the protein are also found within the ATPase1 sequence (Supplemental Figure S1). The greatest amount of variation is observed between the Laverania clade and the avian parasite clade including Haemoproteus. Within the clades there is substantial sequence homology. As is often the case [10,11,12], these variable regions exhibit a high level of low complexity sequence and tandem repeats. The first variable region is between the N-terminal membrane helical loop (nMHL) and the first core transmembrane helix (cTM1). It is characterized by tandem repeats in most of the Laverania sequences and an especially long insert of tandem repeats in P. blacklocki. Variable region 2 is found within the A-domain and occupies most of the sequence between sequence cores B and C. Variable region 3 is between core E and core F. There is a region of conserved sequence before core F that is interrupted by a small asparagine-rich insert of in the Laverania sequences. Variable region 4 is located between core F and core G and a stretch of approximately 110 conserved amino acids is found within variable region 4.
2.2. ATPase3
An ATPase with similarities to ATPase1 has been cloned and sequenced from P. falciparum (Rozmajzl et al., 2001) and P. yoelii (Kimura et al., 1999) and designated as ATPase3. Rozmajzl et al. (2001) identified the eight cores (A-H) found in P-type ATPases (Axelsen and Palmgren, 1998) and detected twelve predicted membrane spanning helices (Rozmajzl et al., 2001). ATPase3 orthologues are found in all Plasmodium species, as well as Hepatocystis and a partial sequence was identified in Haemoproteus (Appendix A). Alignment of the complete sequences reveals the typical features of P-type ATPases including the eight core regions and the six core transmembrane helices (Supplemental Figure S2). In addition, the four supporting transmembrane helices at the C-terminus and the N-terminal membrane loop are also present. Originally, two supporting transmembrane helices at the N-terminal of PfATPase3 were predicted (Rozmajzl et al., 2001). This difference in the previously predicted membrane helices is likely due to the more sophisticated programs that are now available and the increased knowledge about P-type ATPase structure. Furthermore, the predicted three-dimensional structures of ATPase3 are consistent with two or three short helices at the N-terminal supporting membrane helices (see below). ATPase3 also has the phosphorylation site consensus sequence of FDKTGT[L/I]T as is typical of P5-ATPases (Axelsen and Palmgren, 1998). However, in core D the substrate-binding site is typically defined by a PPxxP motif in P5-ATPases (Palmgren, 2023) and the Plasmodium ATPase3 has a PxxxP motif as commonly found in type-P2A, type-P2B, or type-P3 ATPases. Notwithstanding this difference in the substrate-binding kink, ATPase3 is clearly a type-P5 ATPase and shows the most similarity to type-5B as previously noted (Møller et al., 2008). Previous phylogenetic analysis of ATPase1 and ATPase3 also indicate that both are type-P5 ATPases (Rozmajzl et al., 2001).
The unrooted phylogenetic tree generated from complete sequences of Plasmodium ATPase3 is characterized by long branches emanating from a central region and radiation into species (Figure 1). These branches form seven clades that somewhat correspond to host species. The seven clades are: 1) the subgenus Laverania which are parasites of the great apes including the human pathogen P. falciparum; 2) the vivax-like clade consisting of parasites that infect non-human primates primarily from Asia; 3) the rodent parasite clade, 4) the avian parasite clade; 5) the ovale clade, consisting of P. ovale curtisi and P. ovale wallikeri; 6) the malariae clade consisting of P. malariae and P. brasilianum; and 7) the Hepatocystis clade with just a single available sequence thus far. ATPase3 of P. malariae and P. brasilianum have identical sequences which is consistent with the high degree of sequence identity previously reported between these two species (Bajic et al., 2022), and thus, P. brasilianum ATPase3 was not investigated further.
The seven clades all emerge from near the center of the unrooted tree and the phylogenetic relationships between the clades are not clear. This tree structure is observed in many Plasmodium genes and reflects the current understanding of Plasmodium phylogeny (Loy et al., 2017). In the regions corresponding to the transmembrane helices and the eight cores there is a high level of sequence homology between all the species. However, there are also large regions of variable sequence which tends to be conserved between the species within a clade, but not conserved between the clades (Supplemental Figure S2). This ATPase3 structure of highly conserved domains interrupted by variable sequence that is clade specific possibly accounts for the tree topology consisting of long branches between the clades and shorter branches within a clade.
ATPase1 and ATPase3 exhibit substantial homology in the eight core regions and the transmembrane helices, and the variations between ATPase1 and ATPase3 are primarily in the variable regions. In addition, the introns of ATPase1 and ATPase3 are located in almost the same position near or within supporting transmembrane helix 3. As found in ATPase1 there are four large variable regions in ATPase3 which were previously designated as inserts (Rozmajzl et al., 2001). The variable regions of ATPase3, as for ATPase1, are characterized by a large amount of low-complexity sequence, including tandem repeats. Also, as observed in ATPase1, the variable regions are conserved between species within a clade and sequence divergence within a clade is often associated with tandem repeat variations (Supplemental Figure S2). Within variable region 4 there is a short stretch of approximately 13 amino acids that is conserved in Plasmodium species but missing in Hepatocystis. The four variable regions are essentially in the same positions for both ATPase1 and ATPase3. A notable difference between ATPase1 and ATPase3 is an extended N-terminus in ATPase3. Overall, the structure of these two genes is very similar and ATPase1 and ATPase3 are almost certainly related to each other, and ATPase1 likely arose from a duplicative transposition of ATPase3 (see below).
2.3. Non-Plasmodium Orthologues
PfATPase3 and PfATPase1 were used as query sequences in BLAST searches of the NCBI non-redundant sequences, excluding Plasmodium and Hepatocystis sequences, to identify potential orthologues in other species. The highest scoring ATPase3 hits based on E-values were from Babesia and Theileria (Table 1). The next highest scoring hits after the piroplasmids are from the coccidians. There was also a rather high-scoring hit from the colpodellid Vitrella brassicaformis. Colpodellids are predatory apicomplexans found at the base of the apicomplexan clade [14]. There was a single hit from Cryptosporidium, but its E-value was substantially less than the other apicomplexans, and further investigation of this sequence revealed probable and substantial sequence errors (Supplemental Table S1) and was not investigated further. The high scores among apicomplexan sequences and the lower scores from other species suggest that there may be ATPase3 orthologues in the Apicomplexa, especially the piroplasmids which are a sister group to the haemosporidians [15]. Complete sequences from these apicomplexans were obtained (Supplemental Table S1) and used in additional phylogenetic analyses (see below).
ATPase3 queries also detected several sequences from oomycetes and fungi (Table 1). Oomycetes are stramenopiles, a sister group to the alveolates, which with the rhizarians form the SAR clade, whereas fungi are opisthokonts [16,17]. The phylogenetic relationship between SAR and Opisthokonta is unknown and this relationship likely dates back to the base of the eukaryote tree. The similar and overlapping E-values of the oomycetes and fungi, and their much lower values than the apicomplexan sequences suggest that none of these sequences are true orthologues. Furthermore, the lack of hits from neither ciliates nor dinoflagellates also suggests that the oomycetes sequences are not orthologs of ATPase3. Apicomplexans, dinoflagellates, and ciliates form the alveolates with apicomplexans and dinoflagellates forming sister groups combined in the myzozoans [14]. Therefore, the lack of apparent ATPase3 orthologues in the ciliates and dinoflagellates would necessitate at least two separate losses of this gene, if there are true ATPase3 orthologues in the oomycetes. Thus, ATPase3 is likely restricted to apicomplexans.
The E-values of the highest-scoring hits using ATPase1 as the query were substantially lower than those hits of ATPase3, and there were no hits shared between ATPase1 and ATPase3. The majority of the ATPase1 hits were from fungi and the highest scoring hit was from an insect (Table 1). There were a few ATPase1 hits within the Apicomplexa, but they were all different proteins than those identified by ATPase3, and these E-values were substantially lower. These included a hit from V. brassicaformis (Acc. No. CEL93221.1), a single coccidian sequence from Besnoitia besnoiti (Acc. No. XP_029221545.1), and a hit from Cardiosporidium cionae (Acc. No. KAF8819569.1). C. cionae is a parasite of sea squirts that may be related to piroplasmids [18]. The C. cionae hit is a partial sequence corresponding to the C-terminal region which consists primarily of supporting transmembrane helices. Without sequence data from the core ATPase sequences, it is not possible to determine if this C. cionae sequence is related to ATPase1, and therefore, it was not investigated further. Likewise, further investigation into the other apicomplexan sequences and representative sequences from the ciliates suggests that these sequences are possibly P5-ATPases but are probably not orthologues of ATPase1. In particular, many of these sequences have extended N-terminal sequences not seen in ATPase1. Thus, no clear orthologues of ATPase1 were detected outside of Plasmodium and Haemoproteus.
2.4. Phylogeny of ATPase1 and ATPase3
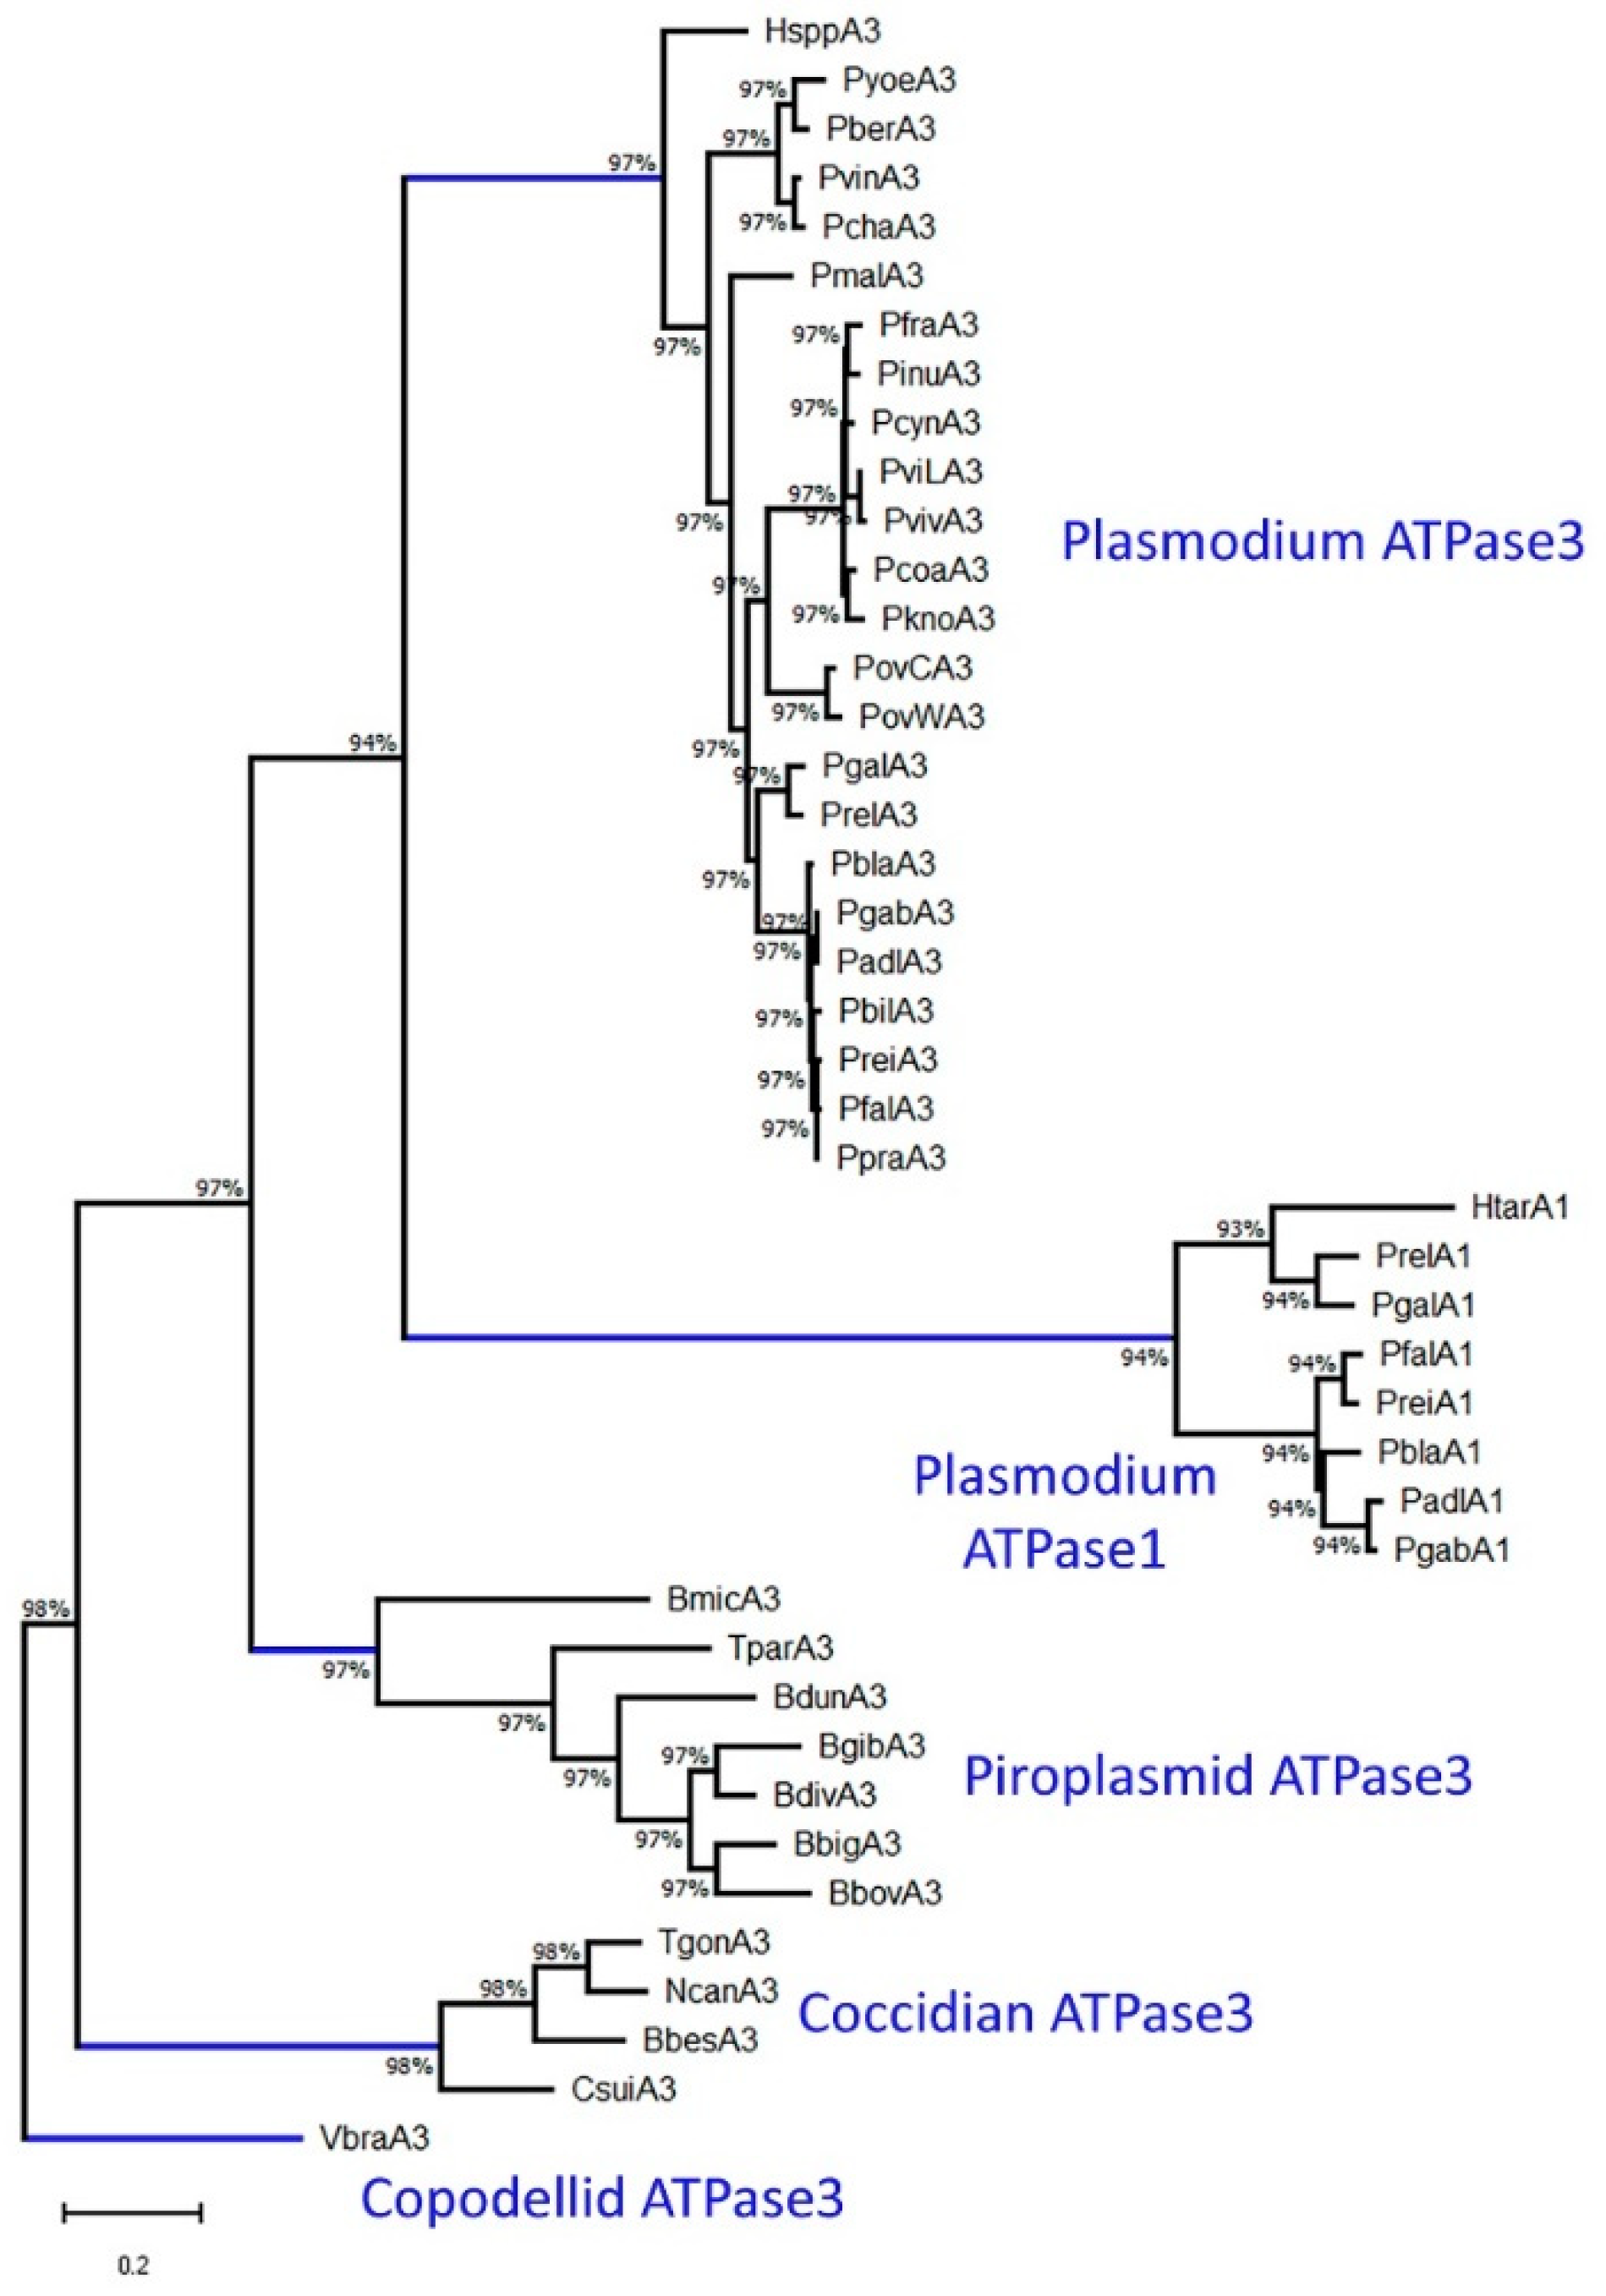
The complete ATPase1 and ATPase3 sequences were aligned and used to generate phylogenetic trees using Vitrella brassicaformis as the outgroup. Overall trees generated by Maximum Likelihood, Neighbor Joining, or Minimum Evolution had similar topology with minor differences (data not shown). Differences between these methods were primarily in the placement of Hepatocystis and Babesia microti, and the exact branching order of the ATPase3 sequences within Plasmodium. To minimize the effect of the variable regions, the variable regions were removed from the sequences and the resulting trees were similar to trees generated with complete sequences with similar minor differences (data not shown). The branching order exhibited by ATPase3 from the colpodellids, coccidians, piroplasmids, and malaria parasites (Figure 2) exhibited the expected and well-known phylogeny of the Apicomplexa [14]. This further corroborates that these apicomplexan ATPase3 sequences are true orthologues.
Plasmodium ATPase3 sequences did not branch in the expected order and the order varied slightly depending on the method used to generate the trees and whether complete or conserved sequences were used. However, this is of little consequence since molecular phylogeny based on single genes is rather unreliable. ATPase1 sequences consistently formed a sister clade with the Plasmodium ATPase3 sequences regardless of the methods or sequences used. The ATPase1 branch is also rather long compared to the other branches, thus implying that an accelerated rate of evolution occurred after the duplication. A faster rate of evolution following duplication was also reported for acyl-CoA synthetase paralogues of P. falciparum [19]. This accelerated divergence between ATPase1 and ATPase3 likely precludes the ability to place the ATPase1 clade within the Plasmodium ATPase3 clade as would be expected. Nonetheless, these phylogeny results demonstrate that the duplication and transposition of ATPase3 leading to the formation of ATPase1 likely occurred early in the evolution of malaria parasites.
Figure 2.
Phylogeny of ATPase1 and ATPase3 from Apicomplexa. The variable regions from the ATPase1 and ATPase3 sequences were removed and the remaining conserved domains were aligned with MUSCLE within MEGA XI [20]. A phylogenetic tree using Maximum Likelihood was generated from the alignment. Descriptions of the species are found in Supplemental Table S1 and bootstrap values are shown at the nodes. The five major clades (denoted in blue) are ATPase3 from colpodellids, ATPase3 from coccidians, ATPase3 from piroplasmids, ATPase3 from Plasmodium including Hepatocystis, and ATPase1 from Plasmodium including Haemoproteus.
2.5. Synteny of ATPase1 and ATPase3
The duplication of ATPase3 was further investigated by the characterization of synteny. ATPase1 and ATPase 3 are located in two different syntenic blocks on chromosome 5 in the Laverania species and on chromosome 10 in the avian parasites (Figure 3). The genes flanking ATPase3 are the same in all Plasmodium species and are the AN1-type zinc-finger protein and a conserved Plasmodium protein of unknown function. These same two genes also flank the ATPase3 of Hepatocysits on contig CABPSV020000075.1 (data not shown). This same ATPase3 syntenic block is found on chromosome 10 of the vivax-like parasites and P. ovale, chromosome 6 in P. malariae, and chromosome 11 of the rodent parasites. These chromosomal designations are consistent with the known synteny of Plasmodium chromosomes [21]. The synteny of ATPase3 from Haemoproteus tartakovskyi could not be determined since only a partial genomic sequence is available. No synteny of ATPase3 from the other apicomplexans with ATPase3 of Plasmodium was found. This is expected since a low level of synteny -- which is restricted to microregions -- between Babesia and Plasmodium has been previously reported [22].
ATPase1 is also found on chromosome 5 of Laverania species and chromosome 10 of avian malaria parasites and is immediately flanked by the 40S ribosomal protein S11 and a putative protein with a RAP (RNA-binding domain abundant in Apicomplexans) domain (Figure 3). As in Laverania and avian Plasmodium species, 40S ribosomal protein S11 is found on the 3’-side of the ATPase1 gene and in the opposite orientation in H. tartakovskyi (Appendix A). The gene on the 5’-side of H. tartakovskyi ATPase1 could not be determined due limited available DNA sequence on this side of the gene. This same syntenic block between the S11 ribosomal protein and RAP genes is found in the Plasmodium species without ATPase1 and is located on chromosome 10 of vivax-like parasites, P. ovale, and P. malariae, and located on chromosome 12 in the rodent parasite clade. These results are consistent with the known synteny of Plasmodium chromosomes [21]. Chromosome 5 of the Laverania species approximately corresponds to chromosome 10 of P. relictum, members of the vivax-like clade, and P. ovale. In P. malariae a portion of chromosome 10 has broken off to form chromosome 6. In the rodent malaria clade approximately half of the chromosome 5/10 syntenic block is associated with chromosome 11 and the other half of this block is associated with chromosome 12. In the clades in which these two syntenic blocks are located on the same chromosome, the distance between ATPase1 and ATPase3 is approximately a half-million base pairs.
2.6. Predicted Three-Dimensional Structures of ATPase1 and ATPase3
Select sequences of ATPase1 and ATPase3 genes that represent distinct apicomplexan and Plasmodium clades were used to search protein databases for proteins with similar 3-dimensional structures. Numerous proteins were identified with 100% confidence of homology, and the coverage in the top-scoring templates ranged from 30-56%. The regions that were not modeled were primarily in the N-terminal extension of ATPase3 and the variable regions of both paralogues (Supplemental Figure S3). The top-scoring templates were heavily shared among the various query sequences (Table 2), and most of the identified templates were designated as P5B-ATPases. Overall, the predicted structures of ATPase1 and ATPase3 are quite similar regardless of species or template. One exception is that the top-scoring template of ATPase3 from P. falciparum and Hepatocystis was a sodium-potassium pump from Sus scrofa (wild boar). Overall, this template was a rather low-ranked template among the various query sequences. This template produced predicted structures that were quite different from P5B-ATPases (data not shown) and was not investigated further.
Supplemental Figure S4a shows models generated from the top scoring templates, or the second highest scoring template in the case of ATPase3 from P. falciparum and Hepatocystis, for each of select sequences. In general, these predicted 3-dimensional structures were all quite similar and the major domains of P-type ATPases are readily identified. The most notable differences between the species are in the region that corresponds to the N-terminal membrane helix loop (nMHL). Overall, the 7m5x template of ATP13A2 generated the best consensus models for all the sequences (Supplemental Figure S4b). However, this template did exclude the N-terminal membrane loop and part of the N-terminal domain from the ATPase3 proteins of Laverania, Toxoplasma, and Cystoisospora. None of the templates included the N-terminal membrane helix loops in the Laverania (data not shown). Perhaps the rather long N-terminal extension or a rather large variable region 1 may interfere with the modeling.
Predicted 3-dimensional modeling was used to compare the substrate-binding sites of ATPase1 and ATPase3. In all P-type ATPases, the core transmembrane helices form a channel that faces the luminal (or extracellular) side of the ATPase and the central kink within cTM4 closes off this channel (Figure 4). The conformation change associated with the phosphorylation-dephosphorylation cycle opens an exit channel to the cytoplasm at the central kink. No overt differences between the structures of ATPase1 and ATPase3 were observed at the whole molecule level. ATP13A2 is a particularly well characterized P5B-ATPase [25] and the predicted structures of the ATPase1 and ATPase3 substrate-binding sites were compared to the known structure of ATP13A2 (PDB ID 7m5x). The substrate-binding site of ATP13A2 is stabilized by interactions between a tyrosine in cTM2, a tyrosine in cTM5, a glutamine in cTM5, and an aspartate in cTM6. An aspartate found at the boundary between cTM1 and cTM2 and another aspartate in cTM4 provide negative charges to interact with the positive charges of polyamines. Negative charges are also seen at the entrance to the luminal channel in Ypk9 [26]. ATPase1 is identical to ATP13A2 at these six key residues (Figure 5). Furthermore, the sequence of the central kink is nearly identical between ATPase1 and ATP13A2 with the consensus sequence of [I/V/L]PPALP.
ATPase3 deviates from ATPase1 in the key residues that make up the substrate-binding site (Figure 5). In the stabilization tetrad, the tyrosine in cTM5 and the aspartate in cTM6 are conserved allowing for conservative replacements of phenylalanine for tyrosine in cTM5 and glutamate for aspartate in cTM6 in the piroplasmids. The tyrosine in cTM2 is replaced by either serine, threonine, or alanine, and the polar glutamine in cTM5 is replaced with a hydrophobic residue (isoleucine or leucine). There is a polar residue (serine or threonine) adjacent to this position (except for the piroplasmids). The two aspartates that bind to polyamines are also absent in ATPase 3 and are replaced with either tryptophan or glycine. However, a negatively charged glutamate residue is found in the loop between cTM1 and cTM2 in ATPase3 from Plasmodium. In the other apicomplexan species this position is occupied by a polar group (serine or asparagine). A notable difference between ATPase1 and ATPase3 is a positively charged residue (lysine or arginine) in the loop between cTM1 and cTM2. In addition, the kink in ATPase3 deviates from ATPase1 with the consensus sequence of [L/V/A]P[V/I]WT[P/S]. These results suggest that ATPase1 and ATPase3 exhibit different substrate specificities.
3. Discussion
ATPase1 and ATPase3 are two related P-type ATPases that were initially identified in the malaria parasite [4,5,6]. Sequence alignments with the eight P-type ATPase cores (A-H), BLAST searches, and three-dimensional structure predictions are consistent with both of these ATPases being P5B-ATPases as previously reported [3]. Both ATPase1 and ATPase3 genes consist of two exons and the introns in both genes are located in almost exactly the same position. Both genes also contain four major variable regions that are located in the same positions. As with many Plasmodium genes [11,12], these variable regions tend to be low-complexity sequence and often contain tandem repeats of variable length. Differences between ATPase1 and ATPase3 include an extended and variable N-terminus in ATPase3, the predicted substrate-binding site, and species distribution. The presence of N-terminal extensions have been reported in other P5B-ATPases, and these extensions have been speculated to perform an auto-inhibitory role by folding back into the phosphorylation site [26]. The high degree of variability among the apicomplexan sequences, however, does question the functional significance of these N-terminal extensions.
P5-ATPases are the least characterized among the P-type ATPases. Two of the better characterized P5B-ATPases are Ypk9 of yeasts [26] and ATP13A2 of humans [25]. Both of these P5-ATPases are likely polyamine transporters that move polyamines from a lysosome-like compartment to the cytoplasm. However, it has also been proposed the Ypk9 plays a role in sequestration of heavy metals [27]. The primary lysosome-like compartment in the malaria parasite is the digestive vacuole [28]. The digestive vacuole of the malaria parasite has been extensively studied and a thorough proteomic analysis did not detect any P-type ATPases [29] suggesting that neither of these Plasmodium paralogues are in the digestive vacuole. However, previous immunofluorescence studies suggest that ATPase1 and ATPase3 are localized to an intracellular compartment [4,5,6]. ATPase1 was reported to also localize in the region of the parasite plasma membrane [4]. However, inspection of the published micrographs reveals a diffuse staining throughout the cytoplasm of the parasite that is similar to those published for ATPase3, and thus, ATPase3 does not appear to be plasma-membrane associated. The previous studies were all carried out with acetone-fixed thin blood smears which limits the resolution and ability to identify subcellular compartments. Therefore, without additional studies it is not possible to definitively assign ATPase1 or ATPase3 to a specific cellular compartment.
ATPase1 most likely arose from a duplication and transposition of ATPase3 in the early evolution of malaria parasites since ATPase3 orthologues are found throughout the Apicomplexa, and thus far, ATPase1 is only found in Haemoproteus, avian Plasmodium species, and Laverania. The observation that ATPase1 has been retained in these three distinct taxa suggests that ATPase1 has a functional role that has been maintained. Furthermore, the predicted differences in the substrate-bind sites of ATPase1 and ATPase3 imply distinct functions for these paralogues. Thus far, polyamines have been the most investigated substrates of P5B-ATPases and ATPase1 has a predicted substrate-binding site that is very similar to the polyamine-binding sites of ATP13A2 (Figure 5) and Ypk9 (data not shown). ATPase3 differs from ATPase1 in the predicted substrate-binding site and, in particular, there are fewer negatively charged sidechains in the binding site which would function to complex the positive amine groups of polyamines. In addition, the predicted binding site of ATPase3 from Plasmodium is slightly different than the predicted binding site of ATPase3 from the other apicomplexans (Figure 5).
Malaria parasites have the three core enzymes of polyamine biosynthesis which include ornithine decarboxylase, adenosylmethionine decarboxylase, and spermidine synthase [30]. Plasmodium is unique in that ornithine decarboxylase and adenosylmethionine decarboxylase are combined into a bifunctional enzyme. A search of PlasmoDB revealed that the bifunctional enzyme and spermine synthetase are found in all Plasmodium species, as well as Hepatocystis and Haemoproteus, and these enzymes are highly conserved (data not shown). These enzymes are presumably located in the cytoplasm since polyamines are needed for the modification of a translation elongation factor. In addition, polyamines are also taken up by the parasite directly into the cytoplasm via an electrogenic mechanism that depends on the parasite’s negative membrane potential [31]. Therefore, there is no need for a transporter to move polyamines to the parasite cytoplasm. Furthermore, it is likely that polyamine metabolism does not differ among the malaria parasites and a distinct polyamine transporter in some species is probably not needed. So, probably neither ATPase1 nor ATPase3 are polyamine transporters.
In the initial reports, ATPase3 was expressed predominantly in gametocytes as determined by immunofluorescence [5,6] and ATPase1 was only investigated in late ring and early trophozoite stages [4]. Analysis of mRNA expression for ATPase3 has maximal expression in either the late ring stage [7] or the trophozoite and schizont stages with no expression in the gametocyte stages [5]. Examination of the transcriptomic studies available through PlasmoDB [24] also reveals inconsistencies in the stage specificity of expression for both paralogues. Both genes appear to be expressed in all stages of the life cycle including the vector stages. Therefore, at this time nothing definitive can be said about the stage specificity of expression of either paralogue. Clearly more work is needed on the subcellular location, stage specificity of expression, and activity of these two paralogues.
3.1. Phylogenetic Implications of ATPase1
The presence of ATPase1 in Laverania, avian Plasmodium species, and Haemoproteus and its exclusion in all other Apicomplexa, including other mammalian Plasmodium species and Hepatocystis, strongly suggest that Laverania is more closely related to avian malaria parasites including Haemoproteus than to the other mammalian malaria parasites. The most parsimonious explanation is that ATPase3 underwent a duplicative transposition during the early evolution of the malaria parasite only in a lineage containing Laverania, avian Plasmodium species, and Haemoproteus. The combined phylogeny of ATPase1 and ATPase3 shows Plasmodium ATPase3 and ATPase1 diverging at the base of the Plasmodium clade (Figure 4) which is consistent with the appearance of ATPase1 early in the evolution of malaria parasites. In contrast, several genome-level molecular phylogenetic studies suggest that all malaria parasites of mammals form a single clade with the Laverania placed as a sister group to the other mammalian parasites, and the avian malaria parasites form a sister group to an exclusive mammalian parasite branch [32,33,34]. To make this molecular phylogeny congruent with the ATPase1 data would require subsequent losses of the ATPase1 gene in at least one mammalian parasite lineage in the appropriate time frame, and therefore is less parsimonious.
The availability of complete genome sequences has strengthened molecular phylogeny. For example, concatenated sequences from many genes provide more resolution and stronger statistical arguments. Despite the robust statistics, the methodology is nonetheless a summation of single genes, which tends to be unreliable. Indeed, one study using concatenated genes found a well-supported clade consisting of Laverania and avian malaria parasites [35]. Molecular phylogeny should be complemented with other approaches such as taxon-specific characters or gene synteny. Specific genes, such as ATPase1 described herein, could be considered as taxon-specific characters. The use of ATPase1 as a character changes the possible phylogeny of Plasmodium and Haemoproteus within the Haemosporidia (Figure 6).
Haemosporidia is a diverse group of blood parasites in reptiles, birds and mammals which are transmitted by blood-feeding dipterans. The phylogeny in this group is complicated and uncertain [36]. For example, among the three major clades within the Haemosporidia represented by Leucocytozoon, Haemoproteus, and Plasmodium, two (Haemoproteus and Plasmodium) are considered polyphyletic. The two characters used for the morphological phylogeny of haemosporidians are hemozoin and erythrocytic merogony. As previously noted [32], erythrocytic merogony is an unreliable character for phylogeny as it is sporadically observed throughout the hematozoans (Figure 6b). Furthermore, since in general cell division is regulated, merogony could be a phenotypic trait. For example, dormant blood-stage forms which do not replicate have been described in Plasmodium [37,38].
Clearly more sampling of avian and reptilian Plasmodium, Haemoproteus, and Leucocytozoon species is needed to resolve the phylogeny of Haemosporidia. Going forward it would be worthwhile to investigate the distribution of ATPase1 among these taxa. In addition, there may be other genes that could serve as reliable taxonomic characters. For example, Bohme et al (2018) identified 15 genes, including ATPase1, that appear to be restricted to Laverania and avian Plasmodium species [33]. Likewise, two orthologous clusters are shared between P. falciparum and H. tartakovskyi that are absent in other mammalian Plasmodium species [32]. One is an unknown protein (PF3D7_1004100) and the other is reticulocyte-binding protein homolog-1 (Pf3D7_0402300). A search for orthologues to these two proteins was carried out since numerous whole genomes have been added to the databases in the last eight years, including several Laverania species, P. relictum, and P. gallinaceum. The unknown protein has syntenic orthologues in the other Laverania, P. relictum, and P. gallinaceum (Ortholog Group: OG6_533697) and the reticulocyte-binding protein homolog-1 has syntenic orthologues only in Laverania (data not shown). Any of these genes may also prove to be reliable taxonomic characters and merit some further investigation.
4. Materials and Methods
4.1. BLAST Searches
ATPase1 (Acc. No. X65738) and ATPase3 (Acc. No. X65740) were used as queries in BLASTP searches (Johnson et al., 2008) searches of non-redundant protein sequences at NCBI. Initially, BLAST searches were restricted to members of the Haemosporidia to identify all ATPase1 and ATPase3 orthologues. Alignments associated with the BLAST results were used to eliminate partial sequences and sequences with obvious errors. Subsequently, the newly identified sequences were used as queries in BLAST searches to ensure that no complete sequences of ATPase1 and ATPase3 in the Haemosporidia were missed. In cases where complete sequences were available from multiple strains of a single species, the reference strain for that species was chosen as much as possible.
A partial genome sequence of Haemoproteus tartakovskyi is available [32] which is not part of the non-redundant database. Therefore, a TBLASTN search of those contigs was performed using ATPase1 and ATPase3 sequences from Plasmodium relictum. A complete ATPase1 sequence and a partial ATPase3 sequence were identified (Appendix A).
To identify orthologues in non-haemosporidian species the same strategy of BLAST searches was performed except haemosporidian species were excluded from the search. Supplemental Table S1 contains a description of all the sequences analyzed in this study.
4.2. Alignments and Tree Building
ClustalW at https://www.genome.jp/tools-bin/clustalw or alignment programs within Mega XI [20] were used to generate alignments. Alignments were adjusted manually to accommodate variable regions and core regions of P-type ATPases. Pairwise alignments with known P5-ATPase sequences were used to assist in identifying these cores. Separate alignments with the various Plasmodium clades were also used to optimize the alignments within variable regions. Potential transmembrane helices and membrane domains were identified with CCTOP [39].
4.3. Three-Dimensional Structure Predictions
The complete sequences were used to search for conserved three-dimensional structure using Phyre® [40]. Structures were generated using PyMOL® Molecular Graphics System, Version 3.0.4 (Schrödinger, LLC).
5. Conclusions
ATPase1 and ATPase3 are paralogous type-P5B ATPases of malaria parasites. ATPase3 is found throughout the Apicomplexa and thus far ATPase1 is only found in Laverania, avian Plasmodium species, and Haemoproteus. ATPase1 most likely arose from a duplication and transposition of ATPase3 early in the evolution of the malaria parasite and may be a useful taxonomic/phylogenetic character to decipher the phylogeny of Haemosporidia. Both ATPase1 and ATPase3 are likely associated with an intracellular compartment within the blood-stage parasite. The exact compartment, stage specific of expression, and substrate specificity of neither ATPase are known.
Supplementary Materials
The following supporting information can be downloaded at the website of this paper posted on Preprints.org. Supplemental Table S1: ATPase1 and ATPase3 sequences evaluated in this study; Supplemental Figure S1: Annotated alignment of ATPase1 from Plasmodium and Haemoproteus; Supplemental Figure S2: Annotated alignment of ATPase3 from Plasmodium species and Hepatocystis; Supplemental Figure S3: Alignment of select ATPase1 and ATPase3 sequences from Apicomplexa; Supplemental Figure S4; Three-dimensional modeling of select ATPase1 and ATPase3 sequences.
Author Contributions
Not applicable.
Funding
This research received no external funding.
Institutional Review Board Statement
Not applicable.
Informed Consent Statement
Not applicable.
Data Availability Statement
Contact author to receive data generated by this study.
Conflicts of Interest
The author declares no conflicts of interest.
Appendix A
Description of ATPase1 and ATPase3 from Haemoproteus tartakovskyi.
The genome of Haemoproteus tartakovskyi [32] was searched with ATPase1 and ATPase3 sequences at https://www.ncbi.nlm.nih.gov/datasets/genome/ GCA_001625125.1/. ATPase1 identified a single contig of 18,840 bases (LSRZ01000339.1). The ATPase1 coding sequence started at position 17,290 and ended at position 10,048 (Figure A1). A single intron was located at positions 10,705-10,377 (Figure A2) in the exact same location as other Plasmodium ATPase1 genes. As expected, no genes were found on the short 5’-side of the ATPase1 gene. The next gene on the 3’-side of ATPase1 is the 40S ribosomal protein S11 gene and following that is the putative tRNA pseudouridine synthase gene (Figure A1), which are the same two genes found in Plasmodium species.
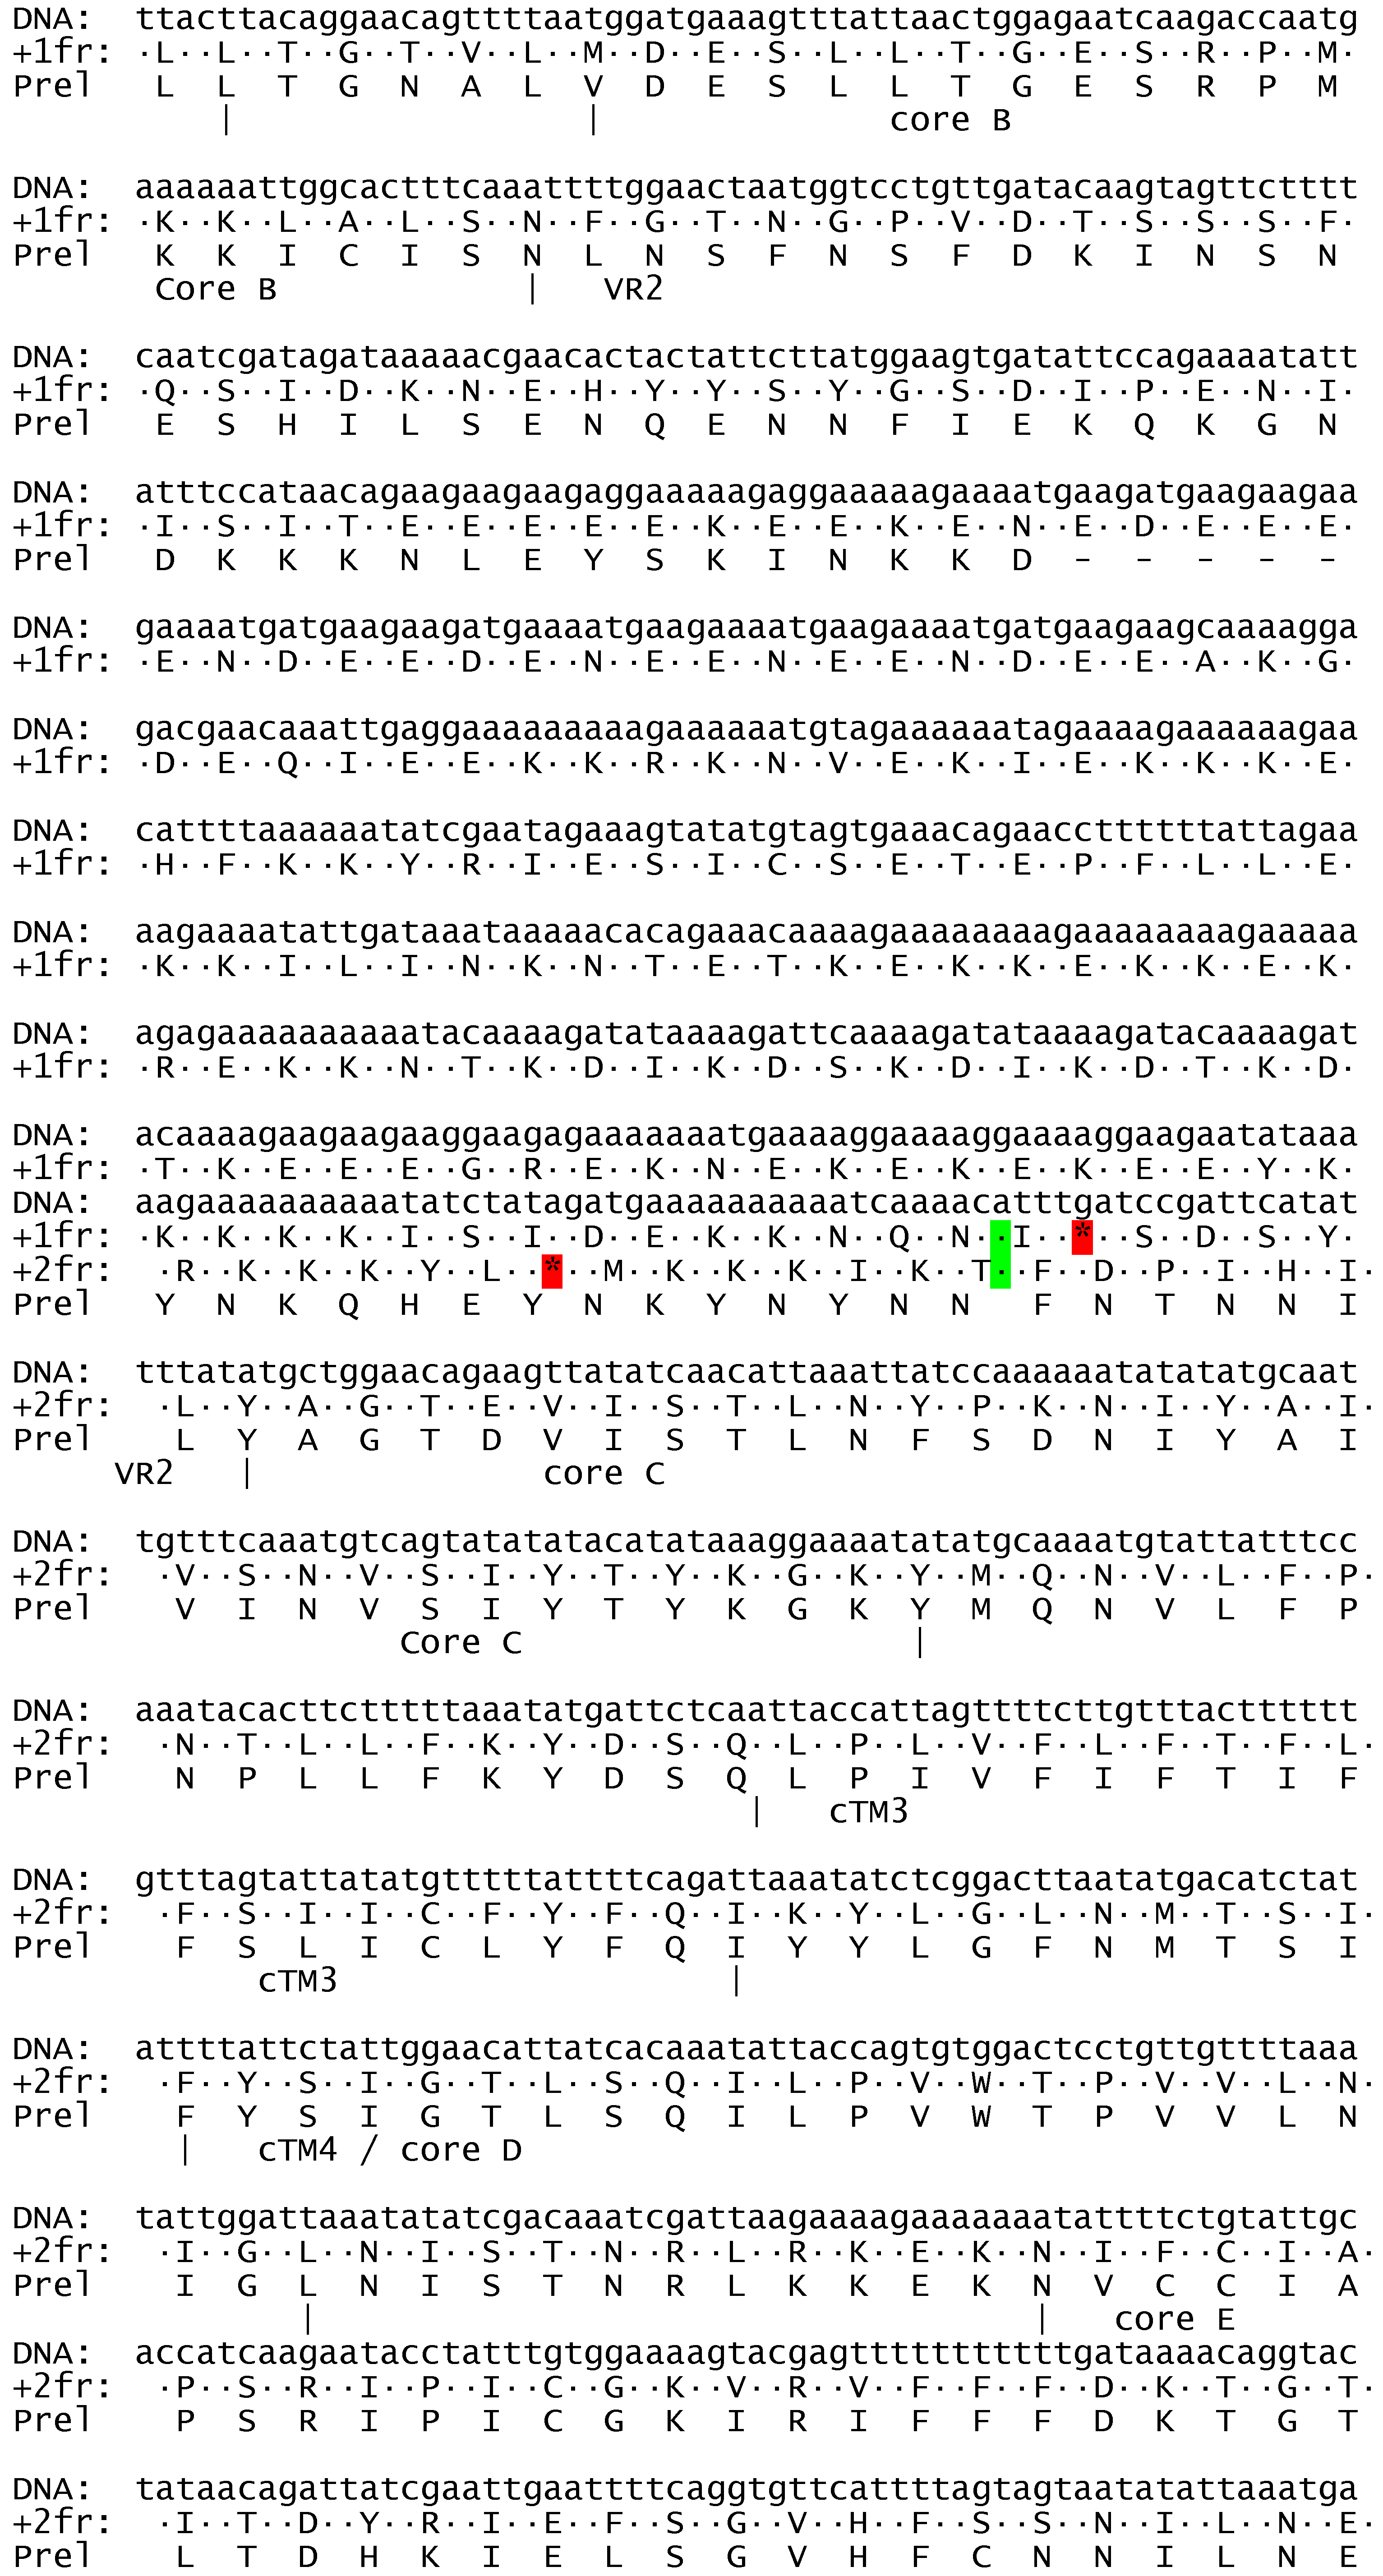
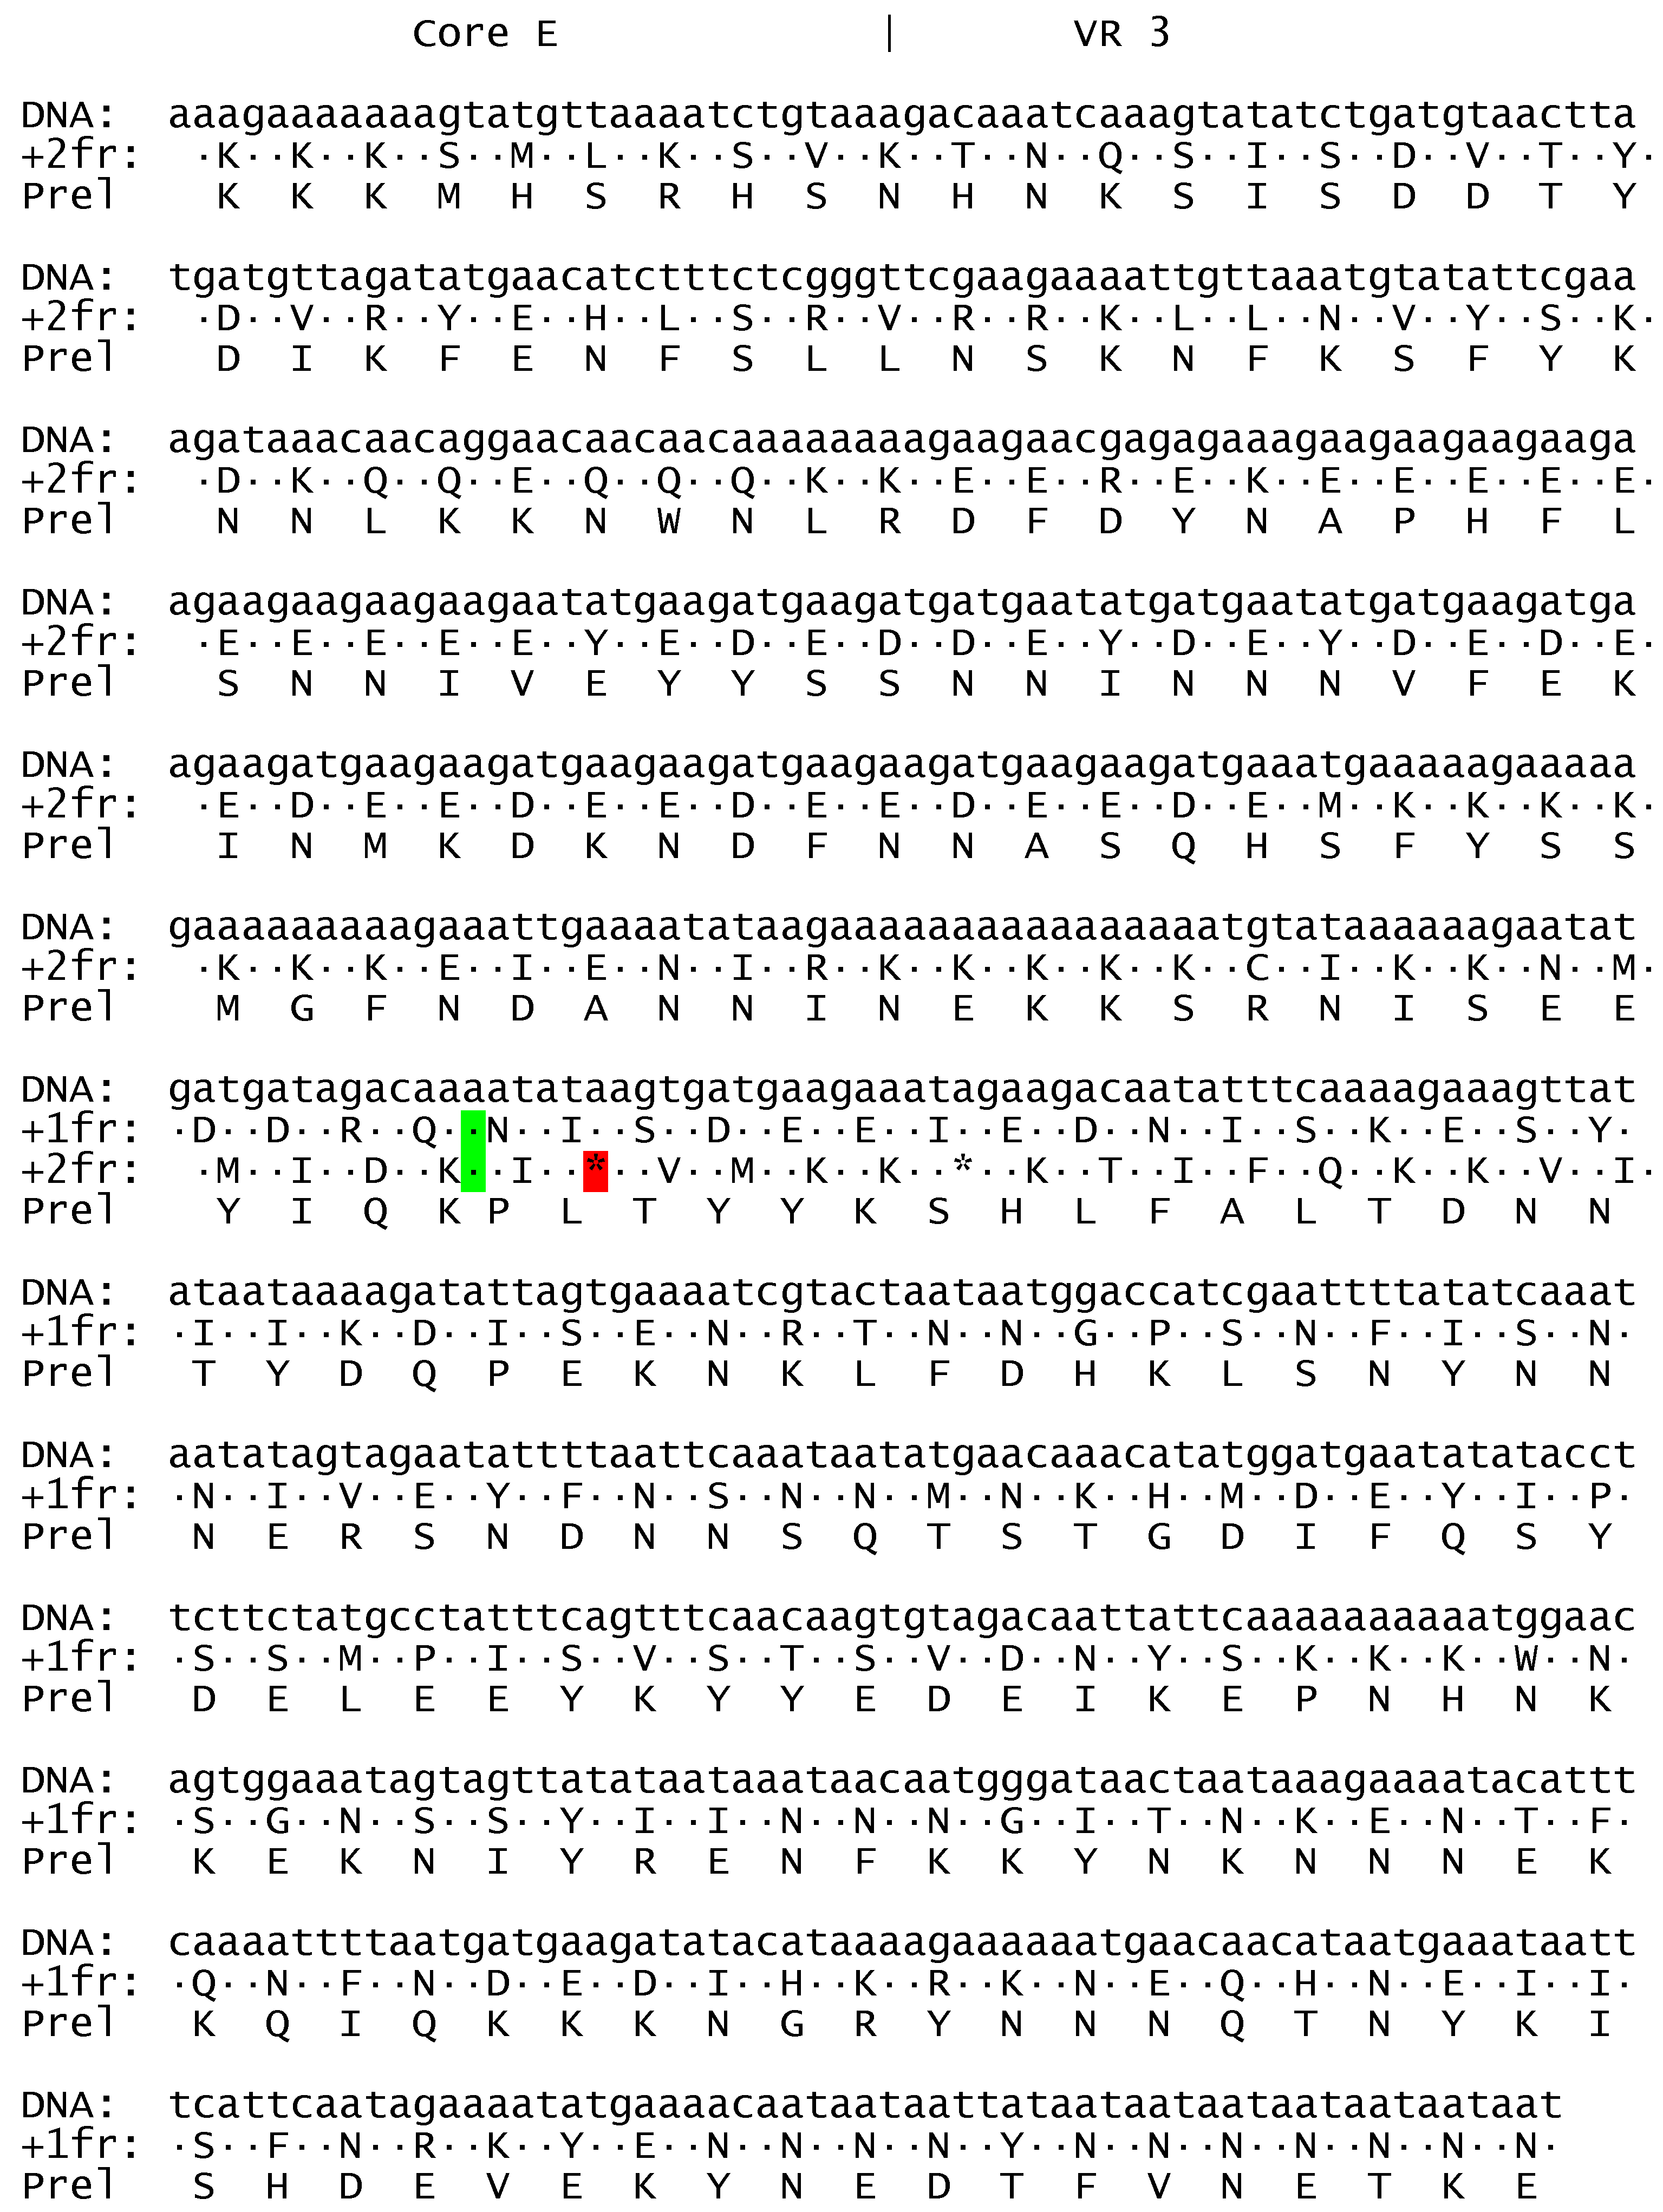
ATPase3 identified a single contig (LSRZ01001921.1) of 2037 bases (Figure A3). The reverse complement of this sequence encoded a partial protein sequence of ATPase3 that included core domains B-E, all of variable region 2, and most of variable region 3 (Figure A4). There was not a continuous open reading frame in contig LSRZ01001921.1 and Figure A5 shows possible locations for frame shifts within variable regions 2 and 3. The reading frames were aligned with P. relictum ATPase3 to identify possible sites for frameshifts. However, the two frameshifts occurred in variable regions and it was not possible to unambiguously determine the frameshifts.
Figure A1.
Sequence of contig LSRZ01000339.1. The sequences of ATPase1 (green), 40S ribosomal protein S11 (aqua), and putative tRNA pseudouridine synthase (yellow) genes are highlighted. .
Figure A1.
Sequence of contig LSRZ01000339.1. The sequences of ATPase1 (green), 40S ribosomal protein S11 (aqua), and putative tRNA pseudouridine synthase (yellow) genes are highlighted. .
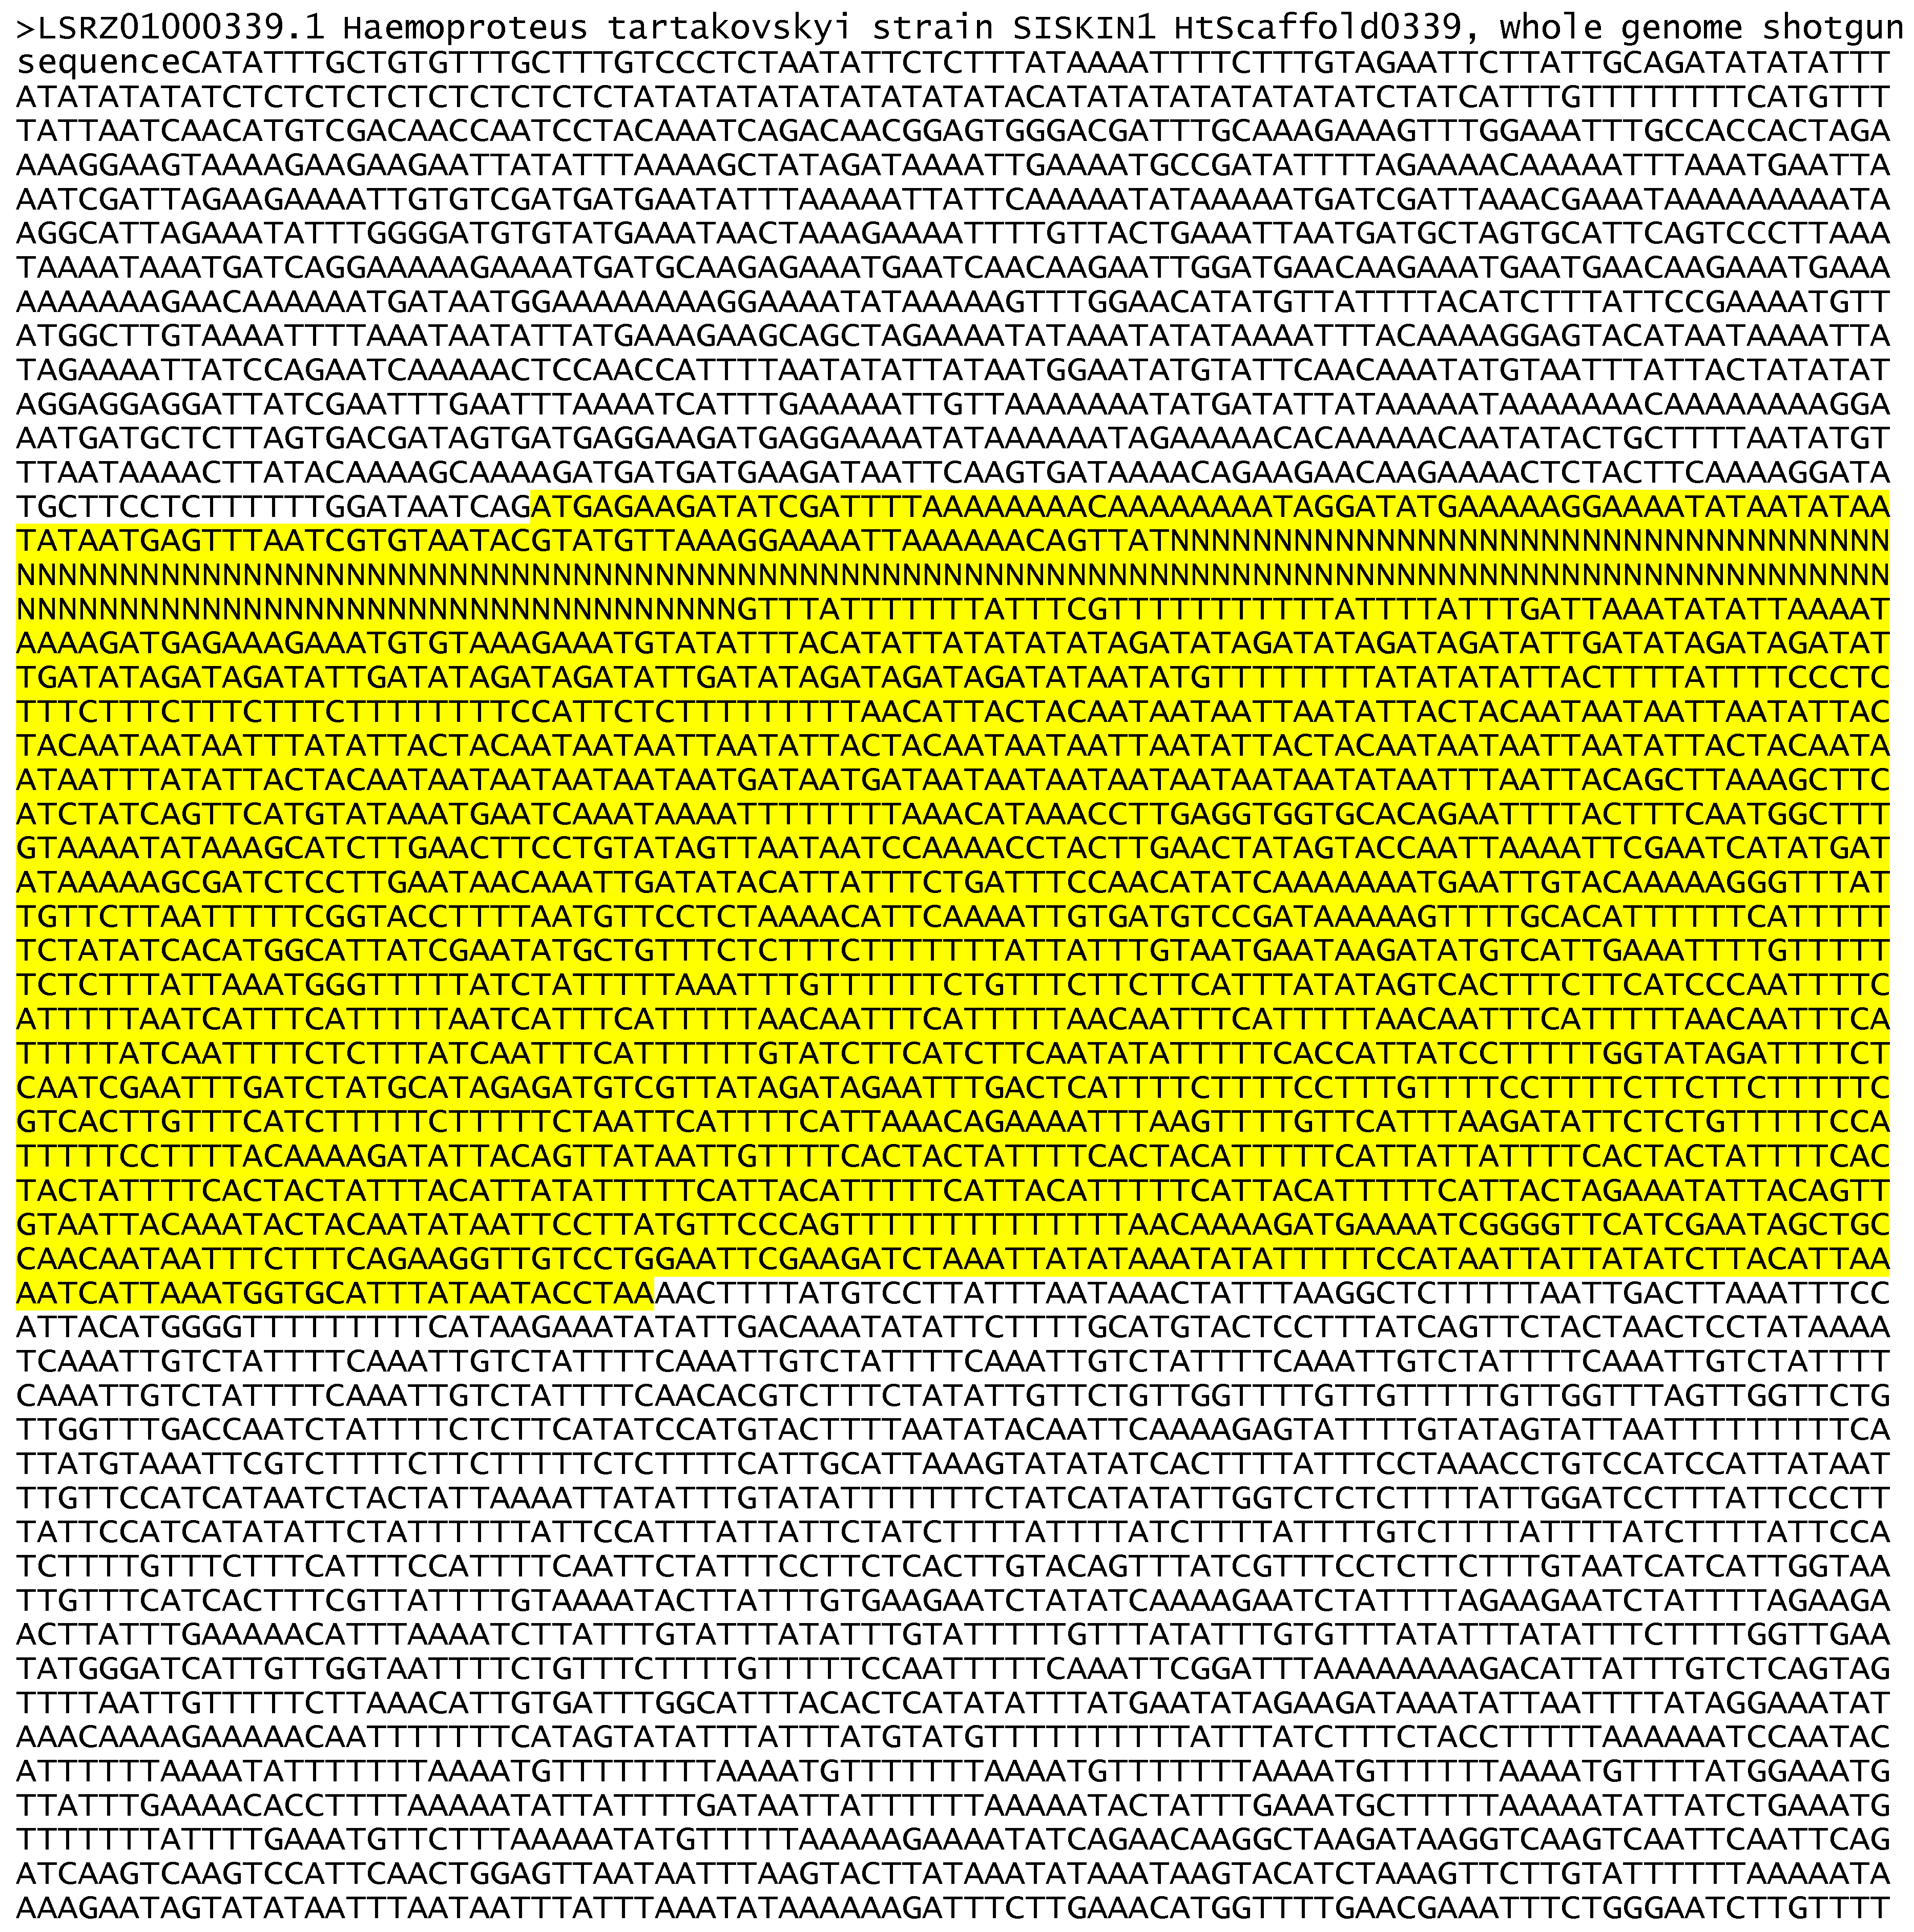
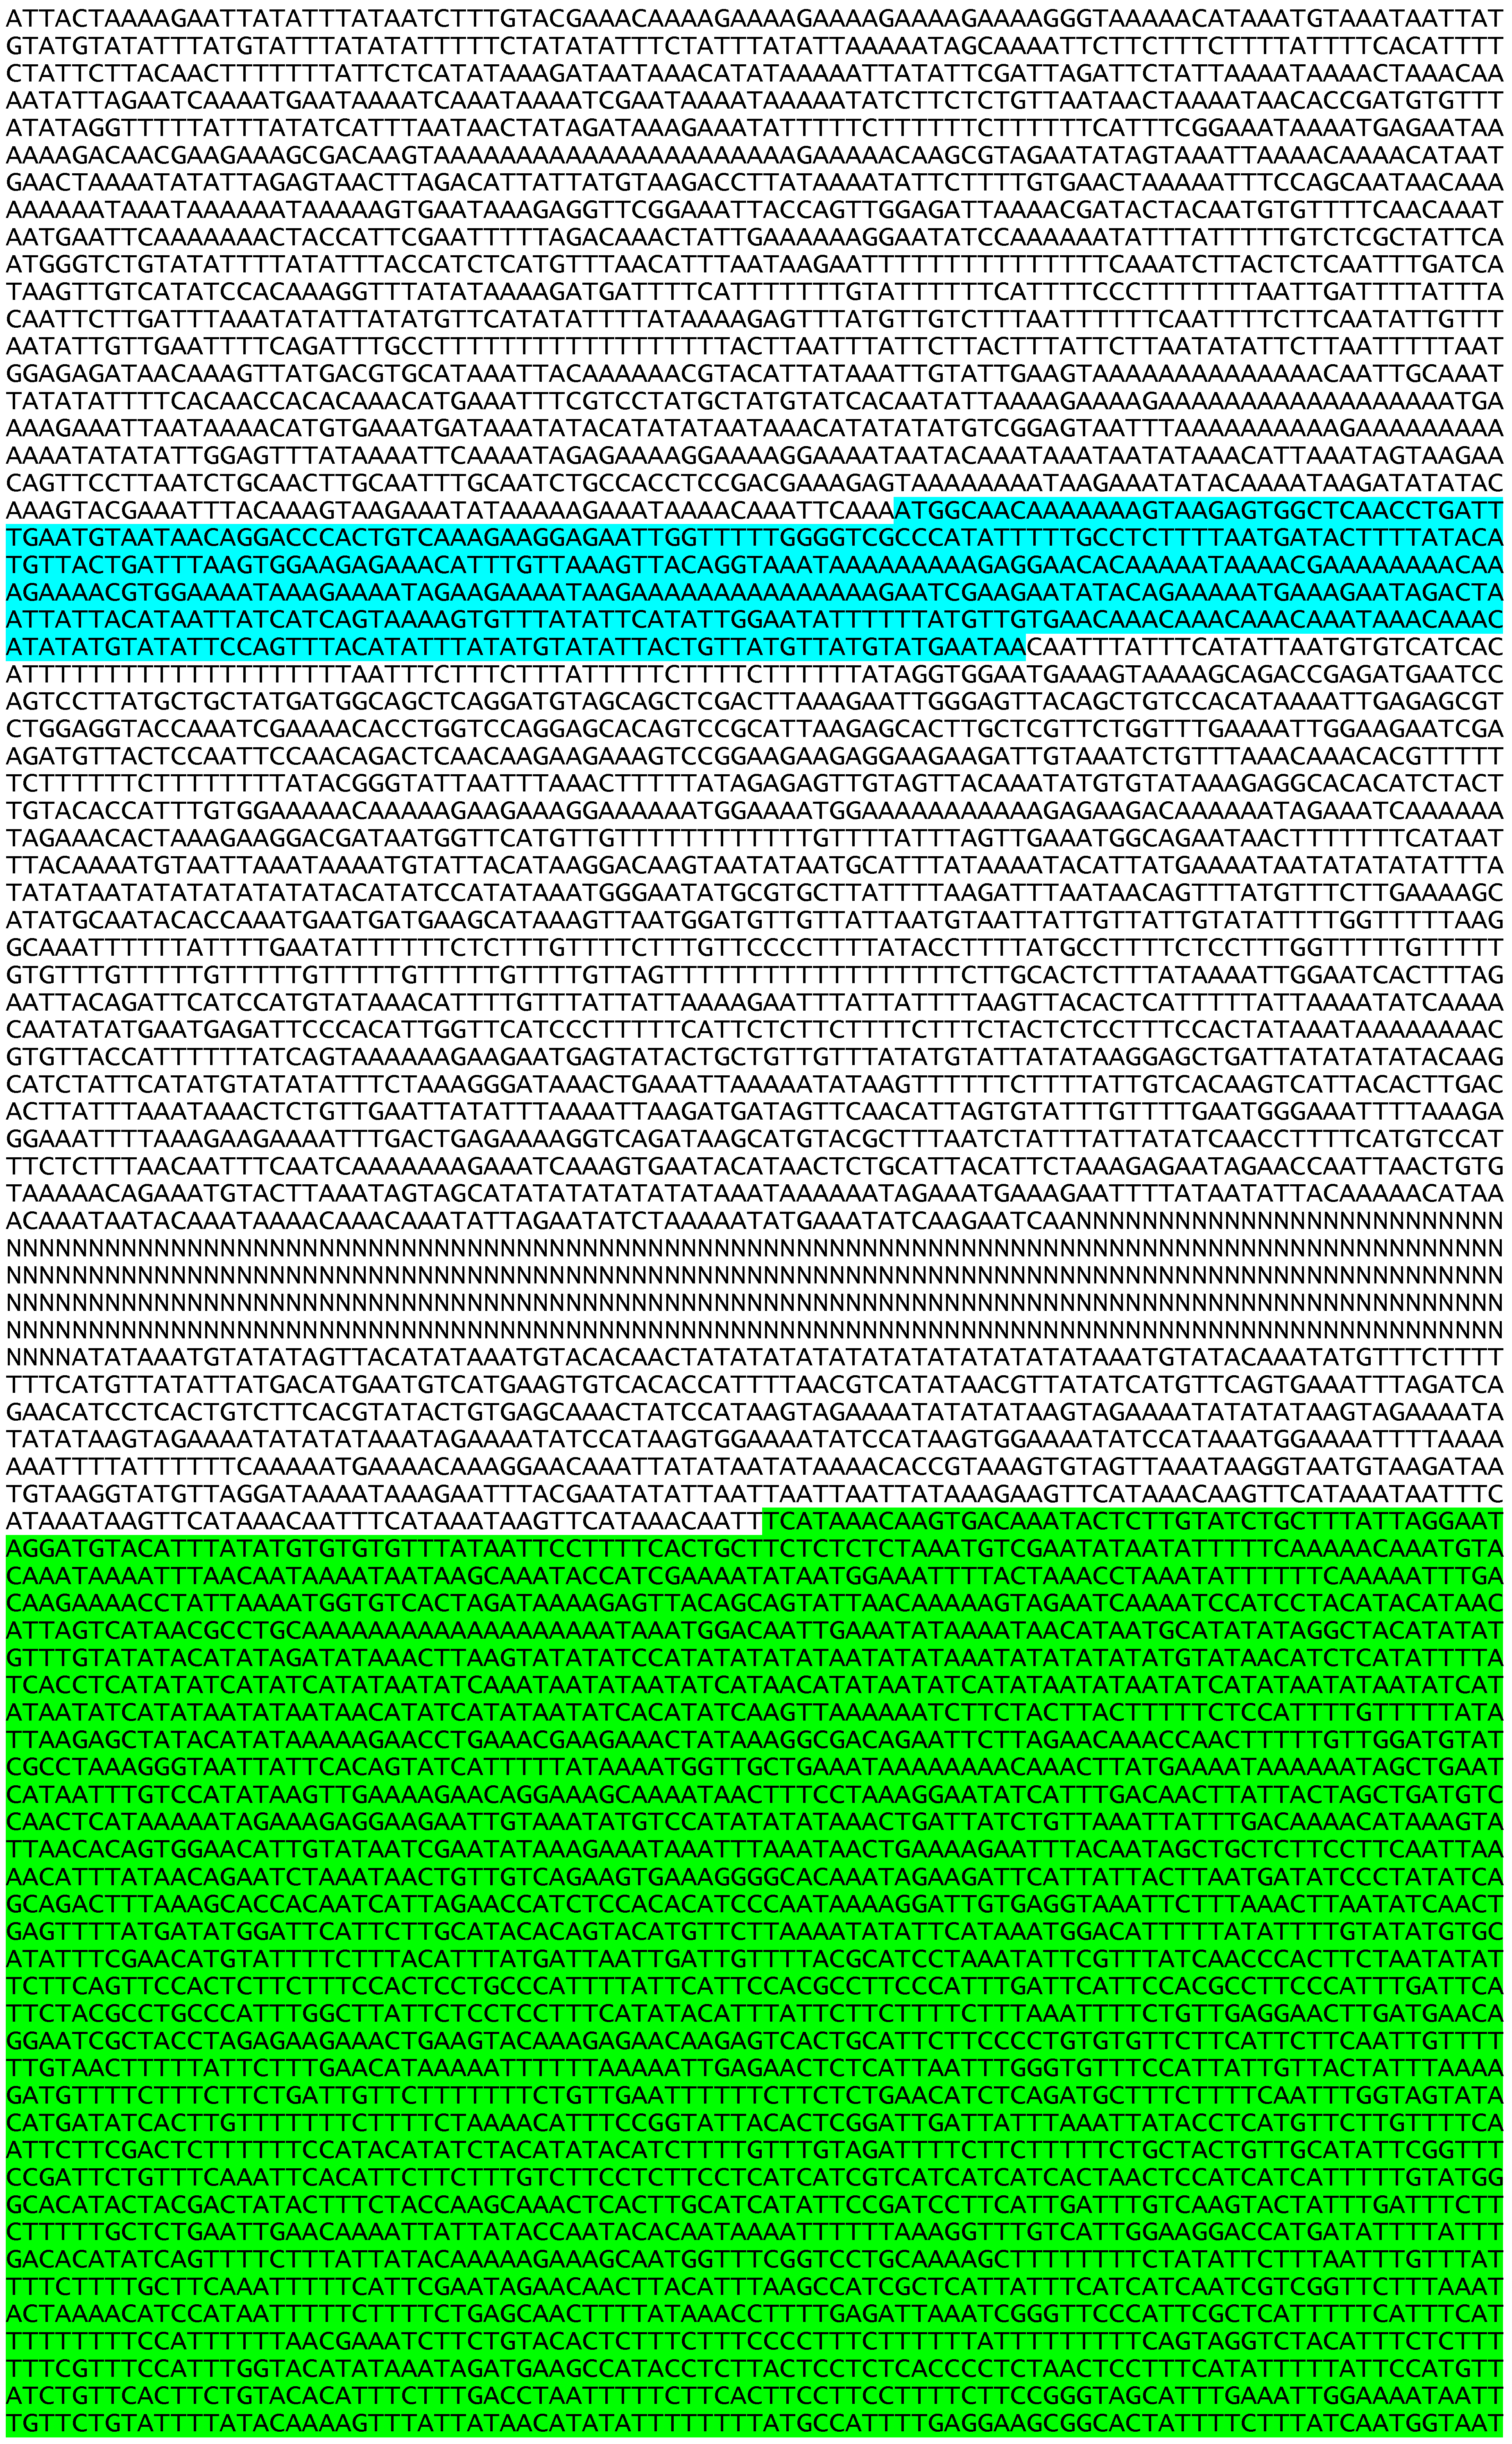
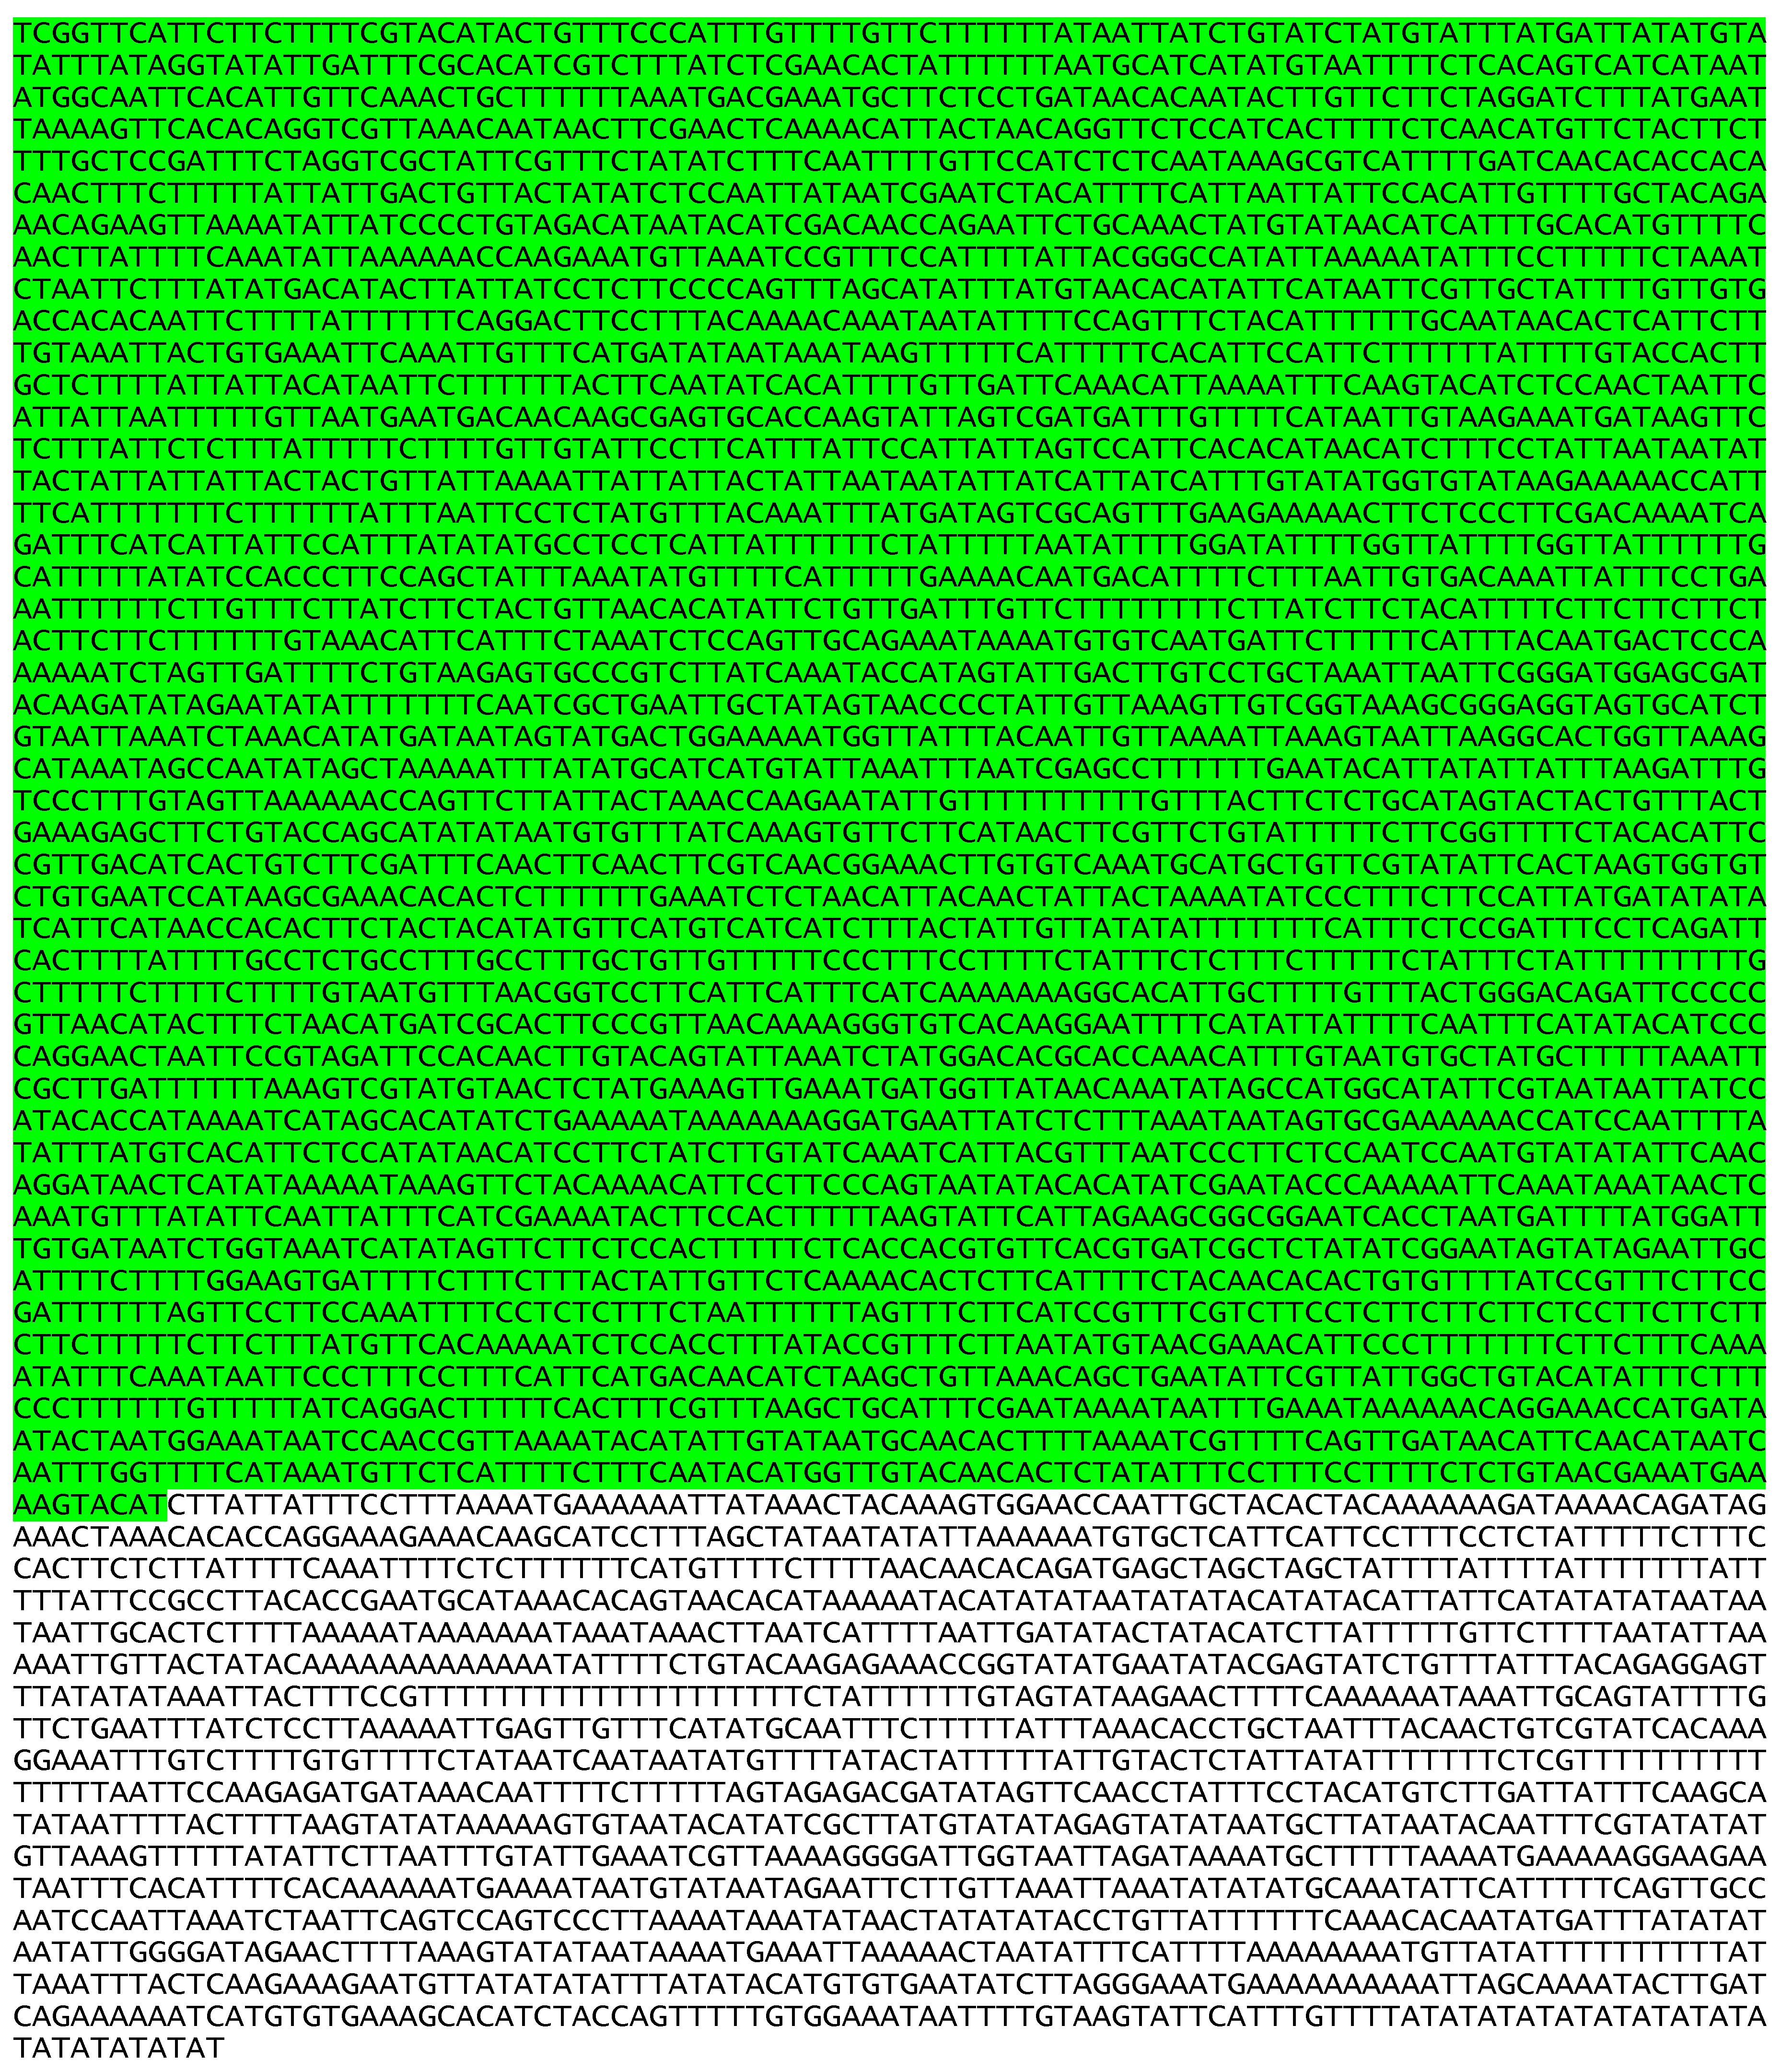
Figure A2.
Fasta files of ATPase genomic sequence and amino acid sequence. Intron is in lower case. CDS = join 17290..10705, 10377..10048 of LSRZ01000339.1.
Figure A2.
Fasta files of ATPase genomic sequence and amino acid sequence. Intron is in lower case. CDS = join 17290..10705, 10377..10048 of LSRZ01000339.1.
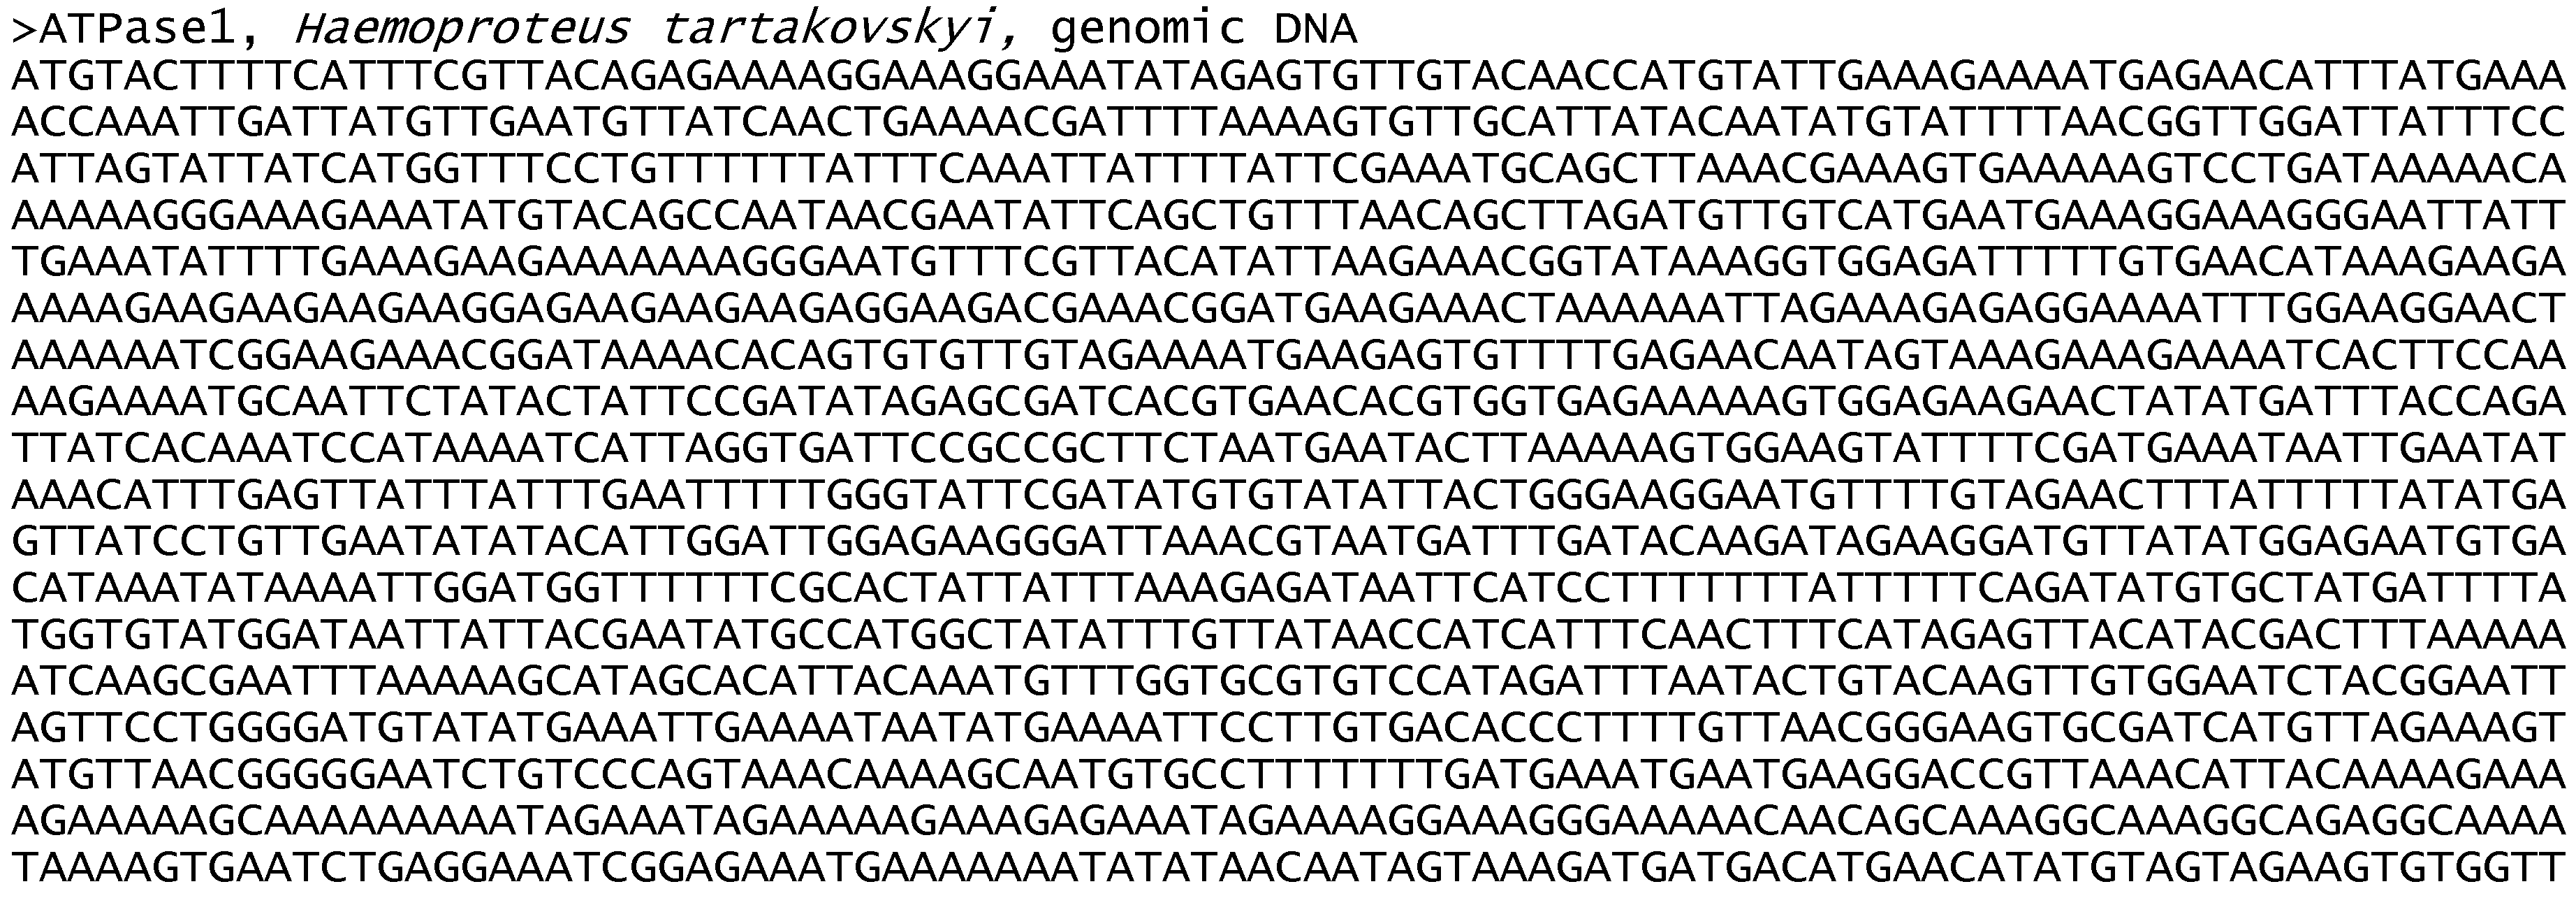
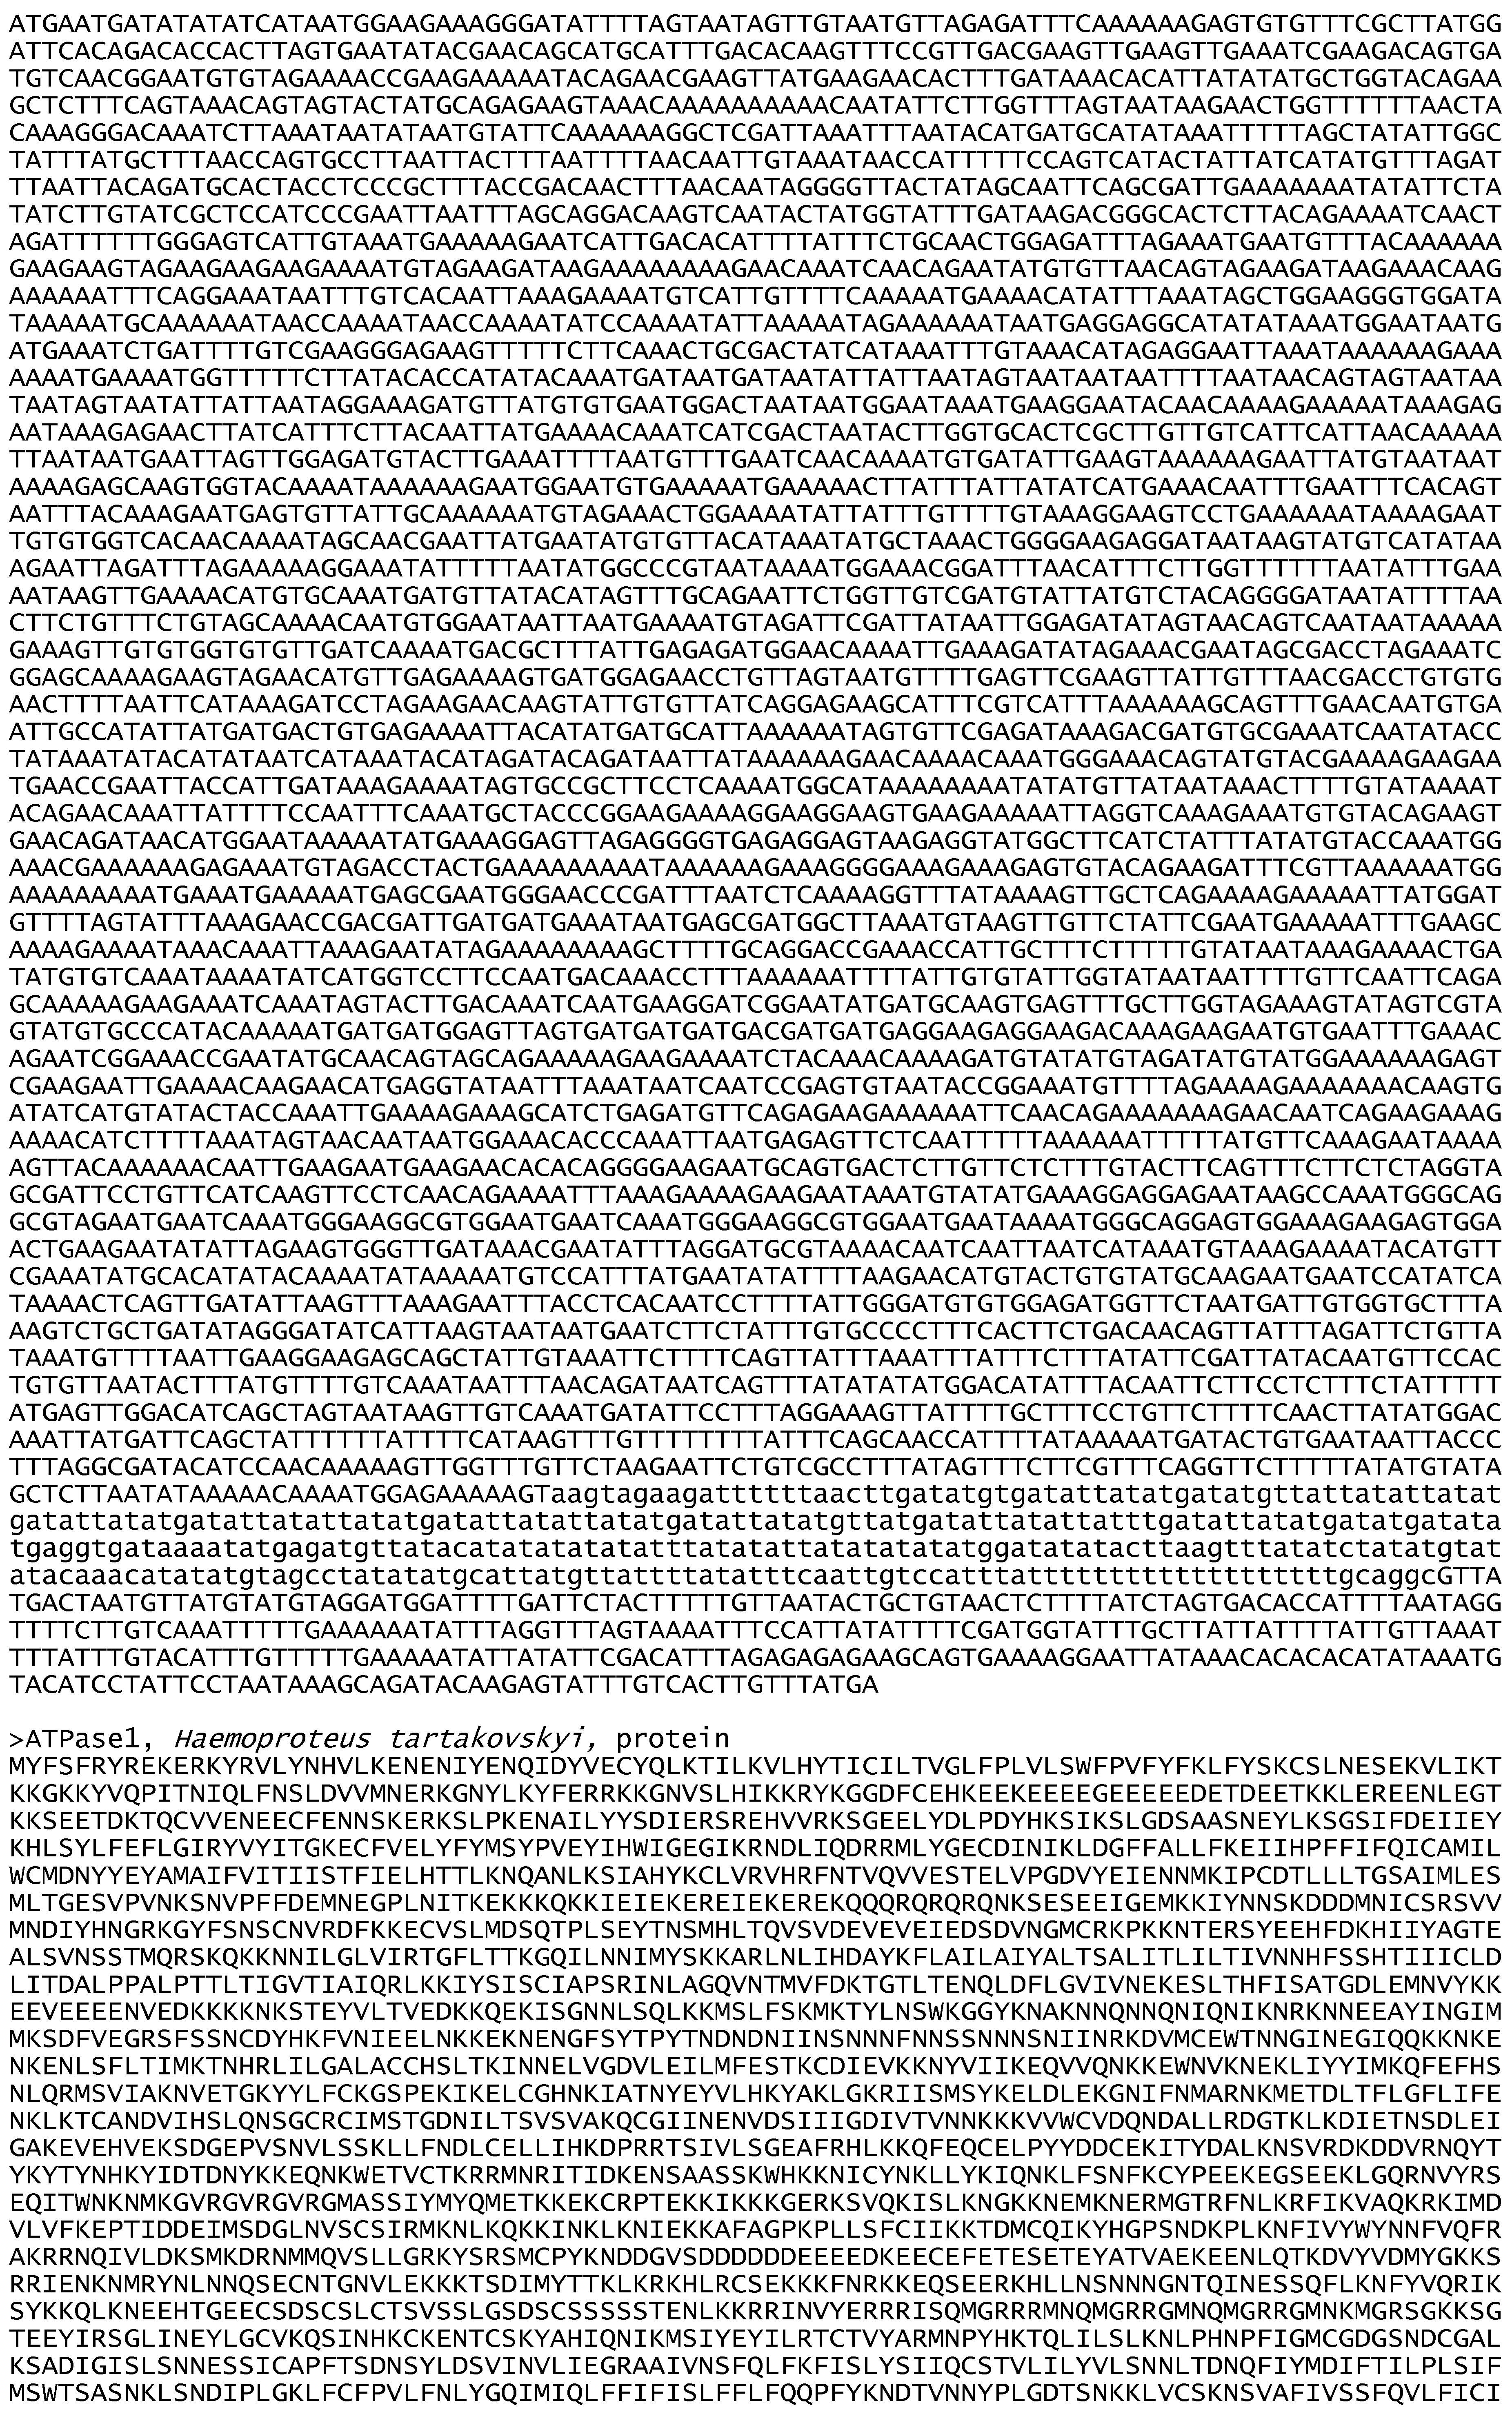

Figure A3.
Sequence of contig LSRZ01001921.1 and reverse complement.
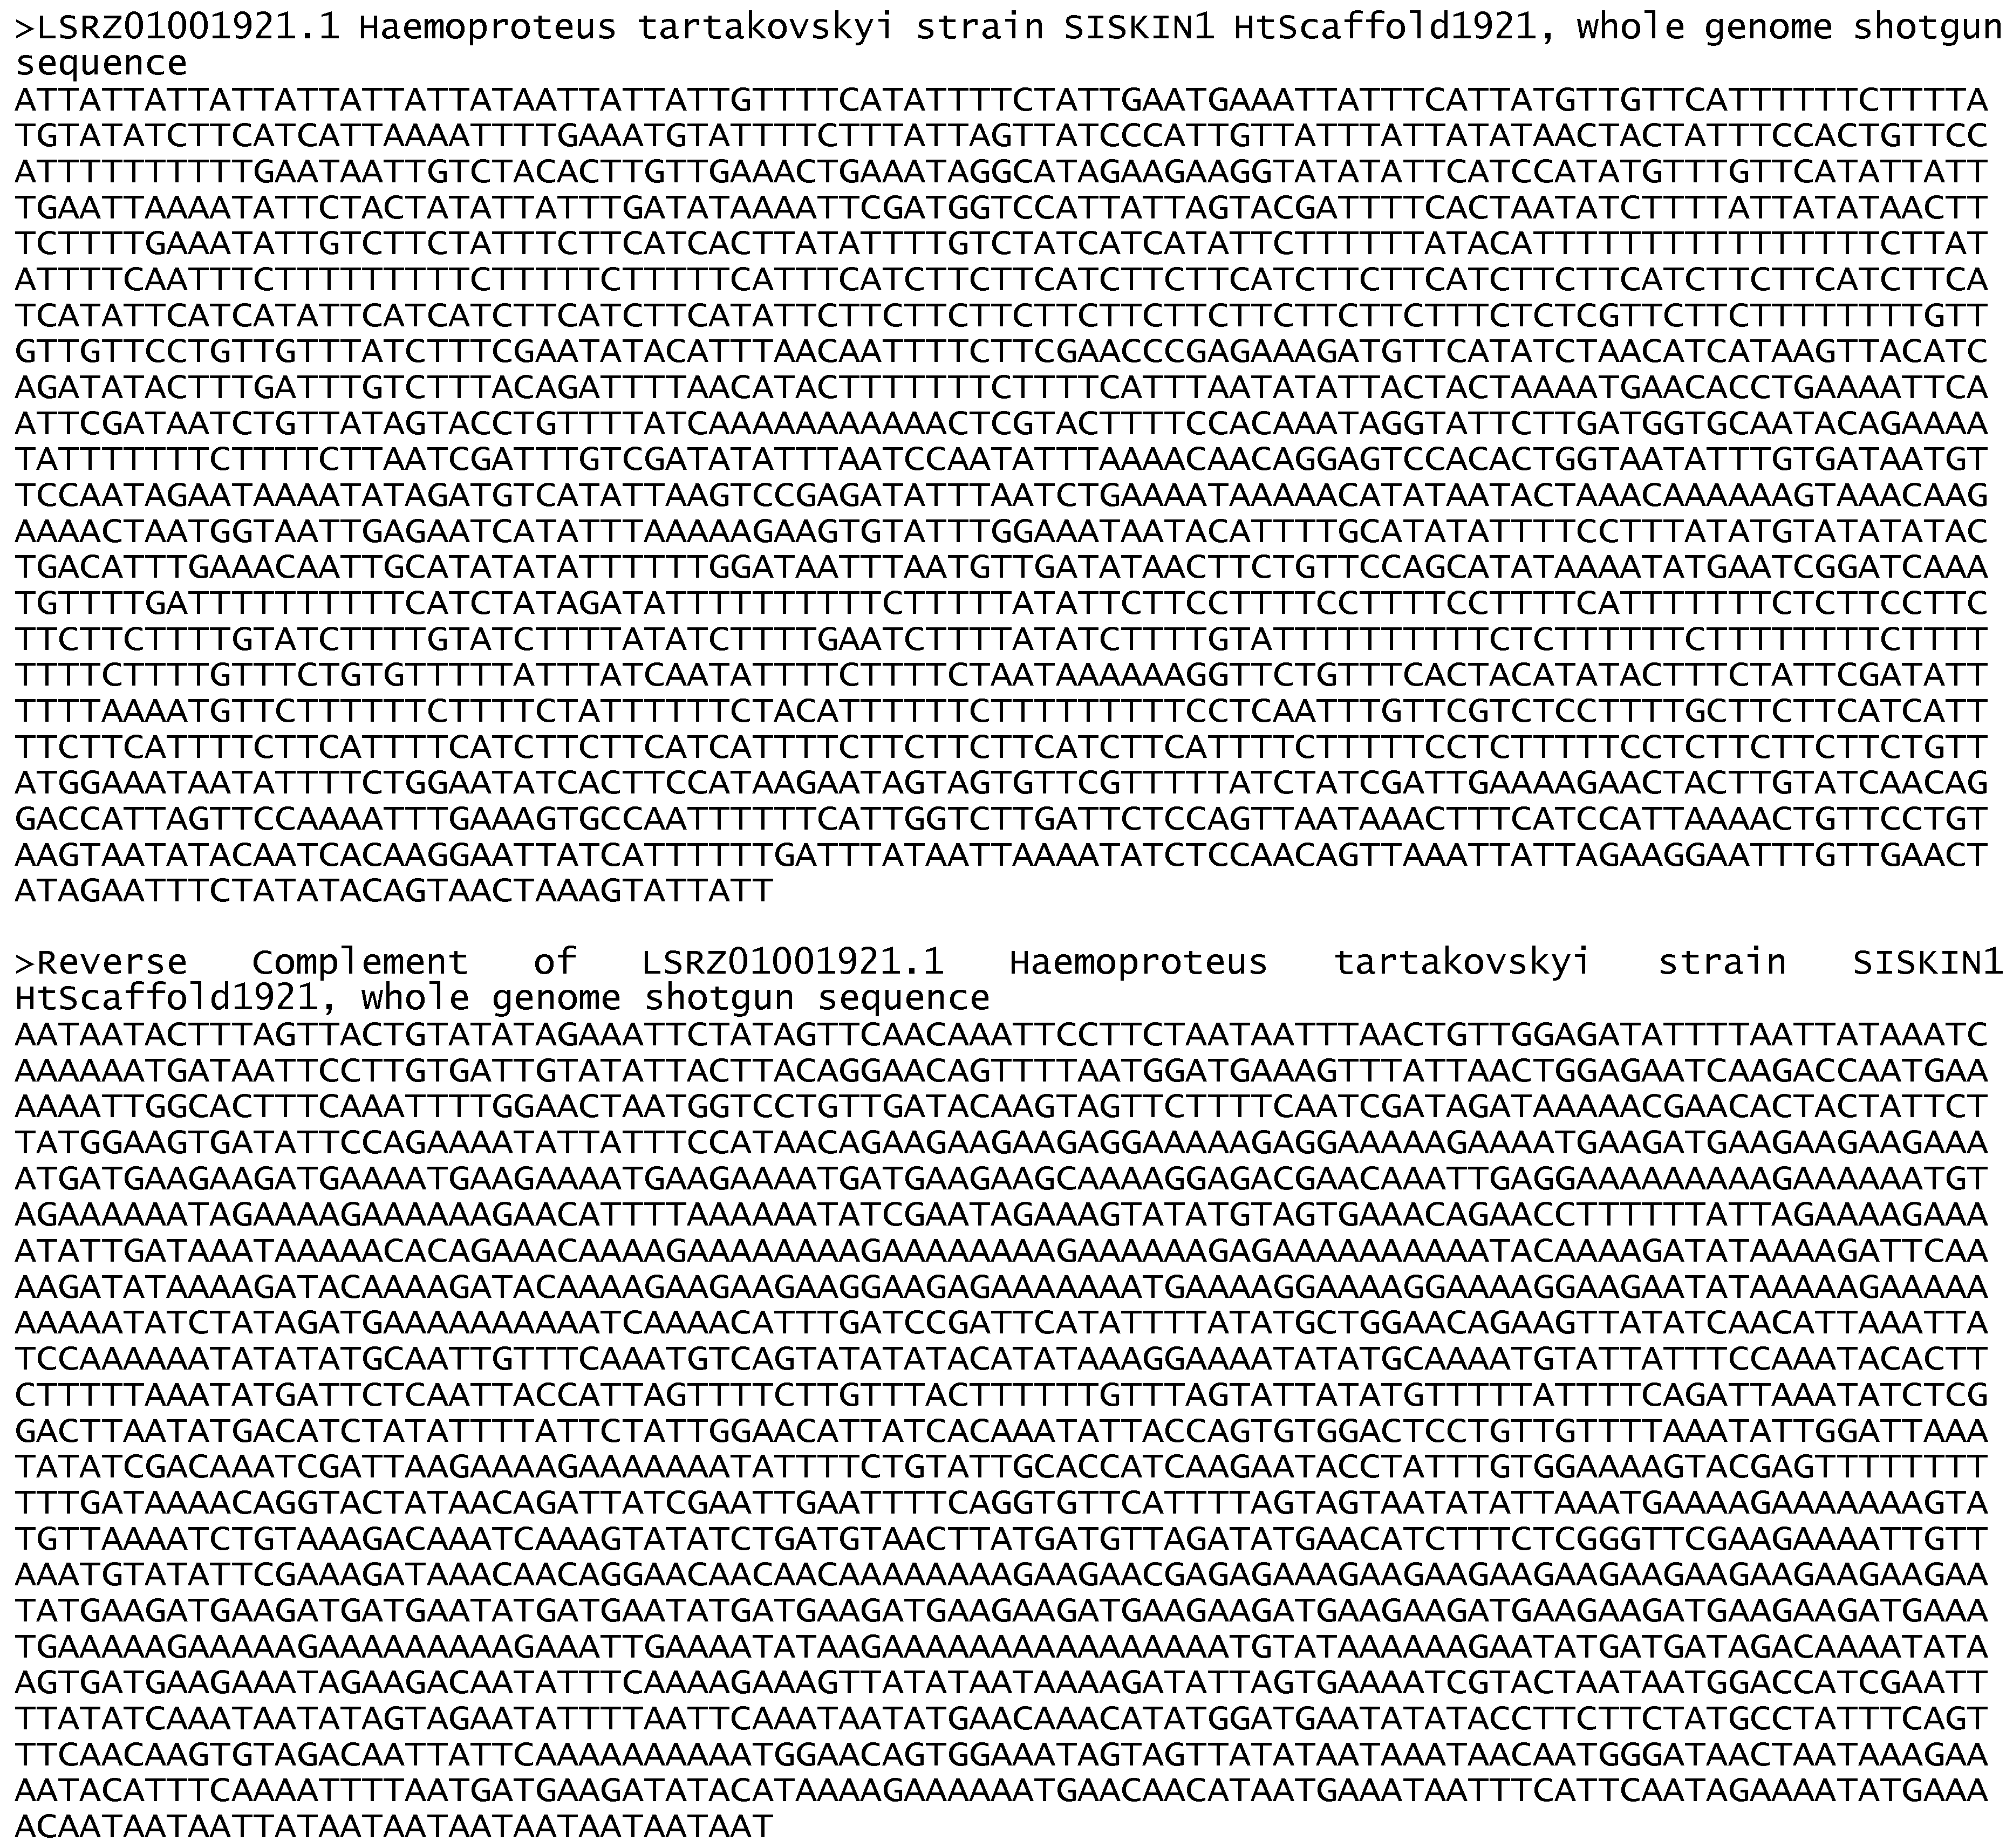
Figure A4.
Fasta file of partial protein sequence of ATPase3 from Haemoproteus tartakovskyi.
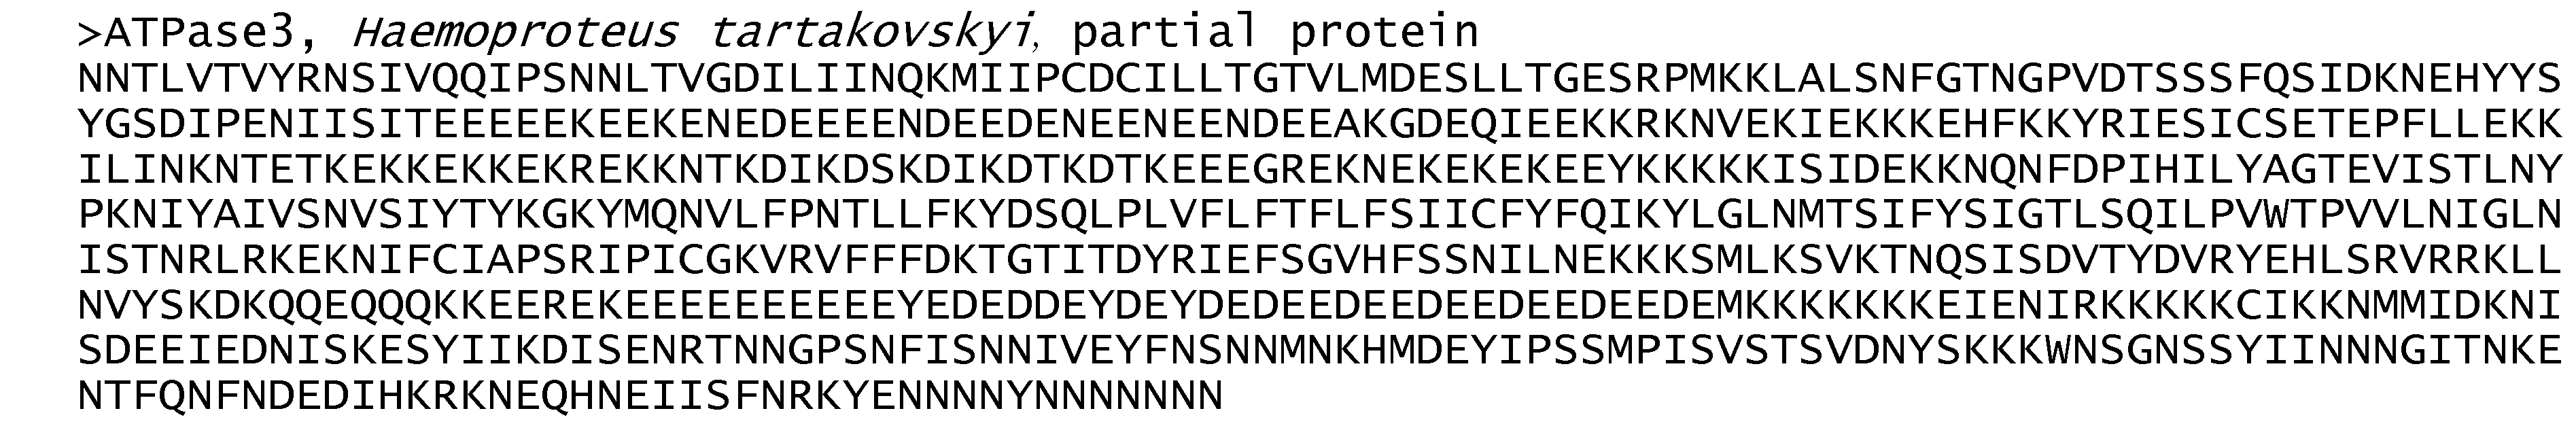
Figure A5.
Mapping of possible frame shifts to generate a continuous open reading frame in contig LSRZ01001921.1. Shown is the translation of contig LSRZ01001921.1 with relevant reading frame(s) and an alignment with ATPase3 from Plasmodium relictum (Prel). The positions of P-type ATPase cores B-E and variable regions (VR) 2 and 3 are shown below the alignment and demarcated with |. Stop codons that necessitate a frame shift are highlighted in red. The position used to generate the frame shift is highlighted in green. .
References
- Palmgren, M. P-type ATPases: many more enigmas left to solve. J. Biol. Chem. 2023, 299, 105352. [Google Scholar] [CrossRef] [PubMed]
- Axelsen, K.B.; Palmgren, M.G. Evolution of substrate specificities in the P-type ATPase superfamily. J. Mol. Evol. 1998, 46, 84–101. [Google Scholar] [CrossRef] [PubMed]
- Møller, A.B.; Asp, T.; Holm, P.B.; Palmgren, M.G. Phylogenetic analysis of P5 P-type ATPases, a eukaryotic lineage of secretory pathway pumps. Mol. Phylogenet. Evol. 2008, 46, 619–634. [Google Scholar] [CrossRef] [PubMed]
- Krishna, S.; Cowan, G.; Meade, J.C.; Wells, R.A.; Stringer, J.R.; Robson, K.J. A family of cation ATPase-like molecules from Plasmodium falciparum. J. Cell Biol. 1993, 120, 385–398. [Google Scholar] [CrossRef] [PubMed]
- Rozmajzl, P.J.; Kimura, M.; Woodrow, C.J.; Krishna, S.; Meade, J.C. Characterization of P-type ATPase 3 in Plasmodium falciparum. Mol. Biochem. Parasitol. 2001, 116, 117–126. [Google Scholar] [CrossRef] [PubMed]
- Kimura, M.; Tanabe, K.; Krishna, S.; Tsuboi, T.; Saito-Ito, A.; Otani, S.; Ogura, H. Gametocyte-dominant expression of a novel P-type ATPase in Plasmodium yoelii. Mol. Biochem. Parasitol. 1999, 104, 331–336. [Google Scholar] [CrossRef] [PubMed]
- Krishna, S.; Cowan, G.M.; Robson, K.J.; Meade, J.C. Plasmodium falciparum: further characterization of putative cation ATPases. Exp. Parasitol. 1994, 78, 113–117. [Google Scholar] [CrossRef] [PubMed]
- Otto, T.D.; Gilabert, A.; Crellen, T.; Böhme, U.; Arnathau, C.; Sanders, M.; Oyola, S.O.; Okouga, A.P.; Boundenga, L.; Willaume, E.; et al. Genomes of all known members of a Plasmodium subgenus reveal paths to virulent human malaria. Nat. Microbiol. 2018, 3, 687–697. [Google Scholar] [CrossRef] [PubMed]
- Hagner, S.C.; Misof, B.; Maier, W.A.; Kampen, H. Bayesian analysis of new and old malaria parasite DNA sequence data demonstrates the need for more phylogenetic signal to clarify the descent of Plasmodium falciparum. Parasitol. Res. 2007, 101, 493–503. [Google Scholar] [CrossRef] [PubMed]
- Cortés, G.T.; Beltran, M.M.G.; Gómez-Alegría, C.J.; Wiser, M.F. Identification of a protein unique to the genus Plasmodium that contains a WD40 repeat domain and extensive low-complexity sequence. Parasitol. Res. 2021, 120, 2617–2629. [Google Scholar] [CrossRef] [PubMed]
- DePristo, M.A.; Zilversmit, M.M.; Hartl, D.L. On the abundance, amino acid composition, and evolutionary dynamics of low-complexity regions in proteins. Gene 2006, 378, 19–30. [Google Scholar] [CrossRef] [PubMed]
- Chaudhry, S.R.; Lwin, N.; Phelan, D.; Escalante, A.A.; Battistuzzi, F.U. Comparative analysis of low complexity regions in Plasmodia. Sci. Rep. 2018, 8, 335. [Google Scholar] [CrossRef]
- Letunic, I.; Bork, P. Interactive Tree of Life (iTOL) v6: recent updates to the phylogenetic tree display and annotation tool. Nucleic Acids Res. 2024, gkae268. [Google Scholar] [CrossRef] [PubMed]
- Votýpka, J.; Modrý, D.; Oborník, M.; Šlapeta, J.; Lukeš, J. Apicomplexa. In Handbook of the Protists; Archibald, J.M., Simpson, A.G.B., Slamovits, C.H., Margulis, L., Melkonian, M., Chapman, D.J., Corliss, J.O., Eds.; Springer International Publishing: Cham, 2017; pp. 1–58. ISBN 978-3-319-32669-6. [Google Scholar]
- Martinsen, E.S.; Perkins, S.L.; Schall, J.J. A three-genome phylogeny of malaria parasites (Plasmodium and closely related genera): evolution of life-history traits and host switches. Mol. Phylogenet. Evol. 2008, 47, 261–273. [Google Scholar] [CrossRef] [PubMed]
- Burki, F.; Roger, A.J.; Brown, M.W.; Simpson, A.G.B. The new tree of eukaryotes. Trends Ecol. Evol. 2020, 35, 43–55. [Google Scholar] [CrossRef] [PubMed]
- Wiser, M.F. Protozoa. In Encyclopedia of Biodiversity (Volume 2); Scheiner, S.M.B.T., Ed.; Academic Press: Oxford, 2024; pp. 802–817. ISBN 978-0-323-98434-8. [Google Scholar]
- Ciancio, A.; Scippa, S.; Finetti-Sialer, M.; De Candia, A.; Avallone, B.; De Vincentiis, M. Redescription of Cardiosporidium cionae (Van Gaver and Stephan, 1907) (Apicomplexa: Piroplasmida), a plasmodial parasite of ascidian haemocytes. Eur. J. Protistol. 2008, 44, 181–196. [Google Scholar] [CrossRef] [PubMed]
- Bethke, L.L.; Zilversmit, M.; Nielsen, K.; Daily, J.; Volkman, S.K.; Ndiaye, D.; Lozovsky, E.R.; Hartl, D.L.; Wirth, D.F. Duplication, gene conversion, and genetic diversity in the species-specific acyl-CoA synthetase gene family of Plasmodium falciparum. Mol. Biochem. Parasitol. 2006, 150B, 10–24. [Google Scholar] [CrossRef]
- Tamura, K.; Stecher, G.; Kumar, S. MEGA11: molecular evolutionary genetics analysis version 11. Mol. Biol. Evol. 2021, 38, 3022–3027. [Google Scholar] [CrossRef]
- Cepeda, A.S.; Mello, B.; Pacheco, M.A.; Luo, Z.; Sullivan, S.A.; Carlton, J.M.; Escalante, A.A. The genome of Plasmodium gonderi: insights into the evolution of human malaria parasites. Genome Biol. Evol. Evol. 2024, 16. [Google Scholar] [CrossRef] [PubMed]
- Brayton, K.A.; Lau, A.O.T.; Herndon, D.R.; Hannick, L.; Kappmeyer, L.S.; Berens, S.J.; Bidwell, S.L.; Brown, W.C.; Crabtree, J.; Fadrosh, D.; et al. Genome sequence of Babesia bovis and comparative analysis of apicomplexan hemoprotozoa. PLoS Pathog. 2007, 3, 1401–1413. [Google Scholar] [CrossRef]
- Diesh, C.; Stevens, G.J.; Xie, P.; De Jesus Martinez, T.; Hershberg, E.A.; Leung, A.; Guo, E.; Dider, S.; Zhang, J.; Bridge, C.; et al. JBrowse 2: a modular genome browser with views of synteny and structural variation. Genome Biol. 2023, 24, 74. [Google Scholar] [CrossRef] [PubMed]
- Aurrecoechea, C.; Brestelli, J.; Brunk, B.P.; Dommer, J.; Fischer, S.; Gajria, B.; Gao, X.; Gingle, A.; Grant, G.; Harb, O.S.; et al. PlasmoDB: A functional genomic database for malaria parasites. Nucleic Acids Res. 2009, 37, 539–543. [Google Scholar] [CrossRef] [PubMed]
- Tillinghast, J.; Drury, S.; Bowser, D.; Benn, A.; Lee, K.P.K. Structural mechanisms for gating and ion selectivity of the human polyamine transporter ATP13A2. Mol. Cell 2021, 81, 4650–4662.e4. [Google Scholar] [CrossRef]
- Li, P.; Wang, K.; Salustros, N.; Grønberg, C.; Gourdon, P. Structure and transport mechanism of P5B-ATPases. Nat. Commun. 2021, 12, 3973. [Google Scholar] [CrossRef]
- Schmidt, K.; Wolfe, D.M.; Stiller, B.; Pearce, D.A. Cd2+, Mn2+, Ni2+ and Se2+ toxicity to Saccharomyces cerevisiae lacking YPK9p the orthologue of human ATP13A2. Biochem. Biophys. Res. Commun. 2009, 383, 198–202. [Google Scholar] [CrossRef]
- Wiser, M.F. The digestive vacuole of the malaria parasite: a specialized lysosome. Pathogens 2024, 13, 182. [Google Scholar] [CrossRef] [PubMed]
- Lamarque, M.; Tastet, C.; Poncet, J.; Demettre, E.; Jouin, P.; Vial, H.; Dubremetz, J.-F. Food vacuole proteome of the malarial parasite Plasmodium falciparum. Proteomics. Clin. Appl. 2008, 2, 1361–1374. [Google Scholar] [CrossRef]
- Phillips, M.A. Polyamines in protozoan pathogens. J. Biol. Chem. 2018, 293, 18746–18756. [Google Scholar] [CrossRef] [PubMed]
- Niemand, J.; Louw, A.I.; Birkholtz, L.; Kirk, K. Polyamine uptake by the intraerythrocytic malaria parasite, Plasmodium falciparum. Int. J. Parasitol. 2012, 42, 921–929. [Google Scholar] [CrossRef]
- Bensch, S.; Canbäck, B.; DeBarry, J.D.; Johansson, T.; Hellgren, O.; Kissinger, J.C.; Palinauskas, V.; Videvall, E.; Valkiūnas, G. The genome of Haemoproteus tartakovskyi and its relationship to human malaria parasites. Genome Biol. Evol. 2016, 8, 1361–1373. [Google Scholar] [CrossRef]
- Böhme, U.; Otto, T.D.; Cotton, J.A.; Steinbiss, S.; Sanders, M.; Oyola, S.O.; Nicot, A.; Gandon, S.; Patra, K.P.; Herd, C.; et al. Complete avian malaria parasite genomes reveal features associated with lineage-specific evolution in birds and mammals. Genome Res. 2018, 28, 547–560. [Google Scholar] [CrossRef] [PubMed]
- Borner, J.; Pick, C.; Thiede, J.; Kolawole, O.M.; Kingsley, M.T.; Schulze, J.; Cottontail, V.M.; Wellinghausen, N.; Schmidt-Chanasit, J.; Bruchhaus, I.; et al. Phylogeny of haemosporidian blood parasites revealed by a multi-gene approach. Mol. Phylogenet. Evol. 2016, 94, 221–231. [Google Scholar] [CrossRef] [PubMed]
- Pick, C.; Ebersberger, I.; Spielmann, T.; Bruchhaus, I.; Burmester, T. Phylogenomic analyses of malaria parasites and evolution of their exported proteins. BMC Evol. Biol. 2011, 11, 167. [Google Scholar] [CrossRef] [PubMed]
- Pacheco, M.A.; Escalante, A.A. Origin and diversity of malaria parasites and other Haemosporida. Trends Parasitol. 2023, 39, 501–516. [Google Scholar] [CrossRef]
- Tripathi, J.; Stoklasa, M.; Nayak, S.; En Low, K.; Qian Hui Lee, E.; Duong Tien, Q.H.; Rénia, L.; Malleret, B.; Bozdech, Z. The artemisinin-induced dormant stages of Plasmodium falciparum exhibit hallmarks of cellular quiescence/senescence and drug resilience. Nat. Commun. 2024, 15, 7485. [Google Scholar] [CrossRef]
- LaCrue, A.N.; Scheel, M.; Kennedy, K.; Kumar, N.; Kyle, D.E. Effects of artesunate on parasite recrudescence and dormancy in the rodent malaria model Plasmodium vinckei. PLoS One 2011, 6, e26689. [Google Scholar] [CrossRef] [PubMed]
- Dobson, L.; Reményi, I.; Tusnády, G.E. CCTOP: a consensus constrained TOPology prediction web server. Nucleic Acids Res. 2015, 43, W408–12. [Google Scholar] [CrossRef] [PubMed]
- Kelley, L.A.; Mezulis, S.; Yates, C.M.; Wass, M.N.; Sternberg, M.J.E. The Phyre2 web portal for protein modeling, prediction and analysis. Nat. Protoc. 2015, 10, 845–858. [Google Scholar] [CrossRef]
Figure 1.
Phylogenetic tree of Atpase3 from Plasmodium species. The ClustalW alignment from Supplemental Figure S2 was used to generate an unrooted phylogenetic tree and visualized with interactive Tree of Life [13]. Seven branches, that define seven clades (blue labels), emanate from a central region of uncertain phylogenetic relationships (gray circle).
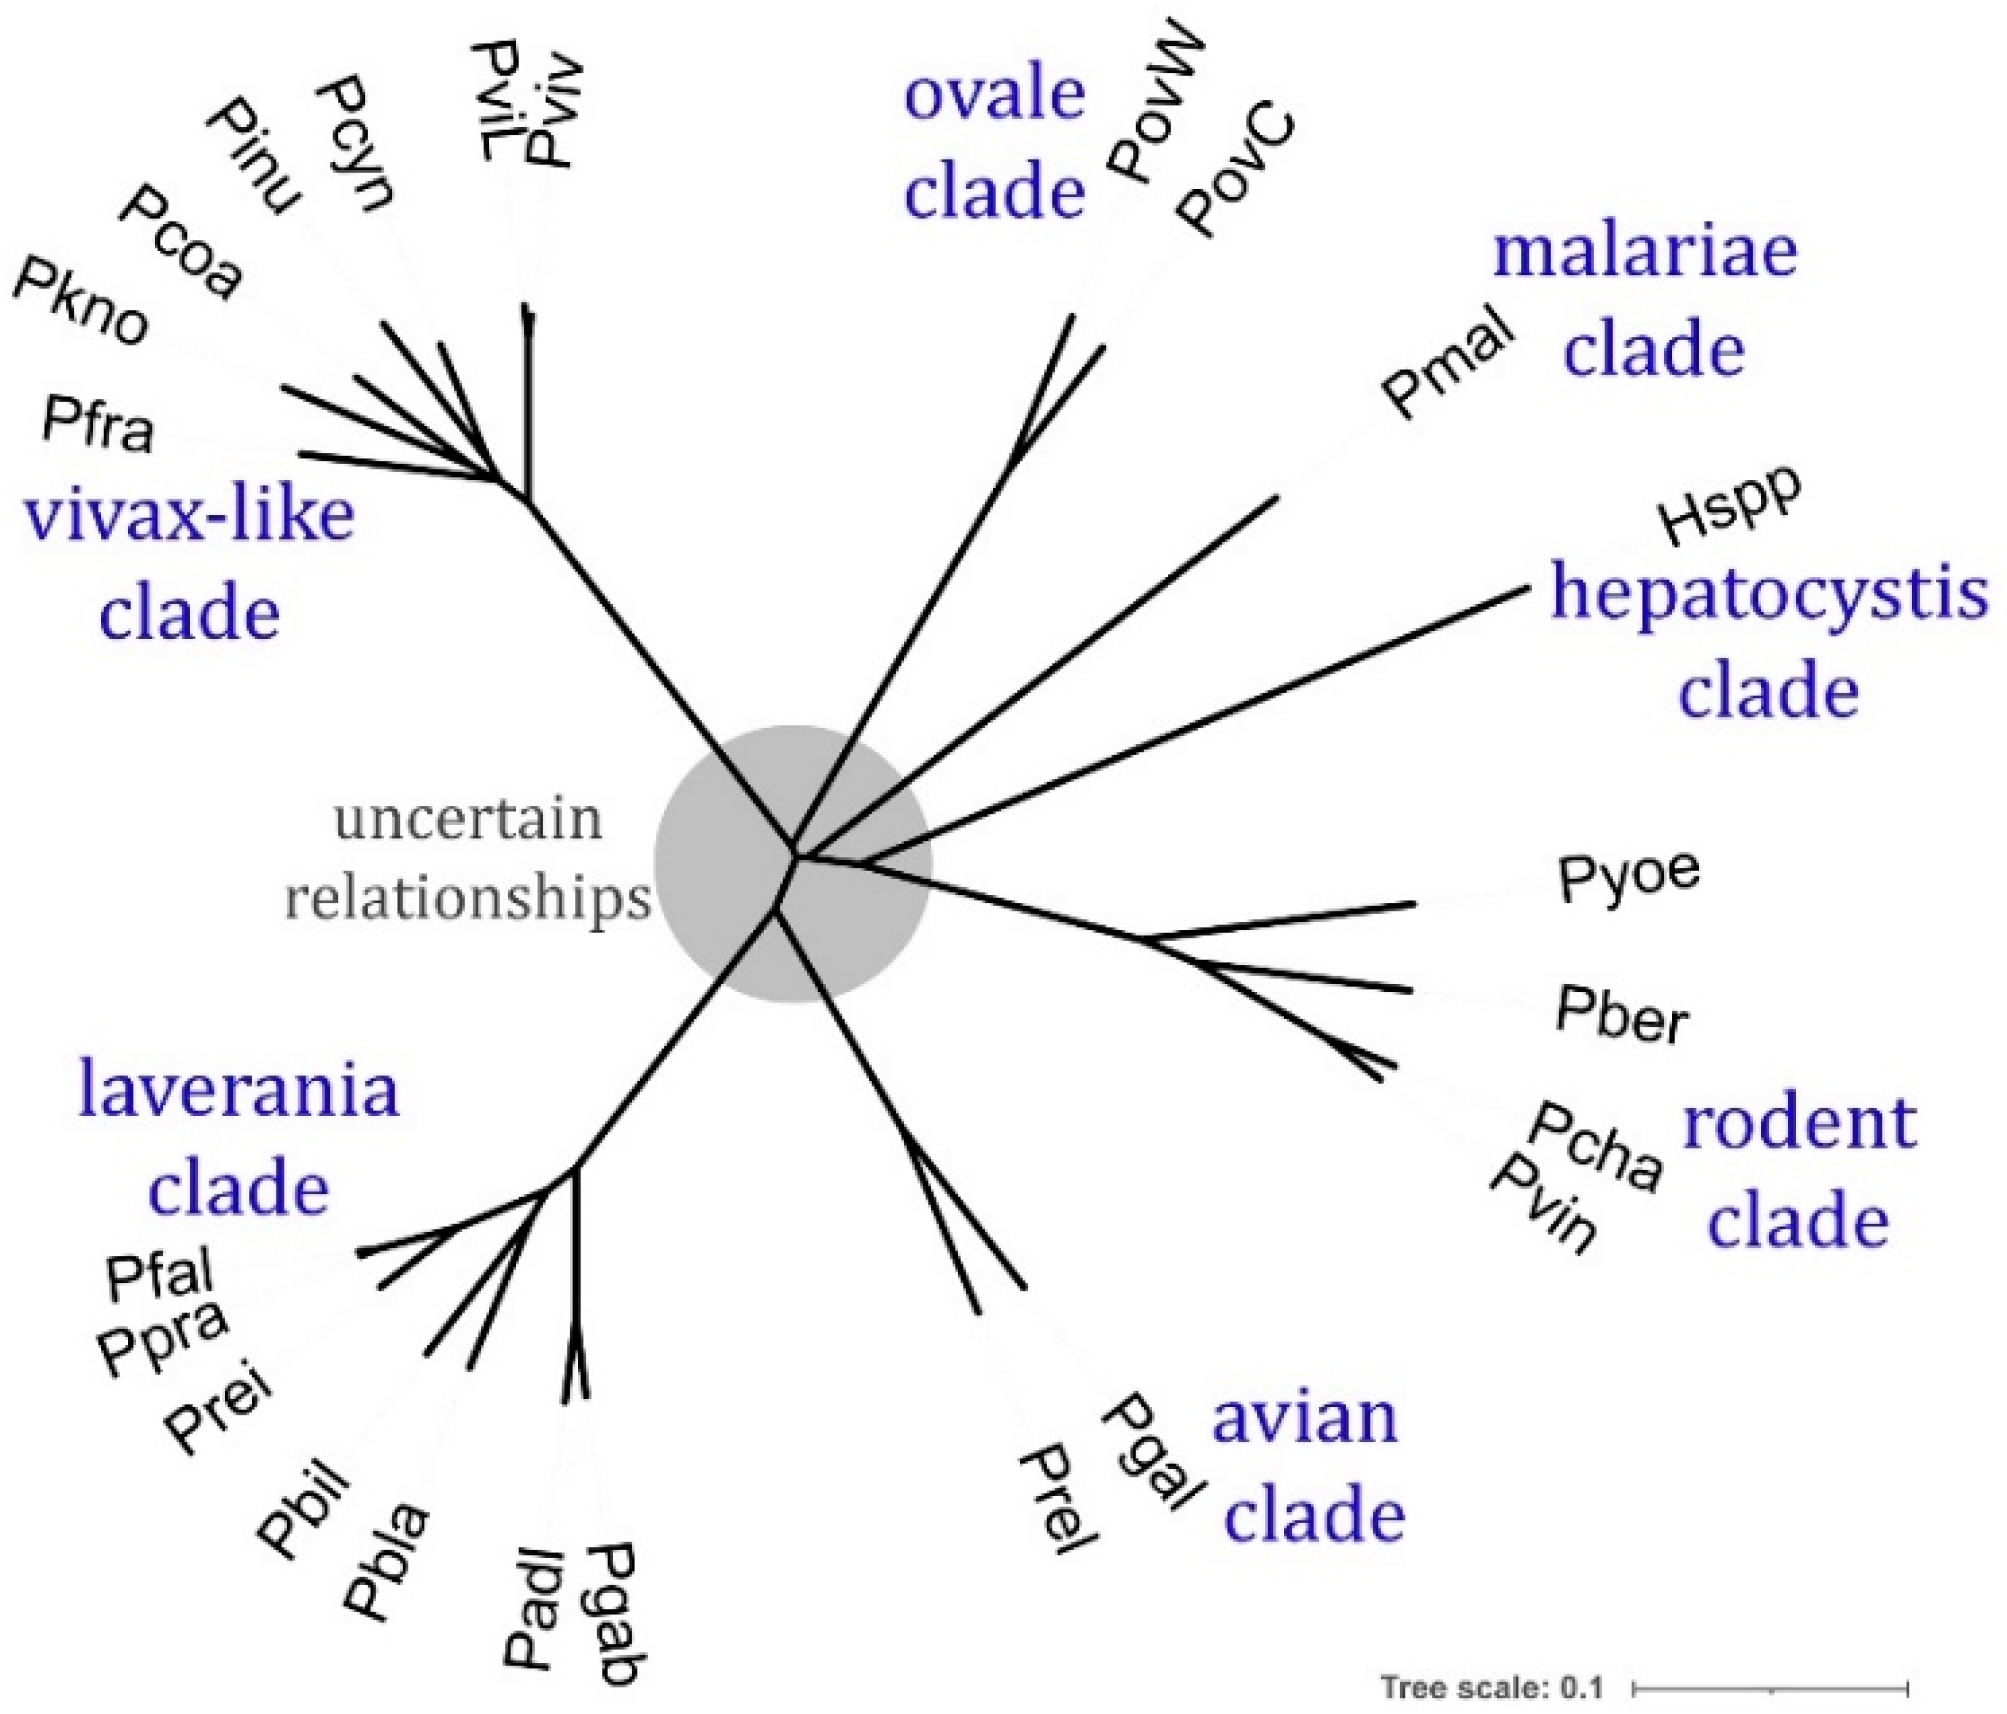
Figure 3.
Synteny of ATPase1 and ATPase3. Synteny of the ATPase1 and ATPase3 genes between Plasmodium species was originally analyzed with JBrowse [23] embedded within PlasmoDB [24]. ATPase1 and ATPase3 were aligned (blue) and the relative positions of the flanking sequences are shown in orange. The flanking sequences are an AN1-type zinc finger protein (ZnFP), a conserved unknown protein, the 40S ribosomal protein S11, and a putative protein with a RAP domain. The numbers in parentheses are the assigned chromosomes. In the parasite clades that have ATPase1 and ATPase3 on the same chromosome, the average distance between the genes in indicated in million base pairs (Mbp). .
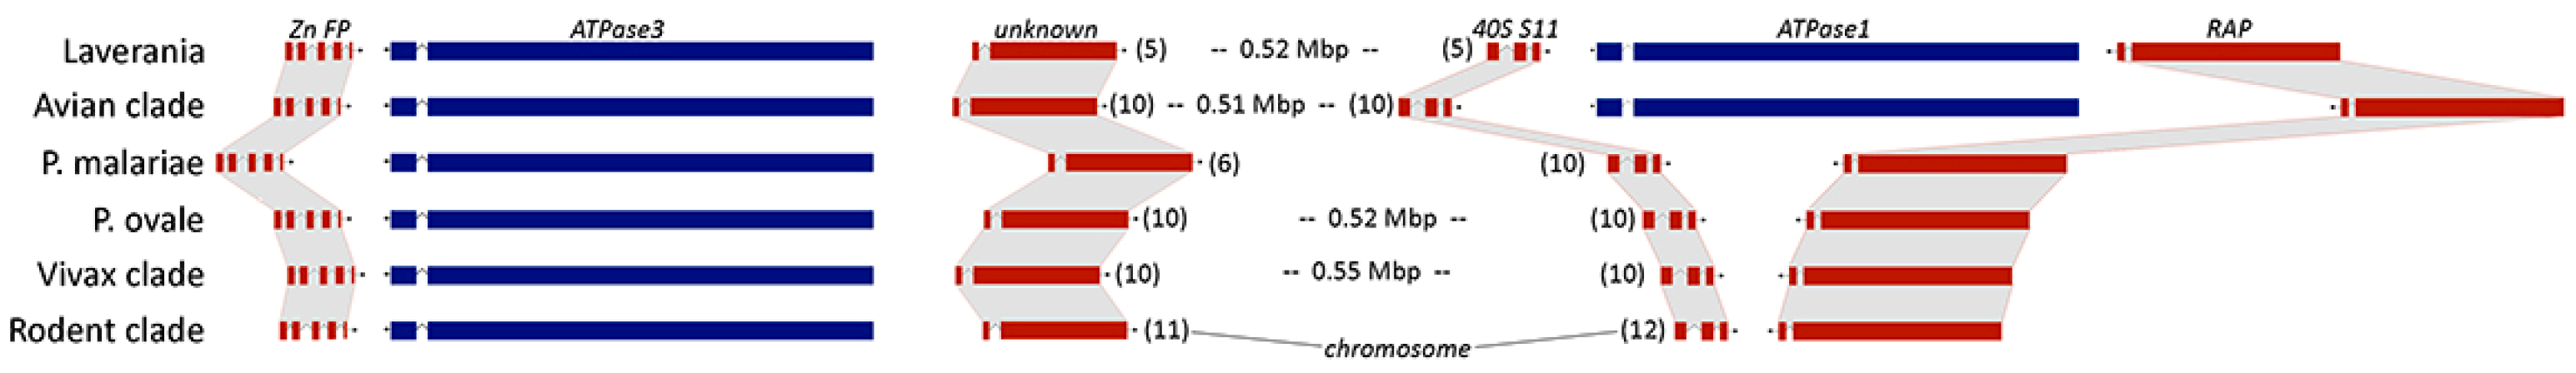
Figure 4.
Ribbon diagrams of ATPase1 and ATPase3 from Plasmodium relictum. Models were generated by Phyre® and visualized by PyMOL® using the template of a P5B-ATPase from Homo sapiens (PDB ID 7m5x). In the top two panels the cytoplasmic facing portions of the proteins are up and the lumen (or extracellular) facing portions of the proteins are facing down. Major domains are denoted and colored according to the following scheme: nMHL (limon), cTM (yelloworange), sTM (light orange), NTD (aquamarine), A-domain (tv green), N-domain (skyblue), P-domain (violetpurple), the kink in cTM4 (magenta), and the phosphorylation motif (magenta). The combined cTM and sTM are denoted as membrane (M) domain. Gray denotes residues not assigned to a domain or positions where residues were removed by the modeling program. In the bottom two panels the molecules were rotated to show the channel formed by the six core transmembrane helices (cTM#) which opens on the luminal side. The channel is transiently closed by the central kink in cTM4 (magenta side chains) and is circled.
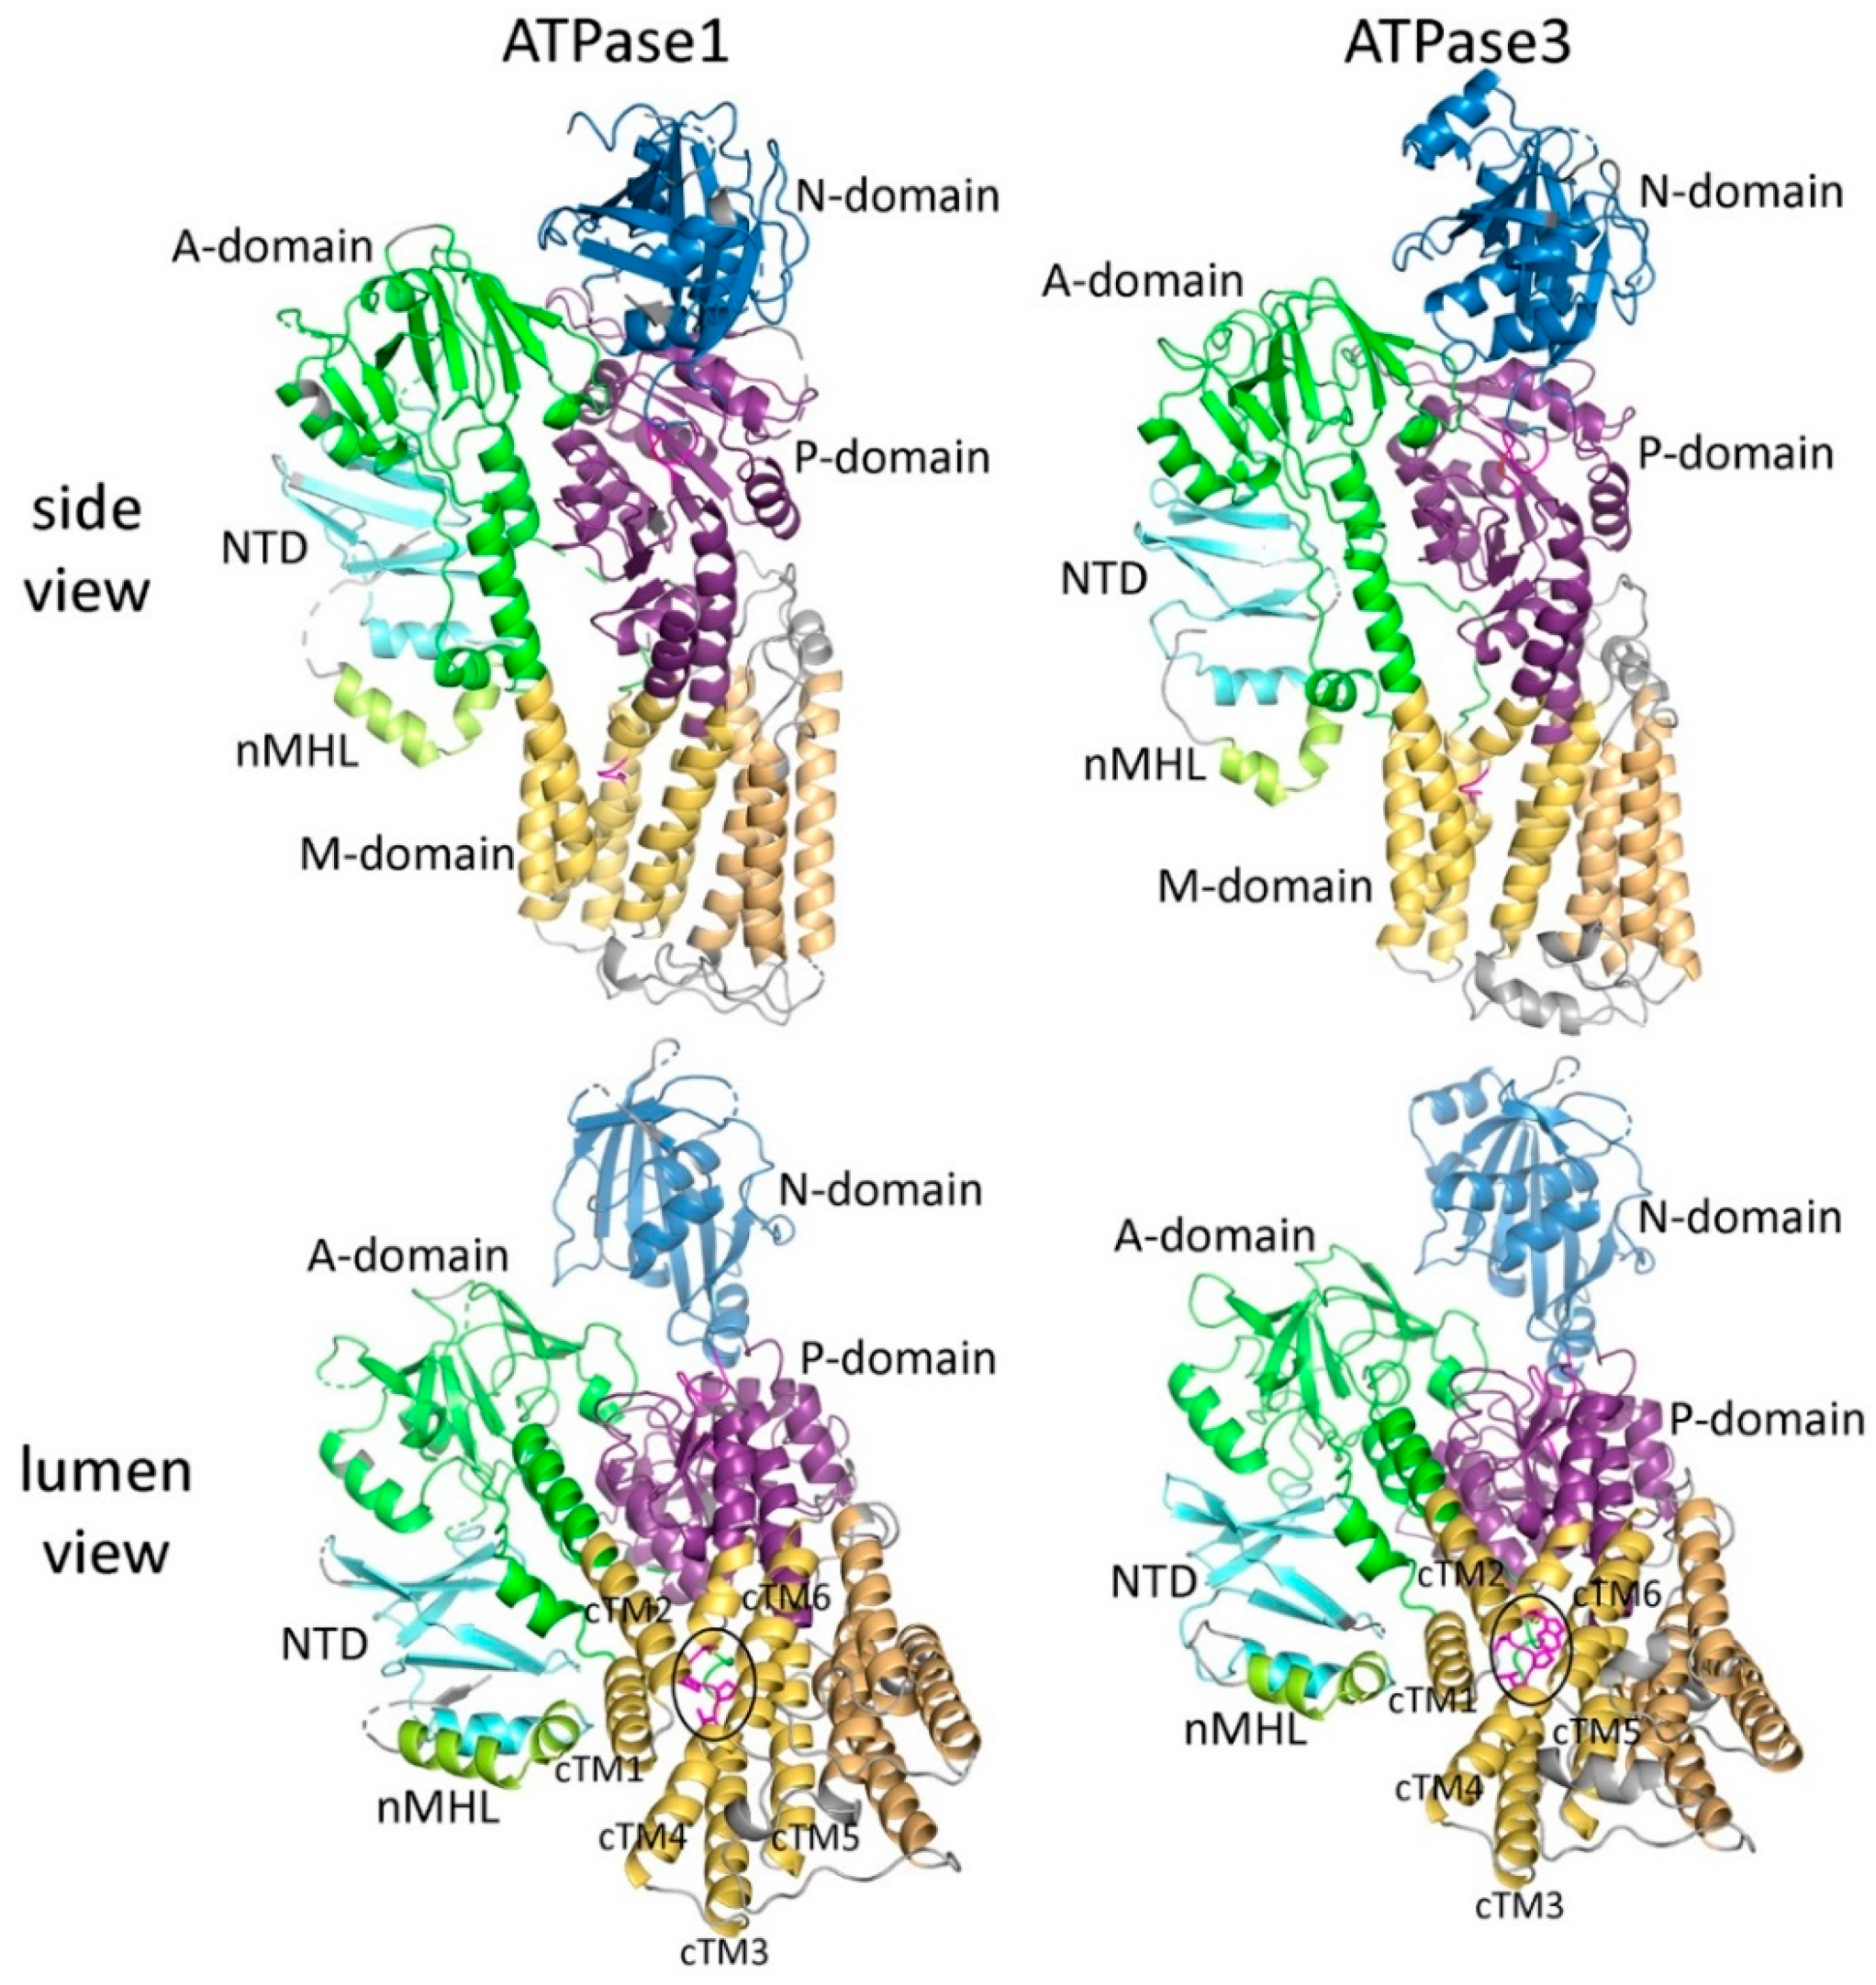
Figure 5.
Predicted binding site of ATPase1 and ATPase3. Shown are ribbon-diagram models of the substrate-binding channel (A) and alignments of the key residues forming this substrate-binding site (B). ATP13A2 (Acc. No. NP_071372.1) was used as a template (PDB ID 7m5x) to generate these structures and includes the bound spermine (spm). The six core transmembrane helices (cTM) form a channel that serves as the substrate binding site with the kink in the middle of cTM4 (magenta side-chains) closing this channel. Three of the cTMs are labeled and cTM1 is unlabeled in the background. cTM3 and cTM6 are not shown to better reveal the substrate-binding channel. Interactions between a tyrosine in cTM2 (Y2), a tyrosine in cTM5 (Y5), a glutamine in cTM5 (Q5), and an aspartate in cTM6 (D6) in ATP13A2 stabilize the binding channel, and the side-chains of these four residues are shown (green). Conservation of this tetrad in the apicomplexans are also colored green and deviations are colored aqua. Side-chains of charged residues are also shown with red denoting negative (-) charges and blue denoting positive (+) charges. A polar replacement of a negative charge is colored pink. Two aspartate residues in ATP13A2 participate in binding the spermine substrate. The three basic types of substrate-binding sites are shown, and the substrate-binding sites of all fifteen select apicomplexan sequences are shown in Supplemental Figure S4c. The alignment shows the key residues making up the substrate-binding site with membrane helices shaded in gray and the four residues making up the tetrad denoted with T’s. Conserved tetrad residues are highlighted in green, and deviations are highlighted in aqua. Dark green shading denotes polar residues next to a polar tetrad residue. Negatively charged residues (-) are highlighted in red and positive residues (+) in blue. Polar replacements of the glutamate residues (E) are shaded in purple.
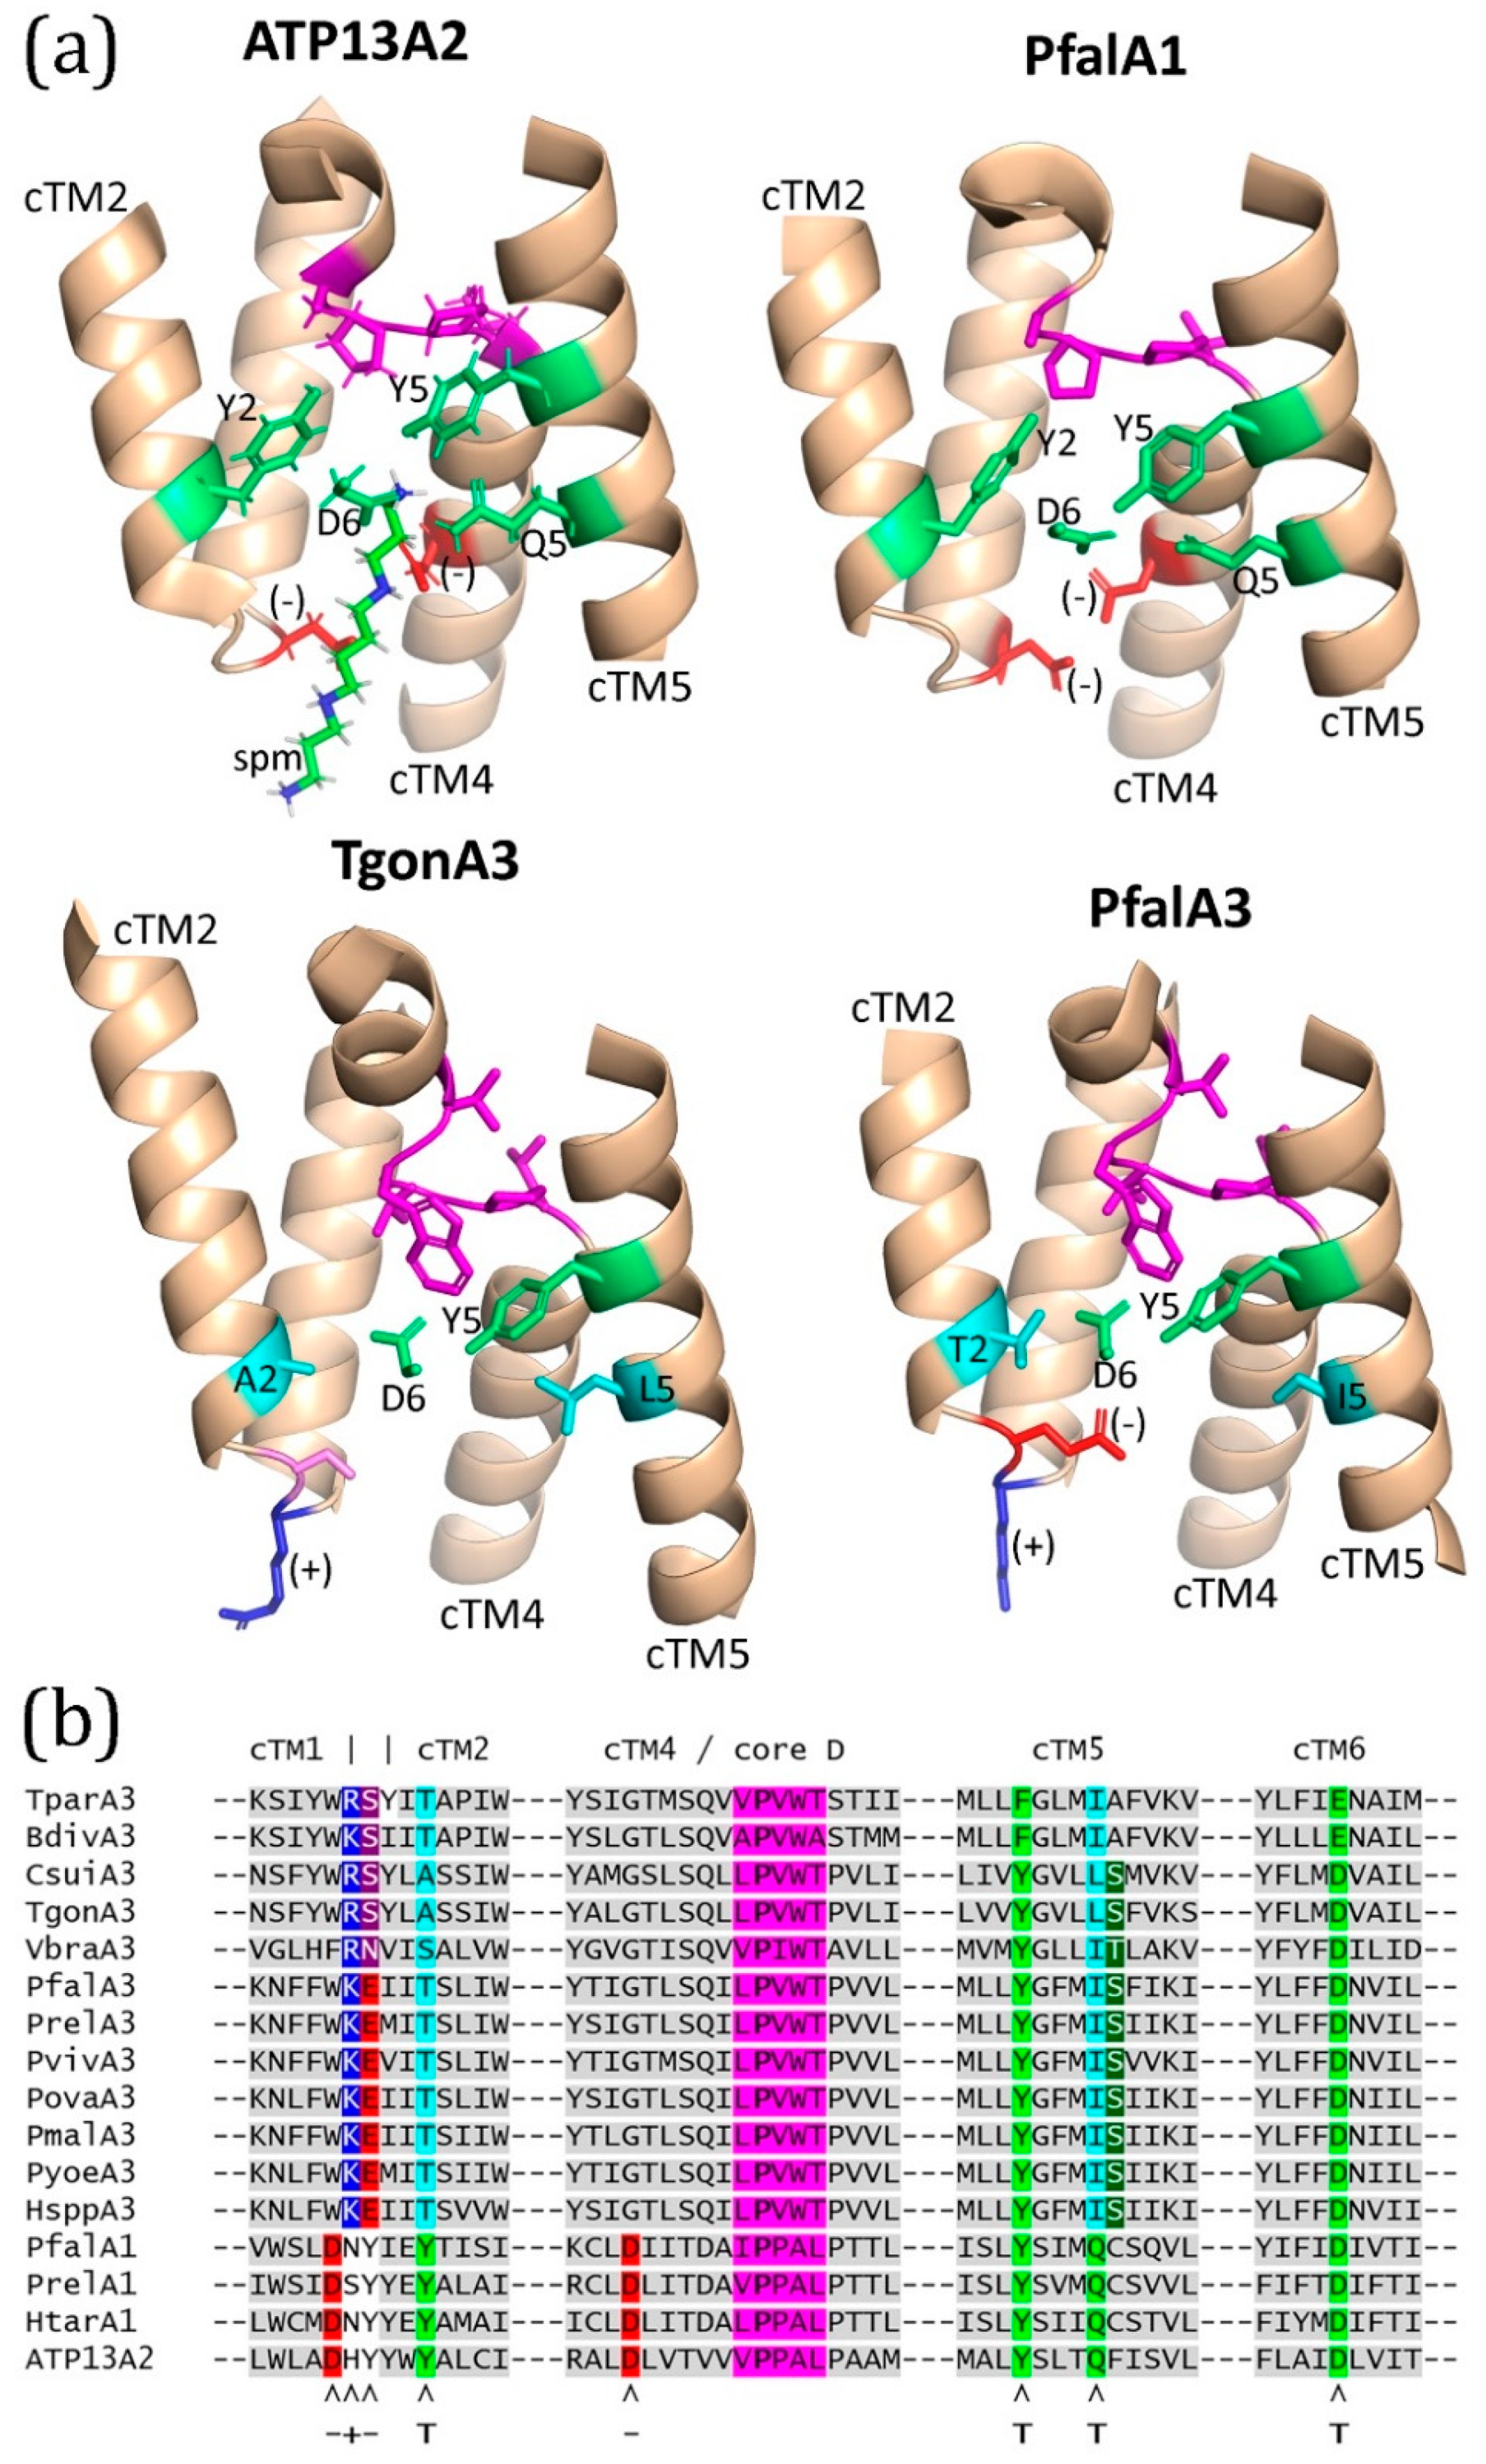
Figure 6.
Possible change in the phylogeny of haemosporidians associated with ATPase1. The panel on the left (a) shows possible branching order of major genera [14,15] as modified from Figure 3 of Wiser (2024) [28] with permission. The panel on the right (b) shows how the phylogeny changes with the gain of ATPase1 (arrowhead). Branch lengths do not depict evolutionary distances and branches do not depict the true complexity of Haemosporidia. The gain of hemozoin formation is denoted with a filled circle and gain or loss of erythrocytic merogony is denoted with a filled or open square (a), or erythrocytic merogony is denoted with asterisks (b).
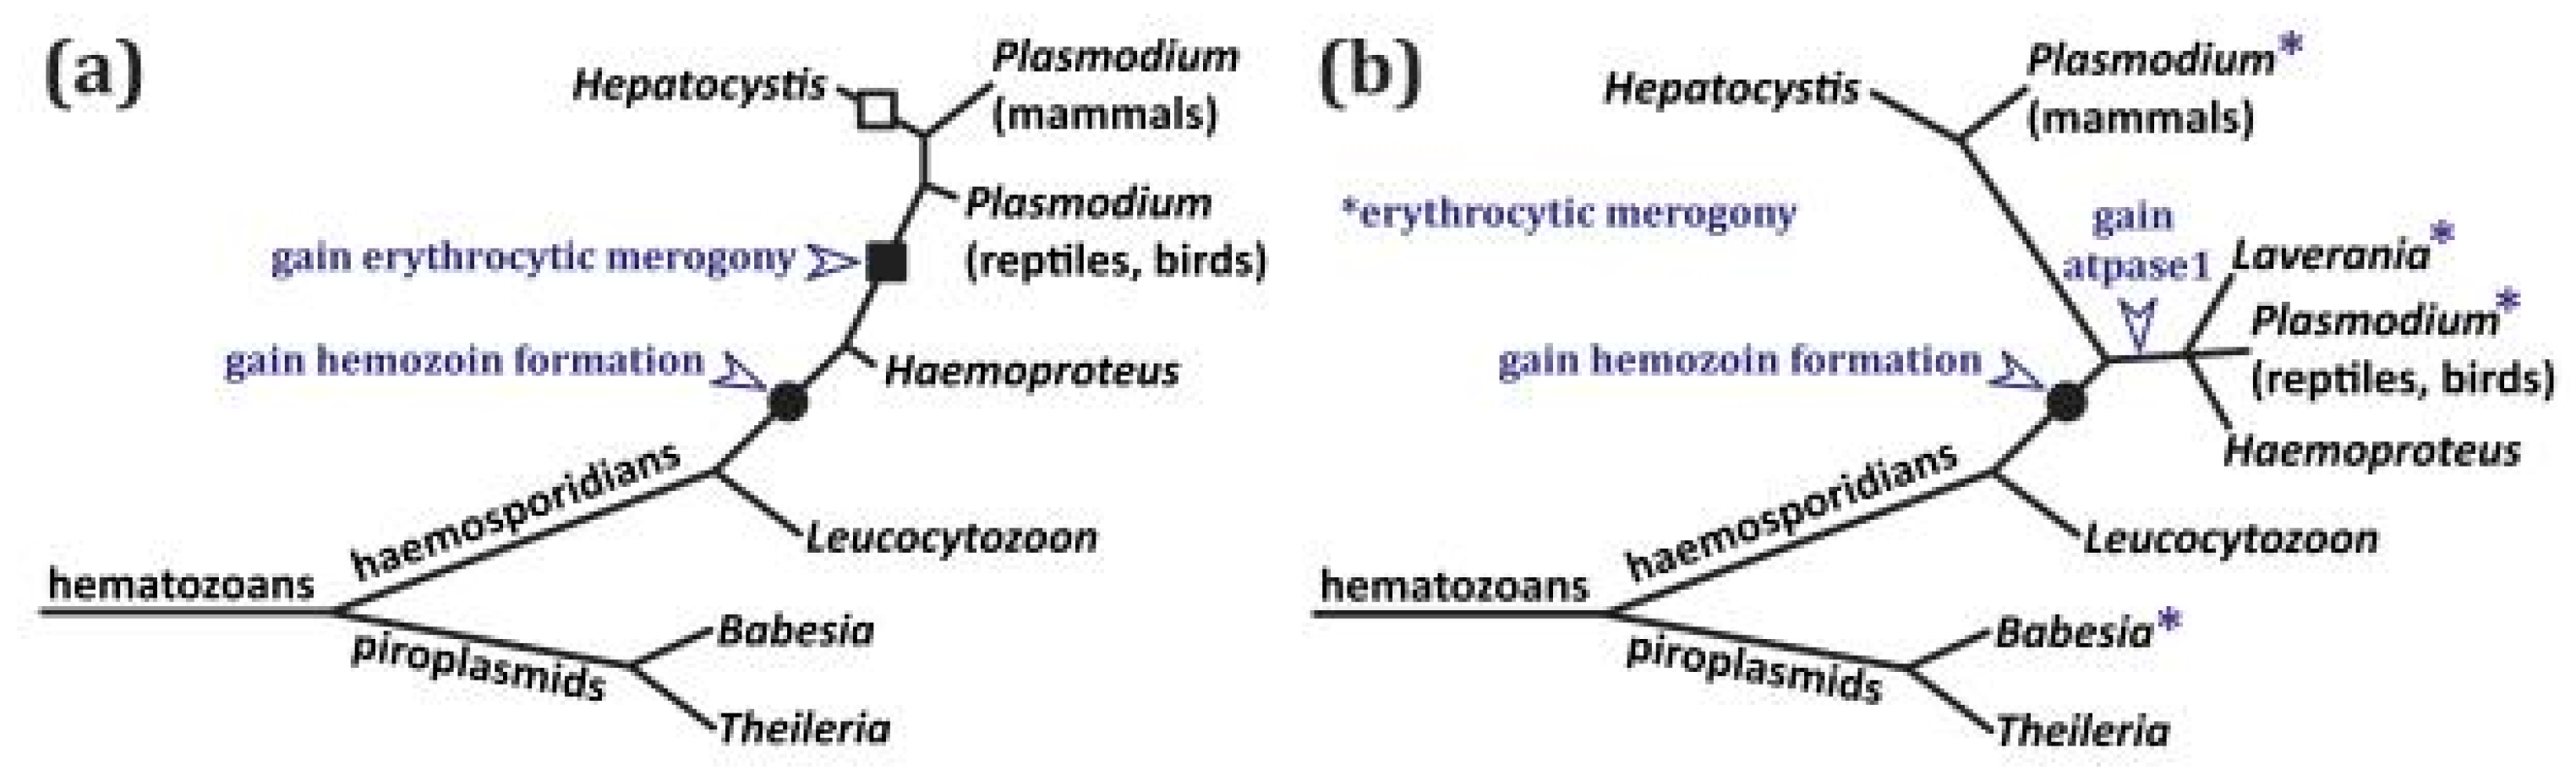

Table 1.
Results of BLAST searches using ATPase3 or ATPase1 as queries in a search for non-Plasmodium orthologs.
Table 1.
Results of BLAST searches using ATPase3 or ATPase1 as queries in a search for non-Plasmodium orthologs.
| Taxonomic Group | PfATPase3 | PfATPase1 |
|---|---|---|
| Piroplasmids | 5E-70 – 2E-101 | 9E-39 |
| Coccidians | 8E-62 – 6E-64 | 5E-33 |
| Vitrella brassicaformis (colpodellid) | 1E-87 | 5E-40 |
| Cryptosporidia | 4E-48 | 2E-30 – 1E-30 |
| Ciliates | ND | 6E-31 – 3E-34 |
| Oomycetes (stramenopile) | 3E-48 – 1E-53 | ND |
| Fungi | 4E-48 – 2E-52 | 3E-30 – 8E-35 |
| Bee (insect) | ND | 2E-42 |
| Anaeramoeba ignava (metamonad) | ND | 4E-32 – 7E-34 |
| The range of E-values from a BLAST search using PfATPase3 or PfATPase1 as queries is shown for the indicated group or species. A single E-value means that there was a single hit for that taxonomic group. ND = none detected in the top 100 hits for PfATPase3 nor the top 50 hits for PfATPase1. No common subjects (i.e., hits) were identified between the top 100 hits using PfATPase3 as a query and the top 50 hits using PfATPase1 as a query. | ||
Table 2.
Ranks of common and top-scoring templates identified by Phyre® with ATPase1 (A1) and ATPase3 (A3) sequences.
Table 2.
Ranks of common and top-scoring templates identified by Phyre® with ATPase1 (A1) and ATPase3 (A3) sequences.
| Species (queries) | 7op1 | 6xms | 8ier | 7m5x | 7n78 | 7fjp | 3b8c |
| Plasmodium falciparum (A1) | 1 | 7 | 5 | 4 | 6 | 3 | 2 |
| Plasmodium relictum (A1) | 1 | 6 | 4 | 2 | 3 | 5 | 31 |
| Haemoproteus tartakovskyi (A1) | 1 | 7 | 3 | 2 | 5 | 6 | 40 |
| Plasmodium falciparum (A3) | 2 | 6 | 5 | 4 | 7 | 8 | 1 |
| Plasmodium relictum (A3) | 1 | 3 | 4 | 6 | 2 | 5 | 10 |
| Plasmodium vivax (A3) | 5 | 6 | 2 | 4 | 1 | 3 | 26 |
| Plasmodium malariae (A3) | 1 | 2 | 3 | 4 | 5 | 6 | 18 |
| Plasmodium ovale (A3) | 2 | 6 | 1 | 5 | 3 | 4 | 32 |
| Plasmodium yoelii (A3) | 1 | 2 | 3 | 4 | 5 | 6 | 7 |
| Hepatocystis spp (A3) | 3 | 2 | 10 | 4 | 7 | 6 | 1 |
| Vitrella brassicaformis (A3) | 5 | 6 | 2 | 4 | 3 | 1 | 13 |
| Theileria parvum (A3) | 1 | 6 | 3 | 5 | 2 | 4 | 19 |
| Babesia divergens (A3) | 2 | 6 | 5 | 3 | 1 | 4 | 33 |
| Toxoplasma gondii (A3) | 1 | 6 | 3 | 4 | 2 | 5 | 7 |
| Cystoisospora suis (A3) | 3 | 6 | 5 | 4 | 2 | 1 | 24 |
| Sequences from the indicated species were analyzed by Phyre® and shown are the ranks of common templates (denoted with PDB IDs in column headers) for each of the species. These templates are Ypk9 from Chaetomium thermophilum (7op1), ATP13A2 of Homo sapiens (8ier, 7m5x, 7n78, or 7fjp), a P5A-ATPase from Saccharomyces cerevisiae (6xms), and a sodium-potassium pump from Sus scrofa (3b8c). | |||||||
Disclaimer/Publisher’s Note: The statements, opinions and data contained in all publications are solely those of the individual author(s) and contributor(s) and not of MDPI and/or the editor(s). MDPI and/or the editor(s) disclaim responsibility for any injury to people or property resulting from any ideas, methods, instructions or products referred to in the content. |
© 2024 by the authors. Licensee MDPI, Basel, Switzerland. This article is an open access article distributed under the terms and conditions of the Creative Commons Attribution (CC BY) license (http://creativecommons.org/licenses/by/4.0/).
Copyright: This open access article is published under a Creative Commons CC BY 4.0 license, which permit the free download, distribution, and reuse, provided that the author and preprint are cited in any reuse.


