
Submitted:
10 December 2024
Posted:
11 December 2024
You are already at the latest version
Abstract
Natural products and synthetic small molecules have been extensively studied as potential therapeutics against Mycobacterium tuberculosis (Mtb), particularly drug-resistant strains. The caseinolytic protein C1 (ClpC1) has emerged as a promising drug target for combating Mtb, and accurate measurement of its ATPase activity is essential for elucidating the mechanisms of drug candidates. In this study, we optimized a highly sensitive ATPase assay for ClpC1 and compared the enzymatic activity of various constructs, including N-terminal His6-SUMO-tagged, C-terminal His6-tagged, native full-length (FL) ClpC1, and smaller domains. Our results demonstrated that the N-terminal tag significantly impairs ClpC1 activity, whereas the C-terminal tag has no such effect. Additionally, smaller domains exhibited markedly reduced enzymatic activity compared to FL-native ClpC1. Taking the native ClpC1 forward, we tested three natural products—rufomycin (RUF), ecumicin (ECU), and cyclomarin A (CYMA)—and observed varying degrees of ATPase activity enhancement. ECU and five of its analogs were further evaluated, yielding AC50 values consistent with their binding affinities (KD) measured by surface plasmon resonance (SPR). RUF and CYMA exhibited strong KD values of 0.023 µM and 0.006 µM, respectively, and minimal inhibitory concentrations (MICs) of 0.02 µM and 0.094 µM, respectively. However, their ATPase activity enhancement was modest (<93%). In contrast, ECU and its analogs significantly enhanced ATPase activity (up to 830%) despite weaker MICs and KD values compared to RUF and CYMA. These findings suggest that RUF/CYMA and ECU may operate via distinct mechanisms of action, offering valuable insights for the development of ClpC1-targeting therapeutics against tuberculosis.
Keywords:
ClpC1
; ATPase assay
; SPR
; Tuberculosis
; Cyclic peptides
1. Introduction
Tuberculosis (TB) is an infectious disease that mainly affects the lungs. The causative agent of most cases of TB is a pathogenic bacterial species called Mycobacterium tuberculosis (Mtb) [1]. As per WHO reports, TB is one of the major public health concerns, accounting for approximately 1.5 million deaths per annum globally [2]. Concerningly, the COVID-19 pandemic has aggravated the already grim situation of TB globally [2]. The current treatment regimen to cure TB, is rather tedious and oftentimes inefficient [3]. Additionally, the emergence of multidrug resistant (MDR), extremely drug resistant (XDR) variants, and totally drug-resistant (TDR) strains of TB [4]; as well as prevalence of disease due to drug-sensitive (DS) TB [5] has warranted the need to develop more effective therapeutics, involving novel targets and new chemical entities.
One of the attractive drug targets is the essential ClpC1–ClpP1–ClpP2 protease of Mtb [6,7] which plays a crucial role in bacterium’s viability [8,9]. The functional protease is formed by an association of a hexameric, ring-forming ATPase, ClpC1, and heptameric barrel-forming peptidases ClpP1 and ClpP2 [10]. The ClpC1 utilizes the energy of ATP binding and hydrolysis to engage, unfold and translocate substrates into the catalytic chamber of tetradecameric ClpP, where they are degraded [11]. ClpC1 is a 95 kDa caseinolytic AAA+ unfoldase consisted of an N-terminal domain (NTD) and two nucleotide binding domains (D1 and D2) (Figure 1). The NTD (a.a. 1-145) has been studied extensively to understand the critical residues for binding of ClpC1 to several natural cyclopeptides with potent anti-TB activity. Many relevant X-ray structures have been deposited in the Protein Data Bank (PDB), with the most recent ones including those of apo Mtb ClpC1-NTD [4] (PDB entry 6PBA, 6PBQ), cyclopeptide bound Mtb ClpC1-NTD (PDB entry 6PBS [4] and 6CN8 [12]), and mutants of Mtb ClpC1-NTD [4] (6UCR). The cryo-EM structures of Mtb ClpC1 hexamer in the apo and peptide bound form has also been reported recently [13] (PDB 8A8U, 8A8V and 8A8W). The entire assembly consists of two heptameric pieces of ClpP1 and ClpP2 forming an overall tetradecameric cylindrical shaped barrel, upon which the ClpC1 unit binds and where the degradation of the substrate occurs (PDB entries 5DZK [14] 5E0S [14] 6SFW [15] and 6SFX [15]). For ClpC1, several macrocyclic peptides that specifically interact with it have been shown to disrupt the normal functioning of the protease [16], validating it as a target for TB therapeutics.
One way to evaluate the effectiveness of macrocyclic peptides in regulating the function of ClpC1 is by measuring the ATPase activity of ClpC1 in vitro in the presence of these peptides. Two popular non-radioactive enzyme assays have been used to measure ATPase activity; Malachite Green Assay and Pyruvate Kinase (PK)/Lactate dehydrogenase (LDH) coupled assay (Figure 2a). The former involves the colorimetric determination of inorganic phosphate (Pi), a common approach for measuring ATPase or protein phosphatase activity [18], The malachite green dye and phosphomolybdate form a complex that exhibits an absorbance signal at 620 nm [19]. The method utilizes a single-color reagent (CR), detects Pi at sub micromolar concentrations (ε ≈ 80 000 M−1 cm−1), and with color development mostly complete in 10–30 min. One major shortcoming is that ATP can undergo non-enzymatic hydrolysis in the presence of strong acids which are required to stabilize the dye complex. This results in the Pi release at the color development stage which can hamper the accurate determination of enzymatically released Pi especially when ATP is present at low micromolar concentrations [20]. This limitation can be overcome by sample dilution coupled with precise timing of quenching and the use of blank wells for subtraction, or by using a chelating agent such as citric acid to quench the color development. However, these approaches bring an additional step and reagent to the assay. Therefore, improved alternative methods are needed.
The PK/LDH is a classic coupled-enzyme assay [21], which measures enzyme activity by detecting ADP. During the reaction, PK uses the ADP produced by the target enzyme to convert phosphoenolpyruvate to pyruvate and in the process regenerate ATP. Pyruvate is then reduced to lactate by LDH accompanied by the oxidization of NADH to NAD+ which is measured by the decrease of absorbance at 340 nm. One advantage of this method is its continuity, as it enables the measurement of enzyme activity over time and allows for the determination of enzyme rate in a single run. The major limitation of this PK/LDH assay is the readout at low wavelength (340 nm), which can have interference from testing compounds.
The ADP-Glo™ Assay is based upon measurement of ADP formation by luminescence signal readout [22]. It provides a homogeneous, high-throughput screening method to measure kinase activity. It is a universal and robust platform for evaluating catalytic function of protein kinases across different families [23], sugar kinases, lipid kinases as well as other ATPases [24]; and is applicable to a broad range of ATP and substrate concentrations. The detection assay is carried out in two steps after the kinase or ATPase reaction has taken place (Figure 2b). First, ADP-Glo™ Reagent is added, which terminates the enzyme reaction and converts the remaining ATP. Second, the Detection Reagent is added which converts ADP to ATP. The newly generated ATP is then quantified using a luciferase/luciferin reaction. The luminescent signal, which is measured using a microplate reader, is proportional to the ADP concentration and hence correlates positively with the enzyme activity. The primary advantage of this method is its high signal-to-noise ratio, which provides a sufficient signal window for testing drug candidates, making it an ideal approach for kinase and ATPase profiling. Here, we present a streamlined method utilizing the optimized ADP-Glo™ Assay to measure ClpC1 ATPase activity with robust luminescence signals. By employing low-volume 384-well plates, we effectively evaluated the effects of several macrocyclic peptides on ClpC1 ATPase activity using minimal use of assay components.
2. Results and Discussion
2.1. His6-SUMO-FL-ClpC1 and Native FL-ClpC1 Purification and Oligomerization Status
The Mtb clpC1 gene (2544 base pairs) was cloned with a His6-SUMO-tag at the N-terminus of the FL-ClpC1, encoding a 848 amino acid residue protein. The SUMO is an 11-kDa size small ubiquitin-related modifier, and SUMO protease recognizes SUMO structure and cleaves at the C-terminal end of the SUMO without leaving any extra amino acid residues, producing a native FL-ClpC1 protein. Despite the relatively large molecular weight of His6-SUMO-FL-ClpC1 at 107 kDa, its overexpression in E. coli exhibited notable levels of expression and solubility. (lanes 2 and 3 in Figure 3a). After two-step (HisTrap affinity-Size Exclusion Chromatography) purification, fractions with over 90% purity were pooled (lanes 6-8 in Figure 3a) followed by His6-SUMO tag cleavage. The His6-SUMO-tagged FL-ClpC1 was also collected for enzyme activity comparison. According to the UV280 profile from 16/60 Superdex 200 Size Exclusion chromatography, the His6-SUMO-tagged FL-ClpC1 was eluted out as ~83% monomers and ~10% oligomers in a buffer with no ATP present (Figure 3b).
Recent studies have shown that ClpC1 protein exhibits various oligomerization states, two of which are active hexameric form and inactive decamers [13,25]. Decamers are formed by two pentamers stacked head-to-head via M-domain. We investigated oligomerization status by Mass Photometry (MP) technique. The Refeyn TwoMP Mass photometer can measure single molecules in solution in their native state, acquiring molecular weight distribution and relative concentrations of all species in a sample using scattered light and reflected light. The purified native FL-ClpC1 existed as three species, 49% monomers, 6% pentamers, and 37% decamers in the buffer containing 5 mM ATP (Figure 3c). Dimers were also observed as a tail of the monomers although it is not prominent. Native FL-ClpC1 seems to be able to form oligomers in the presence of 5 mM ATP, but it remains in inactive forms in the absence of its substrate since hexamers are not detected.
2.2. ATPase Activity Comparison of His6-SUMO-FL-ClpC1 and Native FL-ClpC1
The ClpC1 ATPase breaks down ATP to free phosphate and ADP (Figure 2a), and hence we optimized highly sensitive luminescence assay detecting ADP formation by ClpC1 using a commercially available ADP-Glo kinase assay kit. First, we tested a series of increasing concentrations of ATP from 7.8 µM to 500 µM to find the best ATP concentration for investigating ClpC1 ATPase activity using 1 µM ClpC1. The half maximum ATP concentration was determined to be 125.4 ± 7.4 µM (Figure 4a), and slightly lower (80 µM) ATP concentration was selected for ClpC1 enzyme assay. Second, the pH effect on ClpC1 ATPase activity was determined by testing various pHs from pH 5.0 to pH 10.0. The ATPase activity of ClpC1 was shown higher in acidic conditions compared to basic conditions with the most active at pH 7.5 (Figure 4b). Therefore, ClpC1 enzyme assay buffer was finalized with 50 mM Tris-HCl (pH 7.5), 5 mM MgCl2, 200 mM KCl, 80 µM ATP, and 0.5 mM DTT.
Enzyme activity of the two forms of FL-ClpC1 proteins, native FL-ClpC1 and His6-SUMO-FL-ClpC1, were compared with an optimized assay buffer to see whether the N-terminal His6-SUMO-tag affects enzyme activity of the ClpC1. Both native FL-ClpC1 and His6-SUMO-FL-ClpC1 were investigated in a series of concentrations (0 – 1.0 µM at 2-fold dilution). The native ClpC1 enzyme possessed 4-5-fold higher enzyme activity than that of the His6-SUMO-tagged one at all tested concentrations (Figure 4c and 4d), indicating the His6-SUMO-tag at the N-terminus does interfere with its enzyme activity. The results from the enzyme concentration of 1 µM were not presented in the graph due to excessive luminescence signals produced by native FL-ClpC1. We optimized enzyme concentration at lower concentrations that can still produce remarkable signal to noise (S/N) ratio, while remaining within linear ranges so as to accurately measure initial velocity. According to these data, native ClpC1 enzyme concentration can be used between 0.125 and 0.25 µM.
2.3. The Full-Length is Required for the Full ATPase Activity of ClpC1
Mtb ClpC1 contains two ATP binding sites; one is in D1 and the other in D2 domains (Figure 1A and 1B). We were curious to find out which domains are required for ATPase activity of ClpC1, and hence various lengths of ClpC1 constructs were cloned and purified (Figure 5a). In addition to domains, C-terminal His6-tagged ClpC1 (1-842) was also prepared to see whether His6-tag at the C-terminus affects its enzyme activity or not since N-terminal His6-SUMO-tag significantly reduced ATPase activity. Interestingly, C-terminal His6-tag did not interfere with ATPase activity of ClpC1, possessing the exact same enzyme activity as the native ClpC1 (Figure 5b). D1 domain alone and D1-D2 domains together exhibited only 32% and 28% of the native FL-ClpC1, respectively (Figure 5b). NTD and NTD-D1 showed minimal enzyme activity levels below 10%. Oddly, D1 domain alone showed about 2-fold higher ATPase activity than that of NTD-D1, indicating NTD somehow interferes with enzyme activity of D1 domain. The Circular Dichroism (CD) profiles of FL-ClpC1 and D1D2 were similar, suggesting the absence of the NTD domain does not alter the overall secondary structure of D1D2 (Figure 5c). Taken together, native N-terminus is important for the ATPase activity of ClpC1, and the full-length ClpC1 is necessary for the full enzyme activity.
2.4. Effects of Macrocyclic Peptide on Mtb ClpC1 ATPase Activity
Our previous studies have identified two natural products, RUF and ECU, with inhibitory activity against Mtb infected cells [26]. Both RUF and ECU possess sub-micromolar minimum inhibitory concentration (MIC) values against Mtb H37Rv strain at 0.02 and 0.16 µM, respectively [27]. Another already known natural product, CYMA, exhibits MIC value at 0.094 µM against the same strain. The direct binding affinities (KD) of RUF, ECU, and CYMA, with the FL-ClpC1 have been also determined at 86.6, 70.9, and 3.1 nM, respectively [12]. However, how these natural products affect the ClpC1 ATPase activity is still yet to be determined. We have investigated ATPase activities of the native FL-ClpC1 using 0.125 µM enzyme concentration in the absence and presence of a series of increasing concentrations of these three natural products. Even though all three natural products enhanced ATPase activity of the ClpC1, the degree of activation varied significantly from only ~55% (CYMA) to almost 700% (ECU) (Figure 6a – 6c). The ATPase activity enhancement by RUF was in the middle at ~90%. Half-maximal activation concentration (AC50) values were similar at 0.23 – 0.38 µM. We further investigated the identical natural product effects with 2-fold higher ClpC1 concentration at 0.25 µM and observed ~2-fold higher activation by ECU reaching to 1530%, while RUF and CYMA slightly further enhanced reaching to 155% and 75%, respectively (Figure 6d). The reported MIC values of ECU, RUF, and CYMA are 0.16, 0.02, and 0.094 µM, respectively [26]. Despite all three cyclic peptides having good MIC values against an Mtb strain, we show that they have drastically different levels of enhancements of ClpC1 ATPase activity.
2.5. AC50 Value Comparison of ECU and Its Five Analogs
ATPase activity of native ClpC1 was initially monitored every 10 minutes for a total of 1 hour. As can be seen in Figures 4c, 4d, and 6, enzyme reactions show linear during 1 hour of measurement at both 0.125 µM and 0.25 µM ClpC1 concentrations. Hence, we can safely let enzyme reaction to occur at least 40 minutes to 1 hour and measure the signal without compromising the outcome. Next, we have investigated the enzyme activity effect and binding affinities of ECU and its five analogs for comparison. Structures are shown in Figure 7a. All six cyclic peptides were incubated with ClpC1 for 40 minutes at various cyclic peptide concentrations to allow ATPase enzyme reactions to occur, and enzyme activities were measured at a single time point in order to simplify assay steps and also save assay reagents. The determined AC50 value of ECU was reproducible at 0.34 ± 0.025 µM by single time point measurement, comparable to 0.38 ± 0.018 µM determined by six time point measurement. ClpC1 ATPase activity enhancement by ECU was highest at ~820%, while three analogs (norECU, deoxyECU, and nordeoxyECU) enhanced similarly at ~650% (Figure 7b & 7c). Two analogs with slightly shorter tail, OMSA and OMSB [28,29] showed lower activation levels at 470% and 236%, respectively. Analogues of ECU with the same tail length demonstrated comparable AC50 values ranging from 0.19 to 0.38 µM, whereas OMSA and OMSB displayed significantly higher AC50 values at 1.25 µM and 3.05 µM, respectively. This observation implies that the tail length may play a role in determining their activity.
2.7. Comparison of AC50, KD, and MIC Values
Consistent with the AC50 values, the KD values of ECU and three analogs with the same tail length were comparable, whereas OMSB exhibited the weakest binding affinity at 2.15 µM. Finally, we compared KD and AC50 (with max activation) values with cellular activity by MIC values in Figure 9a. RUF and CYMA have very tight binding to ClpC1 with good MIC values at 0.02 µM and 0.094 µM, respectively. However, their ability to enhance ATPase activity of ClpC1 was low at below 93%, whereas that of all ECU analogs and ECU was much higher up to 830%. This suggests that RUF and ECU may have different mechanisms of action. Correlation among these three parameters, MIC, KD and AC50, were analyzed by plotting them (Figure 9). The overall MIC values correlate KD1 and AC50 values in log scale (Figure 9b and 9c). However, each of these three analyses can offer different aspects of the interaction between ClpC1 and its modulators, providing valuable information.
Figure 8.
Comparison of AC50 and direct binding affinity (KD). (a) Overlaid structures of ClpC1-NTD complexed with either RUF (blue) or ECU (pink). One RUF is bound to ClpC1-NTD (PDB code: 6CN8), while two ECUs are bound to ClpC1-NTD (PDB code: 6PBS). (b) Overlaid SPR sensorgrams of ECU and five analogs. Determined KD values are shown next to each cyclic peptide name. (c) Stoichiometry of cyclic peptides according to SPR response.

2.8. Computational Modeling
To shed more light on structure activity relationship, molecular docking was per-formed using Glide [30] and Glide gscore was selected for final reporting. It is a combination of empirical and force-field-based terms that assess the energy of the docked pose. All ECU analogs were docked to the crystal structure of NTD of ClpC1 bound to the ECU [4]. ECU forms a dimer (Figure 8a) and it is highly likely that ECU1 binds first followed by ECU2 because ECU1 shows more receptor contacts and hence higher affinity. All five ECU analogs were docked to the ECU1 binding site. Consistent with our experimental finding (AC50 and KD values) ECU showed the lowest gscore of -12.306, while OMSA showed the highest scores of -11.322 (Figure 10). The system couldn’t dock OMSB because the binding energy was too high to be scored, and the forces encountered during minimization drove the ligand outside the grid box. The analysis of the receptor binding pocket suggests that the key differences in the interactions stem from the tail region which differs among the analogs, with OMSA and OMSB possessing the shorter tail than others. The hydrophobic surface formed by residues L92 and L96 seems to be playing a key role in binding of the tail region of these cyclic peptide analogs. Most importantly, the residue L96 showed minimal interaction with the analog OMSA, which showed lower activity and a high docking score. The crystal structures of ClpC1 bound to RUF [12] and CYMA [31] show that these ligands, with high affinity but lower ATPase activity (Figure 9a), also don’t interact with L96, which further supports that L96 is indeed an important residue for activity.
3. Materials and Methods
3.1. Preparation and Purification of Full-Length (FL)-ClpC1
The Mtb FL-clpC1 gene (Rv3596c) was cloned into a modified pET-15b vector (Invitrogen) with a His6-SUMO-tag at the N-terminus. BL21(DE3) cells (Invitrogen) containing the recombinant plasmid were grown in SuperLB autoinduction media for 24 hours at 25 °C with shaking at 220 rpm. The cells were harvested and resuspended in lysis buffer (1 mg/mL lysozyme, 0.025 mg/mL DNase I, 1% Triton X-100, one tablet of protease inhibitor cocktail in buffer A: 50 mM Phosphate, pH 8.0, 500 mM NaCl, 20 mM imidazole, and 4 mM β-mercaptoethanol (β-ME)), and then lysed by emulsification (Emulsiflex-C5, Avestin) The His6-SUMO-tagged protein was purified by two-steps, a 1 mL HisTrap HP column (Cytiva) followed by a HiLoad 16/60 Superdex 200 pg size exclusion chromatography (SEC) column (Cytiva). The HisTrap HP step was run with buffer and with a stepwise gradient (4 and 100%) of elution buffer B (50 mM Phosphate, pH 8.0, 500 mM NaCl, 500 mM imidazole, and 4 mM β-ME), and SEC column was run with a buffer C (50 mM Phosphate, pH 7.5, 250 mM NaCl, 5 mM β-ME, and 5% glycerol) using an AKTA Pure FPLC (Cytiva). The pooled proteins were incubated with SUMO protease (1:100 dilution) at room temperature for 90 minutes. The digested protein sample was then loaded onto a 10 mL nickel bead gravity column to remove the cleaved His6-SUMO-tags and uncleaved His6-SUMO-FL-ClpC1. The column was then sequentially treated with 0 mM, 5 mM, 10 mM, and 500 mM imidazole containing buffer A. The flow-through containing purified native FL-ClpC1 was collected and concentrated in the storage buffer (50 mM Phosphate, pH 7.5, 250 mM NaCl, 5 mM b-ME, 25 µM ATP, and 5% Glycerol). Purified His6-SUMO-FL-ClpC1 and native FL-ClpC1 were bead frozen as 20 μL aliquots in liquid nitrogen and stored at -80°C. The protein samples were analyzed by SDS-PAGE at each step, and purity was approximately 95%.
Four smaller constructs of ClpC1, NTD(1-145), NTD-D1(1-493), D1-D2(146-848), and D1(146-493), were also cloned with a His6-SUMO-tag at the N-terminus and purified in a similar way as the FL-ClpC1 described above.
3.2. Circular Dichroism Spectroscopy
FL-ClpC1 and D1D2-ClpC1 were diluted in CD buffer containing 50 mM Tris-HCl, 33 mM KCl, and 0.5 mM dithiothreitol (pH 7.5) to a final concentration 0.05 mg/mL and 0.15 mg/mL, respectively. Sample solutions were transferred each into a 0.1 cm cuvette. The CD measurements were made by scanning wavelengths 190-240 nm at room temperature using a JASCO 815 spectropolarimeter with 100 nm/min of scanning speed, 0.2 nm data pitch, 2 sec D.I.T, and 1 nm band width. The final CD spectrum for each protein was obtained by averaging data from 5 accumulations. CD buffer without proteins was also acquired and used as a control. The buffer control subtracted CD data were analyzed on DichroWeb (http://dichroweb.cryst.bbk.ac.uk).
3.3. Mass Photometry
The oligomerization status of the wild-type Mtb FL-ClpC1 was monitored with a TwoMP Mass photometer (Refeyn Ltd, Oxford, UK). A clean glass coverslip (Refeyn) was mounted onto the TwoMP Mass photometer, and a 6-well Gasket (Refeyn) was placed on the top of the coverslip. A calibration curve was obtained by measuring two standard proteins, B-Amylase (BAM, monomer: 56 kDa, dimer: 112 kDa, and tetramer: 224 kDa) and Thyroglobulin (TG, dimer: 669 kDa). A well in the gasket was filled with 16 μL of PBS, pH 7.4, and 4 μL of either BAM or TG was added and quickly mixed well followed by data collection for 60 seconds using the Acquire MP software. The measurements were made at a final concentration of 10 nM for both BAM and TG. The contrast-to-mass calibration curve had R2 = 0.998 and a mass error of 2.9%. The native Mtb FL-ClpC1 were initially diluted to 20 μM in a 20 mM Tris, pH 8.0, 25 mM KCl, 20 mM MgCl2, 5 mM ATP, and 1 mM DTT buffer and allowed to incubate while the instrument was calibrated with standard proteins. Mtb-FL-ClpC1 samples were monitored at a final concentration of 10 nM in wells of the same gasket and glass slide immediately after calibration in a same manner. Mass photometry movies were analyzed using DiscoverMP (Refeyn).
3.4. ATPase Assay Optimization, Enzyme Activity, and pH Dependence
The ADP-Glo Kinase Assay Kit (Promega) was used to measure ATPase activity by quantifying the amount of ADP produced during the ClpC1 ATPase reaction. Both the native ClpC1-FL and His6-SUMO-FL-ClpC1 were prepared as 2X of the final aiming concentrations (0 µM, 0.125 µM, 0.25 µM, 0.5 µM, and 1.0 µM) in the ATPase assay buffer containing 50 mM Tris-HCl, pH 7.5, 5 mM MgCl2, 200 mM KCl, and 0.5 mM DTT. 2X (200 µM) of ATP was prepared. ClpC1 enzyme reactions were assembled in a standard 384-well plate (Greiner Bio-One) at room temperature (RT) by mixing 40 µL of 2X ClpC1 enzyme and 40 µL of 2X ATP solutions and allowed enzyme reaction to occur for a total of 1 hour. 10 µL each of assembled samples were taken and distributed to a white 384-well plate (Greiner Bio-One) every 10 minutes of the enzyme reaction to measure ATPase activity. 10 µL of ADP-Glo Reagent (Promega) was added to stop the ATPase reaction and deplete the unconsumed ATP, leaving only newly produced ADP by the enzyme reaction followed by incubation for 40 min at RT. 20 µL of Kinase Detection Reagent (Promega) was added to convert produced ADP to ATP for 40 min. The luminescence intensity was measured by the Victor 3V Plate Reader (PerkinElmer). A series of ATP concentrations (7.81 – 500 µM at 2-fold dilution) and various pHs (pH 5.0, 5.5, 6.5, 7.5, 8.5, and 10.0) were prepared and incubated with the native FL-ClpC1, and ATPase activities were monitored in the same manner. The obtained luminescence signals were plotted with tested ATP concentrations and fitted with a single rectangular 2 parameter equation 1, where y is the initial velocity and x is the concentration of ATP. Percent activity (%Act) was calculated using Equation 2.
3.5. The Effects of Macrocyclic Peptides on FL-ClpC1 ATPase Activity
All compounds were initially prepared as 10 mM stock in 100% dry DMSO. 50X of a series of increasing concentrations (0 – 2000 nM final concentration at 2-fold serial dilution) in 100% DMSO were prepared first in a DMSO resistant 384-well plate (Greiner Bio-One), and 3X compound solutions were prepared in enzyme assay buffer. 375 nM (3X) of native FL-ClpC1 and 240 µM (3X) ATP solutions were prepared in the same enzyme assay buffer. 20 µL of 3X enzyme solution was distributed into a standard 384-well plate, and 20 µL each of varying concentrations of 3X compounds were added and incubated for 10 min at room temperature prior to ATP addition. The enzyme reaction was initiated by adding 20 µL of the 3X ATP and allowed to have enzyme reaction for a total of 1 hour with every 10-minute activity measurement in the same way described above. The percent enzyme activation (%Act) was calculated using Equation 2 followed by fitting the data to the Hill equation (Equation 3) where yi is the % activation in the presence of compound, Vmax is the maximum % inhibition, x is the inhibitor concentration, and n is the Hill coefficient to calculate AC50 values.
3.6. Direct Binding Analysis by Surface Plasmon Resonance (SPR)
Direct binding analyses were performed by Surface plasmon resonance (SPR) using either a Biacore T200 or Biacore 8K as previously reported.[12] In short, native FL-ClpC1 protein was immobilized on a CM5 sensor chip using standard amine-coupling. All tested compound solutions were initially prepared as 10 mM stocks in 100% DMSO and diluted to a series of increasing concentrations (50X of final concentrations) in 100% DMSO in order to keep final DMSO concentration at 2%. Compound solutions were then prepared in SPR binding buffer consisting of 10 mM Na2HPO4 (pH 7.4), 1.8 mM KH2PO4, 137 mM NaCl, 2.7 mM KCl, 0.5 mM TCEP, and 2% DMSO and injected into both blank surfaces and FL-ClpC1 protein immobilized surfaces at a 30 μL/min of flow rate at 25 °C. All sensorgrams were double-referenced with blank channel and 2% DMSO concentration, and solvent correction cycles were run before and after compound runs. Control subtracted data were fitted with a 1:1 Langmuir kinetic model and multi-site kinetic model using Biacore Insight evaluation software v 3.0.12. In addition, the same data were fitted with steady-state affinity model, the RU values and corresponding concentrations were plotted using the single hyperbolic Function (Equation 4), where y is the response; ymax is the maximum response, and x is the compound concentration.
3.7. Molecular Docking
Molecular docking techniques have been a method of choice when it comes to structural elucidation of unknown compounds [32,33,34,35] but for macrocyclic compounds it is particularly challenging due to the inclusion of noncanonical residues and high degrees of freedom. Glide [30] from Schrodinger Inc. (Maestro version 14.0.134) [36] was used in this work, to predict the binding of macrocyclic ligand complexes. The constraint-based molecular docking was performed. The crystal structure of ECU bound to NTD of ClpC1 (RCSB PDB 6pbs) [4] was used as a receptor to dock the analogs, saved as a sdf file. The ligand files were prepared using ICM version 3.9-4 modeling software (MolSoft LLC, San Diego, CA) [37]. The bound ECU1 monomer (d chain) was used as a template. In the docking calculation, precision was set to “SP-Peptide” and ligand sampling was allowed to be flexible. The docking was restricted to the reference position (of template) with allowed tolerance value set at 10 Angstroms. The core comparison method was “Maximum common substructure”. The Glide gscores of the resulting docked conformations are reported, and the docked poses were analyzed using ICM.
4. Conclusions
We have optimized an ATPase assay with a very sensitive luminescence signal for the Mtb ClpC1 enzyme, a validated drug target for tuberculosis. This assay has advantages over two other known assays, Malachite Green assay and PK/LDH coupled assay. Malachite Green Assay is sensitive to detect ATPase enzyme activity, but assay condition is very acidic, and hence it could potentially create unwanted adverse effects on ATP itself and/or testing drug candidates. In addition, the required ClpC1 enzyme concentration to see acceptable S/N ratio for Malachite Green assay was 0.5 µM, which is high when testing inhibitors. The 340 nm assay readout of the PK/LDH coupled assay makes it subject to interfering signals from testing compounds, especially natural products. The assay conditions (ATP concentration, enzyme concentration, and pH) established in this paper will enable the characterization of the effects of potential therapeutic compounds on ClpC1 enzymatic activity. We have demonstrated this through three known cyclic peptides (RUF, ECU, and CYMA) and five ECU analogs. Determined AC50 values of eight tested cyclic peptides were comparable to KD values determined independently by SPR and MIC assays. RUF and CYMA have very tight binding to ClpC1 with MIC values at 0.02 µM and 0.094 µM, respectively. However, their ability to enhance ATPase activity of ClpC1 was low at below 93%, whereas that of all ECU and ECU analogs was much higher up to 830% even though KD and MIC were weaker. This suggests that RUF and ECU may have different mechanisms of action. Taken together, it is evident that there may be two distinct classes of mechanisms of action. RUF and CYMA belong to one class, while ECU and its analogs fall into another class. Hence, our sensitive enzymatic assay provides valuable insights in elucidating mechanisms of action and for the development of effective ClpC1-targeting anti-TB therapeutics.
Author Contributions
Conceptualization, H.L., S.G.F. and S.C.; methodology, R.D., Y.K.,G.S. and T.M.V.; validation, H.L., R.D. and G.S.; formal analysis, R.D., Y.K.,G.S. and T.M.V.; investigation, H.L and S.C.; resources, J.W.S, H.L.(Hanki Lee), Y.H.S., J.C., D.C.O. and S.G.F.; data curation, H.L., R.D., Y.K., S.J., F.N. and T.T; writing—original draft preparation, R.D., H.L., Y.K., S.J. and T.T.; writing—review and editing, H.L., S.G.F., T.M.V. and S.C; visualization, H.L.; supervision, H.L.; project administration, H.L., S.G.F. and S.C.; funding acquisition, S.G.F. and S.C. All authors have read and agreed to the published version of the manuscript.
Funding
This research was funded by the Centers of Excellence for Translational Research grant from the National Institute of Allergy and Infectious Diseases of the National Institutes of Health (U19AI142735). This research was supported in part by a grant of the Korea Health Technology R&D Project through the Korea Health Industry Development Institute (KHIDI), funded by the Ministry of Health & Welfare, Republic of Korea (grant number: HI22C1361). This study was partly supported by the Rural Development Administration in Korea via "Cooperative Research Program for Agriculture Science and Technology Development (Project No. PJ 015640)".
Data Availability Statement
All data supporting the conclusions of this article are listed in the text.
Acknowledgments:
We thank ChemAxon for a free academic license of their cheminformatics suite including JChem and JChem for excel for data analysis. Molecular graphics and analyses were performed with UCSF Chimera, developed by the Resource for Biocomputing, Visualization and Informatics at the University of California, San Francisco, with support from NIH P41-GM103311.
Conflicts of Interest
The authors declare no conflicts of interest.
References
- Barberis, I.; Bragazzi, N.L.; Galluzzo, L.; Martini, M. The History of Tuberculosis: From the First Historical Records to the Isolation of Koch’s Bacillus. J Prev Med Hyg 2017, 58, E9–E12. [Google Scholar] [PubMed]
- Chakaya, J.; Petersen, E.; Nantanda, R.; Mungai, B.N.; Migliori, G.B.; Amanullah, F.; Lungu, P.; Ntoumi, F.; Kumarasamy, N.; Maeurer, M.; Zumla, A. The WHO Global Tuberculosis 2021 Report – Not so Good News and Turning the Tide Back to End TB. International Journal of Infectious Diseases 2022, 124, S26–S29. [Google Scholar] [CrossRef] [PubMed]
- Tiwari, D.; Martineau, A.R. Inflammation-Mediated Tissue Damage in Pulmonary Tuberculosis and Host-Directed Therapeutic Strategies. Seminars in Immunology 2023, 65, 101672. [Google Scholar] [CrossRef] [PubMed]
- Wolf, N.M.; Lee, H.; Zagal, D.; Nam, J.-W.; Oh, D.-C.; Lee, H.; Suh, J.-W.; Pauli, G.F.; Cho, S.; Abad-Zapatero, C. Structure of the N-Terminal Domain of ClpC1 in Complex with the Antituberculosis Natural Product Ecumicin Reveals Unique Binding Interactions. Acta Crystallogr D Struct Biol 2020, 76 Pt 5, 458–471. [Google Scholar] [CrossRef]
- Shetye, G.S.; Choi, K.B.; Kim, C.-Y.; Franzblau, S.G.; Cho, S. In Vitro Profiling of Antitubercular Compounds by Rapid, Efficient, and Nondestructive Assays Using Autoluminescent Mycobacterium Tuberculosis. Antimicrob Agents Chemother 2021, 65, e0028221. [Google Scholar] [CrossRef] [PubMed]
- Raju, R.M.; Goldberg, A.L.; Rubin, E.J. Bacterial Proteolytic Complexes as Therapeutic Targets. Nat Rev Drug Discov 2012, 11, 777–789. [Google Scholar] [CrossRef]
- Lee, H.; Suh, J.-W. Anti-Tuberculosis Lead Molecules from Natural Products Targeting Mycobacterium Tuberculosis ClpC1. J Ind Microbiol Biotechnol 2016, 43, (2–3). [Google Scholar] [CrossRef] [PubMed]
- Sauer, R.T.; Baker, T.A. AAA+ Proteases: ATP-Fueled Machines of Protein Destruction. Annu Rev Biochem 2011, 80, 587–612. [Google Scholar] [CrossRef] [PubMed]
- Mahmoud, S.A.; Chien, P. Regulated Proteolysis in Bacteria. Annu Rev Biochem 2018, 87, 677–696. [Google Scholar] [CrossRef]
- Taylor, G.; Frommherz, Y.; Katikaridis, P.; Layer, D.; Sinning, I.; Carroni, M.; Weber-Ban, E.; Mogk, A. Antibacterial Peptide CyclomarinA Creates Toxicity by Deregulating the Mycobacterium Tuberculosis ClpC1-ClpP1P2 Protease. J Biol Chem 2022, 298, 102202. [Google Scholar] [CrossRef] [PubMed]
- Gates, S.N.; Martin, A. Stairway to Translocation: AAA+ Motor Structures Reveal the Mechanisms of ATP-Dependent Substrate Translocation. Protein Sci 2020, 29, 407–419. [Google Scholar] [CrossRef] [PubMed]
- Wolf, N.M.; Lee, H.; Choules, M.P.; Pauli, G.F.; Phansalkar, R.; Anderson, J.R.; Gao, W.; Ren, J.; Santarsiero, B.D.; Lee, H.; Cheng, J.; Jin, Y.-Y.; Ho, N.A.; Duc, N.M.; Suh, J.-W.; Abad-Zapatero, C.; Cho, S. High-Resolution Structure of ClpC1-Rufomycin and Ligand Binding Studies Provide a Framework to Design and Optimize Anti-Tuberculosis Leads. ACS Infect Dis 2019, 5, 829–840. [Google Scholar] [CrossRef] [PubMed]
- Weinhäupl, K.; Gragera, M.; Bueno-Carrasco, M.T.; Arranz, R.; Krandor, O.; Akopian, T.; Soares, R.; Rubin, E.; Felix, J.; Fraga, H. Structure of the Drug Target ClpC1 Unfoldase in Action Provides Insights on Antibiotic Mechanism of Action. J Biol Chem 2022, 298, 102553. [Google Scholar] [CrossRef] [PubMed]
- Li, M.; Kandror, O.; Akopian, T.; Dharkar, P.; Wlodawer, A.; Maurizi, M.R.; Goldberg, A.L. Structure and Functional Properties of the Active Form of the Proteolytic Complex, ClpP1P2, from Mycobacterium Tuberculosis. J Biol Chem 2016, 291, 7465–7476. [Google Scholar] [CrossRef] [PubMed]
- Gatsogiannis, C.; Balogh, D.; Merino, F.; Sieber, S.A.; Raunser, S. Cryo-EM Structure of the ClpXP Protein Degradation Machinery. Nat Struct Mol Biol 2019, 26, 946–954. [Google Scholar] [CrossRef] [PubMed]
- Lupoli, T.J.; Vaubourgeix, J.; Burns-Huang, K.; Gold, B. Targeting the Proteostasis Network for Mycobacterial Drug Discovery. ACS Infect Dis 2018, 4, 478–498. [Google Scholar] [CrossRef] [PubMed]
- Liu, J.; Mei, Z.; Li, N.; Qi, Y.; Xu, Y.; Shi, Y.; Wang, F.; Lei, J.; Gao, N. Structural Dynamics of the MecA-ClpC Complex: A Type II AAA+ Protein Unfolding Machine. J Biol Chem 2013, 288, 17597–17608. [Google Scholar] [CrossRef]
- Pederick, J.L.; Bruning, J.B. An Antimony-Phosphomolybdate Microassay of ATPase Activity through the Detection of Inorganic Phosphate. Analytical Biochemistry 2021, 623, 114170. [Google Scholar] [CrossRef]
- Itaya, K.; Ui, M. A New Micromethod for the Colorimetric Determination of Inorganic Phosphate. Clinica Chimica Acta 1966, 14, 361–366. [Google Scholar] [CrossRef]
- Lanzetta, P.A.; Alvarez, L.J.; Reinach, P.S.; Candia, O.A. An Improved Assay for Nanomole Amounts of Inorganic Phosphate. Analytical Biochemistry 1979, 100, 95–97. [Google Scholar] [CrossRef] [PubMed]
- Kornberg, A.; Pricer, W.E. Enzymatic Phosphorylation of Adenosine and 2,6-Diaminopurine Riboside. J Biol Chem 1951, 193, 481–495. [Google Scholar] [CrossRef]
- Zegzouti, H.; Zdanovskaia, M.; Hsiao, K.; Goueli, S.A. ADP-Glo: A Bioluminescent and Homogeneous ADP Monitoring Assay for Kinases. Assay Drug Dev Technol 2009, 7, 560–572. [Google Scholar] [CrossRef] [PubMed]
- Goueli, S.; Hsiao, K.; Vidugiris, G.; Hennek, J.; Zegzouti, H. ADP GloTM: A One Platform Ideal for Assay Development, Screening and Profiling of All Phosphotransferases. The FASEB Journal 2015, 29. [Google Scholar] [CrossRef]
- Sanghera, J.; Li, R.; Yan, J. Comparison of the Luminescent ADP-Glo Assay to a Standard Radiometric Assay for Measurement of Protein Kinase Activity. ASSAY and Drug Development Technologies 2009, 7, 615–622. [Google Scholar] [CrossRef]
- Wang, F.; Mei, Z.; Qi, Y.; Yan, C.; Hu, Q.; Wang, J.; Shi, Y. Structure and Mechanism of the Hexameric MecA-ClpC Molecular Machine. Nature 2011, 471, 331–335. [Google Scholar] [CrossRef]
- Choules, M.P.; Wolf, N.M.; Lee, H.; Anderson, J.R.; Grzelak, E.M.; Wang, Y.; Ma, R.; Gao, W.; McAlpine, J.B.; Jin, Y.-Y.; Cheng, J.; Lee, H.; Suh, J.-W.; Duc, N.M.; Paik, S.; Choe, J.H.; Jo, E.-K.; Chang, C.L.; Lee, J.S.; Jaki, B.U.; Pauli, G.F.; Franzblau, S.G.; Cho, S. Rufomycin Targets ClpC1 Proteolysis in Mycobacterium Tuberculosis and M. Abscessus. Antimicrob Agents Chemother 2019, 63, e02204–18. [Google Scholar] [CrossRef] [PubMed]
- Gao, W.; Kim, J.-Y.; Anderson, J.R.; Akopian, T.; Hong, S.; Jin, Y.-Y.; Kandror, O.; Kim, J.-W.; Lee, I.-A.; Lee, S.-Y.; McAlpine, J.B.; Mulugeta, S.; Sunoqrot, S.; Wang, Y.; Yang, S.-H.; Yoon, T.-M.; Goldberg, A.L.; Pauli, G.F.; Suh, J.-W.; Franzblau, S.G.; Cho, S. The Cyclic Peptide Ecumicin Targeting ClpC1 Is Active against Mycobacterium Tuberculosis in Vivo. Antimicrob Agents Chemother 2015, 59, 880–889. [Google Scholar] [CrossRef] [PubMed]
- Um, S.; Choi, T.J.; Kim, H.; Kim, B.Y.; Kim, S.-H.; Lee, S.K.; Oh, K.-B.; Shin, J.; Oh, D.-C. Ohmyungsamycins A and B: Cytotoxic and Antimicrobial Cyclic Peptides Produced by Streptomyces Sp. from a Volcanic Island. J Org Chem 2013, 78, 12321–12329. [Google Scholar] [CrossRef]
- Hur, J.; Jang, J.; Sim, J.; Son, W.S.; Ahn, H.-C.; Kim, T.S.; Shin, Y.-H.; Lim, C.; Lee, S.; An, H.; Kim, S.-H.; Oh, D.-C.; Jo, E.-K.; Jang, J.; Lee, J.; Suh, Y.-G. Conformation-Enabled Total Syntheses of Ohmyungsamycins A and B and Structural Revision of Ohmyungsamycin B. Angew Chem Int Ed Engl 2018, 57, 3069–3073. [Google Scholar] [CrossRef] [PubMed]
- Friesner, R.A.; Murphy, R.B.; Repasky, M.P.; Frye, L.L.; Greenwood, J.R.; Halgren, T.A.; Sanschagrin, P.C.; Mainz, D.T. Extra Precision Glide: Docking and Scoring Incorporating a Model of Hydrophobic Enclosure for Protein−Ligand Complexes. J. Med. Chem. 2006, 49, 6177–6196. [Google Scholar] [CrossRef]
- Vasudevan, D.; Rao, S.P.S.; Noble, C.G. Structural Basis of Mycobacterial Inhibition by Cyclomarin A. Journal of Biological Chemistry 2013, 288, 30883–30891. [Google Scholar] [CrossRef]
- Vaid, T.M.; Chalmers, D.K.; Scott, D.J.; Gooley, P.R. INPHARMA-Based Determination of Ligand Binding Modes at A1 -Adrenergic Receptors Explains the Molecular Basis of Subtype Selectivity. Chemistry 2020, 26, 11796–11805. [Google Scholar] [CrossRef] [PubMed]
- Vaid, T.M.; Demissie, R.; Kwon, Y.; Tran, T.; Moon, H.-G.; Villegas, J.A.; Park, G.Y.; Johnson, M.E.; Lee, H. Synergistic Inhibition Guided Fragment-Linking Strategy and Quantitative Structure–Property Relationship Modeling To Design Inhalable Therapeutics for Asthma Targeting CSF1R. ACS Omega 2023, 8, 20505–20512. [Google Scholar] [CrossRef] [PubMed]
- Ren, J.; Vaid, T.M.; Lee, H.; Ojeda, I.; Johnson, M.E. Evaluation of Interactions between the Hepatitis C Virus NS3/4A and Sulfonamidobenzamide Based Molecules Using Molecular Docking, Molecular Dynamics Simulations and Binding Free Energy Calculations. J Comput Aided Mol Des 2023, 37, 53–65. [Google Scholar] [CrossRef]
- Lee, H.; Youn, I.; Demissie, R.; Vaid, T.M.; Che, C.-T.; Azar, D.T.; Han, K.-Y. Identification of Small Molecule Inhibitors against MMP-14 via High-Throughput Screening. Bioorganic & Medicinal Chemistry. [CrossRef]
- Schrödinger, L. Schrödinger Release 2024-2: Maestro, 2024.
- Abagyan, R.; Totrov, M.; Kuznetsov, D. ICM—A New Method for Protein Modeling and Design: Applications to Docking and Structure Prediction from the Distorted Native Conformation. Journal of Computational Chemistry 1994, 15, 488–506. [Google Scholar] [CrossRef]
Figure 1.
Background information. (a) Schematic representation of the M. tuberculosis ClpC1 protein with three domains, NTD (cyan), D1 (tan), and D2 (orange) [17]. (b) Overall structure of the FL-ClpC1 from Bacillus subtilis colored in cyan for NTD, tan for D1, and orange for D2 domain (PDB code: 3J3S [17]). Hexameric form is also shown on the right with each monomer in different colors.
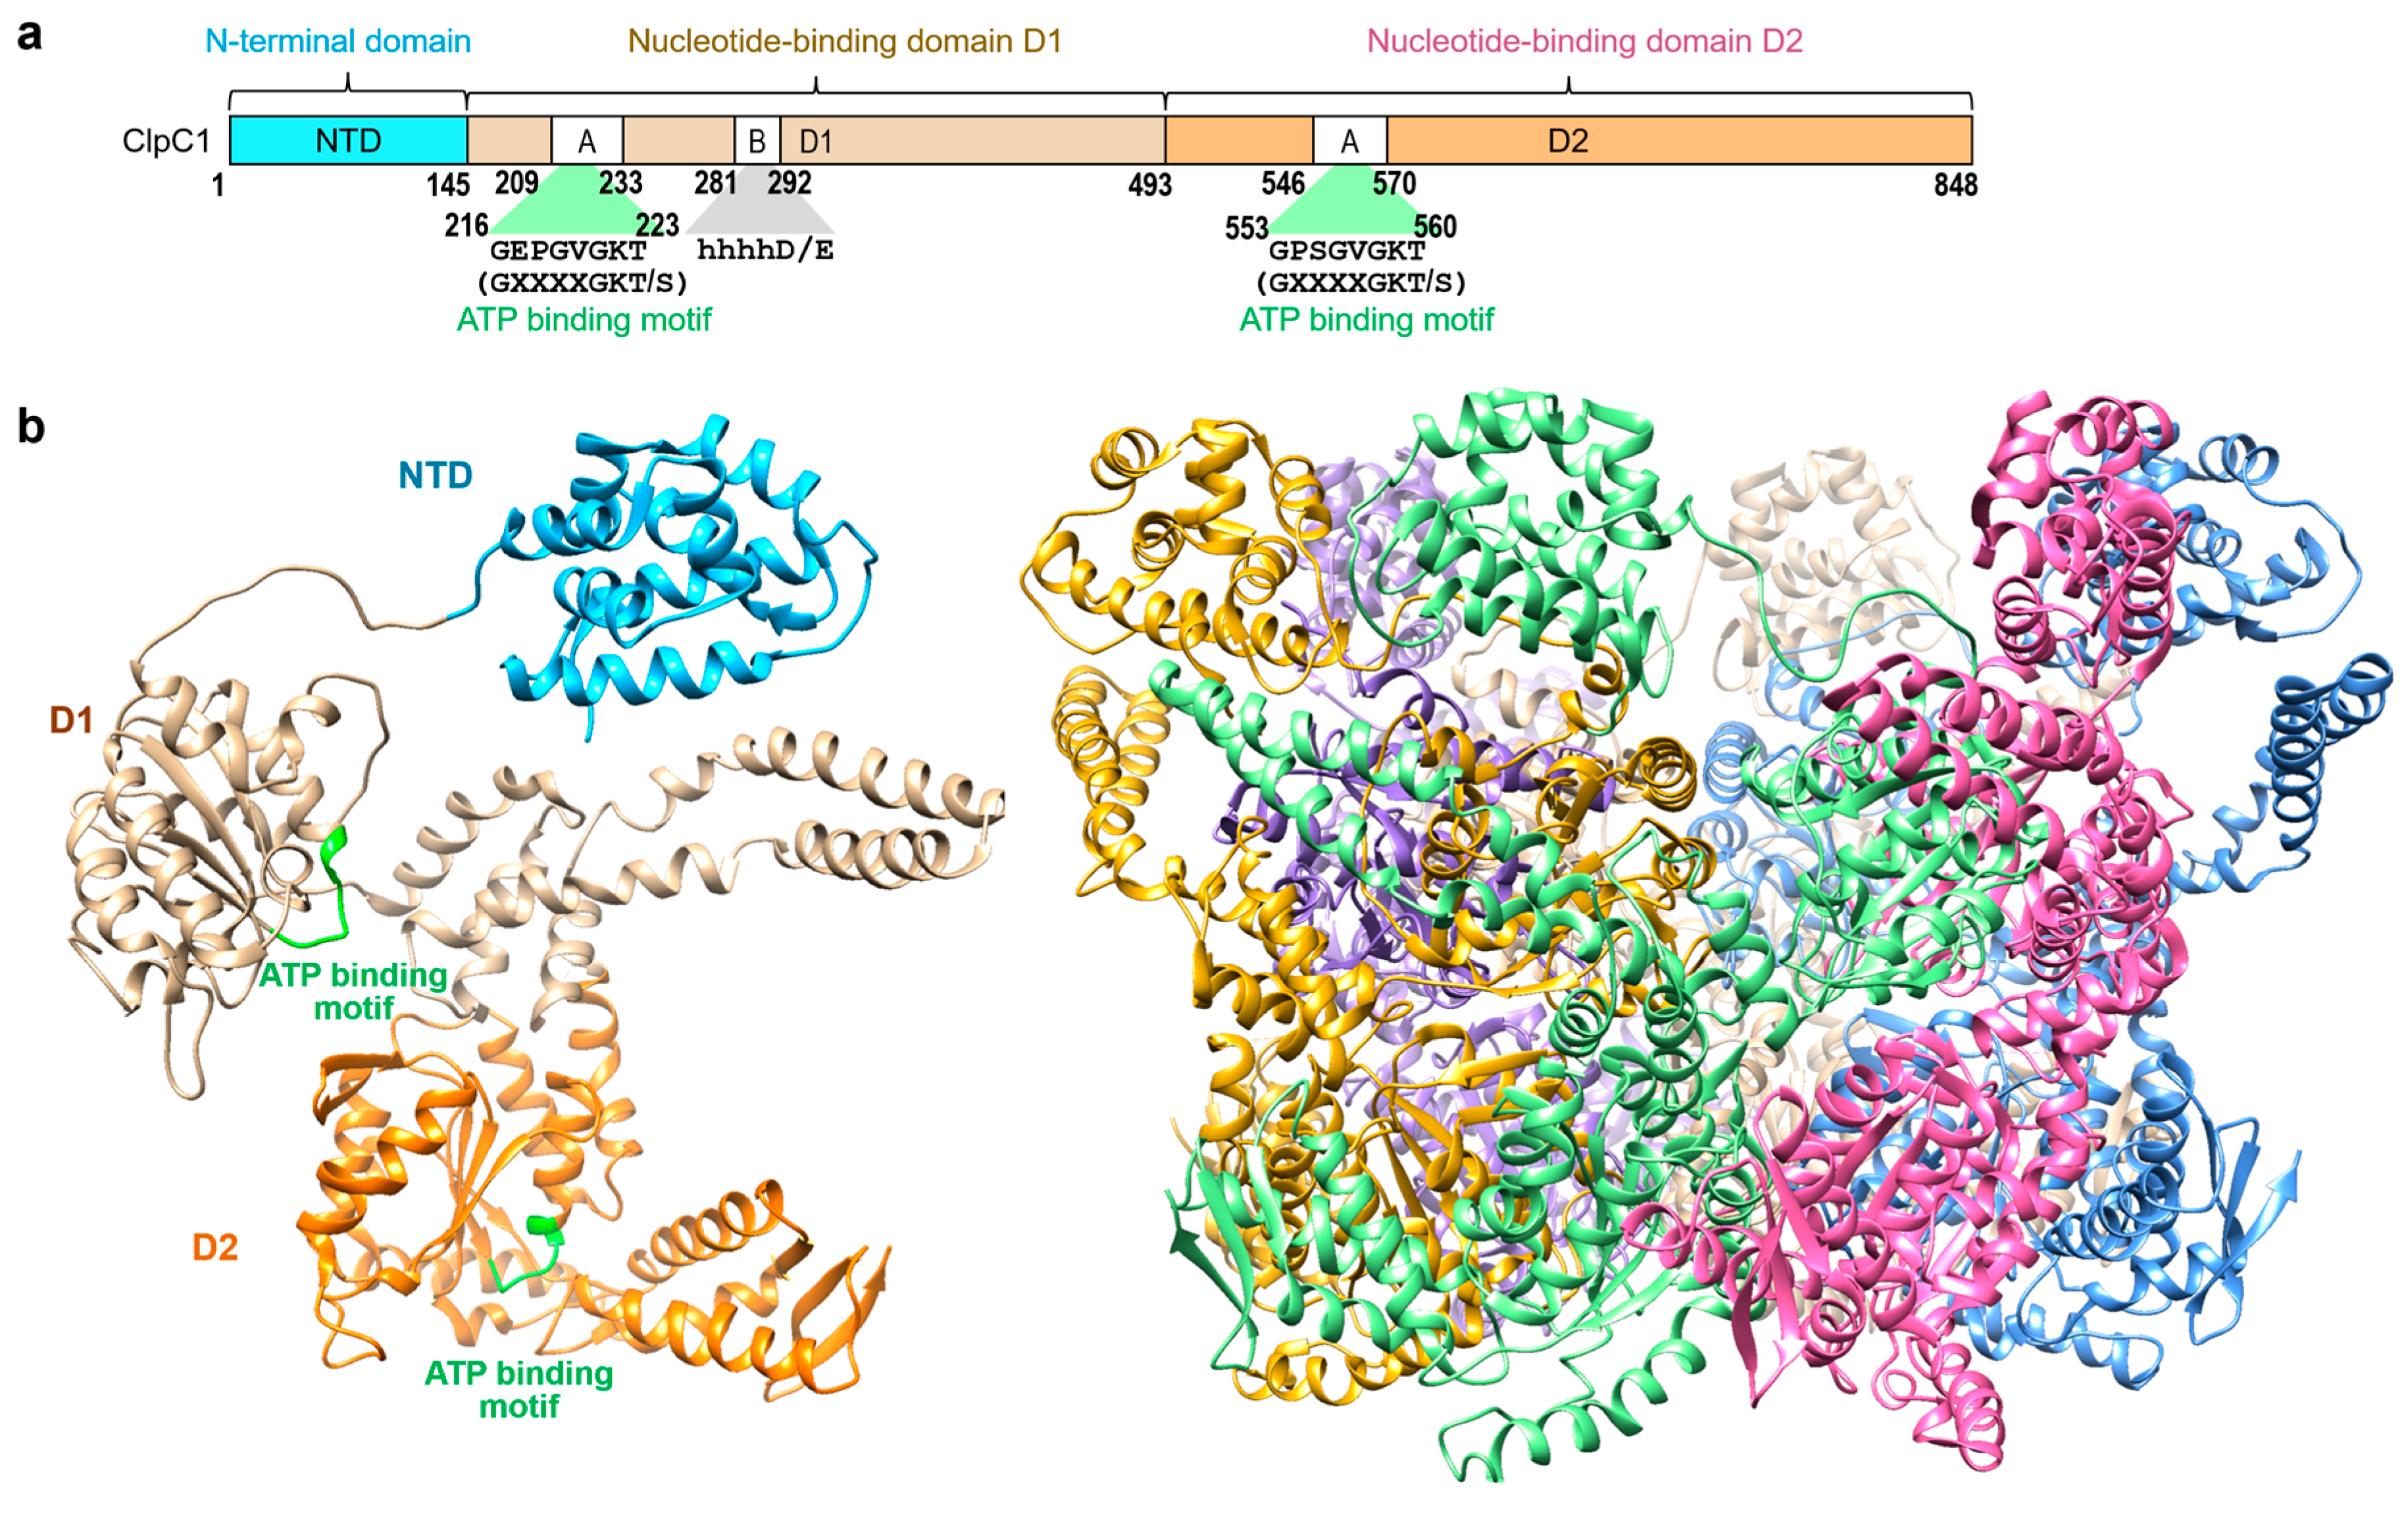
Figure 2.
Three potential non-radioactive enzyme assays to measure ATPase activity. (a) Diagrams of three assays outlined, the Malachite Green Assay (green), the PK/LDH coupled assay (gray), and ADP-Glo luminescence (blue) assay. (b) A diagram of the detailed ADP-Glo luminescence Assay steps. This diagram has been modified from the manufacturer’s instructions (Promega).
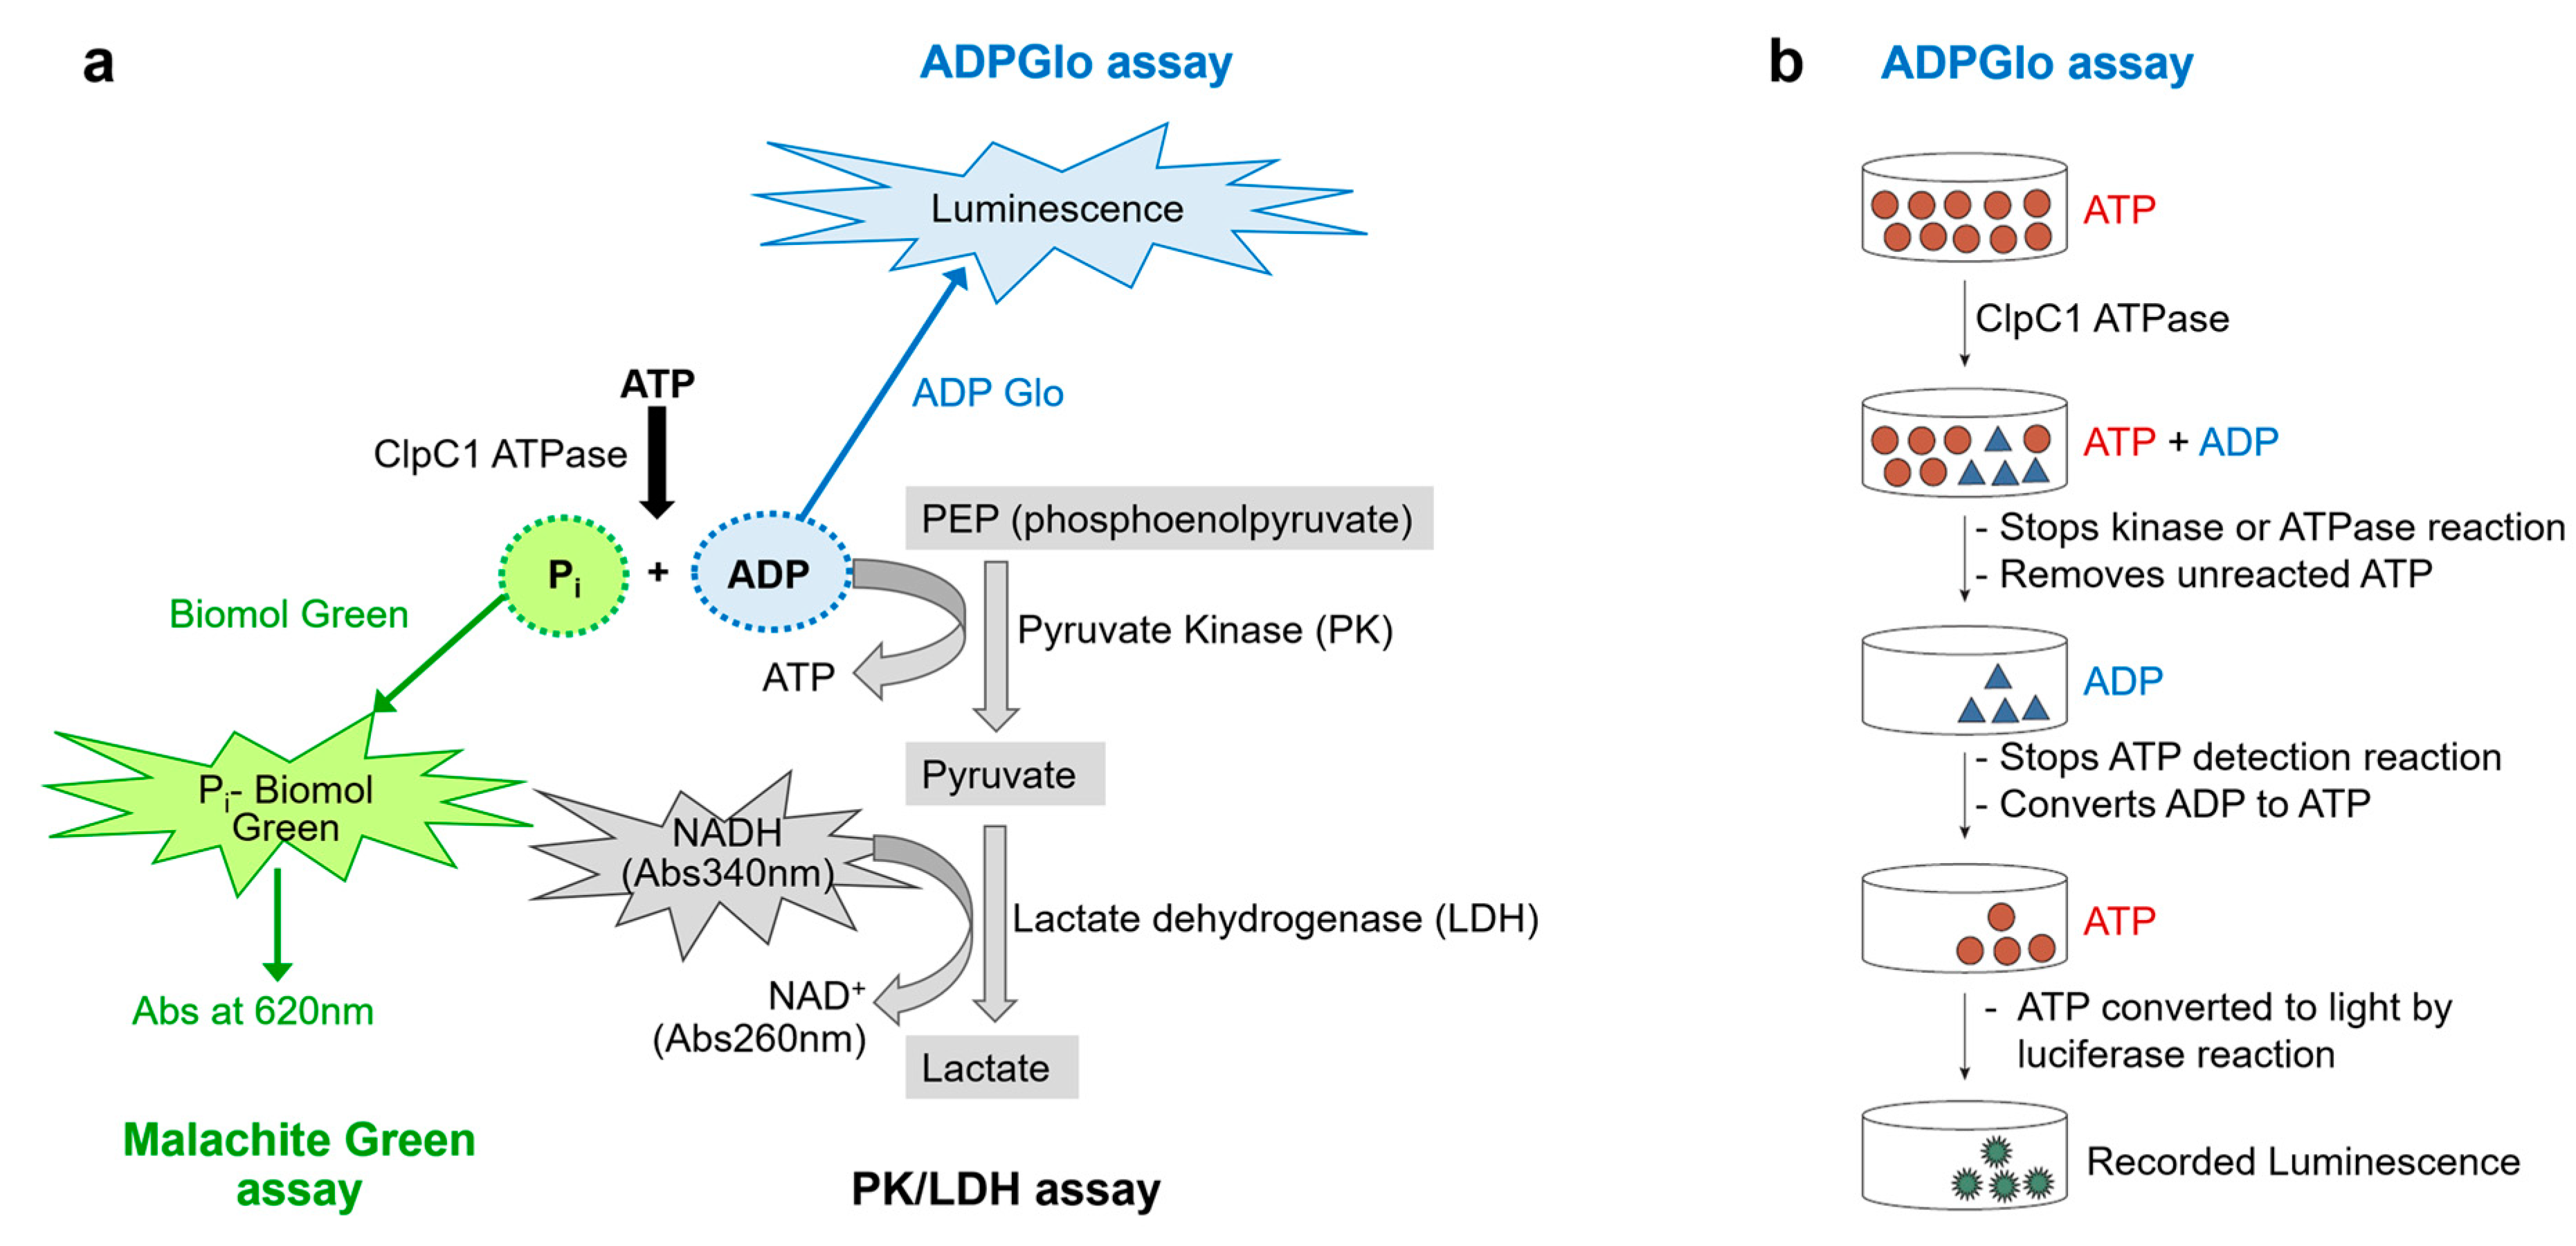
Figure 3.
Purification of His6-SUMO-FL-ClpC1 and native FL-ClpC1. (a) SDS-PAGE image of FL-ClpC1 purification. Lane 1 ladder, lane 2 whole lysate, lane 3 soluble supernatant, lane 4 flow-through, lane 5 unbound wash, lanes 6 - 7 fractions from 16/60 Superdex 200. (b) UV280 profile from 16/60 Superdex 200 (Column volume = 120 mL). Three standard (c) Oligomerization profile measured by Refeyn TwoMP Mass Photometry (MP). The principles of MP on the left panel (Refeyn Ltd), and native FL-ClpC1 MP results are shown on the right panel. Figure courtesy of Refeyn (https://www.refeyn.com/post/how-does-mass-photometry-work).
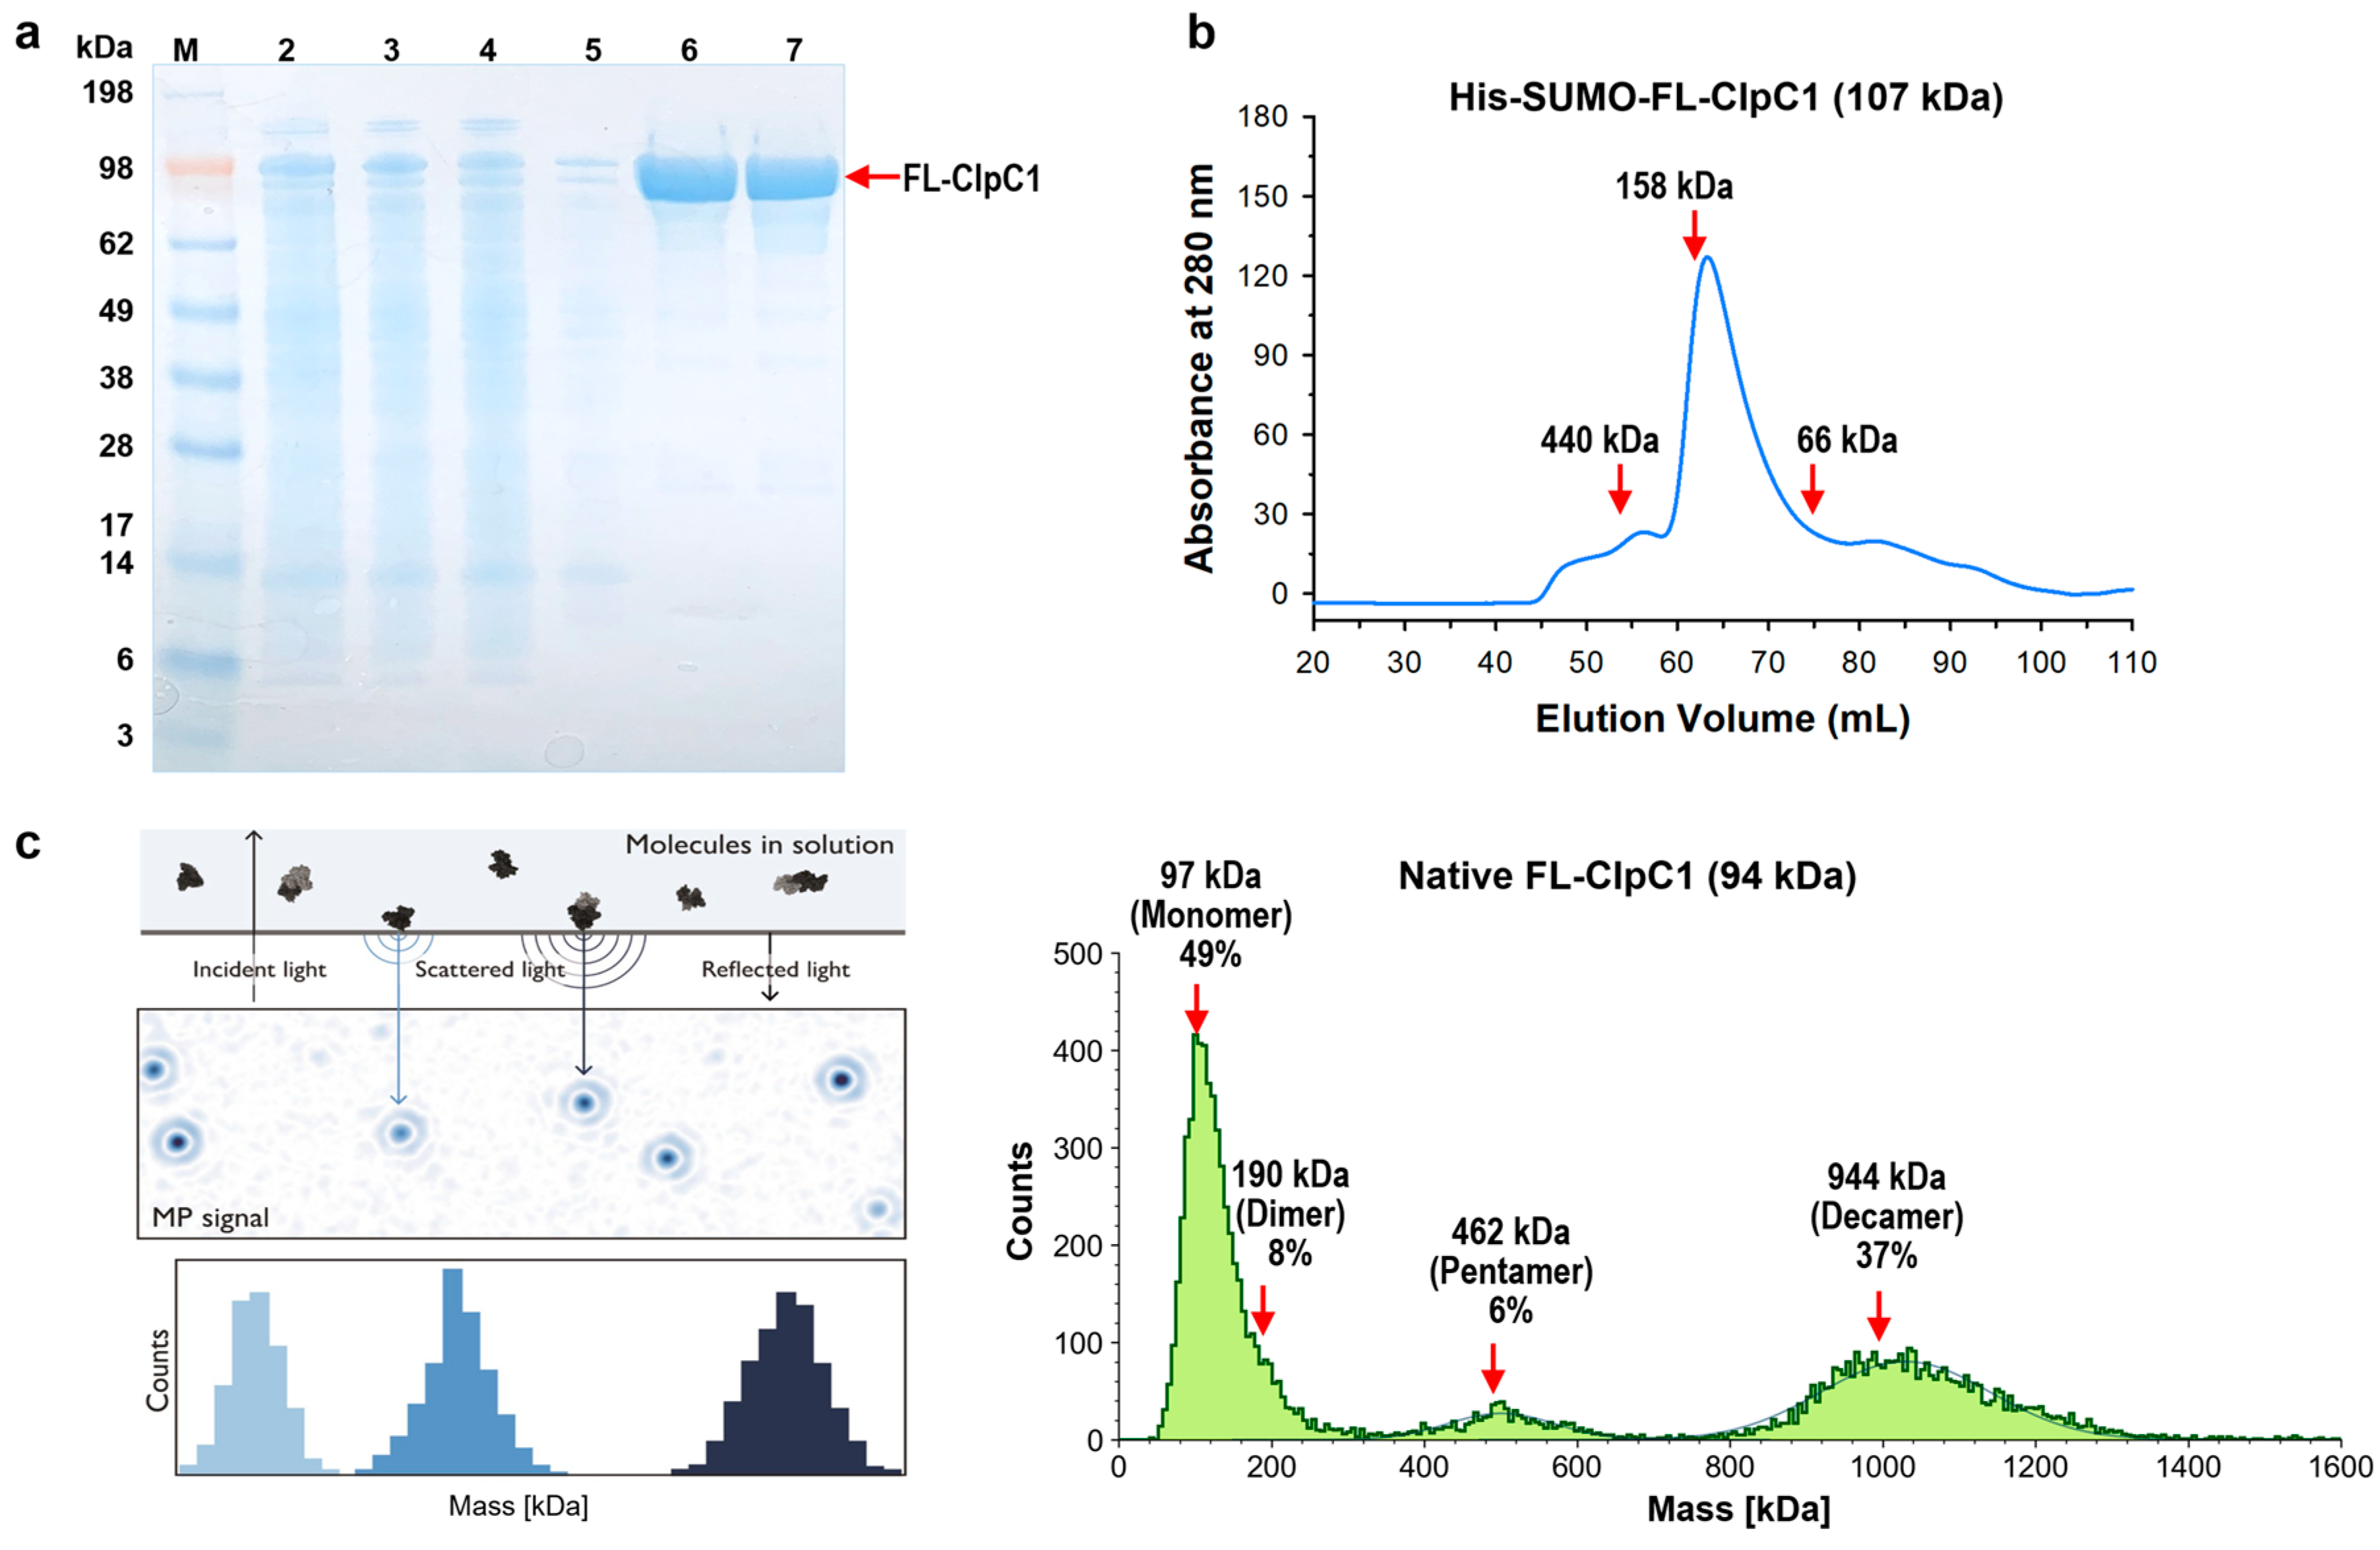
Figure 4.
ATPase assay optimization. (a) Dose-response curve of ATP with a fixed concentration of native FL-ClpC1. (b) The pH profile for the native FL-ClpC1 enzyme activity from pH 5.0 to pH 10.0. Enzyme activities were compared with a series of increasing concentrations of His6-SUMO-FL-ClpC1 (c) and native FL-ClpC1 (d). Error bars represent the standard deviations from three measurements.
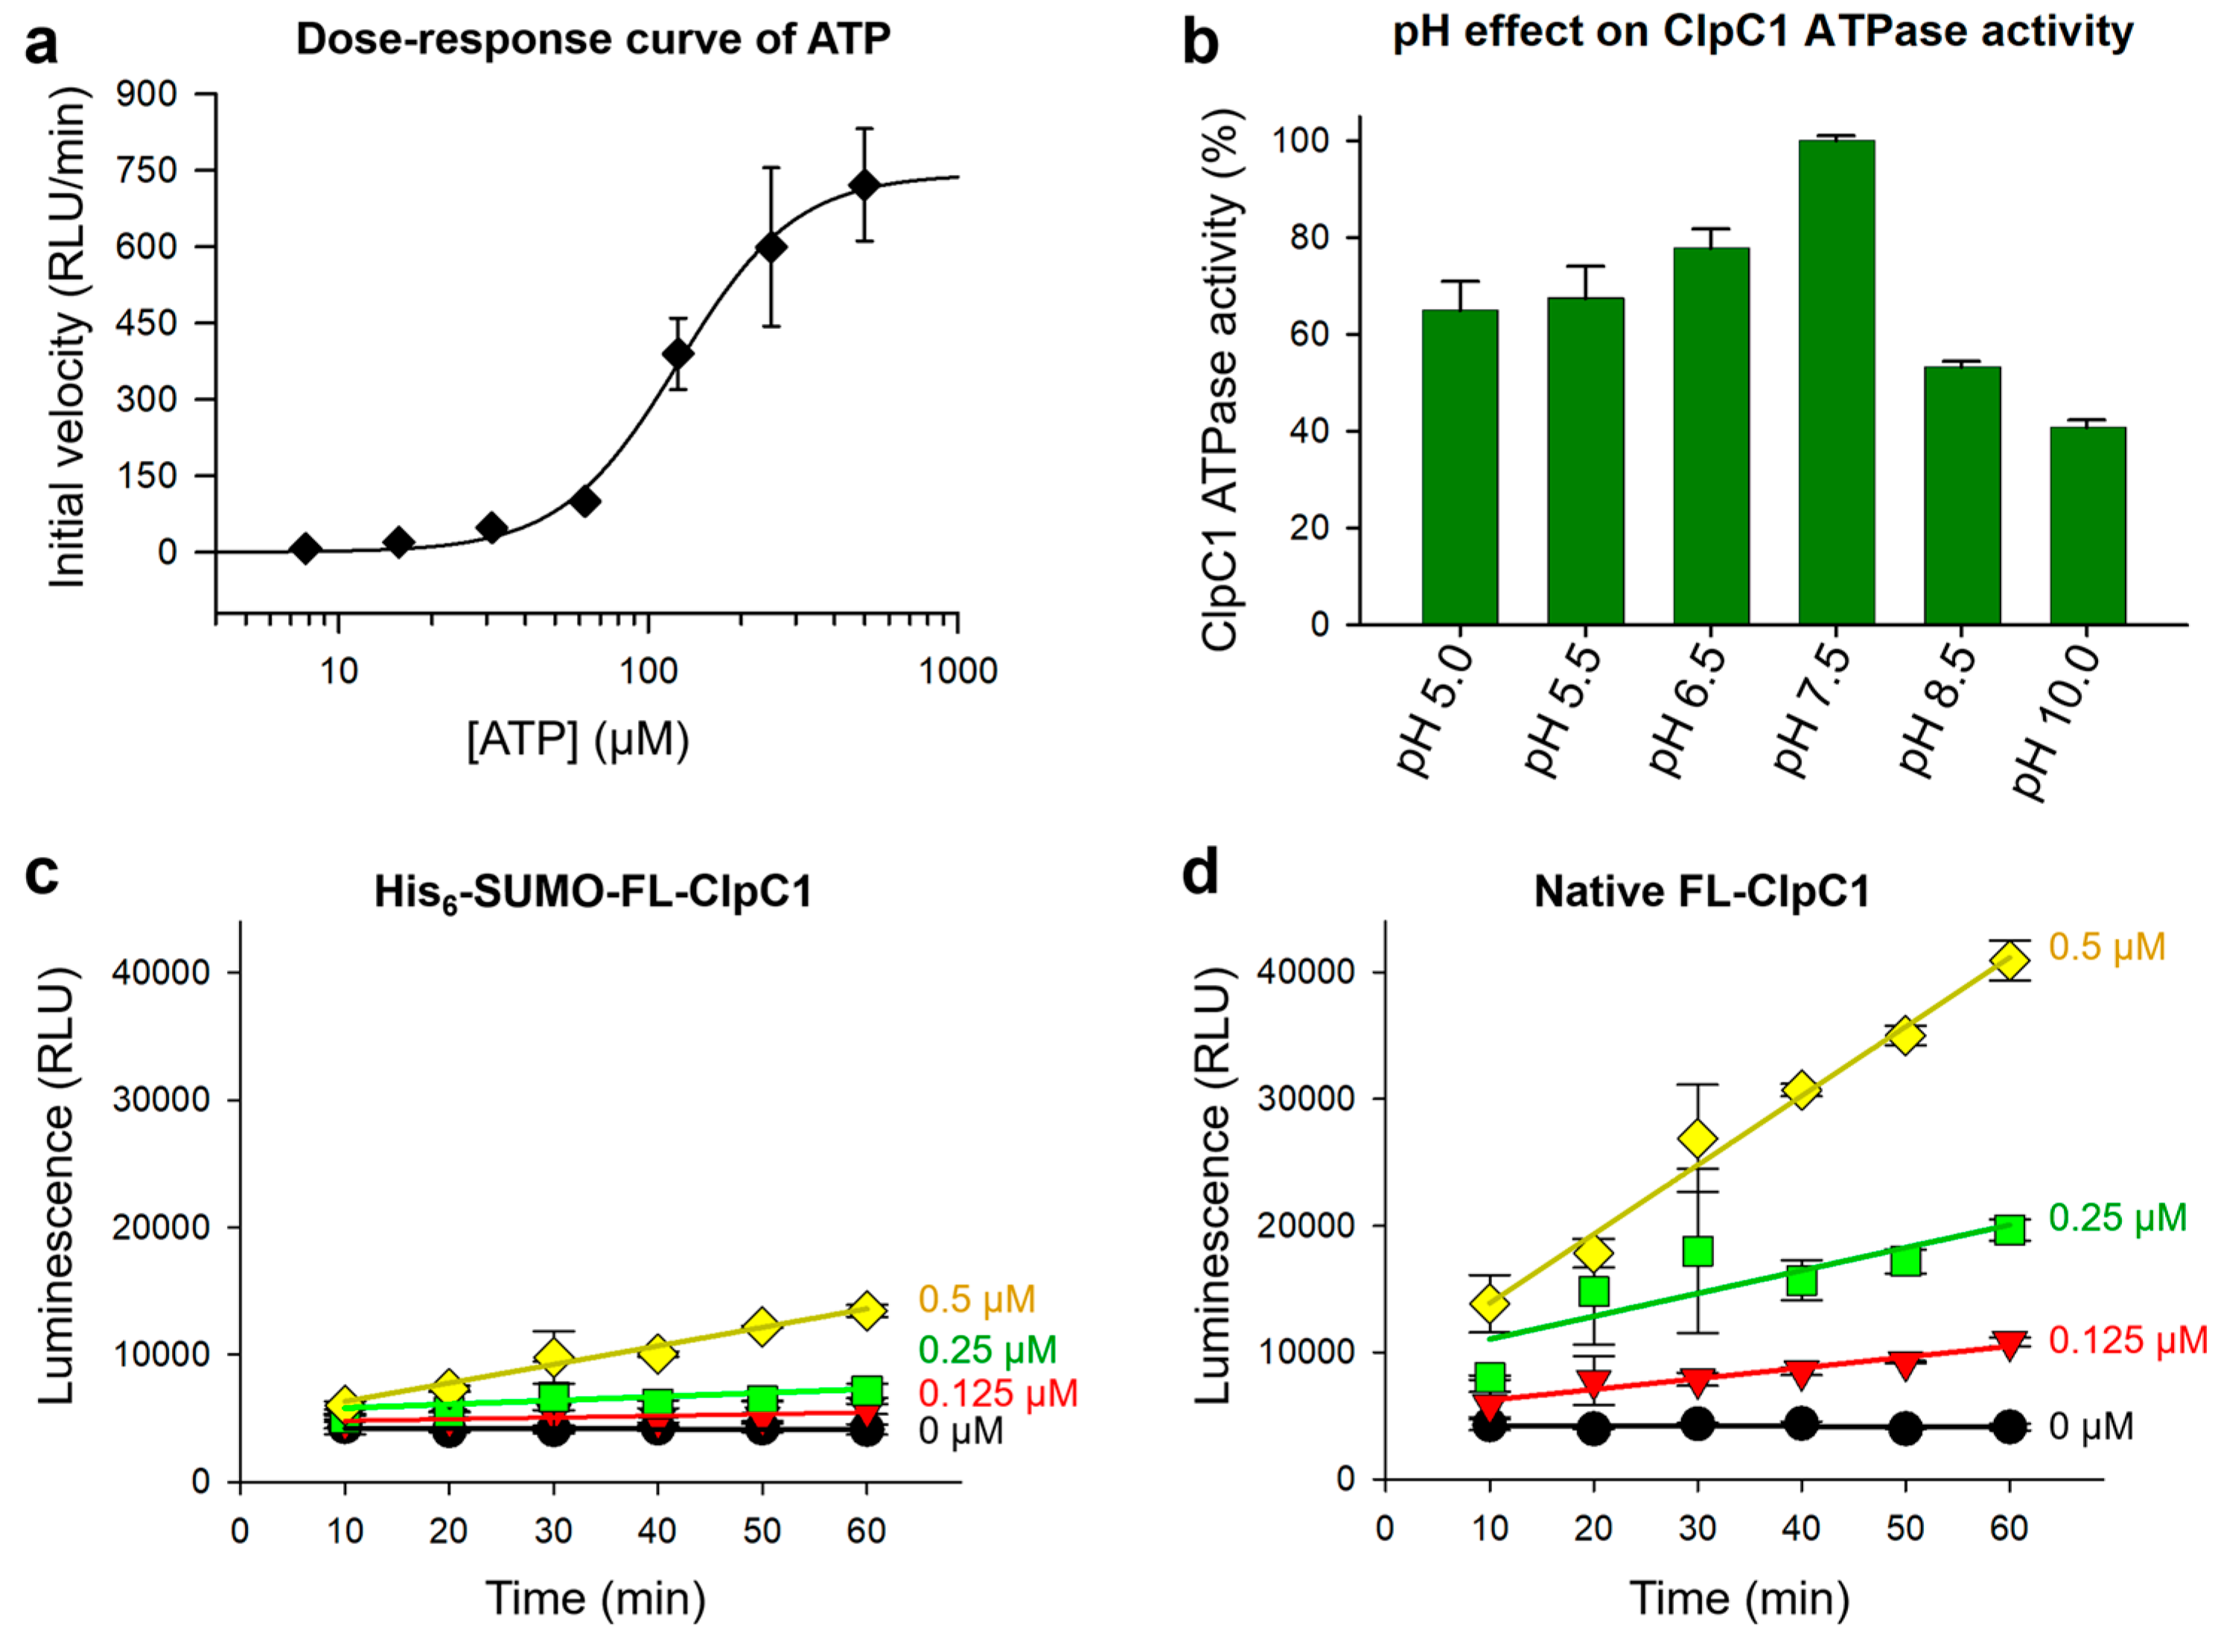
Figure 5.
ATPase activity comparison of different constructs. (a) Diagram of six different constructs of the Mtb ClpC1. (b) ATPase activity comparison of various lengths of the ClpC1. His-SUMO-FL represents a N-terminal His6-SUMO-tag, and FL-His is His6-tag at the C-terminus with 7 residues (KLAAALE) as a linker between ClpC1(1-842) and His6-tag. Error bars represent the standard deviations from four measurements. (c) Circular dichroism (CD) Spectra of FL-ClpC1 and D1D2-ClpC1.
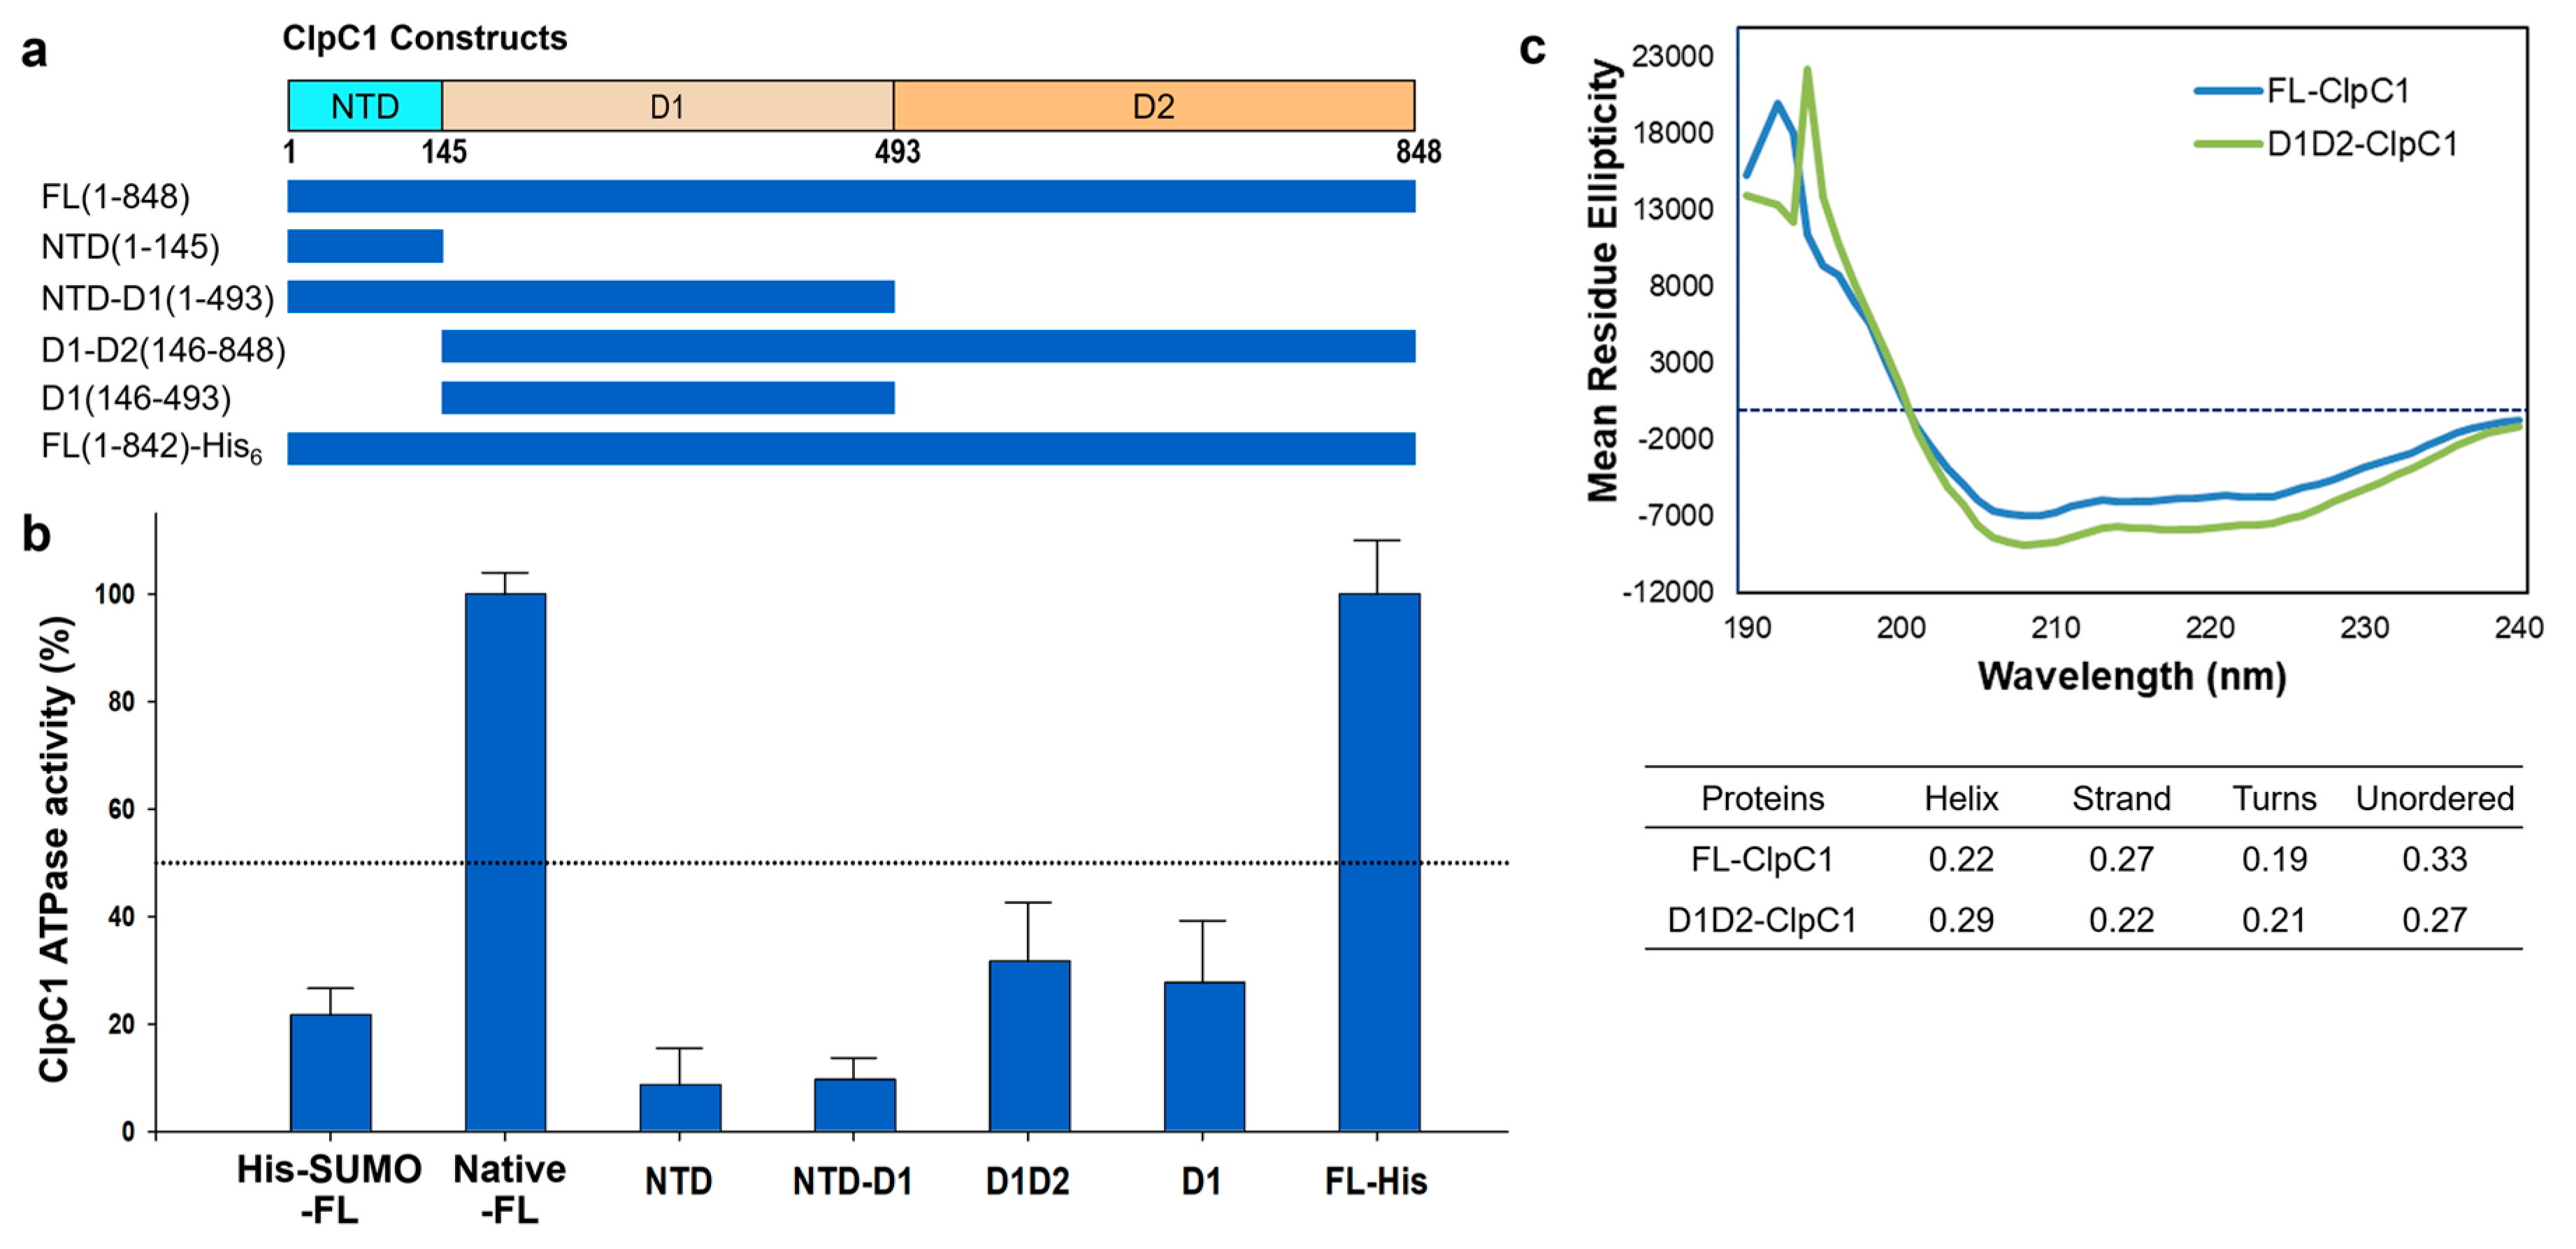
Figure 6.
Effects of the three cyclic peptides on FL-ClpC1 ATPase activity. The native FL-ClpC1 ATPase activities in the presence of a series of increasing concentrations of ECU (a), RUF (b), and CYMA (c). Activity curves up to 60 minutes and dose-response curves are on the left and on the right panels, respectively. (d) Comparison of ClpC1 ATPase activity at 0.125 µM (upper panel) and 0.25 µM (lower panel) in the presence and absence of three cyclic peptides, ECU, RUF, and CYMA. Error bars represent the standard deviations from three measurements.
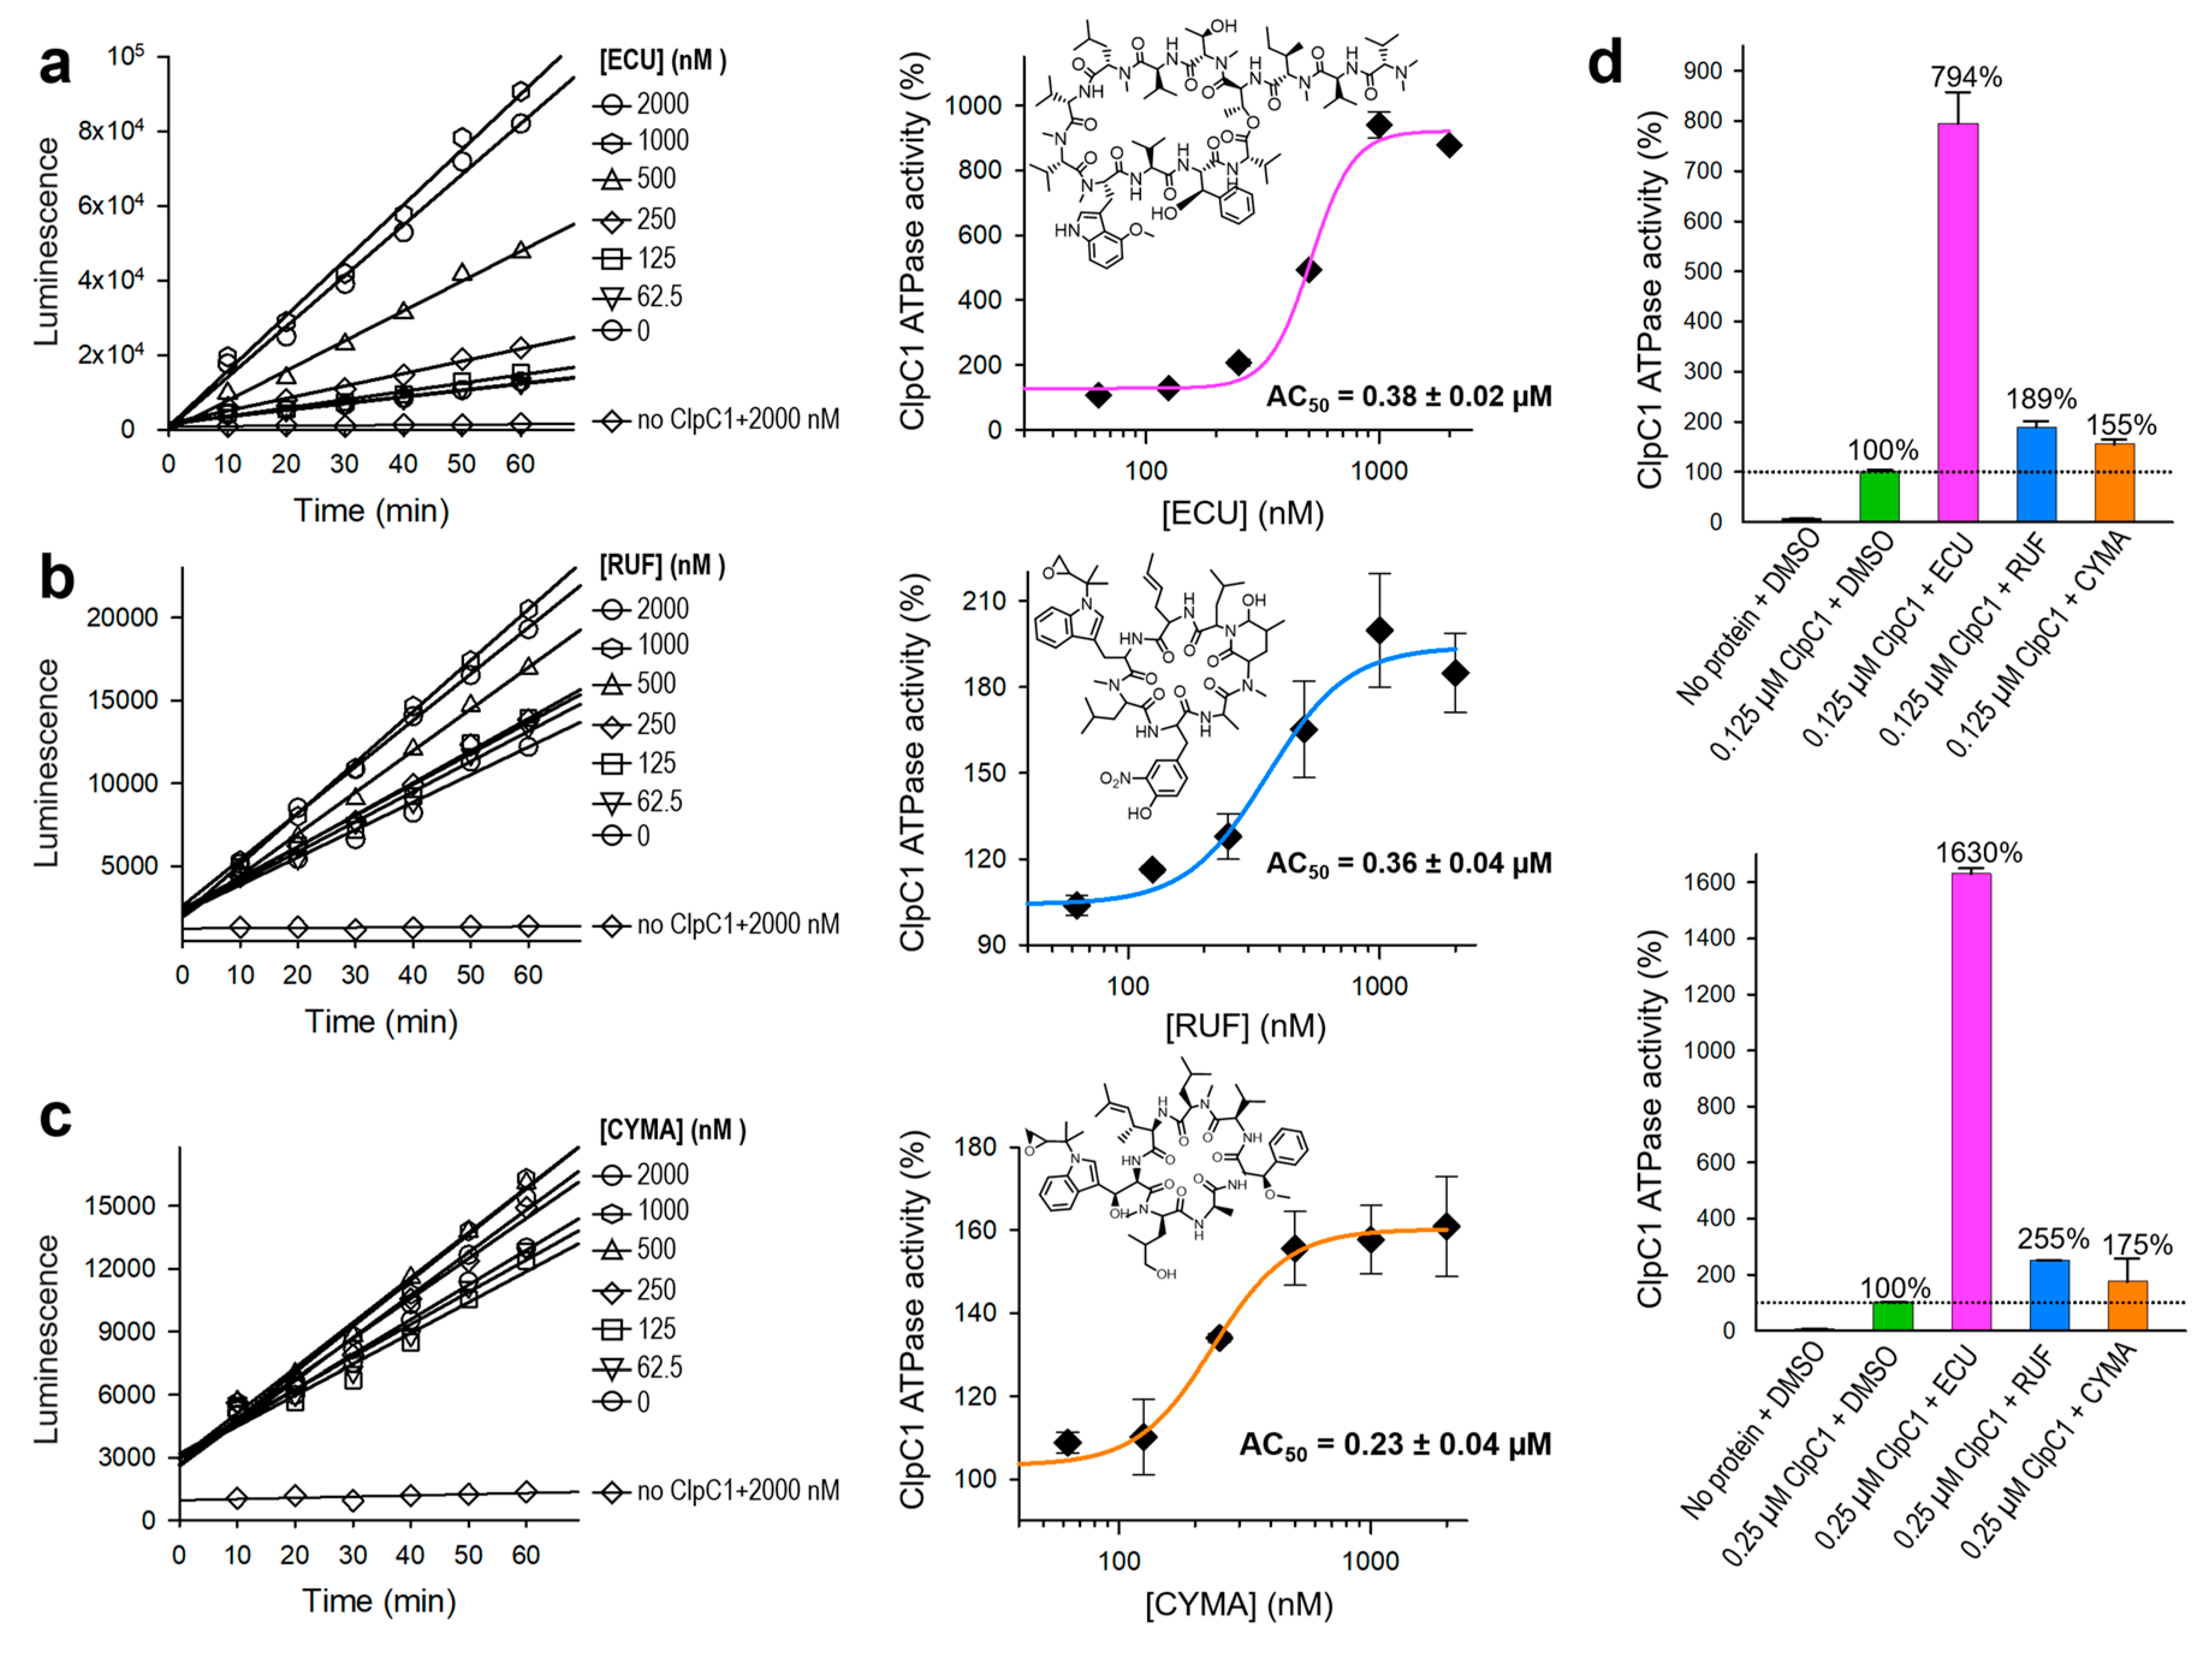
Figure 7.
Compound effect of ECU and five analogs. (a) Structures of ECU and its five analogs. Differences are highlighted in different colors and yellow circles. (b) Dose-response curves of ClpC1 ATPase activity in the presence of ECU and five analogs. (c) Comparison of the maximum enhancement of the ClpC1 ATPase activity by all tested cyclic peptides. Error bars represent the standard deviations from three measurements.
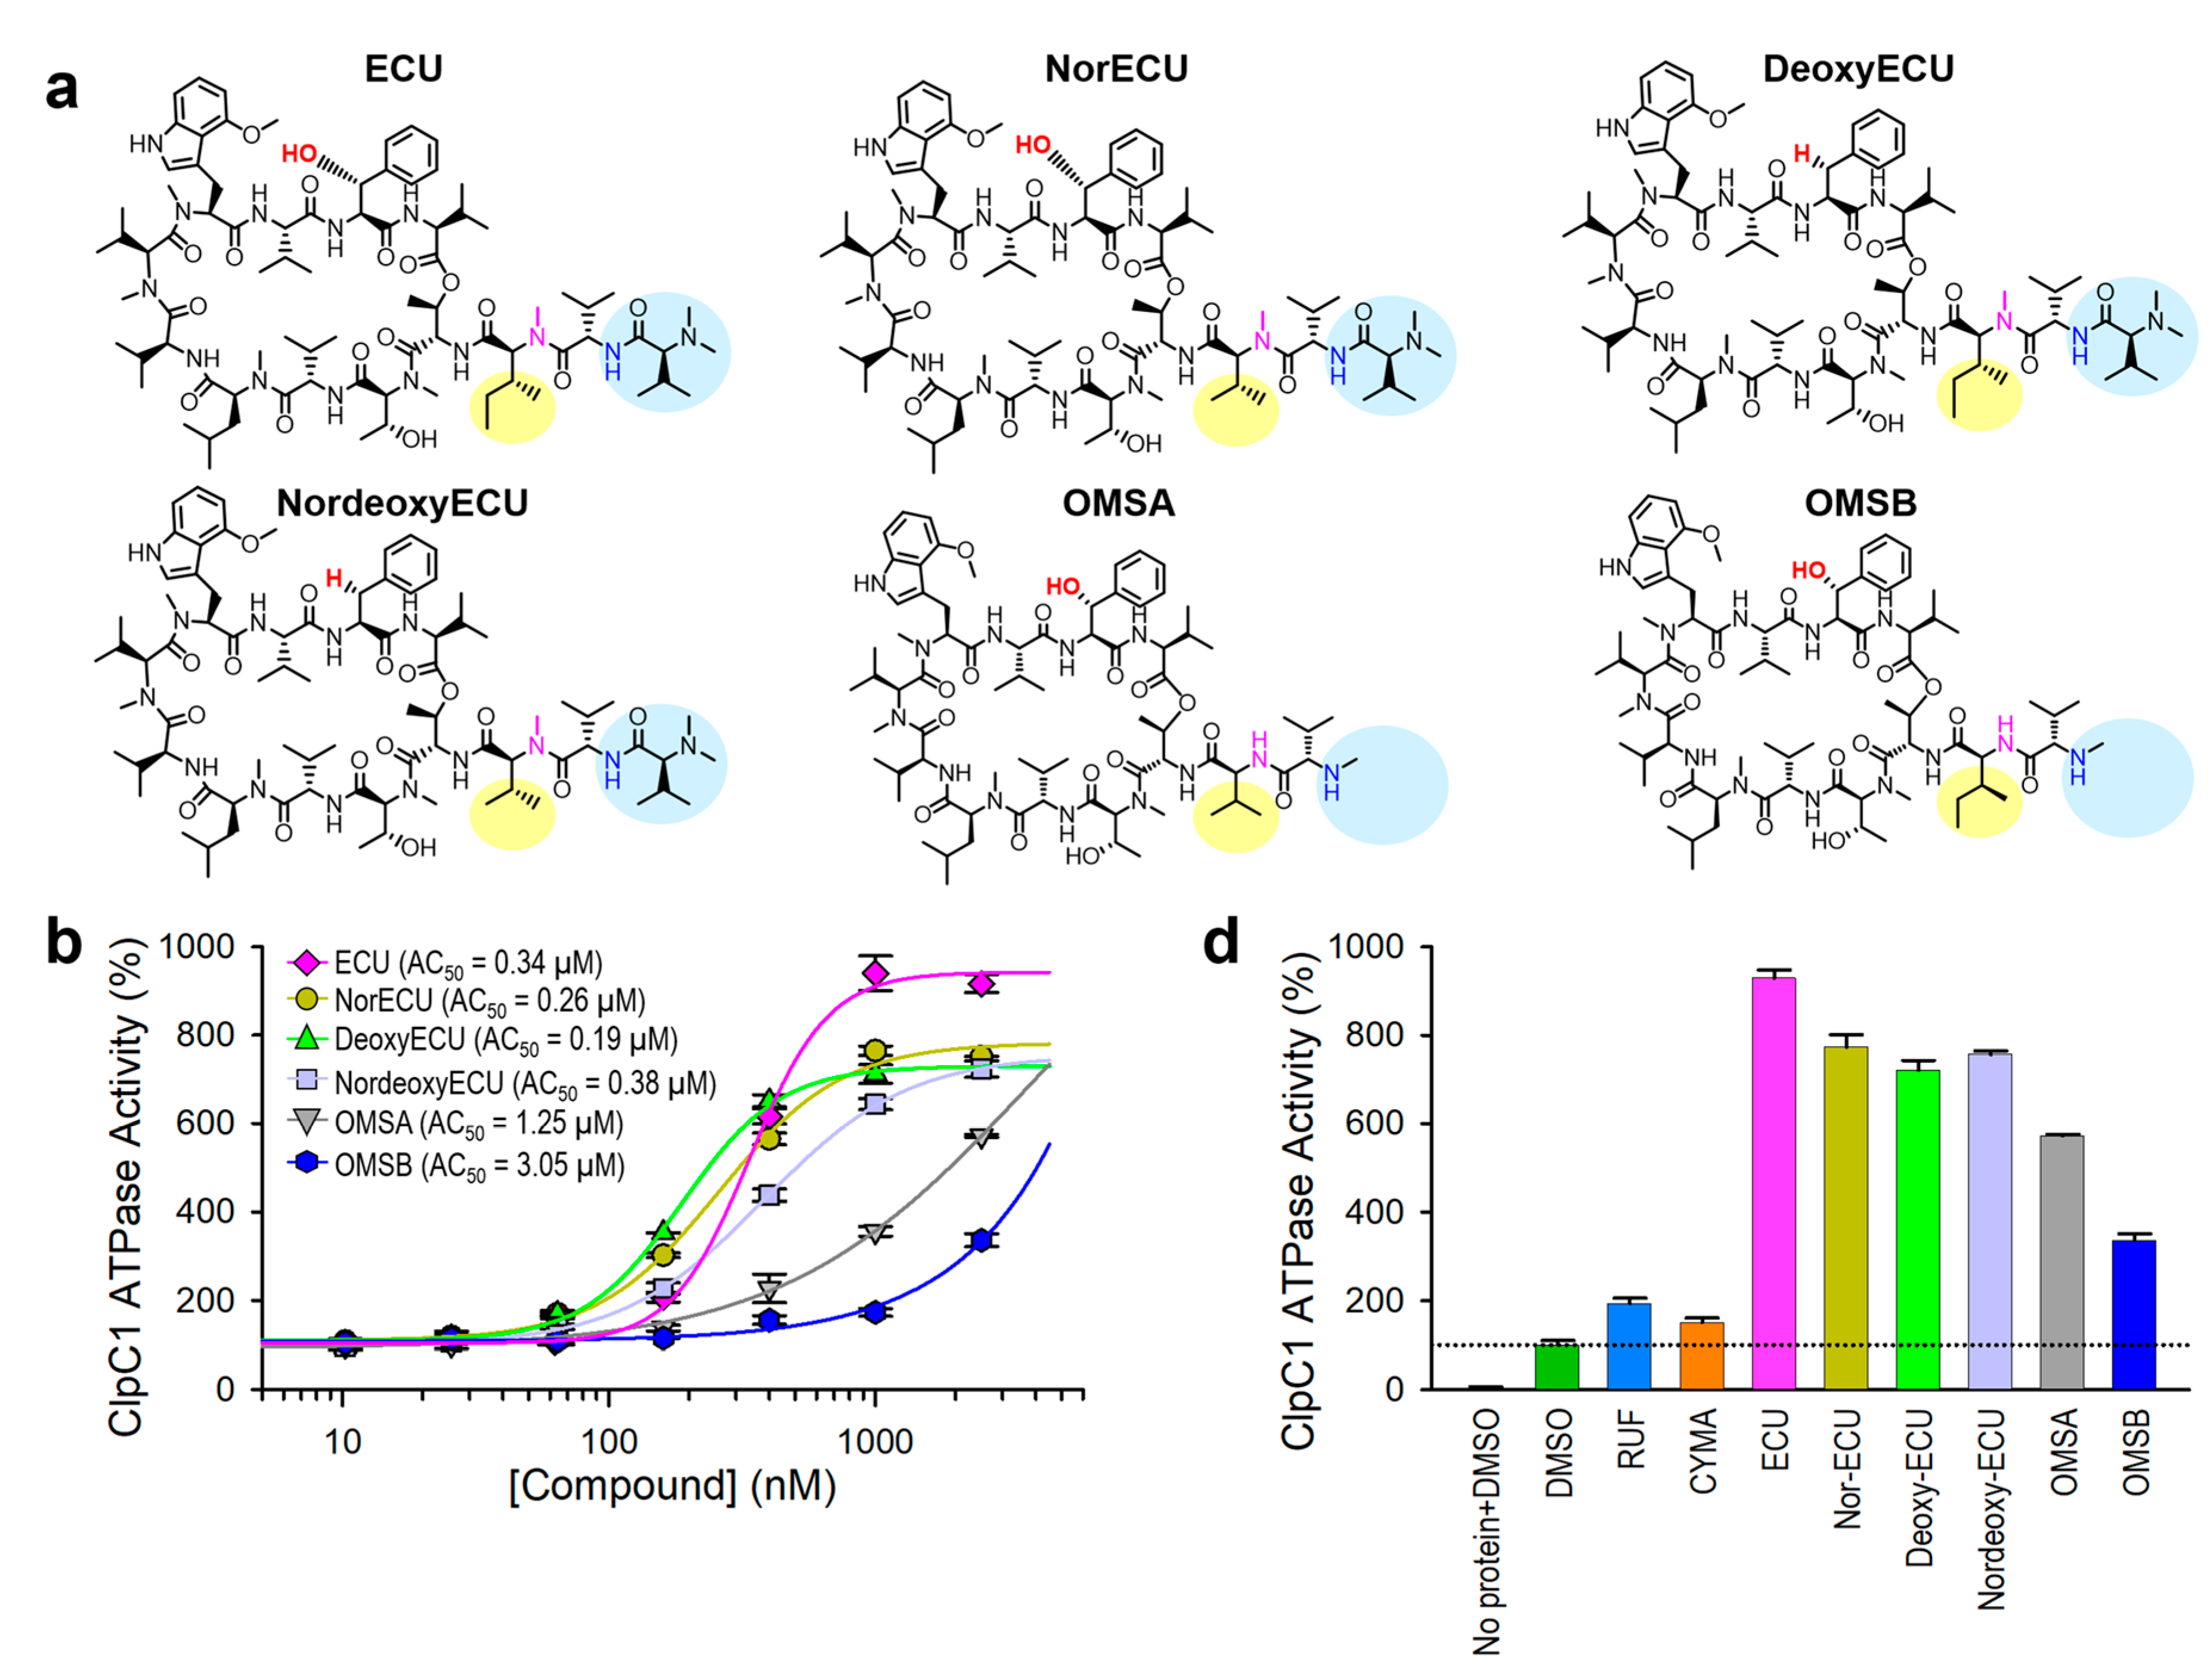
Figure 9.
Correlation among three parameters, MIC, KD and AC50. (a) Bar graph with AC50, KD, and MIC values of all tested cyclic peptides. The maximum activation of ATPase activity by each cyclic peptide is written on top of each AC50 bar graph. Error bars represent the standard deviations from three measurements. (b) MIC and KD1 values are plotted against each other. Two other pairs, MIC vs AC50 values (c) and AC50 vs KD1 values (d) were also plotted.
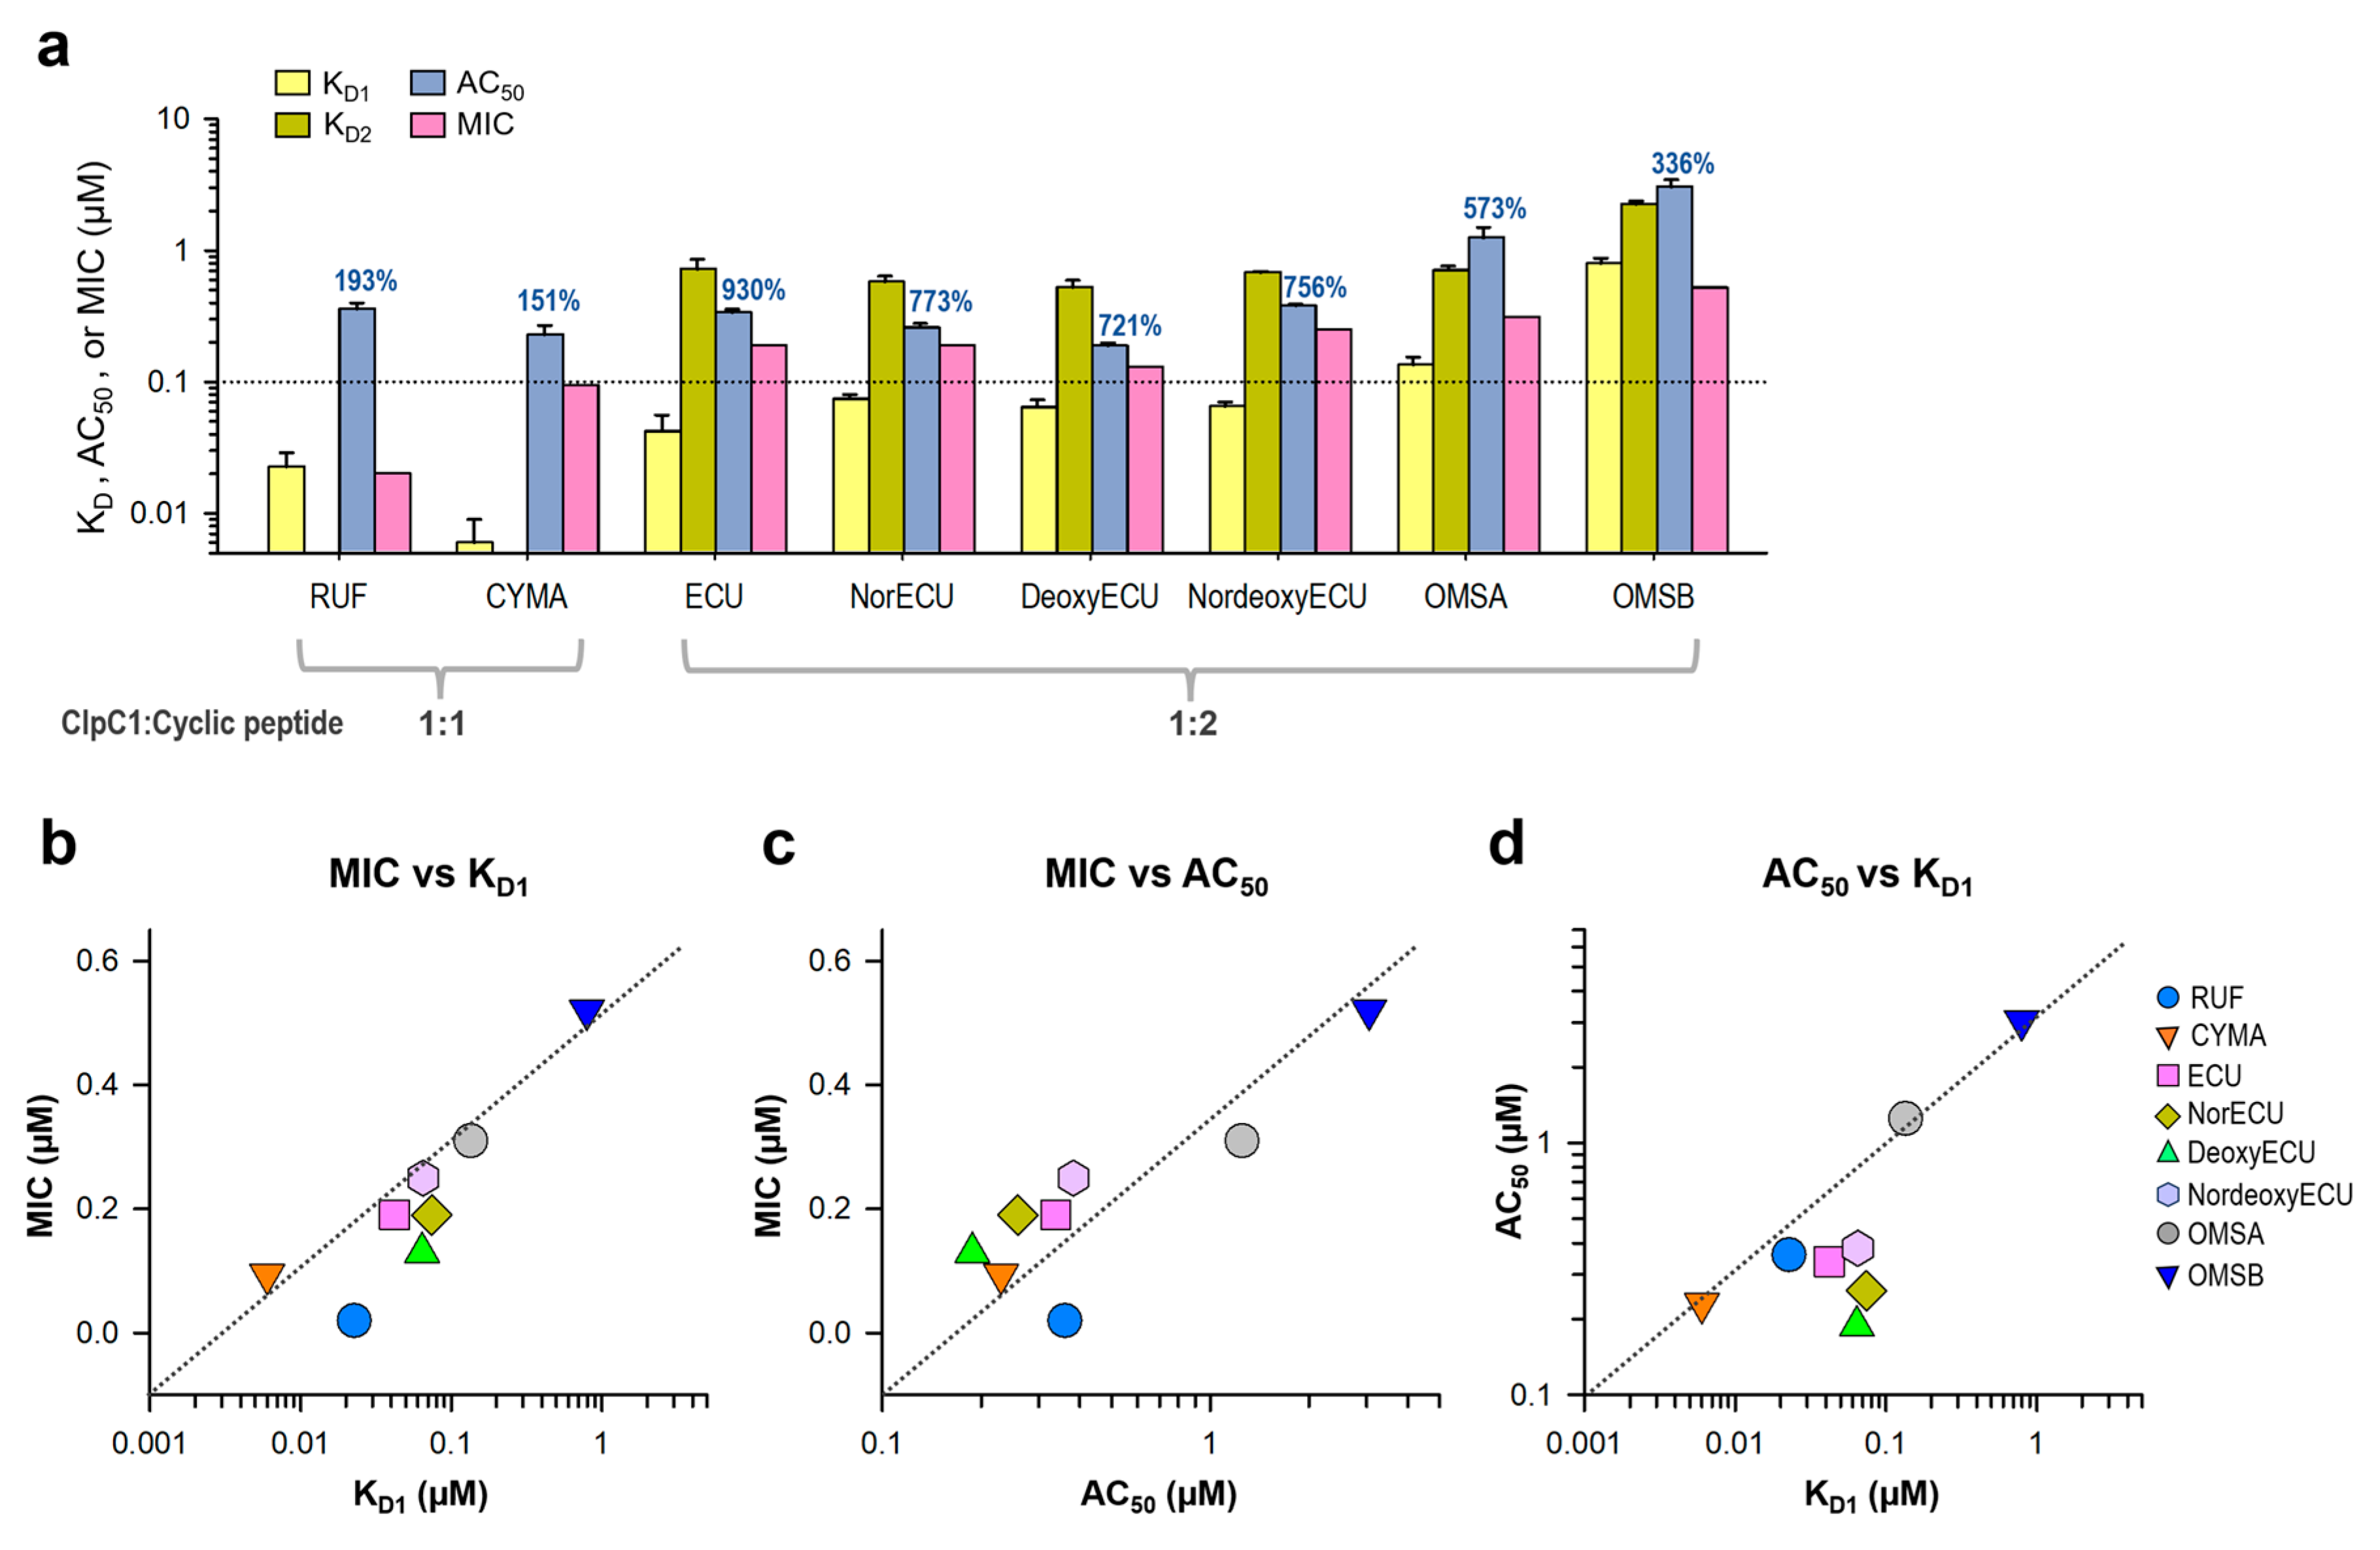
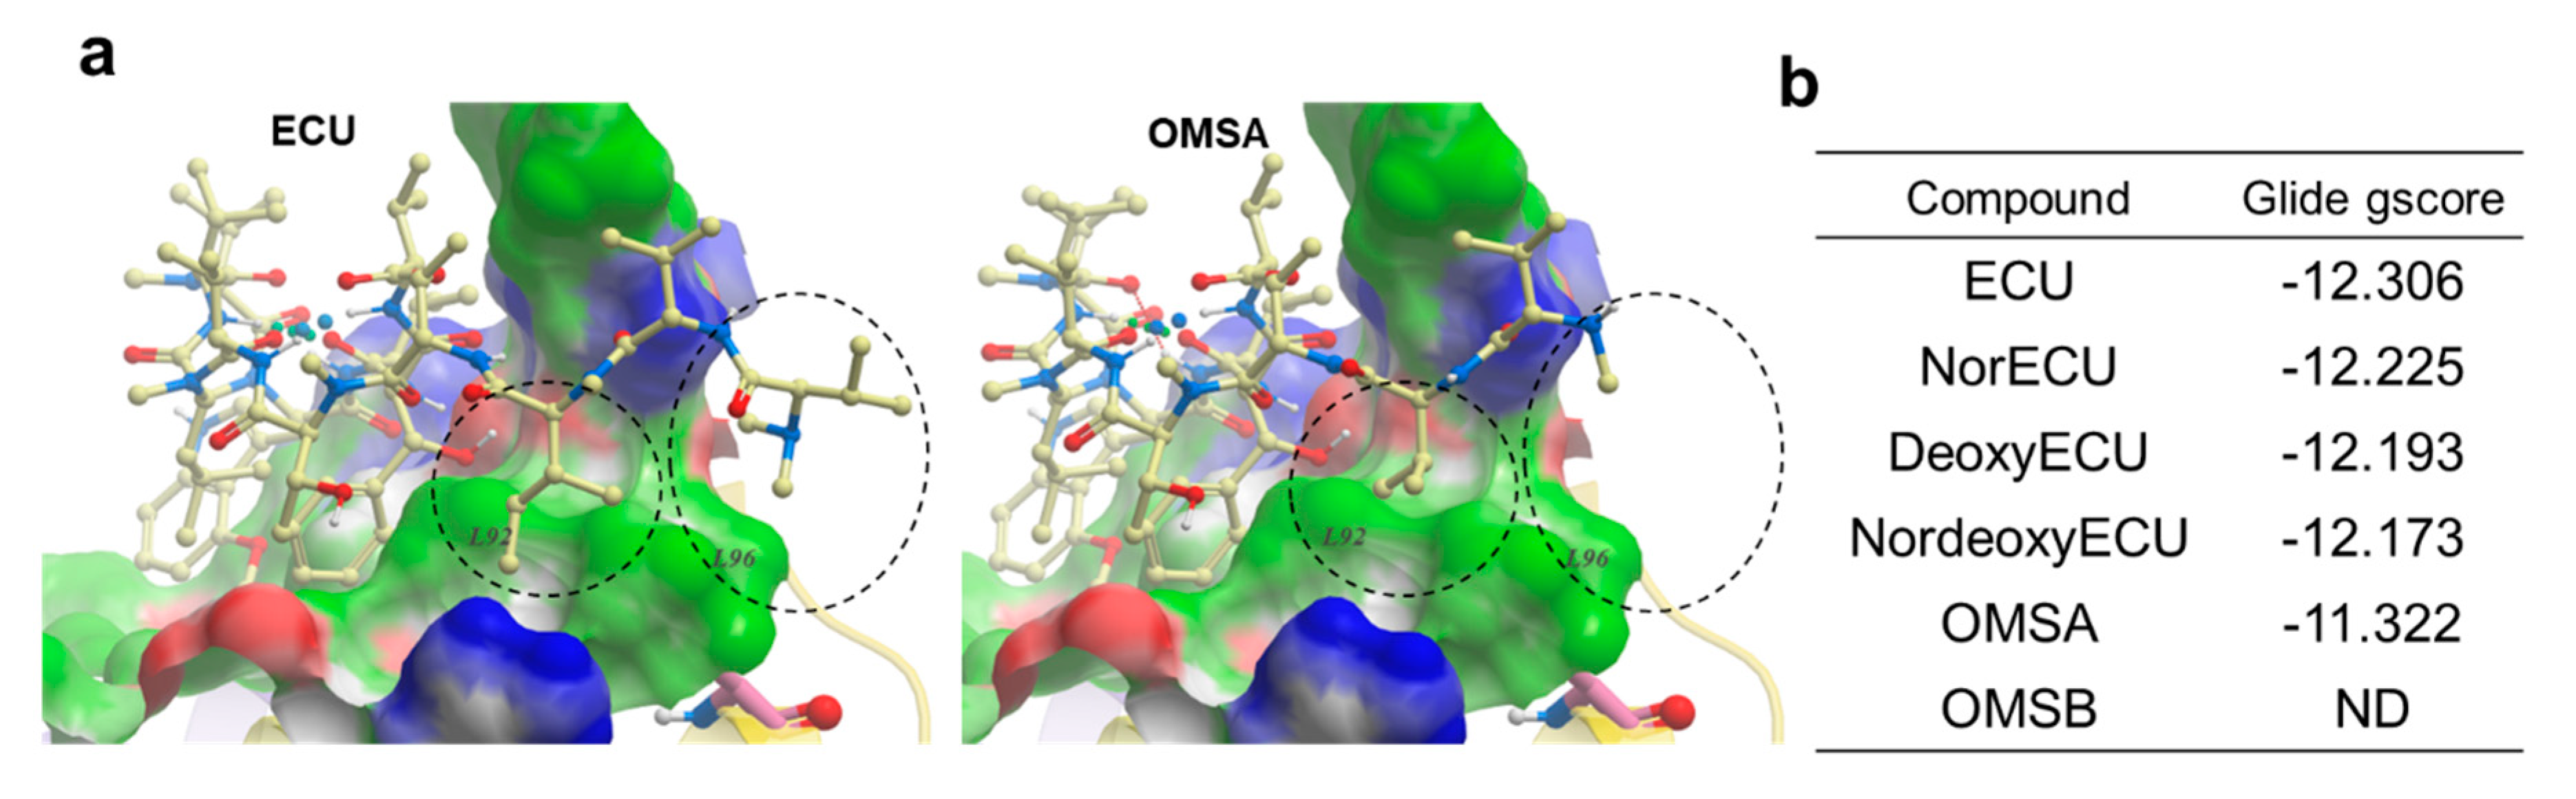
Figure 10.
Molecular docking of ECU and its analogs. (a) Docked conformations of ECU and OMSA. The NTD of ClpC1 is shown in surface representation with the following color code: white - neutral surface, green - hydrophobic surface, red - hydrogen bonding acceptor potential and, blue - hydrogen bonding donor potential. The corresponding hydrophobic surfaces of two residues (L92 and L96) are labeled. The compounds are shown in ball and stick representation (Carbon-light yellow, Nitrogen-blue and oxygen-red). The differences in interaction of compound’s tail with L92 and L96 residue is highlighted using black dashed circles (b) The Glide gscores for ECU and its five analogs.

| Compound | AC50 (µM) |
ATPase activity enhancement (%) | KD1 (µM) |
KD2 (µM) |
MIC90 (µM) |
|---|---|---|---|---|---|
| RUF | 0.360 ± 0.040 | 194 | 0.023 ± 0.006 | 0.020 | |
| CYMA | 0.230 ± 0.040 | 151 | 0.006 ± 0.003 | 0.094 | |
| ECU | 0.338 ± 0.019 | 930 | 0.042 ± 0.014 | 0.721 ± 0.135 | 0.190 |
| NorECU | 0.259 ± 0.020 | 773 | 0.074 ± 0.006 | 0.577 ± 0.060 | 0.190 |
| DeoxyECU | 0.188 ± 0.010 | 721 | 0.064 ± 0.009 | 0.527 ± 0.066 | 0.130 |
| NordeoxyECU | 0.382 ± 0.009 | 756 | 0.065 ± 0.005 | 0.682 ± 0.011 | 0.250 |
| OMSA | 1.250 ± 0.250 | 573 | 0.135 ± 0.020 | 0.706 ± 0.054 | 0.310 |
| OMSB | 3.050 ± 0.400 | 336 | 0.795 ± 0.080 | 2.250 ± 0.121 | 0.520 |
Disclaimer/Publisher’s Note: The statements, opinions and data contained in all publications are solely those of the individual author(s) and contributor(s) and not of MDPI and/or the editor(s). MDPI and/or the editor(s) disclaim responsibility for any injury to people or property resulting from any ideas, methods, instructions or products referred to in the content. |
© 2024 by the authors. Licensee MDPI, Basel, Switzerland. This article is an open access article distributed under the terms and conditions of the Creative Commons Attribution (CC BY) license (http://creativecommons.org/licenses/by/4.0/).
Copyright: This open access article is published under a Creative Commons CC BY 4.0 license, which permit the free download, distribution, and reuse, provided that the author and preprint are cited in any reuse.


