
Submitted:
09 December 2024
Posted:
11 December 2024
You are already at the latest version
Abstract
Pulsed electric field (PEF) has previously been recognized as a method of gentle food processing and its use has been shown to be helpful in reducing the levels of toxigenic Fusarium micromycetes developed during malting. The aim of this study was to describe the effect of PEF on gene expression and metabolite production at the pre-finishing stage of barley malting by using a novel multi-omics data-driven approach. The study helps to uncover the processes occurring in the germinated grain, and discusses the up-/downregulation of genes and metabolites in relation with fungal infection and/or PEF-induced abiotic stress. Among the factors upregulated by PEF and previously described as supportive against Fusarium diseases, we identified increased expression of gene encoding vegetative gp1-like protein which positively correlated with flavonoids, (methylsulfanyl)prop-2-enoates, triterpenoid glycosides and indole alkaloids. On the other hand, some genes associated with barley resistance to fungal infection were also overexpressed in the untreated control (in particular genes encoding ethylene response factor 3-like, putrescine hydroxycinnamoyltransferase 3-like and dirigent protein 21-like). The study provides the first 'data-driven' basic research results that contribute to the understanding of the role of PEF as an effective fungal decontamination strategy, and allows the formulation of new hypotheses related to Fusarium-pathogen cross-talk.
Keywords:
pulsed electric field
; barley
; Fusarium micromycetes
; abiotic stress
; metabolomics
; transcriptomics
; multi‐omics
1. Introduction
Research on plant metabolic pathways has advanced significantly in recent decades, driven by breakthroughs in genomic, transcriptomic, proteomic, and metabolomic studies. These comprehensive investigations have yielded vast amounts of information on the biochemical and physiological processes in plants and microorganisms. Genome sequencing of numerous plant species has facilitated the identification of genes encoding key enzymes involved in essential biosynthetic pathways. Meanwhile, the rise of metabolomics, powered by cutting-edge analytical techniques, has enabled the detailed analysis of a broad spectrum of plant metabolites.
A wide array of bioinformatic tools and databases such as KEGG [1], YMDB [2], PlantCyc [3], MetaCyc [4], GNPS [5], Cytoscape [6], among others, have been developed to help scientists explore and understand the intricate biochemical pathways in plant organisms [7,8]. However, despite the wealth of data available in these resources, challenges remain in covering specific aspects of secondary metabolism, particularly in relation to responses to abiotic stresses (such as drought, salinity, or extreme temperatures) or biotic stresses caused by pathogenic microbial interactions [8]. These databases often fall short in providing clear and definitive answers to these complex questions.
The complexity of the plant metabolome [9,10], coupled with the insufficiently mapped knowledge databases, has been a topic of ongoing discussion [11]. This lack of understanding often hinders the accurate interpretation of metabolomic studies, which are crucial for improving agricultural practices, such as crop cultivation and plant resistance, together with minimizing fungal diseases, as well as for improving processing technologies of plant-based foods with minimizing the occurrence of undesirable fungal metabolites. One of the food processing technologies particularly susceptible to the spread of microbial infections, especially toxinogenic micromycetes of the Fusarium genus, is barley malting. During the malting process, barley is soaked and germinated for several days under humid conditions, which create an environment conducive to the spread of fungal pathogens naturally present on the grain surface, followed by toxin production [12,13,14]. However, as demonstrated in recent studies, treating barley grains with short, intensive electric pulses (food processing technology called the Pulsed Electric Field, PEF) prior to malting disrupts the viability of these fungi through electroporation, significantly reducing the spread of fungal pathogens [15,16,17]. Tackling the issue of minimizing the development of Fusarium micromycetes during malting using PEF holds great potential. Consequently, it is crucial to investigate how this intervention influences the physiology and metabolism of germinating grains, as well as the interactions between the grain and the pathogen.
Although some information on the mutual interaction between plants and Fusarium species is available, most studies have been conducted on cereals under field cultivation conditions [18,19,20]. Field or greenhouse experiments have shown, for instance, that metabolites closely associated with pathogenesis, which are upregulated in cereal varieties resistant to Fusarium diseases, include phenylpropanoids, flavonoids, terpenoids, hydroxycinnamic acid amides, and lignans [18,19,20,21]. Similarly, at the genomic and transcriptomic levels, numerous pathogenesis-related genes involved in the development of field Fusarium diseases have been identified [21]. There are also publications utilizing metabolomics and other “omics” disciplines to investigate the effects of biotic and abiotic stress on plant physiology [22,23]. However, the processes occurring during barley growth in the field may differ significantly from those taking place during barley germination in malt houses. To the best of our knowledge, no studies currently exist that explore biochemical changes in barley (or other cereals) germinated under malting or similar food processing technologies, and their relationship with Fusarium pathogens and/or abiotic stress. This study fills this knowledge gap by providing novel insights into gene expression and metabolic changes in germinated barley subjected to PEF intervention. Using a combined metabolomics-transcriptomics approach, it contextualizes these findings within the framework of Fusarium disease.
2. Results and Discussion
2.1. Analysis of Fusarium Fungi
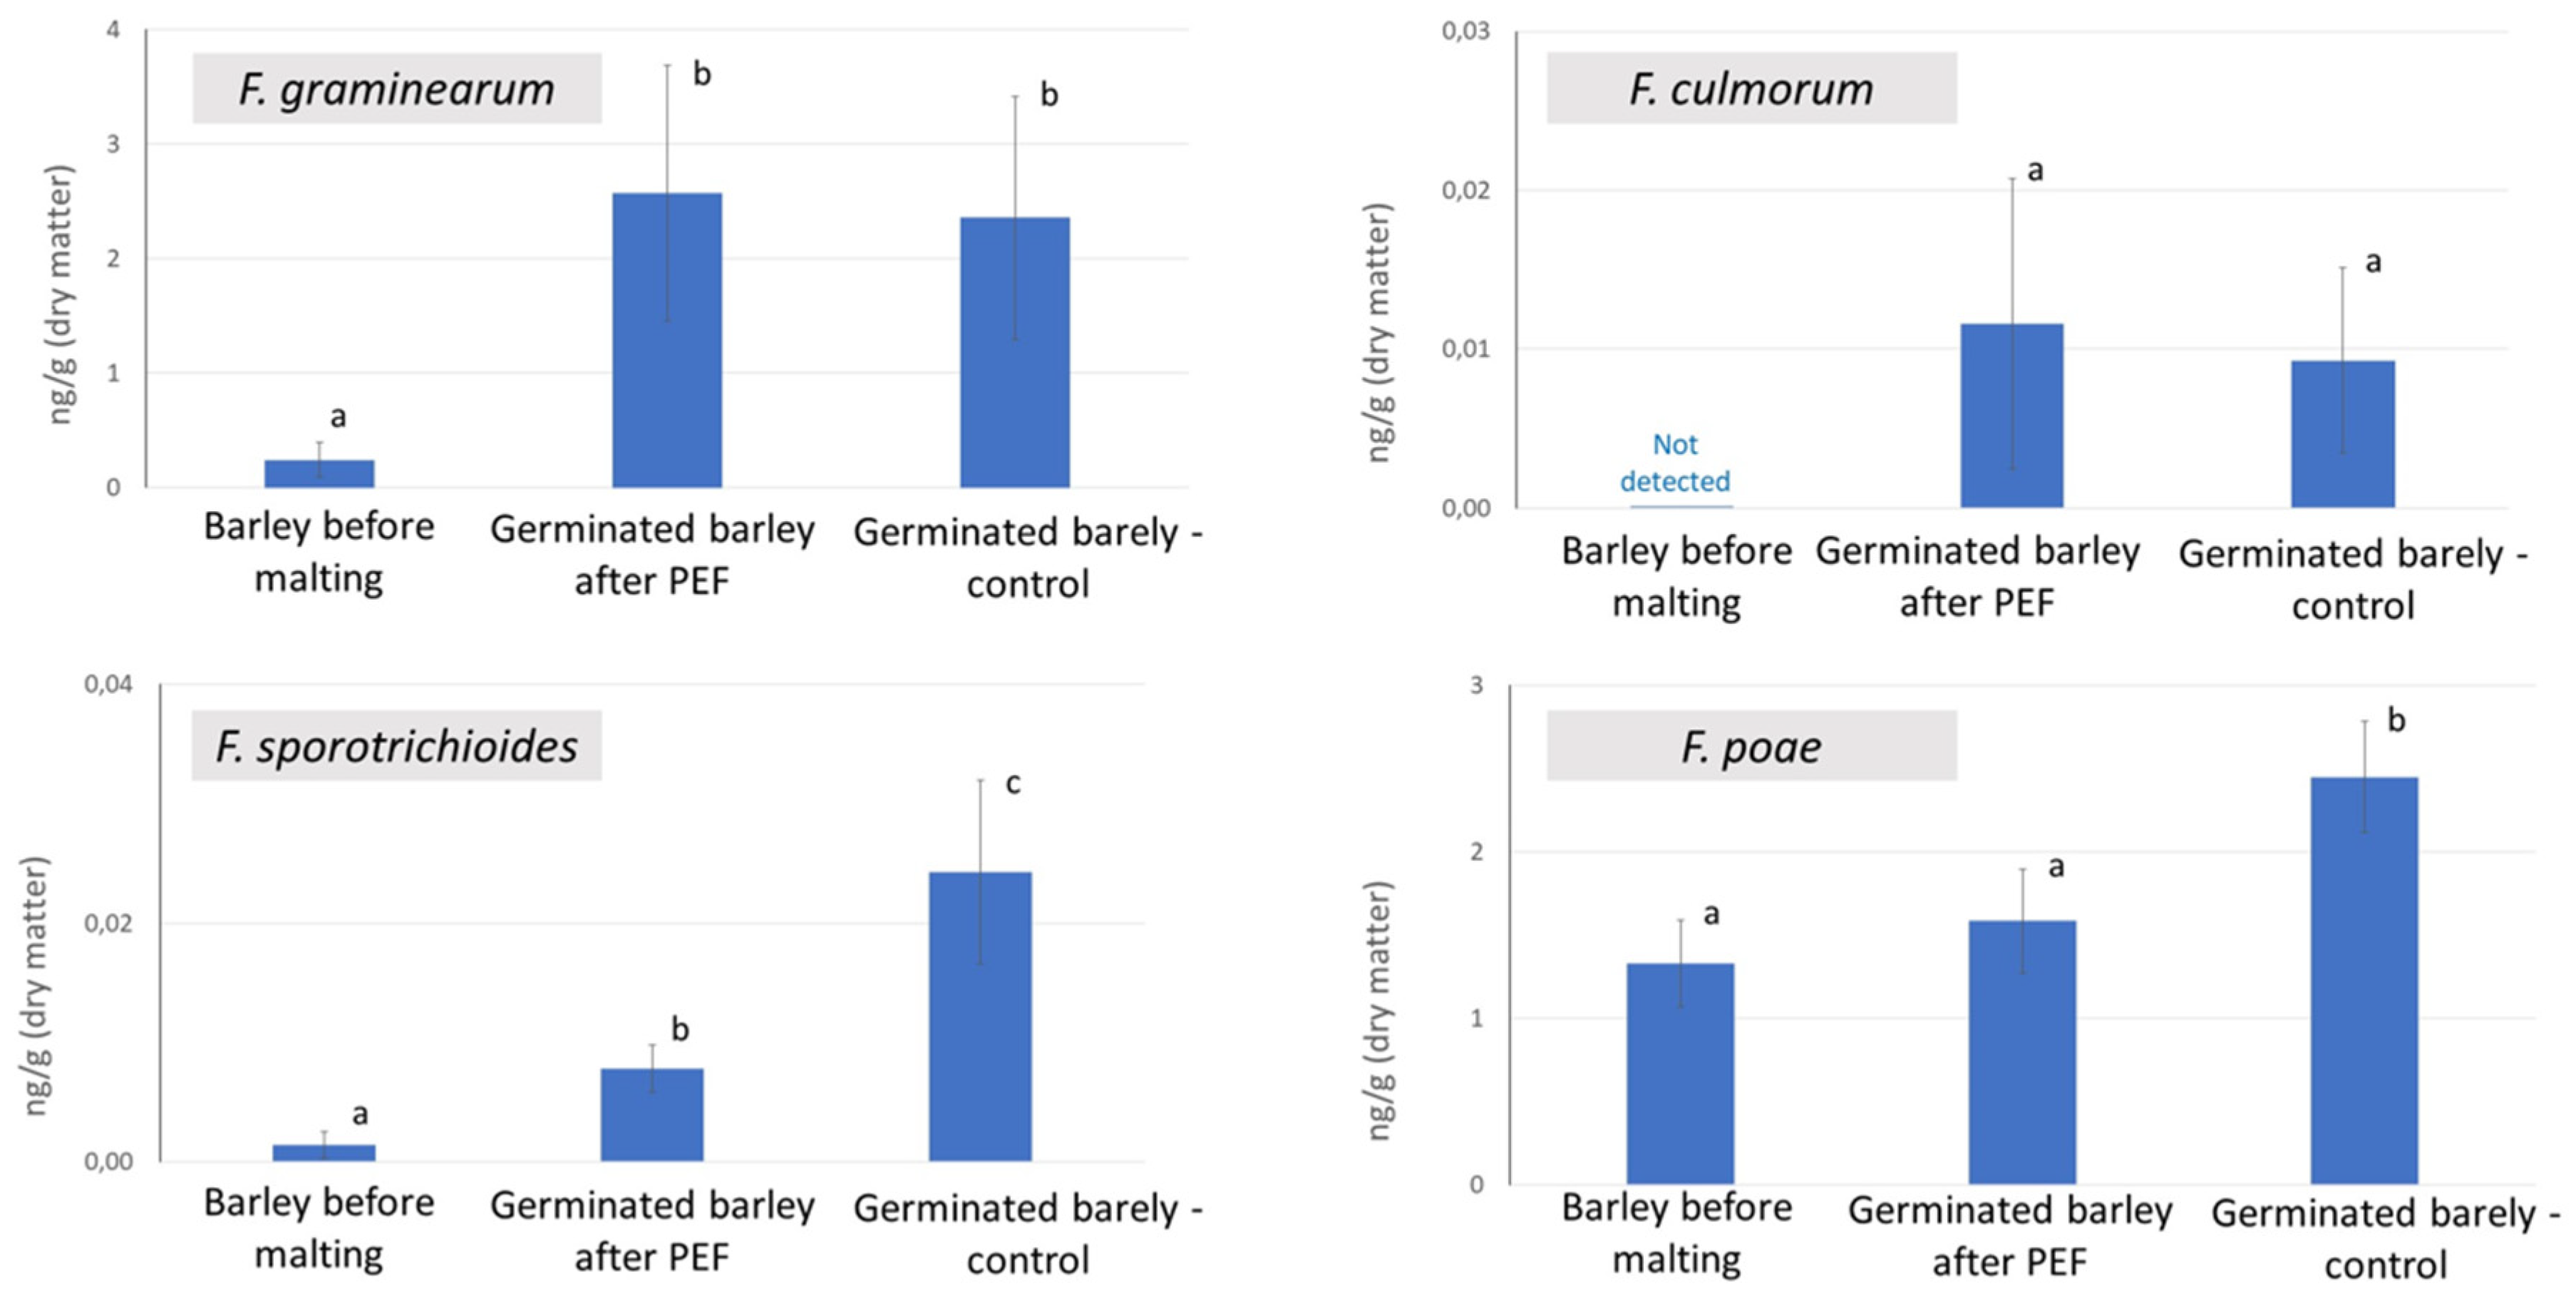
In this study, malting barley grown in the field under the standard agricultural practice was used. The initial analysis revealed natural infection by Fusarium fungi in the grains at low levels, with specific concentrations measured as follows: 0.2423 ± 0.1524 ng/g for F. graminearum, 0.0014 ± 0.0011 ng/g for F. sporotrichioides, and 1.3307 ± 0.2613 ng/g for F. poae. After 72 h of germination, with and without the PEF pre-treatment, the barley samples were analyzed using RT-PCR to quantify pathogen DNA content. As shown in Figure 1, despite the fact that the fungal DNA content increased during germination for all species studied, the content of F. poae and F. sporotrichioides DNA was significantly lower in the germinated barley samples treated with PEF compared to the untreated control. In contrast, the DNA levels of F. culmorum and F. graminearum remained relatively unchanged. Although a slight increase in mean DNA concentration for these two species was observed following PEF treatment, the changes were not statistically significant. These trends align with those observed by Karabin et al. and Prusova et al., who conducted similar experiments using barley artificially inoculated with Fusarium species [17,24].
Figure 1.
Concentration of fungal DNA in samples of barley and malted barley; the error bars represent the standard deviation, n = 9. Data were statistically processed using a two-sample t-test with unequal variance; statistical differences (p-value < 0.05) are indicated by letters.
Figure 1.
Concentration of fungal DNA in samples of barley and malted barley; the error bars represent the standard deviation, n = 9. Data were statistically processed using a two-sample t-test with unequal variance; statistical differences (p-value < 0.05) are indicated by letters.
2.2. Multi-omics analysis and data processing
The level of expressed genes in the germinated barley, with and without prior PEF treatment, was analyzed by the next-generation sequencing (NGS), and changes in metabolite production were recorded by ultra-high-performance liquid chromatography coupled with high-resolution mass spectrometry (U-HPLC-HRMS/MS). As mentioned in the introduction, although significant advances have been made in metabolomics and transcriptomics in plant research in recent years, there are still significant knowledge gaps, particularly in understanding plant-pathogen cross-talk. This is primarily due to the inherent complexity of plant and microbial metabolism and the still incomplete mapping of these processes. Such limitations significantly hinder the application of the so-called “knowledge-driven” approach to data processing, which relies on integrating information from databases and libraries and establishing cross-connections across various levels of omics disciplines [25]. Unlike humans and experimental mammals, whose metabolism is comparatively well-studied and described, plants and fungi possess unique and highly complex biosynthetic pathways. These pathways are not only species-specific but often vary significantly even between different varieties of the same species. The influence of biotic or abiotic stress adds further layers of complexity, introducing additional unknowns into this area of research.
Following that, for data processing in this study, a new multi-omics approach utilizing the ‘data-driven’ correlation method described by Ewald et al. [25] was employed. This approach involved an initial selection of statistically significant variables from each single-omics level prior to the correlation analysis. Unlike the original protocol by Ewald et al. [25], the pre-selection of statistically significant variables (as described in Chapter 4.8 Variables filtration at the single-omics level of the Experimental section) was implemented to limit the number of variables entering the correlation analysis and to filter out correlations with low significance. The complete lists of output features from the transcriptomics and metabolomics analyses are provided in Table 1 and Table 2, respectively, with all relevant details about the identified genes and metabolites available in the Supplementary Materials (MS Excel file). These output lists were subsequently correlated using the OmicsAnalyst software, following the methodology of Ewald et al. [25]. The results of the data-driven correlation between transcriptomics and metabolomics data are presented in Figure 2.
Figure 2.
(A) Score plot of Multiple Co-Inertia Analysis (MCIA) analysis, (B) Loading plot of Multiple Co-Inertia Analysis (MCIA) analysis, (C) Score plot of Data Integration Analysis for Biomarker discovery using Latent cOmponents (DIABLO) analysis, (D) Loadings plot of Data Integration Analysis for Biomarker discovery using Latent cOmponents (DIABLO) analysis, (E) Transcriptomics-metabolomics correlation network; correlated components with correlation coefficient value ≥ 0.8.
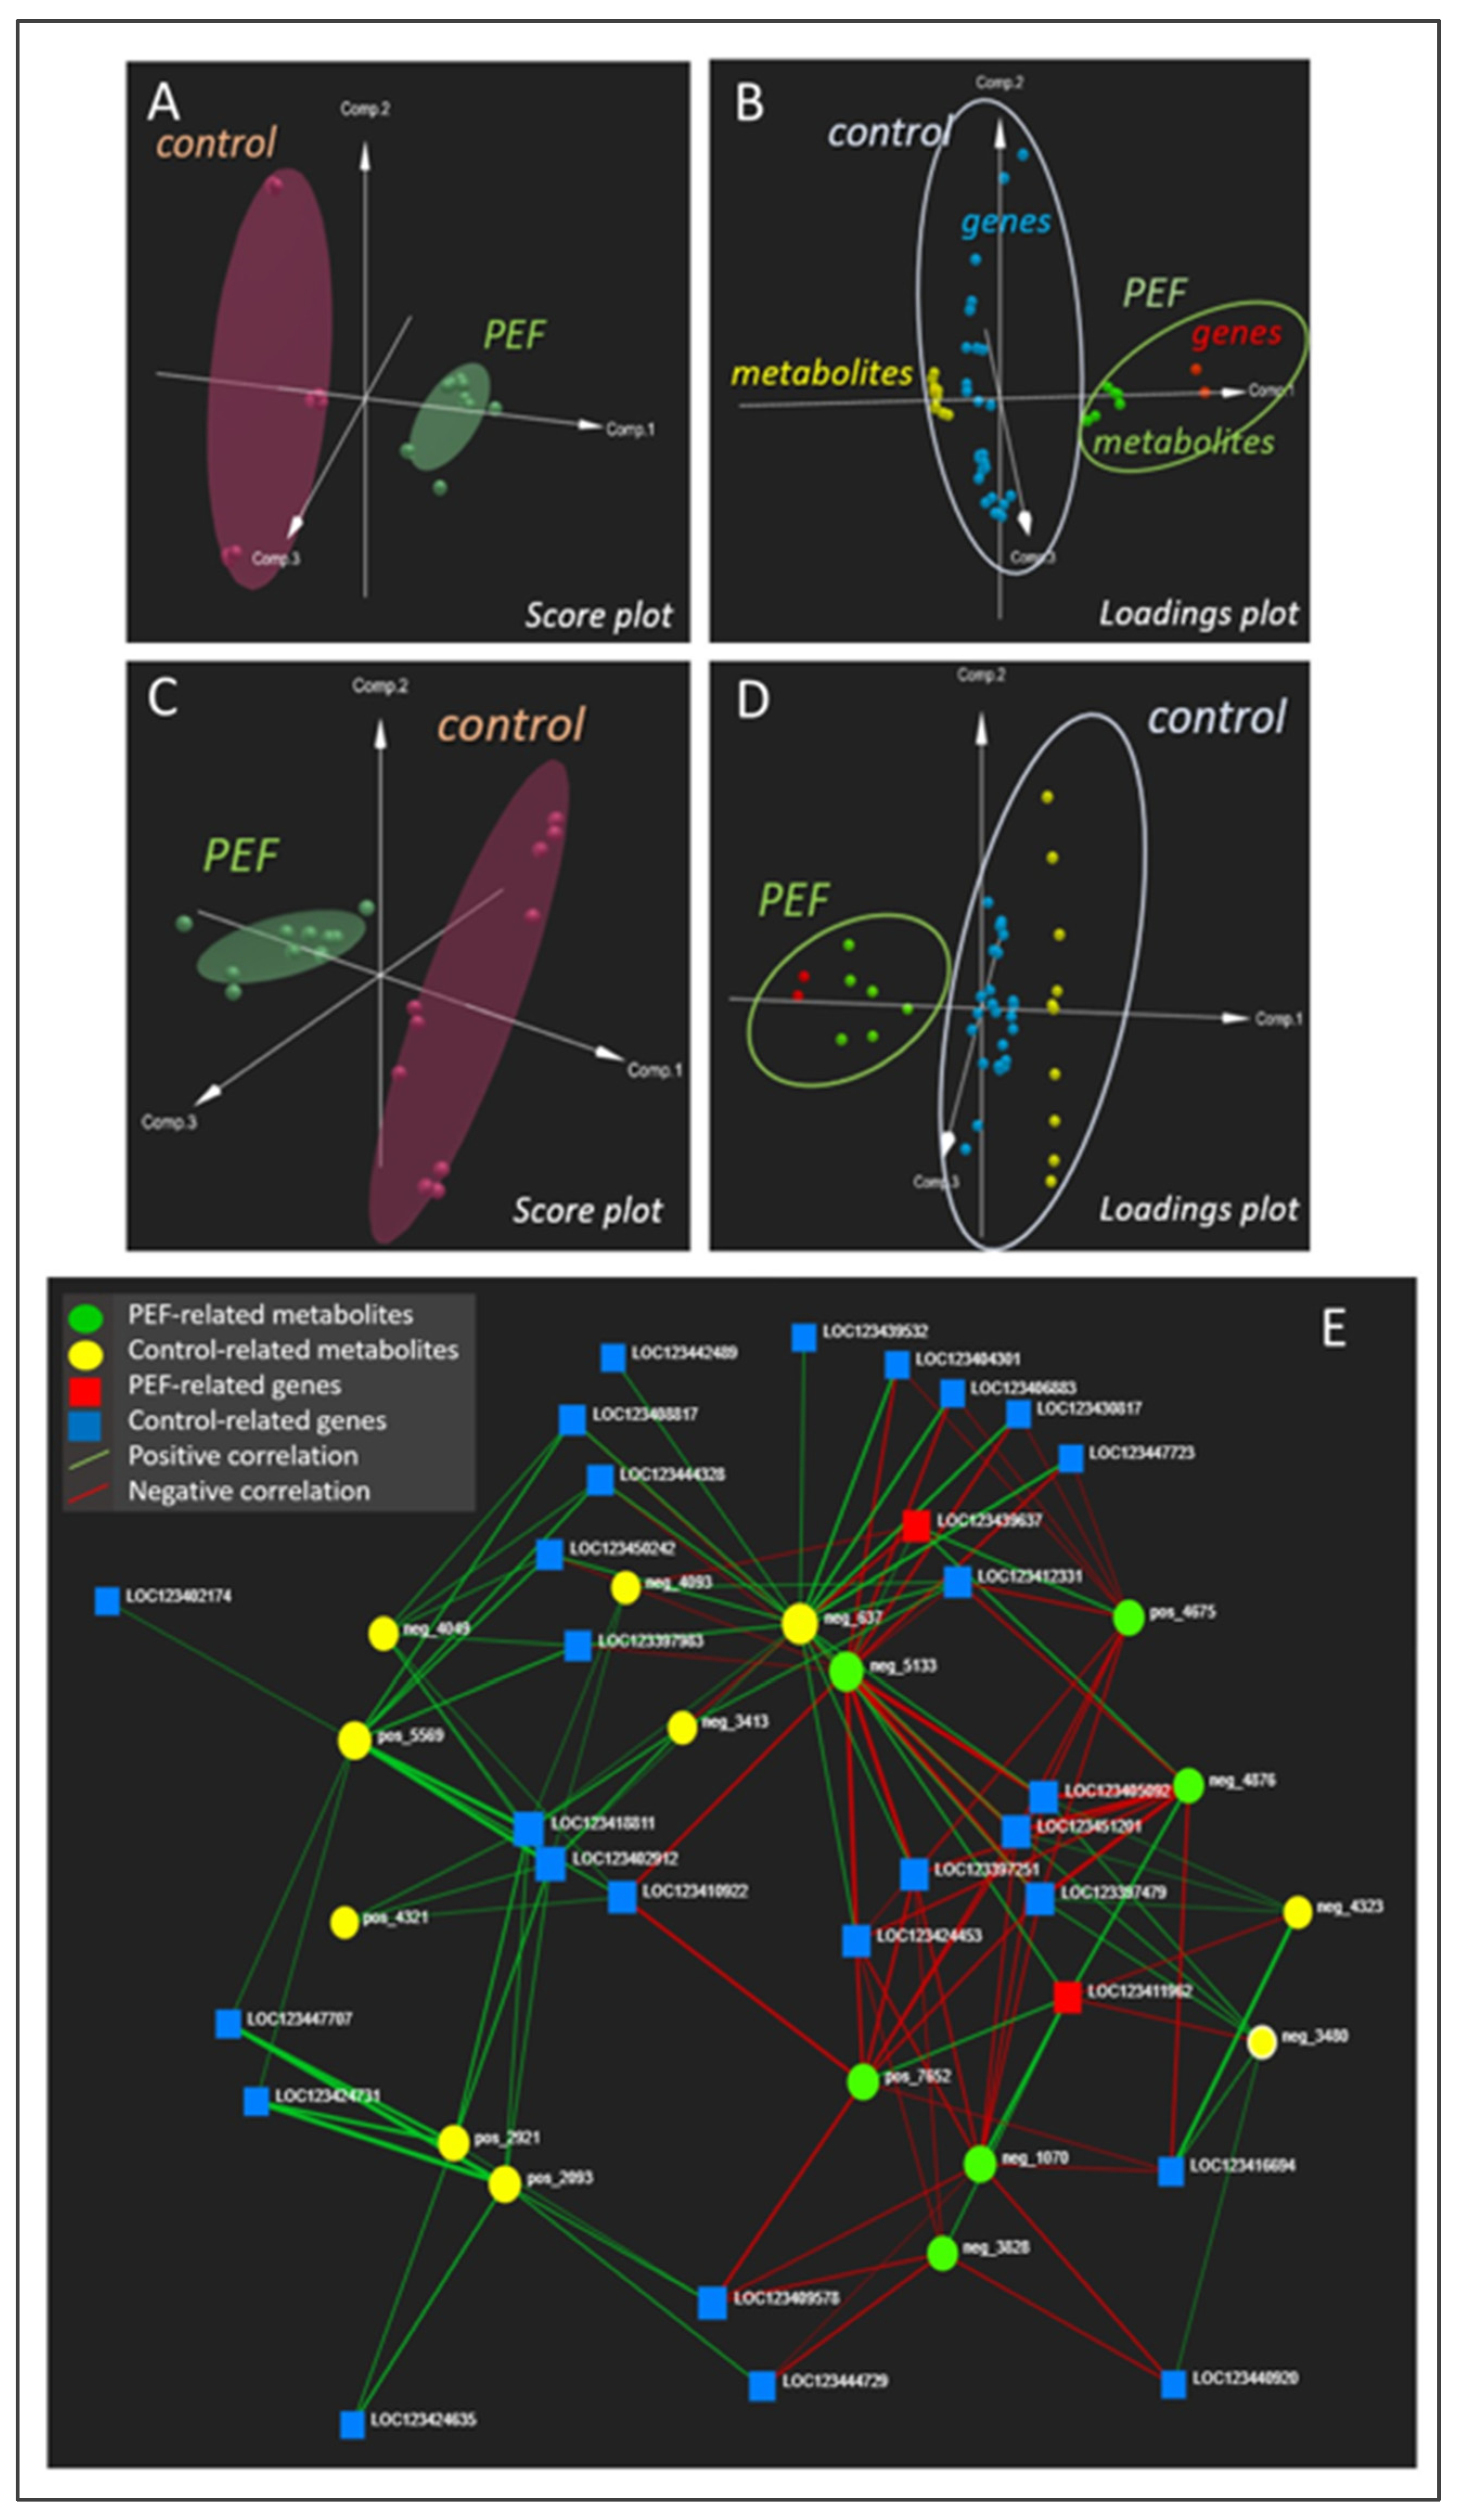
For better clarity, all positive and negative correlation relationships illustrated by a relatively uncluttered ‘multi-omics spider’ are also listed in the Supplementary Materials (MS Excel file). As results from the Table 1 and Figure 2, the only two barley genes whose expression was upregulated by PEF were the genes encoding vegetative gp1-like protein a late embryogenesis abundant protein (LEA) EMB564-like. The vegetative gp1-like protein is known as a part of the plant cell wall acting as a mechanical barrier against negative external influences, including penetration of fungal pathogens [26]. The expression of gene encoding this protein positively correlates with several metabolites, including amentoflavone 7,4′-dimethyl ether. According to the literature, flavonoids are known to protect plant cell wall integrity upon fungal infection by inhibiting the activity of specific cell wall degrading enzymes that are secreted by fungal pathogens to penetrate plant tissues [21,27]. There is also a positive correlation between the vegetative gp1-like protein gene overexpression, and upregulation of the compound from triterpenoid glycosides class, called (2,3,4-trihydroxy-5-{[11-hydroxy-1-(2-hydroxy-6-methylhept-5-en-2-yl)-3a,3b,6,6,9a-pentamethyl-hexadecahydro-1H-cyclopenta[a]phenanthren-7-yl]oxy}cyclohexyl)methyl acetate. Terpene glycosides generally belong to the plant secondary metabolites that act as protective factors against fungal pathogens [28,29], by inhibiting the fungal (1→3)-β-D-glucan synthase, a key enzyme for rigid fungal cell wall [30]. Another metabolite positively correlated with vegetative gp1-like protein gene expression was (2-methoxyphenyl)methyl 3-(methylsulfanyl)prop-2-enoate. Specifically, this compound itself has not been described in barley before, but related substances, derivatives of (methylsulfanyl)prop-2-enoate, have been identified as important components of the extract of another plants [31,32] for which antifungal activity has been demonstrated [32]. The above described cluster of PEF upregulated genes expression and metabolites production mutually correlated with coefficient ≥ 0.8 allows to formulate a hypothesis that PEF stimulates the biosynthesis of defensive biotic factors as a defense against Fusarium micromycetes, which could theoretically explain the reduction in the incidence of Fusarium species, specifically F. sporotrichioides and F. poae in PEF-treated barley (see Figure 1).
Another factor upregulated after the PEF treatment is the gene encoding the late embryogenesis abundant protein (LEA) EMB564-like. In plants, these hydrophilic LEA, including the EMB564-like proteins, are highly produced in embryos during the late embryogenesis stage and in vegetative organs in response to the plant tissues desiccation and drought stress conditions [33,34]. As can be seen in Figure 2, the expression of LEA encoding gene positively correlates with upregulation of metabolite 6,7-dimethoxy-N-methyl-2-[3-(1H-pyrrol-1-yl)-3-(thiophen-3-yl)propanoyl]-1,2,3,4-tetrahydroisoquinoline-3-carboxamide, the isoquinoline alkaloid derivative. Despite the fact that this metabolite has not been described in any previous barley associated study, its positive correlation with LEA protein production makes good sense in the context of the results of the study performed on callus plants [35], where metabolites upregulated in response to drought stress were identified as intermediates of isoquinoline alkaloid biosynthetic pathways [35]. Given that drought stress cannot be taken into account during barley germination during malting (the usual relative humidity is between 90% and 100%), our data-driven correlation study suggests that germinating grain accumulates LEA in response to another type of abiotic stress, most likely that caused by PEF treatment.
In the recent literature, there are many references cross-connecting expression of LEA genes and plant hormones, e.g., abscisic acid (ABA), as one the key players in adaptive response to drought stress; under the stress conditions, the biosynthesis and accumulation of ABA is enhanced, which triggers LEA genes expression [36,37]. At the same time, it is known that ABA also triggers key defense mechanisms relevant to Fusarium infection [38,39]. Despite the fact that ABA was not among the metabolites identified in our study, we can indirectly generalize that increased production of specific signaling molecules in reaction to PEF-induced abiotic stress triggers not only accumulation of LEA, but also the Fusarium defensive factors. This theory is supported by PEF-induced upregulation of two metabolites found in our study, in particular 4,12-dihydroxy-6-(hydroxymethyl)-16-methyl-17-[(N’-methylcarbamimidamido)methyl]-2-oxa-25-azapentacyclo [22.3.1.13,⁷.113,1⁷.0⁹,2⁰]triaconta-3(30),4,6-trien-18-yn-10-yl acetate from the group of pentacyclic methylguanidine derivatives, and methyl 15-ethyl-10-[15-ethyl-18-(methoxycarbonyl)-17-methyl-10,17-diazatetracyclo [12.3.1.03,11.0⁴,⁹]octadeca-3(11),4,6,8-tetraen-12-yl]-12-hydroxy-17-methyl-10,17-diazatetracyclo [12.3.1.03,11.0⁴,⁹]octadeca-3(11),4,6,8-tetraene-18-carboxylate, the derivative of indole alkaloids. As it is known from previous studies, some of the polycyclic guanidine derivatives isolated from the natural resources show antifungal activities [40]. Simple polyamines then play a positive role in the response of plants to various stress conditions, including drought [41], and indole alkaloids have been previously described as substances enhancing tolerance of plants to drought- or Fusarium-induced stress [35,42,43]. Neither the methylguanidine derivative nor the indole alkaloid characterized in this study have been previously reported as constituents of barley, and their direct association with LEA has not been demonstrated in the literature before. Nevertheless, the relationships revealed by the data-driven multi-omics allows raising new theories that need to be tested in the future, and would never have emerged without the methodology used here.
On the other hand, several genes associated with barley’s ability to defend itself against fungal infection were overexpressed also in the PEF untreated control variant. One such gene is the gene encoding the ethylene response factor 3-like (ERF3) protein, that induces the expression of pathogen-related proteins that help alleviate pathogen infection [44]; besides this role, proteins from ERF family are involved also in plants growth and fruits maturation [45]. Another significant gene upregulated in untreated control is that encoding putrescine hydroxycinnamoyltransferase 3-like protein, which belongs to the hydroxycinnamoyltransferase (HCT) family of enzymes. These enzymes catalyze the transfer of hydroxycinnamoyl groups in the biosynthesis of phenylpropanoids, from which monolignols and lignin, forming a mechanical barrier of the cell walls against infection, are further biosynthesized [46,47]. Similarly, another overexpression in the control variant was observed for the gene encoding the dirigent protein 21-like, which has also been previously described as important factor in relation to lignin biosynthesis in response to biotic and abiotic stress [48,49]. These trends may be related to the slightly lower levels of F. culmorum and F. graminearum in ‘control’ germinated barley without PEF intervention, and illustrate well the complexity and ambiguity of the events occurring in a living plant organism.
The overexpression of all of these control-related genes positively correlates with upregulation of some lipid species in control samples, in particular with lysophospholipid LysoPE(0:0/22:5(7Z,10Z,13Z,16Z,19Z)), and ceramide N-(1,3-dihydroxy-16-methyloctadec-4-en-2-yl)-2-hydroxyhexadecanamide. In the current literature, the association of these metabolites with ERF has been described. The recent study of Wang et al. discusses the effect of ethylene and ERF on changes in the lipidome composition of peaches and presents the increased levels of ceramides and phospholipids [42], which is in agreement with our study. There are also studies in which the lipid profile was directly monitored in the context of resistance to Fusarium disease [50,51], and lysophospholipids have been identified as important signaling molecules involved in plant responses to stress [52].
The above discussion represents the interpretation of several examples of correlation relationships that find support in the existing literature, but at the same time many correlation relations are not elucidated. It is evident that the multi-omics data-driven correlation of barley metabolomics and transcriptomics is very complicated, even though only a relatively small number of statistically significant variables from each omics layer entered the correlation analysis. Although some of the correlations make good sense, others cannot be confirmed on the basis of the available knowledge. The difficulty in interpreting complex biological relationships between expressed genes and metabolites is undoubtedly also related to the fact that correlated variables may not always be the end points of mutual interactions, but may be the intermediates of various biosynthetic or signaling pathways that are not yet fully described. Although this study does not provide a comprehensive explanation of all the correlated relationships, it is undoubtedly useful material for any follow-up studies dealing with the issue of plant-pathogen crosstalk, even completely independent of the PEF technology, since all the positively correlated relationships in control-related genes and metabolites actually correspond to normal PEF-unaffected barley.
3. Materials and Methods
3.1. Experimental Material
Barley of cultivar Bojos, which is most commonly used for the production of Pilsner type malt, was used as input material for the PEF experiments and follow-up malting. This Barley was harvested in 2022 and its natural contamination by four Fusarium species (F. graminearum, F. culmorum, F. sporotrichioides and F. poae) was determined by below described RT-PCR method.
3.2. PEF Treatment and Barely Malting
One kilogram of barley was pre-soaked for 10 min in 0.05M phosphate buffer. After pre-soaking, the barley was exposed to PEF under 3.8 kV/cm voltage, 200 A current, 100 bipolar pulses and 20 µs pulse width [17,24]. As a control, one kilogram of barley was pre-soaked in 0.05M phosphate buffer without PEF treatment for the same time period and subjected to malting under the same conditions. The automatic micromalting system (RAVOZ®, Czech Republic), was used for barley steeping and germination. Both control and PEF-treated barley were malted according to following conditions: steeping for 48 h at 15°C (8 h steeping; 12 h aeration break; 8 h steeping; 12 h aeration break; 4 h steeping; 4 h dripping), germination for 72 h at 15°C; humidity 95–98%. After germination, the “green malt” sample from PEF-treated and control variant were collected in amount of 20 g, immediately snap-frozen in liquid nitrogen, and then stored at -180°C until further analysis. Malting experiment was performed in three biological replicates, and from each replicate, the samples were taken in three repetitions.
3.3. Analysis of Fungal DNA
The DNA isolation and RT-PCR assay was performed as described in Prusova et al. [24]. In brief, the frozen samples were cryogenically homogenized and DNAs from 200 mg of each sample were isolated in duplicates using the Machery-Nagel (D) Plant II kit, with follow-up addition of 10U of RNAse and proteinase K (Sigma-Aldridge, USA). RT-PCR reactions were performed in 25 μL volumes consisting of 12.5 μL of TaqMan® 2x Universal PCR MasterMix (ThermoFisher Scientific, Foster City, California, USA), 300 nM of each of the forward and reverse primers (Generi Biotech, Trebes, Czech Republic), 200 nM of the probe (Generi Biotech, Trebes, Czech Republic) and 100 ng of template DNA and nuclease-free water (Sigma, Seelze, Germany). Real-time primers and probes for the quantification of Fusarium species DNA are provided in Table S1 of the Supplementary Materials (MS Word file). Quantitative RT-PCR was performed in the QuantStudioTM 6 cycler (ThermoFisher Scientific, USA). The DNA concentrations were finally recalculated to dry matter of germinated barley.
3.4. RNA Isolation for Transcriptomics
The samples were homogenized by using a cryogenic laboratory mill (IKA A11 basic, Verkon, Czech Republic). RNA was extracted from 100 mg of frozen material using the TRIzol reagent (Invitrogen, Carlsbad, CA, USA) and purified with an RNeasy column in the presence of DNase (Qiagen, Hilden, Germany). The quality of RNA was assessed using agarose gel electrophoresis and the Agilent 4200 TapeStation System. Each sample was represented by three independent replicates.
3.5. NGS Analysis and Data Treatment
To ensure the integrity and quality of the RNA samples for subsequent NGS analysis, a secondary check was performed at company providing NGS analysis (Seqme, Prague, Czech Republic). This step confirmed that the samples met the required standards. Next, sequencing libraries were prepared for each biological replicate of every sample, targeting the 3′ end of the transcripts. RNA-Seq libraries were prepared using the Lexogen QuantSeq 3′ mRNA-Seq Library Prep Kit FWD, incorporating Unique Molecular Identifiers (UMIs) for error correction and reducing amplification bias, along with dual indexing for accurate sample multiplexing. This approach targeted the 3′ ends of polyadenylated RNA, simplifying transcriptome sequencing and enabling precise gene expression profiling. Library quality control (QC) was performed using the Agilent Bioanalyzer 2100, Invitrogen Collibri Library Quantification Kit, and Qubit 1X dsDNA High-Sensitivity Assay Kit to assess size distribution, concentration, and integrity, ensuring high-quality libraries suitable for accurate sequencing with minimal technical variability. Subsequently, individual libraries were normalized to compensate for possible differences in RNA concentration and pooled for further analysis. Own NGS analysis was performed using the Illumina NovaSeq platform with the following parameters: single-end sequencing, 50 base pairs per read, and a sequencing depth of 100 million reads. During the sequencing process, raw fastq files were generated for each sample. These files underwent data preprocessing to ensure quality and remove unwanted sequences. Initial quality assessment was conducted using FastQC (v0.11.9) and multiQC (v1.12) programs. Trim Galore (v0.6.7) was then employed to eliminate low-quality reads and adapter sequences. The resulting data were again evaluated using FastQC and multiQC. After preprocessing, the reads were mapped to the respective genome reference (GCA_904849725.1) using Hisat2 (v2.2.1). To analyze differential expression, the mapped reads were utilized. The count of mapped reads was obtained using featureCounts (v2.0.3) and stored in a count matrix. Normalization of read counts and identification of significantly expressed genes were performed using DESeq2 (v1.26.0). For further analysis, zeroes in count matrixwere replaced using “R” and routines within missMDA libraryR, which does not disturb the original data structure.
3.6. Isolation of Metabolites
All frozen samples were homogenized using a cryogenic laboratory mill (IKA A11 basic, IKA Works GmbH & Co. KG, Germany). 1 g of dry matter was weighed in to the 50 mL PTFE cuvette and 10 mL of methanol was added. The cuvette with homogenized sample was then placed on a laboratory shaker (HS 260 basic, IKA Works GmbH & Co. KG, Germany) for 30 min (shaking at 240 RPM). The extract was then centrifuged (Rotina 35 R, Hettich Zentrifugen, Germany) for 2 min and 13,528 RCF (relative centrifugal force) and microfiltered through 0.2 µm spin filters (Ciro, Deerfield Beach, FL, USA). Finally, an aliquot of approx. 1 mL was transferred to a glass HPLC vial for further analyses by UHPLC-HRMS/MS. To eliminate potential system drift in the analytical system, the pooled extract (quality control sample (QC)) was prepared by mixing 100 µL of extract from each sample and analyzed. To exclude background signals from laboratory processing of samples, a “processing blank” sample was prepared together with the analyzed samples.
3.7. Metabolomics Analysis
The UHPLC-HRMS/MS analysis was performed according to the study of Stranska et al. [11] with slight modifications. Briefly, for the separation of metabolites, the UHPLC system (Dionex UltiMate 3000 RS UHPLC system; Thermo Fisher Scientific; Waltham, United States) used a reverse phase column of Acquity UPLC® BEHC18 (100mm x 2.1mm; 1.7m; Waters, United States). The injection volume was 2 µL, the autosampler temperature was 10 °C, and the column temperature was 60 °C. The mobile phase consisted of (A) 5 mM ammonium in a mixture of milli-Q water:methanol (95:5, v/v) with 0.1% formic acid (v/v) and (B) 5 mM ammonium in a mixture of isopropanol:methanol:milli-Q water (65:30:5, v/v/v) with 0.1% formic acid (v/v). Methanol, isopropanol, ammonium formate, formic acid (all of LC-MS grade) were obtained from Merck (Darmstadt, Germany). Deionized water (18 MΩ, 25°C) was prepared using a Milli-Q® system (Millipore, Bedford, MA, USA).
The SCIEX TripleTOF® 6600 quadruple time-of-flight mass spectrometer (SCIEX, Concord, Ontario, Canada) was used for the detection in negative (ESI-) and positive (ESI+) ionization mode. To record MS1 and MS/MS data, the TOF MS method (full scan) and the Information Dependent Acquisition (IDA) method were used. The working range was 100–1200 m/z for MS1 and 50–1000 m/z for MS/MS and data were acquired between 0.5–19 min. The MS/MS spectra were collected for the eight most intensive ions of the MS spectra throughout the chromatographic run. The collision energy was 35±15 V and the QC sample was analyzed every ten samples during the sequence. Instrument control and data acquisition were operated with Analyst 1.7.1 TF software (SCIEX, Concord, ON, Canada), and qualitative analysis was performed using SCIEX OS software (SCIEX, Concord, ON, Canada).
For data mining and processing, the freely available MS-DIAL–MS-CleanR – MS-FINDER software platform was used according to workflow published by Stranska et al. [53]. In the first step, the UHPLC-HRMS/MS data were processed and deconvoluted by MS-DIAL (v. 4.80, 2021, RIKEN, Japan). For peak picking, the MS1 and MS/MS tolerances were set to 0.03 and 0.1 Da in the centroid mode for both the data sets acquired in the ESI- and ESI+ mode. For peak alignment, QC reference file was used with RT tolerance of 0.05 min and mass tolerance of 0.015 Da. The minimum peak height for peak detection was set to amplitude 9000 (referring to 70% under the observed baseline for a blank injection). Zero values were replaced with 1/10 of the minimum peak height for all samples during export of aligned results from MS-DIAL. In the second step, aligned results were cleaned with MS-CleanR (MetaToul-AgromiX Platform). For data cleaning, all filters, including blank filters, a ghost peaks filter, incorrect mass, relative standard deviation, and relative mass defect were activated, with a minimum blank ratio set to 0.8, a maximum relative standard deviation (RSD) set to 30%, and a relative mass defect (RMD) ranging from 50 to 3000. The maximum RT difference and mass difference tolerance values were set to 0.025 min and 0.005 Da for Pearson correlation and ESI+/- data merging. In this step, feature clustering based on Pearson correlation and MS-DIAL peak character estimation algorithm (MS-DIAL-PCE) was implemented, and one peak (the most intense) was kept in each cluster. In the third step, the filtered features were automatically annotated with MS-FINDER (v. 3.52, 2021, RIKEN, Japan). The MS1 and MS/MS tolerances were set to 5 and 15 ppm, respectively. C, H, O, N, P, and S atoms were included for the formula finder parameter module. As a data source for automatic identification, the databases YMDB, ECMDB, PlantCyc, ChEBI, T3DB, NPA, KNApSAcK, LipidMaps, and PubChem were used. On the basis of the accurate mass and isotope ratio of MS1 ions, elemental compositions of candidate ions were proposed, and possible chemical structures of candidates were computed by comparing the experimental and in silico MS/MS spectra. Finally, MS-CleanR was launched, matched information from MS-FINDER automatic annotation with filtered features and created a final data matrix with filtered and annotated features for further statistical analysis. In this step, MS-CleanR also matched data from the ESI+ and ESI- ionization mode into one data matrix.
3.8. Variables Filtration at the Single-Omics Level
Both data matrices from both single omics level were filtered using univariate statistical tools (Volcano plot – T-test, Fold change) according to Behner et al. [15], to exclude statistically insignificant features and prevent overfitting of final models. Univariate methods were performed by using the freely available web platform MetaboAnalyst (v. 5.0, Xia Lab, McGill, Canada), with t-test false discovery rate (FDR) adjusted p-value <0.01 for metabolomics and <0.05 for transcriptomics and Fold change >2 for both single-omics. The general overview of features reduction during data filtration for all data matrices is summarized in Table S2 and S3 (MS Word file). Metabolomics data-matrix was processed with MS Excel to perform normalization of the data (total area sum normalization). In the next step, both metabolomics and transcriptomics data were separately uploaded to SIMCA software (v. 17.0, 2021, Umetrics, Sweden) where multivariate Principal Component Analysis (PCA) and Orthogonal Partial Least Square Discriminant Analysis (OPLS-DA) were performed. Before creation of every classification model, Pareto scaling and logarithmic transformation of the data were performed. The quality of the models was determined using the R2Y and Q2 validation parameters calculated by a 7-round internal cross-validation. Candidate biomarker compounds and statistically significant genes were selected based on OPLS-DA S-plots and Variable Importance of the Projection (VIP) plots together with Receiver Operating Characteristics (ROC). Both filters were applied simultaneously in an orthogonal way, to assure proper statistical filtration and to keep only the strong biomarkers/genes relevant for further data interpretation. For selection, VIP scores greater than one (VIP score >1) and ROC area under curve (AUC = 1) parameters were set.
3.9. Multi-Omics Data Integration
Multi-omics data integration was performed according to workflow developed and described by Ewald et al. [25] based on web-based freely available software OmicsAnalyst. Although each individual omics data set (metabolomics + transcriptomics) was uploaded, the ‘Metadata table’ file, which included information about samples, groups and factors, was also uploaded to the OmicsAnalyst interface. After uploading, auto scaling was applied to both datasets. For the first view of multi-omics data integration, Multiple Co-Inertia Analysis (MCIA) was performed in Dimensionality Reduction module. MCIA represents a robust method of finding related multidimensional components across multiple datasets. In the next step Data Integration Analysis for Biomarker discovery using Latent cOmponents (DIABLO) was performed. This method is a generalized and supervised version of PLS (multi block PLS-DA) that seeks to find related multidimensional components that maximally separate sample labels. In the next step, the correlation network based on the DIABLO feature selection method and the classical Spearman correlation analysis similarity matrix method was performed. For building a correlation network, only between-omics connections were considered. The corr. threshold between-omics was set to >0.8.
4. Conclusions
This data-driven multi-omics study identified a number of significant factors (metabolites and expressed genes), pattern of which was changed in response to the PEF treatment. The most important findings of this study are summarized below:
- In the PEF-treated samples, upregulation of gene encoding the vegetative gp1-like protein, previously described as barley protective factor against Fusarium disease and abiotic stress, have been found. At the same time, upregulation of metabolites from the class of flavonoids, (methylsulfanyl)prop-2-enoates, triterpenoid glycosides and indole alkaloids, previously described as important factors in the Fusarium pathogen defense, have been demonstrated. The PEF-induced upregulation of these genes/metabolites is well correlated with the apparent and statistically significant decrease in F. sporotrichioides and F. poae in germinated barley after the PEF treatment.
- On the other hand, overexpression of some Fusarium defense factors was observed also in the control samples. These include the genes encoding ethylene response factor 3-like, putrescine hydroxycinnamoyltransferase 3-like, and dirigent protein 21-like. This trend may be related to the slight increase occurrence of F. culmorum and F. graminearum in germinated barley after the PEF intervention.
- It should be noted that when working with natural material, which naturally contains the representation of several Fusarium species, a clear interpretation of transcriptomic and metabolomic data in relation to the decrease/increase of fungal pathogens is very difficult. To confirm or refute the hypotheses raised on the basis of these pilot correlations and to correctly interpret the biochemical context, follow-up studies that include the variability of the input material (e.g., different barley varieties with different resistance/susceptibility to fungal diseases or different input levels of Fusarium pathogens, ideally single species) need to be performed. Nevertheless, the current study undoubtedly demonstrates the practical application of the recently published protocol of data-driven multi-omics and has provided the first important results on which future follow-up research can be built.
Supplementary Materials
The following supporting information can be downloaded at the website of this paper posted on Preprints.org, Figure S1: The extracted ion chromatograms (XIC) (A), match of experimental vs. in silico MS/MS spectra with chemical structures of fragments colored green (B), and Box plots before statistical analysis (C) of PEF-related biomarkers.; Figure S2: The extracted ion chromatograms (XIC) (A), match of experimental vs. in silico MS/MS spectra with chemical structures of fragments colored green (B), and Box plots before statistical analysis (C) of unique control-related biomarkers.; Supplementary MS Excel file: Metabolites, genes and correlations.; Supplementary MS Word file: Table S1: Real-time primers and probes for the quantification of DNA of Fusarium species. Table S2: The general overview of the features reduction during data filtration for metabolomics data matrix. Table S3: The general overview of the features reduction during data filtration for transcriptomics data matrix.
Author Contributions
Conceptualization, M.S., J.H. and J.O.; methodology, M.S., A.B., P.S.; software, A.B. and P.S.; validation, A.B. and P.S.; formal analysis, A.B., P.S.; investigation, M.S., J.H., J.O.; resources, M.S.; data curation, M.S. and A.B.; writing—original draft preparation, M.S.; writing—review and editing, M.S. and A.B.; visualization, A.B.; supervision, M.S. and J.H.; project administration, M.S.; funding acquisition, M.S. All authors have read and agreed to the published version of the manuscript.
Funding
This research was funded by Czech Science Foundation (GACR) grant number 20-14649S and Specific university research grant number A1_FPBT_2024_006. The work used [data/tools/services/facilities] provided by the METROFOOD-CZ Research Infrastructure (https://metrofood.cz), supported by the Ministry of Education, Youth and Sports of the Czech Republic (Project number LM2023064).
Institutional Review Board Statement
Not applicable.
Informed Consent Statement
Not applicable.
Data Availability Statement
The data presented in this study are available in supplementary material.
Acknowledgments
Authors would like to thank collaborators from VITAVE company (VITAVE Tech s.r.o., U Stavoservisu 692/1b, 108 00, Prague, Czech Republic) for technical support when performing the experimental work.
Conflicts of Interest
The authors declare no conflicts of interest.
References
- Kanehisa Laboratories KEGG: Kyoto Encyclopedia of Genes and Genomes Available online: https://www.genome.jp/kegg/.
- Ramirez-Gaona, M.; Marcu, A.; Pon, A.; Guo, A.C.; Sajed, T.; Wishart, N.A.; Karu, N.; Djoumbou Feunang, Y.; Arndt, D.; Wishart, D.S. YMDB 2.0: A Significantly Expanded Version of the Yeast Metabolome Database. Nucleic Acids Res. 2017, 45, D440–D445, doi:10.1093/nar/gkw1058. [CrossRef]
- Plant Metabolic Network PlantCyc Available online: https://plantcyc.org/.
- SRI International MetaCyc Available online: https://plantcyc.org/.
- Wang, M.; Carver, J.J.; Phelan, V. V; Sanchez, L.M.; Garg, N.; Peng, Y.; Nguyen, D.D.; Watrous, J.; Kapono, C.A.; Luzzatto-Knaan, T.; et al. Sharing and Community Curation of Mass Spectrometry Data with Global Natural Products Social Molecular Networking. Nat. Biotechnol. 2016, 34, 828–837, doi:10.1038/nbt.3597. [CrossRef]
- Cytoscape Consortium Cytoscape Available online: https://cytoscape.org/.
- Patel, M.K.; Pandey, S.; Kumar, M.; Haque, M.I.; Pal, S.; Yadav, N.S. Plants Metabolome Study: Emerging Tools and Techniques. Plants 2021, 10, doi:10.3390/plants10112409. [CrossRef]
- Vinay, C.M.; Udayamanoharan, S.K.; Prabhu Basrur, N.; Paul, B.; Rai, P.S. Current Analytical Technologies and Bioinformatic Resources for Plant Metabolomics Data. Plant Biotechnol. Rep. 2021, 15, 561–572, doi:10.1007/s11816-021-00703-3. [CrossRef]
- Dixon, R.A.; Strack, D. Phytochemistry Meets Genome Analysis, and Beyond. Phytochemistry 2003, 62, 815–816, doi:10.1016/S0031-9422(02)00712-4. [CrossRef]
- Liu, Y.; Liu, H.-Z.; Chen, D.-K.; Zeng, H.-Y.; Chen, Y.-L.; Yao, N. PlantMetSuite: A User-Friendly Web-Based Tool for Metabolomics Analysis and Visualisation. Plants 2023, 12, doi:10.3390/plants12152880. [CrossRef]
- Stranska, M.; Uttl, L.; Bechynska, K.; Hurkova, K.; Behner, A.; Hajslova, J. Metabolomic Fingerprinting as a Tool for Authentication of Grapevine (Vitis Vinifera L.) Biomass Used in Food Production. Food Chem. 2021, 361, 130166, doi:10.1016/j.foodchem.2021.130166. [CrossRef]
- Lancova, K.; Hajslova, J.; Poustka, J.; Krplova, A.; Zachariasova, M.; Dostalek, P.; Sachambula, L. Transfer of Fusarium Mycotoxins and ‘Masked’ Deoxynivalenol (Deoxynivalenol-3-Glucoside) from Field Barley through Malt to Beer. Food Addit. Contam. Part A 2008, 25, 732–744, doi:10.1080/02652030701779625. [CrossRef]
- Prusova, N.; Dzuman, Z.; Jelinek, L.; Karabin, M.; Hajslova, J.; Rychlik, M.; Stranska, M. Free and Conjugated Alternaria and Fusarium Mycotoxins during Pilsner Malt Production and Double-Mash Brewing. Food Chem. 2022, 369, 130926, doi:10.1016/j.foodchem.2021.130926. [CrossRef]
- Scheibenzuber, S.; Dick, F.; Bretträger, M.; Gastl, M.; Asam, S.; Rychlik, M. Development of Analytical Methods to Study the Effect of Malting on Levels of Free and Modified Forms of Alternaria Mycotoxins in Barley. Mycotoxin Res. 2022, 38, 137–146, doi:10.1007/s12550-022-00455-1. [CrossRef]
- Behner, A.; Palicova, J.; Hirt-Tobolkova, A.; Prusova, N.; Stranska, M. Pulsed Electric Field Induces Significant Changes in the Metabolome of Fusarium Species and Decreases Their Viability and Toxigenicity. Submitt. to Toxins 2024.
- Palicova, J.; Chrpova, J.; Tobolkova, A.; Ovesna, J.; Stranska, M. Effect of Pulsed Electric Field on Viability of Fusarium Micromycetes. Cereal Res. Commun. 2024, doi:10.1007/s42976-024-00561-z. [CrossRef]
- Karabín, M.; Jelínek, L.; Průšová, N.; Ovesná, J.; Stránská, M. Pulsed Electric Field Treatment Applied to Barley before Malting Reduces Fusarium Pathogens without Compromising the Quality of the Final Malt. LWT 2024, 206, 116575, doi:https://doi.org/10.1016/j.lwt.2024.116575. [CrossRef]
- Bollina, V.; Kumaraswamy, G.K.; Kushalappa, A.C.; Choo, T.M.; Dion, Y.; Rioux, S.; Faubert, D.; Hamzehzarghani, H. Mass Spectrometry-Based Metabolomics Application to Identify Quantitative Resistance-Related Metabolites in Barley against Fusarium Head Blight. Mol. Plant Pathol. 2010, 11, 769–782, doi:https://doi.org/10.1111/j.1364-3703.2010.00643.x. [CrossRef]
- Karre, S.; Kumar, A.; Dhokane, D.; Kushalappa, A.C. Metabolo-Transcriptome Profiling of Barley Reveals Induction of Chitin Elicitor Receptor Kinase Gene (HvCERK1) Conferring Resistance against Fusarium Graminearum. Plant Mol. Biol. 2017, 93, 247–267, doi:10.1007/s11103-016-0559-3. [CrossRef]
- Chamarthi, S.K.; Kumar, K.; Gunnaiah, R.; Kushalappa, A.C.; Dion, Y.; Choo, T.M. Identification of Fusarium Head Blight Resistance Related Metabolites Specific to Doubled-Haploid Lines in Barley. Eur. J. Plant Pathol. 2014, 138, 67–78, doi:10.1007/s10658-013-0302-8. [CrossRef]
- Wu, F.; Zhou, Y.; Shen, Y.; Sun, Z.; Li, L.; Li, T. Linking Multi-Omics to Wheat Resistance Types to Fusarium Head Blight to Reveal the Underlying Mechanisms. Int. J. Mol. Sci. 2022, 23, doi:10.3390/ijms23042280. [CrossRef]
- Anzano, A.; Bonanomi, G.; Mazzoleni, S.; Lanzotti, V. Plant Metabolomics in Biotic and Abiotic Stress: A Critical Overview. Phytochem. Rev. 2022, 21, 503–524, doi:10.1007/s11101-021-09786-w. [CrossRef]
- Nawaz, M.; Sun, J.; Shabbir, S.; Khattak, W.A.; Ren, G.; Nie, X.; Bo, Y.; Javed, Q.; Du, D.; Sonne, C. A Review of Plants Strategies to Resist Biotic and Abiotic Environmental Stressors. Sci. Total Environ. 2023, 900, 165832, doi:https://doi.org/10.1016/j.scitotenv.2023.165832. [CrossRef]
- Prusova, N.; Karabin, M.; Jelinek, L.; Chrpova, J.; Ovesna, J.; Svoboda, P.; Dolezalova, T.; Behner, A.; Hajslova, J.; Stranska, M. Pulsed Electric Field Reduces Fusarium Micromycetes and Mycotoxins during Malting. Toxins, Accepted for publication. 2024.
- Ewald, J.D.; Zhou, G.; Lu, Y.; Kolic, J.; Ellis, C.; Johnson, J.D.; Macdonald, P.E.; Xia, J. Web-Based Multi-Omics Integration Using the Analyst Software Suite. Nat. Protoc. 2024, 19, 1467–1497, doi:10.1038/s41596-023-00950-4. [CrossRef]
- Castro Aviles, A.; Alan Harrison, S.; Joseph Arceneaux, K.; Brown-Guidera, G.; Esten Mason, R.; Baisakh, N. Identification of QTLs for Resistance to Fusarium Head Blight Using a Doubled Haploid Population Derived from Southeastern United States Soft Red Winter Wheat Varieties AGS 2060 and AGS 2035. Genes (Basel). 2020, 11, doi:10.3390/genes11060699. [CrossRef]
- Treutter, D. Significance of Flavonoids in Plant Resistance and Enhancement of Their Biosynthesis. Plant Biol. 2005, 7, 581–591, doi:https://doi.org/10.1055/s-2005-873009. [CrossRef]
- Zhang, D.; Fu, Y.; Yang, J.; Li, X.-N.; San, M.M.; Oo, T.N.; Wang, Y.; Yang, X. Triterpenoids and Their Glycosides from Glinus Oppositifolius with Antifungal Activities against Microsporum Gypseum and Trichophyton Rubrum. Molecules 2019, 24, doi:10.3390/molecules24122206. [CrossRef]
- Wiart, C.; Kathirvalu, G.; Raju, C.S.; Nissapatorn, V.; Rahmatullah, M.; Paul, A.K.; Rajagopal, M.; Sathiya Seelan, J.S.; Rusdi, N.A.; Lanting, S.; et al. Antibacterial and Antifungal Terpenes from the Medicinal Angiosperms of Asia and the Pacific: Haystacks and Gold Needles. Molecules 2023, 28, doi:10.3390/molecules28093873. [CrossRef]
- Ghannoum, M.; Arendrup, M.C.; Chaturvedi, V.P.; Lockhart, S.R.; McCormick, T.S.; Chaturvedi, S.; Berkow, E.L.; Juneja, D.; Tarai, B.; Azie, N.; et al. Ibrexafungerp: A Novel Oral Triterpenoid Antifungal in Development for the Treatment of Candida Auris Infections. Antibiotics 2020, 9, doi:10.3390/antibiotics9090539. [CrossRef]
- Sobiyi, O.K.; Sadgrove, N.J.; Magee, A.R.; Van Wyk, B.-E. The Ethnobotany and Major Essential Oil Compounds of Anise Root (Annesorhiza Species, Apiaceae). South African J. Bot. 2019, 126, 309–316, doi:https://doi.org/10.1016/j.sajb.2019.07.014. [CrossRef]
- Labbé, C.; Faini, F.; Villagrán, C.; Coll, J.; Rycroft, D.S. Antifungal and Insect Antifeedant 2-Phenylethanol Esters from the Liverwort Balantiopsis Cancellata from Chile. J. Agric. Food Chem. 2005, 53, 247–249, doi:10.1021/jf048935c. [CrossRef]
- Lu, P.; Magwanga, R.O.; Guo, X.; Kirungu, J.N.; Lu, H.; Cai, X.; Zhou, Z.; Wei, Y.; Wang, X.; Zhang, Z.; et al. Genome-Wide Analysis of Multidrug and Toxic Compound Extrusion (MATE) Family in Gossypium Raimondii and Gossypium Arboreum and Its Expression Analysis Under Salt, Cadmium, and Drought Stress. G3 Genes|Genomes|Genetics 2018, 8, 2483–2500, doi:10.1534/g3.118.200232. [CrossRef]
- Lim, J.; Lim, C.W.; Lee, S.C. The Pepper Late Embryogenesis Abundant Protein, CaDIL1, Positively Regulates Drought Tolerance and ABA Signaling. Front. Plant Sci. 2018, 9, doi:https://doi.org/10.3389/fpls.2018.01301. [CrossRef]
- Zhao, D.; Zhang, X.; Wang, R.; Liu, D.; Sun, J.; Tao, J. Herbaceous Peony Tryptophan Decarboxylase Confers Drought and Salt Stresses Tolerance. Environ. Exp. Bot. 2019, 162, 345–356, doi:https://doi.org/10.1016/j.envexpbot.2019.03.013. [CrossRef]
- Candat, A.; Paszkiewicz, G.; Neveu, M.; Gautier, R.; Logan, D.C.; Avelange-Macherel, M.-H.; Macherel, D. The Ubiquitous Distribution of Late Embryogenesis Abundant Proteins across Cell Compartments in Arabidopsis Offers Tailored Protection against Abiotic Stress. Plant Cell 2014, 26, 3148–3166, doi:10.1105/tpc.114.127316. [CrossRef]
- Hubbard, K.E.; Nishimura, N.; Hitomi, K.; Getzoff, E.D.; Schroeder, J.I. Early Abscisic Acid Signal Transduction Mechanisms: Newly Discovered Components and Newly Emerging Questions. Genes Dev. 2010, 24, 1695–1708, doi:10.1101/gad.1953910. [CrossRef]
- Lee, S.C.; Luan, S. ABA Signal Transduction at the Crossroad of Biotic and Abiotic Stress Responses. Plant. Cell Environ. 2012, 35, 53–60, doi:https://doi.org/10.1111/j.1365-3040.2011.02426.x. [CrossRef]
- Ng, L.M.; Melcher, K.; Teh, B.T.; Xu, H.E. Abscisic Acid Perception and Signaling: Structural Mechanisms and Applications. Acta Pharmacol. Sin. 2014, 35, 567–584, doi:10.1038/aps.2014.5. [CrossRef]
- Gomes, A.R.; Varela, C.L.; Pires, A.S.; Tavares-da-Silva, E.J.; Roleira, F.M.F. Synthetic and Natural Guanidine Derivatives as Antitumor and Antimicrobial Agents: A Review. Bioorg. Chem. 2023, 138, 106600, doi:https://doi.org/10.1016/j.bioorg.2023.106600. [CrossRef]
- Gill, S.S.; Tuteja, N. Polyamines and Abiotic Stress Tolerance in Plants. Plant Signal. Behav. 2010, 5, 26–33, doi:10.4161/psb.5.1.10291. [CrossRef]
- Wang, Y.; Deng, L.; Meng, J.; Niu, L.; Pan, L.; Lu, Z.; Cui, G.; Wang, Z.; Zeng, W. Transcriptomic and Metabolic Analyses Reveal the Mechanism of Ethylene Production in Stony Hard Peach Fruit during Cold Storage. Int. J. Mol. Sci. 2021, 22, doi:10.3390/ijms222111308. [CrossRef]
- Ahammed, G.J.; Mao, Q.; Yan, Y.; Wu, M.; Wang, Y.; Ren, J.; Guo, P.; Liu, A.; Chen, S. Role of Melatonin in Arbuscular Mycorrhizal Fungi-Induced Resistance to Fusarium Wilt in Cucumber. Phytopathology® 2020, 110, 999–1009, doi:10.1094/PHYTO-11-19-0435-R. [CrossRef]
- Berrocal-Lobo, M.; Molina, A. Ethylene Response Factor 1 Mediates Arabidopsis Resistance to the Soilborne Fungus Fusarium Oxysporum. Mol. Plant-Microbe Interact. 2004, 17, 763–770, doi:10.1094/MPMI.2004.17.7.763. [CrossRef]
- Jiang, L.; Li, R.; Yang, J.; Yao, Z.; Cao, S. Ethylene Response Factor ERF022 Is Involved in Regulating Arabidopsis Root Growth. Plant Mol. Biol. 2023, 113, 1–17, doi:10.1007/s11103-023-01373-1. [CrossRef]
- Pilate, G.; Dejardin, A.; Leple, J.-C. Chapter 1 - Field Trials with Lignin-Modified Transgenic Trees. Lignins 2012, 61, 1–36, doi:https://doi.org/10.1016/B978-0-12-416023-1.00001-X. [CrossRef]
- Shadle, G.; Chen, F.; Srinivasa Reddy, M.S.; Jackson, L.; Nakashima, J.; Dixon, R.A. Down-Regulation of Hydroxycinnamoyl CoA: Shikimate Hydroxycinnamoyl Transferase in Transgenic Alfalfa Affects Lignification, Development and Forage Quality. Phytochemistry 2007, 68, 1521–1529, doi:https://doi.org/10.1016/j.phytochem.2007.03.022. [CrossRef]
- Paniagua, C.; Bilkova, A.; Jackson, P.; Dabravolski, S.; Riber, W.; Didi, V.; Houser, J.; Gigli-Bisceglia, N.; Wimmerova, M.; Budínská, E.; et al. Dirigent Proteins in Plants: Modulating Cell Wall Metabolism during Abiotic and Biotic Stress Exposure. J. Exp. Bot. 2017, 68, 3287–3301, doi:10.1093/jxb/erx141. [CrossRef]
- Gasper, R.; Effenberger, I.; Kolesinski, P.; Terlecka, B.; Hofmann, E.; Schaller, A. Dirigent Protein Mode of Action Revealed by the Crystal Structure of AtDIR6. Plant Physiol. 2016, 172, 2165–2175, doi:10.1104/pp.16.01281. [CrossRef]
- Naguib, D.M. Comparative Lipid Profiling for Studying Resistance Mechanism against Fusarium Wilt. Physiol. Mol. Plant Pathol. 2019, 108, 101421, doi:https://doi.org/10.1016/j.pmpp.2019.101421. [CrossRef]
- Reyna, M.; Peppino Margutti, M.; Villasuso, A.L. Lipid Profiling of Barley Root in Interaction with Fusarium Macroconidia. Environ. Exp. Bot. 2019, 166, 103788, doi:https://doi.org/10.1016/j.envexpbot.2019.06.001. [CrossRef]
- Kuźniak, E.; Gajewska, E. Lipids and Lipid-Mediated Signaling in Plant–Pathogen Interactions. Int. J. Mol. Sci. 2024, 25, doi:10.3390/ijms25137255. [CrossRef]
- Stranska, M.; Lovecka, P.; Vrchotova, B.; Uttl, L.; Bechynska, K.; Behner, A.; Hajslova, J. Bacterial Endophytes from Vitis Vinifera L. – Metabolomics Characterization of Plant-Endophyte Crosstalk. Chem. Biodivers. 2021, 18, e2100516, doi:10.1002/cbdv.202100516. [CrossRef]

Table 1.
List of expressed genes selected at the single-omics transcriptomics level.
| Gene No | PEF-induced upregulation/downregulation | Gene ID | Gene interpretation |
|---|---|---|---|
| 1 | PEF-related | LOC123411962 | vegetative cell wall protein gp1-like |
| 2 | PEF-related | LOC123439637 | late embryogenesis abundant protein (LEA) EMB564-like |
| 3 | Control-related | LOC123440920 | metallothionein like protein |
| 4 | Control-related | LOC123416694 | ethylene responce factor C3-like |
| 5 | Control-related | LOC123405092 | putrescine hydroxycinnamoyltransferase 3-like |
| 6 | Control-related | LOC123451201 | dirigent protein 21-like |
| 7 | Control-related | LOC123397479 | small polypeptide DEVIL 5-like |
| 8 | Control-related | LOC123412331 | metallothionein like protein |
| 9 | Control-related | LOC123418811 | cytochrom b561 and DOMON domain containing protein |
| 10 | Control-related | LOC123402912 | putative cell wall protein |
| 11 | Control-related | LOC123410922 | codeine O-demethylase-like |
| 12 | Control-related | LOC123444328 | subtilisin-like protease SBT 5.6 |
| 13 | Control-related | LOC123397983 | pectin esterase-like |
| 14 | Control-related | LOC123408817 | skin secretory protein xP2-like |
| 15 | Control-related | LOC123450242 | xyloglucan endotransglycosilase |
| 16 | Control-related | LOC123430817 | 3-ketoacyl-CoA synthase 12-like |
| 17 | Control-related | LOC123404301 | phosphoribulokinase |
| 18 | Control-related | LOC123447723 | calmodulin calcium-dependent NAD kinase |
| 19 | Control-related | LOC123406883 | peroxidase 5-like |
| 20 | Control-related | LOC123442489 | lecithin cholesterol acyltransferase 1-like |
| 21 | Control-related | LOC123439532 | acyl transferase 7-like |
| 22 | Control-related | LOC123424453 | indole-2 monooxygenase-like |
| 23 | Control-related | LOC123397251 | protein BIG grain 1-like |
| 24 | Control-related | LOC123424731 | peroxidase 2-like |
| 25 | Control-related | LOC123447707 | photosystem II reaction center W protein |
| 26 | Control-related | LOC123424635 | senescene associated gene 20-like |
| 27 | Control-related | LOC123444729 | expansin A2 |
| 28 | Control-related | LOC123409578 | pathogenesis related protein 1-like |
| 29 | Control-related | LOC123402174 | photosystem II 5 kDa protein, chloroplastic like |
Table 2.
List of metabolites selected at the single-omics metabolomics level.
| Met. No | Trend | Met. ID | Summary formula | Systematic name | Onthology |
|---|---|---|---|---|---|
| 1 | PEF-related | neg_3828 | C32H22O10 | (1) | flavonoid derivative |
| 2 | PEF-related | neg_1070 | C12H14O3S | (2) | (methylsulfanyl)prop-2-enoate derivative |
| 3 | PEF-related | pos_7652 | C39H66O8 | (3) | triterpenoid glycoside derivative |
| 4 | PEF-related | pos_4675 | C24H27N3O4S | (4) | tetrahydroisoquinoline derivative |
| 5 | PEF-related | neg_4876 | C35H52N4O6 | (5) | methylguanidine derivative |
| 6 | PEF-related | neg_5133 | C42H54N4O5 | (6) | indole derivative |
| 7 | Control-related | neg_3480 | C27H46NO7P | (7) | phospholipide |
| 8 | Control-related | neg_4323 | C35H69NO4 | (8) | ceramide |
| 9 | Control-related | neg_4093 | C35H63N2O3P | (9) | phosphorous acid derivative |
| 10 | Control-related | neg_4049 | C32H56N6O4 | (10) | N-acylpiperidines |
| 11 | Control-related | neg_3413 | C27H46N6O4 | (11) | piperidinecarboxamide derivative |
| 12 | Control-related | neg_637 | C8H20N2O5 | (12) | aminoalcohol |
| 13 | Control-related | pos_2093 | C17H32O3 | (13) | sesquiterpenoid derivative |
| 14 | Control-related | pos_2921 | C19H28N2O4 | (14) | phenylmethylamine derivative |
| 15 | Control-related | pos_4321 | C43H68N8O10 | (15) | cyclic depsipeptide derivative |
| 16 | Control-related | pos_5569 | C34H53NO4 | (16) | prostaglandin derivative |
(1) amentoflavone 7,4′-dimethyl ether; (2) (2-methoxyphenyl)methyl 3-(methylsulfanyl)prop-2-enoate; (3) (2,3,4-trihydroxy-5-{[11-hydroxy-1-(2-hydroxy-6-methylhept-5-en-2-yl)-3a,3b,6,6,9a-pentamethyl-hexadecahydro-1H-cyclopenta[a]phenanthren-7-yl]oxy}cyclohexyl)methyl acetate; (4) 6,7-dimethoxy-N-methyl-2-[3-(1H-pyrrol-1-yl)-3-(thiophen-3-yl)propanoyl]-1,2,3,4-tetrahydroisoquinoline-3-carboxamide; (5) 4,12-dihydroxy-6-(hydroxymethyl)-16-methyl-17-[(N’-methylcarbamimidamido)methyl]-2-oxa-25-azapentacyclo [22.3.1.13,⁷.113,1⁷.0⁹,2⁰]triaconta-3(30),4,6-trien-18-yn-10-yl acetate; (6) methyl 15-ethyl-10-[15-ethyl-18-(methoxycarbonyl)-17-methyl-10,17-diazatetracyclo [12.3.1.03,11.0⁴,⁹]octadeca-3(11),4,6,8-tetraen-12-yl]-12-hydroxy-17-methyl-10,17-diazatetracyclo [12.3.1.03,11.0⁴,⁹]octadeca-3(11),4,6,8-tetraene-18-carboxylate; (7) LysoPE(0:0/22:5(7Z,10Z,13Z,16Z,19Z)); (8) N-(1,3-dihydroxynonadecan-2-yl)-2-hydroxyhexadec-3-enamide; (9) phosphorous acid (2,6-ditert-butyl-4-methyl-phenyl) bis(1,2,2,6,6-pentamethyl-3-piperidyl) ester; (10) 1-[4-[[4-[(1-hydroxy-2,2,6,6-tetramethyl-4-piperidyl)oxy]-6-(2,2,6,6-tetramethylpiperidino)-s-triazin-2-yl]oxy]-2,2,6,6-tetramethyl-piperidino]ethanone (11) N2-(1-carbamoyl-2-cyclohexylethyl)-N1-cyclohexyl-4-(piperidine-4-carbonyl)piperazine-1,2-dicarboxamide; (12) octane-2,5-amino-1,3,5,7,8-pentaol; (13) 3,7,11-trimethyldodec-2-en-1-yl ethaneperoxoate; (14) N-[(3-hydroxy-4-{[(4-methoxyphenyl)methyl]amino}oxolan-2-yl)methyl]cyclopentanecarboxamide; (15) N-[20-(butan-2-yl)-17-[(4-methoxyphenyl)methyl]-9,13-dimethyl-7-(2-methylpropyl)-5,8,11,15,18,21-hexaoxo-10-(propan-2-yl)-icosahydro-1H-pyridazino [3,2-i]1-oxa-4,7,10,13,16-pentaazacyclononadecan-14-yl]-2-formamido-3-methylbutanamide; (16) N-benzyl-N-(2,2-dimethyloxan-4-yl)-7-[2-(3-hydroxyoct-1-en-1-yl)-5-oxocyclopentyl]heptanamide;.
Disclaimer/Publisher’s Note: The statements, opinions and data contained in all publications are solely those of the individual author(s) and contributor(s) and not of MDPI and/or the editor(s). MDPI and/or the editor(s) disclaim responsibility for any injury to people or property resulting from any ideas, methods, instructions or products referred to in the content. |
© 2024 by the authors. Licensee MDPI, Basel, Switzerland. This article is an open access article distributed under the terms and conditions of the Creative Commons Attribution (CC BY) license (http://creativecommons.org/licenses/by/4.0/).
Copyright: This open access article is published under a Creative Commons CC BY 4.0 license, which permit the free download, distribution, and reuse, provided that the author and preprint are cited in any reuse.


