Submitted:
10 December 2024
Posted:
11 December 2024
You are already at the latest version
Abstract
This paper establishes a double fixed effect spatial lag model to empirically analyze the panel data of 11 provinces and cities in the Yangtze River Economic Belt from 2012 to 2021 and discusses the impact of economic growth on the health level of residents in the context of low-carbon economy. River Economic Belt from 2012 to 2021 and discusses the impact of economic growth on the health level of residents in the context of low-carbon economy. It finds that there is a significant spatial positive correlation between economic growth and the health level of residents in the Yangtze River Economic Belt. finds that there is a significant spatial positive correlation between the economic growth and the health level of residents in 11 provinces and cities in the Yangtze River Economic Belt from 2012 to 2021 and discusses the impact of economic growth on the health level of residents in the context of low-carbon economy. It finds that there is a significant spatial positive correlation between the per economic growth and the health level of residents in 11 provinces and cities in the Yangtze River Economic Belt, and there is a significant negative spillover effect on the health level of residents affected by other variables; Under the background of low-carbon economy, the economic growth of the Yangtze River Economic Belt has a significant promoting Under the background of low-carbon economy, the economic growth of the Yangtze River Economic Belt has a significant promoting effect on the health level of residents; From the perspective of control variables, the direction and degree of impact of each control variable on residents' health level vary. And based on this, feasible suggestions are proposed.
Keywords:
Low-carbon Economy
; Economic growth
; Residents' health level
; Yangtze River Economic Belt
1. Introduction
The Yangtze River Economic Belt (YREB) encompasses 11 provinces and municipalities, including Shanghai, Jiangsu, Hubei, and Sichuan, and spans China's east, west, and central regions. It accounts for 21% of the country's watershed area, is rich in natural resources and unique ecosystems, and is home to more than 40% of the population (Xi Jinping., 2018) It is a major strategic development area in China and a key watershed for promoting green transformation (Liu et al., 2023). It is a major strategic development area in China and a key watershed for promoting green transformation, and its economic development and environmental conditions have important impacts on human physiological functions and psychological states (Sun et al., 2020). The economic development and environmental conditions have important impacts on human physiological functions and psychological status. Meanwhile, in order to profoundly implement the Outline of the Development Plan for the Yangtze River Economic Belt and the requirements of the 14th Five-Year Plan, the National Development and Reform Commission (NDRC) prepared the Implementation Plan for the Development of the Yangtze River Economic Belt under the 14th Five-Year Plan in April 2021, which aims to promote the green and innovative development, regional synergistic development, and human-industry cooperation in the Yangtze River Economic Belt. It aims to promote the green and innovative development of the Yangtze River Economic Belt, the synergistic development of the region, and the coordinated development of human beings and nature.
In view of this, this paper combines the requirements of the low-carbon economy background to carry out research on the impact of economic growth on the health level of residents in the Yangtze River Economic Belt. This paper utilizes STATA 17 software to conduct spatial econometric analysis to reflect the spatial autocorrelation of the health level of residents in the Yangtze River Economic Belt, and puts forward countermeasures and suggestions that can be used for reference by studying the extent to which the state of economic growth and other influencing factors in the context of a low-carbon economy of the Yangtze River Economic Belt have an impact on the health level of residents. This is of great significance for promoting the decarbonization and greening of the Yangtze River Economic Belt and enhancing the health level of the residents in the Yangtze River Economic Belt.
2. Theoretical Foundation and Literature Review
2.1. Grossman Health Production Theory Functions
Grossman's theoretical function of health production is an innovative study of the health economy that Grossman launched in 1972 based on the results of his predecessor (Grossman, 1972) .The model has become a standard model for the study of health, and the concept of health capital was first introduced. The model has become a standard model for studying health, and for the first time introduced the concept of health capital(Liu et al., 2019) and pointed out that health capital is affected by factors such as age, gender, environment, education, income, and conditions of medical and health services(Li Hu et al., 2019). In addition, he first formulated this concept in the form of a model to study the optimal amount of health demanded when utility is maximized by introducing health as a consumer investment good into the consumer utility function(Cao et al., 2019). He also used the function to estimate the degree of influence of each factor on health capital, and concluded that increasing health capital can effectively improve individual productivity and increase their working hours(Wang, 2019). It is argued that increasing health capital can effectively improve individual productivity and increase their working hours. However, health capital is still subject to depreciation over time, so in order to maintain health capital and improve health, individuals need to invest in health through health insurance services, health care services, and other means(Bu, 2021). In order to maintain health capital and improve health, individuals need to invest in health through health insurance services, health care services, etc.
2.2. Literature Combing
2.2.1. Low Carbon Economy
It is widely recognized that the term low carbon economy first appeared in the 2003 UK energy white paper, Our Energy Future: Creating a Low Carbon Economy(Chen, 2022). It is widely recognized that the term low carbon economy first appeared in the 2003 UK Energy White Paper - Our Energy Future: Creating a Low Carbon Economy. Many scholars in China have defined the connotation of a low carbon economy, basically believing that a low carbon economy is an economic model based on low energy consumption, low emissions and low pollution(Zhang et al., 2008). For example, some scholars also believe that low carbon economy is an economic model based on low energy consumption, low emission and low pollution. For example, some scholars also believe that low carbon economy is an economic model that realizes a certain degree of carbon productivity and human development under certain carbon emission conditions, with three major characteristics of low carbon emission, high carbon productivity and phasing, and its main purpose is to control greenhouse gas emissions(Feng et al., 2016). Its main purpose is to control greenhouse gas emissions. Some scholars believe that low carbon economy is a systematic project, i.e., an economic development model that is mainly aimed at reducing carbon consumption and emission and forming an organism with green development and recycling development in order to cope with or mitigate global climate change(Lv et al., 2021). The low carbon economy is a systematic project. Similarly, some scholars put forward a similar viewpoint that green low-carbon development is essentially an all-round change involving the concept of development, production mode, lifestyle and so on(Duan, 2019). The same point is also made by scholars who believe that green low-carbon development is essentially an all-round change involving the concept of development, production mode and lifestyle. Other scholars believe that the essence of a low-carbon economy is to improve carbon productivity, i.e., for every unit of carbon dioxide emitted, it is necessary to produce more GDP, that is to say, to reduce the intensity of carbon emissions; or the efficient utilization of energy, cleaner production, and the use of energy(He, 2009); or the efficient utilization of energy, clean energy development, and the pursuit of green GDP(Wu et al., 2011). Although there are differences in the expression of the scholars' definition of the connotation of a low-carbon economy, they all agree that it can promote the realization of the goals of climate improvement and low-carbon green economic development.
2.2.2. The Impact of Economic Growth on the Health of the Population
At present, there has been a large accumulation of studies related to economic growth on the health level of the population, and many scholars believe that economic growth has a significant impact on the health level of the population, but the direction of the impact is different. Some scholars believe that economic growth has a significant positive impact on the health of the population. For example, some scholars find that economic growth has a positive impact on the health of the population in the first stage with the help of segmented modeling and the establishment of a cointegration regression model (Sun et al., 2016) For example, some scholars have found that economic growth has a positive effect on the health of the population in the first stage with the help of segmented model and the establishment of cointegration regression model (Li et al., 2018). Other scholars believe that economic growth has a positive effect on the health of the population and conclude that livelihood incentives greatly enhance this effect (Cen et al., 2022). The study concludes that livelihood incentives will greatly enhance this effect. However, some scholars draw on the theory of health production function and find that economic growth in the Yangtze River Economic Zone does not necessarily have a positive impact on the health of the population(Xu et al., 2018). Some scholars believe that there is an inverted U-shaped relationship between economic growth and population health at the national level (Li et al., 2018). Some scholars also believe that there is an inverted U-shaped relationship between economic growth and population health at the national level.
In addition, many scholars in the study of the impact of economic growth on the health level of the population found that there is regional heterogeneity in the degree of its impact. Some scholars have utilized the entropy power method and introduced the coupling theory to find that China's regional economic development has a higher degree of influence on the health level of the population, and the coupling and coordination of the two has a large difference between the regions (Chen et al., 2022). Some scholars have found that there are significant regional differences in the impact of economic growth on the health of residents in the Yangtze River Economic Zone, with the health benefits of economic growth in the upper reaches of the Yangtze River significantly higher than those in the middle and lower reaches of the Yangtze River (Xu er al., 2018). Some scholars have also found that economic agglomeration in different regions of East and West China has both positive and negative impacts on public health, showing regional heterogeneity (Zeng, 2021). Some scholars have also found that the impact of economic agglomeration on public health is both positive and negative in different regions of China, showing regional heterogeneity.
After combing through the literature, it is found that many scholars mostly use GDP or GDP per capita as an indicator of economic development level or economic growth, and few researchers have taken environmental governance factors into account in GDP per capita. Therefore, this paper uses GDP per capita in the context of low-carbon economy to reflect the economic growth of the Yangtze River Economic Belt, and uses spatial econometric modeling to explore its impact on the health level of the population.
3. Research Design
3.1. Model Construction and Variable Data Selection
Considering that there may be spatial correlation in the health level of the residents in the provinces and cities of the Yangtze River Economic Zone due to geographic proximity, convenient transportation, and economic growth, and that the traditional econometric model cannot reflect the spatial interaction effect, which may lead to the problems of incomplete and inaccurate modeling and biased estimation results, and thus adopting a spatial econometric model that can reflect the spatial and temporal effects of the panel data and the spatial autocorrelation relationship. Therefore, adopting a spatial econometric model that can reflect the spatial and temporal effects of panel data and the spatial autocorrelation can make the model setting more reasonable, better reflect the spatial and temporal evolution of the health level of the residents in the Yangtze River Economic Zone, and study the influence of various factors on the health level of the residents. The model can better reflect the characteristics of the spatial and temporal evolution of the health level of residents in the Yangtze River Economic Zone and study the influence of various factors on the health level of residents.
In this regard, this paper draws on Grossman's health production theory function, and in order to explore the impact of economic growth on residents' health level in the context of low-carbon economy, this paper takes economic growth in this context as one of the factors affecting residents' health, and refers to the theoretical results of Xu Xinglong and other scholars to construct the following preliminary model (Xu et al., 2018). The theoretical results of scholars, construct the following preliminary model:
where. denotes the health level of the population in province i in year t; denotes the economic growth of province i in year t in the context of a low-carbon economy; denotes other control variables; denotes other spatial effects; denotes the randomized disturbance term; denotes the intercept; ,, denotes parameters to be estimated, reflecting the extent to which economic growth and other control variables affect population health levels in a low-carbon context.
Then, the explanatory variable in the model is the health level of the population. The health level of the population reflects the healthiness of the physiological functions and psychological state of the inhabitants of a region or country, as well as the degree of physiological and psychological compatibility with the social environment, which is generally measured by indicators such as the average life expectancy, the population mortality rate, the maternal mortality rate, the neonatal mortality rate, and the incidence of infectious disease (Li et al ., 2022). Considering the accessibility and operability of the data, this paper refers to Xu Xinglong et al.(2018) and Xiao Quan et al(2021). This paper refers to the method adopted by scholars to express the average life expectancy ( ) (years) to represent the health level of residents in 11 provinces and cities in the Yangtze River Economic Belt, in which the missing values are obtained by interpolation.
Second, the core explanatory variable is economic growth ( ) ($/person). Economic growth reflects the growth in total output of a region or country from that achieved in the previous period, reflecting the scale of economic development and the rate of economic growth, and is usually measured by GDP and GDP per capita. In order to accurately reflect the economic growth of 11 provinces and cities in the Yangtze River Economic Belt under the background of low-carbon economy, this paper refers to Liu Xiaoyan(2021), Feng Xiaohua et al(2022), Li Jiakai et al(2021) and Liu Na et al(2015) and Liu Na et al. In order to accurately reflect the economic growth of 11 provinces and cities in the Yangtze River Economic Belt under the background of low-carbon economy, this paper refers to Liu Xiaoyan, Feng Xiaohua et al. The specific formula is as follows (see Appendix 1 for the calculation process and results):
Finally, this paper references Zhao et al (2018) and Yang Sihan et al(2020) scholars' research results, the selected control variables include demographic characteristics variables and healthcare service conditions variables. The demographic variables include the degree of aging in each province and city ( ) and education level ( ). Healthcare service condition variables include the number of health technicians ( ) (10,000 people) and the number of medical and health institutions ( ) (units). The education level is expressed in terms of the average number of years of schooling in each province and city (see Appendix 1 for the calculation formula and results); the aging level is expressed in terms of the proportion of elderly people aged 65 and above, which is the ratio of the number of people aged 65 and above in the sample survey to the total number of people in the sample survey; other data can be obtained directly from statistical yearbooks (Xu et al., 2018). Other data can be obtained directly from statistical yearbooks.
In addition, considering the nonlinear relationship, non-normal distribution, and heteroskedasticity, this paper takes the logarithm of the average life expectancy, GDP per capita, the number of health technicians, and the number of health care institutions(Xu et al., 2018).In 2012, China introduced policies on supporting small and micro enterprises, encouraging private capital such endogenous power, increasing the PM2.5 detection index, and gradually opening the work related to urban and rural medical insurance for major diseases, which is of great significance to promote economic growth and improve the health of residents. Therefore, this paper takes the panel data of the 2012-2021 China Statistical Yearbook (2013-2022) and the provincial and municipal statistical yearbooks of the Yangtze River Economic Belt as the basic data, and carries out the spatial econometric model correlation analysis using STATA 17.
Descriptive statistics for specific variables were analyzed as Table 1 As shown, it can be seen that the standard deviations of the logarithm of economic growth, the logarithm of health technicians, the logarithm of healthcare institutions and the education level of the Yangtze River Economic Belt are large, which indicates that most of the data of these four categories of variables have a large gap between them and their respective means, indicating that the 11 provinces and municipalities of the Yangtze River Economic Belt have had relatively large changes and variations of these four indicators over the 10-year period from 2012 to 2021. And the standard deviation of the logarithm of the health level of the residents of the Yangtze River Economic Belt and the degree of aging is smaller, which indicates that the gap between most of the data of these two types of variables and their respective mean values is smaller, indicating that the 11 provinces and cities in the Yangtze River Economic Belt have smaller changes and differences in these two indicators during the 10-year period of 2012-2021.
3.2. Spatial Autocorrelation Test
First of all, the spatial weight matrix is set up, which includes four types: neighbor matrix, geographic distance and inverse geographic distance matrix, economic matrix and economic geography matrix, because the geographic distance between regions is an important factor affecting the spatial distribution of the economy and factors of production.[41] Because the geographical distance between regions is an important factor affecting the spatial distribution of economic and production factors, this paper adopts the inverse geographic distance matrix, which is obtained by calculating the inverse of the square of the distance between two places, and the specific formula is as follows:
where is the geographic distance between the two regions of province i and province j. The spatial correlation between the two regions decreases with increasing distance (Yu, 2022). Then the spatial weight matrix can be defined as(Li, 2020):
Second, the spatial autocorrelation test is conducted using the spatial weight matrix, which includes the global spatial autocorrelation test and the local spatial autocorrelation test. The global spatial autocorrelation test reflects the spatial correlation between the overall economic growth and the health level of the population in the Yangtze River Economic Belt in 2012-2021 under the background of low-carbon economy; the local spatial autocorrelation test reflects the spatial correlation characteristics of the economic growth and the health level of the population under the background of low-carbon economy between a certain province in 11 provinces and cities in the Yangtze River Economic Belt and other different provincial regions(Zhao et al., 2022).
3.2.1. Global Spatial Autocorrelation Test
The global spatial autocorrelation test is calculated using the global Moran's I index test as follows (Li, 2020) :
Of these, the and denote the data of a variable, i.e., log GDP per capita or log average life expectancy, for province (city) i and province (city) j. The data of a variable, x is the mean of the variable data x; is the variance of x; denotes the spatial inverse geographic distance weight matrix; n is 11, indicating that there are 11 provinces and municipalities(Zhao et al., 2022). The Moran's I index takes values between -1 and 1. When the index is greater than 0, it indicates that an indicator shows positive correlation among regions, with high values neighboring high values and low values neighboring low values; when the index is less than 0, it indicates that an indicator shows negative correlation, with high values neighboring low values; and when the index is equal to 0, it indicates that there is no spatial correlation for a given indicator, and the spatial distribution is random(Wang et al., 2023).
By Table 2 It can be seen that the values of global Moran's index showed a weak downward trend under the inverse geographic distance matrix from 2012 to 2021, and the spatial autocorrelation was weakened, but overall the global Moran's indexes of the health level of the residents and the economic growth of 11 provinces and municipalities in the Yangtze River Economic Belt from 2012 to 2021 showed a significant positive spatial correlation, which indicated that the spatial econometric model could be used.
3.2.2. Local Spatial Autocorrelation Test
The local spatial autocorrelation test is represented by a local Moran's I scatter plot with the following equation (Li, 2020):
Moran's I scatterplot has four types of spatial linkages. The first type is high - high agglomeration type in the first quadrant, which exhibits positive spatial correlation, the second type is low - high agglomeration type in the second quadrant, which exhibits negative spatial correlation, the third type is low - low agglomeration type in the third quadrant, which exhibits positive spatial correlation, and the fourth type is high - low agglomeration type in the fourth quadrant which exhibits negative spatial correlation (Zhao et al., 2022). The fourth category is the fourth quadrant high - low agglomeration type showing spatial negative correlation.
By Figure 6 and Figure 7 it can be seen that the local Moran scatterplot of the health level of the residents in the Yangtze River Economic Zone produces a weak change during the 10-year period, and the logarithm of the average life expectancy in Anhui exhibits an obvious low-high clustering characteristic in 2021. The scatters of most provinces and cities are distributed in the first and third quadrants, which are spatially positive correlations. The first quadrant is the clustering of high resident health level provinces and cities and high resident health level provinces and cities, mostly in the lower reaches of the Yangtze River Economic Belt; the third quadrant is the clustering of low resident health level provinces and cities and low resident health level provinces and cities, mostly in the upper reaches of the Yangtze River Economic Belt. By Figure 8 and Figure 9 it can be seen that the provinces with better economic development in the context of low carbon are characterized by agglomeration, mostly in the downstream area; the provinces and cities in the middle reaches are mostly characterized by low-high agglomeration and high-low agglomeration, which is a spatial negative correlation; and the provinces and cities in the downstream area are mostly characterized by low-low agglomeration, which is a spatial positive correlation.
3.3. Model Selection
The Lagrangian LM test was first performed. If the LM spatial error is significant and the LM spatial lag is not significant, the spatial error model (SEM) is used; if the LM spatial error is not significant and the LM spatial lag is significant, the spatial lag model (SAR) is used; and if both are significant, the spatial Durbin model (SDM) is used. The results of the correlation test are shown in Table 3 shown, the LM test results show that the spatial lag coefficient is significant at the 1% level, but the spatial error coefficient is not significant, so the spatial lag model (SAR) is chosen.
Secondly, HAUSMAN test was conducted. The test results show that its P-value is significant at the 10% level and the original hypothesis is rejected, so the fixed effects model is selected. Finally, the LR test is conducted to select the optimal model by comparing the double fixed effect model and individual fixed effect model as well as the double fixed effect model and the time fixed effect model, and the test results show that both P-values are significant at the 1% confidence level, so the double fixed effect model is selected. In summary, the double fixed effects spatial lag model should be selected.
Referring to Wang Yantao et al. (2023) and Shen Hui (2021)'s research results, the specific formula for the double fixed-effects spatial lag model is:
where denotes the spatial weight matrix; denotes the neighboring province j to province i's has a significant influence on the the interaction effect of j; denotes the spatial lag coefficient of the explanatory variables; denotes individual fixed effects;
denotes time fixed effects; denotes residual terms.
4. Empirical Results and Analysis
4.1. Analysis of Baseline Regression Results
In this paper, we use STATAB 16 software to estimate the regression of the double fixed effects spatial lag model, and the results are as follows Table 4 shown.
The explanatory variables of economic growth status and the number of health technicians have significant p-values at the 1% level and positive regression coefficients, then it indicates that increasing GDP and the number of health technicians in the context of a low-carbon economy can effectively increase average life expectancy and improve the health of residents in the Yangtze River Economic Zone; The P-values of aging degree and the number of medical and health institutions are significant at the 1% level, and the regression coefficients are negative, which indicate that increasing the proportion of elderly people aged 65 and above and the number of medical and health institutions will significantly reduce the average life expectancy and inhibit the improvement of the residents' health level. The education level has a negative regression coefficient but is not significant, indicating that the education level does not have a significant inhibitory effect on the health level of residents.
4.2. Decomposition of Spatial Effects
by Table 4 It can be seen that the spatial lag coefficient of the explanatory variable of the health level of the residents of the Yangtze River Economic Belt The value of the spatial lag coefficient is -0.712, and its P-value is significant at the 1% level, which indicates that the double-fixed spatial lag model constructed in this paper has validity, and there is a significant negative spillover effect on the health level of residents in the 11 provinces and cities of the Yangtze River Economic Belt in China, i.e., the enhancement of the health level of residents in the neighboring provinces and cities inhibits the enhancement of the health level of the residents in this province and city. However, considering that the regression coefficient value of the spatial interaction term is not enough to be used directly to discuss the marginal effects of the economic growth status of neighboring provinces and cities in the Yangtze River Economic Belt and other influencing factors on the health level of residents in the province and city, and that simple regression results to analyze the spatial spillover effect between regions are also prone to misestimation. Therefore, in order to avoid weakening the influence of spatial spillover effects between regions, this paper adopts partial differential decomposition to analyze the total marginal effect into direct effect and indirect effect (Zhao, 2022). In this paper, (Zhang, 2022). the total marginal effect is analyzed by partial differential decomposition, which divides the total marginal effect into direct effect and indirect effect, and the direct effect, indirect effect and total effect are used to reflect the economic growth of 11 provinces and cities of the Yangtze River Economic Belt under the background of low-carbon economy, as well as the influence of other control variables on the health level of the residents. The direct effect reflects the impact of economic growth and other control variables on the health of the residents in these provinces and cities; the indirect effect reflects the impact of economic growth and other control variables on the health of the residents in the neighboring provinces and cities; and the total effect reflects the combined impact of economic growth and other control variables on the health of the residents in the Yangtze River Economic Belt. The specific results are as follows Table 5 The results are shown in Table 5:
By Table 5 It can be seen that the direct, indirect and total effects of economic growth, the degree of aging, the number of health technicians, and the number of medical and health institutions on the health level of the population in the Yangtze River Economic Belt are all significant, and the direct and indirect effects are heteroscedastic, which indicates that there is a masking effect, i.e., the effect of one of the four variables on the health level of the population will be affected by the other variables(Yang et al., 2022). The direct effect and indirect effect are all significant, and the direct and indirect effects are heteroscedastic. Since the direct and indirect effects are heteroscedastic, the effect of these variables on the health level of the population will be canceled out to a certain extent, but the total effect is still significant, so the masking effect is relatively weak. On the one hand, it may be due to the fact that high energy-consuming and high-emission enterprises need to invest more costs to realize the innovation of energy-consuming and emission technologies in order to comply with the relevant policy requirements, which may damage the interests of enterprises in the short term (Du, 2022). On the other hand, it may be due to the change in people's views on childbirth and marriage in recent years, which makes the implementation of the relevant policies enacted by the state to alleviate the problem of demographic imbalance unsatisfactory. The existence of the "masking effect" also suggests that the positive impact of economic growth on the health level of the population can be enhanced by rationally controlling the degree of aging, the number of health technicians and the number of medical and health institutions.
Analyzing from the perspective of direct effect of economic growth in the Yangtze River Economic Zone, its regression coefficient on the health level of the residents is 0.029, and it is significant at 1% level, indicating that when other conditions are certain, for every 1% increase in per capita GDP in this province and city, the average life expectancy of this province and city will increase by 0.029%, i.e., the economic growth in the province and city has a promotional effect on the health level of the residents of the province and city; and from the perspective of indirect effect, its regression coefficient on residents' health level is -0.013, which is significant at 5% level, i.e., when other conditions are certain, for every 1% increase of GDP per capita in the surrounding provinces and cities, the average life expectancy in this province and city will decrease by 0.013%, which means that the economic growth in the surrounding provinces and cities will inhibit the health level of the residents in this province and city, and the probable reason for this is that economic growth in the surrounding provinces and cities is accompanied by environmental pollution and spillover, which will reduce the health level of the residents in this province and city. spillover, thus reducing the health level of residents in this province and city; analyzing from the perspective of total effect, its regression coefficient on the health level of residents is 0.016, with a significant P-value at the 1% level, indicating that from an overall point of view, if other conditions remain unchanged, for every 1% increase in the per capita GDP of the Yangtze River Economic Belt, the average life expectancy of the Yangtze River Economic Belt will increase by 0.016%, i.e., the economic growth of the Yangtze River Economic Belt is able to significantly improve the health level of its residents. The results of the direct and total effects of economic growth on residents' health are consistent with the findings of Zhou Jing et al.(2018) The results of the direct and total effects of economic growth on residents' health are consistent with the findings of Zhou Jing and other scholars.
Analyzing from the perspective of direct effect and total effect of aging degree, its regression coefficients on the health level of residents are -0.128 and -0.072 respectively, and are significant at 1% level, indicating that when other conditions are certain, for every 1 unit increase in the aging degree of the province and city, the average life expectancy of the province and city will be lowered by 0.128%; and for every 1 unit increase in the aging degree of the Yangtze River Economic Belt as a whole, the average life expectancy will be lowered by 0.072%. Average life expectancy in the Yangtze River Economic Zone will decrease by 0.072% for every 1 unit of increase in the aging degree in the province and city, i.e., the increase in the aging degree in the province and city has an inhibitory effect on the health level of the residents in the province and city, as well as the overall aging degree of the Yangtze River Economic Zone has an inhibitory effect on the health level of the residents. Analyzed from the perspective of indirect effect, its regression coefficient is significantly positive at the 1% level, with a specific value of 0.056, indicating that when other conditions remain unchanged, an increase of 1 unit in the aging degree of the surrounding provinces and cities will increase the average life expectancy of the province and cities by 0.056%, which means that the aging degree of the surrounding provinces and cities has a significant role in promoting the health level of residents in the province and cities. In reality, older residents may not be able to obtain health knowledge and information in a timely and effective manner, and have a lower level of health literacy (Tang et al., 2021) and thus the aggravation of the aging problem will have a negative impact on the health level of residents in a province or city in the Yangtze River Economic Belt or in the whole.
Analyzing from the perspective of direct effect of the number of health technicians, the regression coefficient of the number of health technicians on the health level of the residents is 0.032, and it is significant at 1% level, indicating that when other conditions are certain, for every 1% increase in the number of health technicians in the province, the average life expectancy of the province and city increases by 0.032%, that is to say, the increase in the number of health technicians of the province has a promotional effect on the health level of the residents of the province and city. effect perspective, its regression coefficient is significantly negative at the 1% level, indicating that the increase in the number of health technicians in the surrounding provinces and cities has a significant inhibitory effect on the health level of residents in this province and city. Analyzed from the perspective of total effect, the regression coefficient is 0.018, which is significant at 1% level, indicating that the increase of the number of health technicians in the Yangtze River Economic Zone as a whole has a significant promotion effect on the health level of its residents. This result that the number of health technicians has a positive effect on the health level of residents is consistent with the findings of Gong Shengsheng et al.(2020) This result is consistent with the findings of Gong Shengsheng et al.
Analyzing the direct and total effects of the number of medical and health institutions, the regression coefficients of the number of medical and health institutions on the health level of the residents are significantly negative at the 5% and 10% levels, indicating that the number of medical and health institutions in the province and city has a significant inhibitory effect on the health level of the residents of the province and city, as well as the number of medical and health institutions in the Yangtze River Economic Belt has a significant inhibitory effect on the health level of the residents of the Yangtze River Economic Belt as a whole. The reason for the inhibitory effect may be that there still exists the phenomenon of "emphasizing medical treatment over prevention" in the field of public health services, and although the number of medical and health institutions is increasing, the resource allocation of the prevention and control department is obviously insufficient, and the capacity of emergency prevention of diseases is weak, which can't effectively meet the high demand of residents for health (Xie, et al., 2023). The phenomenon of "prevention and control" has been observed in the medical and health care sector. Analyzing from the perspective of indirect effect, the regression coefficient on the health level of the residents is 0.006, which is significantly positive at 10% level, that is, if other conditions remain unchanged, for every 1% increase in the number of medical and health institutions in the surrounding provinces and cities, the average life expectancy of the province and cities will increase by 0.007%, which indicates that the increase in the number of medical and health institutions in the surrounding provinces and cities can effectively supplement the medical resources to alleviate the dilemma of insufficient medical resources in the province and cities, thus helping to reduce the shortage of medical resources in the province and cities, and thus helping to improve the health of the residents. This shows that the increase in the number of medical and health institutions in the surrounding provinces and cities can effectively supplement medical resources, alleviate the shortage of medical resources in the province and cities, and thus help the residents of the province and cities to have a place to see a doctor, and promote the improvement of the health level of residents.
Analyzing from the perspective of the total direct effect of educational level, its regression coefficient is negative, the possible reason is that the influence of educational level on the health level of the residents is affected by the joint action of many factors, although the improvement of educational level is conducive to improving the attitude of the residents towards medical services, but it will also increase the possibility of smoking and alcohol abuse (Guo et al., 2019). When the negative effect is greater than the positive effect, the education level will inhibit the health level of the residents to a certain extent. However, according to the results, the regression coefficients of the education level on the health level of the residents do not pass the significance test, which indicates that the education level of this province and the surrounding provinces and cities do not have a great influence on the health level of the residents in this province and cities; the education level of the 11 provinces and cities in the Yangtze River Economic Belt does not have a great influence on the health level of the residents in the Yangtze River Economic Belt, either. The average years of education in the 11 provinces and cities in the Yangtze River Economic Belt are all at the junior and senior high school level during the 10-year period from 2012 to 2021, and the results are consistent with the findings of Guo Swei et al.(2019).The reason for this is that the education level is affected by factors such as the environment in which the residents grow up and their physical conditions, and it is likely that it is these factors that determine the health level of the residents, while there is no direct causal relationship between the education level and the health level of the residents.
5. Conclusions and Recommendations
5.1. Conclusion
Based on Grossman's health production theory function, this paper considers that the factors affecting the health level of residents mainly include economic growth status, demographic characteristics, and medical and health service conditions, of which the economic growth status is expressed as per capita GDP in the context of low-carbon economy, so as to establish a spatial panel model. By determining the spatial weight matrix, spatial autocorrelation test, LM test, HAUSMAN test, and LR test on the basic panel data of 11 provinces and cities in the Yangtze River Economic Belt from 2012 to 2021, a double fixed-effects spatial lag model was finally established for empirical analysis, and the conclusions are as follows:
(1) There is a significant positive spatial correlation between economic growth and residents' health level in all 11 provinces and cities in the Yangtze River Economic Belt, which shows the characteristics of high - high agglomeration and low - low agglomeration, while there is a significant negative spillover effect of residents' health level in 11 provinces and cities in the Yangtze River Economic Belt due to the combined influence of other variables. In this paper, by using Moran's I index, the global autocorrelation test on the panel data of the 11 provinces and cities in the Yangtze River Economic Belt, it is measured that the residents' health level of the 11 provinces and cities in the Yangtze River Economic Belt and the economic growth status in the context of low carbon both show significant spatial positive correlation from 2012 to 2021. Meanwhile, the local autocorrelation test is carried out by using Moran's I index scatterplot, in which most cities in the lower reaches of the Yangtze River are in the first quadrant, and most cities in the upper reaches of the Yangtze River are in the third quadrant, which show the characteristics of high-high agglomeration and low-low agglomeration, respectively. In addition, with the help of double fixed-effects spatial lag model, this paper analyzes that there is a significant negative spillover effect in the health level of residents in 11 provinces and cities in the Yangtze River Economic Belt in China, i.e., the health level of residents in the surrounding provinces and cities has an inhibitory effect on the health level of residents in this province and city.
(2) Under the background of low-carbon economy, the economic growth of a province or city in the Yangtze River Economic Zone has a significant effect on the health level of the residents of that province or city, and despite the masking effect, its overall economic growth still has a significant effect on the health level of its overall residents, which indicates that economic growth can effectively improve the health level of the residents.
(3) In terms of control variables, the number of health technicians, the degree of aging and the number of medical and health institutions in the Yangtze River Economic Belt have a significant impact on the health level of the population in terms of both direct and total effects, and the direction of the impact of both is the same. Among them, the number of health technicians has a significant promotion effect on the health level of residents, while the aging degree and the number of medical and health institutions have a significant inhibition effect on the health level of residents. However, due to the existence of the masking effect, the indirect effect and the direction of the influence of the two is different, the health level of residents of a province or city in the Yangtze River Economic Belt is positively affected by the degree of aging and the number of medical and health care institutions in the surrounding provinces and cities; at the same time, it is also affected by the economic growth in the context of the surrounding provinces and cities in the context of the low carbon and negatively affected by the number of health care technicians. The level of education has no significant effect on the health of the population.
5.2. Recommendations
5.2.1. Grasp the Opportunities of a Low-Carbon Economy and Pursue the Social Well-Being of the People
Under the low-carbon background, the economic growth of the provinces and cities in the Yangtze River Economic Belt has a significant effect on the health level of the residents in the respective provinces and cities, but the economic growth is still affected by resource consumption, environmental pollution and natural disasters, etc. Therefore, improving the efficiency of resource utilization, reducing the pollutant emissions, and improving the construction of early warning system for natural disasters and the construction of the emergency response system can effectively improve the economic growth of the provinces and cities under the low-carbon background. economic growth in the context of low carbon in all provinces and cities.
On the one hand, provinces and cities should firmly grasp the opportunities of the low-carbon economy and continuously increase the volume of their respective economies. In this regard, provinces and municipalities should insist on exploring their own characteristics in the context of a low-carbon economy, adapting to local conditions, strengthening economic restructuring, promoting the transformation and upgrading of the economic structure, and giving full play to the driving force of the advantaged industries in the provinces and municipalities.
On the other hand, provinces and municipalities should continue to improve the living standards of their residents, so as to achieve both an increase in economic output and high economic growth. Provinces and cities can promote resource conservation and environmental protection through technological innovation, effectively implement environmental regulation measures, improve production efficiency, increase per capita GDP and raise per capita incomes, and continuously promote the health of residents in all provinces and cities under the premise of a low-carbon economy. For provinces and cities prone to natural disasters, the Government should set up specialized early-warning and emergency response departments, continuously improve policies on natural disaster prevention, increase investment, and implement relevant countermeasures, such as the construction of earthquake-resistant houses and the laying of landslide nets.
5.2.2. Strengthening the Role of Provincial and Municipal Radiation and Promoting Coordinated Regional Development
Most of the 11 provinces and cities in the lower reaches of the Yangtze River Economic Belt show a high level of economic growth and the health level of the residents with the characteristics of high level and high level of provincial and municipal agglomeration, while most of the upper reaches of the Yangtze River Economic Belt show the characteristics of low level and low level of provincial and municipal agglomeration, and only a small number of cities show the characteristics of high level and low level of provincial and municipal agglomeration.
First, in response to the above results, provinces and cities should fully grasp their own characteristics and positioning. High-level provinces and municipalities can adhere to the principle of joint consultation, joint construction, joint sharing and win-win situation, and fully utilize their own economic, medical, scientific and technological advantages to complement those of low-level provinces and municipalities in various aspects. Under the premise of grasping the requirements of low-carbon economy, provinces and cities can promote the rational use of resources, the efficient flow of talents and the openness and transparency of information, and rely on the development of high-quality regional economy to play the role of radiation driving to other provinces and cities. At the same time, provinces and cities should strengthen talent training and continuously improve the service system of medical and health institutions.
Secondly, provinces and cities can also expand the scope of their radiation through the construction of important transportation hubs and the creation of improved logistics centers, further promoting the coordinated and balanced development of the upstream, midstream and downstream regions of the Yangtze River Economic Belt. By doing so, the provinces and cities will enhance the overall economic level and health of the residents of the Yangtze River Economic Belt by continuously reconciling the contradiction between the people's growing needs for a better life and the unbalanced and inadequate development.
5.2.3. Increase Government Health Spending and Rationalize Industrial Agglomeration
The previous data analysis part of the study concluded that there is a significant negative spillover effect on the health level of residents in 11 provinces and cities in China's Yangtze River Economic Belt, and the possible reason for this is that there is a talent aggregation effect between the more economically developed provinces and cities in the Yangtze River Economic Belt and the economically underdeveloped provinces and cities, i.e., the economically developed regions continue to attract excellent medical talents and healthcare and other healthcare industry agglomeration, which makes the healthcare human capital decline in some regions and the patients patients go out for medical treatment, and the local medical and health resources are not fully utilized, thus generating a significant negative spatial spillover effect(Liang et al., 2022). The negative spatial spillover effect is thus significant.
In this regard, the relevant government departments in the provinces and cities of the Yangtze River Economic Zone can increase government expenditure on health, especially on medical personnel welfare and medical insurance, effectively pro\mote the introduction of talents, and solve the patients' worries about medical treatment, so that they can have a doctor to see the patients and be able to afford to see the patients. At the same time, the publicity department should organize and carry out more publicity and education on health; the health department should actively supervise and improve the preventive service part of the public health service, and step up the implementation of the optimization and rectification of the preventive department of the medical and health institutions, and play the role of "medical and preventive integration" synergistic effect, so that the residents have more health common sense, more health consciousness, more health! Healthy bodies.
In addition, health and wellness industry clustering can promote the health of the population (Hu et al., 2019). Relevant departments can reasonably guide the health industry cluster to attract high-quality investment within and outside the province. Relevant departments can reasonably guide the health industry agglomeration, attract high-quality domestic and foreign investment, and at the same time actively strengthen cooperation with surrounding provinces and cities in the health industry, optimize the allocation of resources, stimulate the positive spillover effect of the health level of residents in surrounding provinces and cities on the health level of residents in their own provinces and cities, so as to improve the overall health level of residents in the Yangtze River Economic Zone.
5.2.4. Actively Responding to the National Call to Promote Long-Term Population Development
From the conclusions of the previous study, it can be seen that the aging level of a province or city in the Yangtze River Economic Belt has become an inhibiting factor for the health level of the residents in that province or city, and the deepening of the aging level adds an obstacle to the improvement of the health level of the residents in that province or city, and at the same time, taking into account the reality that there will be a negative growth of the fertility-led population in China by the year 2022(Song et al., 2023). Therefore, reducing the degree of aging, increasing the fertility rate, and promoting the long-term development of the population are important measures to improve the health of the residents in the Yangtze River Economic Zone.
First of all, the formulation and implementation of fertility policies should be more closely aligned with the actual living conditions of contemporary people and with their concepts of childbearing. Relevant government departments should continue to optimize fertility policies, advocate eugenics, and at the same time raise the level of childcare benefits. For example, they should protect the rights and interests of child-rearing mothers and establish a sound system of universal childcare services, so as to reduce the chances of childbirth and child-rearing (Yang, 2023). The government should also reduce the opportunity cost of childbearing and child rearing. Second, the relevant departments can provide subsidies for families with multiple children within the scope of the policy. For example, they can provide stepwise birth subsidies for tax and education to encourage births. Finally, in terms of public infrastructure construction, the needs of mother and child groups should be given full consideration. Provinces and municipalities can consider improving mother-and-baby facilities in public places in terms of appearance, practicality and serviceability, so as to facilitate childcare and reduce the burden of childcare.
Funding
General Project of Philosophy and Social Science in Colleges and Universities of Jiangsu Provincial Department of Education “Research on Factors Influencing the Health Literacy Level of Chinese Residents Based on Feasible Ability” (2021SJA0314); General Project of Humanities and Social Science Research of the Ministry of Education “Research on Paths and Measures to Realize a Highly Efficient Chinese Medicine Research on the Realization Path and Countermeasures of Building an Efficient Chinese Medicine Service System in China in the New Period” (23YJA630106).
References
- Xi Jinping. 2018. Speech at symposium on in-depth promotion of Yangtze River economic belt development [N]. People's Daily, 2018-06-14(002).
- Liu Qinglin, Guo Tianzi. 2023. Study on the Environmental Impacts of FDI on Host Countries under the Background of "Double Carbon": An Empirical Analysis Based on the Yangtze River Economic Belt in China[J]. Dongyue Lecture Series,44(01):33-43+191.
- Sun Zhijun,Li Meng. 2020. Research on the development strategy of the Yangtze River Economic Belt of the Communist Party of China in the new era[J]. Chongqing Social Science,(12):28-44+2.
- Grossman M. 1972. On the concept of health capital and the demand for health[J].The Journal of Political Economy,80(2):223-255.
- Liu, K. H., Tong, J. D. 2019. Does China's Export Expansion Affect Health? --An Expansion Analysis Based on the Grossman Model[J]. Systems Engineering Theory and Practice,39(10):2451-2465. [CrossRef]
- Li Hu, Han Shuo, Yu Shuhe. 2019. Research on the influencing factors of outpatient medical costs in Jilin province under the background of population aging[J]. Medicine and Society,32(11):23-26.
- Cao Yuxia. 2019. Role mechanism, impact measurement and countermeasures of air pollution on employee health in enterprises[D]. Jiangsu:Nanjing University of Information Engineering.
- Wang Peiru. 2019. Analysis of the impact of education on health and its mechanism of action[D]. Fujian:Xiamen University.
- Bu Youlu. 2021. Research on the Health Impact of Social Health Insurance on Flexible Employment Groups [D]. Hubei:Huazhong University of Science and Technology.
- Chen, Shiyi. 2022. Low Carbon Economy[J]. Economic Research,57(06):12-18.
- Zhang Kunmin,Pan Jiahua,Cui Dapeng. 2008. Theory of Low Carbon Economy [M]. Beijing:China Environmental Science Press 2008:70-85.
- Feng Jinhui,Sun Hui. 2016. he construction of China's low carbon economy assessment system[J]. People's Forum,No.524(20):55-57.
- Lv Jichen,Hu Angang.2021. China's construction of a modernized economic system with green, low-carbon and recycling development: realization path and practical significance[J]. Journal of Beijing Institute of Technology (Social Science Edition),21(06):35-43. [CrossRef]
- Duan Juan.2019. Practical exploration of China's green low-carbon development path and its revelation[J]. Ningxia Social Science,No.218(06):27-34.
- He Jiankun. 2009. The key to the development of low-carbon economy lies in low-carbon technological innovation[J]. Green Leaf,(1):40-50.
- Wu Kai,Wu Yan.2011. Research on the status of low carbon economy and sustainable development in Chongqing--Based on the comprehensive green GDP accounting system[J]. Resource Development and Market,27(03):244-248.
- Sun Shujun,Fu Shuyong,Wu Zhiang. 2016. A study on the relationship between economic development, primary health investment and population health in China[J]. China Health Economics,35(01):73-76.
- Li Shenghui,Zong Jie. 2018. Economic development, social security fiscal expenditure and residents' health--and a test of adverse selection behavior[J]. Macroeconomic Research,No.240(11):26-43.
- Cen Shutian,Ge Yang,Yan Weihai. 2023. Study on livelihood incentives for sustained health improvement of Chinese residents[J]. Lanzhou Journal,No.353(02):59-77.
- Xu Xinglong,Zhou Lulin,Zhang Linrong. 2018. Empirical analysis of regional economic growth, environmental pollution and residents' health[J]. Statistics and Decision Making,,34(22):95-98.
- Chen Miaomiao,Han Xinxin,Madi,et al. 2022. Research on the coupling coordination between the health level of Chinese residents and regional economy[J]. Modern Preventive Medicine,49(15):2784-2788+2794.
- Zeng, Wei-Ping. 2021. Economic agglomeration, resource mismatch and public health[D]. Hunan: Hunan University, .
- Li S, Yu D-S. 2022. Does urbanization exacerbate interregional transmission of infectious diseases?--Analysis based on spatial spillover perspective[J]. Economic Science,2022,No.251(05):107-119.
- Xiao Quan,Fang Shijiao. 2021. Empirical analysis of the impact of income disparity and environmental pollution on residents' health[J]. Statistics and Decision Making,2021,37(07):67-71.
- Liu Xiaoyan. 2021. Research on the relationship between land use structure and green GDP in Dehongzhou [D]. Yunnan:Yunnan University.
- Feng Xiaohua,Qiu Siyuan. 2022. A study on the measurement and convergence of the level of high-quality economic development of cities in the Yangtze River Delta[J]. East China Economic Management,2022,36(11):28-43.
- LI Jiakai,Liu Jiahuan. 2021. Research on high-quality green development of Guizhou under the perspective of resource and environmental constraints[J]. Business and Economic Research,2021,No.834(23):157-161.
- Liu Na,Chen Chunsheng. 2015. Research on the contribution of environmental protection investment to economic development based on green GDP[J]. Journal of Dalian University of Technology (Social Science Edition),2015,36(01):26-31.
- Zhao Jianguo,Chen Liang. 2018. Research on the impact of regional income disparity on residents' health[J]. Research on Financial Issues,2018,(11):122-128.
- Yang Sihan,Tong Menghua,Zhang Xiaoyan. 2020. Environmental Pollution, Public Health Demand and Economic Development-Analysis Based on Moderating and Threshold Effects[J]. Zhejiang Social Science,2020,No.292(12):4-15+156.
- YU Xiao Xiao. 2022. Research on the Impact of Economic Agglomeration on Haze Pollution [D]. Jiangsu:Nanjing University of Posts and Telecommunications.
- Li Xiaoyun. 2020. Empirical analysis of the sustainable development of the Yangtze River Economic Belt under spatial econometric modeling[D]. Guangxi:Guangxi Normal University.
- Zhao W,Peng Yuting. 2022. Does the development of digital economy affect income inequality? --An empirical test based on spatial panel model[J]. Exploration of Economic Issues,No.485(12):35-51.
- Wang Yantao,Zhang Yaya,Zhang Xiao. 2023. Research on the impact of green credit on the efficiency of green development--a spatial econometric analysis based on the super-efficient SBM model[J]. Journal of Dalian University of Technology (Social Science Edition),44(02):37-44.
- Shen Hui. 2021. Empirical analysis of the impact of inclusive financial development on farmers' income in Shaanxi Province [D]. Shaanxi:Northwest Agriculture and Forestry University.
- Zhao Shu. 2022. Research on the Impact of Fintech on Regional Financial Risk [D]. Shandong:Jinan University.
- Zhang Dao-Ting. 2022. Research on spatial spillover effect of regional tourism economy based on spatial econometric model[D]. Guangxi:Guangxi Normal University.
- Yang Sihan,Tong Menghua. 2022. Human capital, technological progress and steady economic growth-theoretical mechanism and empirical evidence[J]. Zhejiang Social Science,No.305(01):24-38+157.
- Du Xiaoyan. 2022. Research on the Impact of Climate Change on Low-Carbon Economy--Based on the Mediating Effect of Green Finance[J]. Journal of Wuxi College of Commerce and Technology,2022,22(06):19-27.
- Zhou Jing,Hu Qiuhong,Duan Dingqiang. 2018. An empirical test of the role of transfer payments and economic growth on residents' health[J]. Statistics and Decision Making,2018,34(01):96-99.
- Tang Jiayang,Ren Yu,Yang Xiaohong,et al. 2021. Analysis of health literacy level and influencing factors of residents in a district of Chengdu City[J]. Modern Preventive Medicine,48(01):123-127.
- Gong Shengsheng,Chen Yun. 2020. Spatio-temporal relationship between health resources and population health in southern China[J]. Geography Research,39(01):115-128.
- Xie Danxia, Zhao Weiyi, Liu Peilin, et al. 2023. Economic Analysis of Public Health System Reform-Mechanism and Policy Design for Optimal Allocation of Prevention and Treatment Resources[J/OL]. Economic Journal:1-32. [CrossRef]
- Guo S.W., Zhang M.A., Cao J..2019. Can education really affect health? --Evidence from the implementation of China's 1986 compulsory education law[J]. Journal of Economics,6(03):148-187.
- Liang Wenming,Chen Tong,Ye Azhong. 2022. Analysis of the spatial effect of health expenditure on residents' health level in the context of healthy China[J]. China Health Economics,41(02):1-5.
- Hu Xuhua, Chen Mo, He Dan. 2019. Spatial agglomeration of health and wellness industry and the improvement of residents' health level:based on the perspective of agglomeration threshold and spatial spillover[J]. China Health Economics,38(07):71-75.
- Song Jian,Alimire Alimu. 2023. Evaluation of fertility support policies:European practices and Chinese reflections[J/OL]. Northwest Population:1-11. http://kns.cnki.net/kcms/detail/62.1019.c.20230426.1923.004.html.
- Yang Liping. 2023. Universal childcare at home eases parents' worries about bringing up children[N]. Zhengzhou Daily, 2023-04-25(006).
Figure 6.
Localized Moran scatter plot of the logarithm of the health level of the population in the Yangtze River Economic Zone, 2012.
Figure 6.
Localized Moran scatter plot of the logarithm of the health level of the population in the Yangtze River Economic Zone, 2012.
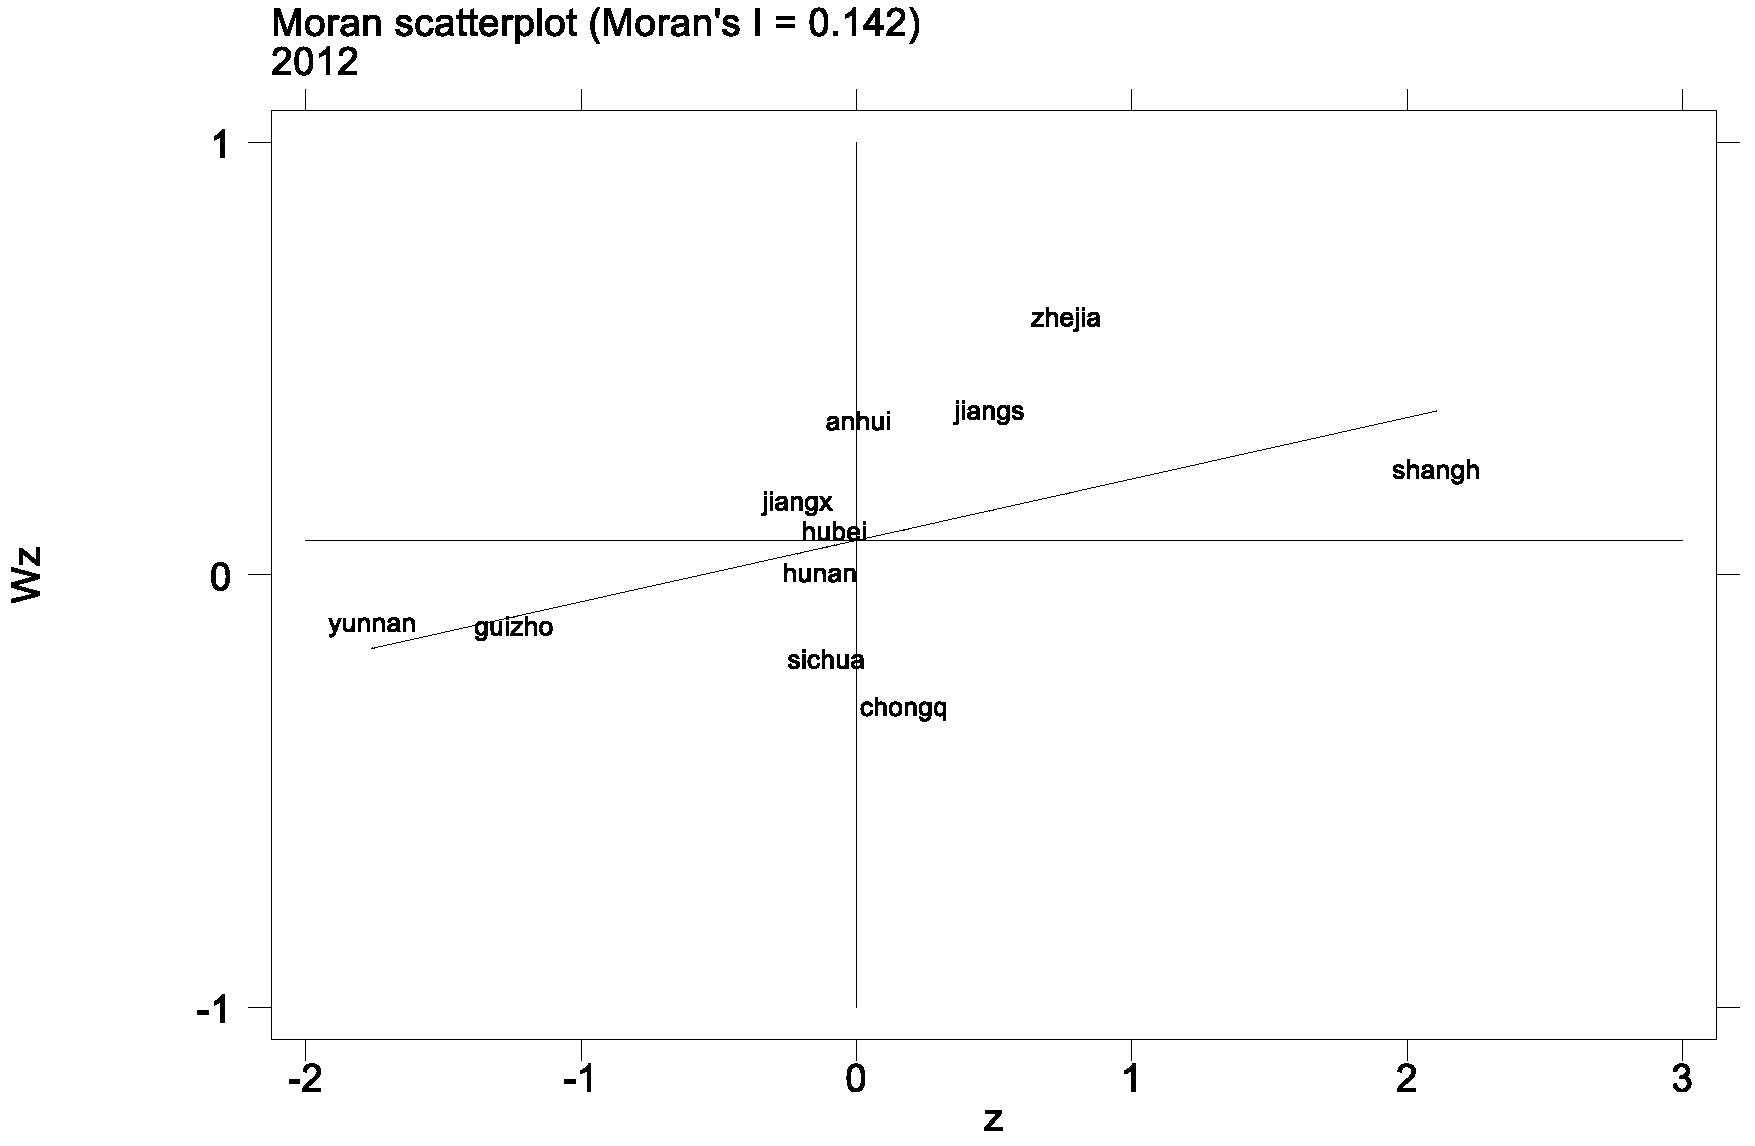
Figure 7.
Localized Moran scatterplot of the health level of the population in the Yangtze River Economic Zone in 2021.
Figure 7.
Localized Moran scatterplot of the health level of the population in the Yangtze River Economic Zone in 2021.
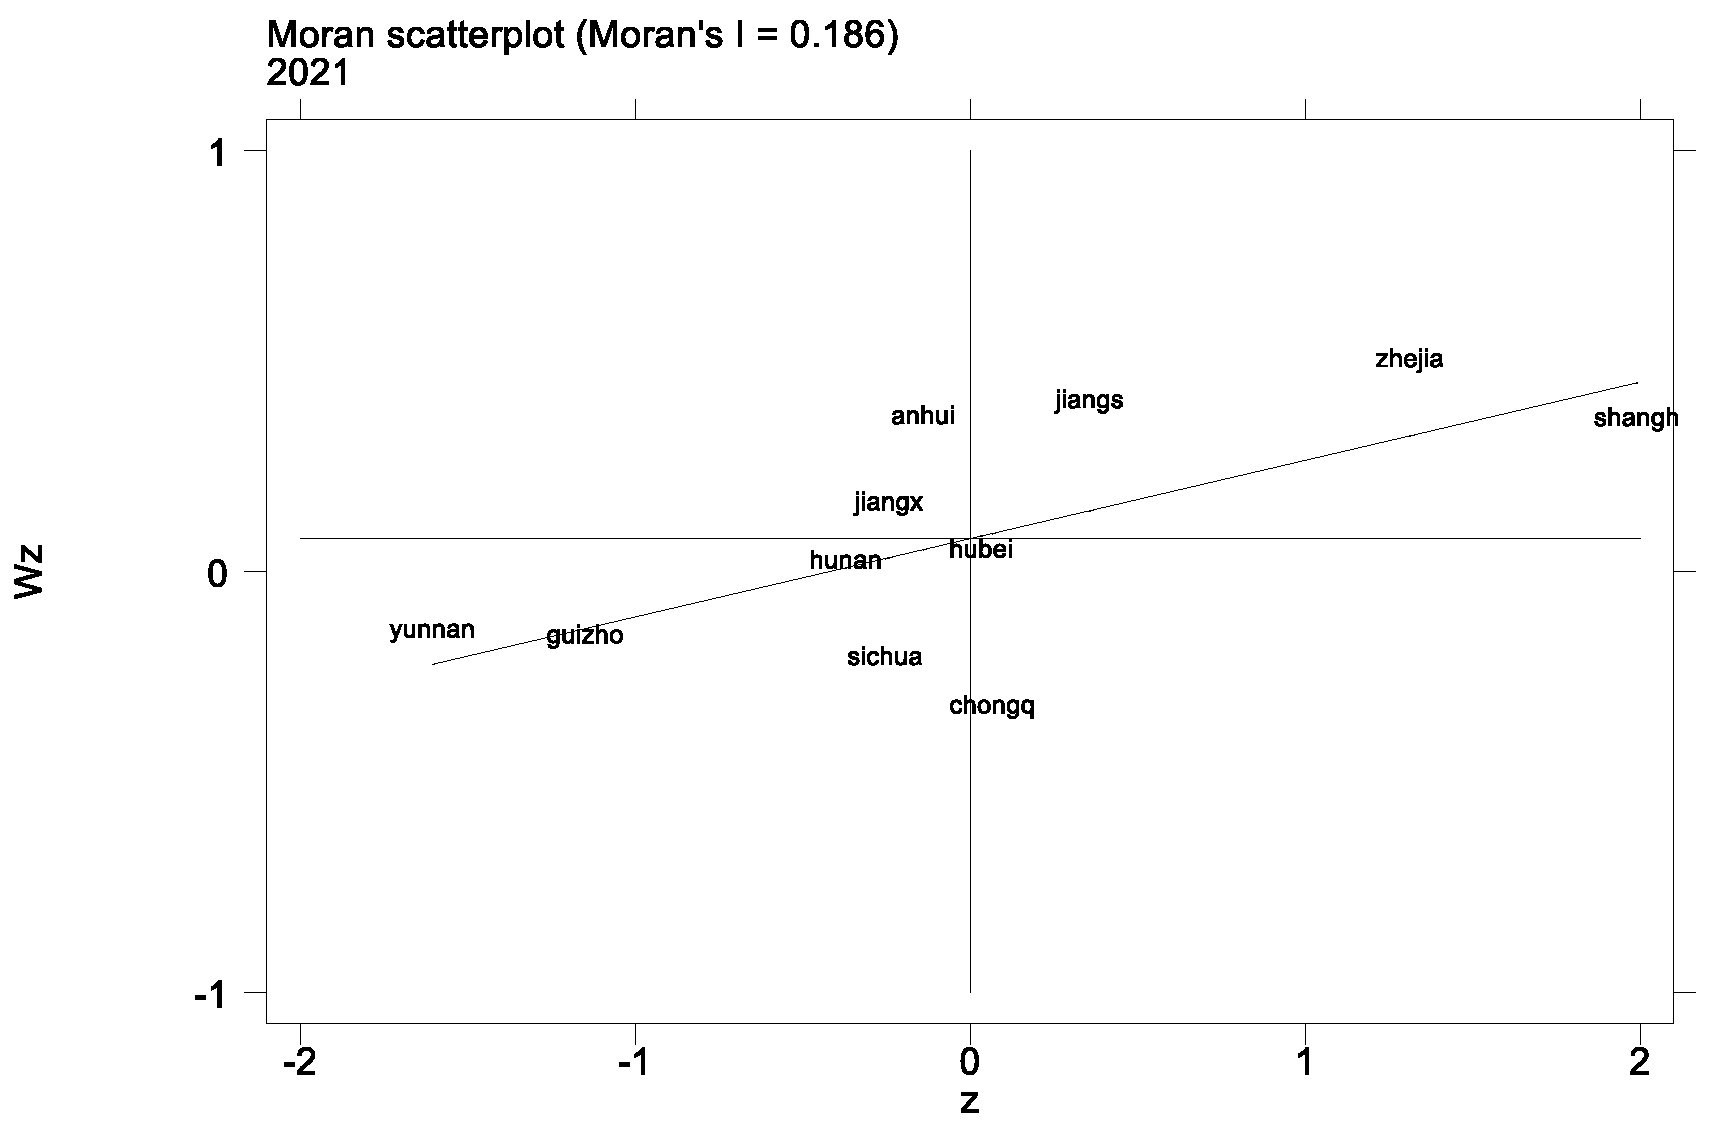
Figure 8.
Localized Moran scatterplot of economic growth in the context of the low-carbon economy in the Yangtze River Economic Zone, 2012.
Figure 8.
Localized Moran scatterplot of economic growth in the context of the low-carbon economy in the Yangtze River Economic Zone, 2012.
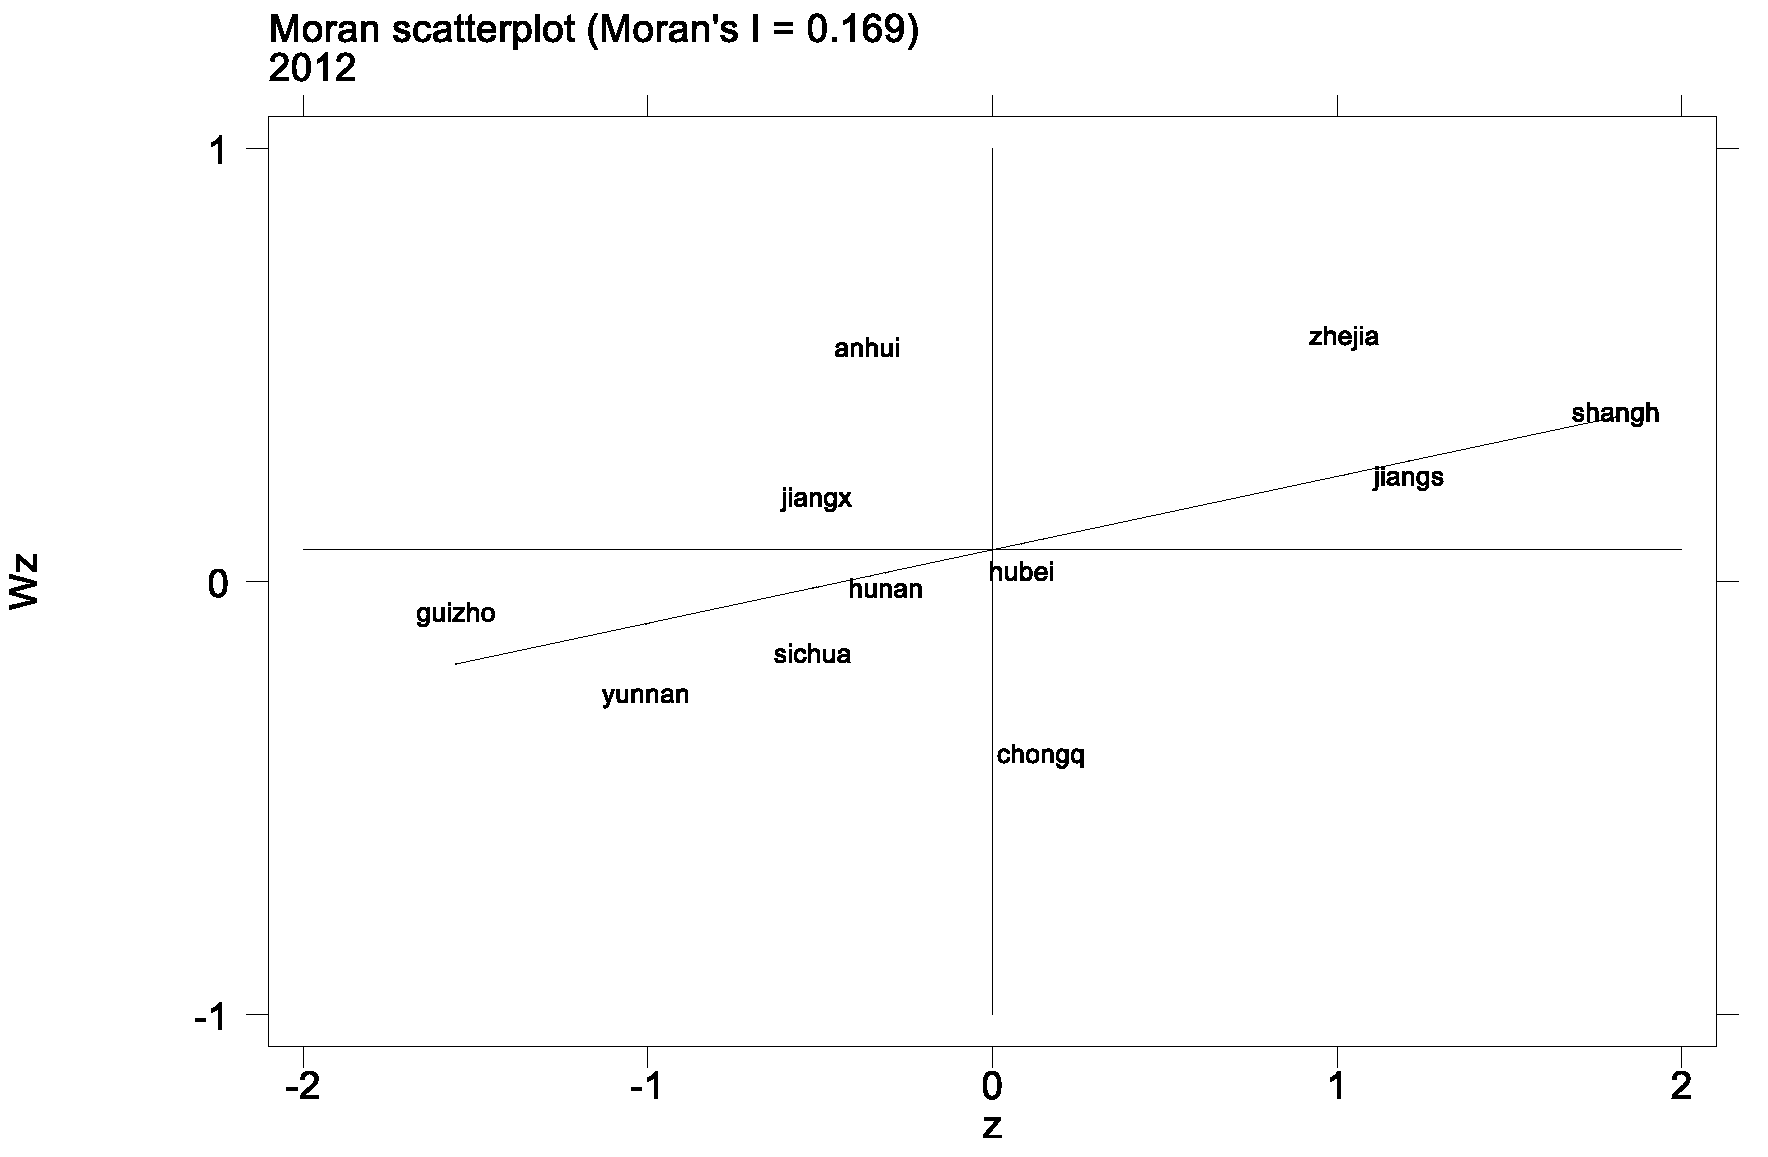
Figure 9.
Localized Moran scatterplot of economic growth in the context of a low-carbon economy in the Yangtze River Economic Belt, 2021.
Figure 9.
Localized Moran scatterplot of economic growth in the context of a low-carbon economy in the Yangtze River Economic Belt, 2021.
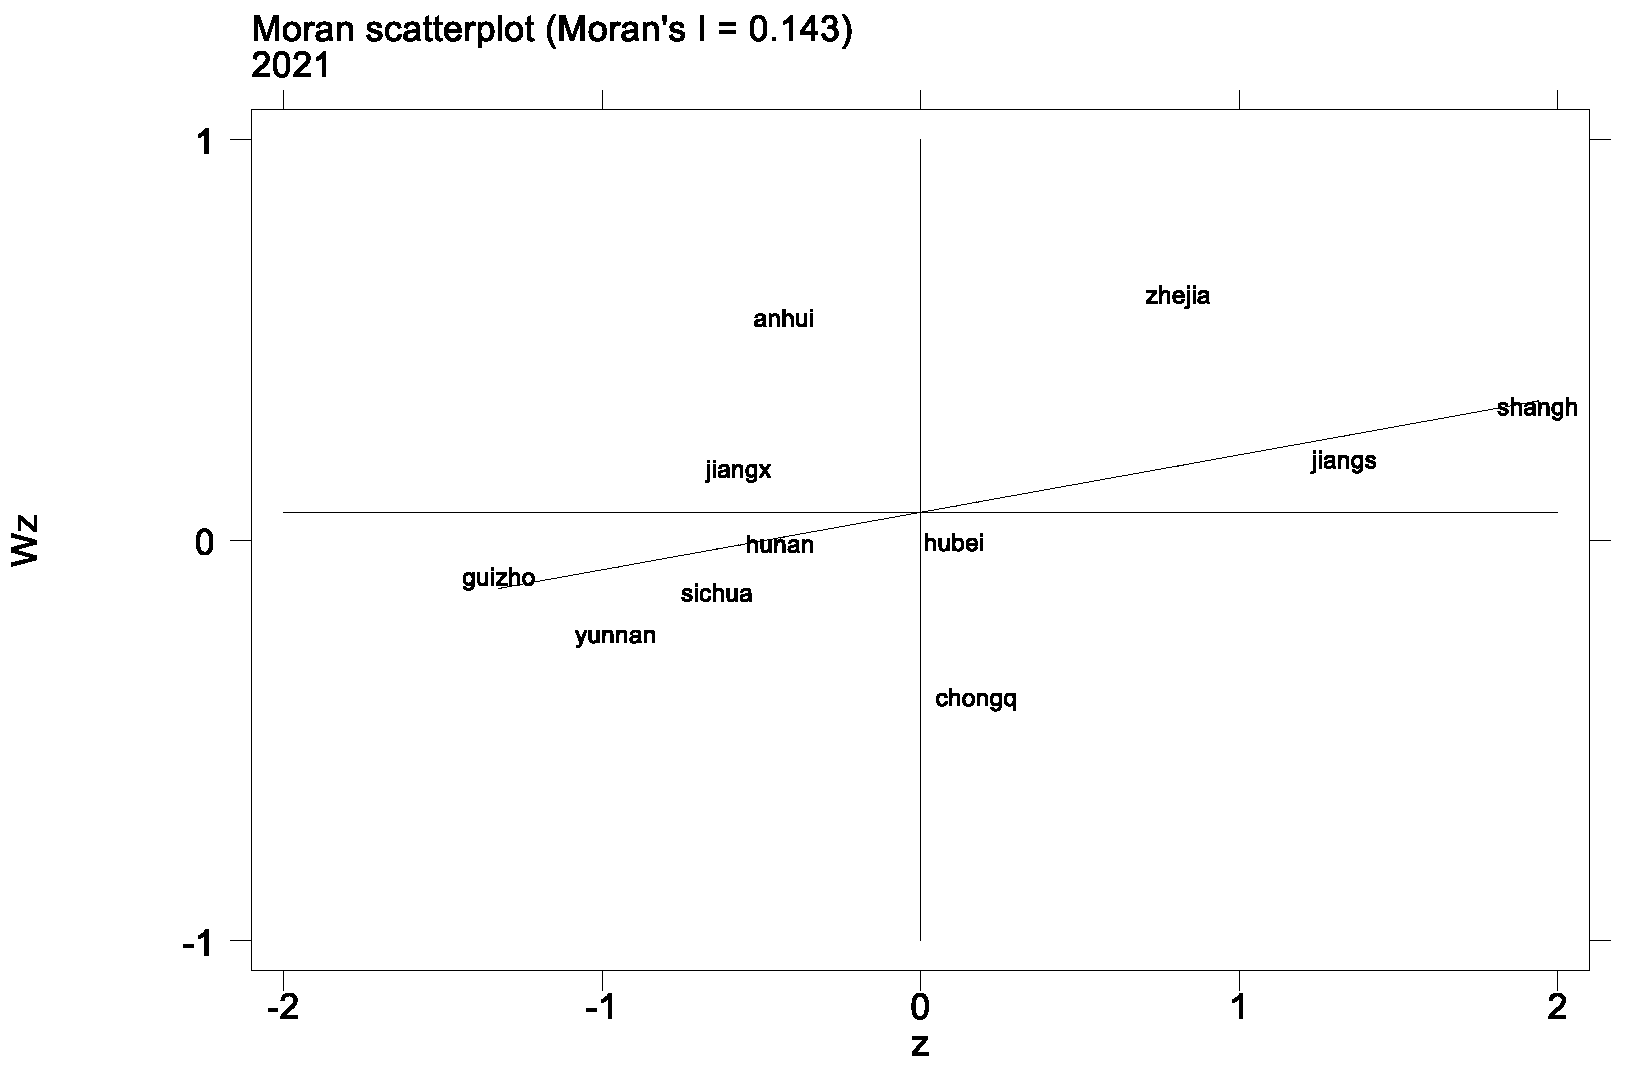

Table 1.
Descriptive statistical analysis of variables.
| Variable classification | variant | average value | (statistics) standard deviation | minimum value | maximum values |
| explanatory variable | Health level of the population ( ) | 4.34 | 0.04 | 4.25 | 4.43 |
| Core explanatory variables | Logarithm of economic growth( ) | 10.85 | 0.50 | 9.63 | 12.04 |
| control variable | Degree of aging ( ) | 0.12 | 0.03 | 0.08 | 0.20 |
| Log of health technicians ( ) | 3.43 | 0.43 | 2.56 | 4.24 | |
| Logarithm of health care institutions ( ) | 10.28 | 0.66 | 8.49 | 11.34 | |
| Educational level ( ) | 9.13 | 0.83 | 7.63 | 11.74 |
Table 2.
Global Moran Index values for population health and economic growth in the Yangtze River Economic Zone, 2012-2021.
Table 2.
Global Moran Index values for population health and economic growth in the Yangtze River Economic Zone, 2012-2021.
| variant | Level of health of the population | Economic growth |
| 2012 | 0.144*** | 0.168*** |
| 2013 | 0.144*** | 0.163*** |
| 2014 | 0.147*** | 0.154*** |
| 2015 | 0.141*** | 0.141*** |
| 2016 | 0.135*** | 0.134*** |
| 2017 | 0.133*** | 0.137*** |
| 2018 | 0.129*** | 0.150*** |
| 2019 | 0.128*** | 0.141*** |
| 2020 | 0.113*** | 0.133*** |
| 2021 | 0.188*** | 0.140*** |
Note: *** indicates significant at the 1% level; ** indicates significant at the 5% level; * indicates significant at the 10% level.
Table 3.
Model selection test results.
| Test Methods | ratio | P-value |
| LM-Spatial error | 1.812 | 0.178 |
| LM-Spatial lag | 15.524*** | 0.000 |
| HAUSMAN Inspection | 10.75* | 0.0966 |
| LR test (both or ind) | 47.02*** | 0.0000 |
| LR test (both or time) | 310.36*** | 0.0000 |
Note: *** indicates significant at the 1% level; ** indicates significant at the 5% level; * indicates significant at the 10% level.
Table 4.
Benchmark Regression Estimates of the Double Fixed Effects Spatial Lag Model (SAR) for the Yangtze River Economic Belt, 2012-2021.
Table 4.
Benchmark Regression Estimates of the Double Fixed Effects Spatial Lag Model (SAR) for the Yangtze River Economic Belt, 2012-2021.
| variant | regression coefficient | Standard deviation of coefficients | Z-value | P-value |
| 0.027*** | 0.009 | 2.90 | 0.004 | |
| -0.120*** | 0.038 | -3.12 | 0.002 | |
| 0.030*** | 0.008 | 3.55 | 0.000 | |
| -0.014* | 0.007 | -1.90 | 0.058 | |
| -0.001 | 0.002 | -0.51 | 0.608 | |
| -0.712*** | 0.210 | -3.40 | 0.001 |
Note: *** indicates significant at the 1% level; ** indicates significant at the 5% level; * indicates significant at the 10% level.
Table 5.
Decomposition of the effects of the double fixed-effects spatial lag model (SAR) for the Yangtze River Economic Belt, 2012-2021.
Table 5.
Decomposition of the effects of the double fixed-effects spatial lag model (SAR) for the Yangtze River Economic Belt, 2012-2021.
| variant | direct effect | indirect effect | aggregate effect | |||
| ratio | P-value | ratio | P-value | ratio | P-value | |
| 0.029*** | 0.005 | -0.013** | 0.023 | 0.016*** | 0.005 | |
| -0.128*** | 0.001 | 0.056*** | 0.007 | -0.072*** | 0.004 | |
| 0.032*** | 0.000 | -0.014*** | 0.007 | 0.018*** | 0.001 | |
| -0.014** | 0.050 | 0.006* | 0.083 | -0.008* | 0.058 | |
| -0.001 | 0.593 | 0.000 | 0.621 | -0.001 | 0.583 | |
Note: *** indicates significant at the 1% level; ** indicates significant at the 5% level; * indicates significant at the 10% level.
Disclaimer/Publisher’s Note: The statements, opinions and data contained in all publications are solely those of the individual author(s) and contributor(s) and not of MDPI and/or the editor(s). MDPI and/or the editor(s) disclaim responsibility for any injury to people or property resulting from any ideas, methods, instructions or products referred to in the content. |
© 2024 by the authors. Licensee MDPI, Basel, Switzerland. This article is an open access article distributed under the terms and conditions of the Creative Commons Attribution (CC BY) license (http://creativecommons.org/licenses/by/4.0/).
Copyright: This open access article is published under a Creative Commons CC BY 4.0 license, which permit the free download, distribution, and reuse, provided that the author and preprint are cited in any reuse.


