
Submitted:
09 December 2024
Posted:
10 December 2024
You are already at the latest version
Abstract
Background/Objectives: Understanding the relationship between dietary patterns, nutrient intake, and chronic disease risk is critical for informing public health strategies. However, confounding from lifestyle and individual factors complicates the assessment of diet-disease associations. Emerging machine learning (ML) techniques offer novel approaches to clarifying the importance of multifactorial predictors. This study investigated the associations between animal-sourced and plant-based dietary patterns and diabetes history, accounting for diet-lifestyle patterns employing the XGBoost algorithm. Methods: Using data from the National Health and Nutrition Examination Survey (NHANES) from 2013-2016, individuals consuming animal-sourced foods (ASF) and plant-based foods (PBF) were matched on key confounders, including age, gender, body composition, energy intake, and activity levels. Predictors of diabetes history were analyzed using the XGBoost classifier, with feature importance derived from Shapley plots. Lifestyle and dietary patterns derived from principal component analysis (PCA) were incorporated as predictors, and high multicollinearity among predictors was examined. Results: The top predictors by importance to diabetes prediction included age, percent body fat, recent BMI changes, and physical activity. Higher protein and fat intake from ASFs and PBFs were associated with lower risk, while unhealthy lifestyle factors exacerbated risk. The XGBoost model achieved an accuracy of 91.4% and an AUROC of 89%. The dietary and serum omega-6 to omega-3 fatty acids ratio emerged as significant dietary predictors. Conclusions: This study underscores the complex interactions between diet, lifestyle, and body composition in diabetes risk. Machine learning techniques like XGBoost provide valuable insights into these multifactorial relationships by mitigating confounding and identifying key predictors. Future research should focus on prospective studies incorporating detailed nutrient analyses and ML approaches to refine prevention strategies and dietary recommendations for type 2 diabetes.
Keywords:
animal-sourced foods
; plant-based diets
; chronic disease
; animal protein
; animal fat
; plant protein
; plant fat
; machine-learning
; confounding
; epidemiology
1. Introduction
The relation of diet to disease has been one of the long-standing interests of public health and nutrition. Dietary patterns and nutrient intake have wide-ranging implications for general health, and understanding the influence of specific nutrients on disease risk is vital for effectively formulating dietary guidelines. Extant literature comparing dietary patterns focuses on those emphasizing plant-based foods (PBFs) versus animal-sourced foods (ASFs) for the prevention and management of cardiometabolic diseases such as cardiovascular disease (CVD) and type 2 diabetes (T2D). Many cohort studies show different cardiometabolic disease and mortality outcomes based on the intake of plant or animal-sourced fat and protein [1,2,3,4,5]. One popular method used in observational studies to demonstrate these effects involves a statistical procedure in which risk ratios are calculated for isocaloric substitutions of one nutrient type for the other [2,3,6]. For example, in one study, replacing 5% of energy from animal fat with 5% from plant fat was associated with reduced overall mortality and CVD mortality [2]. However, this procedure can introduce bias by decoupling subject characteristics from nutrient intakes. In other words, statistical methods that adjust risk ratios based on increases in specific nutrients while holding total calorie intake constant do not isolate the effect of nutrient proportions alone; they also alter the composition of the sample used in each analysis. Thus, the new risk ratios reflect a different sample of individuals whose disease risk is affected by many other factors besides dietary composition, such as age, obesity, socioeconomic status (SES), race/ethnicity, or access to healthcare, to name a few. Since dietary patterns are often linked to many health factors, this risk analysis method is problematic, as it may not fully account for healthy user bias, even after adjustments for common confounders. Likewise, individuals with unhealthy lifestyles typically engage in other risk-increasing behaviors or present with multiple comorbidities that may not be accounted for or adjusted for during disease risk analysis, leading to residual confounding.
Lifestyle behaviors and individual characteristics, including physical activity, total energy intake, BMI, sedentary behavior, and age, have an outsized effect on cardiometabolic disease outcomes and are highly interrelated. In many studies, the association between increased risk for cardiometabolic diseases and higher total and animal protein intake compared to plant protein intake applies only to those with unhealthy lifestyle factors [3,6,7,8,9,10]. Adjustments for variables such as BMI, alcohol consumption, physical activity, and smoking often result in attenuation of associations between animal-sourced food intake and disease or mortality outcomes. For example, animal protein was associated with higher incident T2D in the Melbourne Collaborative Cohort Study, while plant protein was inversely associated [6]. However, higher animal protein intake was positively associated with BMI and fat intake and inversely associated with SES, physical activity, fiber, and vitamin intake. In contrast, plant protein intake was linked to higher physical activity, fiber, and vitamin intake and was inversely associated with BMI and smoking. The inverse association between plant protein intake and T2D attenuated after adjustment for lifestyle factors, fiber, magnesium, vitamin intakes, sodium, and saturated fatty acids.
Similarly, in a recent study by Eckart et al. using data from the National Health and Nutrition Examination Survey (NHANES), the effect of an unhealthy lifestyle characterized by high BMI, higher alcohol consumption, higher total energy, less overall protein intake, higher sugar intake, low physical activity, higher likelihood of smoking, and low participation in other health behaviors (e.g., dental visits and fiber intake) on CVD history was over 2.5 times higher than the effect of red meat intake alone [9]. Moreover, red meat eaters had unfavorable lipid profiles and less physical activity and were more likely to smoke compared to white meat eaters. Evidence from these studies suggests an inexorable link between lifestyle, dietary patterns, and disease outcomes. Consequently, high intake of specific nutrients within hypercaloric diets could be linked to cardiometabolic disease status, irrespective of purported nutrient-disease interactions.
Due to the difficulty in isolating the effects of nutrient intakes, links between dietary patterns and chronic diseases would seem paradoxical if other lifestyle factors were not emphasized. For example, in the Shanghai Women’s Health Study, diets higher in dairy were associated with lower diabetes risk and a lower likelihood of smoking and alcohol consumption. In contrast, diets higher in plant-based foods were associated with lower SES and higher diabetes risk [10]. A prospective study of over 43,000 people found that diets higher in meat consumption compared to those higher in fruits and vegetables were associated with a higher risk of diabetes in non-smokers but not in those with a history of smoking [11]. Another prospective study of over half a million people reported that white meat intake was associated with higher cardiovascular disease (CVD) risk in former smokers. In contrast, processed meat intake was linked to lower risk among those who never smoked [12].
Confounding issues in nutrient-disease research warrant changes in the methodological approach to account for bias and to identify relevant modifiable risk factors. Traditional statistical approaches cannot effectively handle the challenges posed by high-dimensional data, non-linear relationships, and interactions prevalent in nutritional epidemiology. Developments in machine learning (ML) techniques such as least absolute shrinkage selector operator (LASSO), ridge regression, elastic net regression, boosted decision trees, support vector machine (SVM), k-nearest neighbor (KNN), random forest, naive Bayes and artificial neural networks (ANN) offer new approaches to reducing model overfit and improving predictive power. They also provide greater flexibility in dealing with high-dimensional and deeply interrelated predictors, which are very common in nutritional epidemiology. These methods enable the examination of large and complex datasets, managing multicollinearity, providing robust estimates, or selecting the most relevant predictors. Utilizing these advanced methods can significantly improve the identification of risk factors and enhance dietary recommendations through a better understanding of diet-disease relationships.
T2D is a global public health issue directly linked to dietary and lifestyle factors, making it an ideal health outcome for analyzing multifactorial predictors using ML techniques. Many studies have compared the performance of various ML models in predicting T2D, with gradient-boosted decision trees among the most used and top-performing, as determined by accuracy and area under the receiver operating characteristic curve (AUROC) metrics [13]. Gradient-boosted decision trees are innovative machine learning algorithms that address issues related to predictive modeling, such as overfit or bias, by combining weaker models, correcting errors, and updating predictions. Gradient boosting minimizes the log loss (for classification models) and the size of the tree, improving interpretability. XGBoost is an extreme gradient-boosting decision tree algorithm that utilizes lasso (L1) and ridge (L2) regularization to prevent overfitting and provides feature importance outputs. Regularization adds a penalty (λ) term to the loss function, reducing coefficients for less relevant predictors. This is especially useful when high multicollinearity exists, which may obscure the true relationships between predictors and the outcome. Whereas L2 reduces feature weights near zero, L1 reduces insignificant features to zero, retaining only the most relevant predictors. The degree of L1 and L2 regularization can be optimized during the ML process to improve accuracy.
ML predictive modeling for T2D is still nascent. The feature sets used in these models are heterogeneous, making comparing feature selection across studies challenging. However, in a meta-analysis of 90 studies on the performance of 18 different models, models that included lifestyle, socioeconomic, and diagnostic data were more accurate overall [13]. Tan et al. (2022) used Lasso regression to select relevant predictors of T2D from a population-based cohort that included 2,012 adult men and women. Smoking and waist circumference were among the most important lifestyle factors, increasing the odds of T2D incidence by over 65% and 5% per cm, respectively [14]. In a different study, predictors of fasting blood glucose in 650 participants, 270 of whom had T2D, were compared using basic linear, ridge, and lasso regression [15]. There were high variance inflation factors (VIFs), a measure of multicollinearity for total cholesterol and LDL cholesterol, and a moderate VIF for triglycerides. However, there was an agreement among ML models for age, BMI, and gender as significant predictors of T2D. Qin et al. evaluated the predictive performance of five different ML models in predicting diabetes history employing data from NHANES. The top three predictors in order of importance were sleep, energy, and age, with an AUROC of 83% and an 82% sensitivity [16]. Similarly, Meng et al. compared the importance of diabetes predictors across logistic regression, ANN, and decision tree predictive models [17]. All three models achieved moderately high sensitivity, ranking lifestyle factors, SES, and health-related behaviors among the most important predictors.
Despite the limited research utilizing gradient-boosted decision tree models to explore the connections between animal and plant-based diets, lifestyle factors, and diabetes, we aim to fill this gap. Our analysis will focus on common predictors of diabetes history typically found in nutrient-disease studies. To add another layer of control, we will match ASF and PBF dietary patterns on key confounders. Additionally, we will assess the predictive power of the XGBoost boosted tree algorithm and investigate how effectively this method can minimize noise from complicated, interrelated data.
2. Materials and Methods
2.1. Data and Sample Extraction
Data from NHANES were collected between 2013 and 2016, including basic demographic information, body composition data, physical activity, individual food intakes, diabetes history, medication history, macro-nutrient intakes, serum nutrient levels, and serum metabolic markers. NHANES is a nationally representative survey of US civilians. Estimates were calculated using combined-cycle case weights according to NHANES guidance to account for variations in selection probabilities, non-response, missing data, and sub-sample datasets [18]. After variable selection and data aggregation from the 2013-2014 and 2015-2016 collection cycles, there were 20,146 respondents with valid data. After excluding respondents who were on a special diet during the survey and cases with missing case weights, there were 15,359 respondents in the sample (Figure 1). Dietary intakes were collected via 24-hour dietary recall and food frequency questionnaires administered by trained interviewers. Individual food intakes were collected and categorized by the What We Eat in America food categories. Six thousand three hundred respondents reported an intake of non-combination foods, which comprised most recorded food items. All non-combination food intakes were further categorized as animal-sourced foods (ASFs) or plant-based foods (PBF). Respondents were selected for the ASF eating pattern if any amount of non-combination ASF intake was recorded, whereas those who did not report intake of non-combination ASFs were selected for the PBF eating pattern.
2.2. Dietary Group Matching
Respondents in the ASF and PBF dietary patterns were matched by age, gender, body composition, total calories, and the ratio of physical activity to sedentary time (PAX) via propensity score matching with replacement and a 0.5 match tolerance. All variables included in the analyses were examined for normality via the Kolmogorov-Smirnov test (p ≤ 0.05).
Respondents were categorized as having diabetes if they answered "Yes" to the question, “Doctor told you have diabetes" and met at least one of the following criteria: glycohemoglobin of 6.5% or higher or current use of diabetes medication (insulin or pills) at the time of the survey. Gestational or borderline diabetes cases were not included. To address diet quality related to dietary fat, we created new variables, including the dietary ω6FAs: ωFAs ratio, the serum ω6: ω3FAs ratio, and the ratio of total unsaturated fatty acids (UFAs) to saturated fatty acids (SFAs) [PUFAs + MUFAs / SFAs]. The UFAs/SFAs variable is based on the National Cancer Institute Healthy Eating Index (HEI) scoring standard of ≥ 2.5 [19]. To address the effects of more recent lifestyle changes, we calculated the change in BMI from one year before the survey. To analyze the effect of an unhealthy lifestyle, we categorized respondents based on the presence of at least one lifestyle factor, including obesity (≥30 kg/m^2), smoking history, 1-SD increase in BMI within the past year, or less than 30 minutes of daily recreational physical activity at any intensity.
2.3. Statistical Analyses
To examine multicollinearity, linear regression was used to derive each predictor's variance inflation factor (VIF). We used principal component analysis (PCA) to analyze diet-lifestyle patterns for those reporting doctor-confirmed diabetes. Principal components were rotated via direct oblimin (=0) to maximize interpretability. Regression factor scores from each component were added as new features and characterized according to the partial correlations for each predictor in the pattern matrix.
The XGBoost classifier was configured for optimization using a parameter grid for learning rate, n-estimators (the number of trees in the ensemble), max depth (the number of allowable branches), subsample (the percentage of the sample used for training ensemble trees), and gamma value (the regularization parameter that controls the number of tree splits). Training was performed on 70% of the data and tested on 30%.
The classes in the training dataset were balanced using the Synthetic Minority Oversampling Technique (SMOTE). We used a random state of 42 to generate synthetic samples of the diabetes-positive class by interpolating between observed cases. In this way, there is equal representation for the classes in the resampled training set, which overcomes the problem of class imbalance. The resampled data was then used in model training and optimization to improve predictive performance and equity across both classes. Sensitivity and accuracy analyses were performed via AUROC and precision-recall curves (AUPRC). Shapley Additive Explanation (SHAP) plots were generated to explain the contribution of each predictor to diabetes status in order of importance. Data aggregation, transformation, cleaning, and diet-matched extraction were performed via IBM SPSS (version 29.0); PCA and XGBoost analyses were performed in Python (version 3.9.6).
3. Results
The diet-matched sample included 2,119 respondents in the ASF group, of which 55.6% were male, and 2,119 respondents in the PBF group, of which 50.1% were male. The median age of those in the PBF pattern was 45 years compared to 43 years in the ASF pattern (Table 1). Approximately 5.4% (S.E. 0.3%) in the PBF group and 7.8% (S.E. 1.0%) in the ASF group reported diabetes history. The median total energy intake in the ASF pattern was 7% higher than in the PBF pattern. Those in the ASF pattern consumed a median intake of 21.36% of their total calories from non-combination ASFs and 17.81% of their total intake from non-combination PBFs. In contrast, those in the PBF pattern consumed 17.35% of their total calories from non-combination PBFs.
Median dietary intakes of total energy, total fat, monounsaturated fatty acids, polyunsaturated fatty acids, total protein, total fat, total cholesterol, ω6FAs, and ω3FAs were higher in the ASF pattern. Conversely, carbohydrates and fiber were higher in the PBF pattern. The ASF group had a higher intake of plant fats, MUFAs, and PUFAs and a higher ratio of UFAs to SFAs. The ASF group had a higher intake of MUFAs and PUFAs from animal sources than from plant sources.
Serum values of HDL-C, LDL-C, glycohemoglobin, triglycerides, total serum ω3FAs, total serum ω6FAs, and HS-CRP were similar. However, fatty acid subtypes, including Arachidonic acid (AA), alpha-linolenic acid (ALA), Eicosapentaenoic acid (EPA), and Docosahexaenoic acid (DHA), were higher in the ASF group.
Of the ASF group, 51.4% were classified as having an unhealthy lifestyle, compared to 48.6% in the PBF group. However, the ASF group had a 38% greater reduction in BMI in the past year and a 3% lower percentage of body fat. Eighteen-point-five percent in the PBF group reported a smoking history, compared to 24.7% in the ASF group.
Table 2 shows the descriptive estimates stratified by diabetes history. Of those with diabetes, 55.9% were male. At the median, the diabetes group was over twice as old, consumed more energy, had poorer body composition, higher serum triglycerides, lower HDL-C, lower fiber intake, higher intake of plant fat and plant protein, higher intake of ASF protein, higher glycohemoglobin, higher HS-CRP, higher insulin levels, higher intake of cholesterol, higher intake of PUFAs and MUFAs, and lower PA levels. However, those with diabetes had a 15% lower intake of carbohydrates, a 20% lower ASF fat intake, lower LDL-C, and higher levels of AA, ALA, EPA, and DHA than those without diabetes. Approximately 43% of those with diabetes reported a smoking history, compared to 20.1% in non-diabetics.
Linear regression showed high VIFs for ω6FAs, PUFAs, MUFAs, and UFAs: SFAs (Figure 2). Moderate VIFs were found for total energy, total ω3FAs, and the serum ω6FAs: ω3FAs ratio.
The PCA resulted in 9 components extracted, explaining 78% of the variance in diabetes history (Table 3). Component 1 explained over 23% of the variance and was influenced primarily by high unsaturated fatty acids and high total energy intake. Component 2 explained over 10% of the variance, with the highest factor loadings of poor body composition (BMI and percent body fat), age, and unhealthy lifestyle. Female gender loaded highest onto Component 3, explaining over 8% of the variance. Component 4 explained over 7.9% of the variance with strong loadings of ASF dietary patterns. Explaining over 6.8% of the variance, Component 5 was influenced by animal-sourced fat and protein. Component 6 had negative loadings of serum ω6FAs: ω3FAs ratios yet high positive loading of serum ω3FAs. Component 7 had high loadings of plant fat and protein. Component 8 was influenced by higher dietary ω6FAs: ω3FAs ratios. Lastly, BMI and percent body fat loaded negatively, while recent increases in BMI and smoking history loaded positively onto Component 9.
The best hyperparameters for the XGBoost classifier included a gamma value of 1.0, a learning rate of 0.05, a max depth of 5, n-estimators of 25, and a subsample of 0.8. The mean accuracy across the 10-fold cross-validation was 96.3%. The AUROC was 89%, with an overall accuracy of 91.4% and an F1 score of 36.3% (Figure 3). The AUPRC for the diabetes-positive class was 34%.
Figure 4 shows the top individual and lifestyle predictors by feature importance. Individual predictors that positively impacted diabetes prediction were age, body fat percentage, BMI, ASF dietary pattern, and recent BMI changes. Individual predictors negatively impacting diabetes were smoking history, PAX, and serum ω6FAs. Diet-lifestyle features having a positive impact on diabetes prediction were ‘Unhealthy Lifestyle, Older, & Poor Body Composition,’ ‘High Total Energy/UFAs,’ ‘High Dietary O6: O3 Ratio’, and ‘Recent BMI Increase & Smoking History.’ In contrast, lifestyle features ‘Lower Serum O6: O3 Ratio’, ‘Higher Plant Fat & Protein,’ and ‘Higher ASF Fat & Protein’ had a negative impact. The impact of fiber intake was inconclusive. However, predictive values for many features had substantial overlap between positive and negative impacts on prediction.
4. Discussion
This cross-sectional investigation observed complex dietary, lifestyle, and body composition patterns associated with diabetes history. High multicollinearity measures for UFAs confounded the relationship between dietary patterns and diabetes history. Supporting established links, age, percent body fat, BMI, and recent increase in BMI were among the top predictors of diabetes history, emphasizing the role of age and lifestyle in disease progression [20,21]. However, the effect of smoking on diabetes was unclear. Although an unhealthy lifestyle defined by obesity, a marked recent increase in BMI, low physical activity, or smoking history was associated with diabetes, smoking history as an individual predictor was inversely associated. Evidence suggests a complex relationship between smoking and diabetes risk, with smoking contributing to a relatively higher risk of prediabetes and an increased risk of T2D following smoking cessation that gradually declines [22]. Increased risk after smoking cessation may be due to cumulative exposure to smoking or is the result of weight gain following cessation. In the current study, smoking history included current and former smokers, so it is plausible that the increased risk in those with and without a smoking history is due to unhealthy levels of body fat. Moreover, the positive association between diabetes and the diet-lifestyle feature ‘Recent BMI Increase & Smoking History’ supports the theory of weight gain following smoking cessation.
There was no clear link between the ASF or PBF dietary pattern and diabetes history. Despite the higher prevalence of diabetes in the ASF group, higher levels of animal fat and protein were negatively associated with diabetes. This is likely due to the link between ASF patterns and unhealthy lifestyle factors rather than the inclusion of ASFs. Conversely, diets higher in plant protein and fat were associated with a lower risk of diabetes, like the studies mentioned previously. High amounts of circulating amino acids, specifically branched-chain amino acids (BCAAs), found in animal protein sources have been linked to hyperinsulinemia and impaired glucose uptake via activation of the mammalian target of rapamycin (mTOR) pathway, which promotes protein synthesis and lipogenesis [23]. However, the effects of amino acid types on insulin action and glucose tolerance remain unclear. Recent clinical evidence suggests that the mTOR pathway is not activated with isocaloric, non-energy-restrictive substitutions of fat for animal or plant protein [24]. This may explain the attenuated associations between total and animal-sourced protein and increased risk of T2D or insulin resistance with adjustment for body composition or total energy in several studies [25,27,28]. In contrast, one study found an association between animal-sourced and total protein intakes in obese women compared to men [26]. Again, adjustment for previous chronic disease conditions weakened this relationship.
Evidence suggests that age, muscle mass, and adiposity have independent effects on insulin resistance [29,30,31]. In men, age appears to be an independent predictor of insulin resistance, while in females, increases in age-related adiposity drive insulin resistance [30]. In one study of over 100 post-menopausal women, lean body mass and visceral fat independently predicted insulin levels and HS-CRP, an inflammatory marker associated with increased CVD risk [29]. We found a similar result in the PCA, with female gender and percent body fat loading strongly onto Component 3, accounting for 8.66% of the variance in diabetes outcomes.
The difference in BCAA content between animal- and plant-based protein sources may explain the effect of protein type on insulin resistance, especially in older, overweight individuals. Animal protein consumption has been linked to higher muscle mass index (muscle mass (kg)/height(m)2) through higher muscle protein synthesis compared to plant protein [32]. However, animal protein intake and higher muscle mass may promote insulin resistance as age and adiposity-related inflammation increase. In a cross-sectional study of older adults, insulin resistance measured by HOMA-IR was associated with animal protein intake, but only in those with higher muscle mass index and higher body fat. In contrast, plant protein was inversely associated with muscle mass index and insulin resistance [31]. A higher muscle mass index was inversely associated with body fat and chronic disease. The loss of type I muscle fibers, which are dense in mitochondria and have high oxidative capacity, may also play a role in the development of T2D via increased fat deposition [33]. Our results support these effects. The ASF group had higher insulin levels and BMI but slightly lower body fat, which indicates relatively higher muscle mass. These findings suggest a complex relationship between age, diet, body composition, and insulin dysregulation.
A higher dietary ω6FAs: ω3FAs ratio and the dietary pattern ‘High Total Energy & UFAs’ predicted diabetes. Evidence on the effects of UFAs on diabetes or metabolic markers is unclear [4,34,35,36]. A meta-analysis of 10 cohort studies showed that ω3FA consumption was positively associated with T2D, exhibiting an inverted U-shape relationship [37]. In another meta-analysis of 83 randomized controlled trials, increasing ω3FAs, ω6FAs, or total PUFA had little or no effect on preventing or treating newly diagnosed T2D [38]. In the Prospective Metabolism and Islet Cell Evaluation (PROMISE) longitudinal study that included 477 participants with 6 years of follow-up, total non-esterified fatty acids (NEFAs) independently predicted decreased beta cell function [39]. No individual NEFAs had a positive influence on insulin sensitivity except for EPA. Similarly, the ASF group and diabetes group had a higher intake of fat, particularly from plant sources, and a higher ratio of UFAs to SFAs. This may be evidence of an adverse effect of overconsumption of UFAs despite lower relative amounts of SFAs.
Other research suggests that the relative dose of ω3FAs and long-term consumption may mediate this relationship [34,37]. Using NHANES data from 2005-2020, Jiang et al. observed that higher amounts of specific subtypes of MUFAs (16:1, 18:1, and 20:1) and PUFAs (18:2 and18:3) were related to reduced diabetes risk [40]. Furthermore, only the highest intakes of PUFA subtypes 20:4, 20:5 (EPA), 22:5 (DPA), and 22:6 were associated with lower risk. In the current study, the ASF and diabetes group had higher intakes of EPA, DHA, plant fats, PUFAs, and MUFAs, like Jiang et al. However, it is possible that the levels of EPA and DHA were insufficient to mitigate the onset of diabetes.
In the current study, the dietary ω6FAs: ω3FAs ratio was over 9, and the serum ω6FAs: ω3FAs ratio was around 14 for both groups. This is much higher than the ratios associated with improved metabolic health of around 4-5:1 [41,42,43]. Although there is no consensus on the optimal ratios, some evidence suggests that the serum and dietary ω6FAs: ω3FAs ratio may predict T2D [41,42]. Modern diets have increased the availability of 6FAs compared to 3FA, which has implications for metabolic health. ω6FAs are converted to AA, which may have inflammatory and thrombotic effects, whereas ω3FAs are converted to EPA and DHA, which exert anti-inflammatory effects [44]. ω6FAs may also contribute to obesity by increasing triglyceride concentration via increased cell membrane permeability, while ω3FAs have the opposite effect [45]. This is supported by several investigations showing a positive association between higher relative amounts of ω3FAs and improved insulin sensitivity, fasting glucose, insulin, HS-CRP levels, and fitness measures [41,42,46].
The use of the ω6FAs: ω3FAs ratio has been questioned recently, however, due to the need for more reporting for specific subtypes used in the ratio [47]. Another criticism is that using a ratio does not consider the absolute amounts of each UFA despite evidence of a dose-response effect of specific UFAs in reducing T2D risk [40,46,47]. Furthermore, some evidence suggests that the lack of ω3FAs, not the relative increases in ω6FAs, is proinflammatory [47].
Pancreatic beta cell function and their survival are related to the carbon chain length and degree of FA saturation, with long-chain SFAs (> 12 carbons) inducing cytotoxicity [48]. However, in vitro studies have shown improvements in beta cell function after exposure to UFAs [49]. Some epidemiological evidence suggests that food preparation practices confound the relationship between UFAs and diabetes. For example, Qian observed a 50% increase in T2D risk with higher consumption of fried plant-based MUFAs than animal-sourced MUFAs [50]. Deep frying typically involves using long-chain (18 carbons) plant oils. However, deep frying with low smoke point oils, especially with repeated use, increases oxidation and production of SFAs and trans fats and impairs beta cell function [47,48].
In another study in children and older adults that combined multiple cross-sectional and longitudinal studies, a lower ω6FAs: ω3FAs ratio was associated with higher HEI scores, indicating higher diet quality [43]. Still, participants across age groups did not meet the recommended amounts of EPA and DHA. Our study supports this as the dietary pattern ‘Lower Serum O6: O3 Ratio, Higher Serum O3’ was associated with lower diabetes risk, while ‘High Dietary O6: O3 Ratio’ was positively associated. However, we also found lower serum ω6FAs to be associated with higher risk, albeit ranked lower in feature importance. This may confirm the importance of absolute values of ω6FAs and ω3FAs and optimal ratios in reducing diabetes risk, although further investigation is warranted.
Noteworthy observations from this study highlight the importance of lifestyle modification in preventing and treating diabetes. First is the impact of BMI, recent BMI increases, and unhealthy lifestyles on diabetes outcomes. A recent investigation showed that just 14 days of reduced physical activity led to increases in insulin resistance and total body fat and decreases in limb lean mass [51]. Countless clinical trials representing the standard care model, which includes increasing physical activity and caloric restriction, have demonstrated effectiveness in reducing diabetes risk and improving T2D and cardiometabolic markers [52]. Next is the consumption of nearly 150 more calories in the ASF group at the median despite being matched on total energy, body composition, and physical activity index. The link between T2D and energy surplus is inexorable, and recent attempts have been made to define T2D as an energy surplus disease [53]. Lack of dietary planning could lead to reduced dietary quality and over-consumption of calorically dense foods, including animal-sourced foods or processed foods from any source, increasing the risk of T2D. Caloric restriction, however, is a powerful tool in managing T2D. In a network meta-analysis of 18 studies on caloric restriction methods, intermittent fasting and continuous energy restriction methods improved HbA1c, body weight, and body mass index compared to traditional diets [54].
Although dietary interventions for T2D management have been studied extensively, the best dietary pattern has yet to be identified. A recent meta-analysis of 56 trials comparing nine different dietary patterns showed that all dietary patterns were effective in reducing HbA1c and fasting glucose compared to the control, with a low-carbohydrate diet, Mediterranean diet, and Paleolithic diet among the most effective [55]. These dietary patterns share common characteristics favorable to metabolic profiles such as energy balance, higher UFA content, higher protein, higher intake of fruits and vegetables, minimally processed foods, and higher intakes of fiber.
4.1. Strengths
This is the first study incorporating XGBoost analysis to address the relationship between specific dietary patterns and diabetes risk. We found that lifestyle variables confounded the relationship between nutrients from animal and plant sources and diabetes history. By matching on dietary patterns, our study provides insights into how lifestyle and nutrient intake contexts influence diabetes risk, offering a novel perspective on the interplay between diet and metabolic health. Although counter-matching has traditionally been employed to improve case-control efficiency, our study differs in that it uses matching to isolate dietary exposure groups for analysis of diabetes predictors. The results of this study align with other studies employing ML methods for predicting diabetes that found a high impact of age, body composition, and lifestyle variables on diabetes [14,15,16,17]. However, the sets of predictors used across studies differed, which is likely to change feature importance. It is important to emphasize that researchers should consider the aims, sample characteristics, and sets of predictors used when comparing models. To our knowledge, this is the first study to employ XGBoost on an NHANES sample with PCA-engineered variables depicting diet-lifestyle patterns as additional features. Including PCA-engineered features allowed for the differentiation of importance for individual and interrelated predictors.
4.2. Limitations
The use of 24-hour dietary recall and food-frequency questionnaires as a proxy for habitual intake is a weakness in this and many other dietary studies. We only considered non-combination ASFs and PBFs from several food categories when selecting individuals for each group, which does not account for sources of nutrients from combination foods or specific food groups, nor does it allow for an in-depth examination of diet quality. However, the differences between the ASF and PBF groups were similar to those in other studies. Moreover, we did not account for other lifestyle factors such as alcohol consumption, prescription drug use, family history, or SES. However, due to their interrelatedness with other lifestyle factors, we did not deem it necessary to include all known/available background factors to illustrate issues with confounding. The cross-sectional design opens the possibility of reverse causality attribution, although many of our results are supported by prospective studies. Although we excluded individuals who reported being on a diet at the time of the survey, this questionnaire item may not account for all individuals who recently changed their lifestyle or dietary habits.
Furthermore, the results of this study may differ from future cross-sectional studies that include a wider age range. The XGBoost model achieved a relatively high accuracy but moderate precision, which may be due to the inclusion of interrelated predictors. However, our goal was not necessarily to find the best diabetes predictors but to explore the importance of lifestyle and dietary factors on diabetes history. Future studies should prospectively analyze the interactions of pre-existing metabolic conditions, nutrient intake thresholds, and diabetes incidences to clarify the relationships further and propose new guidelines for management and prevention purposes.
4.3. Practical Implications
Although randomized-controlled interventions significantly reduce bias and serve to isolate causal predictors, they are limited by funding, the extent to which nutrients and other physiology-influencing behaviors can be controlled, lack of long-term follow-up, and diet adherence issues, to name a few. While often having high statistical power, cross-sectional studies are often limited by retrospective design, lack of control variables and groups, lack of causal inference, and confounding due to unknown or uncollected variables. Despite these shortcomings, the wide availability (often publicly available) and high sample size of cohort-based datasets make these data sources readily accessible and have utility in providing insights on otherwise complex subject matter. In conjunction with incorporating control variables, robust ML techniques may improve the signal-to-noise ratio compared to traditional predictive methods.
5. Conclusions
This study highlights the complex interplay between dietary and lifestyle patterns and their association with diabetes history, emphasizing the significant impact of age, body composition, and recent BMI changes. Although the animal-sourced food pattern was associated with diabetes, this was primarily explainable by unhealthy lifestyles, yet animal-sourced protein and fat were inversely associated. The XGBoost algorithm clarified the importance of interrelated multifactorial predictors, underscoring the limitations of traditional approaches in addressing confounding. Future research in this area should establish robust ML techniques and include longitudinal designs that would help isolate the effects of dietary and lifestyle factors on chronic disease outcomes. This approach can refine dietary guidelines and preventive strategies for type 2 diabetes.
Author Contributions
Adam Eckart: Conceptualization, Methodology, Validation, Formal analysis, Investigation, Data Curation, Writing – Original Draft, Visualization. Pragya Ghimire: Conceptualization, Methodology, Validation, Writing – Review & Editing.
Funding
This research did not receive any specific grant from funding agencies in the public, commercial, or not-for-profit sectors.
Institutional Review Board Statement
This research is considered exempt under 45 CFR 46.104. NHANES undergoes periodic human subjects research ethical review by the NCHS Ethics Review Board. IRB/ERB protocol numbers and descriptions can be found here: https://www.cdc.gov/nchs/nhanes/irba98.htm.
Informed Consent Statement
Not applicable.
Data Availability Statement
The data used throughout this study were derived from the following resources available in the public domain: https://www.cdc.gov/nchs/nhanes/index.htm.
Acknowledgments
None.
Conflicts of Interest
The authors declare no conflicts of interest.
Abbreviations
| ASFs | animal-sourced foods |
| AUPRC | area under the precision-recall curve |
| AUROC | area under the receiver operating characteristic curve |
| BMI | body mass index |
| CVD | cardiovascular disease |
| FAs | fatty acids |
| HEI | healthy eating index |
| HS-CRP | high-sensitivity c-reactive protein |
| ML | machine learning |
| MUFAs | monounsaturated fatty acids |
| PA | physical activity |
| PAX | ratio of total physical activity to sedentary time |
| PBFs | Plant-based foods |
| PUFAs | polyunsaturated fatty acids |
| RCT | randomized controlled trial |
| SFAs | saturated fatty acids |
| T2D | Type 2 diabetes |
| ω3FAs | dietary omega-3 fatty acids |
| ω6FAs | dietary omega-6 fatty acids |
| ω6FAs | ω3FAs ratio of omega-6 to omega-3 fatty acids |
| UFAs | unsaturated fatty acids |
References
- Petersen KS, Flock MR, Richter CK, Mukherjea R, Slavin JL, Kris-Etherton PM. Healthy dietary patterns for preventing cardiometabolic disease: the role of plant-based foods and animal products. Current Developments in Nutrition. 2017 Dec 1;1(12):cdn-117.
- Zhao B, Gan L, Graubard BI, Männistö S, Fang F, Weinstein SJ, Liao LM, Sinha R, Chen X, Albanes D, Huang J. Plant and Animal Fat Intake and Overall and Cardiovascular Disease Mortality. JAMA Internal Medicine. 2024 Aug 12.
- Song M, Fung TT, Hu FB, Willett WC, Longo VD, Chan AT, Giovannucci EL. Association of animal and plant protein intake with all-cause and cause-specific mortality. JAMA Internal Medicine. 2016 Oct 1;176(10):1453-63.
- Appel LJ, Sacks FM, Carey VJ, Obarzanek E, Swain JF, Miller ER, Conlin PR, Erlinger TP, Rosner BA, Laranjo NM, Charleston J. Effects of protein, monounsaturated fat, and carbohydrate intake on blood pressure and serum lipids: results of the OmniHeart randomized trial. JAMA. 2005 Nov 16;294(19):2455-64.
- Kelemen LE, Kushi LH, Jacobs Jr DR, Cerhan JR. Associations of dietary protein with disease and mortality in a prospective study of postmenopausal women. American Journal of Epidemiology. 2005 Feb 1;161(3):239-49.
- Shang X, Scott D, Hodge AM, English DR, Giles GG, Ebeling PR, Sanders KM. Dietary protein intake and risk of type 2 diabetes: results from the Melbourne Collaborative Cohort Study and a meta-analysis of prospective studies. The American Journal of Clinical Nutrition. 2016 Nov 1;104(5):1352-65.
- Tong TY, Appleby PN, Bradbury KE, Perez-Cornago A, Travis RC, Clarke R, Key TJ. Risks of ischaemic heart disease and stroke in meat eaters, fish eaters, and vegetarians over 18 years of follow-up: results from the prospective EPIC-Oxford study. BMJ. 2019 Sep 4;366.
- Satija A, Bhupathiraju SN, Rimm EB, Spiegelman D, Chiuve SE, Borgi L, Willett WC, Manson JE, Sun Q, Hu FB. Plant-based dietary patterns and incidence of type 2 diabetes in US men and women: results from three prospective cohort studies. PLoS Medicine. 2016 Jun 14;13(6):e1002039.
- Eckart AC, Stavitz JA, Bhochhibhoya A, Sharma Ghimire P. Associations of animal source foods, cardiovascular disease history, and health behaviors from the national health and nutrition examination survey: 2013–2016. Global Epidemiology. 2023; 5. [CrossRef]
- Villegas R, Yang G, Gao YT, Cai H, Li H, Zheng W, Shu XO. Dietary patterns are associated with lower incidence of type 2 diabetes in middle-aged women: the Shanghai Women’s Health Study. International Journal of Epidemiology. 2010 Jun 1;39(3):889-99.
- Odegaard AO, Koh WP, Butler LM, Duval S, Gross MD, Yu MC, Yuan JM, Pereira MA. Dietary patterns and incident type 2 diabetes in Chinese men and women: the Singapore Chinese Health Study. Diabetes Care. 2011 Apr 1;34(4):880-5.
- Sinha R, Cross AJ, Graubard BI, Leitzmann MF, Schatzkin A. Meat intake and mortality: a prospective study of over half a million people. Archives of Internal Medicine. 2009 Mar 23;169(6):562-71.
- Fregoso-Aparicio L, Noguez J, Montesinos L, García-García JA. Machine learning and deep learning predictive models for type 2 diabetes: a systematic review. Diabetology & Metabolic Syndrome. 2021 Dec 20;13(1):148.
- Tan C, Li B, Xiao L, Zhang Y, Su Y, Ding N. A prediction model of the incidence of type 2 diabetes in individuals with abdominal obesity: insights from the general population. Diabetes, Metabolic Syndrome and Obesity: Targets and Therapy. 2022 Jan 1:3555-64.
- Farvahari A, Gozashti MH, Dehesh T. The usage of lasso, ridge, and linear regression to explore the most influential metabolic variables that affect fasting blood sugar in type 2 Diabetes patients. Romanian Journal of Diabetes Nutrition and Metabolic Diseases. 2019;26(4):371-9.
- Qin Y, Wu J, Xiao W, Wang K, Huang A, Liu B, Yu J, Li C, Yu F, Ren Z. Machine learning models for data-driven prediction of diabetes by lifestyle type. International Journal of Environmental Research and Public Health. 2022 Nov 15;19(22):15027.
- Meng XH, Huang YX, Rao DP, Zhang Q, Liu Q. Comparison of three data mining models for predicting diabetes or prediabetes by risk factors. The Kaohsiung Journal of Medical Sciences. 2013 Feb 1;29(2):93-9.
- National Center for Health Statistics. NHANES Survey Methods and Analytic Guidelines. [Internet]. Available from: https://wwwn.cdc.gov/nchs/nhanes/analyticguidelines.
- National Cancer Institute, Division of Cancer Control and Population Sciences. Developing the Healthy Eating Index [Internet]. Available from: https://epi.grants.cancer.gov/hei/developing.
- Nanayakkara N, Curtis AJ, Heritier S, Gadowski AM, Pavkov ME, Kenealy T, Owens DR, Thomas RL, Song S, Wong J, Chan JC. Impact of age at type 2 diabetes mellitus diagnosis on mortality and vascular complications: systematic review and meta-analyses. Diabetologia. 2021 Feb;64:275-87.
- Janssen JA. Hyperinsulinemia and its pivotal role in aging, obesity, type 2 diabetes, cardiovascular disease and cancer. International Journal of Molecular Sciences. 2021 Jul 21;22(15):7797.
- Campagna D, Alamo A, Di Pino A, Russo C, Calogero AE, Purrello F, Polosa R. Smoking and diabetes: dangerous liaisons and confusing relationships. Diabetology & Metabolic Syndrome. 2019 Dec;11:1-2.
- Levine ME, Suarez JA, Brandhorst S, Balasubramanian P, Cheng CW, Madia F, Fontana L, Mirisola MG, Guevara-Aguirre J, Wan J, Passarino G. Low protein intake is associated with a major reduction in IGF-1, cancer, and overall mortality in the 65 and younger but not older population. Cell Metabolism. 2014 Mar 4;19(3):407-17.
- arkova M, Pivovarova O, Hornemann S, Sucher S, Frahnow T, Wegner K, Machann J, Petzke KJ, Hierholzer J, Lichtinghagen R, Herder C. Isocaloric diets high in animal or plant protein reduce liver fat and inflammation in individuals with type 2 diabetes. Gastroenterology. 2017 Feb 1;152(3):571-85.
- Malik VS, Li Y, Tobias DK, Pan A, Hu FB. Dietary protein intake and risk of type 2 diabetes in US men and women. American Journal of Epidemiology. 2016 Apr 15;183(8):715-28.
- Van Nielen M, Feskens EJ, Mensink M, Sluijs I, Molina E, Amiano P, Ardanaz E, Balkau B, Beulens JW, Boeing H, Clavel-Chapelon F. Dietary protein intake and incidence of type 2 diabetes in Europe: the EPIC-InterAct Case-Cohort Study. Diabetes Care. 2014 Jul 1;37(7):1854-62.
- Sluijs I, Beulens JW, Van Der A DL, Spijkerman AM, Grobbee DE, Van Der Schouw YT. Dietary intake of total, animal, and vegetable protein and risk of type 2 diabetes in the European Prospective Investigation into Cancer and Nutrition (EPIC)-NL study. Diabetes Care. 2010 Jan 1;33(1):43-8.
- Azemati B, Rajaram S, Jaceldo-Siegl K, Sabate J, Shavlik D, Fraser GE, Haddad EH. Animal-protein intake is associated with insulin resistance in Adventist Health Study 2 (AHS-2) calibration substudy participants: a cross-sectional analysis. Current Developments in Nutrition. 2017 Apr 1;1(4):e000299.
- Brochu M, Mathieu ME, Karelis AD, Doucet É, Lavoie ME, Garrel D, Rabasa-Lhoret R. Contribution of the lean body mass to insulin resistance in postmenopausal women with visceral obesity: a Monet study. Obesity. 2008 May;16(5):1085-93.
- Ehrhardt N, Cui J, Dagdeviren S, Saengnipanthkul S, Goodridge HS, Kim JK, Lantier L, Guo X, Chen YD, Raffel LJ, Buchanan TA. Adiposity-independent effects of aging on insulin sensitivity and clearance in mice and humans. Obesity. 2019 Mar;27(3):434-43.
- Matta J, Mayo N, Dionne IJ, Gaudreau P, Fulop T, Tessier D, Gray-Donald K, Shatenstein B, Morais JA. Muscle mass index and animal source of dietary protein are positively associated with insulin resistance in participants of the NuAge study. The Journal of Nutrition, Health & Aging. 2016 Feb;20:90-7.
- Aubertin-Leheudre M, Adlercreutz H. Relationship between animal protein intake and muscle mass index in healthy women. British Journal of Nutrition. 2009 Dec;102(12):1803-10.
- Liu Z, Guo Y, Zheng C. Type 2 diabetes mellitus related sarcopenia: a type of muscle loss distinct from sarcopenia and disuse muscle atrophy. Frontiers in Endocrinology. 2024 May 24;15:1375610.
- Bowen KJ, Harris WS, Kris-Etherton PM. Omega-3 fatty acids and cardiovascular disease: are there benefits?. Current Treatment Options in Cardiovascular Medicine. 2016 Nov;18:1-6.
- Aung T, Halsey J, Kromhout D, Gerstein HC, Marchioli R, Tavazzi L, Geleijnse JM, Rauch B, Ness A, Galan P, Chew EY. Associations of omega-3 fatty acid supplement use with cardiovascular disease risks: meta-analysis of 10 trials involving 77 917 individuals. JAMA Cardiology. 2018 Mar 1;3(3):225-33.
- Watanabe Y, Tatsuno I. Omega-3 polyunsaturated fatty acids for cardiovascular diseases: present, past and future. Expert Review of Clinical Pharmacology. 2017 Aug 3;10(8):865-73.
- Chen YD, Raffel LJ, Buchanan TA. Adiposity-independent effects of aging on insulin sensitivity and clearance in mice and humans. Obesity. 2019 Mar;27(3):434-43.
- Brown TJ, Brainard J, Song F, Wang X, Abdelhamid A, Hooper L. Omega-3, omega-6, and total dietary polyunsaturated fat for prevention and treatment of type 2 diabetes mellitus: systematic review and meta-analysis of randomised controlled trials. BMJ. 2019 Aug 21;366.
- Johnston LW, Harris SB, Retnakaran R, Giacca A, Liu Z, Bazinet RP, Hanley AJ. Association of NEFA composition with insulin sensitivity and beta cell function in the Prospective Metabolism and Islet Cell Evaluation (PROMISE) cohort. Diabetologia. 2018 Apr;61:821-30.
- Jiang S, Yang W, Li Y, Feng J, Miao J, Shi H, Xue H. Monounsaturated and polyunsaturated fatty acids concerning prediabetes and type 2 diabetes mellitus risk among participants in the National Health and Nutrition Examination Surveys (NHANES) from 2005 to March 2020. Frontiers in Nutrition. 2023 Nov 24;10:1284800.
- Serra MC, Ryan AS, Hafer-Macko CE, Yepes M, Nahab FB, Ziegler TR. Dietary and serum Omega-6/Omega-3 fatty acids are Associated with Physical and metabolic function in stroke survivors. Nutrients. 2020 Mar 6;12(3):701.
- Shetty SS, Shetty PK. ω-6/ω-3 fatty acid ratio as an essential predictive biomarker in the management of type 2 diabetes mellitus. Nutrition. 2020 Nov 1;79:110968.
- Sheppard KW, Cheatham CL. Omega-6/omega-3 fatty acid intake of children and older adults in the US: dietary intake in comparison to current dietary recommendations and the Healthy Eating Index. Lipids in Health and Disease. 2018 Dec;17:1-2.
- Egalini F, Guardamagna O, Gaggero G, Varaldo E, Giannone B, Beccuti G, Benso A, Broglio F. The effects of omega 3 and omega 6 fatty acids on glucose metabolism: An updated review. Nutrients. 2023 Jun 8;15(12):2672.
- Simopoulos AP. An increase in the omega-6/omega-3 fatty acid ratio increases the risk for obesity. Nutrients. 2016 Mar 2;8(3):128.
- Albert BB, Derraik JG, Brennan CM, Biggs JB, Smith GC, Garg ML, Cameron-Smith D, Hofman PL, Cutfield WS. Higher omega-3 index is associated with increased insulin sensitivity and more favourable metabolic profile in middle-aged overweight men. Scientific Reports. 2014 Oct 21;4(1):6697.
- Petersen KS, Maki KC, Calder PC, Belury MA, Messina M, Kirkpatrick CF, Harris WS. Perspective on the health effects of unsaturated fatty acids and commonly consumed plant oils high in unsaturated fat. British Journal of Nutrition. 2024 Sep 24:1-2.
- Oh YS, Bae GD, Baek DJ, Park EY, Jun HS. Fatty acid-induced lipotoxicity in pancreatic beta-cells during development of type 2 diabetes. Frontiers in Endocrinology. 2018 Jul 16;9:384.
- Keane DC, Takahashi HK, Dhayal S, Morgan NG, Curi R, Newsholme P. Arachidonic acid actions on functional integrity and attenuation of the negative effects of palmitic acid in a clonal pancreatic β-cell line. Clinical Science. 2011 Mar 1;120(5):195-206.
- Qian F, Korat AA, Malik V, Hu FB. Metabolic effects of monounsaturated fatty acid–enriched diets compared with carbohydrate or polyunsaturated fatty acid–enriched diets in patients with type 2 diabetes: a systematic review and meta-analysis of randomized controlled trials. Diabetes Care. 2016 Aug 1;39(8):1448-57.
- Bowden Davies KA, Sprung VS, Norman JA, Thompson A, Mitchell KL, Halford JC, Harrold JA, Wilding JP, Kemp GJ, Cuthbertson DJ. Short-term decreased physical activity with increased sedentary behaviour causes metabolic derangements and altered body composition: effects in individuals with and without a first-degree relative with type 2 diabetes. Diabetologia. 2018 Jun;61(6):1282-94.
- Carbone S, Del Buono MG, Ozemek C, Lavie CJ. Obesity, risk of diabetes and role of physical activity, exercise training and cardiorespiratory fitness. Progress in Cardiovascular Diseases. 2019 Jul 1;62(4):327-33.
- Ye J, Yin J. Type 2 diabetes: a sacrifice program handling energy surplus. Life Metabolism. 2024 Dec;3(6):loae033.
- Zeng X, Ji QP, Jiang ZZ, Xu Y. The effect of different dietary restriction on weight management and metabolic parameters in people with type 2 diabetes mellitus: a network meta-analysis of randomized controlled trials. Diabetology & Metabolic Syndrome. 2024 Oct 28;16(1):254.
- Schwingshackl L, Chaimani A, Hoffmann G, Schwedhelm C, Boeing H. A network meta-analysis on the comparative efficacy of different dietary approaches on glycaemic control in patients with type 2 diabetes mellitus. European Journal of Epidemiology. 2018 Feb;33:157-70.
Figure 1.
Data Processing and Analysis Overview.
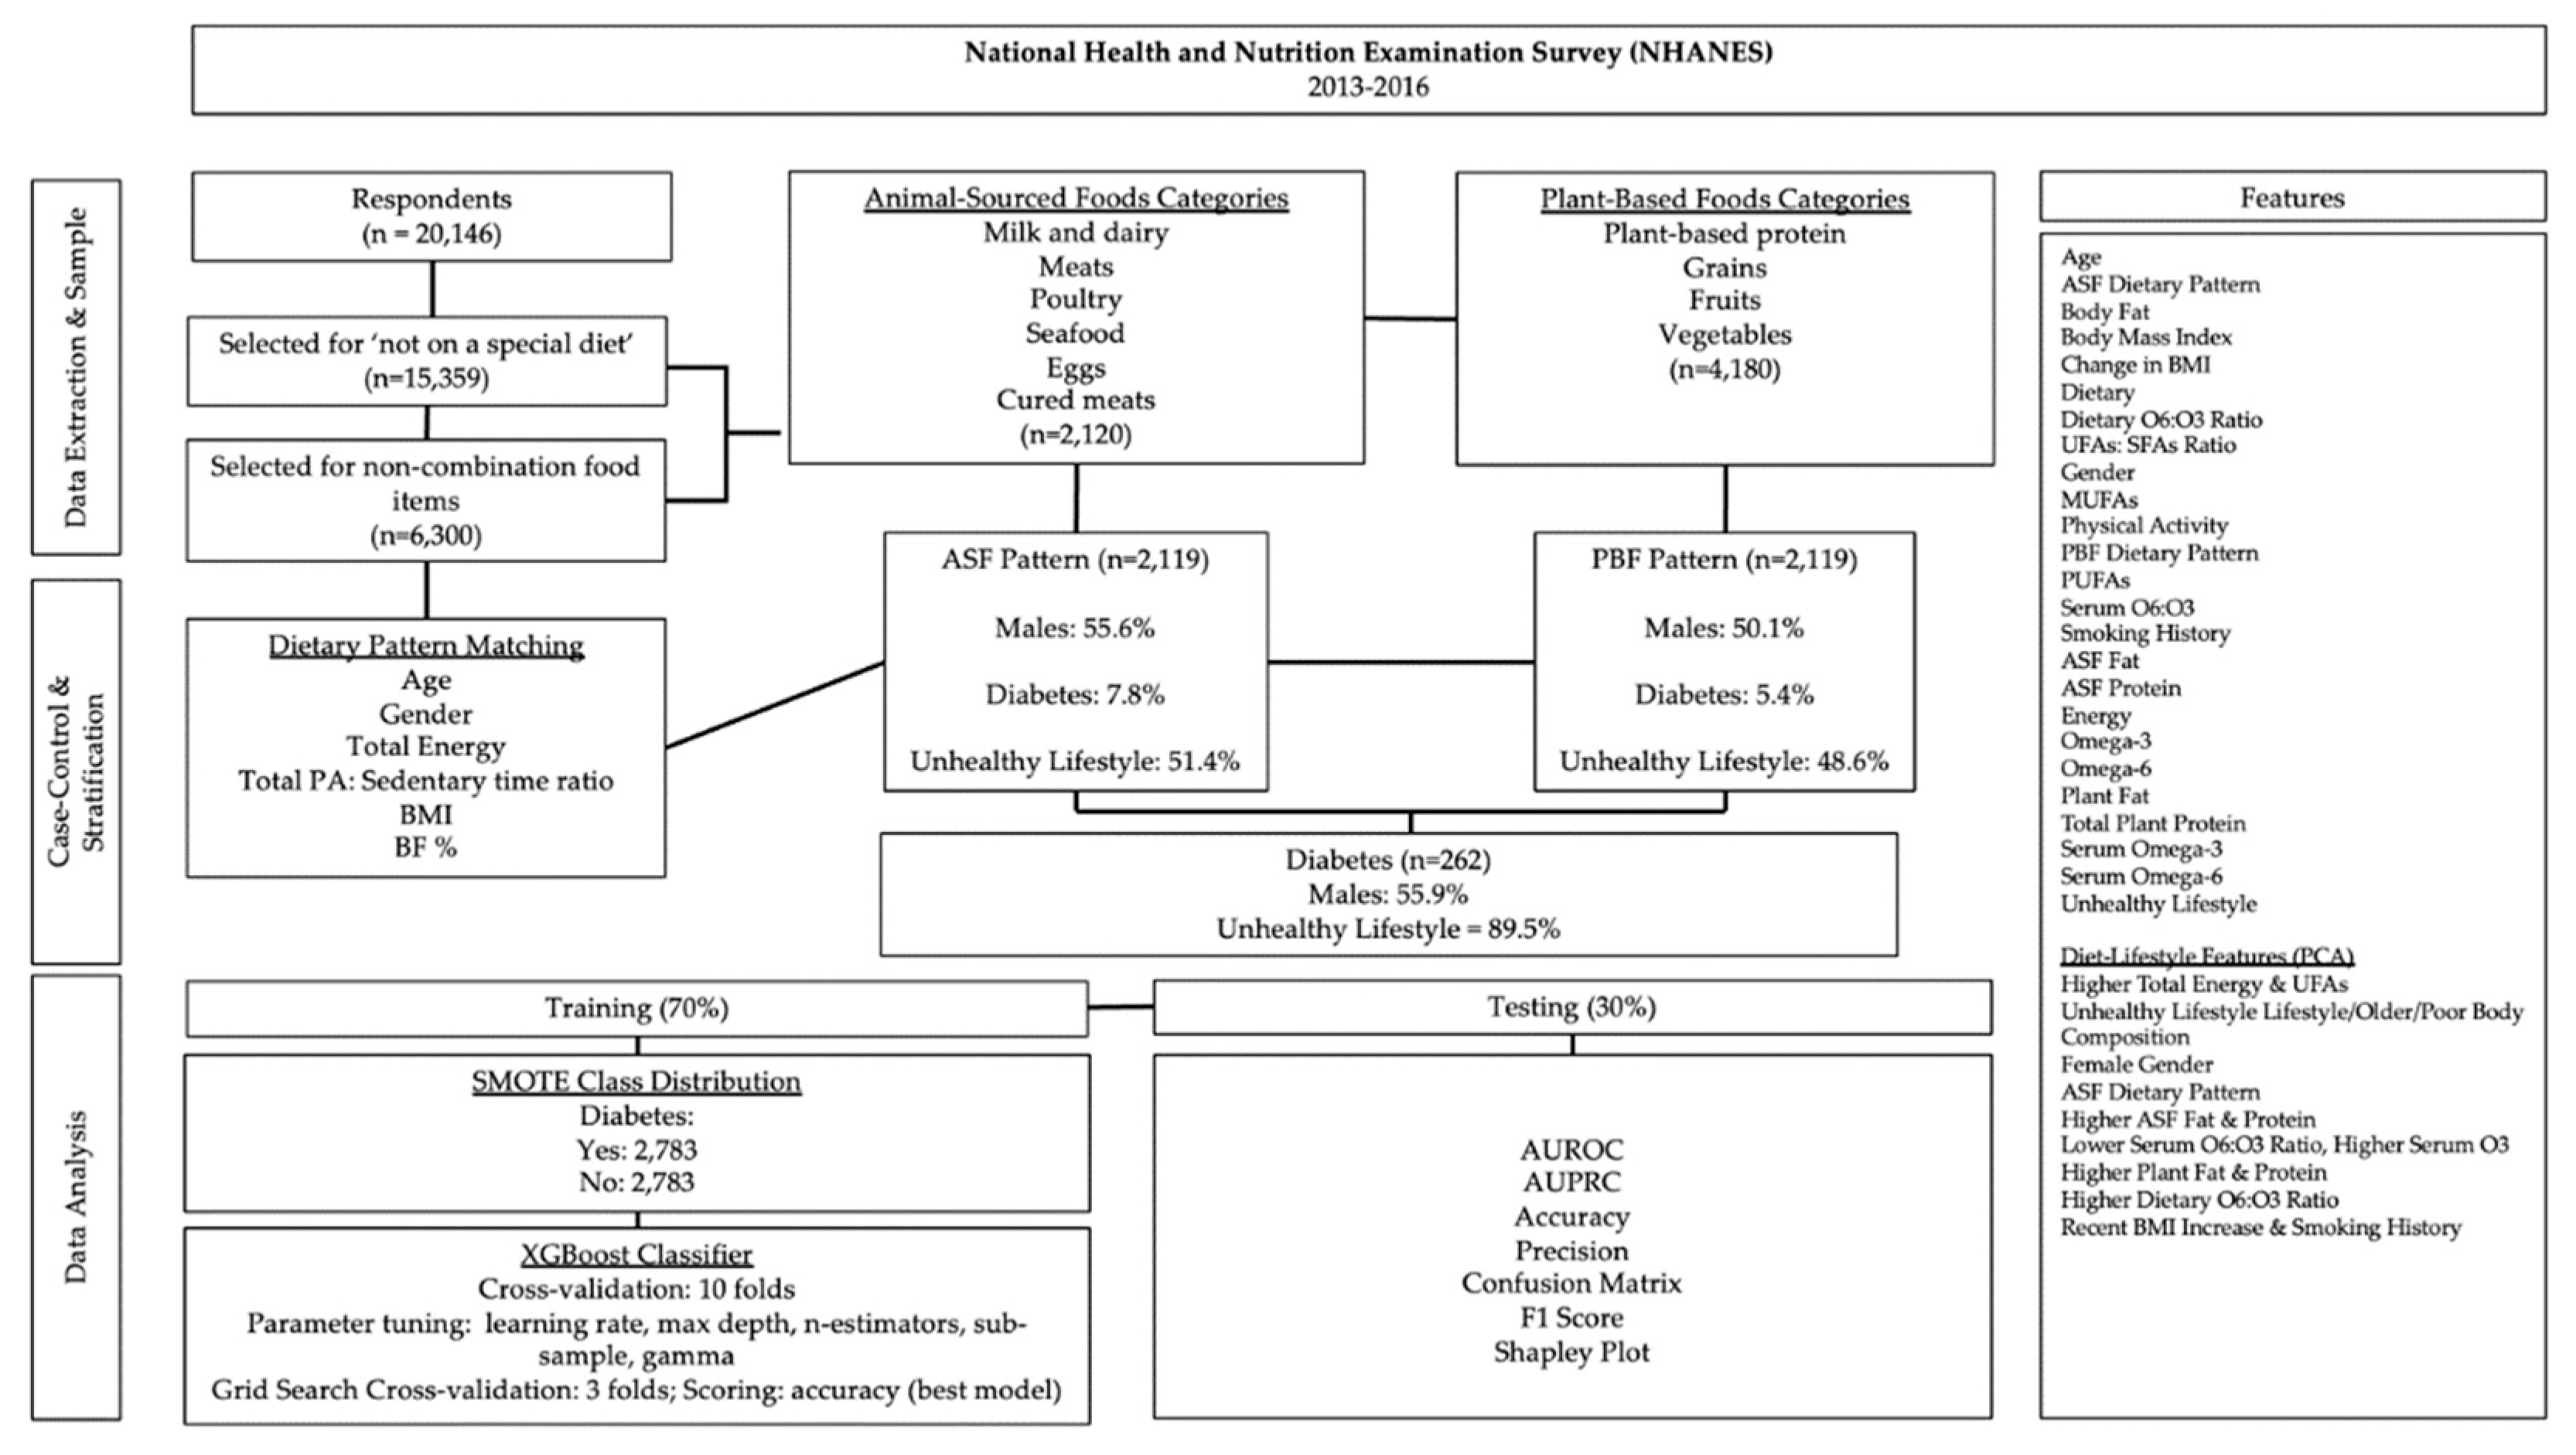
Figure 2.
Variance inflation factors for diabetes predictors. Predictors were standardized (Z).
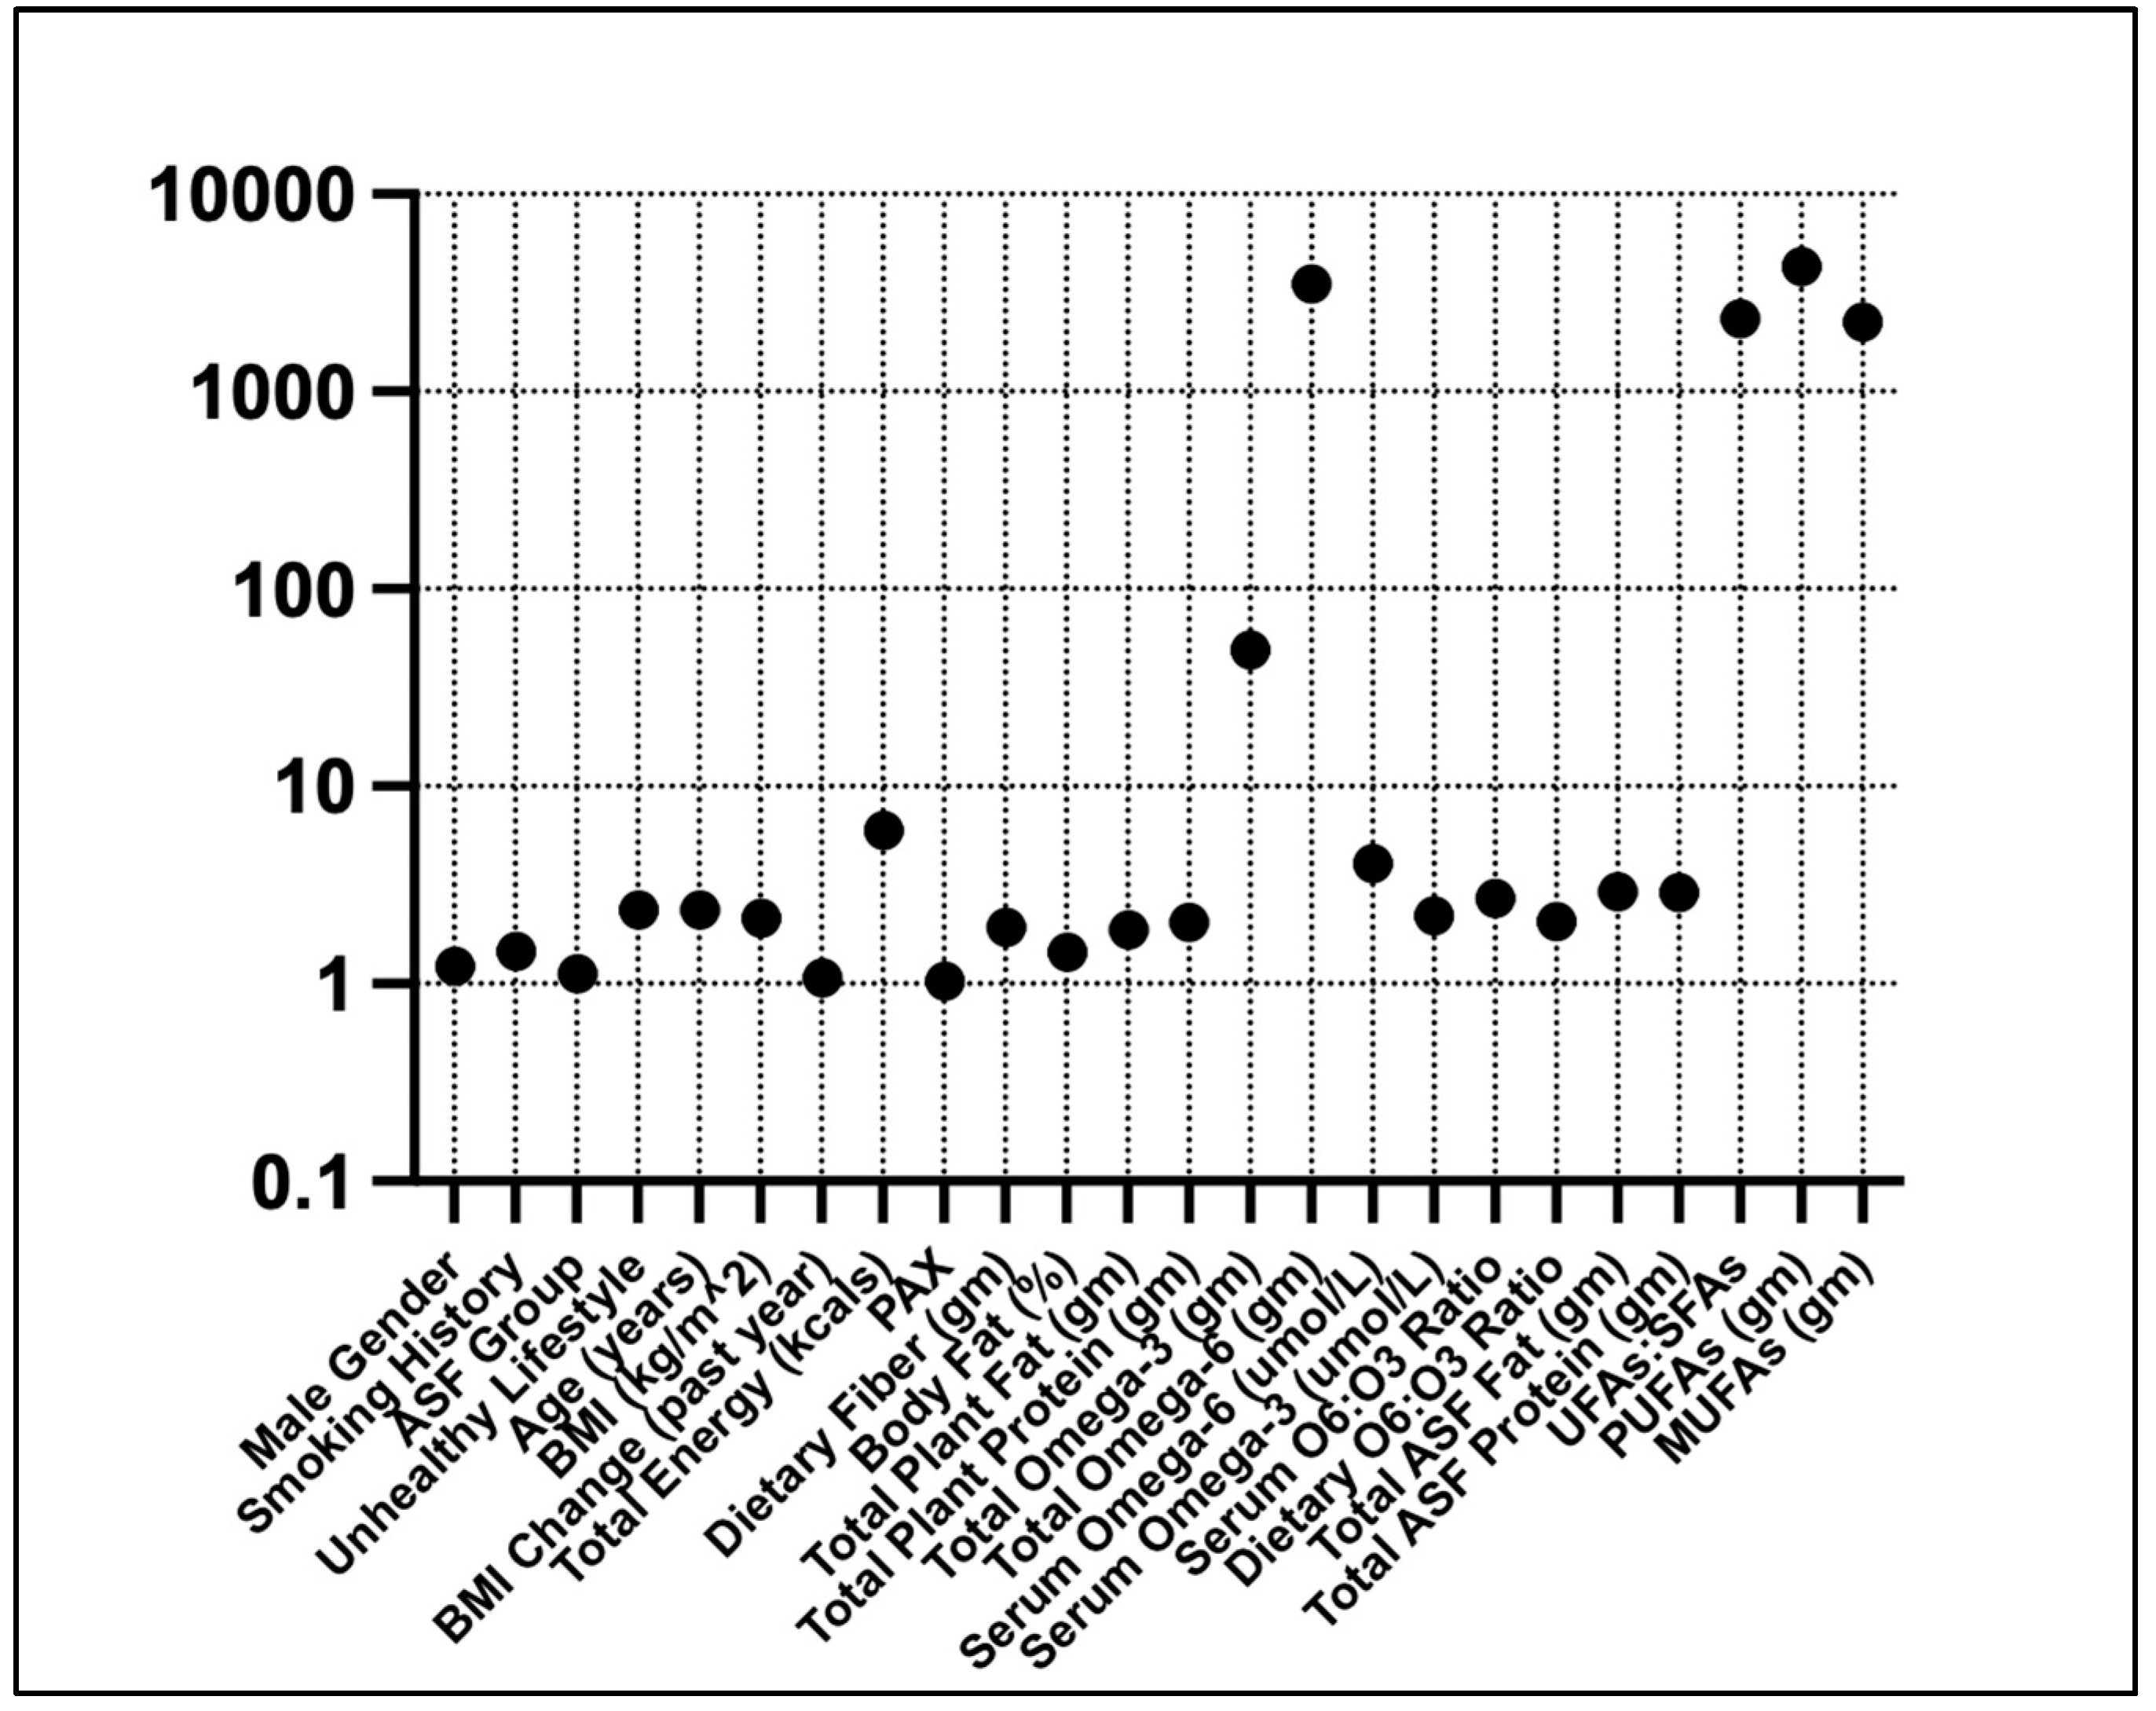
Figure 3.
Confusion matrix (top), ROC curve (middle), and PRC (bottom) curve for the XGBoost classifier model.
Figure 3.
Confusion matrix (top), ROC curve (middle), and PRC (bottom) curve for the XGBoost classifier model.
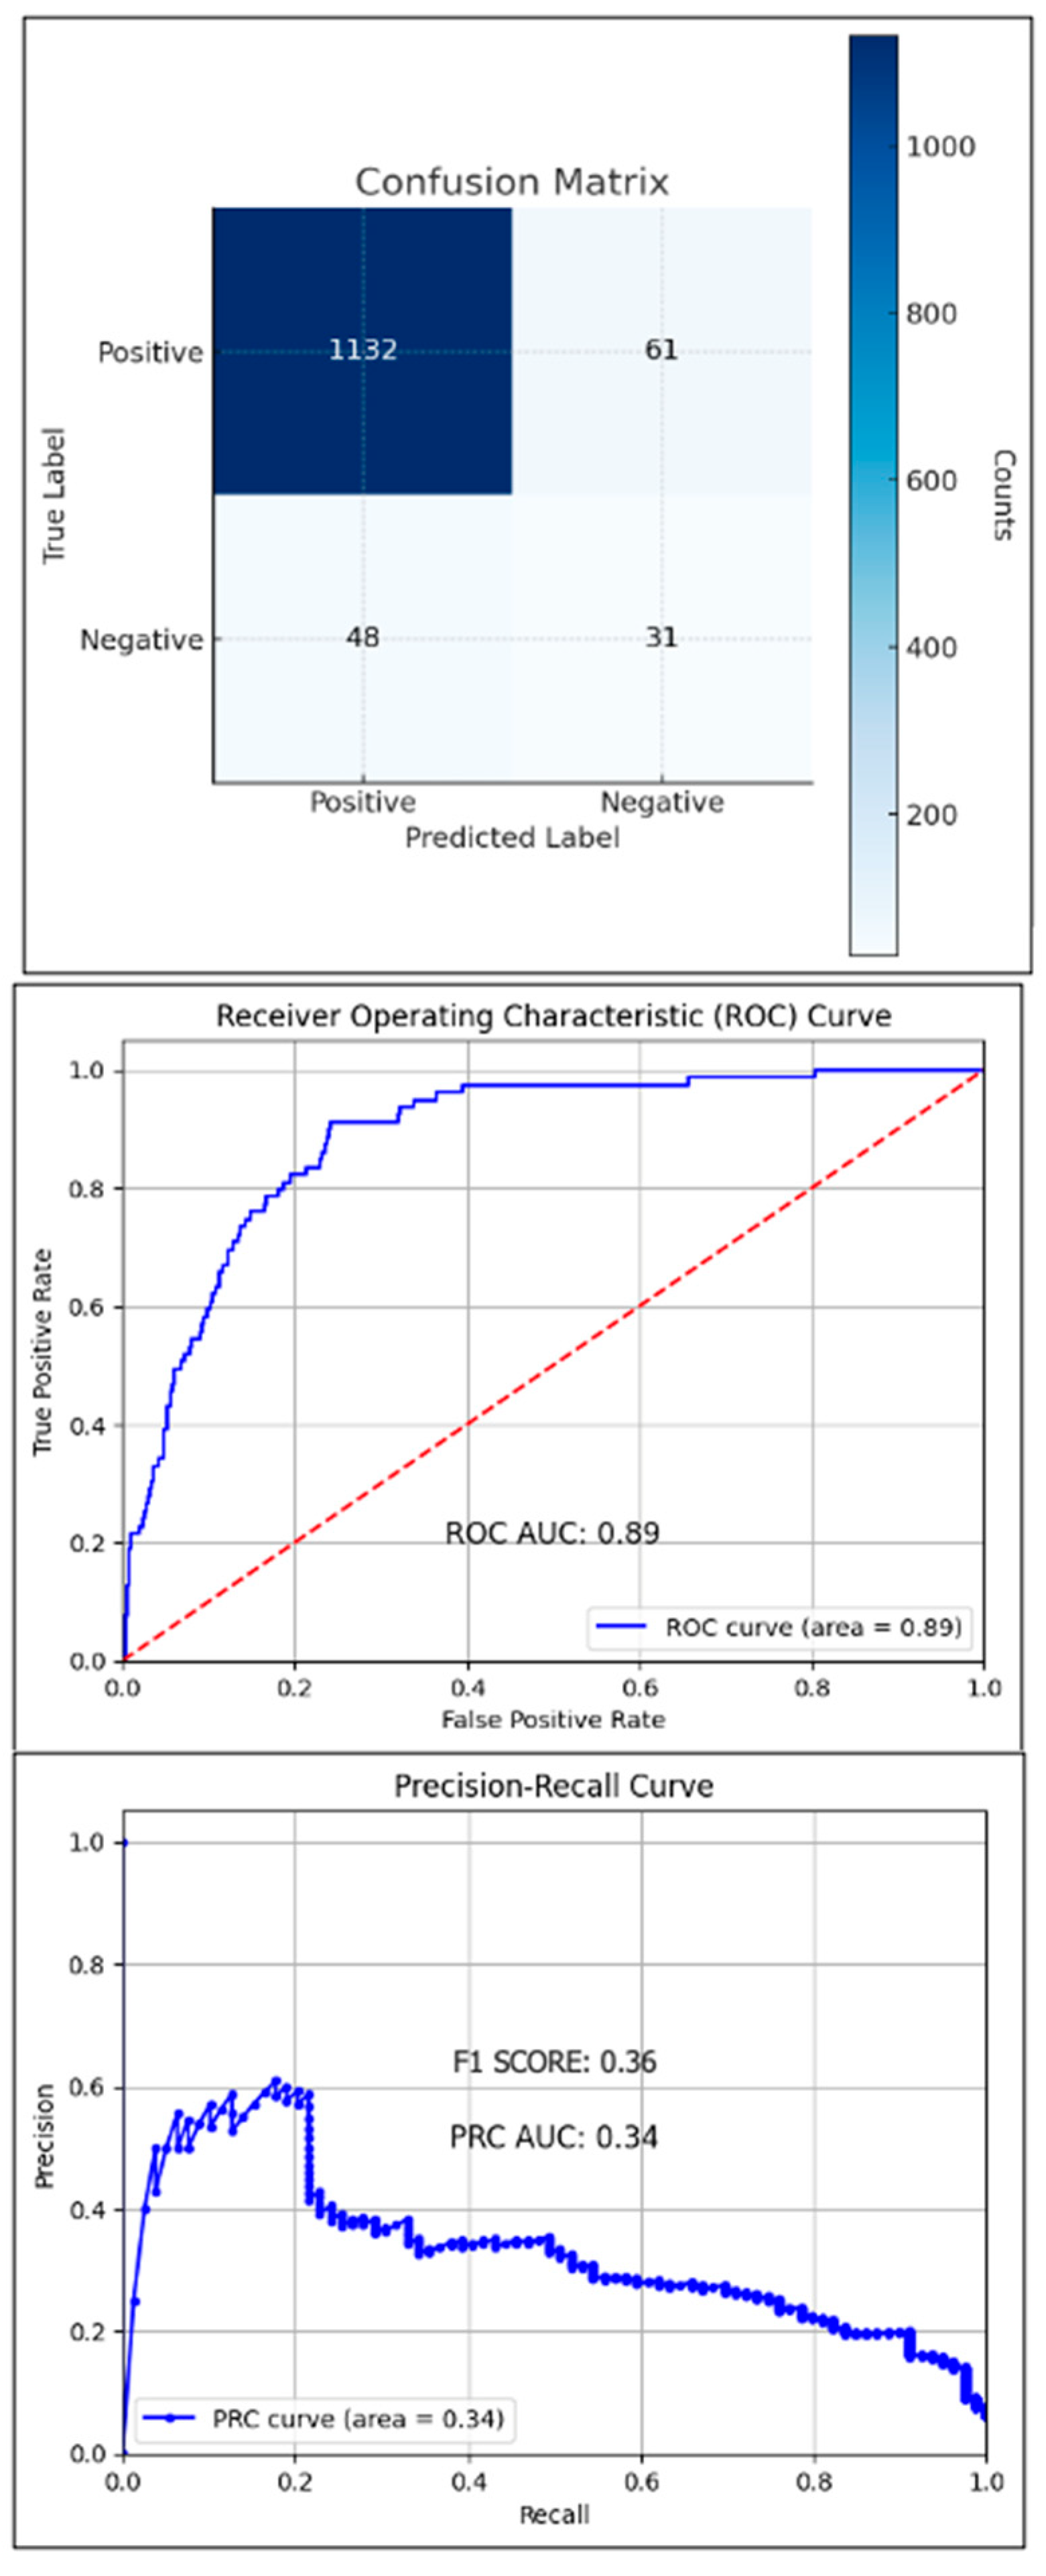
Figure 4.
SHAP beeswarm plot ranking the top 20 features by their importance in predicting diabetes history. Features on the y-axis increase in magnitude from left to right. Pink data points have a higher impact on prediction; blue data points have a negative impact on prediction. *PCA-engineered feature; data points represent regression factor scores. Higher scores indicate a stronger association with the feature.
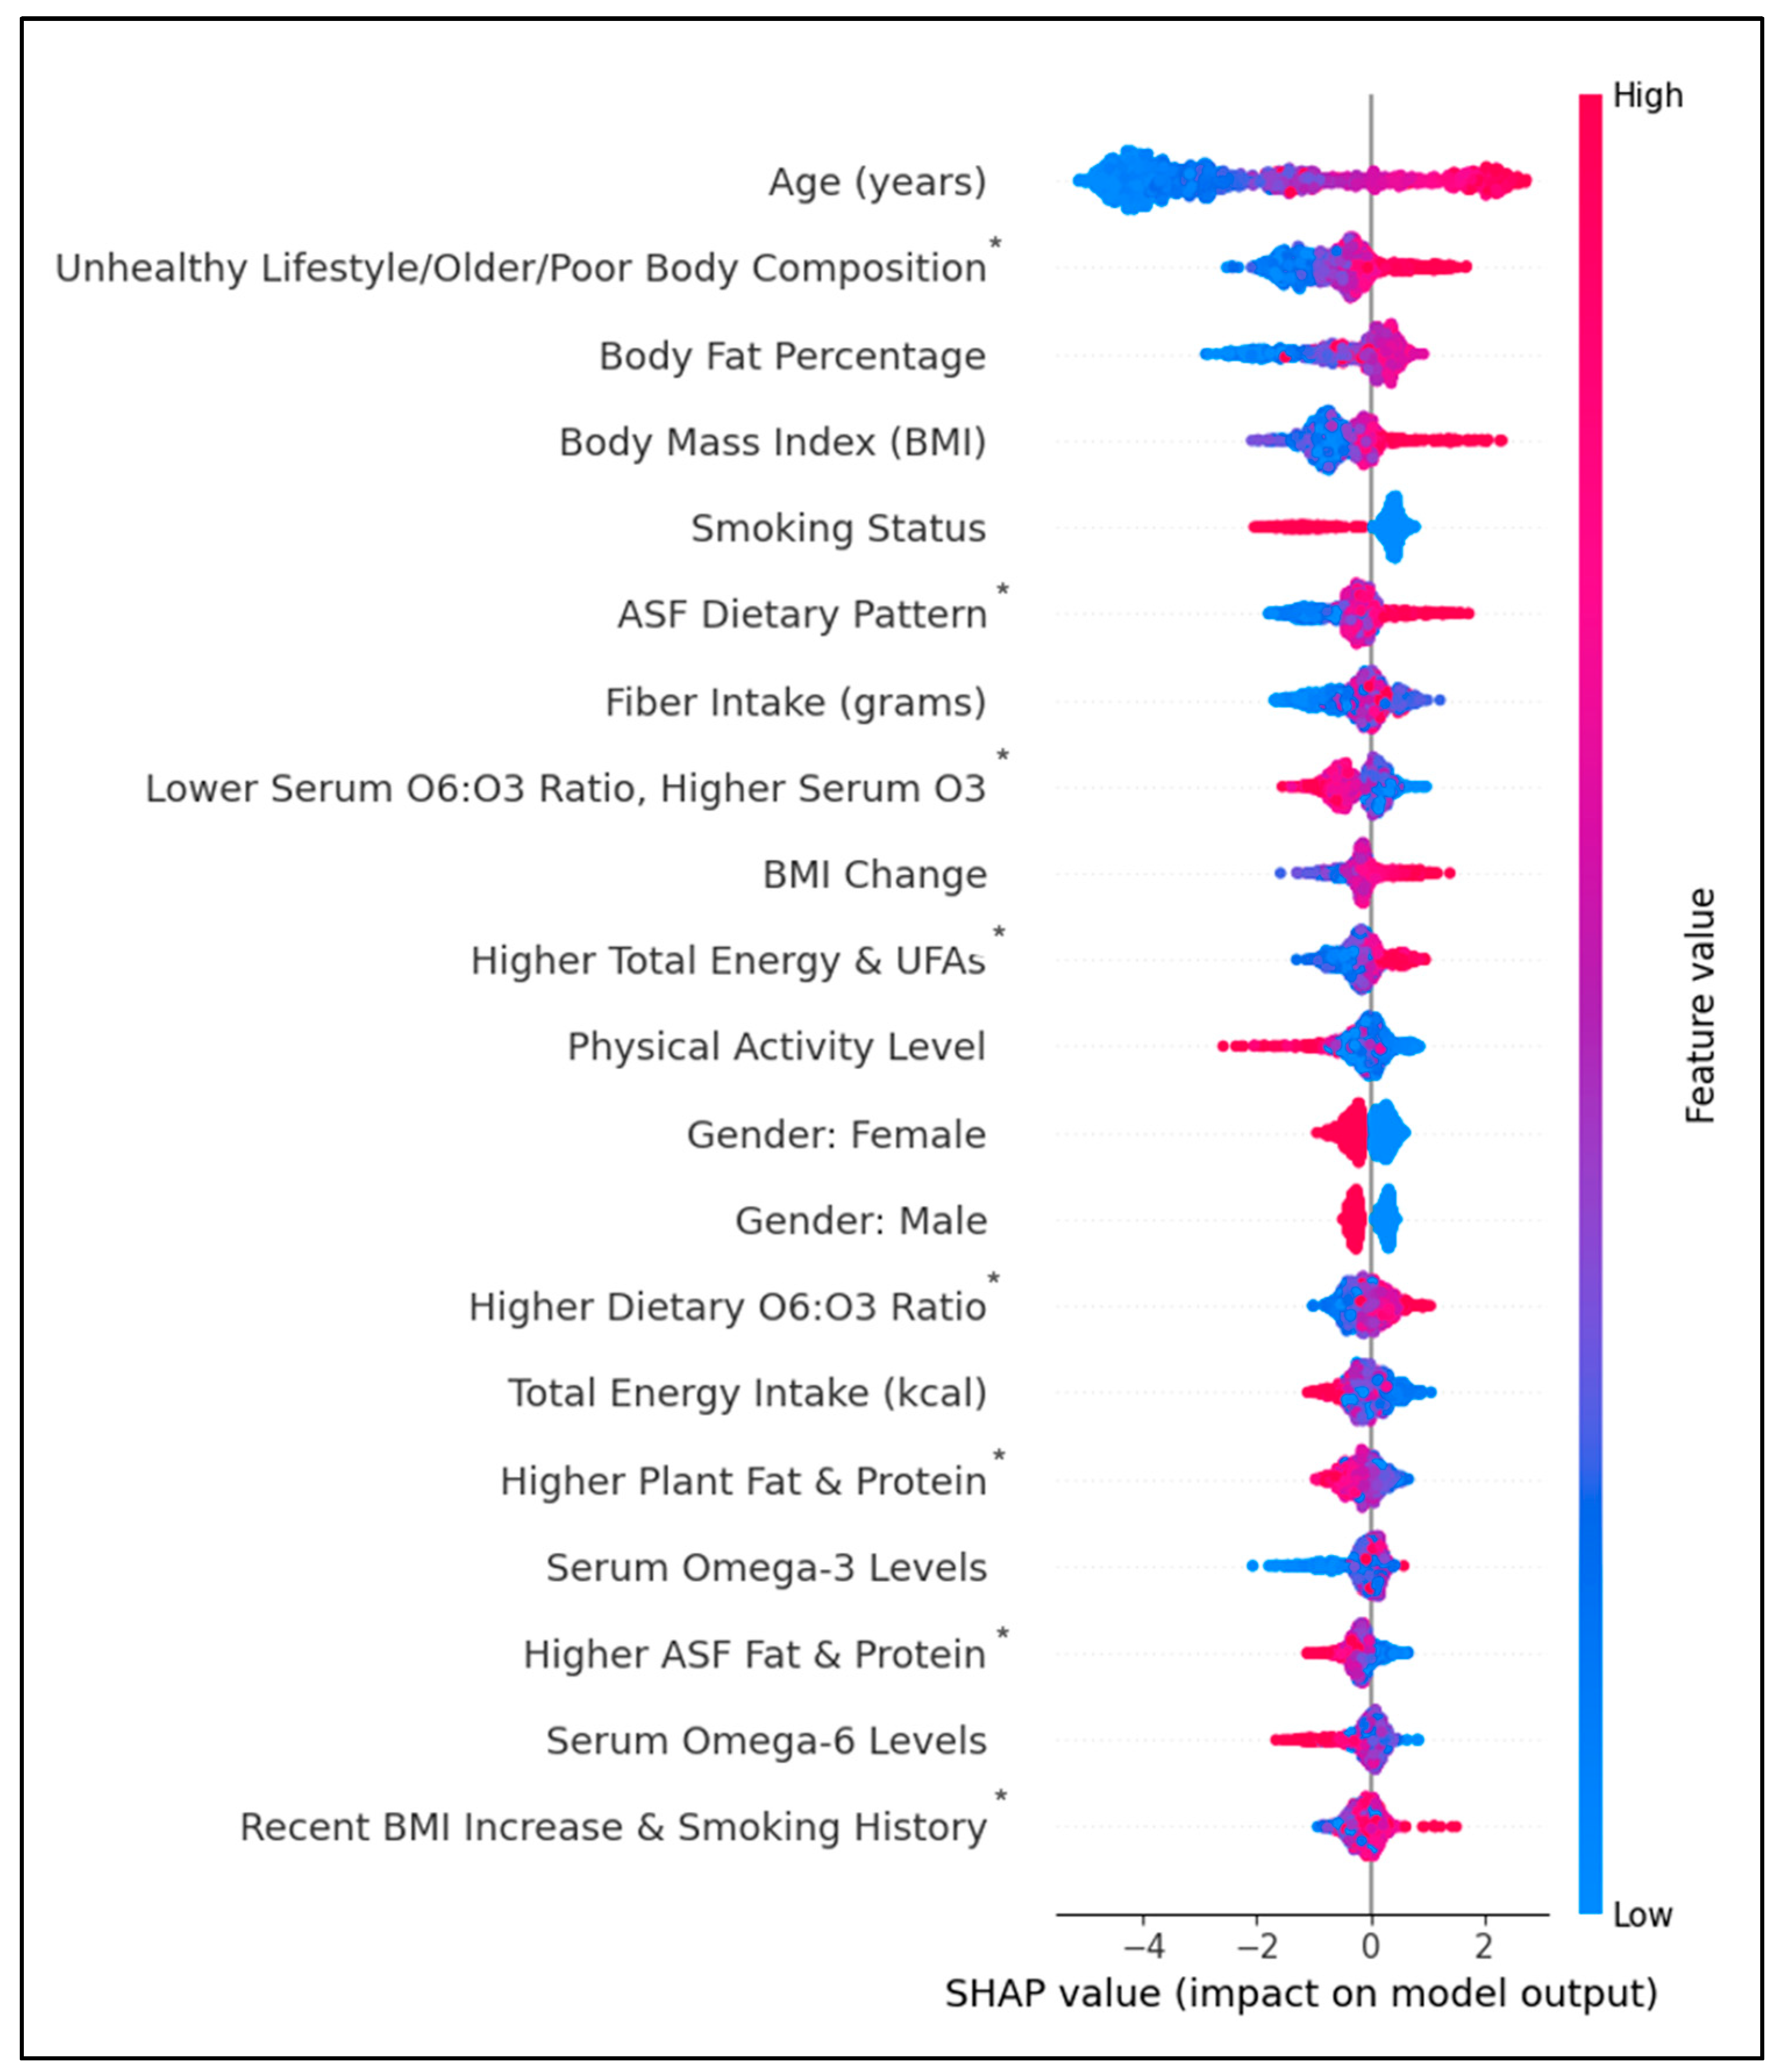

Table 1.
Descriptive estimates by dietary pattern.
| PBF Pattern (n = 2,119) | ASF Pattern (n = 2,119) | ||||
| Median | IQR | Median | IQR | Median Diff. (ASF / PBF) |
|
| Age (yrs.) | 45 | 31 | 43 | 30 | 0.96 |
| Alpha-Linolenic acid (18:3n-3) (umol/L) | 64.1 | 38.6 | 69 | 42.9 | 1.08 |
| Arachidonic acid (20:4n-6) (umol/L) | 711 | 298 | 754 | 290 | 1.06 |
| ASF MUFAs (gm) | . | . | 8.04 | 9.46 | . |
| ASF PUFAs (gm) | . | . | 3.52 | 4.74 | . |
| BMI Change (past year) | -0.68 | 2.56 | -0.94 | -0.936 | 1.38 |
| Body Mass Index (kg/m2) | 27.3 | 7.7 | 28 | 8.4 | 1.03 |
| Carbohydrate (gm) | 244.94 | 136.45 | 227.07 | 145.38 | 0.93 |
| Cholesterol (mg) | 205 | 189 | 444 | 371 | 2.17 |
| Dietary fiber (gm) | 16 | 11 | 14.3 | 11.2 | 0.89 |
| Direct HDL-Cholesterol (mg/dL) | 52 | 19 | 51 | 20 | 0.98 |
| Docosahexaenoic acid (22:6n-3) (umol/L) | 117 | 62.9 | 120 | 78 | 1.03 |
| Eicosapentaenoic acid (20:5n-3) (umol/L) | 35.8 | 32.8 | 41.5 | 33.4 | 1.16 |
| Glycohemoglobin (%) | 5.3 | 8.41 | 5.4 | 8.66 | 1.02 |
| UFAs: SFAs Ratio | 22.97 | 17.11 | 27.31 | 20.42 | 1.19 |
| HS C-Reactive Protein (mg/L) | 1.3 | 3.8 | 1.3 | 3.1 | 1 |
| Insulin (uU/mL) | 8.38 | 8.66 | 8.82 | 8.6 | 1.05 |
| LDL-cholesterol (mg/dL) | 103 | 48 | 107 | 53 | 1.04 |
| Linoleic acid (18:2n-6) (umol/L) | 3,140.00 | 1,070.00 | 3,210.00 | 980 | 1.02 |
| Plant MUFAs (gm) | 1.65 | 3.58 | 2.16 | 5.194 | 1.31 |
| Plant PUFAs (gm) | 2.09 | 3.5 | 2.18 | 3.902 | 1.05 |
| Plant Total Energy (kcals) | 277 | 158 | 378 | 416 | 1.36 |
| Plant Total Fat (gm) | 6.05 | 11.9 | 7.06 | 14.9 | 1.17 |
| Protein (gm) | 76.52 | 45.54 | 87.69 | 52.32 | 1.15 |
| Ratio of ASF kcals to Total kcals | . | . | 0.2136 | 0.1866 | . |
| Ratio of Dietary O6 to O3 | 9.01 | 3.64 | 9.07 | 3.35 | 1.01 |
| Ratio of Plant kcals to Total kcals | 0.1735 | 0.2211 | 0.1781 | 0.1984 | 1.03 |
| Ratio of Serum O6 to O3 | 14.34 | 5.19 | 13.91 | 4.33 | 0.97 |
| Ratio of Total Physical Activity to Sedentary Time (mins) | 0.048 | 0.218 | 0.05 | 0.2 | 1.04 |
| Total Cholesterol (mg/dL) | 178 | 54 | 187 | 55 | 1.05 |
| Total Energy (kcal) | 2016 | 1087 | 2158 | 1078 | 1.07 |
| Total Fat (gm) | 72.54 | 52.31 | 86.76 | 58.61 | 1.2 |
| Total Monounsaturated Fatty Acids (gm) |
24.34 | 19.41 | 30.492 | 21.124 | 1.25 |
| Total MUFAs (gm) | 2.16 | 5.2 | 7.942 | 9.36 | 3.68 |
| Total Omega-3 (gm) | 1.562 | 1.42 | 1.749 | 1.528 | 1.12 |
| Total Omega-6 (gm) | 14.514 | 12.15 | 16.736 | 13.013 | 1.15 |
| Total Percent Body Fat | 32 | 12.6 | 30.9 | 13.5 | 0.97 |
| Total Polyunsaturated Fatty Acids (gm) | 16.422 | 13.63 | 18.656 | 14.732 | 1.14 |
| Total PUFAs (gm) | 2.19 | 3.9 | 3.285 | 4.8 | 1.5 |
| Total Serum Omega 3 (mmol/L) | 304.78 | 164.95 | 308.45 | 151.03 | 1.01 |
| Total Serum Omega 6 (mmol/L) | 4391.6 | 1425.1 | 4302.2 | 1416.6 | 0.98 |
| Triglycerides (mg/dL) | 89 | 72 | 88 | 83 | 0.99 |
Table 2.
Descriptive estimates by disease status.
| No Diabetes (n = 3,976) | Diabetes (n = 262) | Median Diff. | |||
| Median | IQR | Median | IQR | (Diabetes / No Diabetes) | |
| Age (yrs.) | 28 | 41 | 59 | 17 | 2.107 |
| Alpha-Linolenic acid (18:3n-3) (umol/L) | 64.6 | 38.7 | 68.4 | 53.6 | 1.05 |
| Arachidonic acid (20:4n-6) (umol/L) | 722 | 295 | 743 | 364 | 1.03 |
| ASF MUFAs (gm) | 8.036 | 9.746 | 8.558 | 7.192 | 1.06 |
| ASF PUFAs (gm) | 3.489 | 5.103 | 3.955 | 3.399 | 1.13 |
| BMI Change (past year) | -0.84 | 2.75 | -0.07 | 3.93 | 0.083 |
| Body Mass Index (kg/m2) | 24.5 | 9.7 | 31.3 | 20.3 | 1.278 |
| Carbohydrate (gm) | 239.26 | 142.12 | 201.97 | 117.57 | 0.844 |
| Cholesterol (mg) | 268 | 332 | 319 | 381 | 1.19 |
| Dietary Fiber (gm) | 12.9 | 11.9 | 12.3 | 22.7 | 0.953 |
| Direct HDL-Cholesterol (mg/dL) | 52 | 18 | 49 | 21 | 0.942 |
| Docosahexaenoic acid (22:6n-3) (umol/L) | 118 | 68.6 | 129 | 73.1 | 1.09 |
| Eicosapentaenoic acid (20:5n-3) (umol/L) | 36.5 | 33.1 | 44.3 | 37.2 | 1.21 |
| Energy (kcal) | 1,958.00 | 878 | 2,115.00 | 2,120.00 | 1.08 |
| Glycohemoglobin (%) | 5.3 | 0.5 | 6.6 | 1.9 | 1.245 |
| UFAs: SFAs Ratio | 24.78 | 18.93 | 27.56 | 20.43 | 1.112 |
| HS C-Reactive Protein (mg/L) | 1.1 | 2.9 | 3.3 | 5.8 | 3 |
| Insulin (uU/mL) | 8.3 | 7.8 | 12 | 12.26 | 1.446 |
| LDL-cholesterol (mg/dL) | 102 | 49 | 92 | 44 | 0.902 |
| Linoleic acid (18:2n-6) (umol/L) | 3,150.00 | 1,030.00 | 3,210.00 | 1,260.00 | 1.01 |
| Plant MUFAs (gm) | 2.066 | 5.012 | 3.38 | 9.228 | 1.63 |
| Plant PUFAs (gm) | 2.057 | 3.895 | 3.307 | 6.046 | 1.6 |
| Ratio of ASF kcals to Total kcals | 0.2115 | 0.1868 | 0.2283 | 0.1979 | 1.07 |
| Ratio of Dietary O6 to O3 | 9.5 | 3.37 | 9.41 | 1.44 | 0.991 |
| Ratio of Plant kcals to Total kcals | 0.1716 | 0.1965 | 0.2289 | 0.2578 | 1.33 |
| Ratio of Serum O6 to O3 | 14.95 | 5.19 | 13.71 | 2.7 | 0.917 |
| Ratio of Total Physical Activity to Sedentary Time (mins) | 0.071 | 0.25 | 0 | 0.08 | 0 |
| Total ASF Fat (gm) | 24.72 | 22.58 | 19.69 | 5.52 | 0.797 |
| Total ASF Protein (gm) | 28.28 | 32.82 | 36.68 | 33.68 | 1.297 |
| Total fat (gm) | 78.85 | 53.6 | 74.42 | 56.2 | 0.944 |
| Total Monounsaturated Fatty acids (gm) | 26.68 | 18.48 | 32.98 | 34.44 | 1.236 |
| Total Omega-3 (gm) | 1.46 | 1.34 | 1.57 | 1.27 | 1.07 |
| Total Omega-6 (gm) | 13.89 | 11.84 | 14.5 | 12.74 | 1.04 |
| Total Plant Fat (gm) | 8.23 | 11.93 | 16.15 | 21.12 | 1.962 |
| Total Plant Protein (gm) | 8.14 | 8.6 | 8.22 | 20.48 | 1.01 |
| Total Polyunsaturated Fatty Acids (gm) | 15.52 | 13.46 | 24.16 | 13.61 | 1.557 |
| Total Serum Omega-3 (mmol/L) | 291.55 | 124.23 | 359.42 | 155.73 | 1.233 |
| Total Serum Omega-6 (mmol/L) | 4,166.40 | 1,081.60 | 4,966.70 | 439.7 | 1.192 |
| Triglycerides (mg/dL) | 81 | 68 | 90 | 80 | 1.111 |
Table 3.
Pattern matrix for nine principal components, explaining over 77% of the variance in diabetes history. The table values are regression coefficients that reflect the unique contribution of each variable to the component. Components were rotated via direct oblimin (Δ=0).
Table 3.
Pattern matrix for nine principal components, explaining over 77% of the variance in diabetes history. The table values are regression coefficients that reflect the unique contribution of each variable to the component. Components were rotated via direct oblimin (Δ=0).
| Factor 1 | Factor 2 | Factor 3 | Factor 4 | Factor 5 | Factor 6 | Factor 7 | Factor 8 | Factor 9 | |
|---|---|---|---|---|---|---|---|---|---|
| Variance Explained (%) | 23.26 | 10.71 | 8.66 | 7.9 | 6.85 | 6.05 | 5.87 | 4.23 | 4.18 |
| Higher Total Energy & UFAs | Unhealthy Lifestyle, Older, & Poor Body Composition | Female Gender | ASF Dietary Pattern | Higher ASF Fat & Protein | Lower Serum O6:O3 Ratio, Higher O3 | Higher Plant Fat & Protein | Higher Dietary O6:O3 Ratio | Recent BMI Increase & Smoking History | |
| PUFAs (gm) | 0.96 | -0.01 | 0.04 | 0.00 | -0.01 | -0.01 | -0.01 | 0.03 | -0.02 |
| Total Omega-6 (gm) | 0.96 | -0.01 | 0.04 | 0.00 | -0.01 | -0.01 | -0.01 | 0.07 | -0.02 |
| UFAs: SFAs | 0.92 | 0.03 | -0.03 | 0.06 | 0.04 | 0.00 | 0.00 | 0.10 | 0.01 |
| MUFAs (gm) | 0.91 | 0.02 | -0.03 | 0.07 | 0.04 | 0.00 | 0.00 | 0.10 | 0.01 |
| Total Energy (kcals) | 0.88 | 0.01 | -0.10 | -0.04 | 0.03 | -0.01 | 0.01 | 0.01 | 0.03 |
| Total Omega-3 (gm) | 0.86 | 0.01 | 0.05 | 0.01 | 0.01 | 0.01 | 0.00 | -0.35 | -0.01 |
| Dietary Fiber (gm) | 0.61 | 0.03 | -0.05 | -0.23 | -0.12 | 0.06 | 0.18 | -0.10 | 0.02 |
| Unhealthy Lifestyle | 0.02 | 0.85 | 0.04 | 0.00 | 0.01 | 0.02 | 0.00 | 0.00 | -0.03 |
| Age (years) | 0.02 | 0.84 | -0.02 | -0.04 | -0.02 | 0.06 | 0.05 | -0.02 | 0.13 |
| Body Mass Index | 0.06 | 0.77 | 0.03 | 0.01 | 0.00 | 0.00 | 0.00 | -0.02 | -0.32 |
| Smoking History | -0.01 | 0.69 | -0.15 | 0.08 | 0.05 | -0.04 | -0.03 | 0.04 | 0.30 |
| Female | 0.00 | -0.02 | 0.99 | 0.00 | 0.01 | 0.00 | 0.00 | 0.01 | 0.04 |
| Male | 0.00 | 0.02 | -0.99 | 0.00 | -0.01 | 0.00 | 0.00 | -0.01 | -0.04 |
| ASF Dietary Pattern | 0.01 | 0.00 | 0.00 | 0.99 | -0.01 | 0.01 | 0.01 | -0.02 | 0.00 |
| PBF Dietary Pattern | -0.01 | 0.00 | 0.00 | -0.99 | 0.01 | -0.01 | -0.01 | 0.02 | 0.00 |
| Total ASF Fat (gm) | 0.03 | -0.01 | 0.01 | 0.00 | 0.95 | -0.01 | -0.02 | 0.00 | -0.02 |
| Total ASF Protein (gm) | -0.01 | 0.01 | 0.00 | -0.01 | 0.94 | 0.02 | 0.03 | -0.01 | 0.01 |
| Total Serum Omega-3 (umol/L) | -0.02 | 0.00 | 0.00 | 0.03 | 0.02 | 0.96 | 0.01 | 0.01 | -0.01 |
| Serum O6:O3 Ratio | -0.02 | -0.02 | -0.01 | 0.07 | 0.01 | -0.76 | 0.07 | 0.11 | -0.14 |
| Total Serum Omega-6 (umol/L) | 0.02 | 0.00 | -0.02 | 0.09 | 0.00 | 0.64 | 0.06 | 0.15 | -0.20 |
| Total Plant Fat (gm) | 0.03 | -0.03 | 0.02 | 0.04 | -0.09 | -0.01 | 0.91 | 0.02 | 0.01 |
| Total Plant Protein (gm) | -0.03 | 0.04 | -0.02 | -0.01 | 0.11 | 0.00 | 0.90 | -0.02 | 0.00 |
| Dietary O6:O3 Ratio | 0.05 | -0.01 | 0.02 | -0.04 | -0.01 | -0.01 | 0.00 | 0.97 | 0.01 |
| Change in BMI (past year) | 0.01 | 0.04 | 0.10 | -0.01 | -0.01 | 0.01 | 0.01 | 0.02 | 0.85 |
| Body Fat (%) | -0.11 | 0.25 | 0.43 | -0.03 | -0.05 | 0.00 | -0.01 | -0.01 | -0.42 |
| PAX | 0.00 | 0.00 | 0.02 | -0.01 | 0.00 | 0.00 | -0.01 | -0.01 | 0.01 |
Disclaimer/Publisher’s Note: The statements, opinions and data contained in all publications are solely those of the individual author(s) and contributor(s) and not of MDPI and/or the editor(s). MDPI and/or the editor(s) disclaim responsibility for any injury to people or property resulting from any ideas, methods, instructions or products referred to in the content. |
© 2024 by the authors. Licensee MDPI, Basel, Switzerland. This article is an open access article distributed under the terms and conditions of the Creative Commons Attribution (CC BY) license (http://creativecommons.org/licenses/by/4.0/).
Copyright: This open access article is published under a Creative Commons CC BY 4.0 license, which permit the free download, distribution, and reuse, provided that the author and preprint are cited in any reuse.


