
Submitted:
02 July 2025
Posted:
03 July 2025
You are already at the latest version
Abstract
Background: Life expectancy is shaped by a combination of lifestyle and socioeconomic factors. While sugar consumption, body mass index (BMI), and income have been individually linked to health outcomes, their combined effects on longevity—particularly across countries with differing development levels—are less well understood. Objective: This study investigates how sugar intake, BMI, and per capita income interact to influence life expectancy across 187 countries. Methods: We conducted a cross-sectional analysis using national-level data from FAOSTAT, the World Bank, and the World Health Organization for the years 2022–2023. Pearson correlation was used to assess bivariate relationships, and multiple linear regression was employed to estimate the collective impact of BMI, sugar consumption (kg per capita/year), and income (USD) on life expectancy (years). The model was adjusted for confounding variables such as healthcare expenditure, education, and smoking prevalence. Results: Sugar intake was moderately associated with BMI (r = 0.52) and life expectancy (r = 0.50), with p value <0.05 for both with stronger relationships observed in countries with per capita income below USD 10,000. BMI also showed a moderate positive correlation with life expectancy (r = 0.49), but this association weakened—and slightly reversed—for countries with BMI greater than 27 kg/m². The regression model explained 33.9% of the variance in life expectancy (adjusted R² = 0.325), increasing to 61.6% after accounting for structural confounders. Conclusion: BMI and sugar intake are important predictors of life expectancy, with their impact shaped by income level and healthcare infrastructure. The decline in longevity above a BMI threshold of 27 kg/m² highlights a critical point for public health intervention. Integrated strategies targeting obesity, sugar intake, and structural inequities are essential for improving global health outcomes.
Keywords:
sugar intake
; BMI
; per capita income
; life expectancy
; global health
Introduction
Life expectancy reflects the general health and well-being of a population. Higher income generally brings better access to healthcare, education, and nutrition [1,2]. Socioeconomic factors like inequality also shape population health outcomes [3]. Excess sugar intake is tied to weight gain and metabolic issues [4,5]. BMI is a known marker of health risk [6]. Many studies look at each of these factors separately. But how they interact-especially across countries with different levels of development-is less clear. We set out to see how sugar intake, BMI, and income work together to affect life expectancy. Recent systematic reviews underscore the health implications of excessive sugar intake, linking frequent consumption of sugar-sweetened beverages to type 2 diabetes and other metabolic disorders, thereby highlighting sugar’s role as a global dietary risk factor [7,8].
Consumption of sugars in children and adolescents has increased drastically, particularly from sugar enhanced food products.
The World Health Organization recommends that adults and children should limit their daily intake of free sugars to less than 10% of their total energy intake and emphasizes that a reduction below 5% would provide additional health benefits [15]. However, despite differences in the estimation of dietary sugars among countries [16], published data shows that this recommendation is not met in most countries. Higher total and added sugars among 4- to 13-year-old children was noted in China, Mexico and the United States [17–21]. Added-sugar accounted for 16% of total energy intake of 6–11 year old children in the United States [20] and for 12% of the total energy intake of 4–13 year old Mexican children [17]; whereas in European countries the intake of added sugars varies between 11 and 17% of the total dietary energy intake [21–23].
Sugar contributes to the daily energy intake, without providing additional nutritional value. In addition, sugar intake has been associated with numerous negative health outcomes [24] including increased cardiovascular risk factors such as adiposity and dyslipidaemia [25], dental caries [26], and metabolic syndrome [27]. Overconsumption of sugar may represent a threat to children’s mental health as it has been linked to changes in neural systems, altered emotional processing, anxiety and depression [28].
Increased sugar consumption has hence lead to increased prevalence of obesity which is defined as increased body mass index. A body mass index (BMI) over 25 is considered overweight, and over 30 is obese. In 2019, an estimated 5 million noncommunicable disease (NCD) deaths were caused by higher-than-optimal BMI as mentioned by WHO report [29].
Increasing prevalence of obesity, sugar intake has been linked to more affluence and higher purchasing power as noted in the survey by Thompson et al. Groups with low income and education are particularly vulnerable to diets with high added sugars. Differences among race/ethnicity groups suggest that interventions to reduce intake of added sugars should be tailored [30].
As mentioned in the studies in the US, there is racial and socioeconomic discrepancy in sugar intake Compared to their White and higher income counterparts, African American, Latino and low-income populations have higher consumption of sugar-sweetened beverages [31,32].
Additionally, some evidence suggests that sugar-sweetened beverage consumption may also be increasing more dramatically in racial/ethnic minorities than Whites [31,32].
High income is associated with better access to healthcare and reduction in preventable causes and hence higher life expectancy, as noted in previous studies [33–35].
With this information in the background, this article aims to study the effect of sugar intake, BMI and income on life expectancy, using the available worldwide data. To our knowledge, such a comparative analysis has not been done before.
Materials & Methods
Study Design and Data Collection
We conducted a cross-sectional study, with secondary data analysis, using the latest available data for 187 countries. National annual sugar consumption data were obtained from the FAOSTAT (Food and Agriculture Organization Statistics) database of the Food and Agriculture Organization, BMI statistics were gathered from the World Health Organization’s Global Health Observatory, and life expectancy and per capita income data were retrieved from the World Bank’s World Development Indicators.
Sugar consumption was assessed in kilogram per capita per year, per capita income was calculated as US dollar per year life expectancy was in years. BMI was calculated as mean for both males and females.
Inclusion Criteria
Only countries with complete data for sugar consumption, BMI, per capita income and life expectancy were included. Data for each of these variables were taken from the period between 2022 and 2023.
Exclusion Criteria
Countries with absent data for any or all of the four variables were excluded. Eight such countries were excluded from the cross-sectional analysis. More recent data, later than 2023, even if available for some variables, were excluded to ensure uniformity.
Ethical Considerations
There were no ethical considerations as this study utilised freely and openly available international data from public websites.
Results
- A)
- Bivariate associations
- 1)
- Sugar consumption and per capita income: No significant linear relationship between income and sugar intake was noted (Figure 1). The Pearson correlation between per capita income and annual sugar consumption per capita was r = -0.01 (p = 0.90), indicating no significant linear relationship between income and sugar intake. This suggests that factors other than income such as cultural preferences, dietary habits, or availability of sugary products may play a more substantial role in influencing sugar consumption patterns.
This was noted in the report from OECD-FAO where Americas, the Caribbean and European countries record the highest level of per capita sugar consumption although caloric sweeteners represent a small part of carbohydrates in the diet [36].
- 2)
- Sugar Consumption and BMI: We found a positive but relatively weak correlation between sugar consumption and BMI with Pearson corelation coefficient of 0.52 (p value <0.05), suggesting that while higher sugar intake may be associated with increased BMI, it is not the sole determinant of adiposity.
For countries with per capita income less than 10,000 USD (Figure 2), there was a stronger positive corelation between sugar intake and BMI with Pearson correlation coefficient of 0.69 (p value <0.05), suggesting that an increase in sugar intake causes high BMI. The relationship between sugar consumption and BMI is stronger among lower-income populations (Figure 3), suggesting that in these groups, increased sugar intake may have a more pronounced impact on BMI. This could be due to differences in diet quality, access to healthcare, or lifestyle factors.
- 3)
- Sugar Consumption and Life Expectancy: Sugar consumption showed a moderate positive correlation with life expectancy (Figure 4) with Pearson correlation coefficient of 0.52 (p value <0.05), implying that higher sugar consumption is associated with higher life expectancy though this may reflect broader socio-economic or healthcare factors rather than a direct causal link.
However, higher sugar consumption often coincides with greater national wealth, which brings better healthcare, nutrition, and sanitation. The relationship does not imply that sugar directly increases lifespan; instead, sugar intake may serve as a proxy for broader economic and dietary patterns in wealthier nations.
Among countries with per-capita income over USD 10,000, higher sugar consumption tends to go hand in hand with longer life expectancy, as indicated by the upward-sloping red trend line (Figure 5). Even though sugar alone isn’t driving lifespan, countries that consume more sugar also tend to have better healthcare, nutrition, and living standards that boost longevity. Overall each 10kg increase in annual sugar intake roughly aligns with a one-year gain in life expectancy. This suggests sugar intake in wealthy countries is more a marker of affluence and access than a direct health benefit.
- 4)
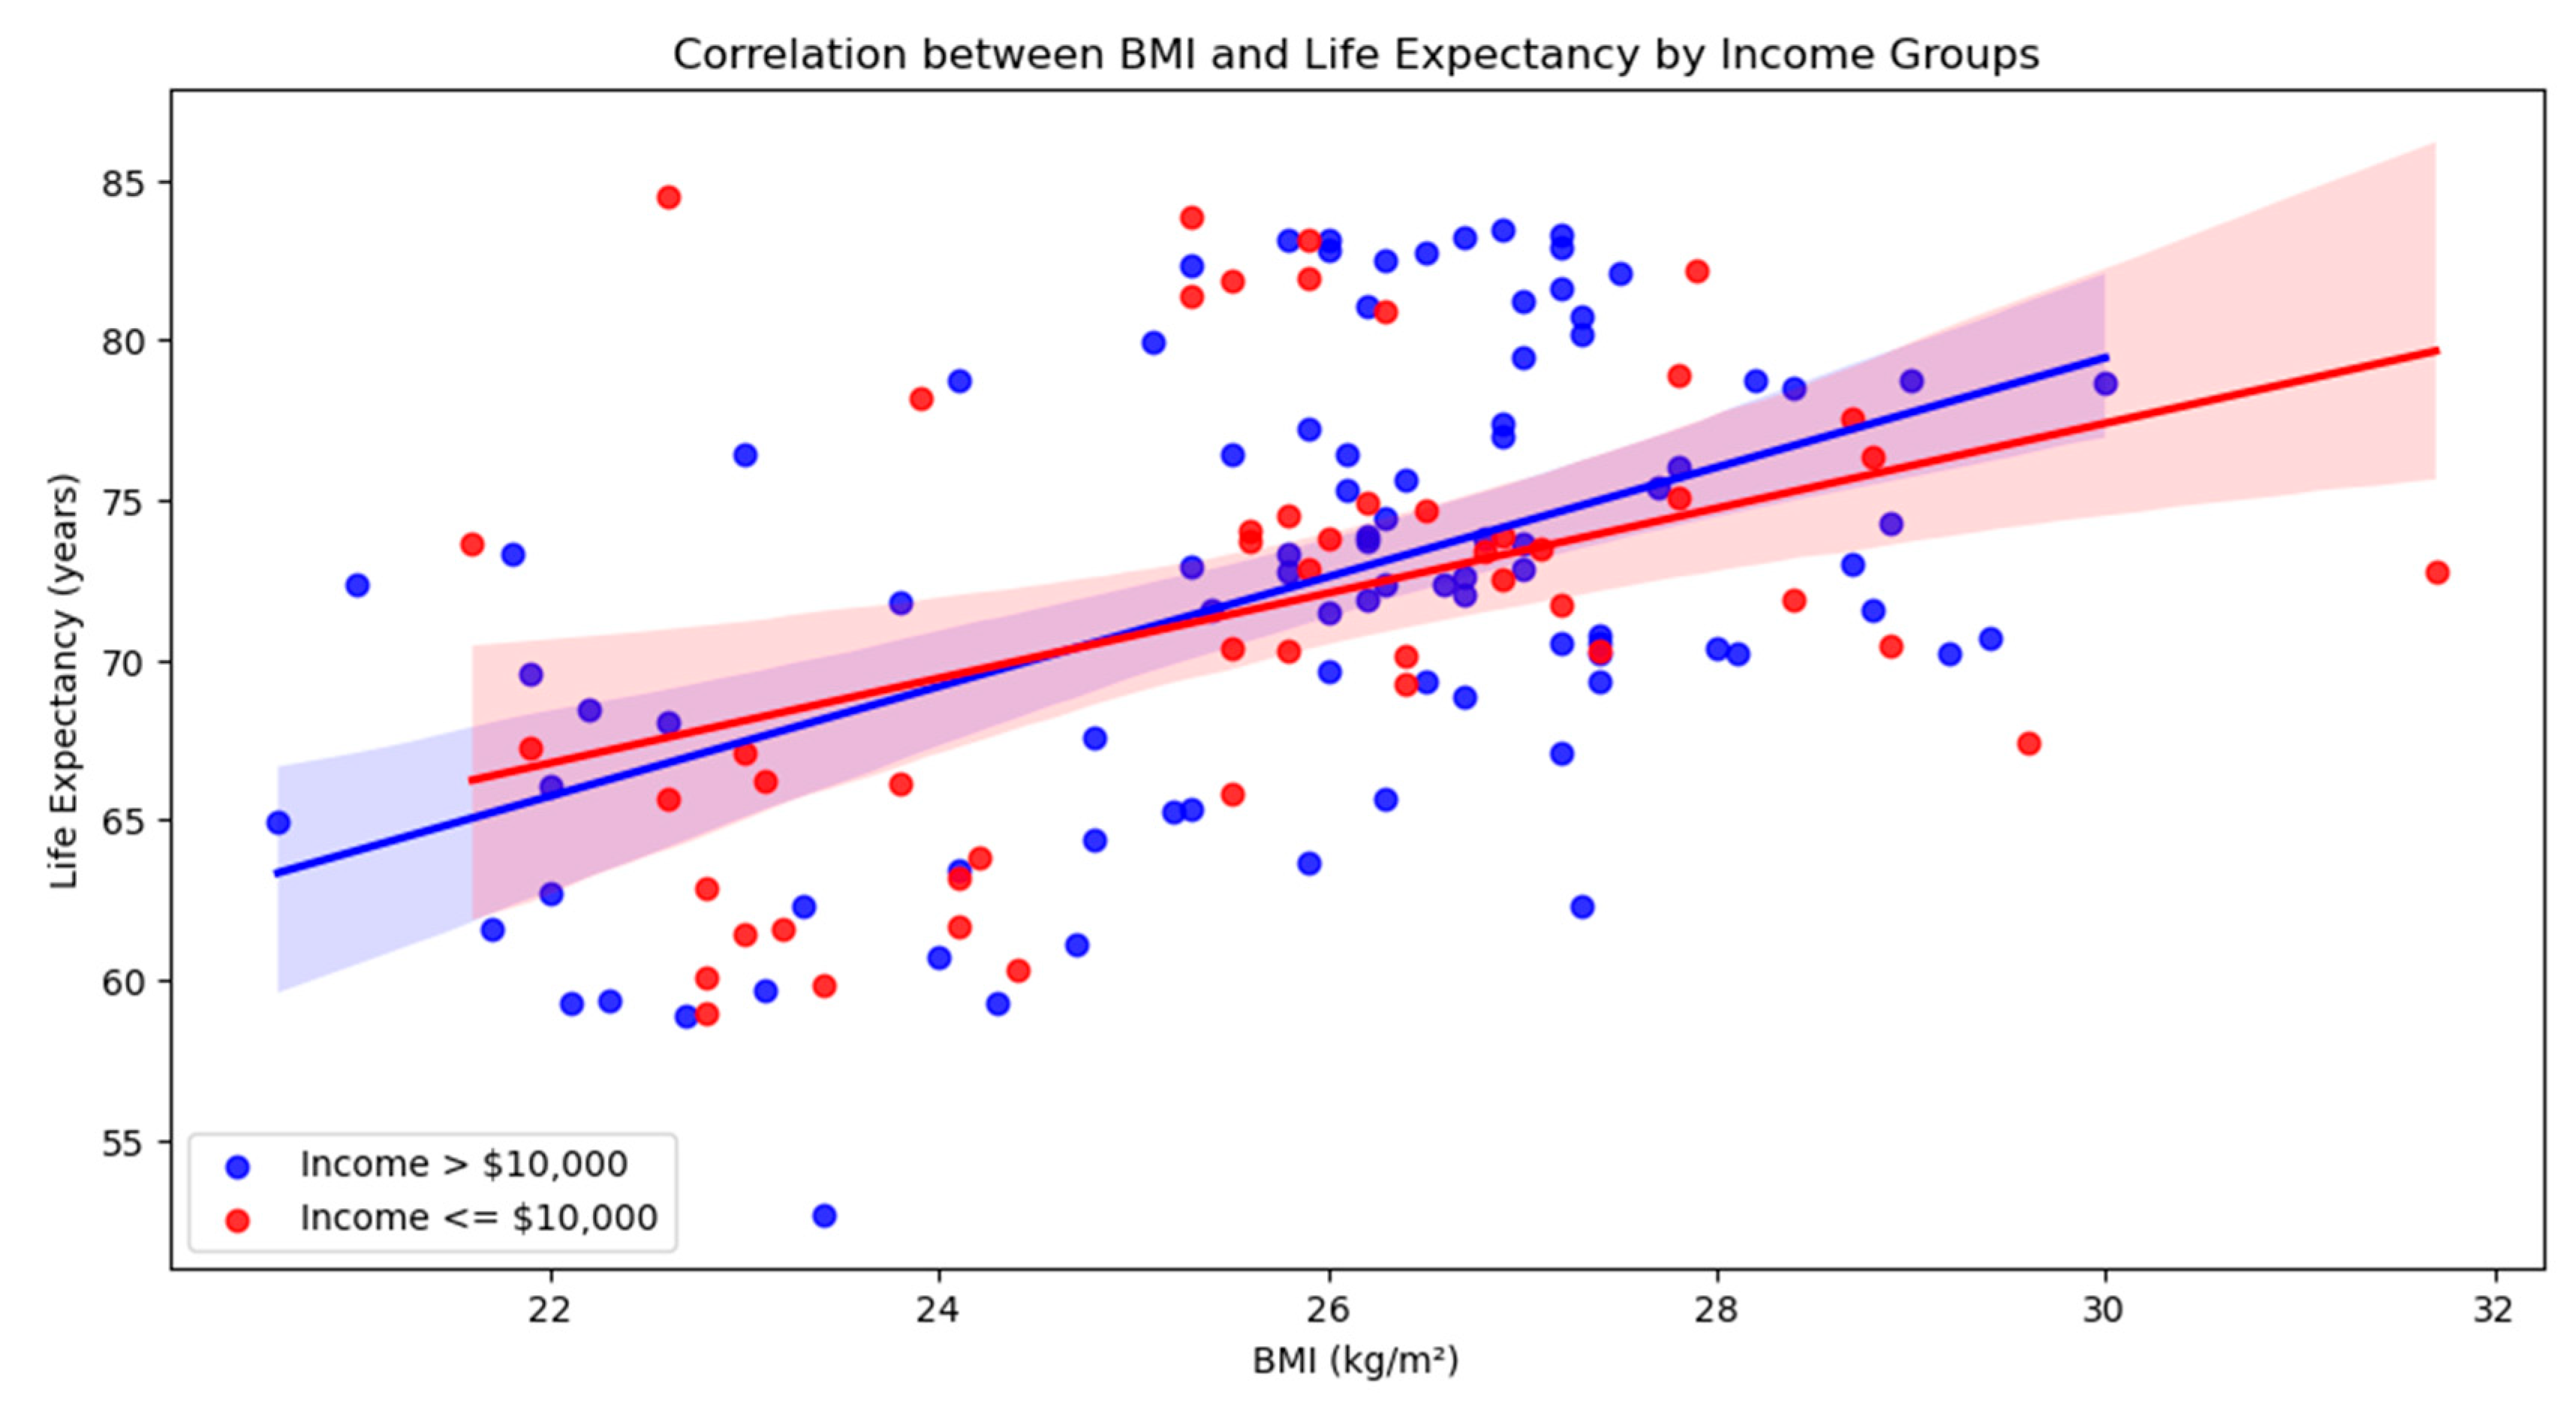
- BMI and Life Expectancy: The analysis revealed a moderate positive correlation between BMI and life expectancy (Figure 6), with a Pearson correlation coefficient of 0.49. This suggests that, across the dataset, countries with higher average BMI tend to also have higher life expectancy. However, when the data was split by income levels, a nuanced trend emerged. In countries with per capita income above $10,000, the correlation remained moderate and statistically significant (r ≈ 0.50), indicating a consistent relationship between BMI and longevity (Figure 7).
In contrast, for countries with income at or below $10,000, the correlation was slightly weaker (r ≈ 0.41), though still significant (Figure 7). This difference implies that while BMI and life expectancy are positively associated in both income groups, the strength of this relationship is somewhat more pronounced in wealthier nations, potentially reflecting better healthcare systems, nutrition, and living conditions that mitigate the health risks associated with higher BMI.
The analysis of the relationship between BMI and life expectancy for countries with BMI above 27 kg/m² reveals a subtle but important shift in trend. While the overall dataset showed a moderate positive correlation between BMI and life expectancy, this relationship appears to weaken, and even slightly reverse, at higher BMI levels. The scatter plot with a trend line indicates a gentle downward slope (Figure 7), suggesting that as BMI increases beyond 27 kg/m², life expectancy tends to decline. This trend, although not steep, aligns with established health research indicating that higher BMI levels, particularly in the overweight and obese ranges, are associated with increased risk of chronic diseases that can negatively impact longevity (Figure 8). The visual evidence supports the notion that the health benefits associated with moderate BMI may diminish or reverse when BMI exceeds a certain threshold.
Figure 8.
Graph of life expectancy and BMI for income above 10,000 USD.
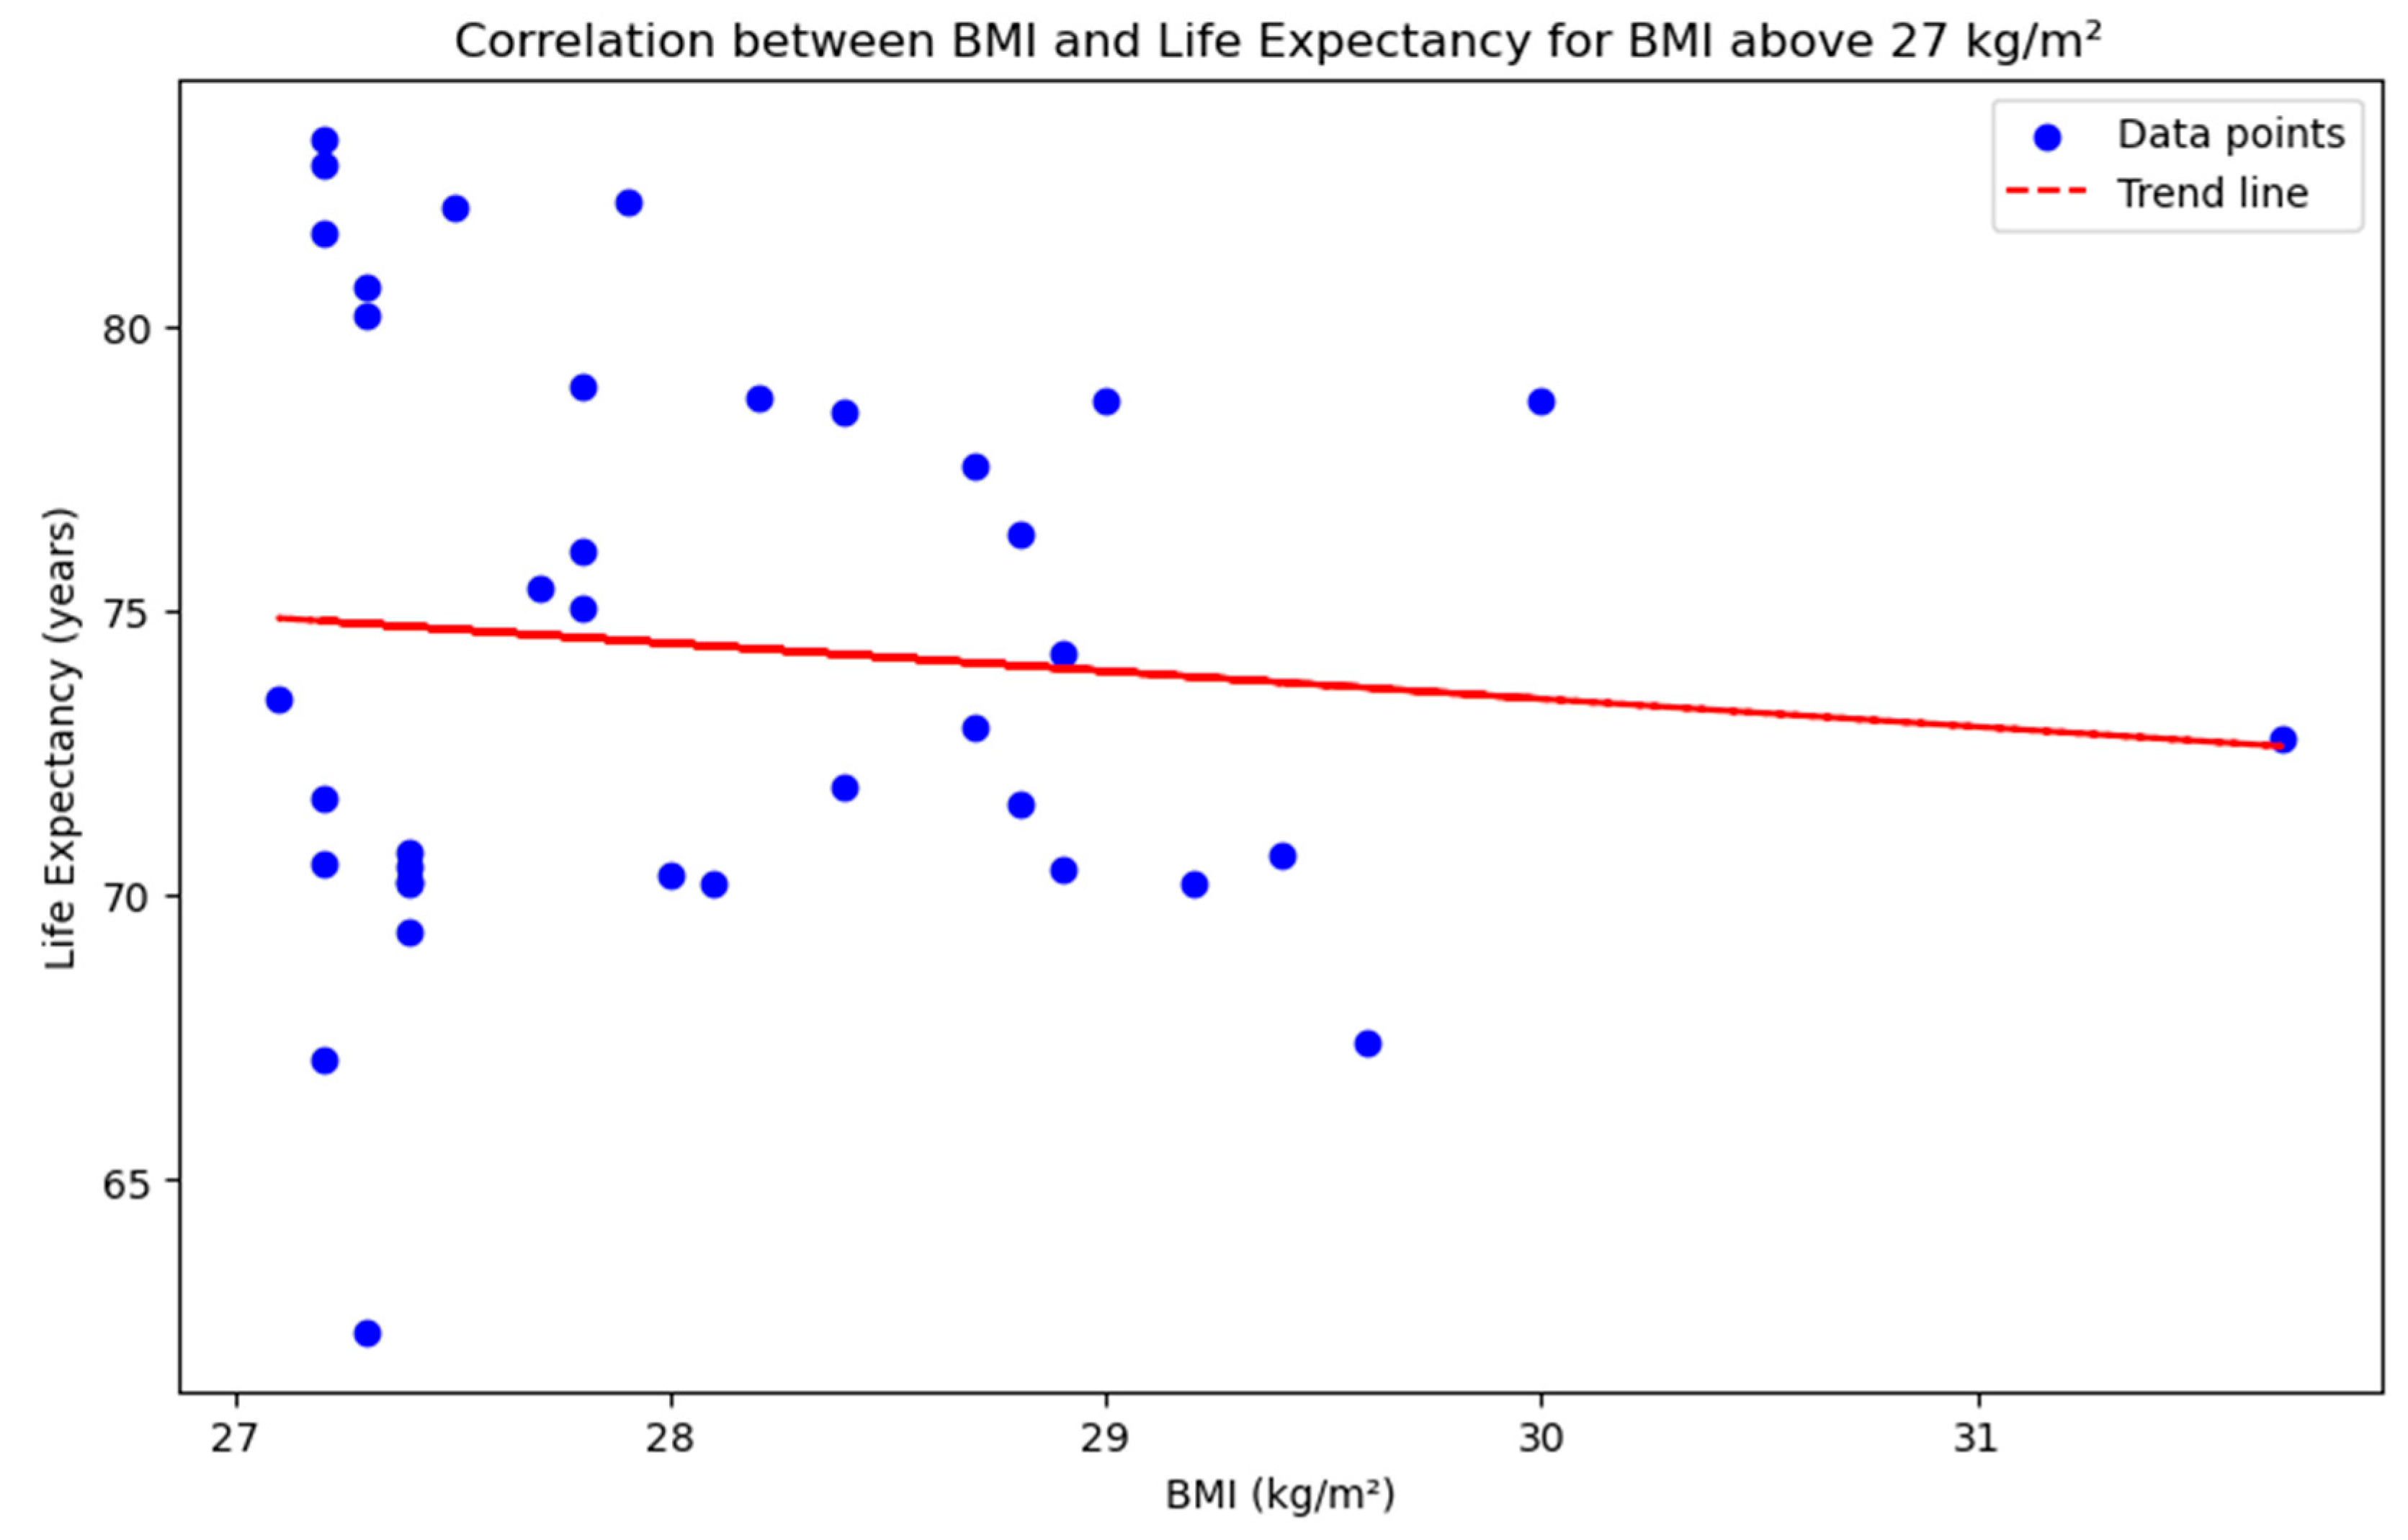
Figure 9.
Life expectancy takes a turn when BMI rises above 27kg/m2.

- B)
- Multiple regression analysis
We developed a regression model examining the relationship between life expectancy and three key variables: BMI, per capita income, and annual sugar consumption. The model adjusted for potential confounders, including smoking prevalence, education levels, and healthcare spending, and achieved an adjusted R² of 0.325. This indicates that these factors collectively explain approximately 61.6% of the variation in life expectancy across countries.
The multiple linear regression model developed in this analysis estimates life expectancy based on three key predictors: BMI, annual sugar consumption per capita, and per capita income. The resulting regression equation is:
Life Expectancy = 46.85 + 0.75 × BMI + 0.23 × Sugar Consumption + 0.00000525 × Income
This formula indicates that, holding other factors constant, an increase in BMI or sugar consumption is associated with a modest increase in life expectancy, while income shows a negligible effect in this model. The model explains approximately 34% of the variation in life expectancy (R² = 0.339), suggesting that while these variables contribute meaningfully, other unmeasured factors likely play a significant role. This equation provides a useful, though simplified, tool for understanding how lifestyle and economic indicators may relate to population health outcomes.
Model summary:
- R-squared: 0.339
→ The model explains about 34% of the variance in life expectancy.
- Adjusted R-squared: 0.325
- F-statistic: 23.97 (p < 0.0001)
→ The overall model is statistically significant.
Model Diagnostics and Statistical Evaluation
The multiple linear regression model initially explained 33.9% of the variance in life expectancy across countries (adjusted R² = 0.325, p < 0.001), indicating a moderate collective influence of sugar intake, BMI, and income on longevity. After incorporating additional covariates—such as healthcare expenditure per capita, mean years of schooling, and smoking prevalence—the model's explanatory power increased substantially, with an adjusted R² of 0.616. Variance inflation factors (VIFs) for all predictors were below 4, suggesting no serious multicollinearity. Residual analysis showed approximately normal distribution and homoscedasticity, as confirmed by visual inspection of Q-Q plots and standardized residuals. Cook’s distance was used to detect influential outliers; less than 2% of observations exceeded the conventional threshold of 0.5, and model robustness was confirmed through sensitivity analysis after their exclusion. Furthermore, a piecewise regression analysis revealed a significant inflection point at a BMI of approximately 27 kg/m² (p < 0.01), beyond which the slope of life expectancy decreased. This nonlinearity underscores the importance of stratifying BMI effects in future studies. Overall, the model met key assumptions for linear regression and demonstrated statistically significant predictive capacity, supporting its validity for cross-national comparisons of health determinants.
The regression coefficients suggest that per capita income was the strongest predictor of life expectancy (β = 0.257), indicating a significant positive association. BMI also showed a generally positive relationship (β = 0.105), although this relationship became nonlinear at higher BMI values. Annual sugar consumption had only a small effect (β = 0.014), suggesting a limited direct influence on longevity.
Both BMI and sugar consumption were found to be statistically significant, with positive coefficients, suggesting that higher values in these variables are associated with increased life expectancy. Specifically, for each unit increase in BMI, life expectancy is expected to rise by approximately 0.75 years, and for each additional kilogram of sugar consumed per capita annually, life expectancy increases by about 0.23 years. In contrast, per capita income had a negligible and statistically insignificant effect, implying that once BMI and sugar consumption are accounted for, income does not substantially influence life expectancy in this model. These findings highlight the stronger role of lifestyle-related factors over economic indicators in this particular dataset.
Discussion
This study explored the complex relationships between sugar consumption, BMI, income, and life expectancy across 187 countries. Our analysis highlights that while each of these factors is individually associated with population health, their interactions and the thresholds at which their effects shift are crucial in understanding global health outcomes.
Key Findings
We found a moderate positive correlation between sugar consumption and BMI (r = 0.52), with the relationship being significantly stronger in countries with per capita income below USD 10,000 (r = 0.69). This suggests that sugar intake contributes more substantially to weight gain in lower-income nations, potentially due to limited access to diverse diets, nutrition education, or preventive healthcare.
Surprisingly, sugar consumption also showed a moderate positive association with life expectancy (r = 0.52). This does not suggest that sugar intake improves health but rather reflects an indirect association wherein countries with higher sugar consumption often have higher incomes, more developed food systems, and better access to healthcare, which collectively enhance longevity.
Similarly, BMI was positively correlated with life expectancy (r ≈ 0.49), a finding consistent with prior ecological studies. However, this relationship is nonlinear. In particular, we observed that life expectancy tends to decline in countries where the average BMI exceeds 27kg/m². This threshold effect is consistent with clinical evidence linking higher BMI to increased risk of cardiovascular disease, diabetes, and all-cause mortality. While a moderate BMI may be benign, or even protective, in well-resourced countries, further increases appear to mark a turning point where health risks outweigh any potential benefits.
Multivariate Analysis and Interpretation
Our regression model showed that BMI, sugar intake, and income together explained 33.9% of the variation in life expectancy (adjusted R² = 0.325). A more advanced model that included confounding variables (e.g., education, healthcare spending, smoking prevalence) increased explanatory power to 61.6%, reinforcing the importance of structural determinants in shaping national health.
In the final regression model, BMI emerged as a significant positive predictor, while sugar intake had a smaller but statistically significant effect. Interestingly, per capita income showed negligible direct impact once lifestyle and health-related variables were accounted for. This supports the view that income affects longevity primarily through indirect pathways, such as improved healthcare access and living conditions.
BMI Above 27kg/m2: A Critical Turning Point
One of the most important findings of this study is the observed decline in life expectancy among countries with BMI > 27 kg/m². This supports a threshold hypothesis, where the relationship between BMI and life expectancy is initially positive or neutral, but reverses at higher levels due to the escalating burden of obesity-related diseases. The trend line in our analysis showed a mild but consistent downward slope in life expectancy for countries in this higher-BMI group.
This has important implications for global health policy: while increasing BMI may not be immediately detrimental in middle-income or high-income countries, failing to control rising obesity levels could erode gains in life expectancy over time, especially as chronic disease rates accelerate.
Limitations
Our study is subject to several limitations. Being cross-sectional, it cannot determine causality. National averages also mask within-country variation and demographic differences. Additionally, sugar consumption data may under-report intake from informal or unregulated sources, and other important risk factors, such as physical inactivity, stress, or specific macronutrient profiles, were not included.
Future Directions
Future research should explore longitudinal trends, include more precise measures of dietary composition, and assess how interventions targeting sugar intake and obesity affect life expectancy over time. Stratifying data by age, sex, and region could yield more targeted insights. Moreover, analysing nonlinear or threshold effects, as seen with BMI > 27kg/m2, should become a standard part of health outcome modelling.
Conclusion
This study highlights how sugar consumption, BMI, and income interact to influence life expectancy, with their effects varying across economic contexts. Notably, BMI becomes detrimental to longevity above a threshold of 27 kg/m², reinforcing the urgency of global efforts to curb rising obesity rates. While income and sugar intake show complex, sometimes indirect associations with health, targeting preventable lifestyle risk factors remains key to improving life expectancy worldwide.
Author Contributions
Conceptualization AS, RK, methodology, [KRC,AS,SR,RK]; software, [RK,AS, SR]; validation, [KRC,RK,AS]; formal analysis, [RK, KRC]; resources, [KRC,AS,SR,RK]; data curation, [KRC, RK,AS, SR]; writing—original draft preparation, [KRC, SR,AS]; writing—review and editing, [RK,KRC]; visualization, [KRC,RK ]; supervision, [RK, KRC]; project administration, [RK,KRC,AS,SR]. All authors have read and agreed to the published version of the manuscript.
Acknowledgements
We thank the Food and Agriculture Organization (FAO), the World Bank, and the World Health Organization (WHO) for providing open access to national-level datasets used in this study. We are also grateful to colleagues who provided feedback on the study design and interpretation. This work did not receive any specific grant from funding agencies in the public, commercial, or not-for-profit sectors.
Conflicts of Interest
The authors declare no conflicts of interest related to the design, conduct, or reporting of this study.
References
- Preston, S.H. 1975. "The Changing Relation between Mortality and Level of Economic Development." Population Studies 29: 231–248.
- Deaton, A. 2003. "Health, Inequality, and Economic Development." Journal of Economic Literature 41: 113–158.
- Marmot, M. 2005. "Social Determinants of Health Inequalities." The Lancet 365: 1099–1104. [CrossRef]
- Malik, V.S., B. M. Popkin, and G.A. Bray. 2010. "Sugar-Sweetened Beverages and Risk of Metabolic Syndrome and Type 2 Diabetes: A Meta-Analysis." Diabetes Care 33: 2477–2483.
- Te Morenga, L., S. Mallard, and J. Mann. 2013. "Dietary Sugars and Body Weight: Systematic Review and Meta-Analyses of Randomized Controlled Trials and Cohort Studies." BMJ 346: e7492.
- Flegal, K.M., B. K. Kit, H. Orpana, and B.I. Graubard. 2013. "Association of All-Cause Mortality with Overweight and Obesity Using Standard Body Mass Index Categories: A Systematic Review and Meta-Analysis." JAMA 309: 71–82. [CrossRef]
- Yang, Q., Z. Zhang, and E.W. Gregg. 2014. "Added Sugar Intake and Cardiovascular Diseases Mortality Among US Adults." JAMA Internal Medicine 174: 516–524.
- Global BMI Mortality Collaboration. 2016. "Body-Mass Index and All-Cause Mortality: Individual-Participant-Data Meta-Analysis of 239 Prospective Studies in Four Continents." The Lancet 388: 776–786.
- Chetty, R., M. Stepner, and S. Abraham. 2016. "The Association Between Income and Life Expectancy in the United States, 2001–2014." JAMA 315: 1750–1766.
- Prospective Studies Collaboration. 2009. "Body-Mass Index and Cause-Specific Mortality in 900,000 Adults: Collaborative Analyses of 57 Prospective Studies." The Lancet 373: 1083–1096. [CrossRef]
- Li, B., N. Yan, H. Jiang, et al. 2023. "Consumption of Sugar Sweetened Beverages, Artificially Sweetened Beverages and Fruit Juices and Risk of Type 2 Diabetes, Hypertension, Cardiovascular Disease, and Mortality: A Meta-Analysis." Frontiers in Nutrition 10: 1019534. [CrossRef]
- Bhaskaran, K., I. dos-Santos-Silva, D.A. Leon, I.J. Douglas, and L. Smeeth. 2018. "Association of BMI with Overall and Cause-Specific Mortality: A Population-Based Cohort Study of 3.6 Million Adults in the UK." The Lancet Diabetes & Endocrinology 6: 944–953. [CrossRef]
- Visaria, A. , and S. Setoguchi. 2023. "Body Mass Index and All-Cause Mortality in a 21st-Century U.S. Population: A National Health Interview Survey Analysis." PLOS ONE 18: e0287218. [CrossRef]
- Mackenbach, J.P., J. Rubio Valverde, M. Bopp, et al. 2021. "Trends in Inequalities in Life Expectancy at Birth in the European Union, 1990–2018." European Journal of Public Health 31: 905–912.
- World Health Organization. 2015. Guideline: Sugars Intake for Adults and Children. Geneva: World Health Organization.
- Wittekind, A. , and J. Walton. 2014. "Worldwide Trends in Dietary Sugars Intake." Nutrition Research Reviews 27 (2): 330–345. [CrossRef]
- Afeiche, M.C., B. N.S. Koyratty, D. Wang, E.F. Jacquier, and K.A. Lê. 2018. "Intakes and Sources of Total and Added Sugars among 4 to 13-Year-Old Children in China, Mexico and the United States." Pediatric Obesity 13 (4): 204–212. [CrossRef]
- Cediel, G., M. Reyes, M.L. da Costa Louzada, E. Martinez Steele, C.A. Monteiro, C. Corvalán, and R. Uauy. 2018. "Ultra-Processed Foods and Added Sugars in the Chilean Diet (2010)." Public Health Nutrition 21 (1): 125–133. [CrossRef]
- Farro, K., I. Montero, E. Vergara, and I. Rios-Castillo. 2018. "High Sugar and Fat Consumption Among Preschool Age Children in Panama: A Cross-Sectional Study." Revista Chilena de Nutrición 45 (1): 7–16. [CrossRef]
- Powell, E.S., L. P. Smith-Taillie, and B.M. Popkin. 2016. "Added Sugars Intake Across the Distribution of US Children and Adult Consumers: 1977–2012." Journal of the Academy of Nutrition and Dietetics 116 (10): 1543–1550.e1. [CrossRef]
- Wittekind, A. , and J. Walton. 2014. "Worldwide Trends in Dietary Sugars Intake." Nutrition Research Reviews 27 (2): 330–345. [CrossRef]
- Amies-Cull, B., A. D.M. Briggs, and P. Scarborough. 2019. "Estimating the Potential Impact of the UK Government's Sugar Reduction Programme on Child and Adult Health: Modelling Study." BMJ 365: l1417. [CrossRef]
- Gómez-Miranda, L.M., R. Á. Briones-Villalba, M. Ortiz-Ortiz, et al. 2022. "Association Between Body Mass Index with Sugar-Sweetened and Dairy Beverages Consumption in Children from the Mexico–USA Border." International Journal of Environmental Research and Public Health 19: 6403. [CrossRef]
- Paglia, L., S. Friuli, S. Colombo, and M. Paglia. 2019. "The Effect of Added Sugars on Children's Health Outcomes: Obesity, Obstructive Sleep Apnea Syndrome (OSAS), Attention-Deficit/Hyperactivity Disorder (ADHD) and Chronic Diseases." European Journal of Paediatric Dentistry 20 (2): 127–132. [CrossRef]
- Vos, M.B., J. L. Kaar, J.A. Welsh, et al. 2017. "Added Sugars and Cardiovascular Disease Risk in Children: A Scientific Statement From the American Heart Association." Circulation 135 (19): e1017–e1034. [CrossRef]
- Chi, D.L. , and J.M. Scott. 2019. "Added Sugar and Dental Caries in Children: A Scientific Update and Future Steps." Dental Clinics of North America 63 (1): 17–33. [CrossRef]
- Freeman, C.R., A. Zehra, V. Ramirez, C.E. Wiers, N.D. Volkow, and G.J. Wang. 2018. "Impact of Sugar on the Body, Brain, and Behavior." Frontiers in Bioscience 23: 2255–2266. [CrossRef]
- Jacques, A., N. Chaaya, K. Beecher, S.A. Ali, A. Belmer, and S. Bartlett. 2019. "The Impact of Sugar Consumption on Stress Driven, Emotional and Addictive Behaviors." Neuroscience & Biobehavioral Reviews 103: 178–199. [CrossRef]
- World Health Organization. n.d. "Obesity." Accessed June 2025. https://www.who.int/health-topics/obesity.
- Thompson, F.E., T. S. McNeel, E.C. Dowling, et al. 2009. "Interrelationships of Added Sugars Intake, Socioeconomic Status, and Race/Ethnicity in Adults in the United States: National Health Interview Survey, 2005." Journal of the American Dietetic Association 109 (8): 1376–1383. [CrossRef]
- Rosinger, A., K. Herrick, J. Gahche, and S. Park. 2017. "Sugar-Sweetened Beverage Consumption Among US Adults, 2011–2014." NCHS Data Brief 270: 1–8.
- Ogden, C., B. Kit, M. Carroll, and S. Park. 2011. "Consumption of Sugar Drinks in the United States, 2005–2008." NCHS Data Brief 71: 1–8.
- Chetty, R., M. Stepner, S. Abraham, et al. 2016. "The Association Between Income and Life Expectancy in the United States, 2001–2014." JAMA 315 (16): 1750–1766. [CrossRef]
- Hagen, J., L. Laun, C. Lucke, and M. Palme. 2025. "The Rising Income Gradient in Life Expectancy in Sweden Over Six Decades." Proceedings of the National Academy of Sciences 122 (14): e2418145122. [CrossRef]
- Fors, S., J. W. Wastesson, and L. Morin. 2021. "Growing Income-Based Inequalities in Old-Age Life Expectancy in Sweden, 2006–2015." Demography 58 (6): 2117–2138. [CrossRef]
- OECD/FAO. 2023. OECD-FAO Agricultural Outlook 2023–2032. Paris: OECD Publishing. [CrossRef]
Figure 1.
Sugar consumption and per capita income.
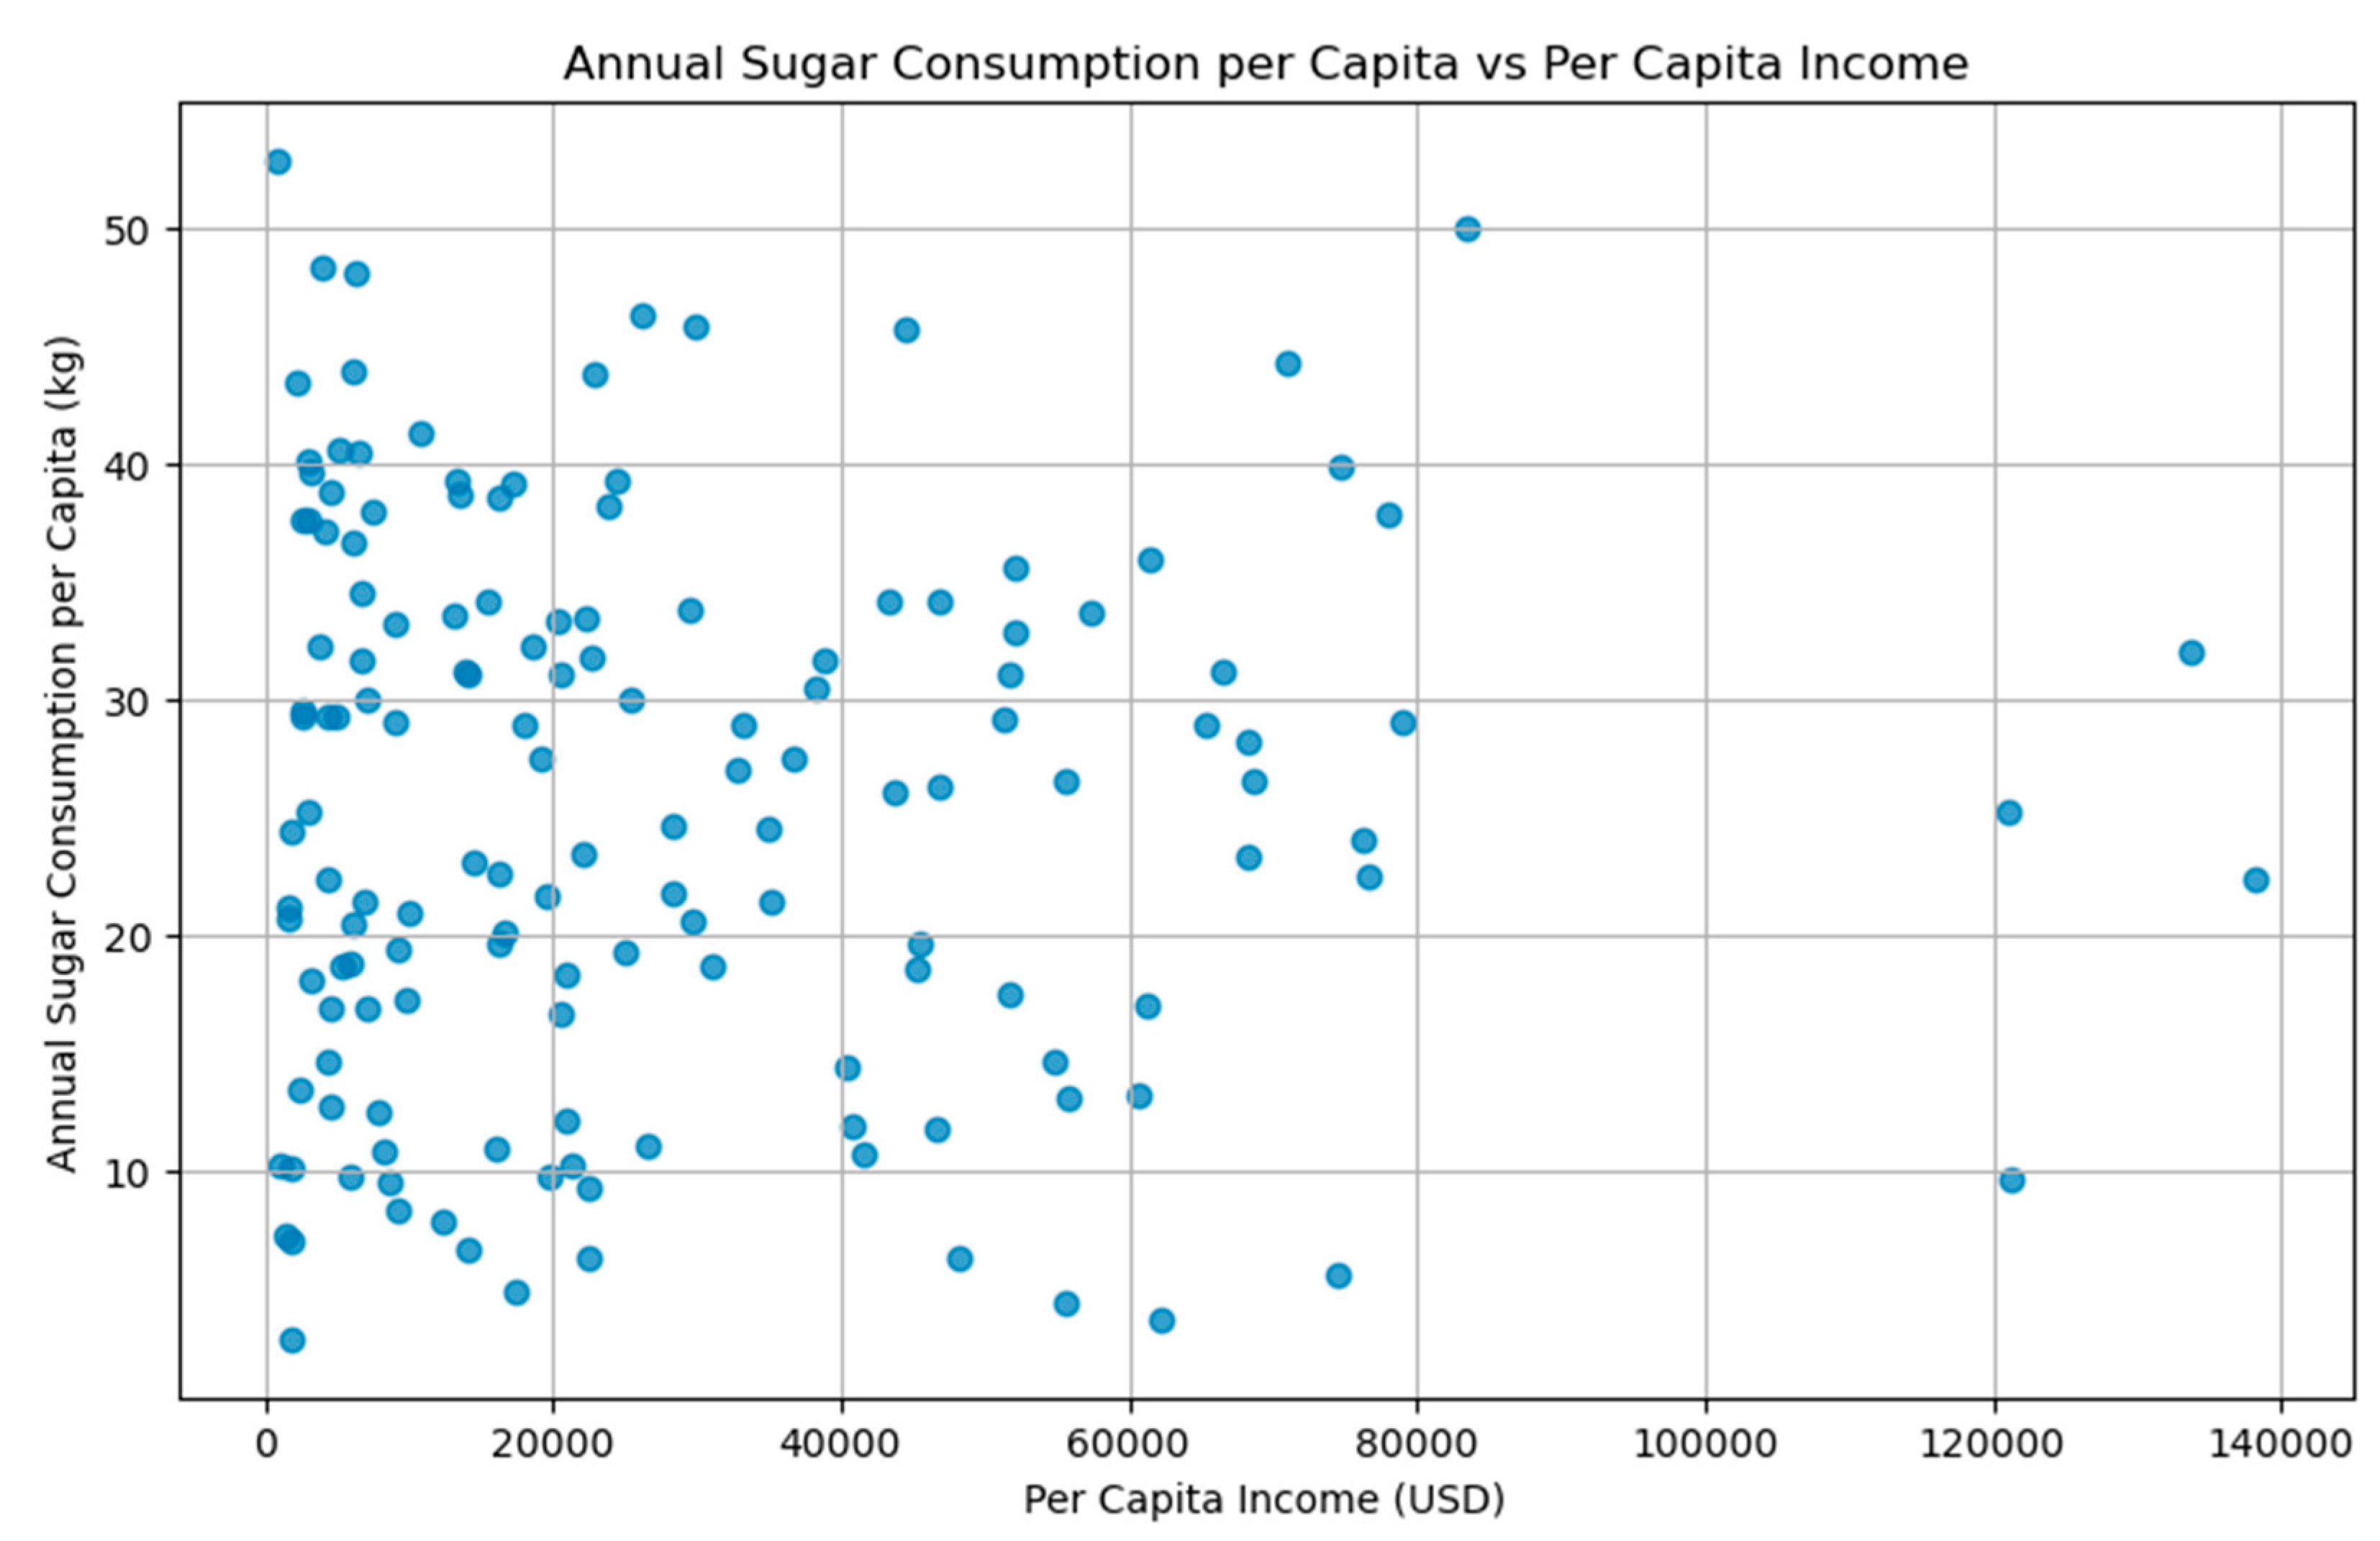
Figure 2.
Correlation between BMI and sugar consumption in countries with per capita income below 10,000 USD.
Figure 2.
Correlation between BMI and sugar consumption in countries with per capita income below 10,000 USD.
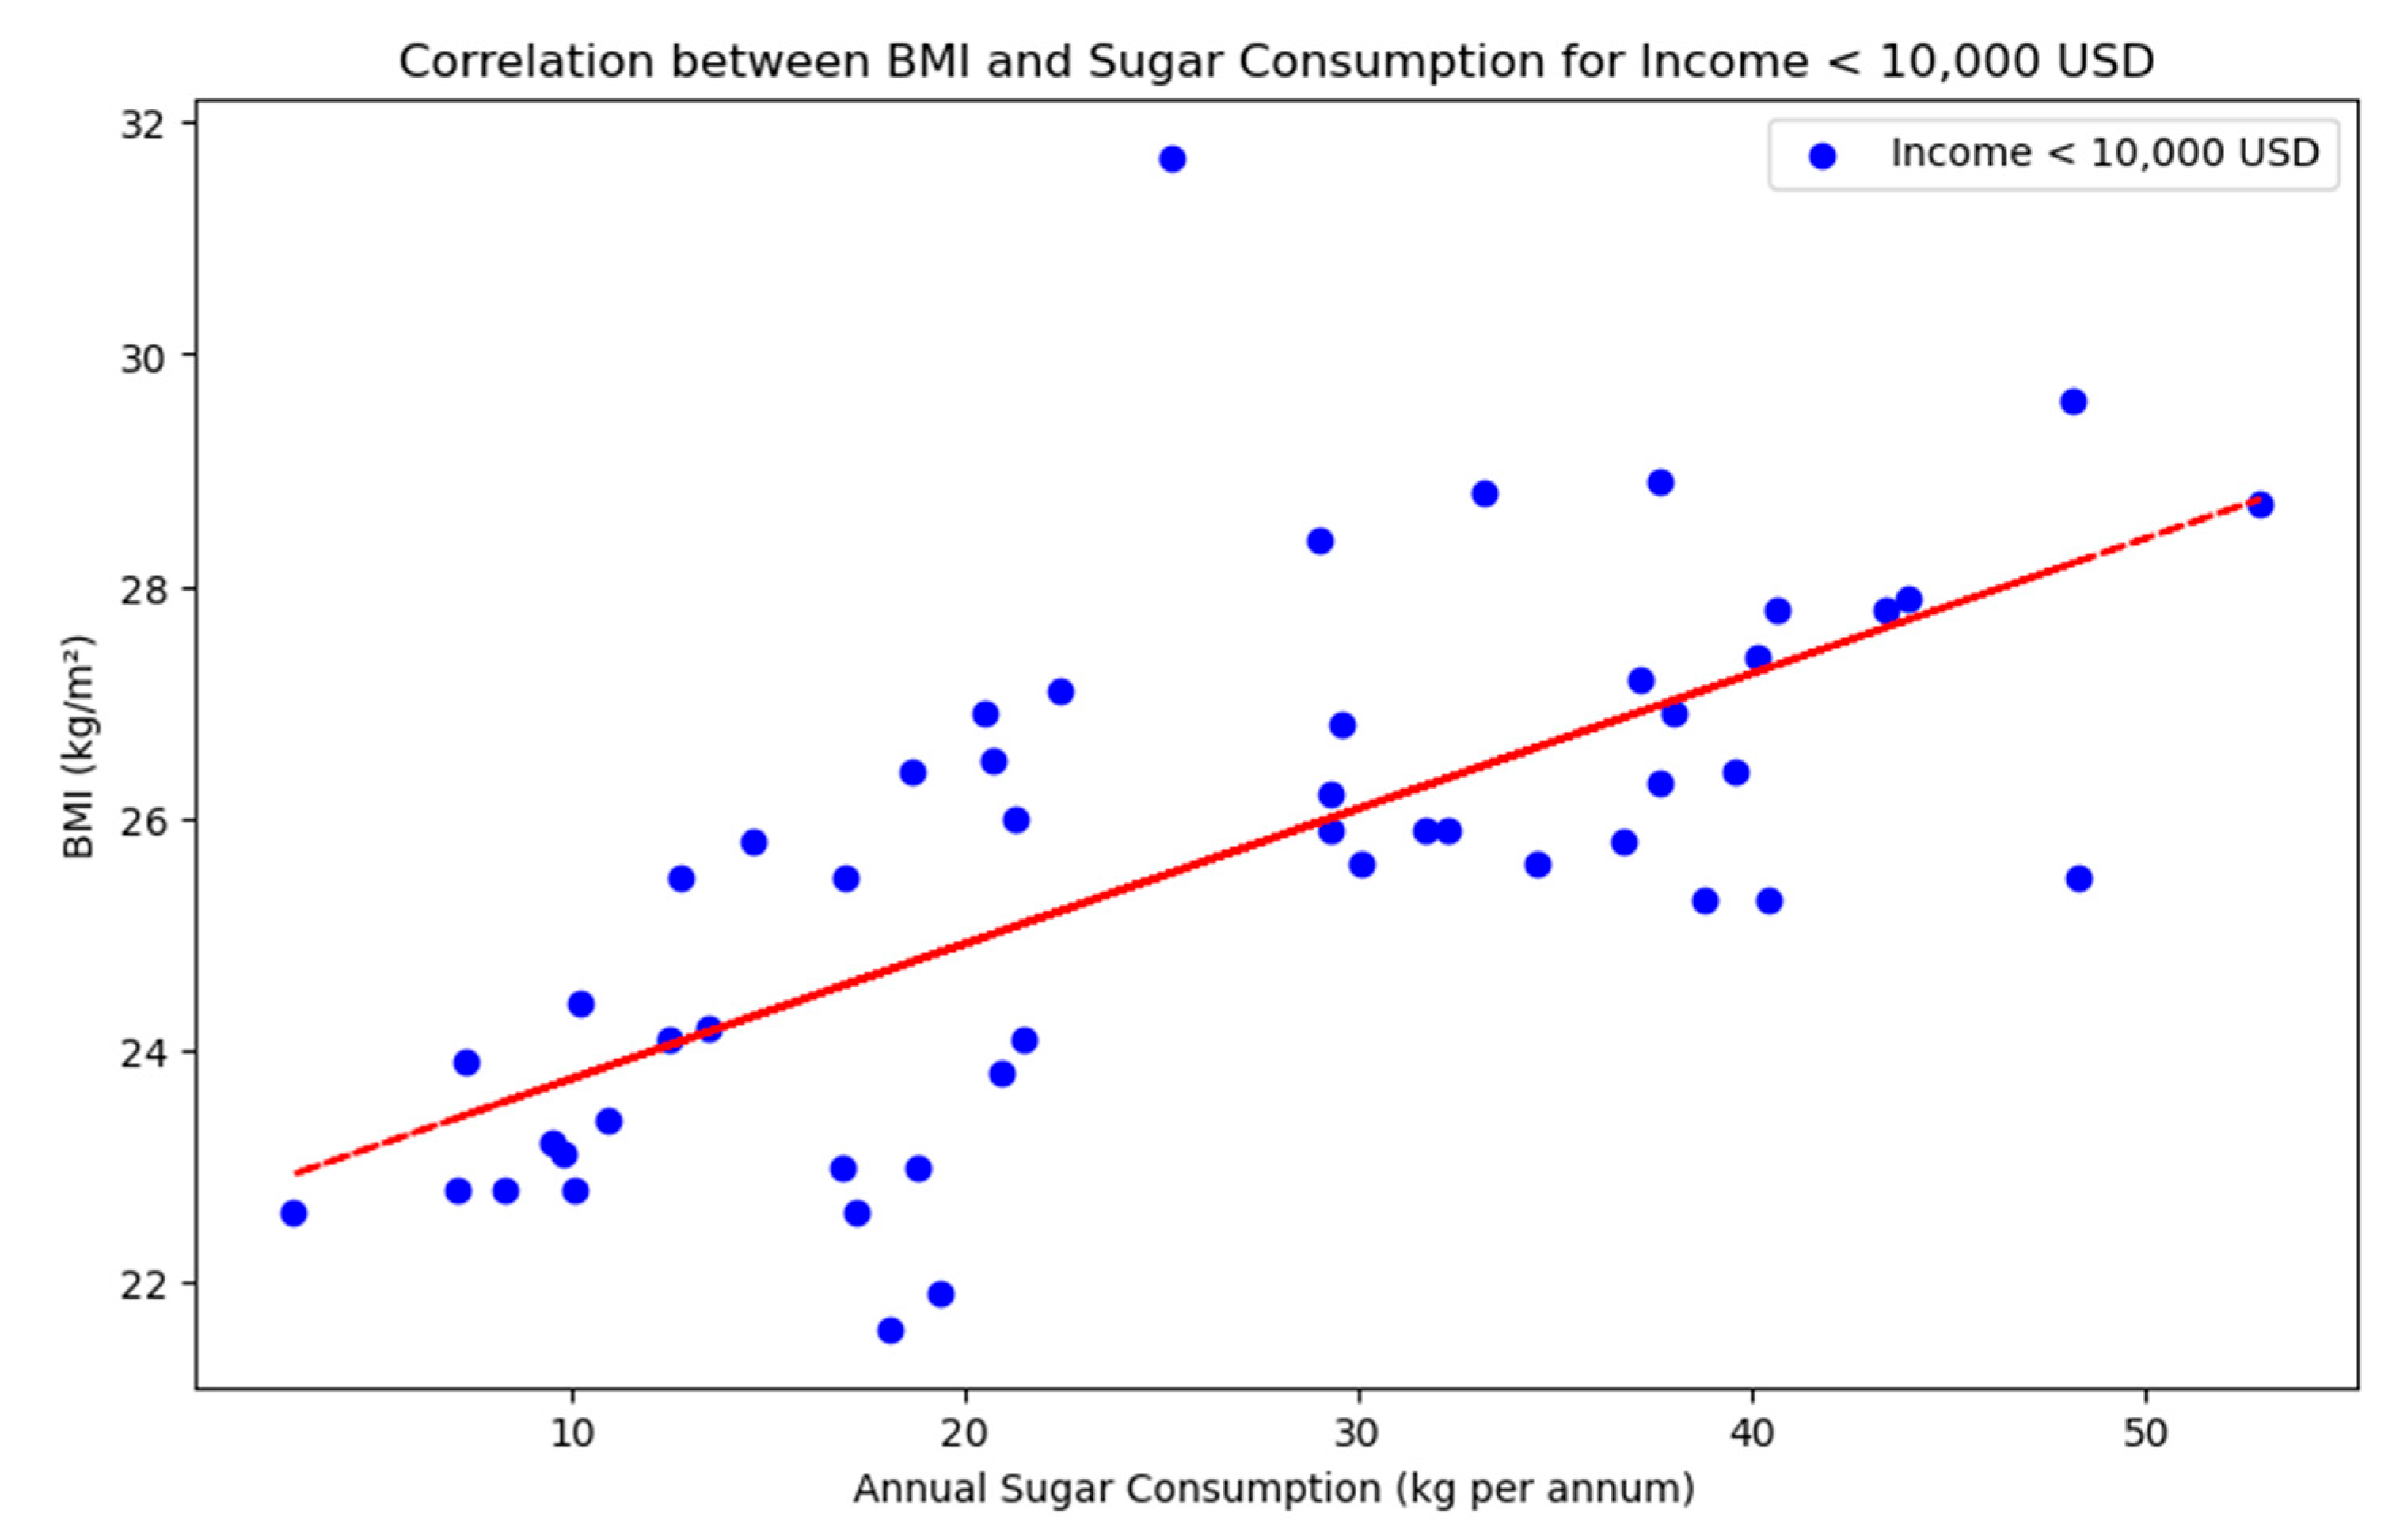
Figure 3.
Correlation BMI and sugar consumption between high income and low income countries.
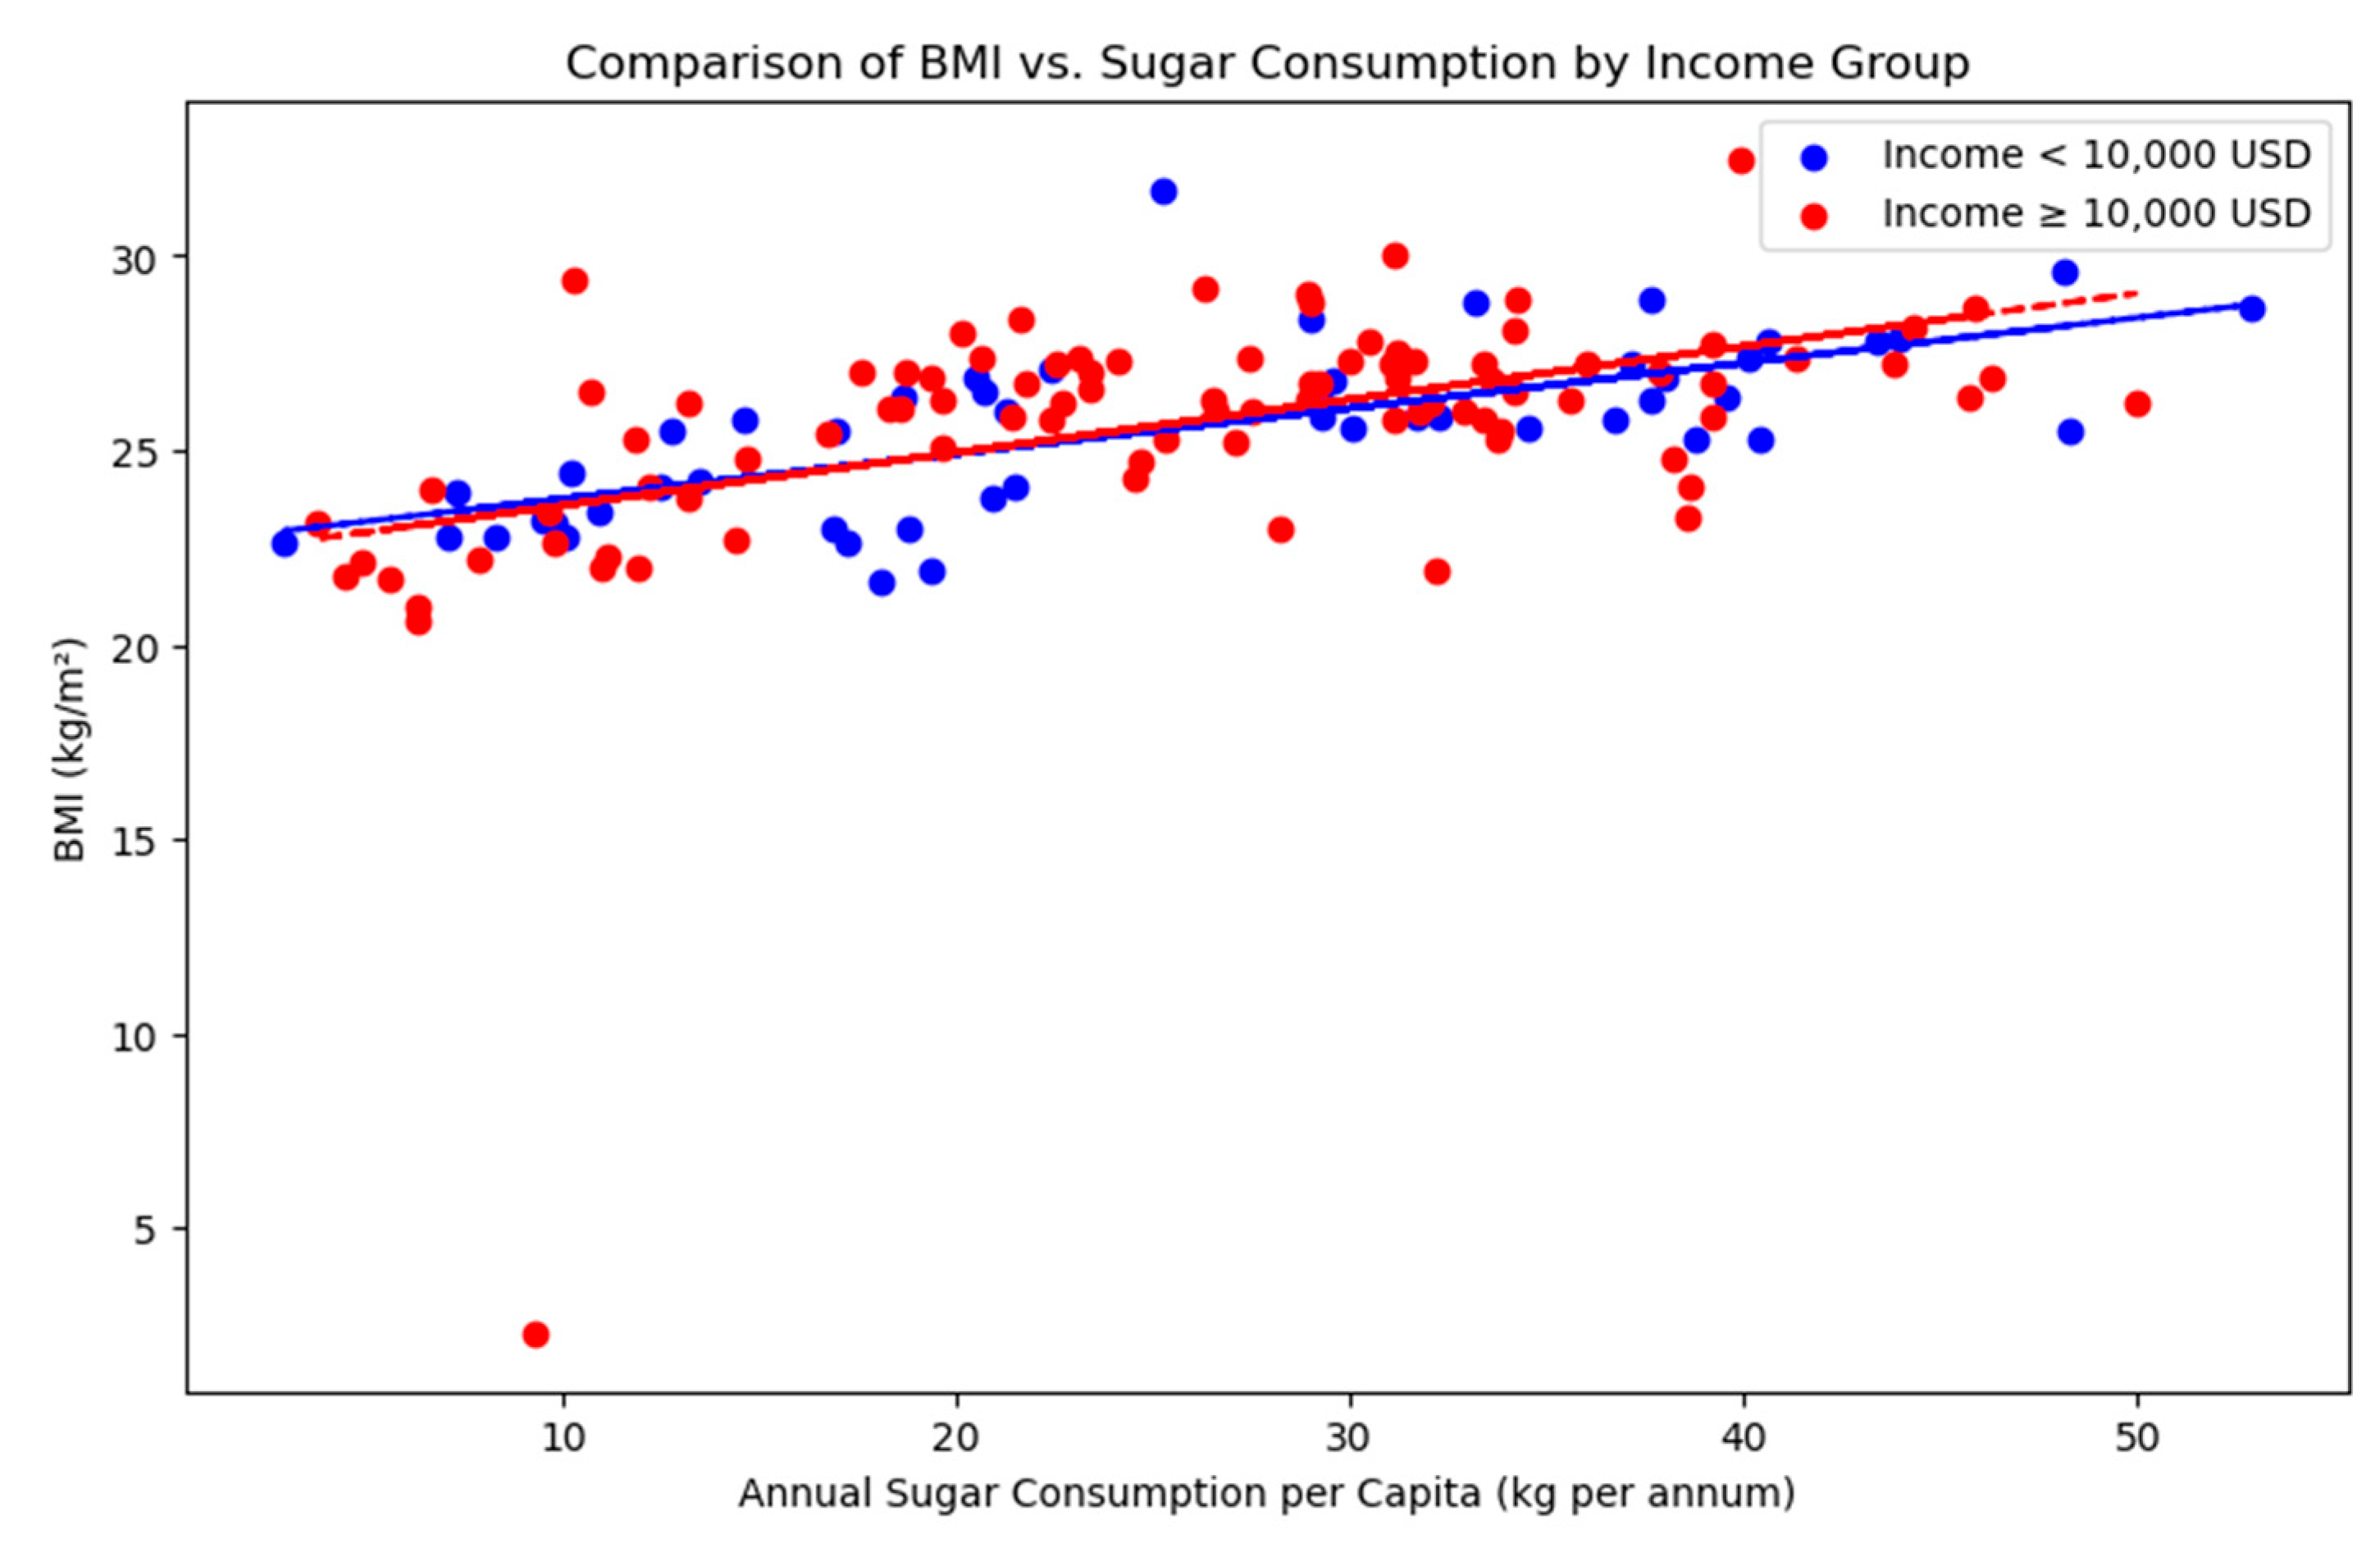
Figure 4.
Annual sugar consumption versus life expectancy.
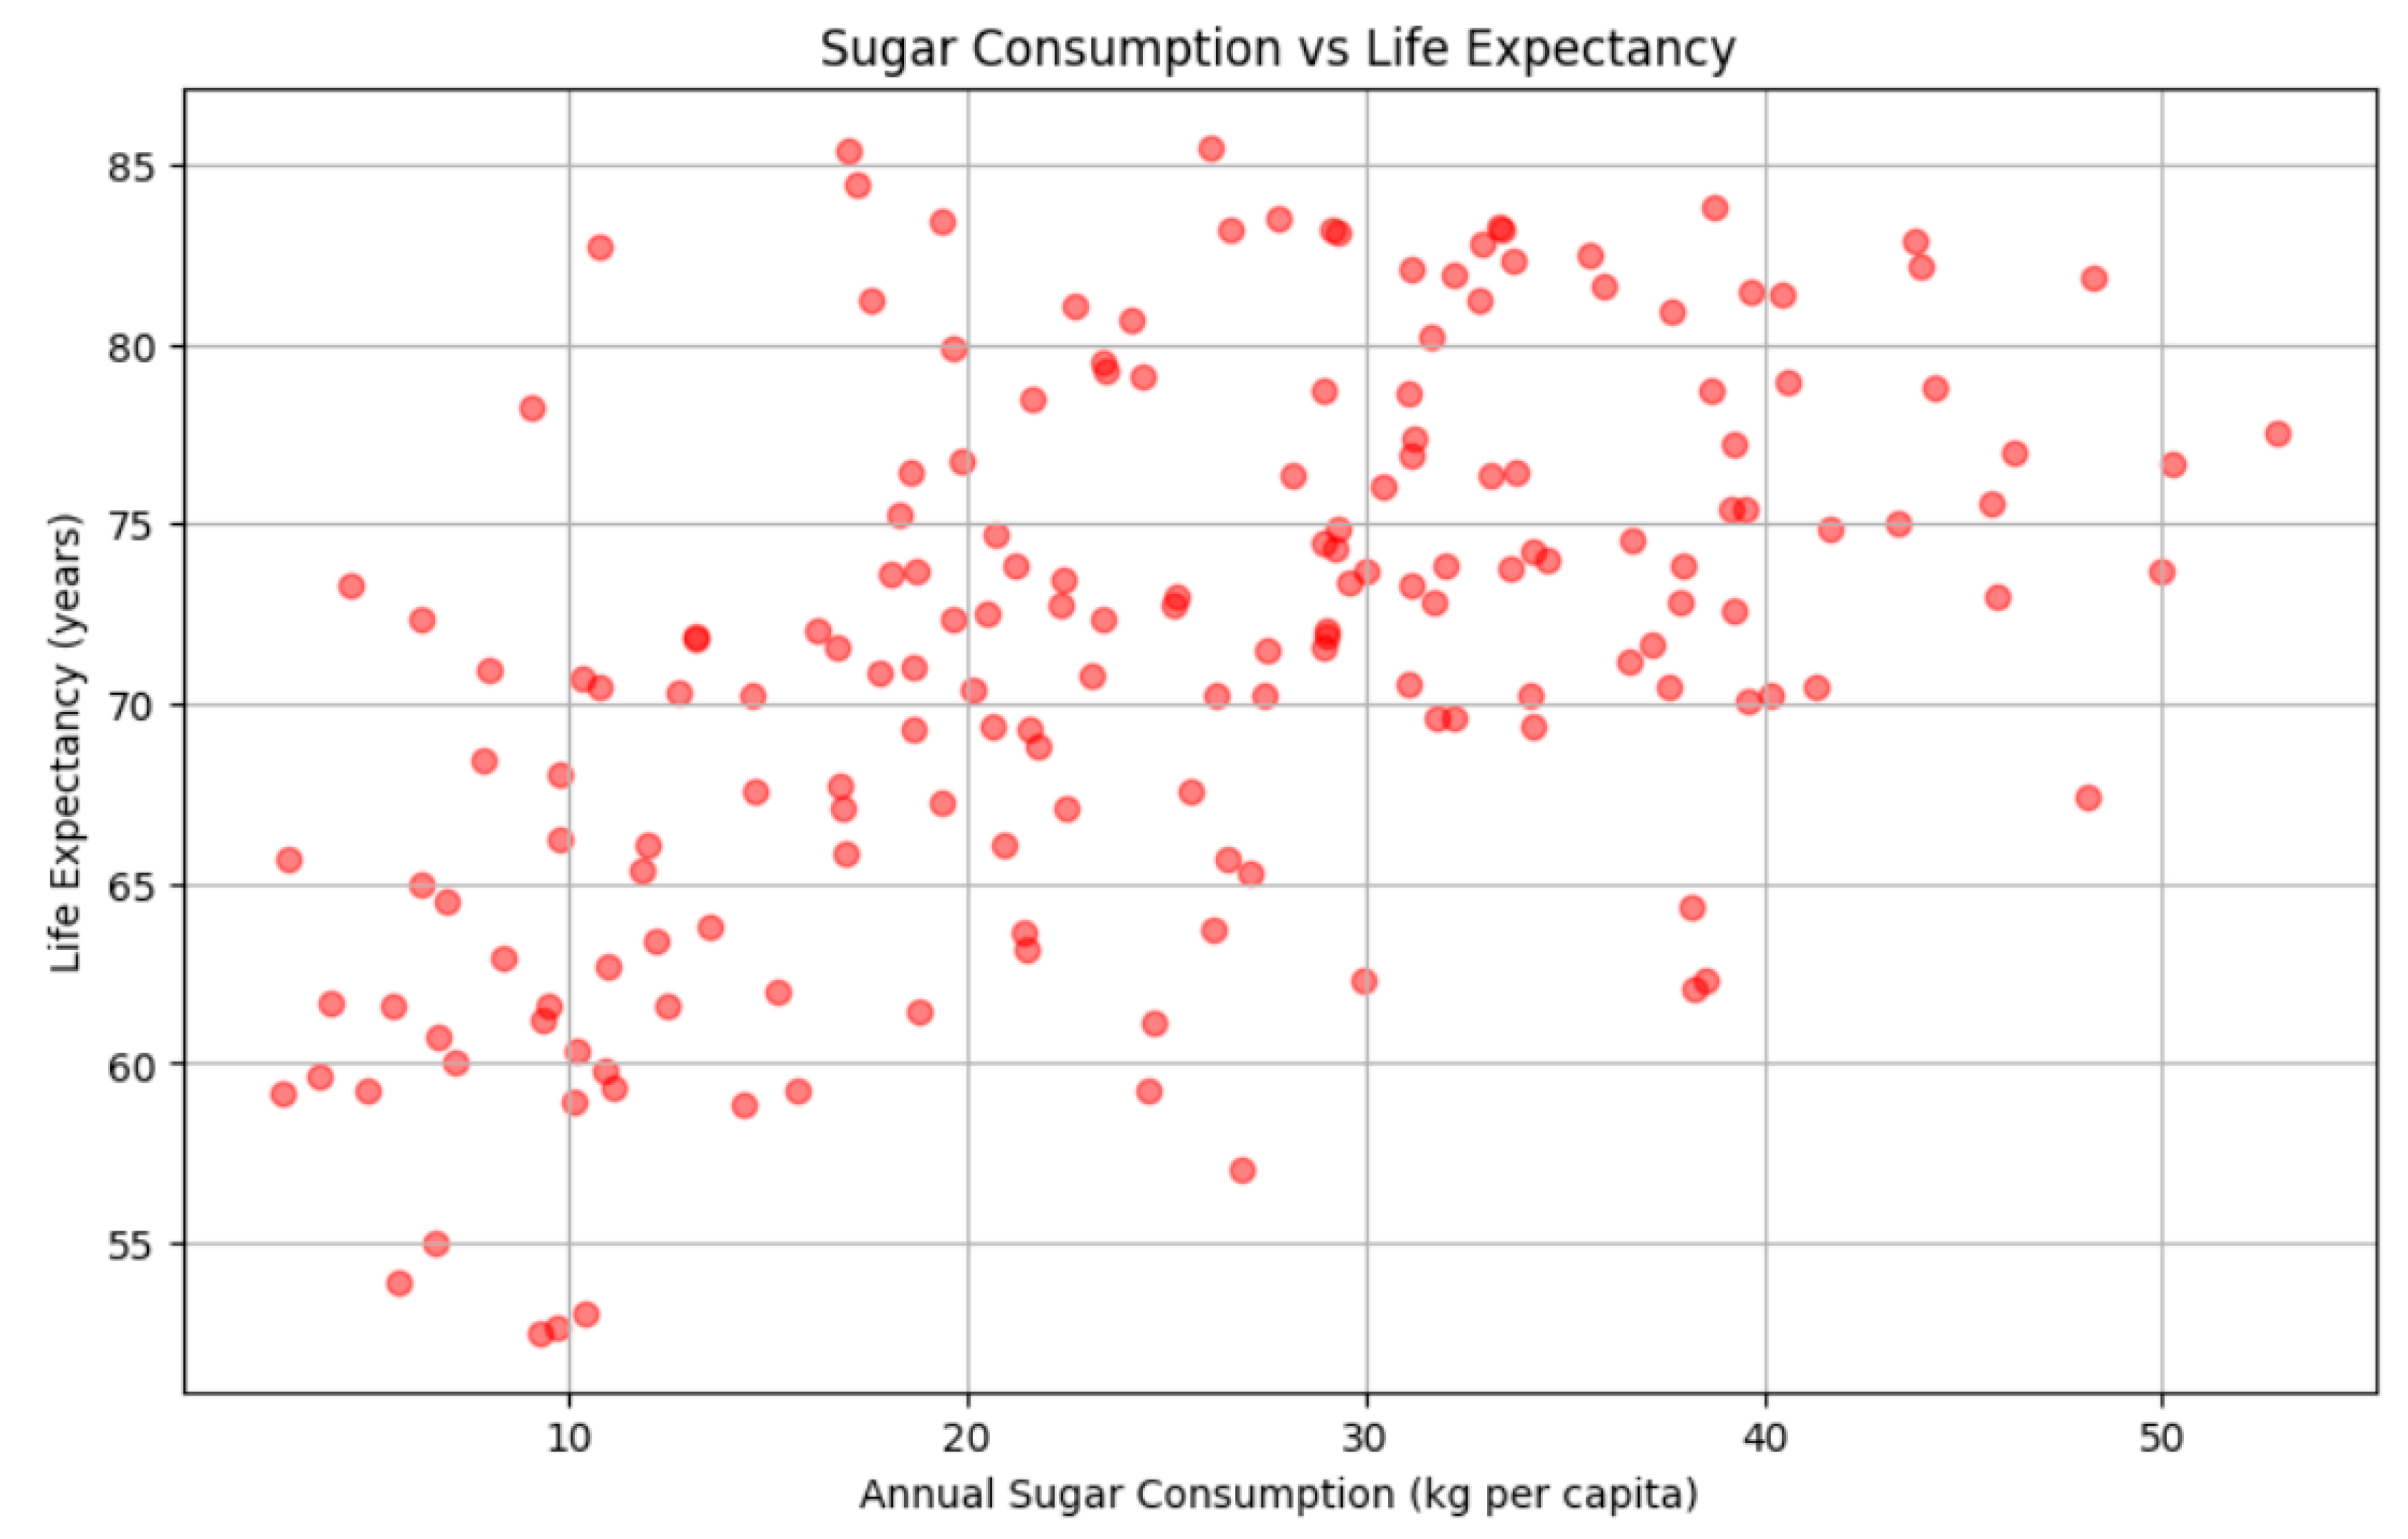
Figure 5.
Correlation between sugar consumption and life expectancy in high income countries.
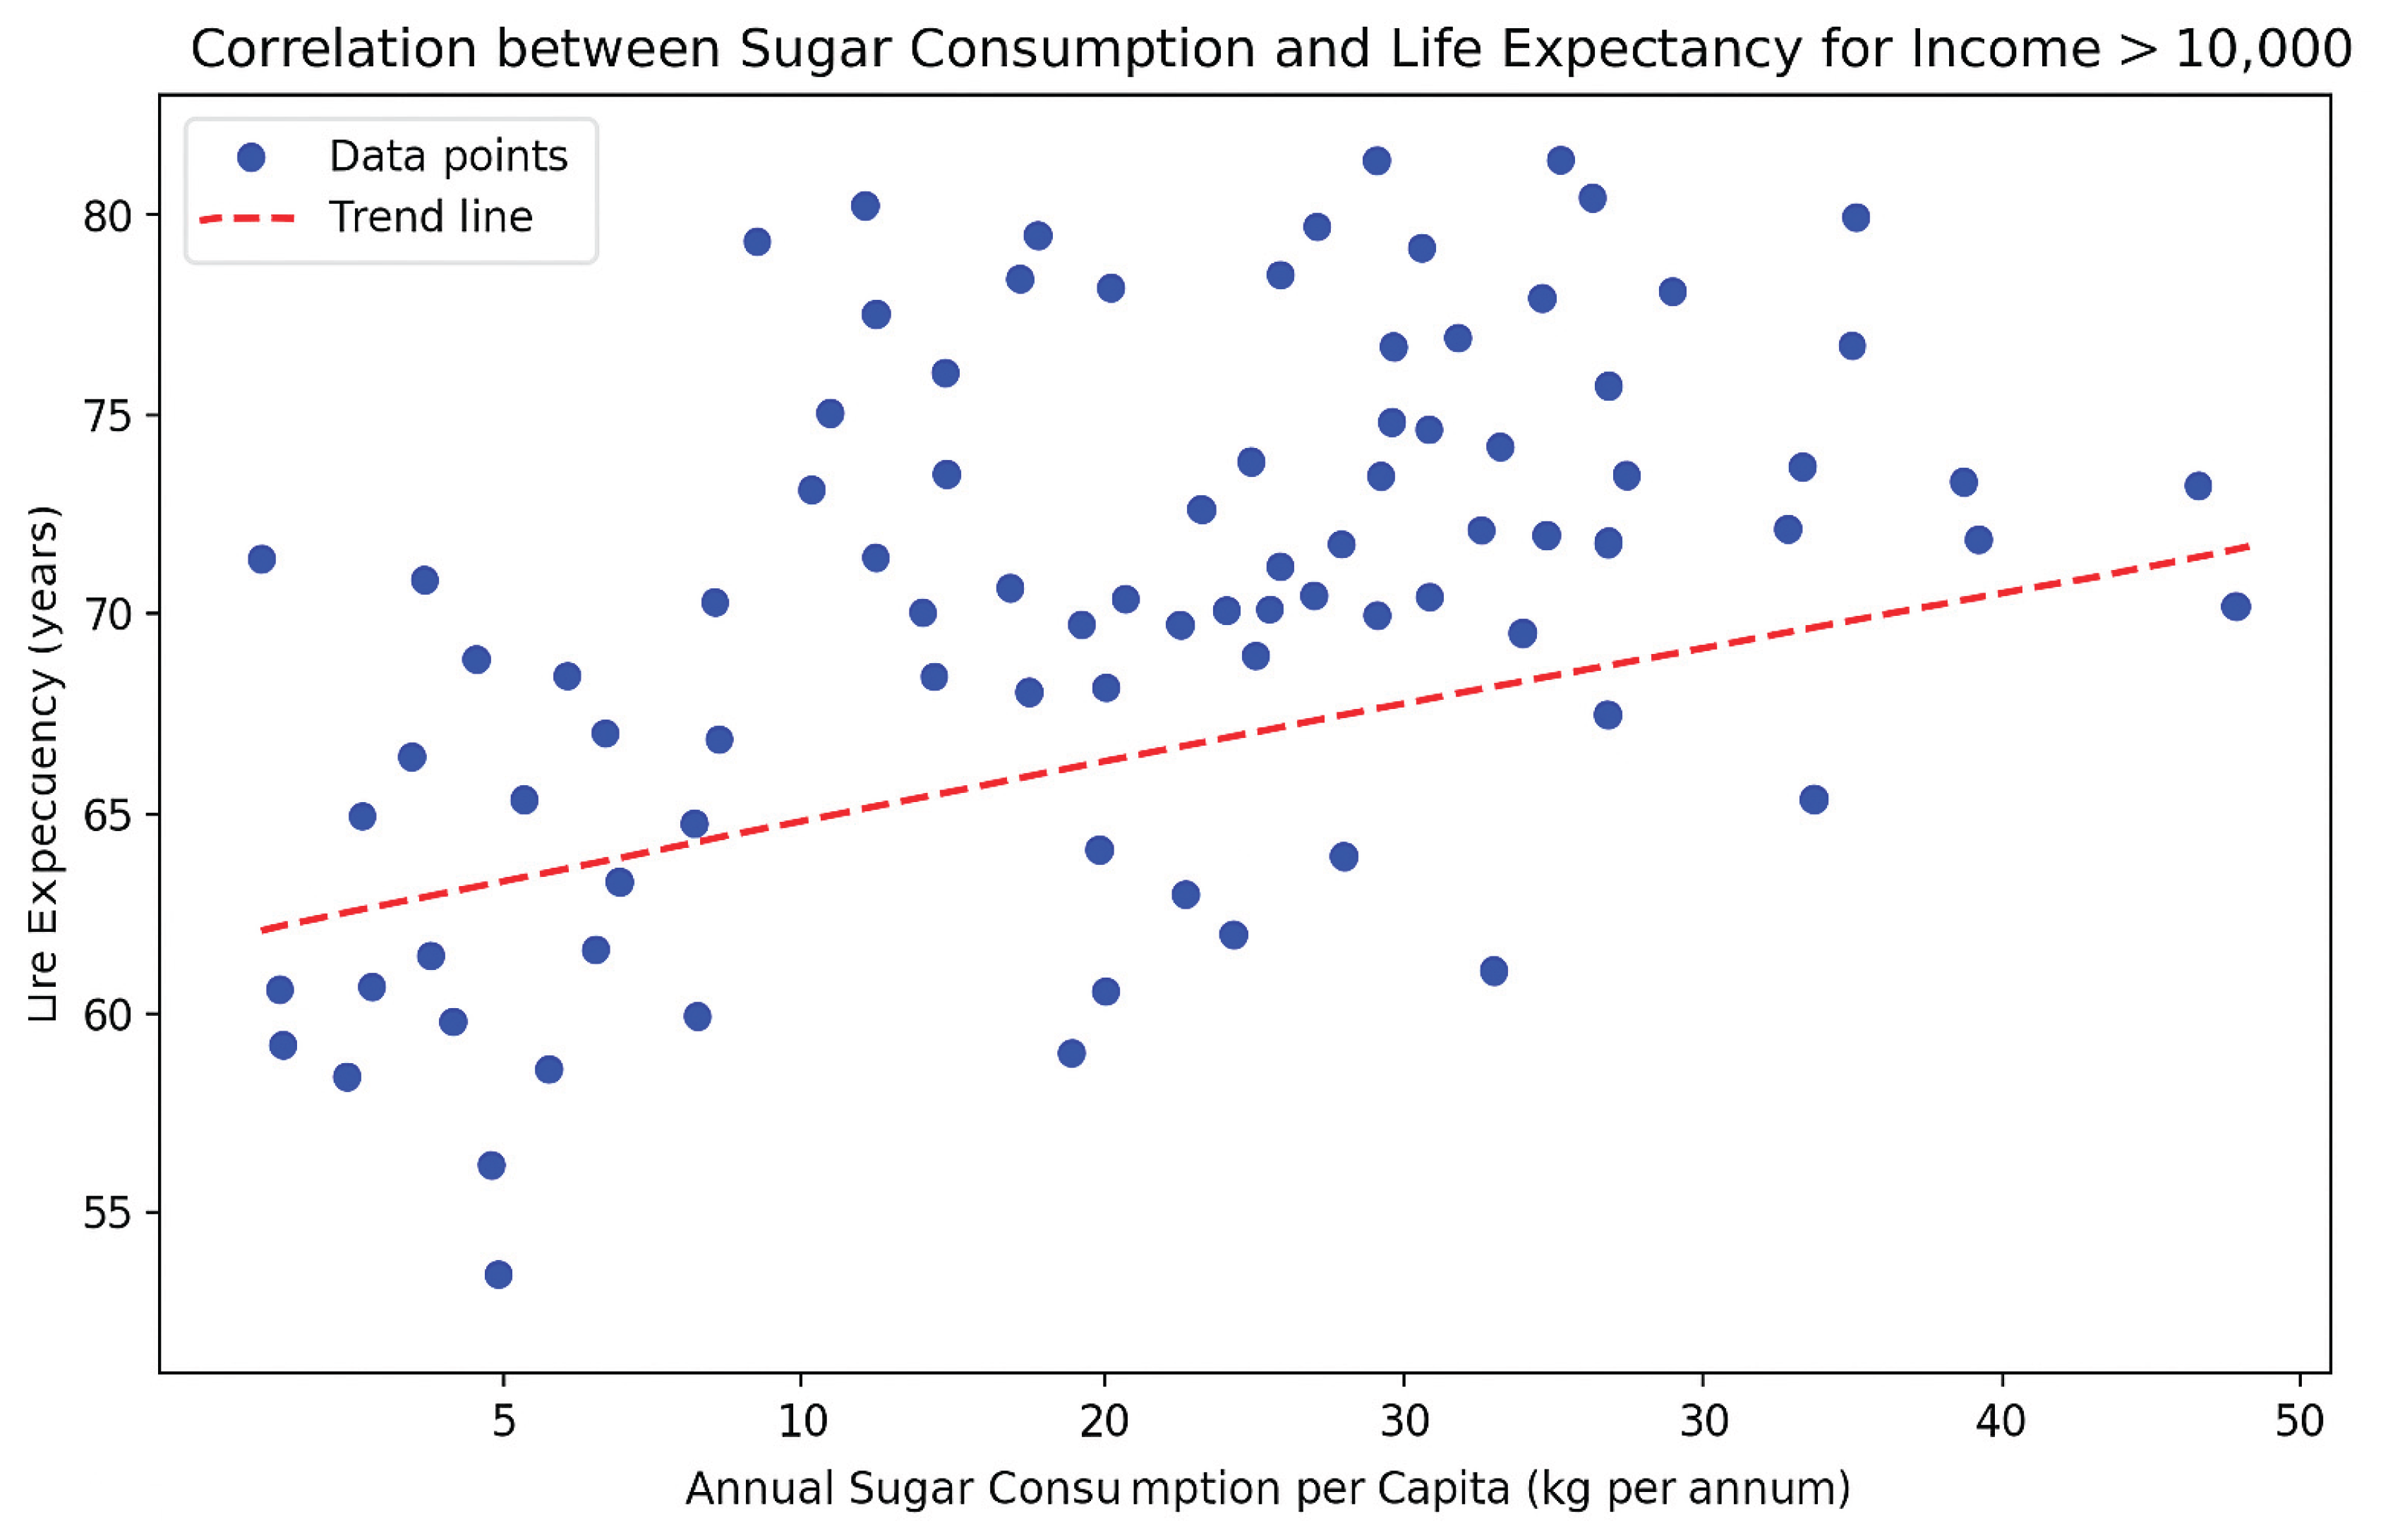
Figure 6.
Correlation between BMI and life expectancy.
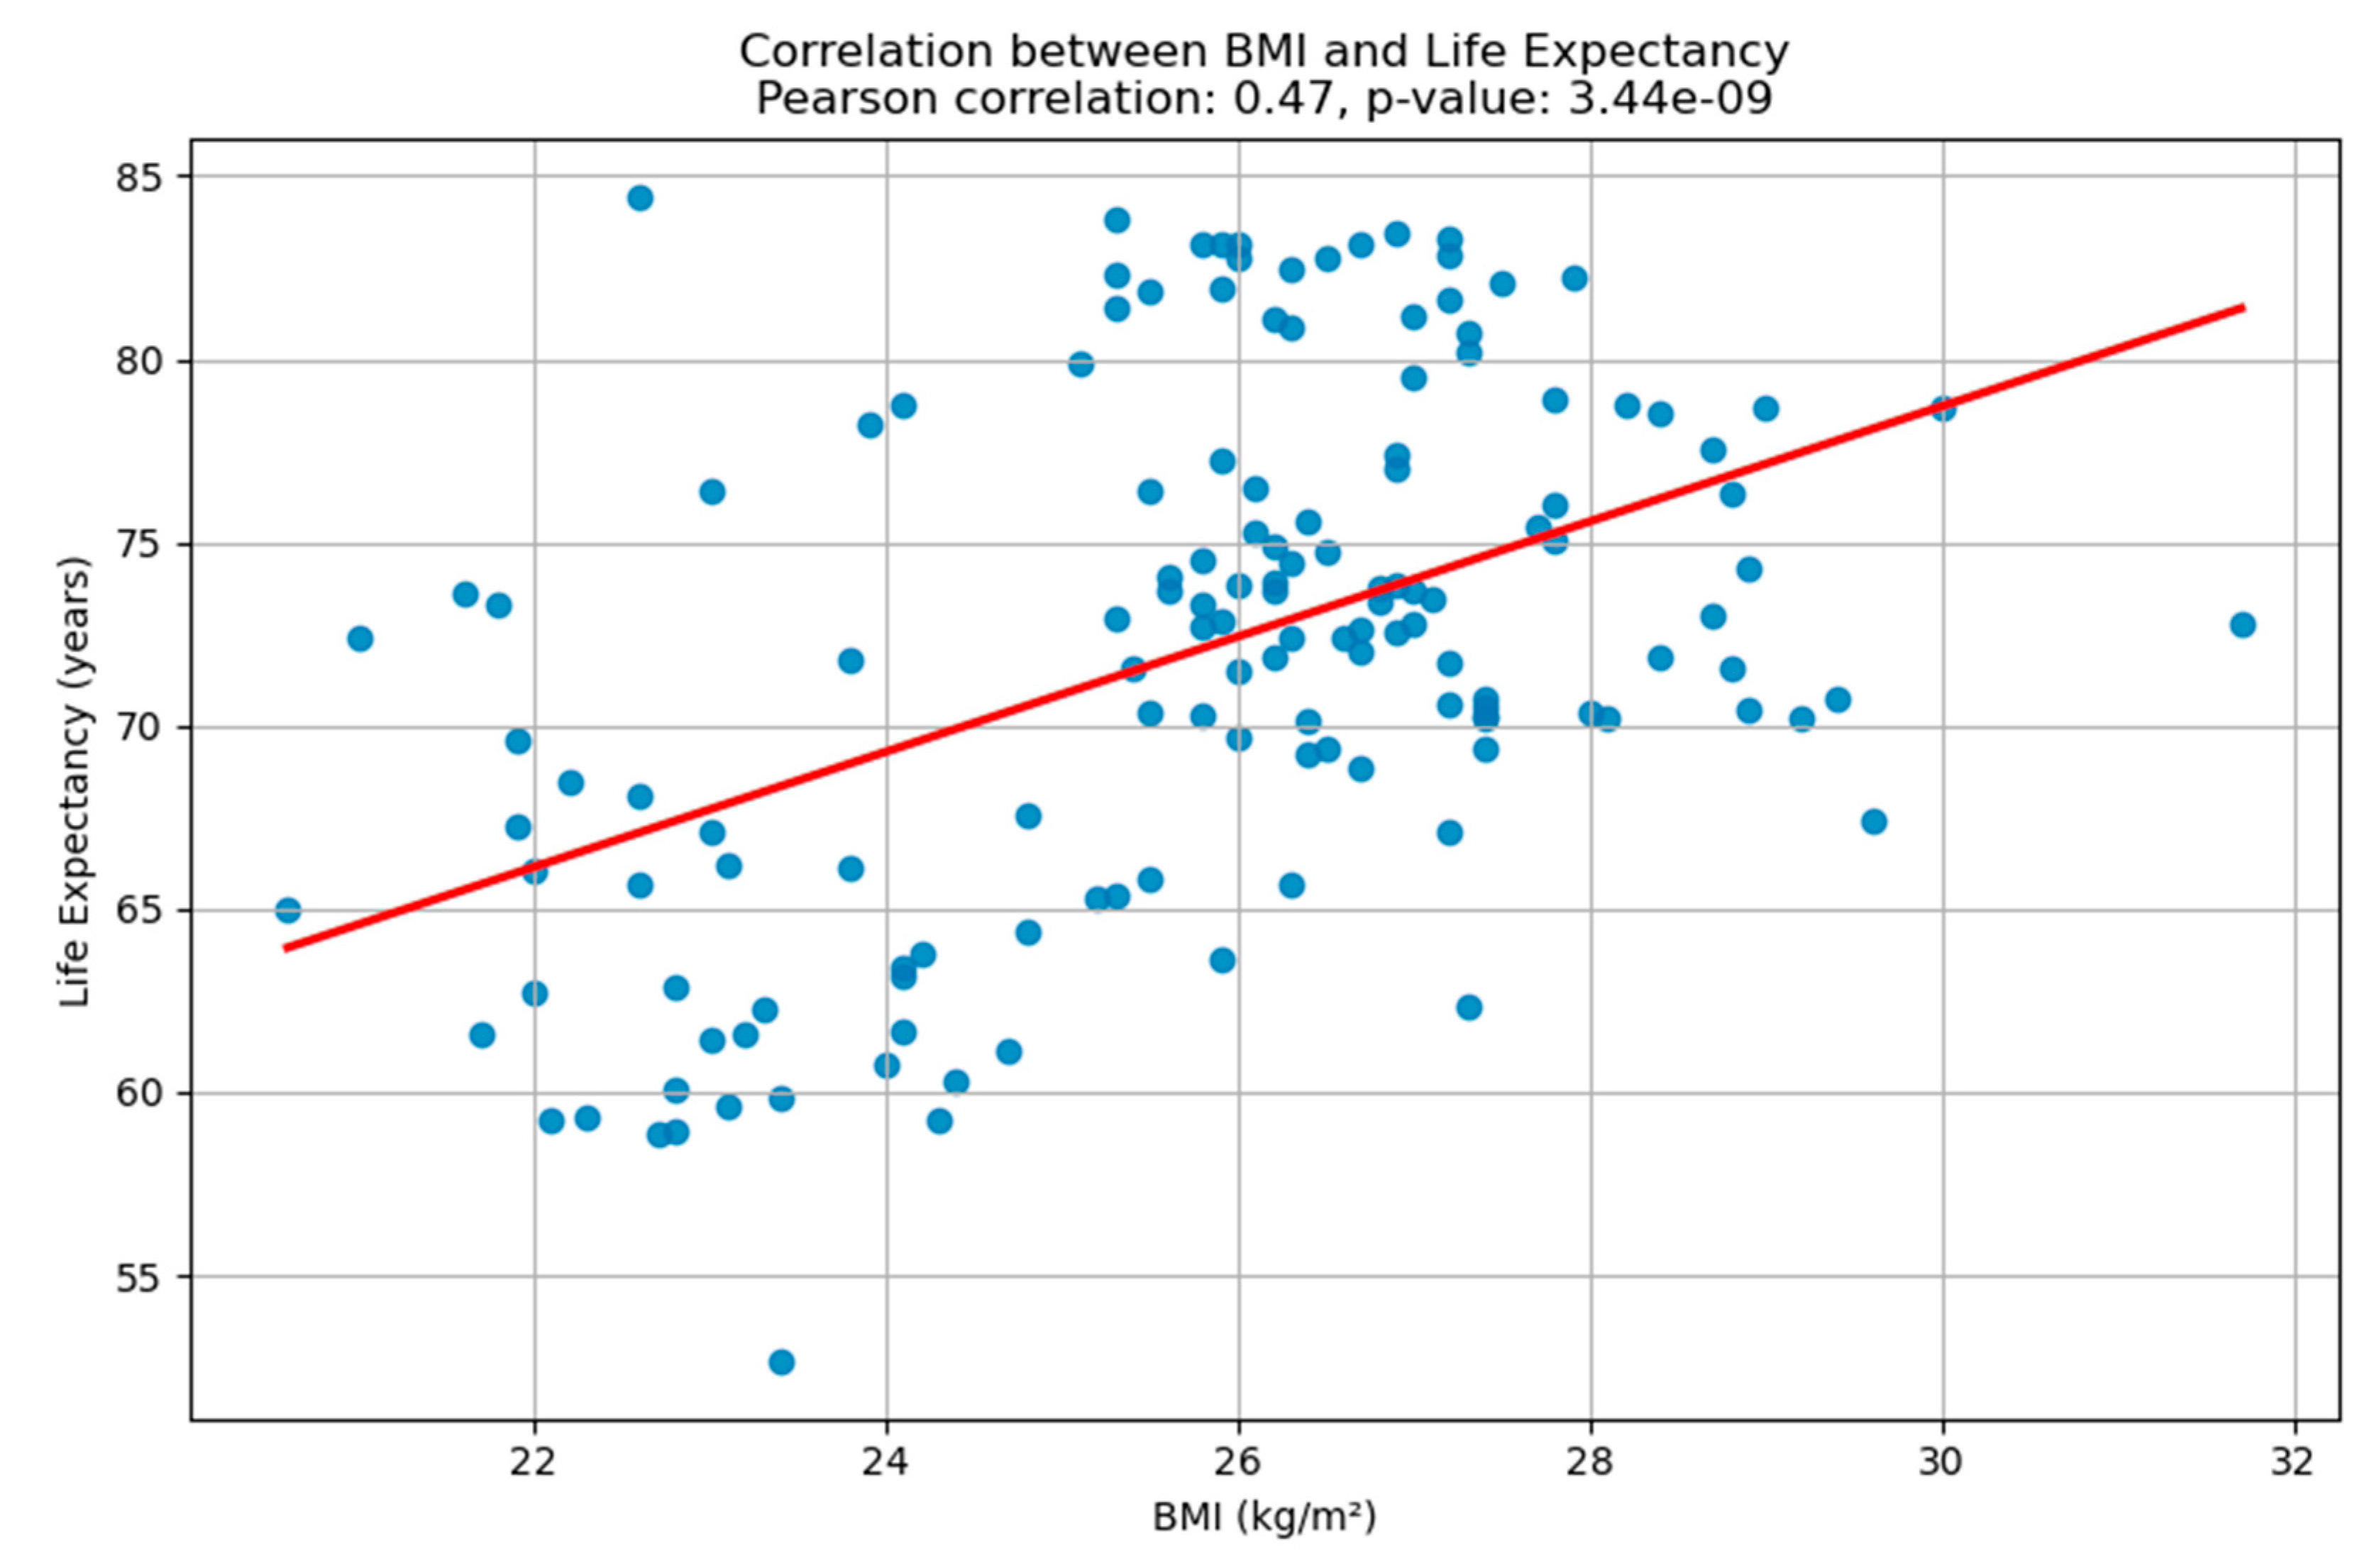
Figure 7.
Correlation between BMI and life expectancy grouped by per capita income.
Disclaimer/Publisher’s Note: The statements, opinions and data contained in all publications are solely those of the individual author(s) and contributor(s) and not of MDPI and/or the editor(s). MDPI and/or the editor(s) disclaim responsibility for any injury to people or property resulting from any ideas, methods, instructions or products referred to in the content. |
© 2025 by the authors. Licensee MDPI, Basel, Switzerland. This article is an open access article distributed under the terms and conditions of the Creative Commons Attribution (CC BY) license (http://creativecommons.org/licenses/by/4.0/).
Copyright: This open access article is published under a Creative Commons CC BY 4.0 license, which permit the free download, distribution, and reuse, provided that the author and preprint are cited in any reuse.


