
Submitted:
09 December 2024
Posted:
10 December 2024
You are already at the latest version
Abstract
Homogenization of sour cherry fruit in aqueous or alcoholic medium resulted in spontaneous assembly of cell wall components such as pectin, oligosaccharides linked to proteins, polyphenols and malic acid into spherical nanoparticles. These were detergent stable, uniform spherical structures ranging in size from 25–50 nm in solution and appear enlarged when dehydrated into a powder. A different type of nanostructure resembling fibers, ~5 nm in width, and several micrometers in length, was also isolated from ethanol-bleached cherry devoid of anthocyanins. The nanoparticles could be completely disrupted by treating them with polygalacturonase, indicating the presence of pectin among the constituent molecules. Also, treatment with cellulase and trypsin resulted in the removal of the outer fibrillar structures of the nanoparticles exposing an inner core. SDS-PAGE of nanoparticles revealed the presence of polypeptides of varying masses, co-migrating with pectin and anthocyanins. Both nanoparticles and nanofibers showed strong affinity to anti- arabinogalactan-protein complexes, and a far lower affinity to anti-extensin. The nanoparticles did not react with anti-homogalacturonan, while the nanofibers showed a very strong reaction. FT-IR spectra of the nanoparticles and the nanofibers showed absorption peaks characteristic to those of proteins and pectin. Both nanoparticles and nanofibers were internalized by cultured human cells efficiently. Treatment with nanofiber-paclitaxel adducts caused cytotoxicity in multidrug resistant colorectal cancer cells, suggesting that nanofibers may have applications in delivering bioactive molecules and materials with therapeutic potential into human cells.
Keywords:
fruit
; hemicellulose
; pectin
; glycoprotein
; nanodelivery system
; nanoparticle
; nanofiber
; cytotoxicity
; multi-drug resistance
; self-assembly
1. Introduction
Nanotechnology has influenced every facet of human life with applications in areas including material science and technology, medicine, agriculture, and food [1,2,3,4,5,6]. Nanotechnology provides great promise in improving agricultural productivity and reducing environmental impact. Agriculture is a highly chemical intensive area, as the chemical inputs are applied multiple times in the form of fertilizers, agrochemicals, pesticides, fungicides and herbicides, as well as various growth regulators. It is estimated that a significant portion (50-90%) of these chemical inputs are lost in the environment leading to pollution, affecting human and animal life negatively. Developing efficient means of delivering nutrients through nanotechnology will positively benefit productivity, economy, food security and health. Nanoparticle mediated delivery of therapeutic agents is an area of immense interest, because of its novelty and increased efficiency due to targeted delivery of therapeutic materials. The influence of nanomaterials on human health is also increasingly being scrutinized, as the use of engineered nanomaterials is increasing worldwide [7]. Engineered nanomaterials can escape into the environment as airborne nanostructured agglomerates (eg. silver nanoparticles, TiO2) or SWNT (eg. Single walled Carbon nanotubes) which enter the body through inhalation, ingestion, and penetration through skin, subsequently get mobilized into other organs. Engineered nanomaterials from biological components are also being explored for several type of applications, including drug delivery, cosmetics, food ingredients, coatings, food packaging materials etc. [8,9,10,11,12]. Nanomaterials can also enter the body through food chain, especially through the consumption of plant derived food that has accumulated such materials from soil, water and air [13].
As an omnipresent biological macromolecule in plants, and especially abundant in fruits and vegetables, the physicochemical properties of pectin have been well studied. Potential utility of pectin in medicine for drug encapsulation, targeted delivery and development of hydrogels for applications as skin protectants, either alone, or in combination with proteins, or synthetic molecules such as polyvinyl pyrrolidone, and polylactic acid has been well-explored [14]. Pectin-based materials have been consumed as food, and its ability as a food matrix for transporting encapsulated bioactives into the colon help protect the microbiome. Pectin-based nanostructures have been explored for drug delivery through multiple roots [15,16].
Three-dimensional structure of pectin matrices is influenced by the free carboxylic acid groups (homogalacturonans and rhamnogalacturonans). Pectin chains can exist as anionic chains stabilized by divalent ions such as calcium adopting various forms, based on pH of the embedded solution. Pectin formulations such as films, hydrogels, nanoparticles etc., have been explored for multiple medical applications. However, pectin-based matrices have some disadvantages such as low mechanical strength, low shear stability, low drug loading efficacy, and premature drug release. For this reason, chemical and physical alterations of pectin by blending or co-polymerization with biodegradable polymers such as chitosan, polylactic acid, starch, gelatin, soy protein, β-lactoglobulin, human serum albumin etc., to provide a higher charge density (positive primary amine and negative carboxyl group), have been explored. Production of ZnO-pectin nanoparticles ranging in size between 70–200 nm in diameter has been achieved to explore the possibility of enhancing Zn uptake in Zn-deficient population [17]. Such molecules have been observed to penetrate into the tissue deeper and able to provide better drug delivery. Thiolated nanoparticles of pectin have been prepared for better ocular drug delivery. SPIONs (superparamagnetic iron-based nanoparticles) and oxaliplatin were encapsulated in Pectin-Ca2+ to form pectin based spherical nanoparticles, 100–200 nm in diameter with magnetic function. The cancer drug paclitaxel was conjugated with pectin nanoparticles, and the process has been suggested to be influenced by the hydrophilicity of pectin (-OH and -COOH groups) as well as positively charged amide groups of asparagines [18,19]. Attempts have also been made to deliver several classes of drugs such as thiazoles with low solubility, cancer drugs, neuro-and mood controlling drugs, and insulin through pectin based nanoparticles [20]. Similar studies are advancing in plants, where, the charge, as well as shape of nanoparticles, determines their foliar bioavailability [21].
Formation of amorphous carbon nanoparticles have been observed to exist in caramelized food [22]. The occurrence of nanovesicular type components in grape juice [23] suggests that similar structures could be formed during processing where cell disruption occurs providing an environment for molecular interactions and self-assembly, resulting in the formation of well-defined biological nanostructures. The present study describes the physico-chemical characterization, properties, and potential functional uses of nanoparticles from sour cherry and its applications. As well, designer functional foods fortified with such nanocomponents can enhance bioavailability of nutrients that may help prevent chronic diseases.
2. Results and Discussions
2.1. Characterization of Nanoparticles
Homogenization of fruit in an aqueous medium disrupted the natural organization of cellular macromolecules resulting in their random assembly leading to the generation of well-defined novel nanostructures. Such structures complexed with anthocyanins were separated by dialysis, using a low molecular mass (6 kDa) cut off membrane. Polyphenol contents of the crude sour cherry extract, dialyzed extract containing nanoparticles, and the dialyzate are shown in Table S1. Nearly 80 % of the polyphenols in the extract were retained within the dialysis membrane, suggesting that the polyphenols existed in a complexed state. By comparison to other fruits such as grape and blueberry, complex formation was much higher in sour cherry. Extraction in methanol (~50 % v/v final) also resulted in the formation of nanocomplexes. Dialyzed extract could be lyophilized into a fluffy powder containing (w/w) protein (10–12 %), polyphenols (12–14 %), pectin (10–15 %), and other carbohydrates (eg. hemicellulose components such as xyloglucan, pectin components such as arabinogalactans, and complexed pectins (60–70 %). Once formed, the polyphenols in the nanocomplexes could not be extracted with ethanol (50–100 %). The complexes were acid stable (pH <3). Addition of 10 % trichloroacetic acid resulted in the precipitation of complexes as a reddish residue, however, alkaline conditions (>pH 7) resulted in the ring cleavage of polyphenols, potentially destabilizing the macromolecular organization. The nanocomplexes from ethanol-bleached cherry did not contain detectable amounts of polyphenols, but contained protein (~15 %), pectin (15–20 %) and other carbohydrates (hemicelluloses such as xyloglucans, pectic components such as arabinoxylans and complexed pectins, 60–70 %).
2.2. Ultrastructure of Nanoparticles
Transmission Electron Microscopy (TEM) of the dialyzed extract revealed nanoparticles with diameters in the range of 25 to 50 nm (Figure 1 A, arrow). The nanoparticles possessed linear fiber shaped components winding around a central structure (Figure 1 A, arrow). These structures can be seen stretching between two nanoparticles in the magnified view (Figure 1 B, arrow). Variation in the sizes of nanoparticles may arise from multiple layers of fiber-like structures winding around a central core. The fibers appear to be unwound (Figure 1 B, arrow) in several nanoparticles.
Organization of the fiber like structures around a central core suggests that these may be held together by non-covalent bonds, and changes in the external environment may dissociate the nanoparticles into their building units. Figure 2 shows the ultrastructural organization of the nanoparticles. In Figure 2 A the core structure of the nanoparticle was visible as a spherical unit, which is stripped of the winding fibers (arrow). The fibrous structures can be observed in the background. The substructure of the fibers showed spirally organized fibrils as seen in Figure 2 B and C (arrows 1, 2). Figure 2 D shows extended fibrous structures (arrow) composed of fibrils (arrow 2). Thus, the nanoparticles appeared to possess multiple levels of organization having a central core, fibers surrounding the core sometimes assembled as spirals that can be extended into long fibrils, potentially held together through non-covalent bonds.
2.3. Structural Components of Nanoparticles
Macromolecules that are present in ripe fruit are primarily carbohydrates such as cellulose, hemicelluloses, pectin, and glycoproteins associated with the cell wall [24]. The amount of soluble protein in ripe sour cherry is relatively low. Starch, a major storage component exists as high molecular mass structures, and is absent in ripe sour cherry. Anthocyanin accumulation increases during ripening imparting red color to the fruit. Nanoparticles were subjected to digestion using pectinolytic and cellulolytic enzymes and the morphology of complexes assessed by TEM. The effect of pectinase (polygalacturonase, α 1-4-glycosidase) treatment on the stability of nanoparticles is shown in Figure 3 A and a magnified region is shown in 3 B. After subjecting to pectinase digestion (1 unit/mL) the nanoparticles were totally disassembled into small tubular/vesicular structures interspersed within an electron dense matrix potentially formed by the binding of Uranium ions to negatively charged molecules of galacturonic acid in pectin [24]. It is interesting to note that these structures resembled the nanovesicles observed in grape juice [23]. This observation suggests that the nanoparticles contain a high level of polygalacturonic acid.
Nanoparticles were also treated with cellulase (β-1,4- glucanase, 1 unit/mL) and the resulting structural modifications examined by TEM. By contrast to pectinase digestion, treatment with cellulase resulted in the formation of much larger vesicles and vesicular aggregates (Figure 3 C and 3 D). Since cellulase cannot digest pectin, the structures left over after digestion must be made of nanoparticles. Therefore, the β-1,4-glucan moieties must form the part of the fiber-like structure surrounding the pectin core of the nanoparticles.
Nanoparticles were also treated with trypsin (1 unit/mL), which again digested the outer fiber-like structure of the nanoparticles leaving a core made of pectin (Figure 4 A). These structures were similar to the globose structures observed after cellulase treatment, suggesting that the outer fiber-like structure of the nanoparticles contained both β-1,4-glucan moieties and protein.
A magnified view of the shell structure after stripping the outer filaments by trypsin treatment is shown in Figure 4 B. Intermediary structures formed during trypsin digestion are shown in Figures 4 C, D and E. Figure 4 C shows a nanoparticle surrounded by concentric rings of fiber-like structures that are being released as a result of trypsin treatment. Figure 4 D shows a shell of the nanoparticle along with the fibers that are stripped of the complex. Figure 4 E shows the substructure of the fiber-like materials constituted by long fibrillar structures that are intermingled and woven around into an aggregate fiber structure. These fibrillary structures are long, several micrometers in length, and with a diameter of ~2–3 nm. The resilience of the nanoparticles to chemical treatments may come from this structural complexity that stabilizes its structure, potentially through non-covalent interactions by different types of macromolecules.
2.4. Scanning Electron Microscopy (SEM) of Dry Nanoparticles
Nanoparticles were lyophilized, and upon removal of water, an amorphous powder was obtained. Examination of this powder by SEM revealed structural transitions that may lead to the formation of nanoparticles. The size distribution of lyophilized nanoparticles is shown in Figure 5. In the dry form, the size of these particles ranged from < 200 nm to over a micrometer in diameter. This is nearly 10-fold higher than what was observed in the hydrated nanoparticles in suspension (Figure 1 A), where the size distribution was from 25 to 50 nm. This suggests that during slow dehydration, water bound to the nanoparticles are removed leading to an expansion of the complex. Rehydration of the powder by suspending in water resulted in their reversal to smaller nanoparticles. In addition to spherical structures, tubular structures were also observed in the lyophilized powder (Figure S1, arrow 2), probably resulting from pectin which is not transformed into nanoparticles. Figure S1 shows the heterogeneity of transitory structures in the form of sheets (arrow 1), filaments (arrow 2), tubes (arrow 3), and vesicles all of which can be seen in an intermingled state. A region showing the budding of vesicles from tubular structures is shown by arrow 4. Thus, in terms of their origin, it appears that the sheets tend to form tubular structures, which may bud off vesicular structures. These globular structures may further get coated with pectin-polypeptide-cellulose fibers during the formation of nanoparticles.
2.5. SEM of Nanofibers from Ethanol-Bleached Cherry
As the polyphenols were tightly bound to the nanoparticles and was difficult to remove by solvent (alcohol, DMSO, acids) extraction, the polyphenols were removed (>95 %) from the fruit by immersing the fruits in ethanol. Removal of polyphenols resulted in a total structural change of the nanocomplexes. Examination of the lyophilized powder by SEM and TEM showed extended strands or fiber-like structures that were nanometers (4–5 nm) in diameter, and micrometers in length (Figure 6 A). These features were retained in an aqueous condition (Figure 6 B). These fibers also showed regions with a helical structure (Figure 6 B, arrow 2). Thus, it appears that polyphenols have a major role in determining the structural organization of the nanocomplexes. Structurally, polyphenols are known to interact with both pectin and cellulose through ionic and hydrogen bonding [25]. Polyphenols interacted with both cellulose and pectin components in a biphasic process with binding as high as 18 %. Cellulose-pectin composites composites showed the highest binding. Thus, a combination of polypeptides, pectin and cellulose may thus provide a highly favorable environment for polyphenol binding. The presence or absence of polyphenols may thus influence the outcome of self-assembly in a fruit homogenate, either resulting in the formation of nanoparticles or nanofibers, respectively.
2.6. Stability of Nanoparticles to Detergents
The stability of nanoparticles was further examined by treating the dialyzed extract with detergents such as Triton X-100 and sodium deoxycholate, that did not disrupt the macromolecular structures of nanoparticles (Figure S2). These results also suggested the absence of lipids among the structural components of nanoparticles.
2.7. Co-migration of Polypeptides and Anthocyanins-SDS-PAGE Analysis
Since the nanoparticles contained polypeptides of various molecular masses, the nature of their association with pectin and polyphenols was examined. Protein fractions were analyzed by SDS-PAGE as described elsewhere (Supporting information). Figure 7 A shows a photograph of the gel after separation of peptides before staining with Coomassie brilliant blue, to reveal the pink trailing color due to the presence of anthocyanins migrating along with the polypeptides. The same gel was stained with Coomassie brilliant blue to reveal the presence of polypeptides (Figure 7 B). Lane 2 (Figure 7) shows the staining pattern of peptides isolated from nanoparticles as well as nanofibers.
A comparison of lane 2 in Figure 7 A and B reveals the similarity in the migration of anthocyanin (Figure 7 A, lane 2) and peptides (Figure 7 B, lane 2), suggesting that the polyphenols are tightly bound to the polypeptides in the nanoparticles. Polyphenols are small and uncharged molecules compared to peptides, and will not co-migrate with polypeptides if they were not complexed. Nanoparticles were subjected to Trizol extraction and phase separation. Lane 3 (Figure 7 A & B) corresponding to the aqueous supernatant fraction showed the presence of both polypeptides and anthocyanins, indicating their tight association. This property also suggests the hydrophilic nature of peptide-carbohydrate-polyphenol complexes, because, in the absence of complex formation, polypeptides by themselves would have partitioned into the organic (phenol:chloroform) phase of Trizol extract. However, as shown (Figure 7, lane 7), the organic phase from Trizol extract of the nanoparticles did not possess any polypeptides. Lanes 8, 9 and 10 respectively correspond to the supernatant, interphase and the organic phase obtained after Trizol extraction of nanofibers from ethanol bleached cherries devoid of anthocyanins. Even though removal of polyphenols resulted in structural transition of nanoparticles from a spherical to a fiber structure, the polypeptides are still an integral part of the nanofibers (Figure 7 B, lane 8). The interphase and the organic phase of nanofiber extract showed minimal staining for peptides (Figure 7 B, lanes 9, 10).
The pectin nature of carbohydrates and their association with polypeptides in the nanoparticles was also revealed by the similarity in staining with propidium iodide and Coomassie brilliant blue after SDS-PAGE. Propidium iodide has been reported to be a stain for pectic acid [26]. Figure 7 C shows the staining pattern of nanoparticles with propidium iodide (10 µM in water). The lower panel 7 D shows a corresponding gel stained with Coomassie brilliant blue. A sample of authentic pectin shows minimal staining for pectin and polypeptides (lane 1, 7 C and D). The staining of pectin with propidium iodide is due to the presence of negatively charged free carboxylic acid groups. If the carboxylic acid groups are blocked by methylation as a natural occurrence in some pectin samples, staining will be reduced. Lane 2 shows the migration pattern of peptides in nanoparticles showing the distribution of pectin (7A, C), and polypeptides (7 D). Lane 3 shows the aqueous fraction of nanoparticles subjected to Trizol extraction, with reduced levels of pectin and marginal level of polypeptides. Lane 4 corresponds to a standard of polygalacturonic acid which shows staining with propidium iodide, and not for polypeptides. Pellet of the sour cherry homogenates (post 12000×g) also showed the presence of polypeptides, and marginal levels of pectin, (lane 5); which is quite distinct from that of the extracts of nanoparticles (lanes 2, 3).
Further analysis of the chemical nature of the nanoparticles was conducted by Western blot analysis Figure 8). Nanoparticles and nanofibers were resuspended in glycerol:water and subjected to SDS-PAGE and immunolocalization with structure specific monoclonal antibodies (rat IgM) raised against homogalacturonan (a twentymer of α-1,4-galacturonic acid with intervening methylated units which forms a principal backbone structure of pectin), extensin (the major cell wall glycoprotein), and arabinogalactan-protein (a major pectin-linked to protein). The bound antibodies were detected with alkaline phosphatase conjugated goat-anti rat IgG. Figure 8 A shows the staining pattern of nanofibers (lane 2) and nanoparticles (lane 3) by Coomassie brilliant blue. Staining intensity with Coomassie brilliant blue is considerably reduced after ethanol extraction of polyphenols, suggesting potential loss of polypeptides along with polyphenols (lane 2). Figure 8 B shows the reactivity of homogalacturonan antibodies against nanofibers (lane 2) and nanoparticles (lane 3). Interestingly, reactivity towards homogalacturonan was more intense in nanofibers as compared to nanoparticles (lane 3). This is again reflected in the intensity of dot blots shown below 8 B. This differential staining potentially reflects the degree of accessibility of homogalacturonan moieties by the antibodies in the nanofibers vs nanoparticles. In nanoparticles, pectin forms the core shell, and is potentially masked by peptides, hemicelluloses and anthocyanins. These may hinder the accessibility of the anti-homogalacturonan antibody to the interior. While in nanofibers, the pectic moieties are potentially exposed which enable strong interaction with the anti-homogalacturonan antibody. Again, by the removal of polyphenols, the homogalacturonan moieties in nanofibers may become exposed to a greater extent that can lead to increased reactivity to the antibody. As well, these results suggest that anthocyanins are an integral part of the nanoparticles. Incubating nanofibers with cherry polyphenols did not reverse the transformation from the fiber form to the spherical form (data not shown), however, both forms are structurally stable. Nanoparticles and nanofibers showed a mild reactivity towards anti-extensin, an antibody raised against the major cell wall protein in fruits (Figure 8 C). The dot blots against anti-extensin also showed minimal reactivity. However, a very strong reaction was observed against anti-arabinogalactan-protein (pectin-protein) by both nanoparticles and nanofibers, suggesting that this may be a major component of both structures (Figure 8 D, lanes 2, 3; dot blots). Differences were also noticed in the reactivity of nanofibers and nanoparticles to anti-xyloglucan (LM 15; antibody recognizes epitopes having x-x-x-G structural sequence) in dot blots. Strong reactivity was seen with nanofibers indicating exposed xyloglucan moieties, while with nanoparticles, no reactivity could be observed suggesting their hidden nature or compositional difference (Figure 8 A, dot blot).
2.8. Peptides in Nanoparticles
In addition to carbohydrates, peptides form a significant portion of structural components in the nanoparticles and nanofibers. These peptides may originate due to protease activity during ripening. While nanoparticles show intense Coomassie brilliant blue staining of peptides, these are less clear in SDS-PAGE of nanofibers (Figure S3). Two distinct bands with relative molecular masses of 40 kDa and 20 kDa were observed in nanofibers (Figure S3 A, B, lane 3). These were sliced from the gel and peptides sequenced. Sequencing revealed peptide fragments corresponding to pathogenesis related proteins as shown in the Figure S3. The band 1 in figure 3 corresponded to Glucan endo-1,3-beta-glucosidase (Accession #P50694) in cherry, and band 2 contained fragments that corresponded to major cherry allergen Pru a1 (Accession #O24248) (Figure S3). Nanoparticles also contained a peptide band with similar mobility as in nanofibers (Figure S3, lane 2). As revealed by the staining of the gels, there appear to be several peptides that are potentially part of the nanoparticle/nanofiber structure that provides the versatile properties of these entities.
2.9. Organic Acid and Sugars
Organic acids have also been found to be incorporated into nanoparticles and nanofibers. Malic acid is the major organic acid present in both nanoparticles and nanofibers (Figure S4). These small molecules may serve as bridging molecules to provide structural stability to nanoparticles and nanofibers through hydrogen bonding. Hydrolysis of nanoparticles and nanofiber with TFA under harsh conditions, and trimethylsilylation of resulting sugars, enabled to identify potential differences in sugar composition between the two structural forms. While nanoparticles are enriched in hexoses such as mannose, glucose, and galacturonic acid, the nanofibers appear to be enriched in pentoses such as arabinose, and xylose along with glucose and galacturonic acid (Figure S5). Such differences may also contribute to the differences in reactivity to antibodies discussed earlier.
FT-IR analysis of the nanoparticles and the nanofibers showed similar spectral characteristics between nanoparticles, nanofibers and authentic polygalacturonic acid (Figure S6).
2.10. A Proposed Model for Structural Organization of Nanoparticles
Potential organization of structural components in the nanoparticles can be elucidated from several results. The electron micrograph of a single nanoparticle is shown in Figure 9 A. Though most of the nanoparticles are in the size range of 25 to 50 nm in diameter, occasionally large complexes are formed exceeding 100 nm in diameter. It is likely that the larger size may make such complexes structurally unstable in comparison to the smaller nanoparticles. The large nanoparticles that appear spherical under normal conditions become collapsed occasionally revealing structural details. In the micrograph, the collapsed area is shown in the center (arrow 1). This observation is consistent with the results obtained after enzyme (trypsin, cellulase) treatment where nanoparticles are stripped off from their outer structures revealing a spherical, pliable, pectin core. The core is likely formed by homogalacturonan moieties and surrounded by other structural components, since the nanoparticle does not show cross reactivity to antibodies raised against homogalacturonan. The collapsed structure suggests that the interior of the core may be hollow. The core is surrounded by fibrous region (Figure 9 A, arrow 2) constituted by homogalacturonan and protein, as deduced by its susceptibility to pectinase and trypsin. Anthocyanins may have a significant role in stabilizing the outer region. Removal of anthocyanins with ethanol results in a fiber structure, potentially resulting from the unwinding of the outer structures into long fibers. These fibers show strong reactivity to homogalacturonan antibodies when anthocyanins are removed, which suggests that anthocyanins may mask the outer fiber structures. Exterior to the fiber structures covering the pectin core, there appears to be another distinct layer of fibrils (Figure 9 A, arrow 3). It is likely that the composition of this layer is different from that of the interior layer since this may primarily be constituted by arabinogalactan-protein complexes showing high reactivity against arabinogalactan-protein antibodies, indicating their exterior location and enhanced accessibility to the antibodies. Arabinogalactan-proteins are also a part of the nanofibers. Thus, the nanoparticles and the nanofibers possess similar components, but are organized as physically distinct structures. An enlarged view of the nanoparticle (Figure 9B) shows the helical structures on the inner layer of the nanoparticle and interior region (arrows).
2.11. Polyphenol Content in the Nanoparticles
The aqueous extracts of sour cherry containing nanoparticles, in general, contained 0.88 to 0.94 mg/g fresh weight of polyphenols comprising anthocyanins and simple phenolic, while in methanol extracts, polyphenol content ranged from 1.04–1.13 mg/g fresh weight (Table S1). During dialysis against water or aqueous methanol (50 % v/v final) nearly 80 % of the polyphenols was retained within the dialysis bag as nanoparticles (Table S1). The polyphenol content of the dialyzed extract containing nanoparticles ranged from 0.63–0.65 mg/g fresh weight, while dialysis in aqueous methanol resulted in polyphenols ranging from 0.70–0.80 mg/g fresh weight. Sour cherry juice contained a much higher content (>80 %) of polyphenols as nanoparticles. Blueberry was intermediate in its ability to form nanocomplexes. The phenolic composition of nanoparticles was analyzed by HPLC-MS (Table S2) and the components were similar to those reported earlier [27]. Anthocyanins constituted the major proportion of phenolic components (>90 %) with a minor proportion of phenolic acids (<10 %). Cyanidin-3-rutinoside was the major anthocyanin (~70 %) followed by peonidin-3-rutinoside. Pelargonidin-3-rutinoside and cyanidin-3-sophoroside were present at ~10–12 %. Chlorogenic acid and p-coumaroylquinic acid were the major phenolic acids. In terms of quantity, the dialyzed extract had a higher content of cyanidin-3-rutinoside (~25–30 % higher) than the dialyzate, showing specific enrichment by forming nanocomplexes.
2.12. Functional Attributes of Nanoparticles and Nanofibers – Uptake of Nanofibers by Mammalian Cells
To evaluate the ability of the nanoparticles and nanofibers to enter the cells, these were conjugated with Dylight 650 (excitation 650 nm, emission 670 nm). Three mammalian cell lines were used in this study, which included a colorectal cancer cell line (HT 29), a multidrug resistant colorectal cancer cell line (CRL 2158) and a normal human intestinal cell line (CRL 1790). The cells were exposed to the dye solution and examined under a confocal microscope. The nanoparticle- and nanofiber-conjugates of the dye was internalized by the cells and after 10–15 min, they were clearly visible compartmentalized in vesicular structures, potentially mitochondria (Figure S7). Figure S7 A and B show the uptake of nanoparticles and nanofibers, respectively by HT 29 cells. C and D show the uptake of nanoparticles and nanofibers respectively by CRL 2158 cells. Uptake of conjugated nanoparticles and nanofibers into normal human intestinal cells is shown in Figure S7 E and F, respectively. These results confirm that both the nanoparticles and nanofibers are able to cross the cell membrane and accumulate in specific organelles. The absorption of Dylight was a demonstration of uptake of a molecule chemically conjugated to nanoparticles and nanofibers. To evaluate the capability of nanofibers to form stable adducts that can cross cell membrane, nanofiber-calcein adducts were prepared by mixing nanofibers (10 mg) with excess amount of calcein (10 mg) and dialyzed against water. Calcein is impermeable to cell membrane in the carboxylic acid form and may be taken up at a low level by endocytosis. The complexed nanofiber-calcein was used to evaluate uptake into mammalian cells (HT 29 and CRL 1790). Nanoparticles were not used because of the quenching of calcein fluorescence by anthocyanins. Uptake of free calcein and nanofiber-calcein adducts were evaluated by confocal microscopy (Figure 10). Absorption of free calcein was minimal in both HT 29 and CRL 1790 cells (Figure 10 A, C). The nanofiber-calcein adducts were taken up far in excess, showing that nanofibers can form stable adducts with other molecules and carry them into the cells (Figure 10 B, D). Fluorescent adducts appear to accumulate in discrete spherical compartments which could be mitochondria, lysosomes or both because of their positive charge. Ligand-binding to nanofibers appear to be pH dependent, favoring binding at low pH. The uptake was rapid attaining saturation within 30 min, and may bypass an endosomal carrier system.
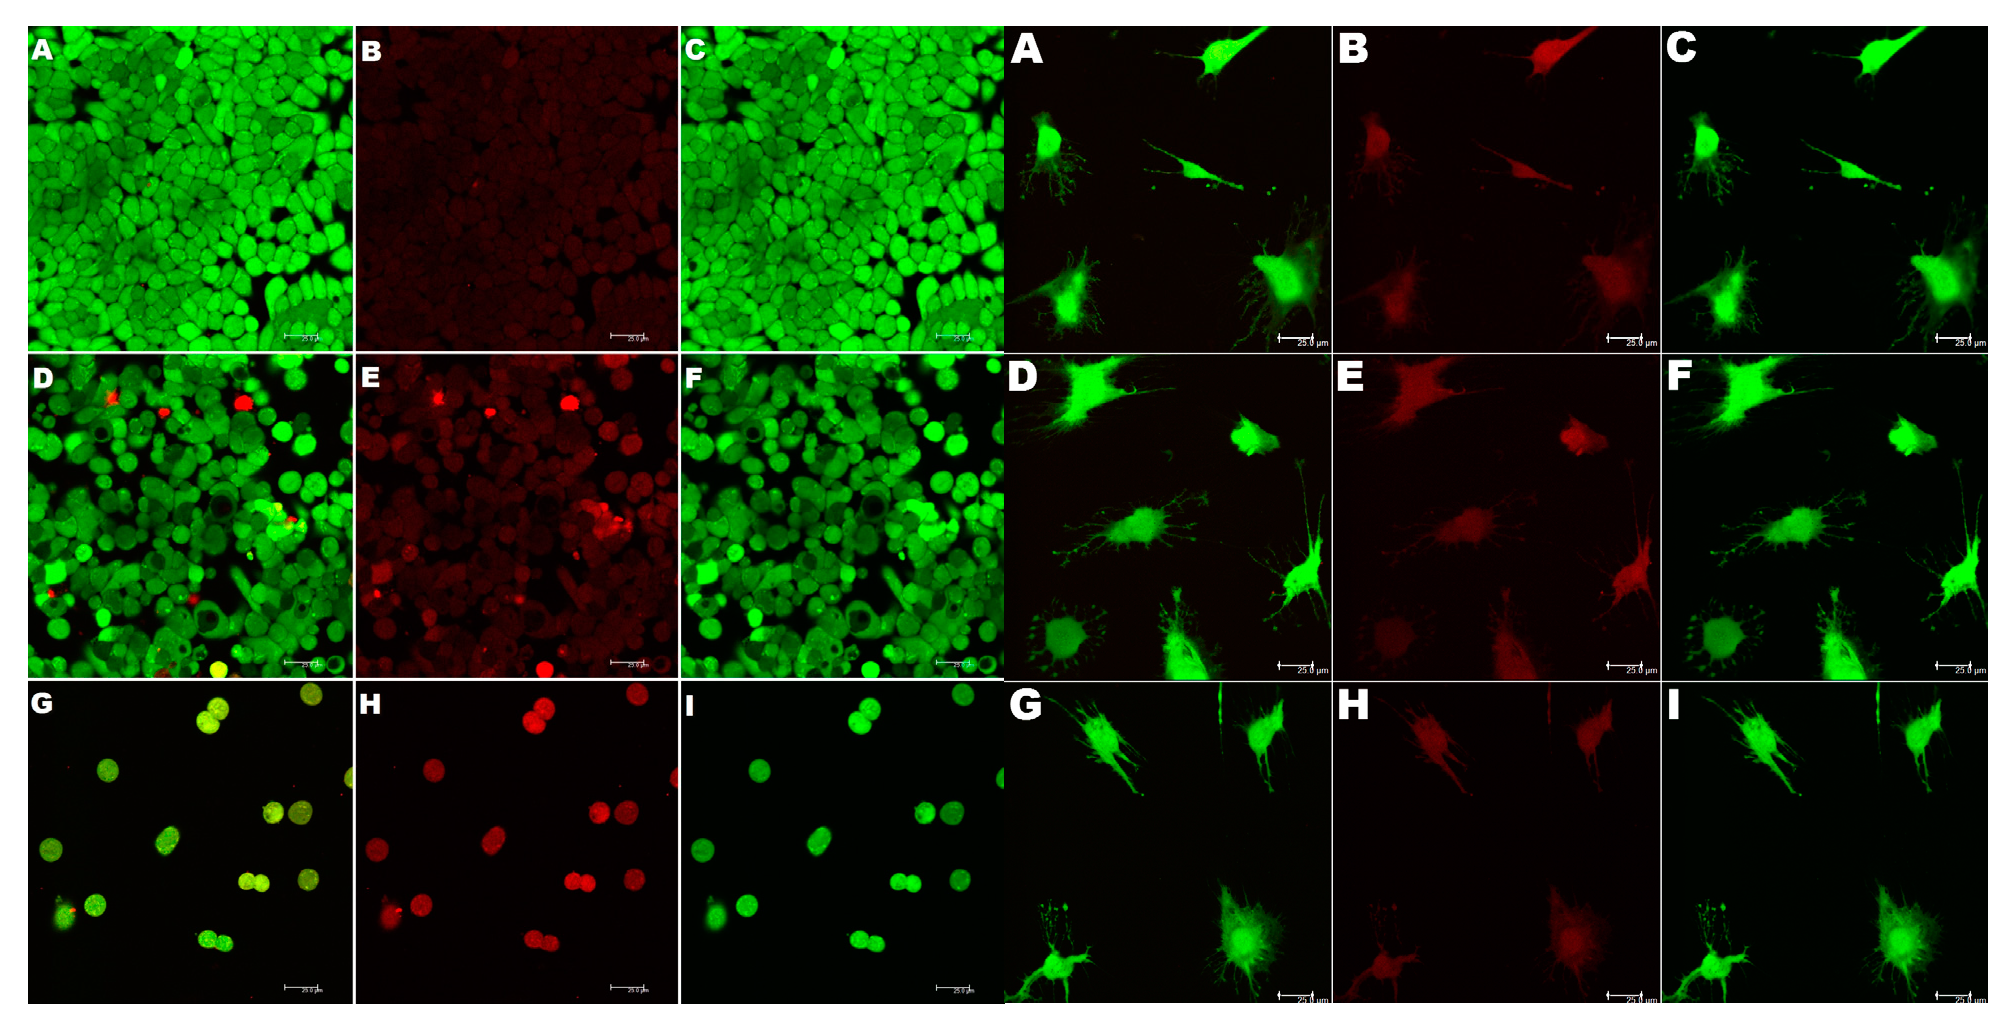
The efficacy of nanofiber in enhancing internalization of paclitaxel into cancer cells is shown in Figure 11, left panel. Multidrug resistant colorectal cancer cell line CRL 2158 was cultured in petri plates for 24 h. Paclitaxel was added at a concentration of 32 nM along with 4 µg equivalent of nanofiber. Cytotoxicity was evaluated after 24 h using an assay kit. The left panel of Figure 11 shows the cytotoxicity effects of Paclitaxel treatment on CRL 2158 cells. Figures A, B and C (untreated cells) show the composite image, red channel image (indicating membrane compromised cells or dead cells) and the green channel image (indicating live cells). Figure 11 D, E and F show the cells subjected to treatment with 32 nM paclitaxel alone. Increase in red fluorescence in cells suggests some degree of toxicity to paclitaxel. The cells subjected to paclitaxel treatment along with nanofiber showed over 90 % toxicity, with the surviving cells on their way to necrosis (G, H, I; Figure G, a composite image, shows cells with predominantly a yellowish fluorescence, suggesting their membrane compromised nature). We are evaluating the mechanism of this process, nevertheless, the results suggest that nanofiber-cancer drug-adducts can be highly lethal to multi-drug resistant cancer cells.
A similar exposure of CRL 1790 cells to the same treatment regime did not indicate any toxicity to these normal cells (Right Panel, Figure 11)
Figure 11 (Right) Human intestinal smooth muscle cells (CRL 1790) treated with Paclitaxel and nanofiber showing the absence of cytotoxicity. The experimental conditions are as explained for the previous figure. (B, C) show the fluorescence in the red and green channels, respectively. (A) Composite. (E, F) Cells treated with 32 nM paclitaxel in the red and green channels, respectively. (D) composite. (H, I) Cells treated with 32 nM paclitaxel in the presence of 4 μg/mL nanofibers. (G) Composite of the two channels.
The development of nanomaterials based on natural products is increasingly being explored in the fields of agriculture, food and medicine. There are potential cytotoxic effects associated with the use of engineered nanomaterials, such as iron oxide nanoparticles, dendrimers, gold- and silver nanoparticles, carbon nanotubes etc. [7]. Human body does not have a mechanism to eliminate inorganic nanomaterials from the system. In cell culture studies, it has been observed that toxicity from fullerene type nanomaterials decreased as the hydroxylation of the structure increased [28]. The primary application of engineered nanomaterials is in diagnostics and biomedicine [29]. Silica nanoparticles of 70 nm were able to penetrate placental barrier and enter the fetus, while those, 300 nm to 900 nm in size did not accumulate in the fetal tissue [30]. Similarly, drug loaded polymeric micelles 30 nm in diameter were more efficient in penetrating tumors with low permeability, than 50 nm, 70 nm or 100 nm wide micelles [31]. Recent use of solid lipid nanoparticles for the delivery of mRNA vaccines against SARS CoV2 is an example of a successful application of nanomaterials in medicine. Examples of other types of applications of nanomaterials in various fields are indicated in the literature [1,2,3,4,5].
The present research shows the potential of using biological materials such as fruit, for producing nanocomplexes with unique characteristics. As the fruit ripens, catabolic processes are activated, which results in the generation of components of low molecular masses, derived from cellulose, pectin and cell wall glycoproteins, with positive, negative and amphiphilic character. Some of the fast ripening fruit showing excessive softening, and which contains high levels of glucanase and polygalacturonase, may not serve as ideal materials for the isolation of nanoparticles. In such fruits, the intermediates could be degraded much faster, thus preventing their spontaneous assembly into nanoparticles and nanofibers. The presence of an anthocyanin in relatively larger amounts, as well as that of malic acid also can influence nanoparticle formation. During homogenization of sour cherry, self-assembly of various components may take place resulting in the formation of nanocomplexes of uniform size, shape and physicochemical characteristics. Fruit such as sour cherry and blueberry, show potential to form identical types of nanocomplexes [32,33]. An abundance of sour cherry fruit will enable the production of mega quantities of nanomaterials required for delivery systems for applications in agriculture, food and medicine. Applications may include the production of nanofertilizers, nanoherbicides, nano-DSiRNA adducts (biopesticides, biofungicides), nanonutrients, nanosupplements, nanopharmaceuticals etc. These aspects are currently under investigation.
Just as engineered nanomaterials, biological nanomaterials of different shapes and sizes have been proposed to provide benefits in drug delivery and retention. Nanoliposomes, nanocochleates, micelles, filasomes etc., are potential morphovariants of biological nanostructures with potential applications in biomedicine [34]. Among these, filamentous polymeric micelles referred to as filomicelles which are 22 to 60 nm in diameter and 2–8 μm in length, have been observed to remain in the blood for a longer duration than spherical nanomicelles [35]. Proteins such as fibrinogen surround polyacrylate-coated gold nanoparticles, and this appears to be a structural change which is a part of its elicitation of inflammation [36]. Daidzein loaded solid- lipid nanoparticles were more efficient than daidzein alone in cardio-cerebrovascular protection in animal models through enhancing bioavailability and increased circulation time [37].
An interesting feature that has become evident from this study is the role of anthocyanins in determining the self-assembly of the components to form nanocomplexes. In the presence of anthocyanins, the nanocomplexes are spherical with a central pectin core that is woven around with galacturonan-xyloglucan-arabinogalactan-polypeptide fibers. Anthocyanins are amphiphilic molecules and may serve as bridging structures between various components. However, once the anthocyanins are removed, the carbohydrate components tend to form fiber shaped structures (~4–5 nm wide and micrometers long as in filomicelles). Irrespective of their shape, both spherical, and fiber-shaped nanocomplexes are highly stable, and are capable of forming stable adducts with a variety of ligand molecules such as drugs (Paclitaxel, Vincristine), minerals, nucleic acids and other bioactives, with high efficiency and uptake.
3. Materials and Methods
Materials. Sour cherry (Prunus cerasus) fruit were obtained from the Vineland Research Station, Vineland, Ontario. Fruit were stored frozen at –40°C until use. Chemicals were purchased from Sigma Chemical Co., St Louis, USA, ThermoFisher Canada, Invitrogen, Molecular Probes etc.
Isolation and Purification of nanoparticles. Pitted fruit were homogenized using a polytron homogenizer with a PTA 10 probe in a medium (preferably water, may use absolute or diluted ethanol or methanol), in 1:1 proportion (w/w, 1 g tissue to 1 mL water or alcohol), at an intermediate setting (4–5) until the tissue is completely homogenized. The homogenate was filtered through 4 layers of cheese cloth. The filtrate was centrifuged (18,000x g) in a Sorvall RC6 Plus centrifuge for 20 min. The supernatant (5 mL) was dialyzed (Spectra-Por, 6–8 kDa cut off) against water (1 L) for 12 h at 4⁰C. The dialyzed extract was lyophilized to obtain nanoparticles as a powder. In some cases, the homogenate was passed through a PD-10 exclusion column packed with Sephadex G-25 (exclusion limit 5 kDa, 7.5 mL bed volume, Amersham Biosciences), and the void volume fractions were collected. The fractions containing nanoparticles were pooled and subjected to transmission electron microscopy. For the preparation of nanofibers, the pitted cherry fruit was immersed in equal volume of 50 % ethanol (3×) to remove anthocyanins. The bleached cherry was homogenized and subjected to filtration and centrifugation as described earlier. The homogenate was dialyzed against water, and the dialyzed extract was lyophilized to a fluffy powder of nanofibers which was observed under SEM and TEM.
Polyphenol estimation and analysis. Polyphenols were estimated by Folin-Ciocalteau method [23] Samples were diluted to a final volume of 100 μL with 50 % (v/v) of ethanol in water. The polyphenol concentrations are expressed as gallic acid equivalent per gram fresh weight of fruit. Polyphenols were purified and concentrated using Sep-Pak C18 chromatography. Usually, 1–2 mg polyphenol equivalent of extract was loaded onto a 1 mL cartridge, washed with 1–2 mL water, and polyphenols were eluted with 100 % methanol. Methanol was removed in a stream of nitrogen at 45⁰C and the resulting dry polyphenols were dissolved in methanol (for HPLC-MS analysis).
Electron Microscopy. Transmission electron microscopy of nanoparticles and nanofibers was conducted according to standard methods [23]. Carbon coated nickel grid was floated on a 50 μL drop of the respective sample solution for 30s. After blot-drying, the grid was stained with 1 % Uranyl acetate for 30s. The grid was blotted dry and examined under a Leo 912 B transmission electron microscope. For scanning electron microscopy, about 500 µg of lyophilized nanoparticles or nanofibers was dusted uniformly onto adhesive carbon conducting tape mounted on a 12 mm diameter aluminum stub and examined under a Scanning Electron Microscope (FEI Quanta 250, FEG).
Polygalacturonase, cellulase and trypsin treatment. One mL of dialyzed extract containing nanoparticles (0.8–1 mg polyphenol equivalent/mL) was treated with pectinase (1 unit /mL of extract), cellulase (β-1,4-glucanase, 1 unit/mL) or 1 unit of trypsin for 15 min. The nanoparticles were examined by TEM as described earlier.
Detergent treatment. Nanoparticles were incubated in the presence of increasing concentrations of lipid-destabilizing detergents such as Triton-X 100 and sodium deoxycholate in 6–8 kDa cut off dialysis bags and dialyzed against water adjusted to a pH of 4.0, for 12 h. The absorbance of polyphenols inside the dialysis bag was measured at 520 nm (benzopyran) and 260 nm (phenolic ring).
Analysis of protein. Protein was extracted using TRIzol® (Invitrogen, ThermoFisher Scientific) following standard methods (Supporting information for the detailed protocol). Protein was isolated from nanoparticles or nanofibers by homogenizing in 300 mM potassium citrate (pH 6.0). Protein samples (15 µg) were separated on 10 % polyacrylamide gels under denaturing and reducing conditions. The gel was fixed in 10 % acetic acid and stained with Coomassie brilliant blue R250.
Association of pectin in nanoparticles. Apple pectin and polygalacturonic acid were dissolved in 0.1 N NaOH and used as standards. The nanoparticles and pectin samples were resolved on 10 % polyacrylamide gels under denaturing/reducing condition. After electrophoresis, the gel was stained with propidium iodide (10 µM in water) for 1 h and photographed. The same gel was again stained with Coomassie brilliant blue R250.
Western and spot blot analysis. To identify the nature of major carbohydrate structural components of the nanoparticles and nanofibers, western and spot blot analysis of the polypeptides isolated from nanoparticles and nanofibers were performed using four monoclonal antibodies (www.Plantprobes.net) raised against homogalacturonan (LM20), extensin (LM1), arabinogalactan-protein (LM14), and LM15, specific to an epitope of xyloglucan having a sequence x-x-x-G Supporting information for the detailed protocols).
Sequence analysis of major peptide bands in nanofibers and nanoparticles. Two distinct bands that were characteristically observed during SDS-PAGE of nanofiber proteins (labelled 1 and 2 with relative molecular masses of 40 kDa and 20 kDa, respectively, Figure S3, Supporting information) were sliced out. A region from the SDS-PAGE gel of nanoparticle proteins corresponding to band 1 of nanofibers (Figure S3, Supporting information, Panels A and B) was also sliced out. The sequences of these peptides were analyzed by Edman sequencing and HPLC/MS/MS at the SPARC BioCentre, Hospital for SickKids, Toronto.
GCMS analysis of organic acids and sugars. Organic acids present in nanoparticles and nanofibers were identified by non-hydrolyzing trimethylsilylation. Nanoparticles and nanofiber solution was purified through size exclusion column (PD 10) and lyophilized into powder. Lyophilized powder (400 µg) was dissolved in 100 µL of pyridine, and 100 µL of BSTFA: TMCS mixture (99:1) and incubated at 80°C for 1 h. One µL was directly injected for GC-MS analysis using a Saturn GC-MS system. Trimethylsilyl derivatives of sugars in the nanoparticles and nanofibers, and sugar standards, were prepared using procedures described by the manufacturer (Pierce Chemicals CO). Nanoparticles and nanofibers were subjected to digestion using trifluoroacetic acid, before derivatization with BSTFA. Derivatized sugars were extracted with hexane and analyzed using a Saturn GC-MS system.
FT-IR analysis. FT-IR analysis of nanoparticles and nanofibers were conducted using a Bruker Tensor 27 InfraRed spectrometer. Equal amounts of nanoparticle and nanofiber powders (1 %) were mixed with potassium bromide and made into a transparent disc which was scanned for acquiring the spectra.
HPLC-MS analysis. Anthocyanins in the crude extracts, dialyzed extracts and the dialyzate fractions was performed using an Agilent 1100 series HPLC-MS. Separation was conducted using an X-Terra® MS C-18 column (5 μm, 150 x 3.0 mm, Waters Corporation, MA, USA). Anthocyanins were eluted with a gradient of methanol (solvent A) and 2.0 % (v/ v) formic acid (solvent B) at a flow rate of 0.8 ml/min. The gradient used was as follows: 0 – 2 min, 93 % B; 2 – 30 min, 80 % B; 30 – 45 min, 70 % B; 45 – 50 min; 65 % B, 50 – 60 min, 50 % B; 60 – 65 min, 20 % B; 65 – 70 min, 93 % B. Detection was carried out at 520 nm for anthocyanins and at 260 nm for phenolic acids. Electrospray ionization (ESI) was performed with an API-ES mass spectrometer. Nitrogen was used as the nebulizing and drying gas, at a flow rate of 12 L/min at 350o C; an ion spray voltage of 4000 V and a fragmentor voltage of 80 V. Ions generated were scanned from m/z 100 to 700. Spectra were acquired in the positive and negative ion mode. A sample injection volume of 20 μL (20 µg) was used for all the samples. Structure identification of the compounds was achieved by matching their molecular ions (m/z) obtained by LC-ESI-MS with literature (www.metabolomics.jp). Three independent samples were analyzed and the quantity of ingredients expressed as mean ± SEM per g fresh weight of tissue equivalent.
Cell culture. Three cell lines (ATCC): CRL 1790 (normal colon), HT 29 (colorectal cancer), and CRL 2158 (a multidrug resistant colorectal cancer) were used to evaluate the cytotoxicity of nanoparticles and nanofibers. Cells were grown in their specific media (HT 29 in Dulbecco’s modified Eagle’s medium, CRL 2158 in RPMI, and CRL 1790 in Eagle’s minimum essential medium, Cedarlane Labs, Burlington, ON, Canada) supplemented with fetal bovine serum, Penicillin / streptomycin, and L-glutamine. At confluency (~80 %), cells were washed with 1× PBS twice and stained using a live-dead staining kit.
Confocal Microscopy. Cells (2 × 10⁵) were grown (35 mm×10mm dish) until confluency and examined under a confocal microscope after staining with appropriate reagents. Dylight 650 (Excitation 650 nm, Emission 700 nm, Thermo Scientific Pierce Biology Products) was found to provide superior performance and stability during uptake experiments. Lyophilized powder of the dialyzed extract containing nanocomplexes (4 mg) was mixed with a 10 μM solution of Dylight 650 ester dissolved in dimethylformamide and incubated for 1 h at 25⁰C for conjugation. After the reaction, the mixture was dialyzed against water (3×) using a 6-8 kDa dialysis membrane until the free reagents were completely removed. The binding of Dylight to the nanoparticles and nanofibers was evaluated by monitoring the fluorescence using confocal microscopy.
Statistical analysis. Statistical analyses were conducted using GraphPad Prism version 4. Results having two means were compared using a Student’s t test. Results with multiple means were compared using one way ANOVA followed by Tukey’s test to evaluate the level of significance. Significantly different means (p<0.05) are denoted by different superscripts.
4. Conclusions
We are currently investigating the mechanistic aspects and optimizing applications of these nanocomplexes. A bioactive adduct of sour cherry nanoparticles has been shown to be highly effective in lowering cholesterol in mouse models. Since the nanocomplexes can carry ~8–10 times its weight of bioactive materials, they are an attractive choice as nanodelivery systems in agriculture, food and medical applications.
5. Patents
US Patent number 2022/0018038A1 assigned to University of Guelph and Psigryph Inc., Waterloo by Gopinadhan Paliyath, Krishnaraj Tiwari, Renu Chandrasekaran, Julieta Correa-Betanzo, Priya Padmanabhan, Jayasankar Subramanian has been issued based on this reported work.
Supplementary Materials
The following supporting information can be downloaded at the website of this paper posted on Preprints.org.
Author Contributions
Conceptualization, G.P. and J.S..; methodology, K.R.T, R.C., N.N, P.P.; validation, K.R.T and G.P.; formal analysis, K.R.T., R.C., N.N., K.S.S.; investigation, K.R.T, R.C., K.S.S.; resources, G.P., J.S.,K.S.S.,; data curation, K.R.T., and R.C.,; writing—original draft preparation, G.P., K.R.T..; writing—review and editing, G.P., K.R.T and J.S.; visualization, K.S.S., N.N., K.R.T.,; supervision, G.P.,; project administration, G.P.,; funding acquisition, G.P., and J.S.. All authors have read and agreed to the published version of the manuscript.
Funding
This research was partly funded by the IDRC-CIFSRF-GAC Canada grant to J.S and G.P., grant number 107847 ” and “The APC was funded by J.S.
Data Availability Statement
All the data pertinent to the research is presented here.
Acknowledgments
We acknowledge the permission to use the Electron Microscopy facility at the Department of Nanoscience and Technology, TNAU, Coimbatore and.
Conflicts of Interest
Declare conflicts of interest or state “The authors declare no conflicts of interest. The funders had no role in the design of the study; in the collection, analyses, or interpretation of data; in the writing of the manuscript; or in the decision to publish the results”.
References
- An, J.; Hu, P.; Li, F.; Wu, H.; Shen, Y.; White, J.C.; Tian, X.; Li, Z.; Pablo Giraldo, J. Molecular Mechanisms of Plant Salinity Stress Tolerance Improvement by Seed Priming with Cerium Oxide Nanoparticles. Environ. Sci. Nano 2020, 7, 2214–2228. [Google Scholar] [CrossRef]
- Chen, H.; Zhang, H.; Xu, T.; Yu, J. An Overview of Micronanoswarms for Biomedical Applications. ACS Nano, 2021, 15, 15625–15644. [Google Scholar] [CrossRef]
- Kumar, S.; Nehra, M.; Dilbaghi, N.; Marrazza, G.; Tuteja, S.K.; Kim, K-H. Nanovehicles for Plant Modifications Towards Pest- and Disease-Resistance Traits. Trends Plant Sci. 2020, 25, 198–212. [Google Scholar] [CrossRef] [PubMed]
- Santana, I.; Wu, H.; Hu, P.; Pablo Giraldo, J. Targeted Delivery of Nanomaterials with Chemical Cargoes in Plants Enabled by a Biorecognition Motif. Nat. Commun. 2020, 11, 2045. [Google Scholar] [CrossRef] [PubMed]
- Surnar, B.; Shah, A.S.; Park, M.; Kalathil, A.A.; Kamran, M.Z.; Ramirez Jaime, R.; Toborek, M.; Nair, M.; Kolishetti, N.; Dhar, S. Brain-Accumulating Nanoparticles for Assisting Astrocytes to Reduce Human Immunodeficiency Virus and Drug Abuse Induced Induced Neuroinflammation and Oxidative Stress. ACS Nano, 2021, 15, 15741–15753. [Google Scholar] [CrossRef] [PubMed]
- Wu, J.; Zhai, Y.; Monikh, F.A.; Arenas-Lago, D.; Grillo, R.; Vijver, M.G.; Peijnenburg, W.J.G.M. The Differences Between the Effects of a Nanoformulation and a Conventional Form of Atrazine to Lettuce: Physiological Responses, Defense Mechanisms, and Nutrient Displacement. J. Agric. Food Chem. 2021, 69, 12527–12540. [Google Scholar] [CrossRef]
- Maynard, A.D. Nanotechnology: Assessing the Risks. Nanotoday, 2006, 1, 22–33. [Google Scholar] [CrossRef]
- Azeredo, H.M.C.; Mattoso, L.H.C.; Wood, D.; Williams, T.G.; Avena-Bustillos, R.J.; McHugh, T.H. Nanocomposite Edible Films from Mango Puree Reinforced with Cellulose Nanofibers. J. Food. Sci. 2009, 74, N31–N35. [Google Scholar] [CrossRef] [PubMed]
- Ramasamy, T.; Khandasamy, U.; Hinabindhu, R.; Kona, K. Nanocochleate – A New Drug Delivery System. FABAD J. Pharm. Sci. 2009, 34, 91–101. [Google Scholar]
- Zhao, N.; Bagaria, H.G.; Wong, M.S.; Zu, Y. A Nanocomplex that is Both Tumor Cell-Selective and Cancer Gene-Specific for Anaplastic Large Cell Lymphoma. J. Nanobiotechnol. 2011, 9, 1–12. [Google Scholar] [CrossRef] [PubMed]
- Sessa, M.; Tsao, R.; Liu, R.; Ferrari, G.; Donsì, F. Evaluation of the Stability and Antioxidant Activity of Nanoencapsulated Resveratrol during in Vitro Digestion. J. Agr. Food Chem, 2011, 59, 12352–12360. [Google Scholar] [CrossRef] [PubMed]
- Zhang, H.Y.; Arab Tehrany, E.; Kahn, C.J.F.; Poncot, M.; Cleymand, L.F. Effects of Nanoliposomes Based on Soya, Rapeseed and Fish Lecithins on Chitosan Thin Films Designed for Tissue Engineering. Carbohydr. Polym. 2012, 88, 618–627. [Google Scholar] [CrossRef]
- Rico, C.M.; Majumdar, S.; Duarte-Gardea, M.; Peralta-Videa, J.R.; Gardea-Torresdey, J.L. Interaction of Nanoparticles with Edible Plants and Their Possible Implications in the Food Chain. J. Agr. Food Chem. 2011, 59, 3485–3498. [Google Scholar] [CrossRef] [PubMed]
- Mishra, R.K.; Banthia, A.K.; Majeed, A.B.A. Development and Characterization of Pectin/Gelatin Hydrogel Membranes for Wound Dressing. Int. J. Plast. Technol. 2011, 15, 82–95. [Google Scholar] [CrossRef]
- Yadav, N.; Morris, G.A.; Harding, S.E.; Ang, S.; Adams, G.G. Various Non-Injectable Delivery Systems for the Treatment of Diabetes Mellitus. Endo. Metabol. & Imm. Disord. - Drug Targ. 2009, 9, 1–13. [Google Scholar] [CrossRef]
- Sriamornsak, P. Application of Pectin in Oral Drug Delivery. Expert Opin. Drug Deliv. 2011, 8, 1009–1023. [Google Scholar] [CrossRef]
- Shi, L.; Gunasekaran, S. Preparation of Pectin-ZnO NanoComposites. Nanoscale Res. Lett. 2008, 3, 491–495. [Google Scholar] [CrossRef] [PubMed]
- Verma, A.K.; Chanchal, A.; Kumar, A. Potential of Negatively Charged Pectin Nanoparticles Encapsulating Paclitaxel: Preparation & Characterization. IEEE. 2011, 978, 1–8. [Google Scholar] [CrossRef]
- Iversena, T.G.; Skotlanda, T.; Sandvig, K. Endocytosis and Intracellular Transport of Nanoparticles: Present Knowledge and Need for Future Studies. Nano Today, 2011, 6, 176–185. [Google Scholar] [CrossRef]
- Sharma, R.; Ahuja, M.; Kaur, H. Thiolated Pectin Nanomaterials: Preparation, Characterization and Ex Vivo Corneal Permeation Study. Carbohydrate Polymers 2012, 87, 1606–1610. [Google Scholar] [CrossRef]
- Hu, P.; An, J.; Faulkner., M.M.; Wu, H.; Li, Z.; Tian, X.; Pablo Giraldo, J. Nanoparticle Charge and Size Control Foliar Delivery Efficiency to Plant Cells and Organelles. ACS Nano 2020, 14, 7970–7986. [Google Scholar] [CrossRef] [PubMed]
- Palashuddin, Md. S.K.; Jaiswal, A.; Paul, A.; Ghosh, S.S.; Chattopadhyay, A. Presence of Amorphous Carbon Nanoparticles in Food Caramels. Sci.Rep. 2012, 2, 383. [Google Scholar] [CrossRef]
- Jacob, J.K.; Paliyath, G. Physico-Chemical Characteristics of Nanovesicle-Carbohydrate Complexes in Grape Juice. J. Agr. Food Chem. 2008, 56, 1305–1315. [Google Scholar] [CrossRef] [PubMed]
- Negi, P.S.; Handa, A.K. Structural Deterioration of the Produce: The Breakdown of Cell Wall Components. In Post Harvest Biology and Technology of Fruits, Vegetables and Flowers; Paliyath, G., Murr, D.P., Lurie, S., Handa, A.K., Eds.; Wiley-Blackwell: Iowa, 2008; pp. 162–194. [Google Scholar]
- Padayachee, A.; Netzel, G.; Netzel, M.; Day, L.; Zabaras, D.; Mikkelsen, D.; Gidley, M. Binding of polyphenols to plant cell wall analogues - Part 1: Anthocyanins. Food Chem. 2012, 134, 155–161. [Google Scholar] [CrossRef]
- Rounds, C.M.; Lubeck, F.; Hepler, P.K.; Winshin, L.J. Propidium Iodide Competes with Ca2+ to Label Pectin in Pollen Tubes and Arabidopsis Toot Hairs. Plant Physiol. 2011, 157, 175–187. [Google Scholar] [CrossRef]
- Chandra, A.; Nair, M.G.; Lezzoni, A. Evaluation and Characterization of the Anthocyanin Pigments in Tart Cherries (Prunus cerasus L.). J. Agric. Food Chem. 1992, 40, 967–969. [Google Scholar] [CrossRef]
- Lewinski, N.; Colvin, V.; Drezek, R. Cytotoxicity of NanoParticles. Small 2008, 4, 26–49. [Google Scholar] [CrossRef]
- Kunzmann, A.; Andersson, B.; Thurnherrm, T.; Krug, H.; Scheynius, A.; Fadeel, B. Toxicology of Engineered Nanomaterials: Focus on Biocompatibility, Biodistribution and Biodegradation. Biochim. Biophys. Acta. 2011, 1810, 361–373. [Google Scholar] [CrossRef] [PubMed]
- Yamashita, K.; Yoshioka, Y.; Higashisaka, K.; Mimura, K.; Morishita, Y.; Nozaki, M.; Yoshida, T.; Ogura, T.; Nabeshi, H.; Nagano, N.; Abe, Y.; Kamada, H.; Monobe, Y.; Imazawa, T.; Aoshima, H.; Shishido, K.; Kawai, Y.; Mayumi, T.; Tsunoda, S.-I.; Itoh, N.; Yoshikawa, T.; Yanagihara, I.; Saito, S.; Tsutsumi, Y. Silica and Titanium Dioxide Nanoparticles Cause Pregnancy Complications in Mice. Nat. Nanotechnol. 2011, 6, 321–328. [Google Scholar] [CrossRef]
- Cabral, H.; Matsumoto, Y.; Mizuno, K.; Chen, Q.; Murakami, M.; Kimura, M.; Terada, Y.; Kano, M.R.; Miyazono, K.; Uesaka, M.; Nishiyama, N.; Kataoka, K. Accumulation of Sub-100 nm Polymeric Micelles in Poorly Permeable Tumors Depends on Size. Nat. Nanotechnol. 2011, 6, 815–823. [Google Scholar] [CrossRef] [PubMed]
- Paliyath, G.; Tiwari, K.; Chandrasekaran, R.; Padmanabhan, P.; Correa-Betanzo, J.; Subramanian, J. 2020a. Plant Tissue Derived Nanofibers WO 2020/097740 A1.
- Paliyath, G.; Tiwari, K.; Padmanabhan, P.; Correa-Betanzo, J.; Nosrati, N.; Bakovic, M.; et al. 2020b. Plant Tissue Derived Nanoparticles and Food Powders. WO 2020/097739 A1.
- Nishiyama, N. Nanocarriers Shape Up for Long Life. Nat. Nanotechnol. 2007, 2, 203–205. [Google Scholar] [CrossRef]
- Discher, D.E.; Eisenberg, A. Polymer Vesicles. Science 1995, 297, 967–973. [Google Scholar] [CrossRef]
- Deng, Z.J.; Liang, M.; Monteiro, M.; Toth, I.; Minchin, R.F. Nanoparticle-Induced Unfolding of Fibrinogen Promotes Mac-1 Receptor Activation and Inflammation. Nat. Nanotechnol. 2011, 6, 39–44. [Google Scholar] [CrossRef] [PubMed]
- Gao, Y.; Gu, W.; Chen, L.; Xu, Z.; Li, Y. The Role of Daidzein-Loaded Sterically Stabilized Solid Lipid Nanoparticles in Therapy for Cardio-Cerebrovascular Diseases. Biomaterials 2008, 29, 4129–4136. [Google Scholar] [CrossRef] [PubMed]
Figure 1.
(A) Transmission electron micrograph of nanoparticles. (B) A magnified view of the nanoparticles. The arrows indicate fibril like structures emanating from the nanoparticles.
Figure 1.
(A) Transmission electron micrograph of nanoparticles. (B) A magnified view of the nanoparticles. The arrows indicate fibril like structures emanating from the nanoparticles.
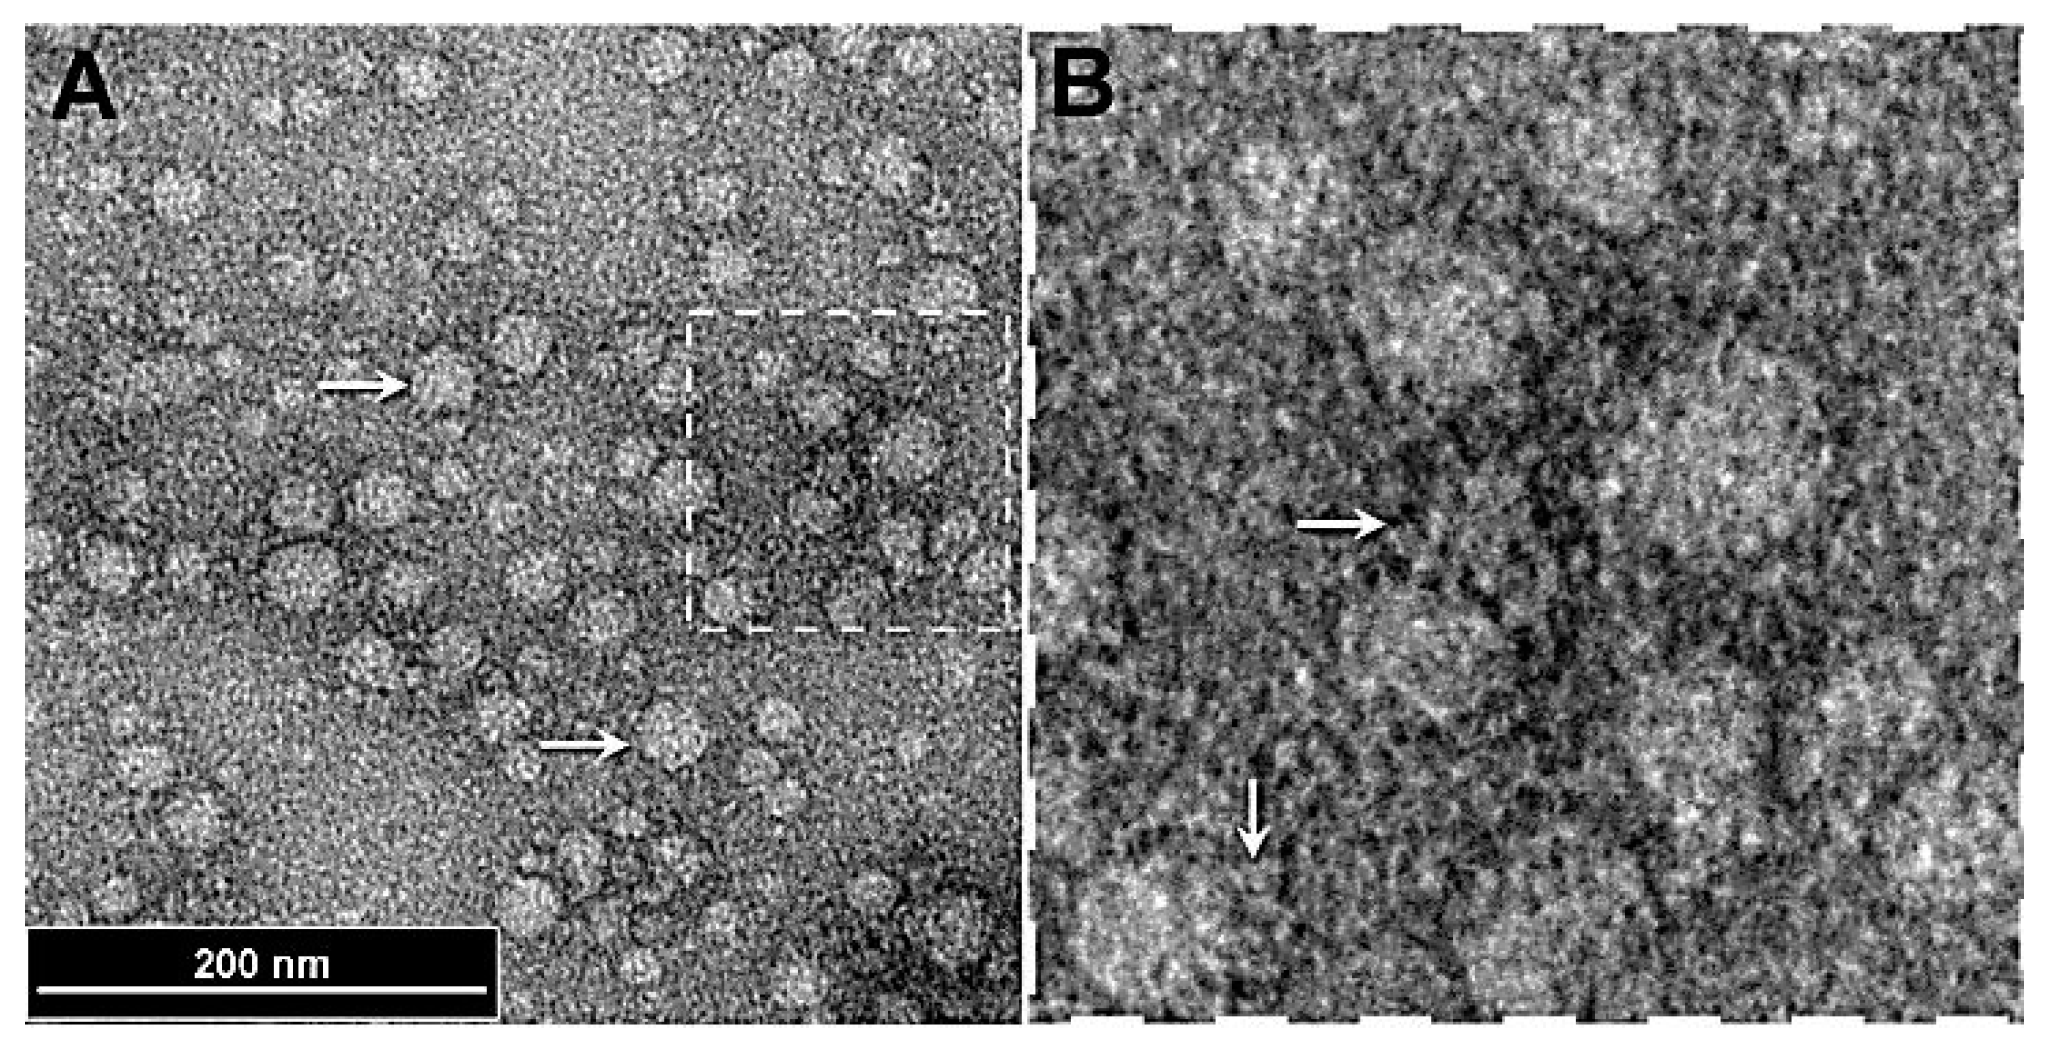
Figure 2.
Magnified views of nanoparticles as observed under the TEM. (A) Two nanoparticles that have been stripped of the outer structures exposing a much smoother interior shell (arrow). (B, C) Detailed morphology of the outer coating comprising fibrils. (Arrow 1) shows regions of the fibrils having a spiral fibrous structure. (Arrow 2) The spiral fibrous structures are coated with fibrils. (D) A region with simple fibril structure stripped from the spiral fibers. (Arrow) A mat of fibrils, that occurs during potential natural disassociation of the nanoparticles.
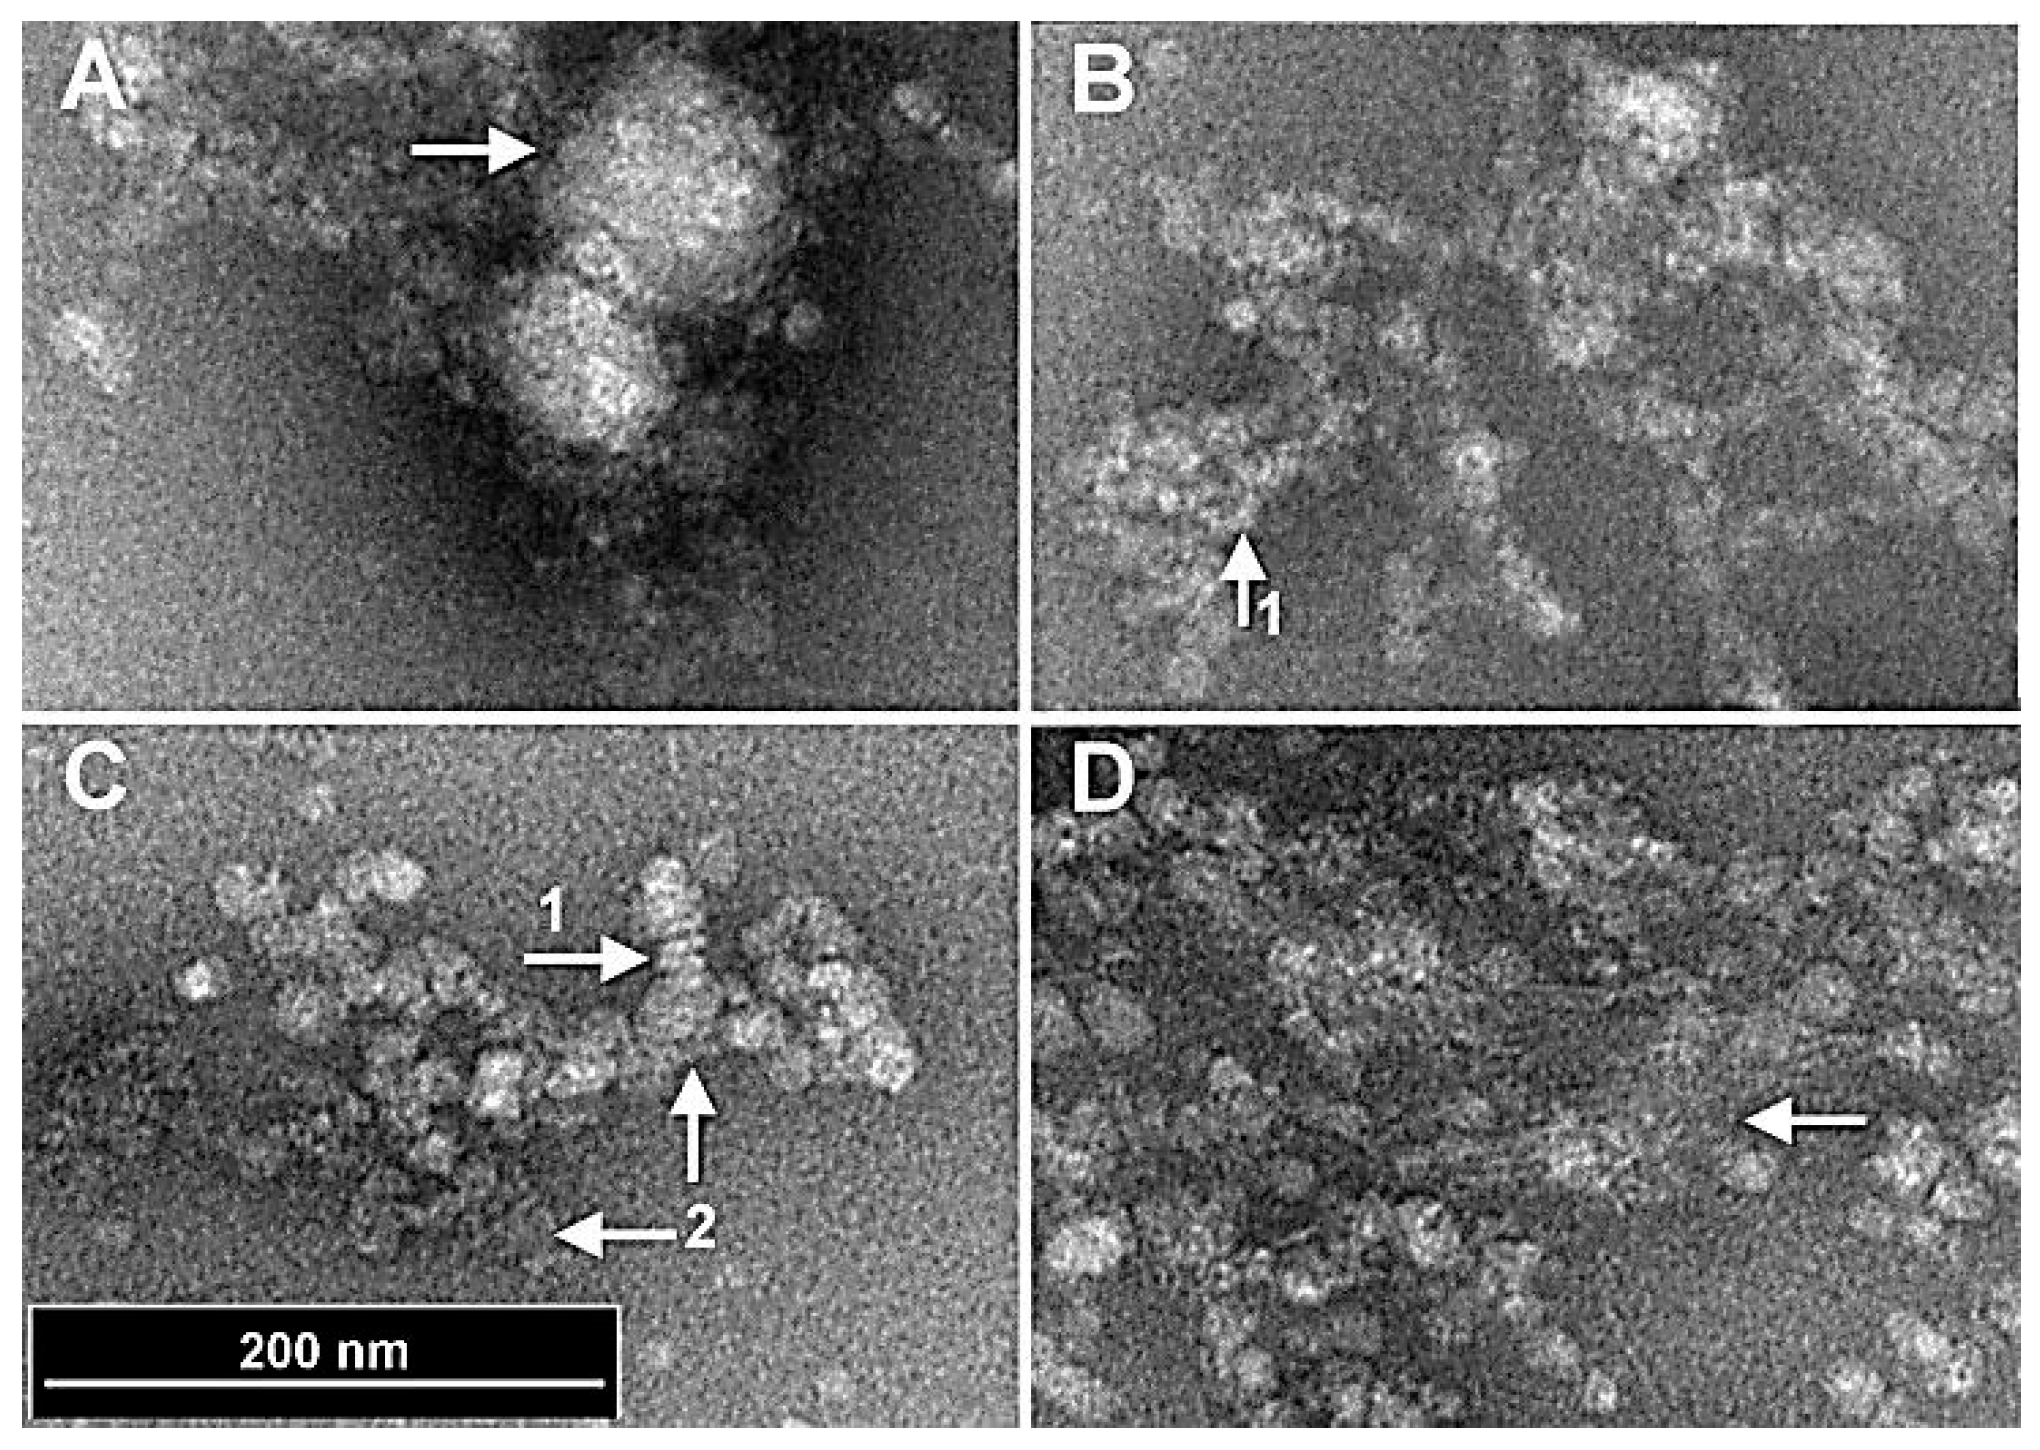
Figure 3.
Effect of polygalacturonase and cellulase treatments on the stability of nanoparticles. (A) Dissolution of spherical complexes into smaller vesicular and filamentous structures following α 1-4-glycosidase treatment (boxed region). (B) A magnified version of the boxed region. (C & D) The effect of treatment of the nanoparticles with β-1,4-glucanase, that stripped the complexes of the filamentous coat leaving an inner core indicating the presence of β-1,4-glucan type components in the filaments.
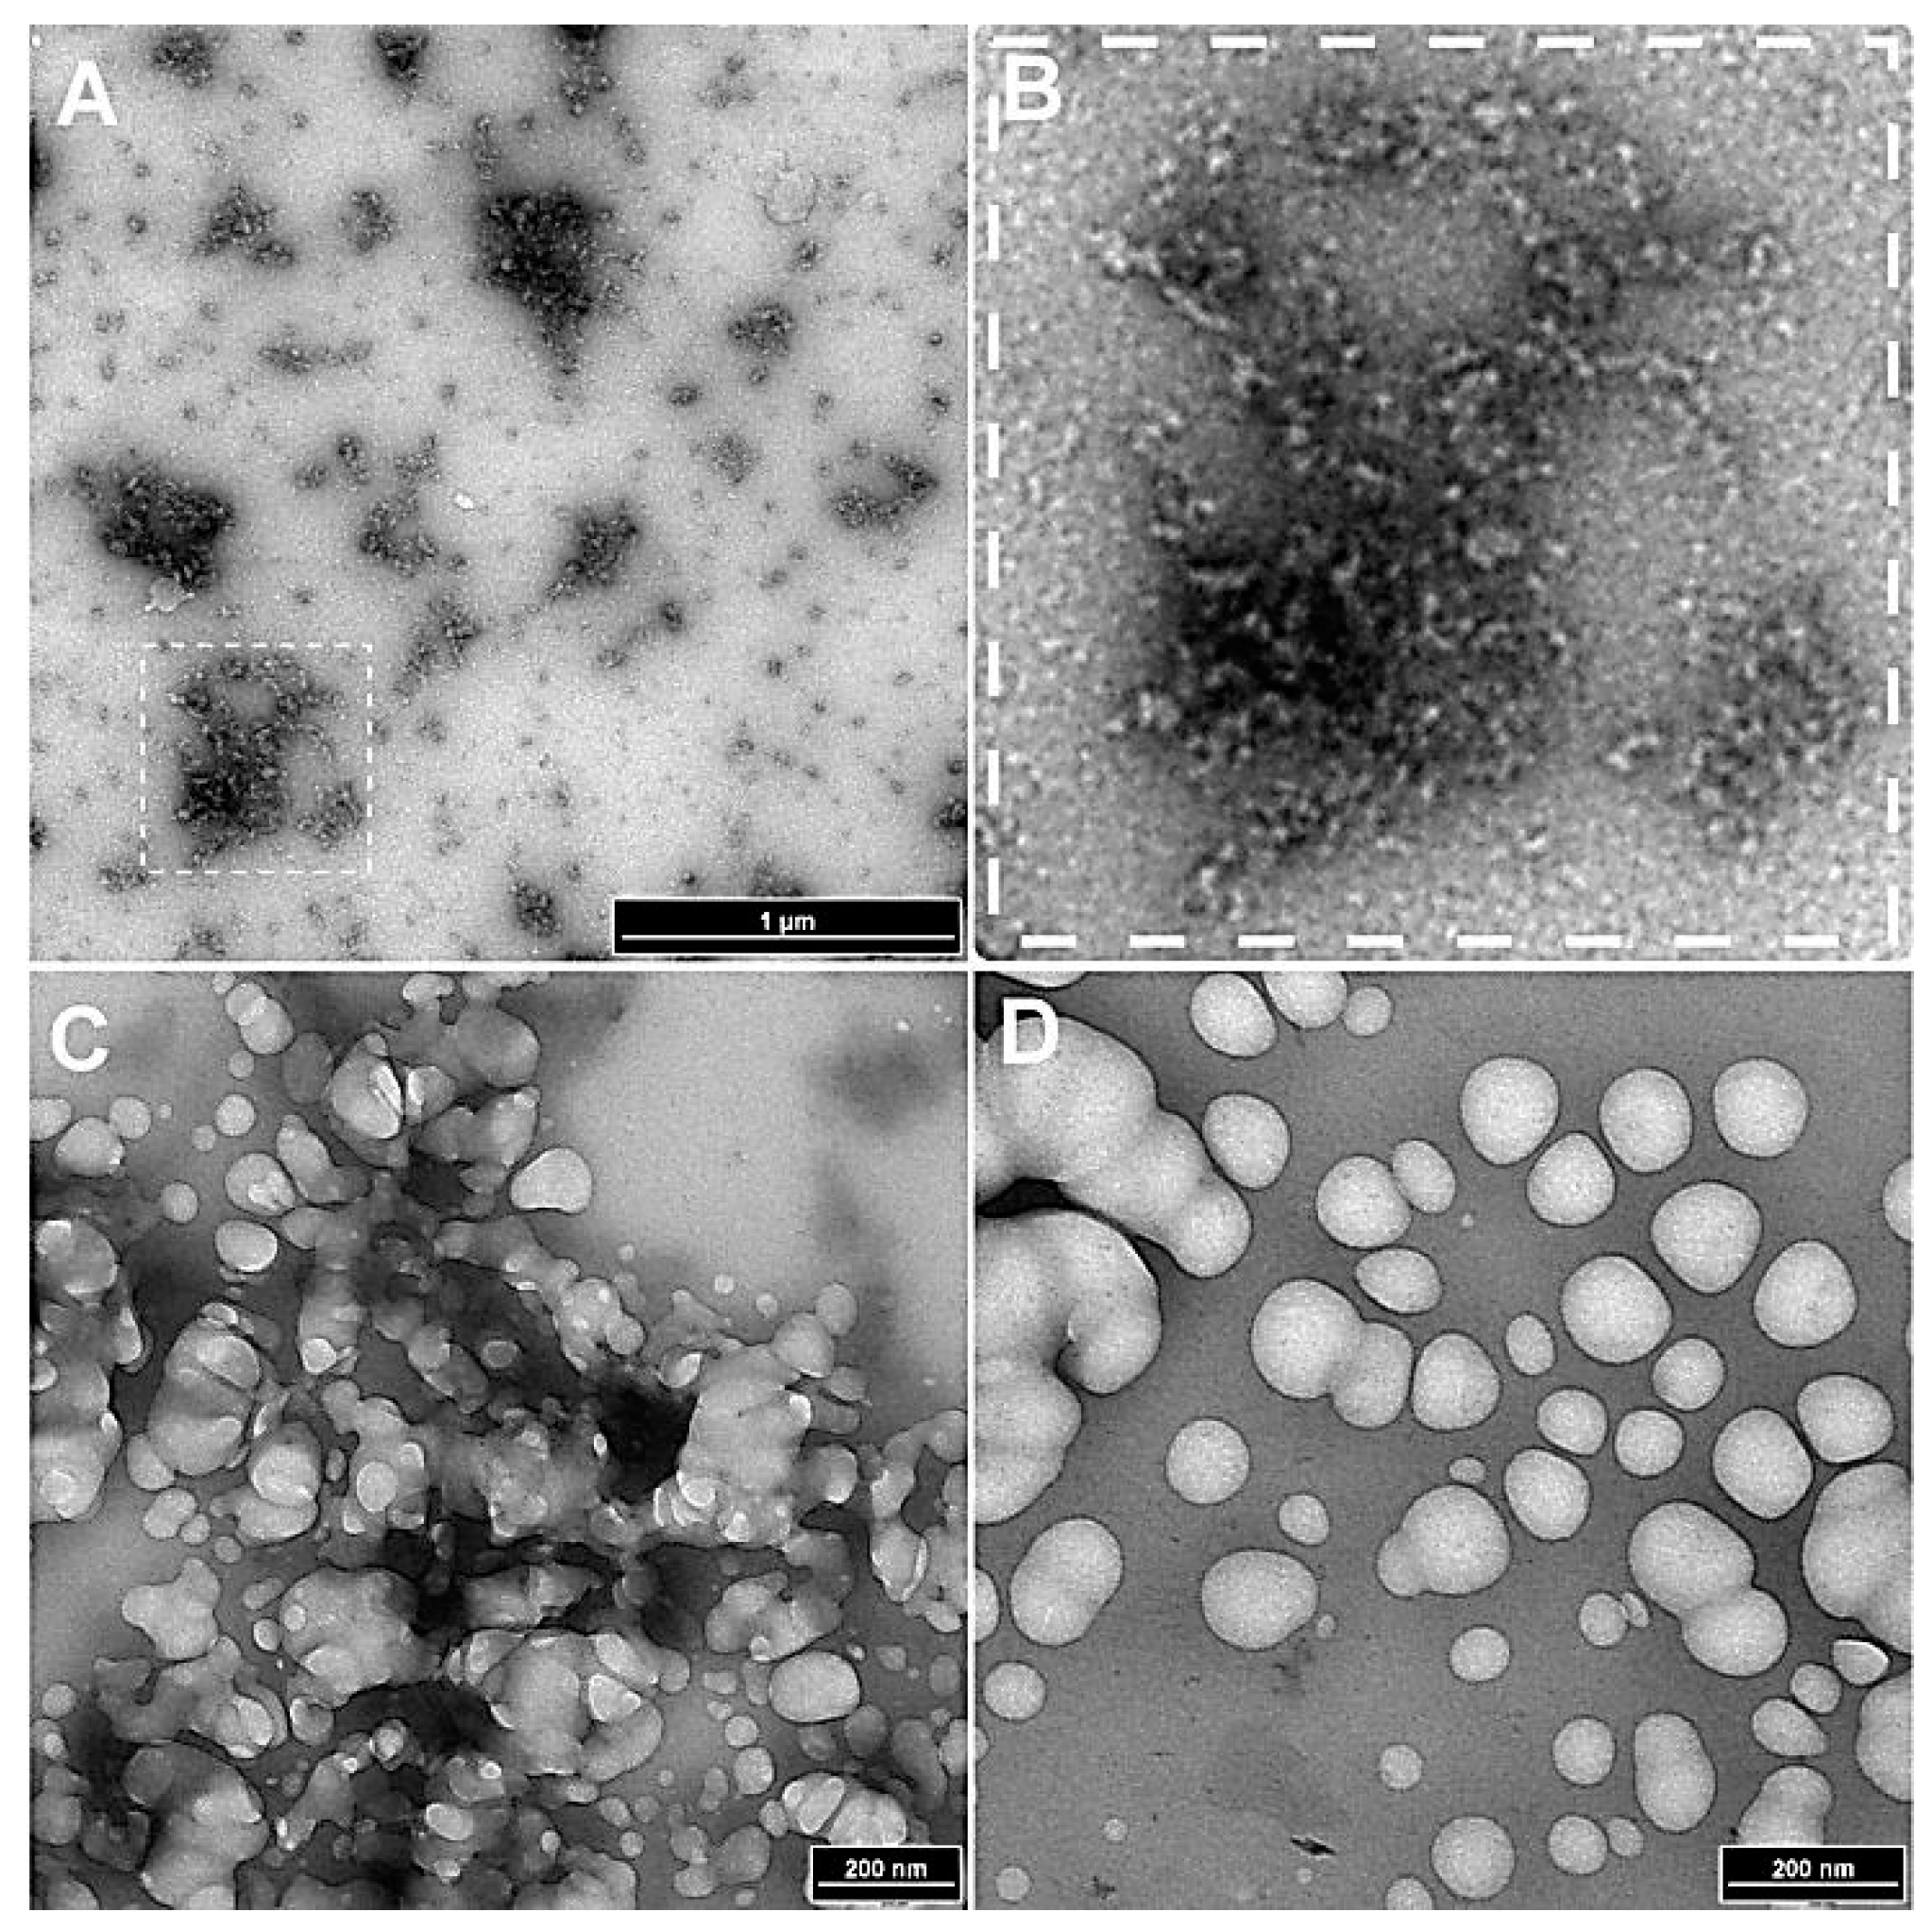
Figure 4.
Effect of trypsin treatment on the structure of nanoparticles. (A) Trypsin treatment resulted in the dissolution of the outer filamentous structure (stained with Ruthenium Red which binds pectin) seen as dark stained areas (Arrows) around the globular interior pectin shell of the nanoparticles. The shell like structures tend to fuse together as also observed after cellulase treatment (Figure 3 C & D). (B) A magnified view of a shell like structure. (C) Partially digested nanoparticle showing the fibrous coating dispersing into fibrillar structures (arrows). (D) A nanoparticle that has been stripped off the fibrous structures. The top arrow shows the globular shell left after dissolution of the fibers, and the bottom arrow shows the fibrous structure liberated from the core. (E) A magnified view of the fibrils showing an intertwined assembly of the fibres.
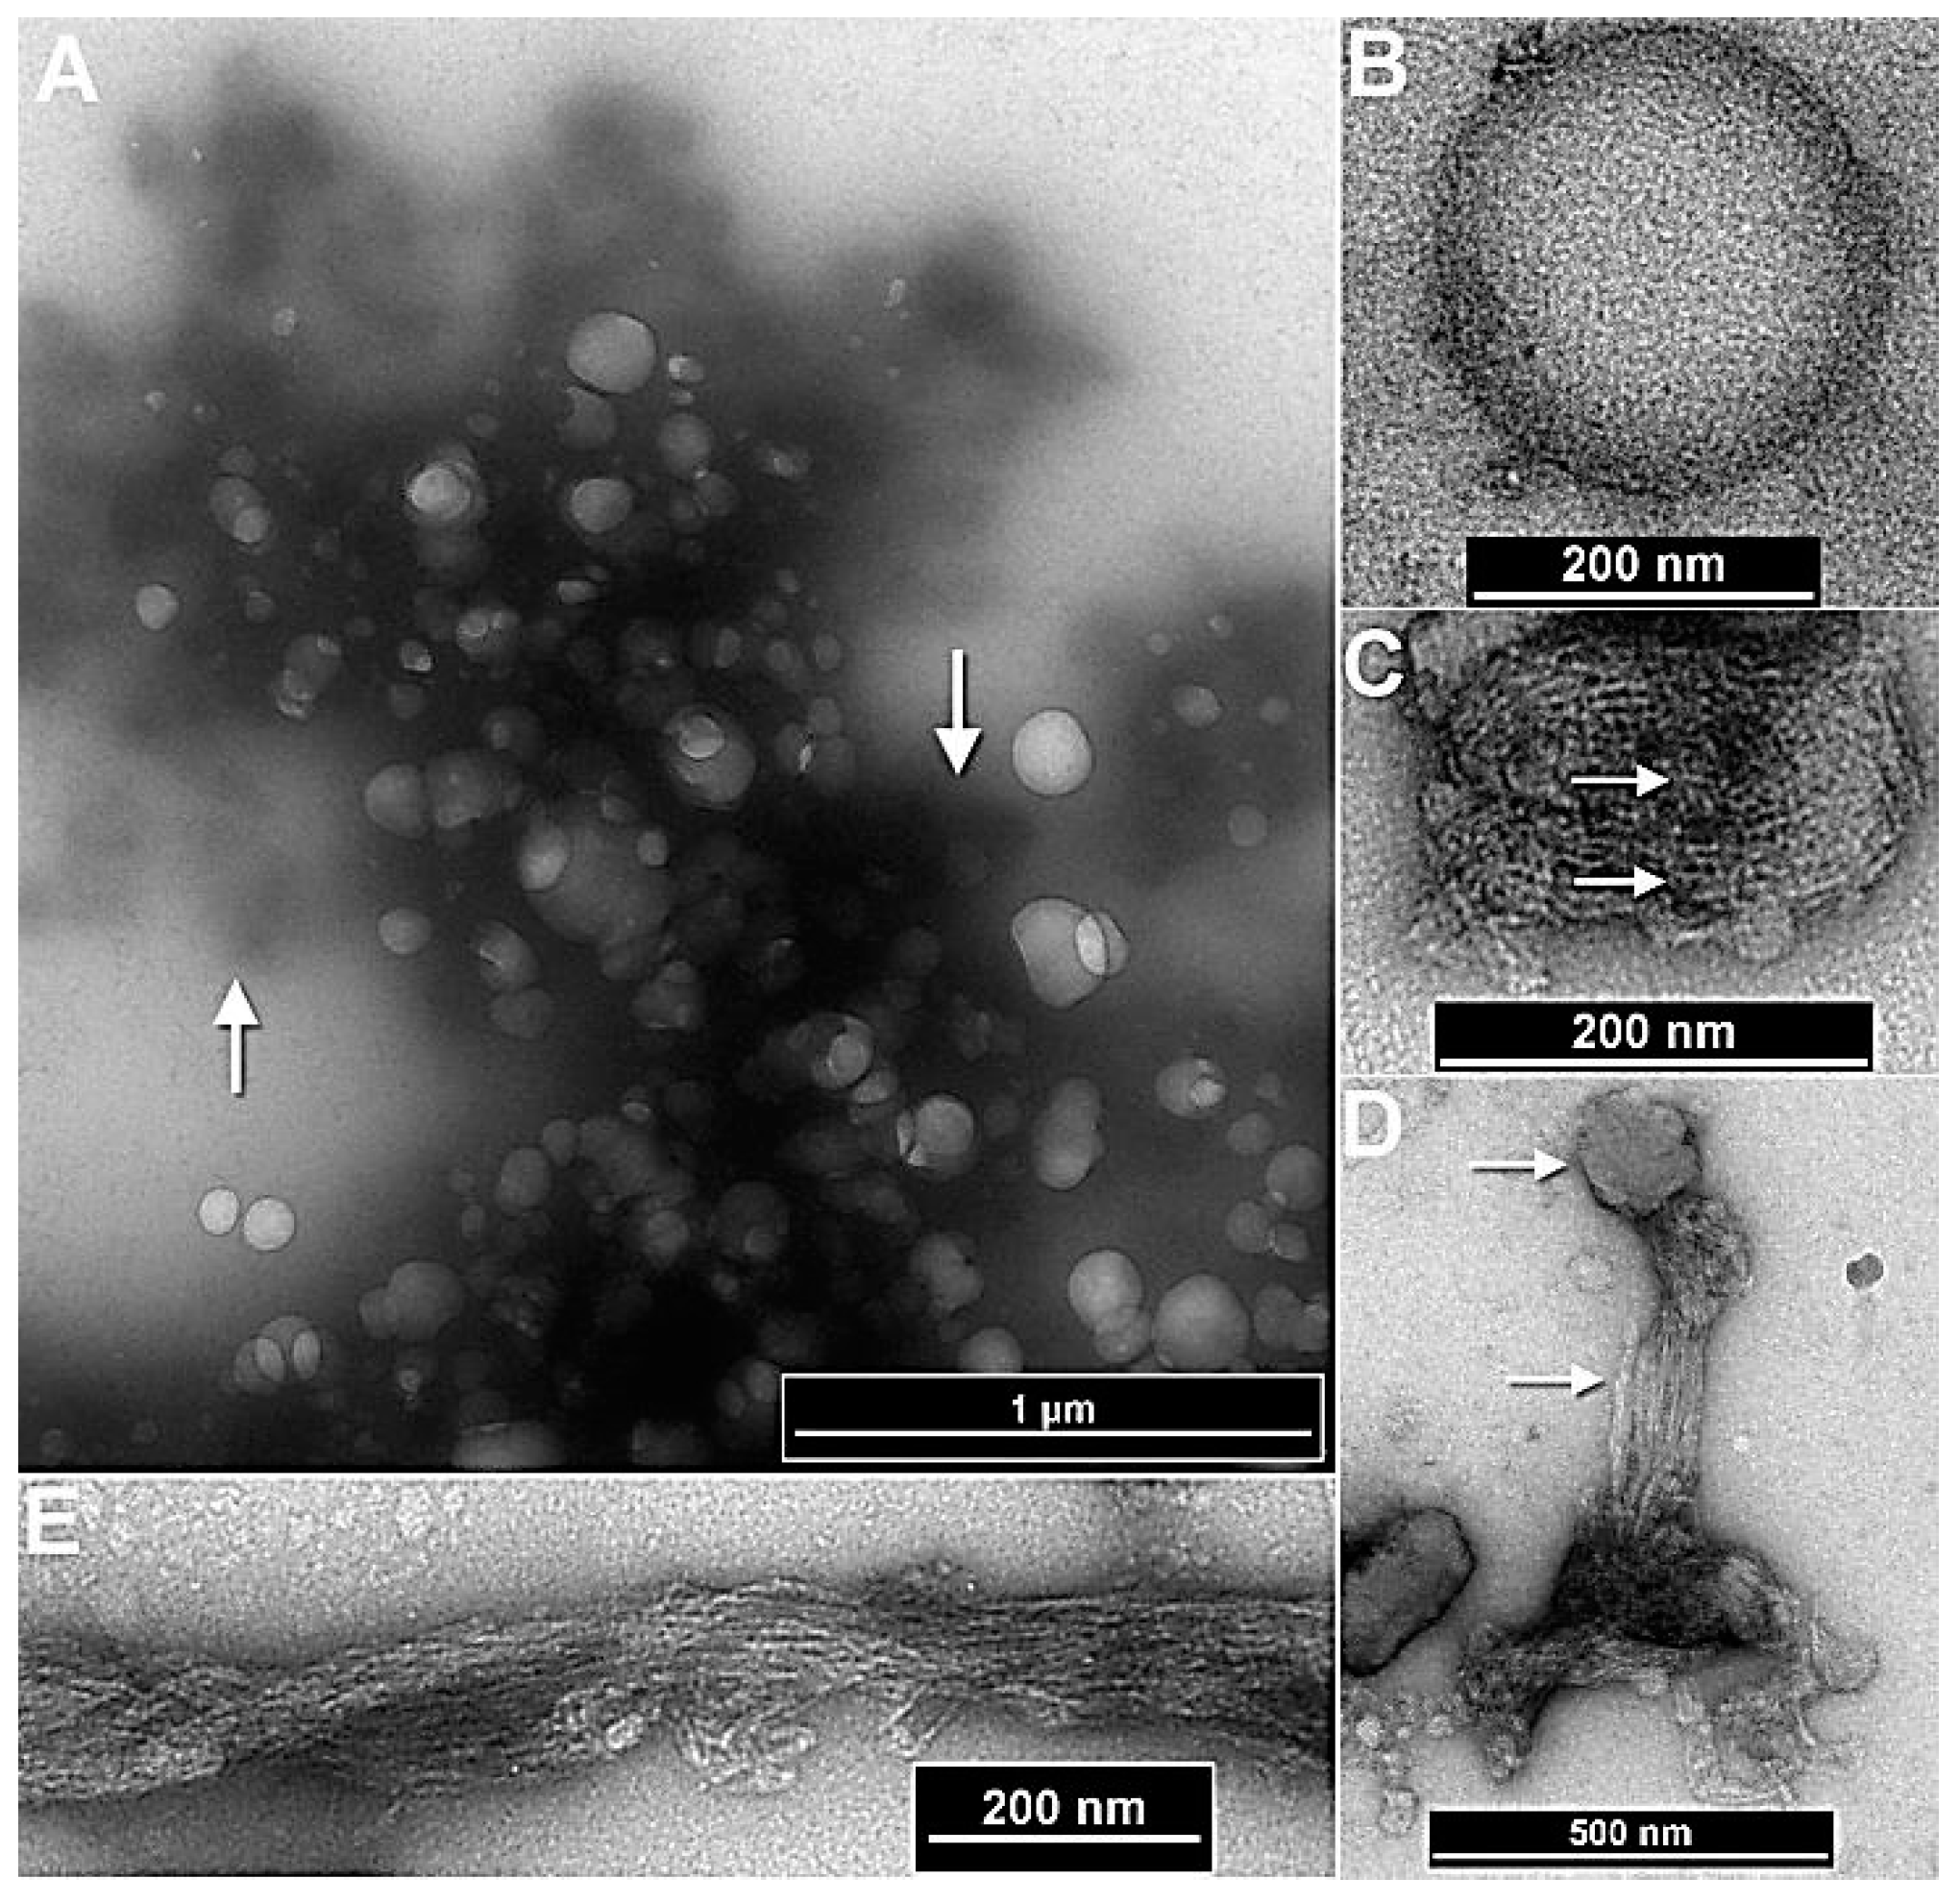
Figure 5.
Scanning electron micrograph of lyophilized nanoparticles showing a size distribution ranging from 200–800 nm in diameter.
Figure 5.
Scanning electron micrograph of lyophilized nanoparticles showing a size distribution ranging from 200–800 nm in diameter.
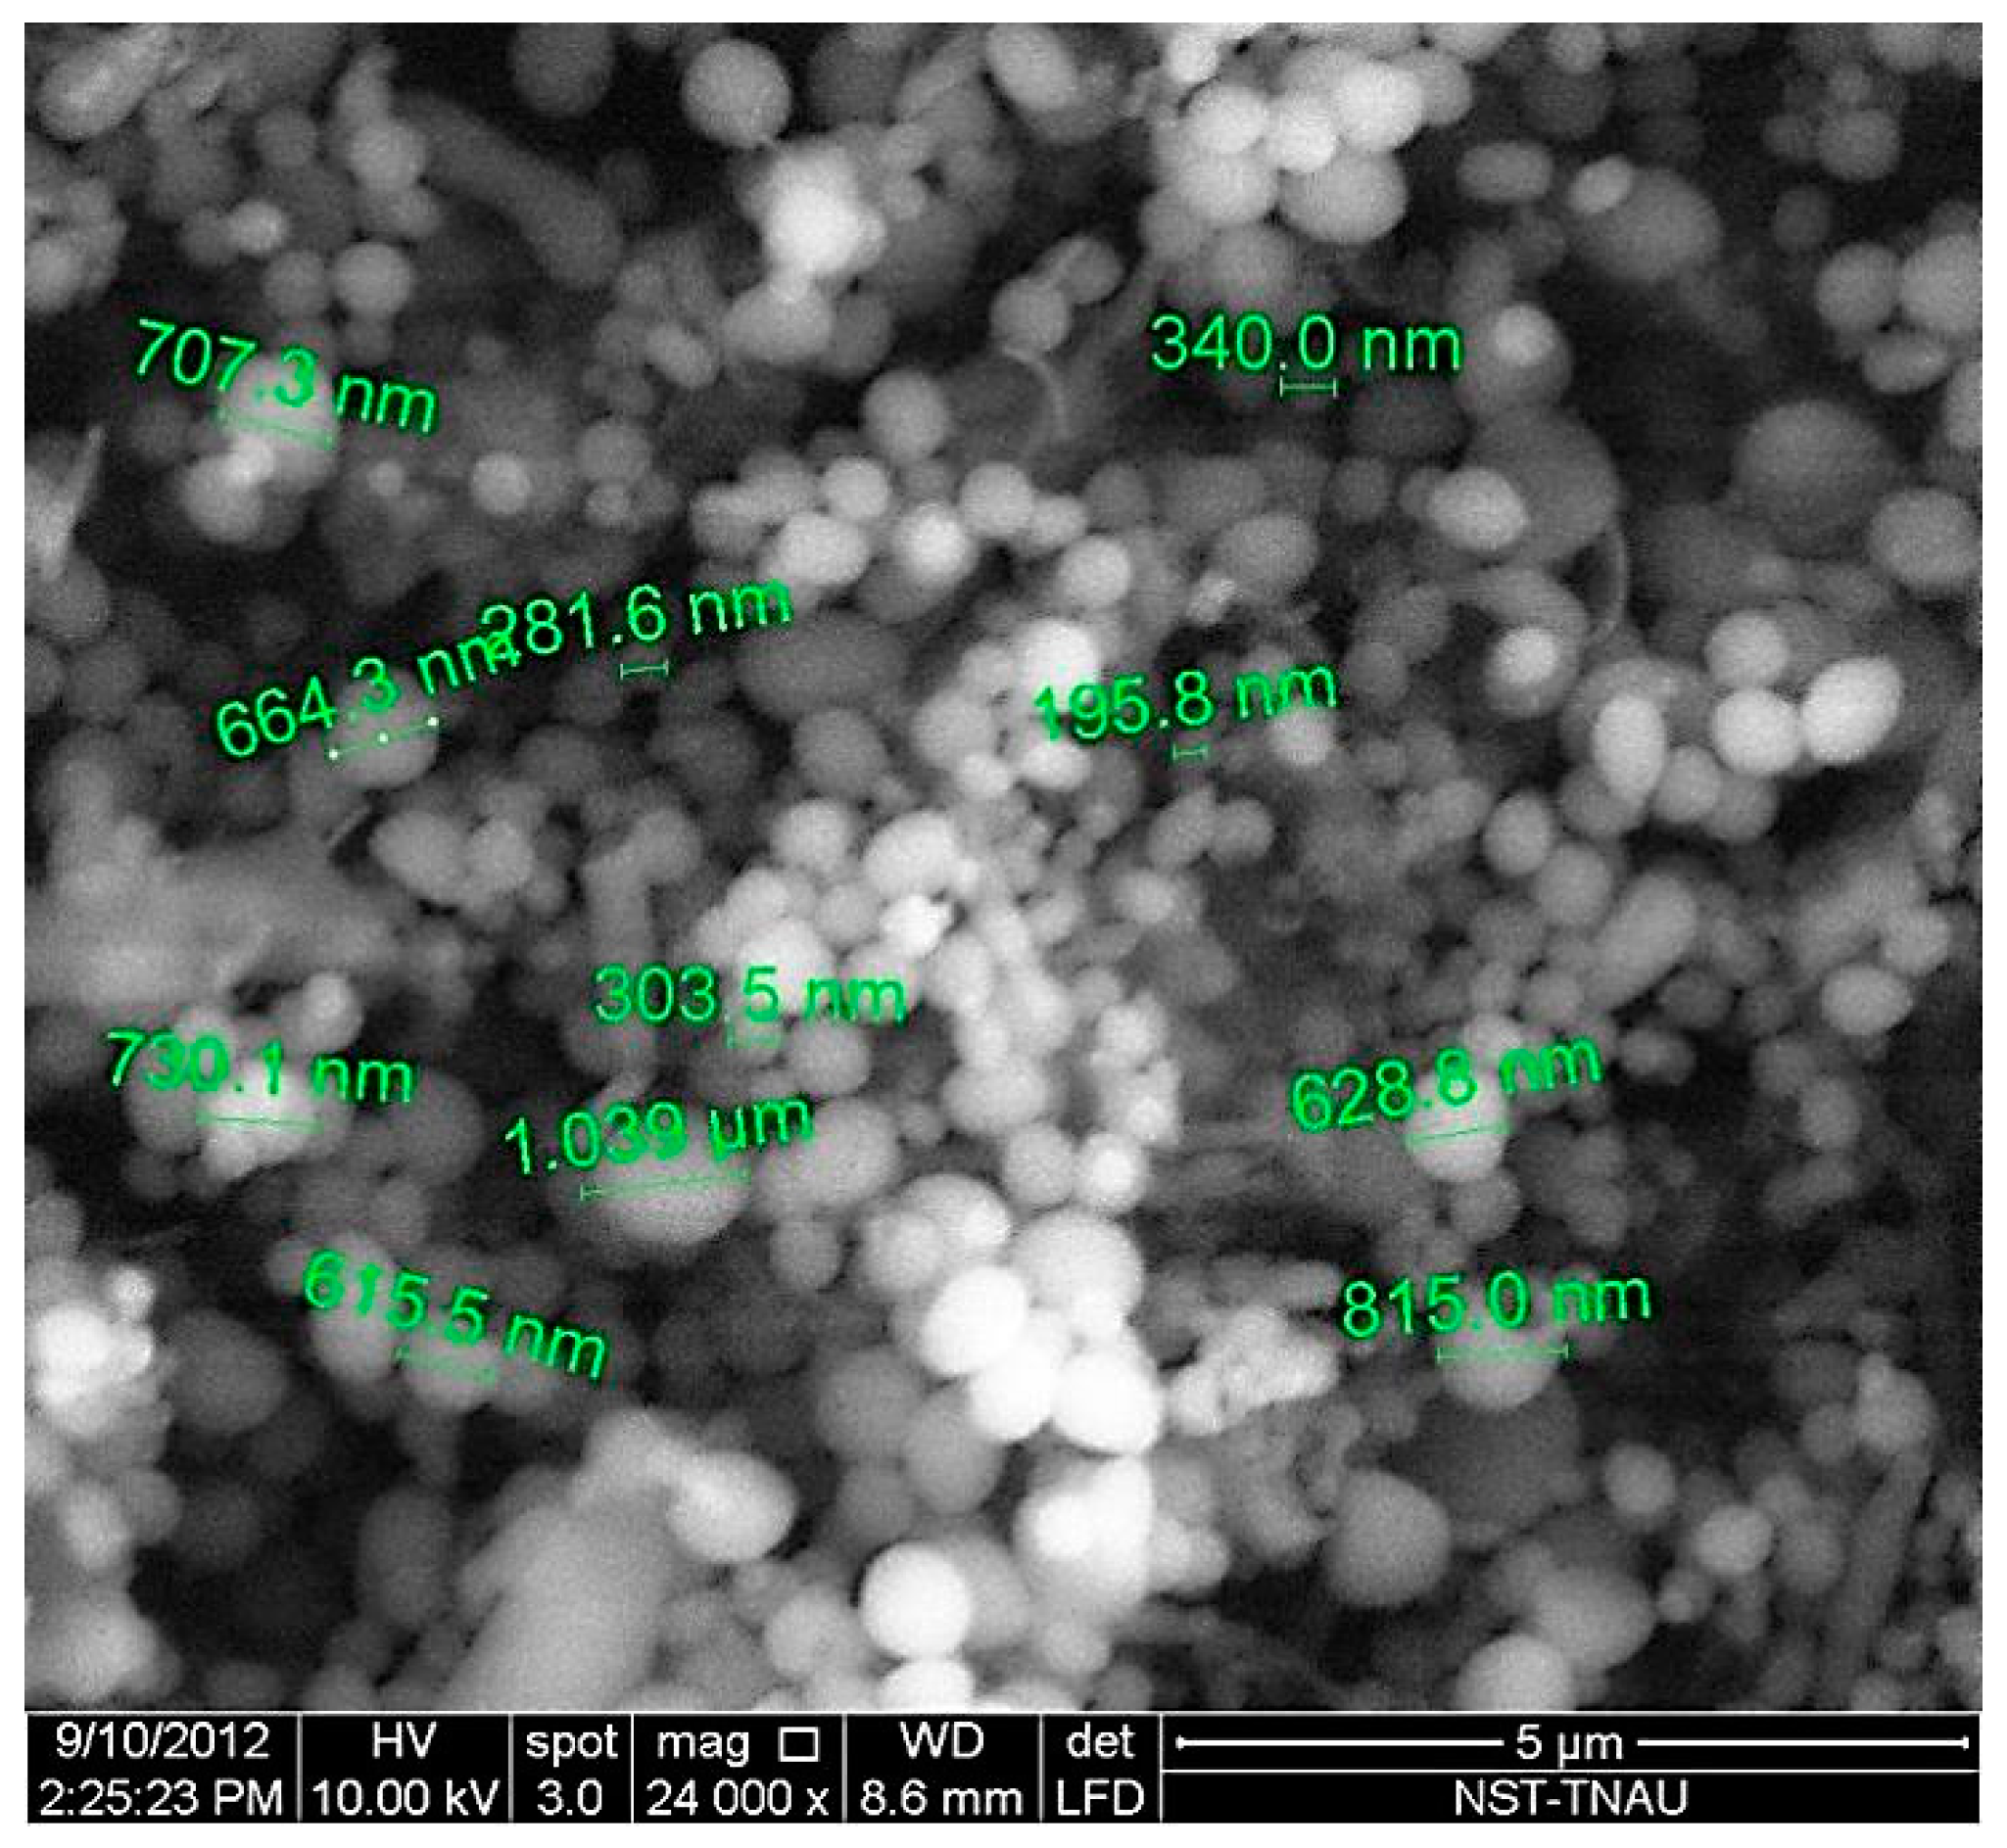
Figure 6.
Lyophilized nanofibers isolated from ethanol bleached sour cherry. (A) SEM of nanofibers (Arrows 1, 2). (B) TEM of nanofibers which appear micrometers in length 4–5 nm in diameter (Arrow 1). These filaments still retain the ability to form spiral structures (arrow 2) in solution.
Figure 6.
Lyophilized nanofibers isolated from ethanol bleached sour cherry. (A) SEM of nanofibers (Arrows 1, 2). (B) TEM of nanofibers which appear micrometers in length 4–5 nm in diameter (Arrow 1). These filaments still retain the ability to form spiral structures (arrow 2) in solution.
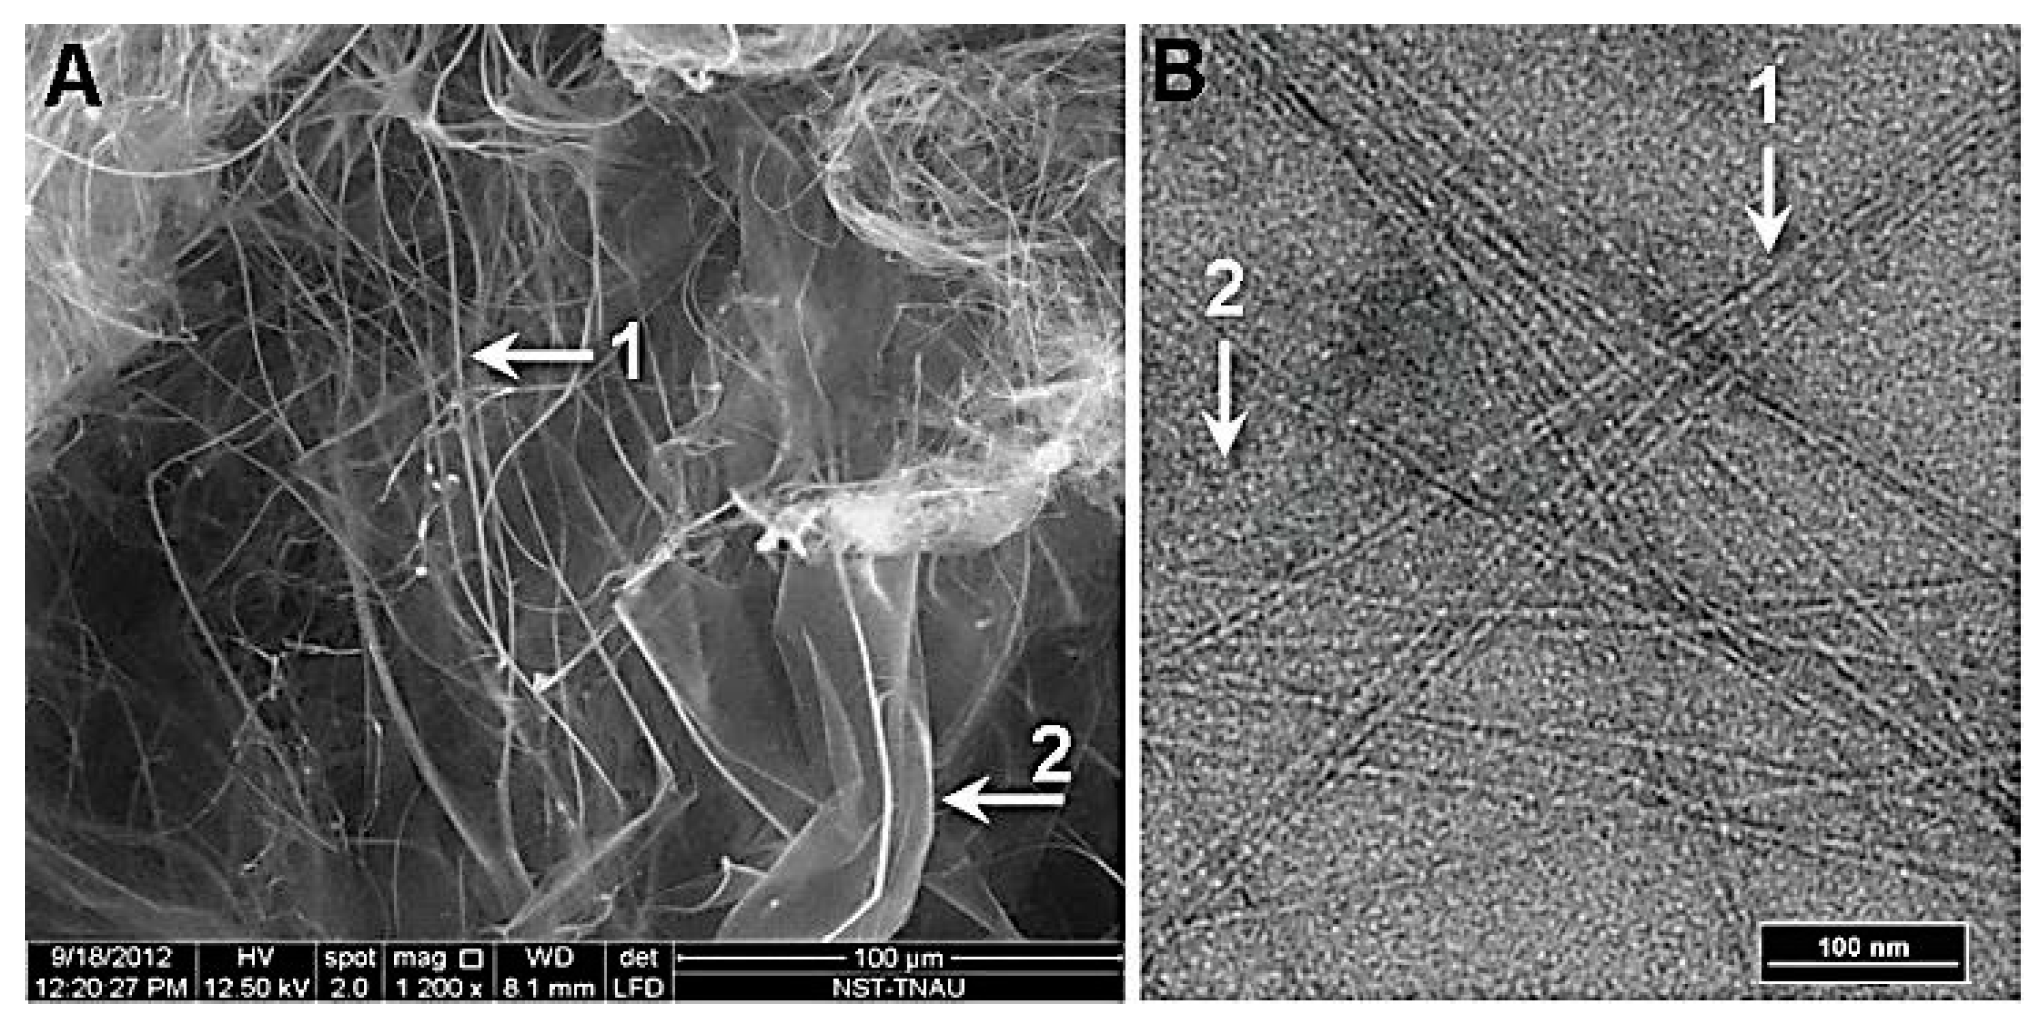
Figure 7.
SDS-PAGE analysis of peptides in nanoparticles and nanofibers. (A) The gel before staining (incubated in 10 % acetic acid v/v) to reveal the pink colour of anthocyanins. (B) The same gel stained with Coomassie brilliant blue to reveal peptides. Lane 1 – Molecular markers, Lane 2 - Anthocyanins with polypeptides in nanoparticles resuspended in 15 % glycerol; Lane 3 – Supernatant (aqueous phase) after Trizol extraction of nanoparticles shows peptides associated with anthocyanins; Lane 4 – Nanoparticles in 15 % glycerol; Lanes 5, 6 and 7– Correspond to the supernatant, interphase and organic phase (no anthocyanin or peptide staining in Lane 7) of nanoparticles subjected to Trizol extraction; Note that the bulk of peptides and anthocyanins are in the aqueous (hydrophilic) phase of Trizol extract (Lane 5); Lanes 8, 9 and 10 – Correspond to the supernatant, interphase and the organic phase obtained after Trizol extraction of nanofibers from ethanol bleached cherries, where most of the anthocyanins have been removed, as observed in 7 A. Lanes 8, 9 and 10 of 7 B shows staining of nanofibers with Coomassie blue. Lane 8 (aqueous phase) showed the presence of peptides, while the interphase and the organic phase of nanofibers showed minimal staining for peptides (Lanes 9 & 10 of 7 B). (C & D) Association of pectin and polypeptides in the nanoparticles as revealed by the similarity in staining with propidium iodide and Coomassie brilliant blue after SDS-PAGE of nanoparticles. Lane 1 - Pectin; Lane 2 – Peptides in nanoparticles; Lane 3 – Peptides excluded during dialysis (6-8 kDa). Lane 4 – Polygalacturonic acid which shows staining with propidium iodide, and not for polypeptides (D). Lane 5 – Pellet of sour cherry homogenate (post 12000 ×g) also shows the presence of pectin and polypeptides.
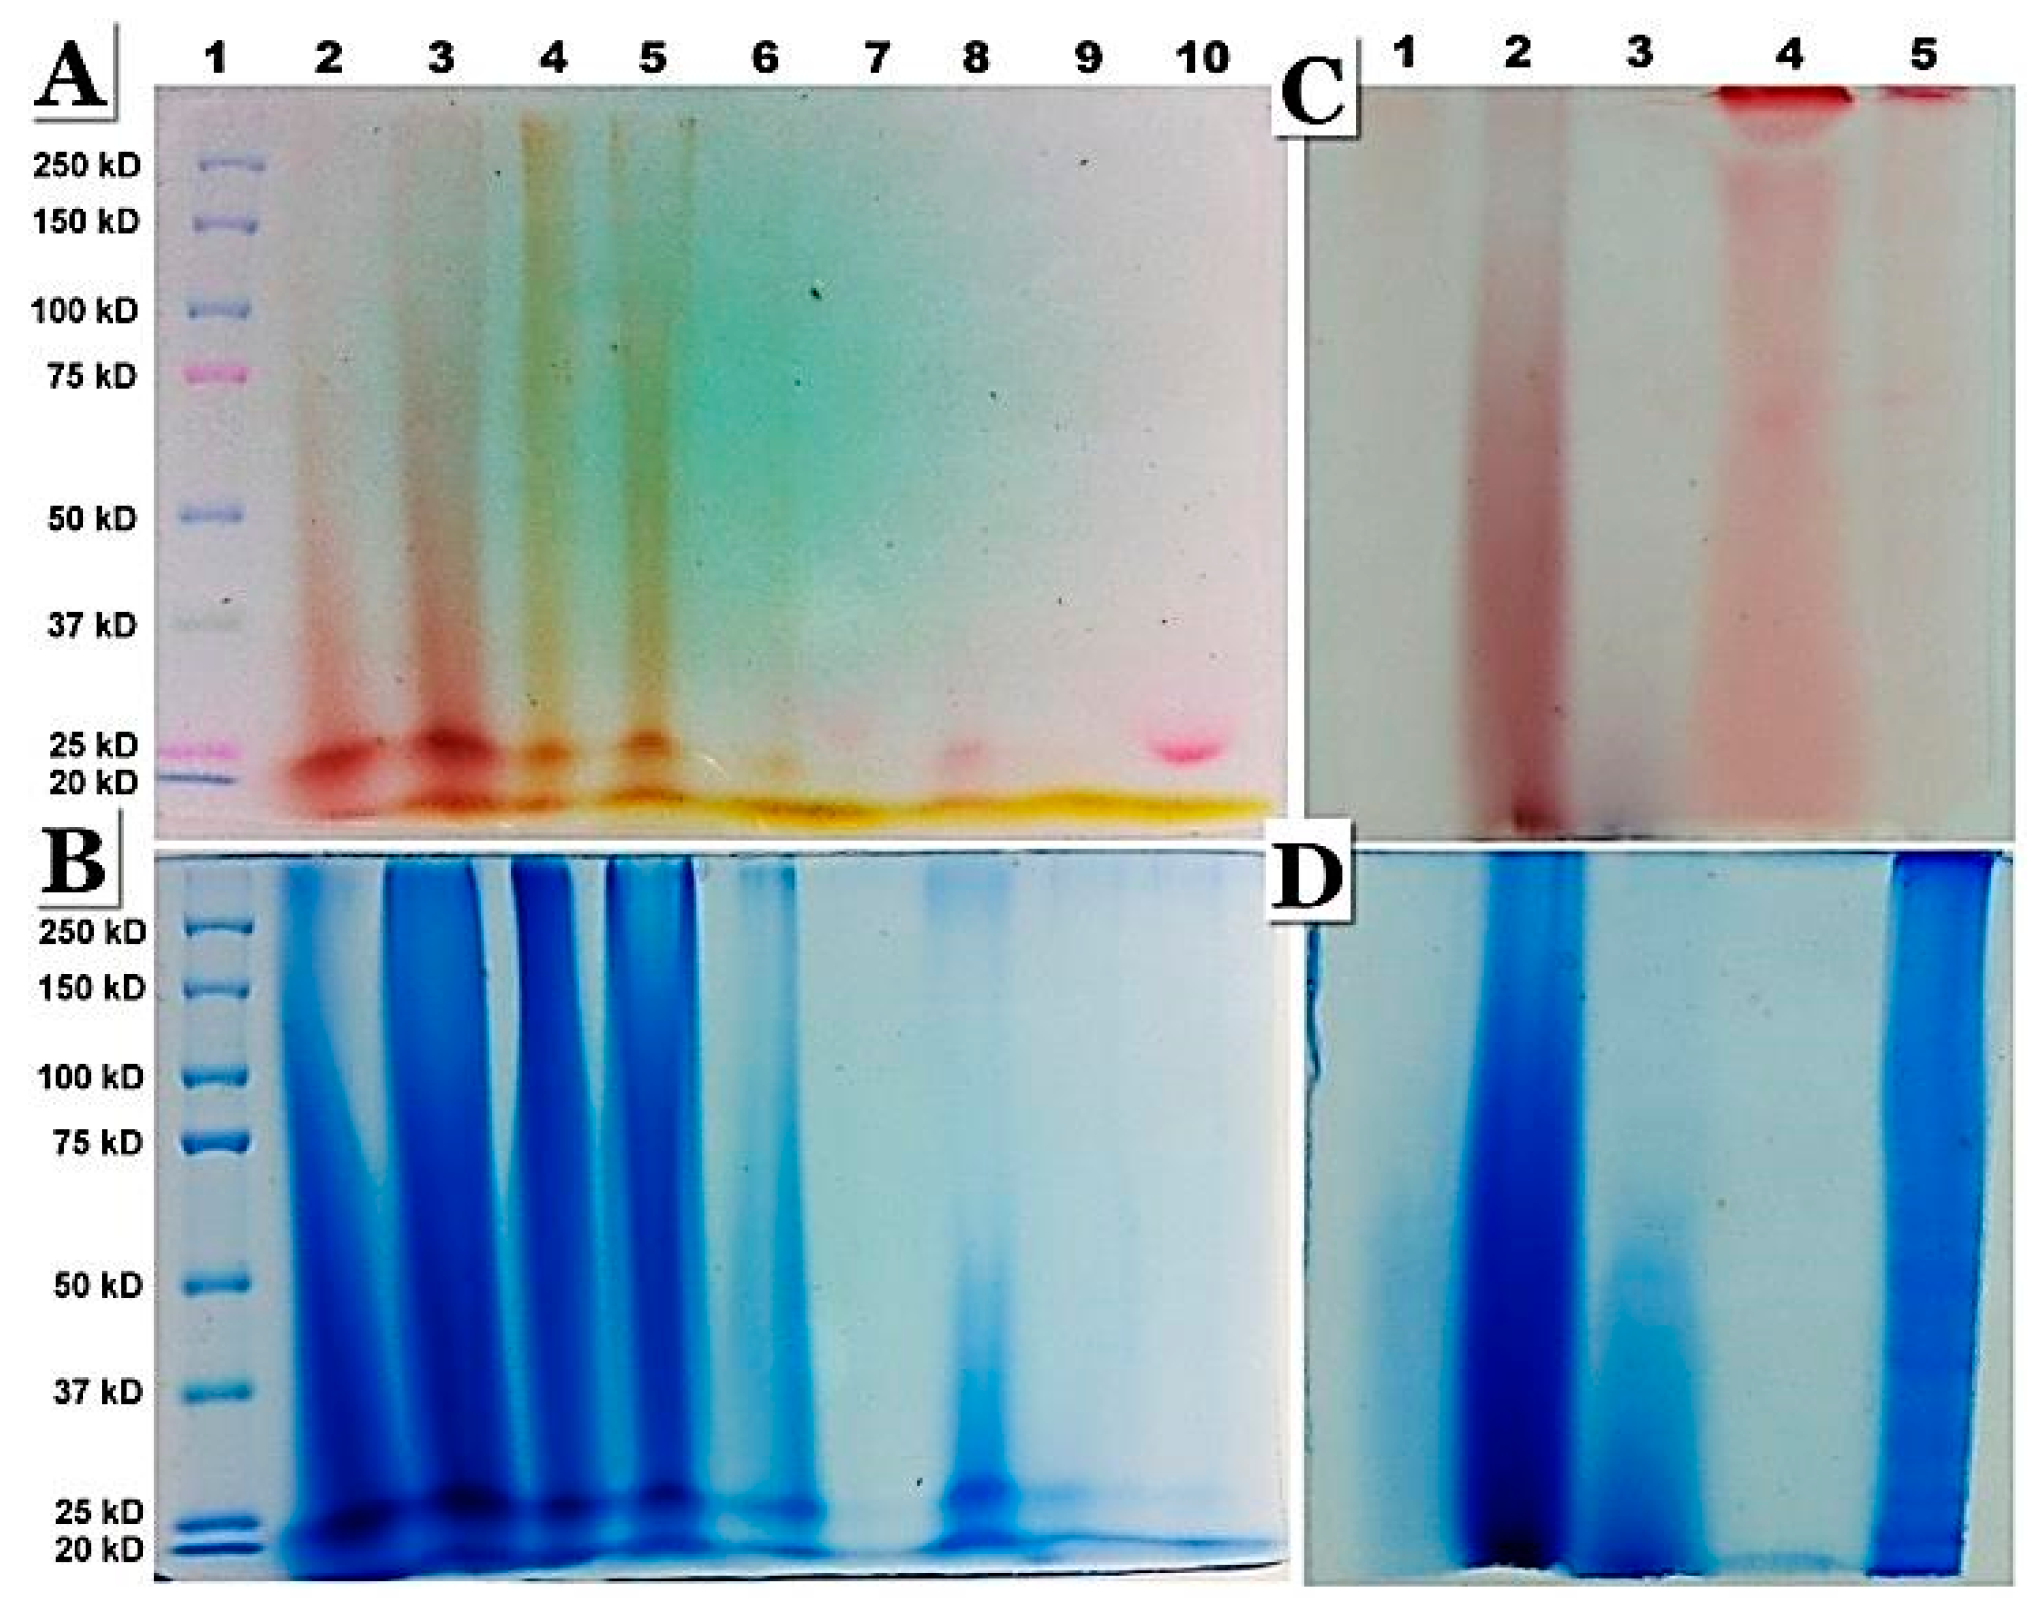
Figure 8.
Nanoparticles and nanofibers were subjected to SDS-PAGE and immunolocalization with structure specific monoclonal antibodies (rat IgM). The bound antibodies were detected with alkaline phosphatase conjugated goat-anti rat IgG. (A) Coomassie brilliant blue staining of polypeptides in nanofibers (Lane 2) and nanoparticles (Lane 3). (B) shows the reactivity of nanoparticles (Lane 2) and nanofibers (Lane 3) against homogalacturonan (oligo 1,4-linked galacturonic acid methyl esters) antibody. Dot blots against the same antibody are shown below (B). (C) Reaction to anti-extensin antibodies. (D) Very strong reaction was observed against anti-arabinogalactan-protein (hemicellulose-protein) by both nanoparticles and nanofibers (Lanes 2 & 3). This was also demonstrated by dot blots (bottom). Dot blot below A indicates reactivity of nanofibers and nanoparticles to anti-xyloglucan (LM15).
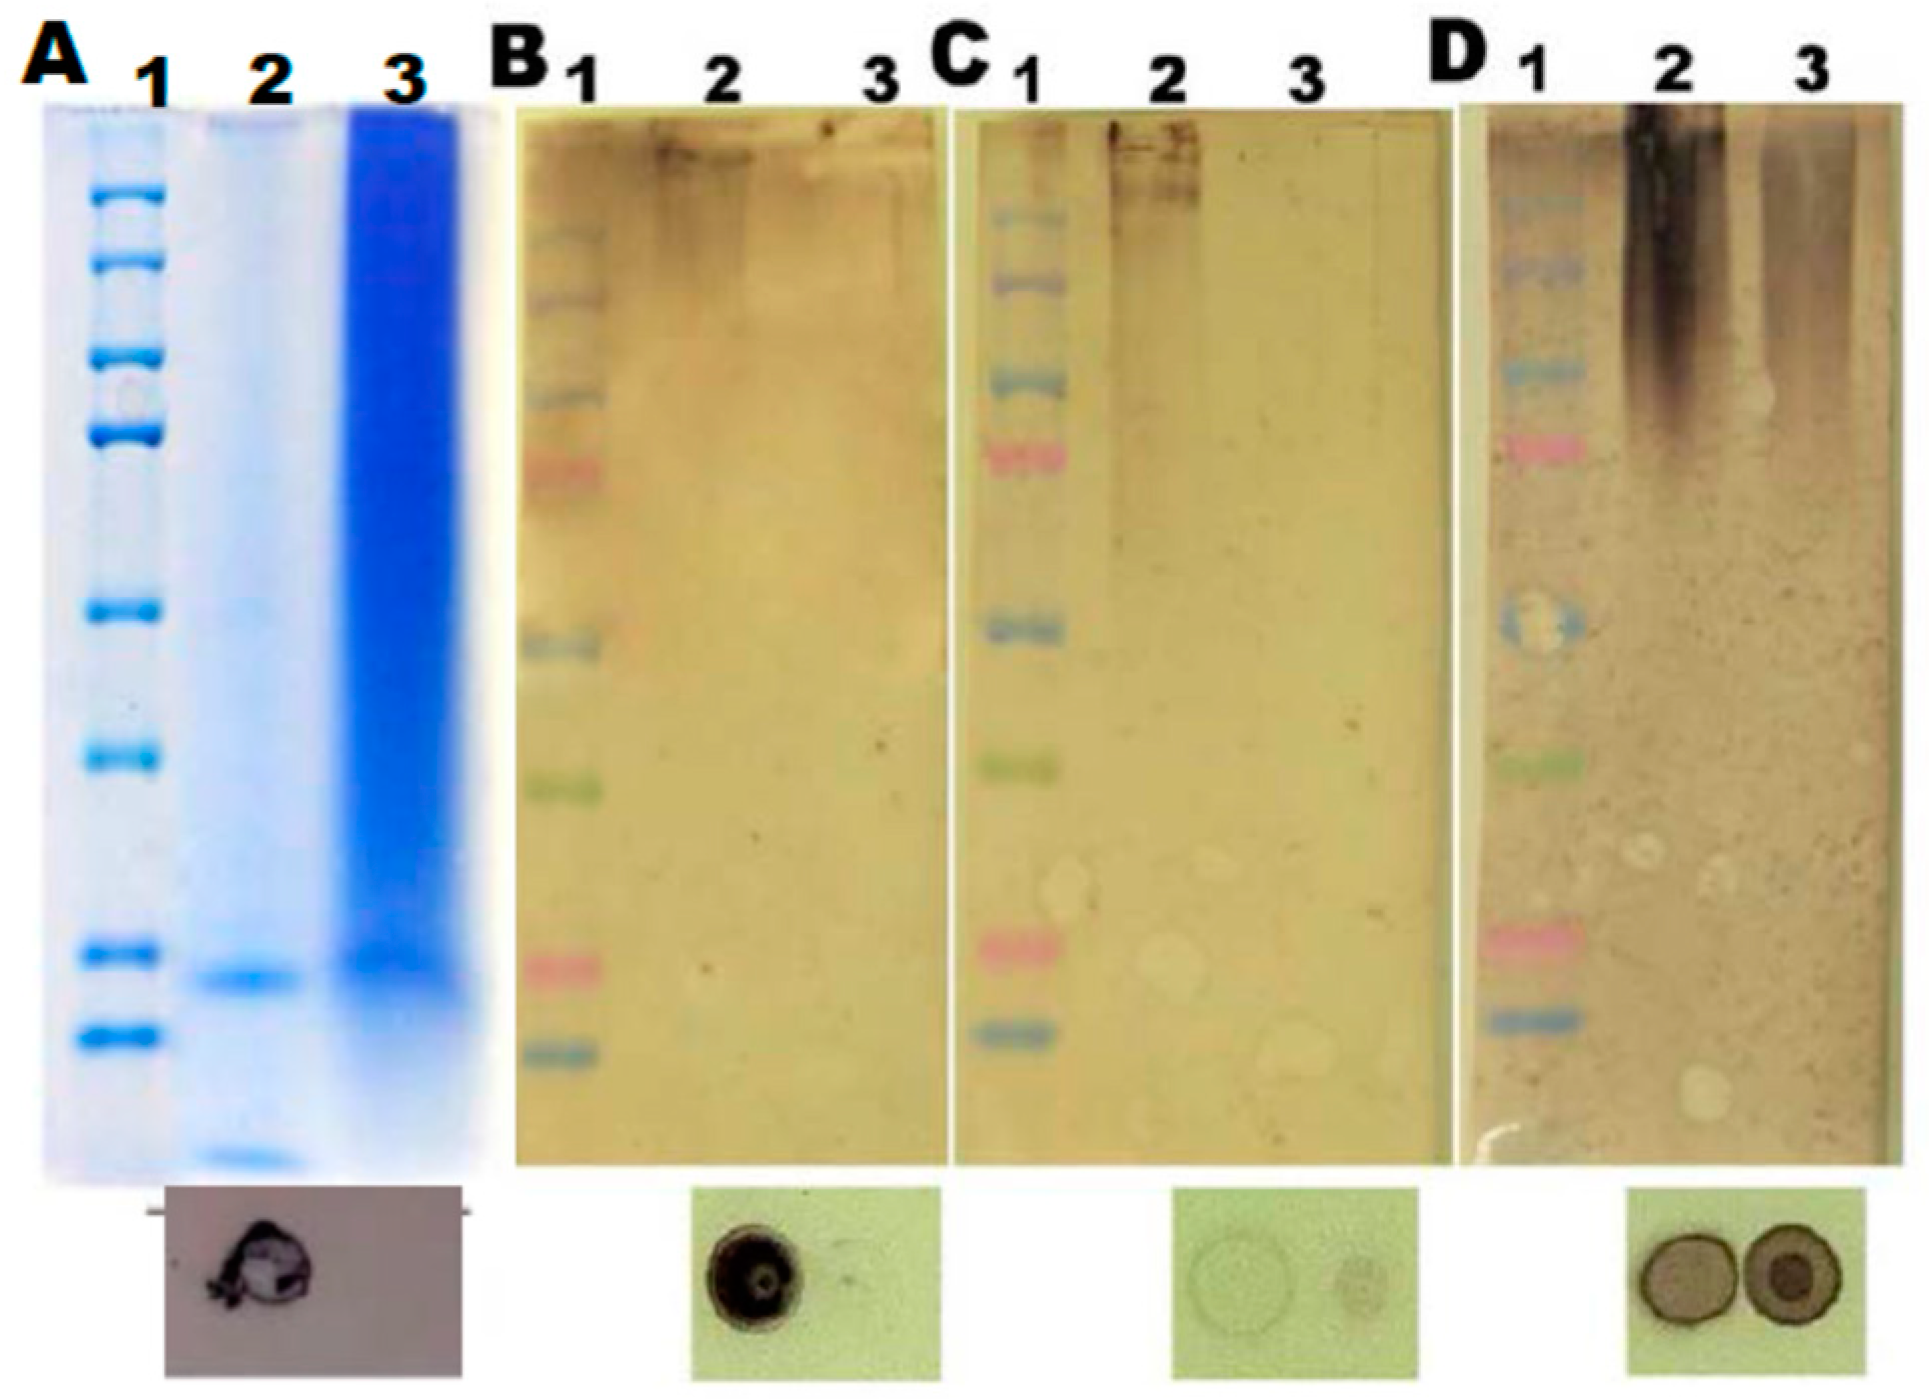
Figure 9.
A proposed model for the nanoparticle from a magnified view of a nanoparticle as observed by TEM. (A) arrow 1 – shows a collapsed region around the inner core showing a ring shaped structure, surrounded by a less electron dense region comprised of helical fibrous structures potentially containing pectin, peptides and anthocyanins (arrow 2). Surrounding this layer, there is a slightly more electron dense fibrillary region forming the outer part of the nanoparticle (arrow 3) potentially comprising arabinogalacan-protein containing fibrils. (B) – An enlarged view of the nanoparticle. The helical elements are indicated by arrows.
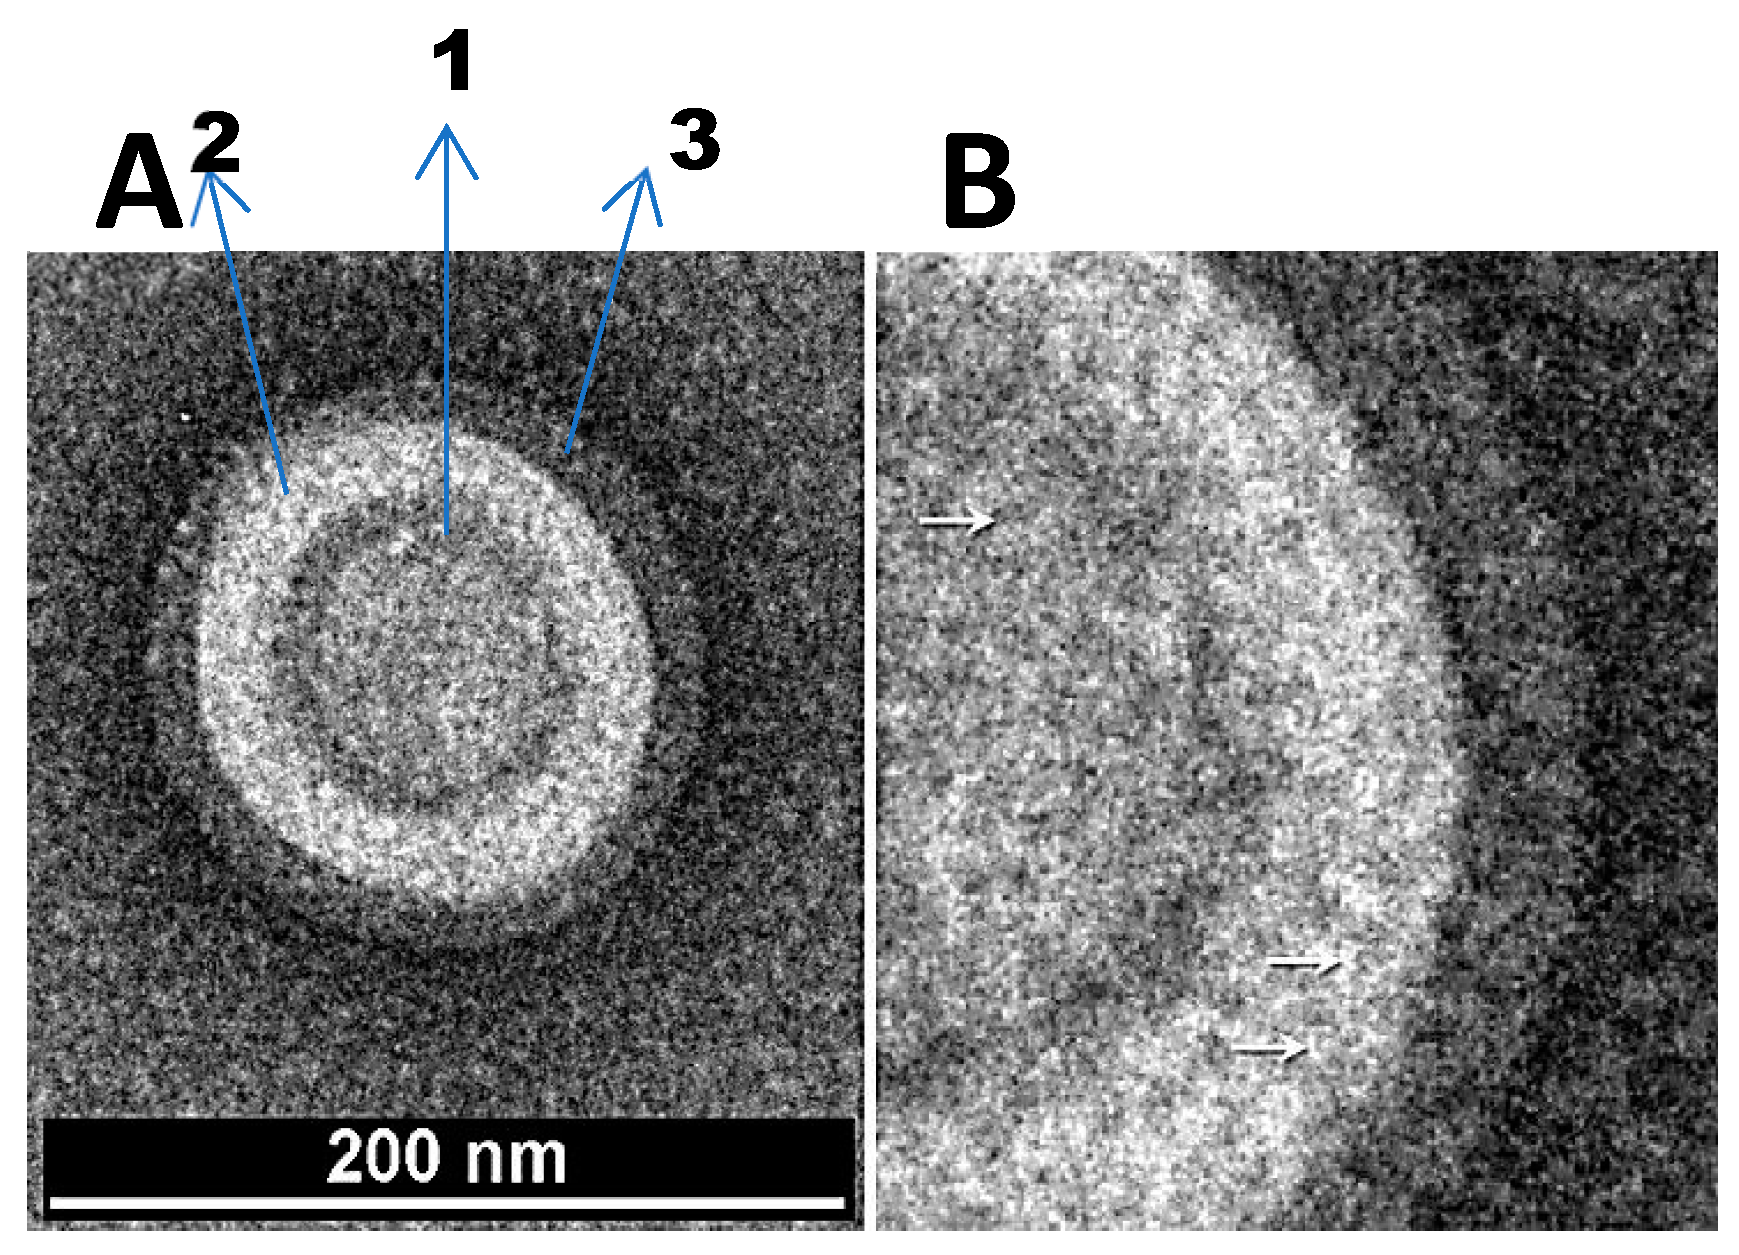
Figure 10.
Uptake of calcein-nanofiber adducts into HT 29 and CRL 1790 cells. (A, C) – Uptake of free calcein (Ex 494 nm/ Em 517 nm) by HT29 (top) and CRL 1790 (bottom) respectively; (B, D) – Uptake of nanofiber-calcein adducts into HT 29 (top) and CRL 1790 (bottom), respectively. The increased uptake is visible by the accumulation of nanofiber-calcein adducts in organelles showing enhanced fluorescence (bar= 25 µm).
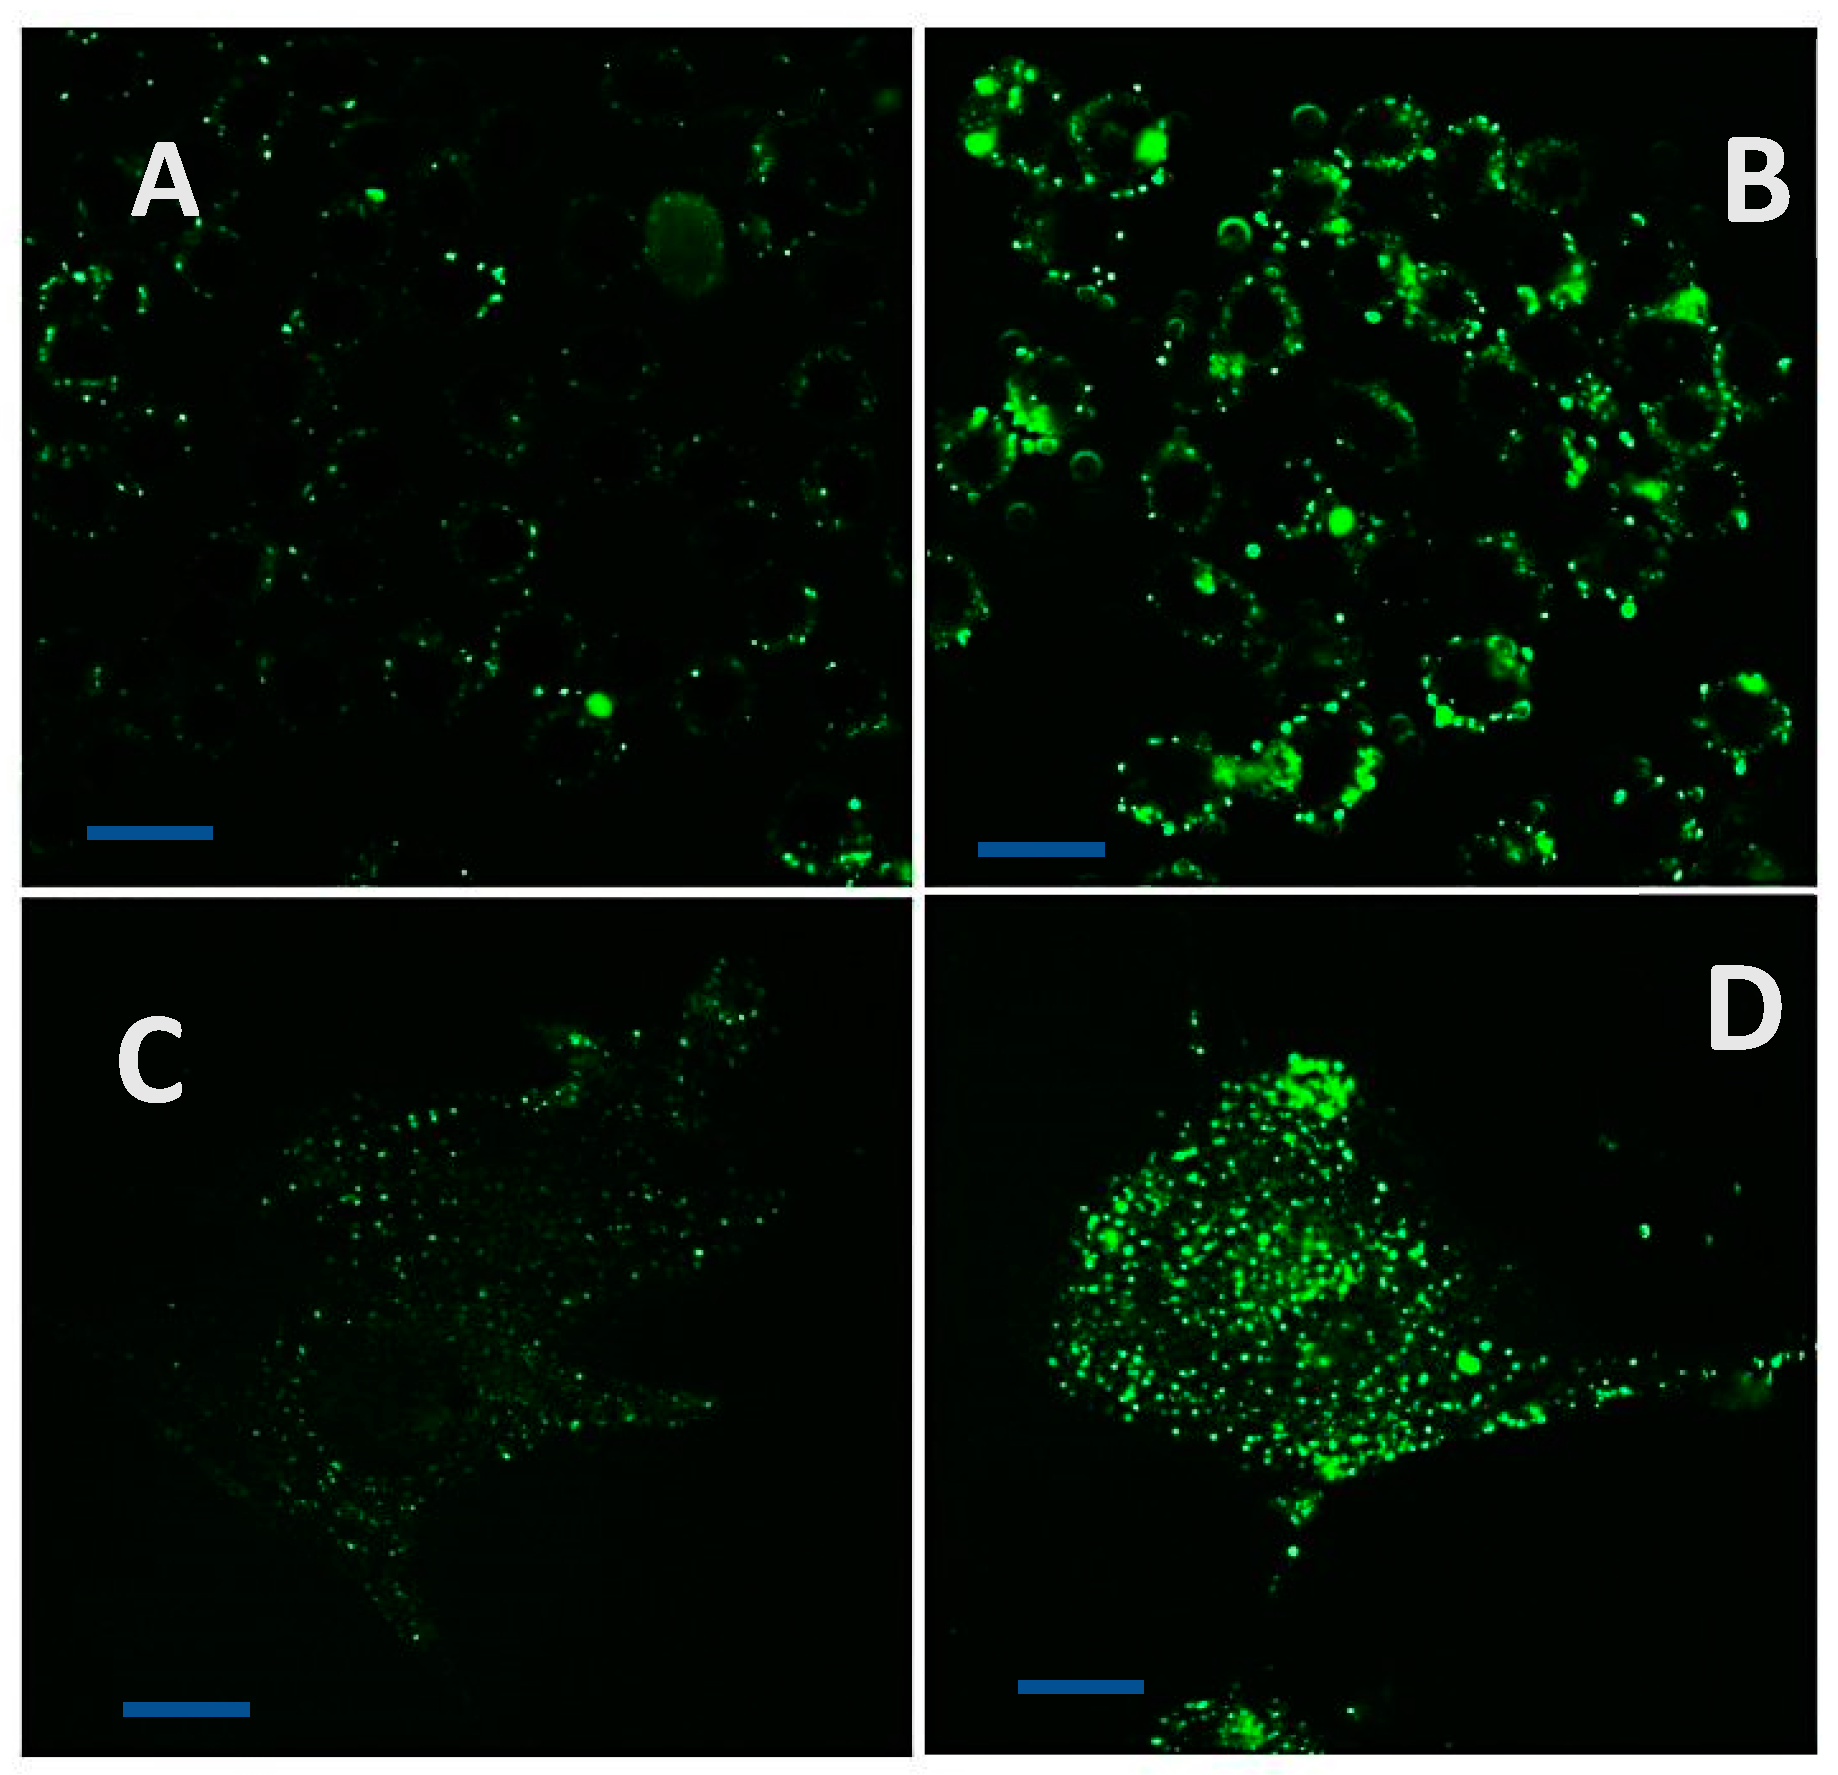
Figure 11.
(Left). Induction of cytotoxicity in CRL 2158 multidrug resistant cancer cells by paclitaxel in combination with nanofibers. The assay kit contains, calcein AM ester (Ex 494 nm, Em 517 nm) which specifically enters live cells, and stains the live cells green and ethidium homodimer (Ex 517 nm/ Em 617). The dying cells as well as dead cells are membrane compromised, and allows the entry of ethidium homodimer, which stains the nucleus red. The cells were observed at 517 nm to visualize live cells (green channel) and at 617 nm which enabled visualization of dead cells. The composite image from the two channels shows the cells in transition to loss of cell viability. (B, C) Control cells visualized at 617 nm (red, dead cells) and at 517 nm (green, live cells), respectively. (A) Composite image of untreated cells. (E, F) Cells treated with paclitaxel (32 nM) recorded at the two wavelengths 617 and 517 nm respectively. (D) Composite image. (H, I) Cells treated with 32 nM Paclitaxel + 4 μg/mL nanofiber. (G) A composite of the red and green images. Size bar = 25 µm.
Disclaimer/Publisher’s Note: The statements, opinions and data contained in all publications are solely those of the individual author(s) and contributor(s) and not of MDPI and/or the editor(s). MDPI and/or the editor(s) disclaim responsibility for any injury to people or property resulting from any ideas, methods, instructions or products referred to in the content. |
© 2024 by the authors. Licensee MDPI, Basel, Switzerland. This article is an open access article distributed under the terms and conditions of the Creative Commons Attribution (CC BY) license (https://creativecommons.org/licenses/by/4.0/).
Copyright: This open access article is published under a Creative Commons CC BY 4.0 license, which permit the free download, distribution, and reuse, provided that the author and preprint are cited in any reuse.


