1. Introduction
Currently, one of the world's concerns is environmental pollution generated by hu-man activities. Most municipal waste is organic waste (food scraps, pruning waste). There are various forms of disposal and treatment, and there is interest from the construction sector to contribute to reducing the environmental impact of its activities. Studies have been carried out on organic waste such as eggshell as a substitute for cement [
1], ashes from various plant residues [
2,
3], bio-char from wood waste and sawdust and palm oil ash [
4], sawdust [
5], waste from the cellulose industry [
6], dried corn husk fibers [
7], corn cob [
8], corn cob and sawdust [
9] and corn cob [
10].
In the present study, an analysis of some organic plant waste from homes, markets, parks and gardens has been carried out to evaluate its potential use as a partial replacement for sand in mortars and concrete, to reduce the impact of much of this waste that is disposed of without any treatment, generating pollution in many cities in Peru and other countries.
2. Materials and Methods
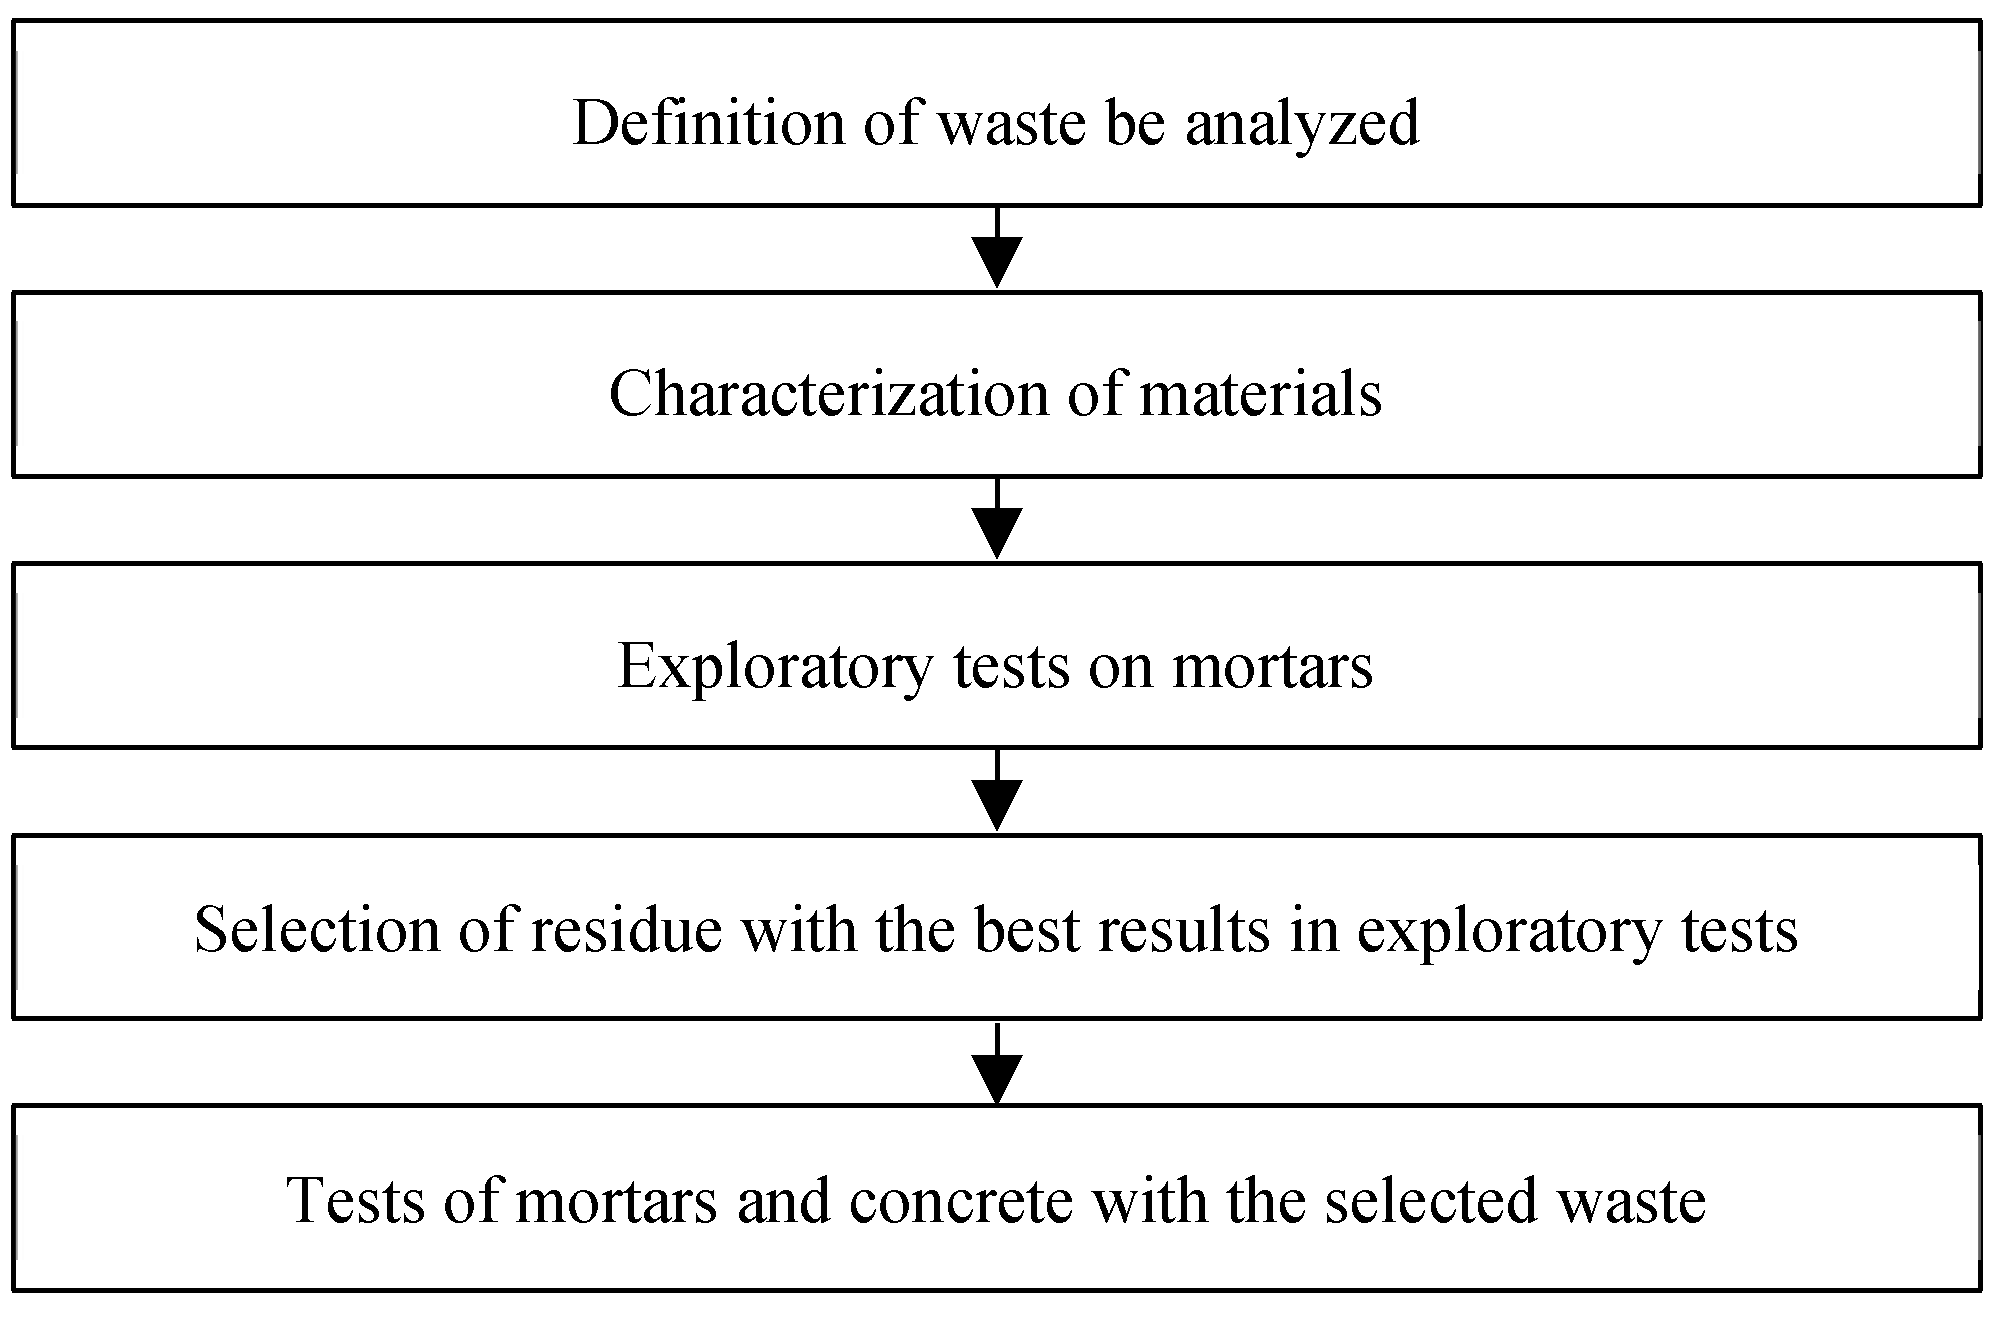
The stages of the process are shown in
Figure 1. They were then characterized, and exploratory tests were carried out to select the one with the best results and carry out the final tests with it.
2.1. Components of Mortar and Concrete
2.1.1. Vegetable Waste
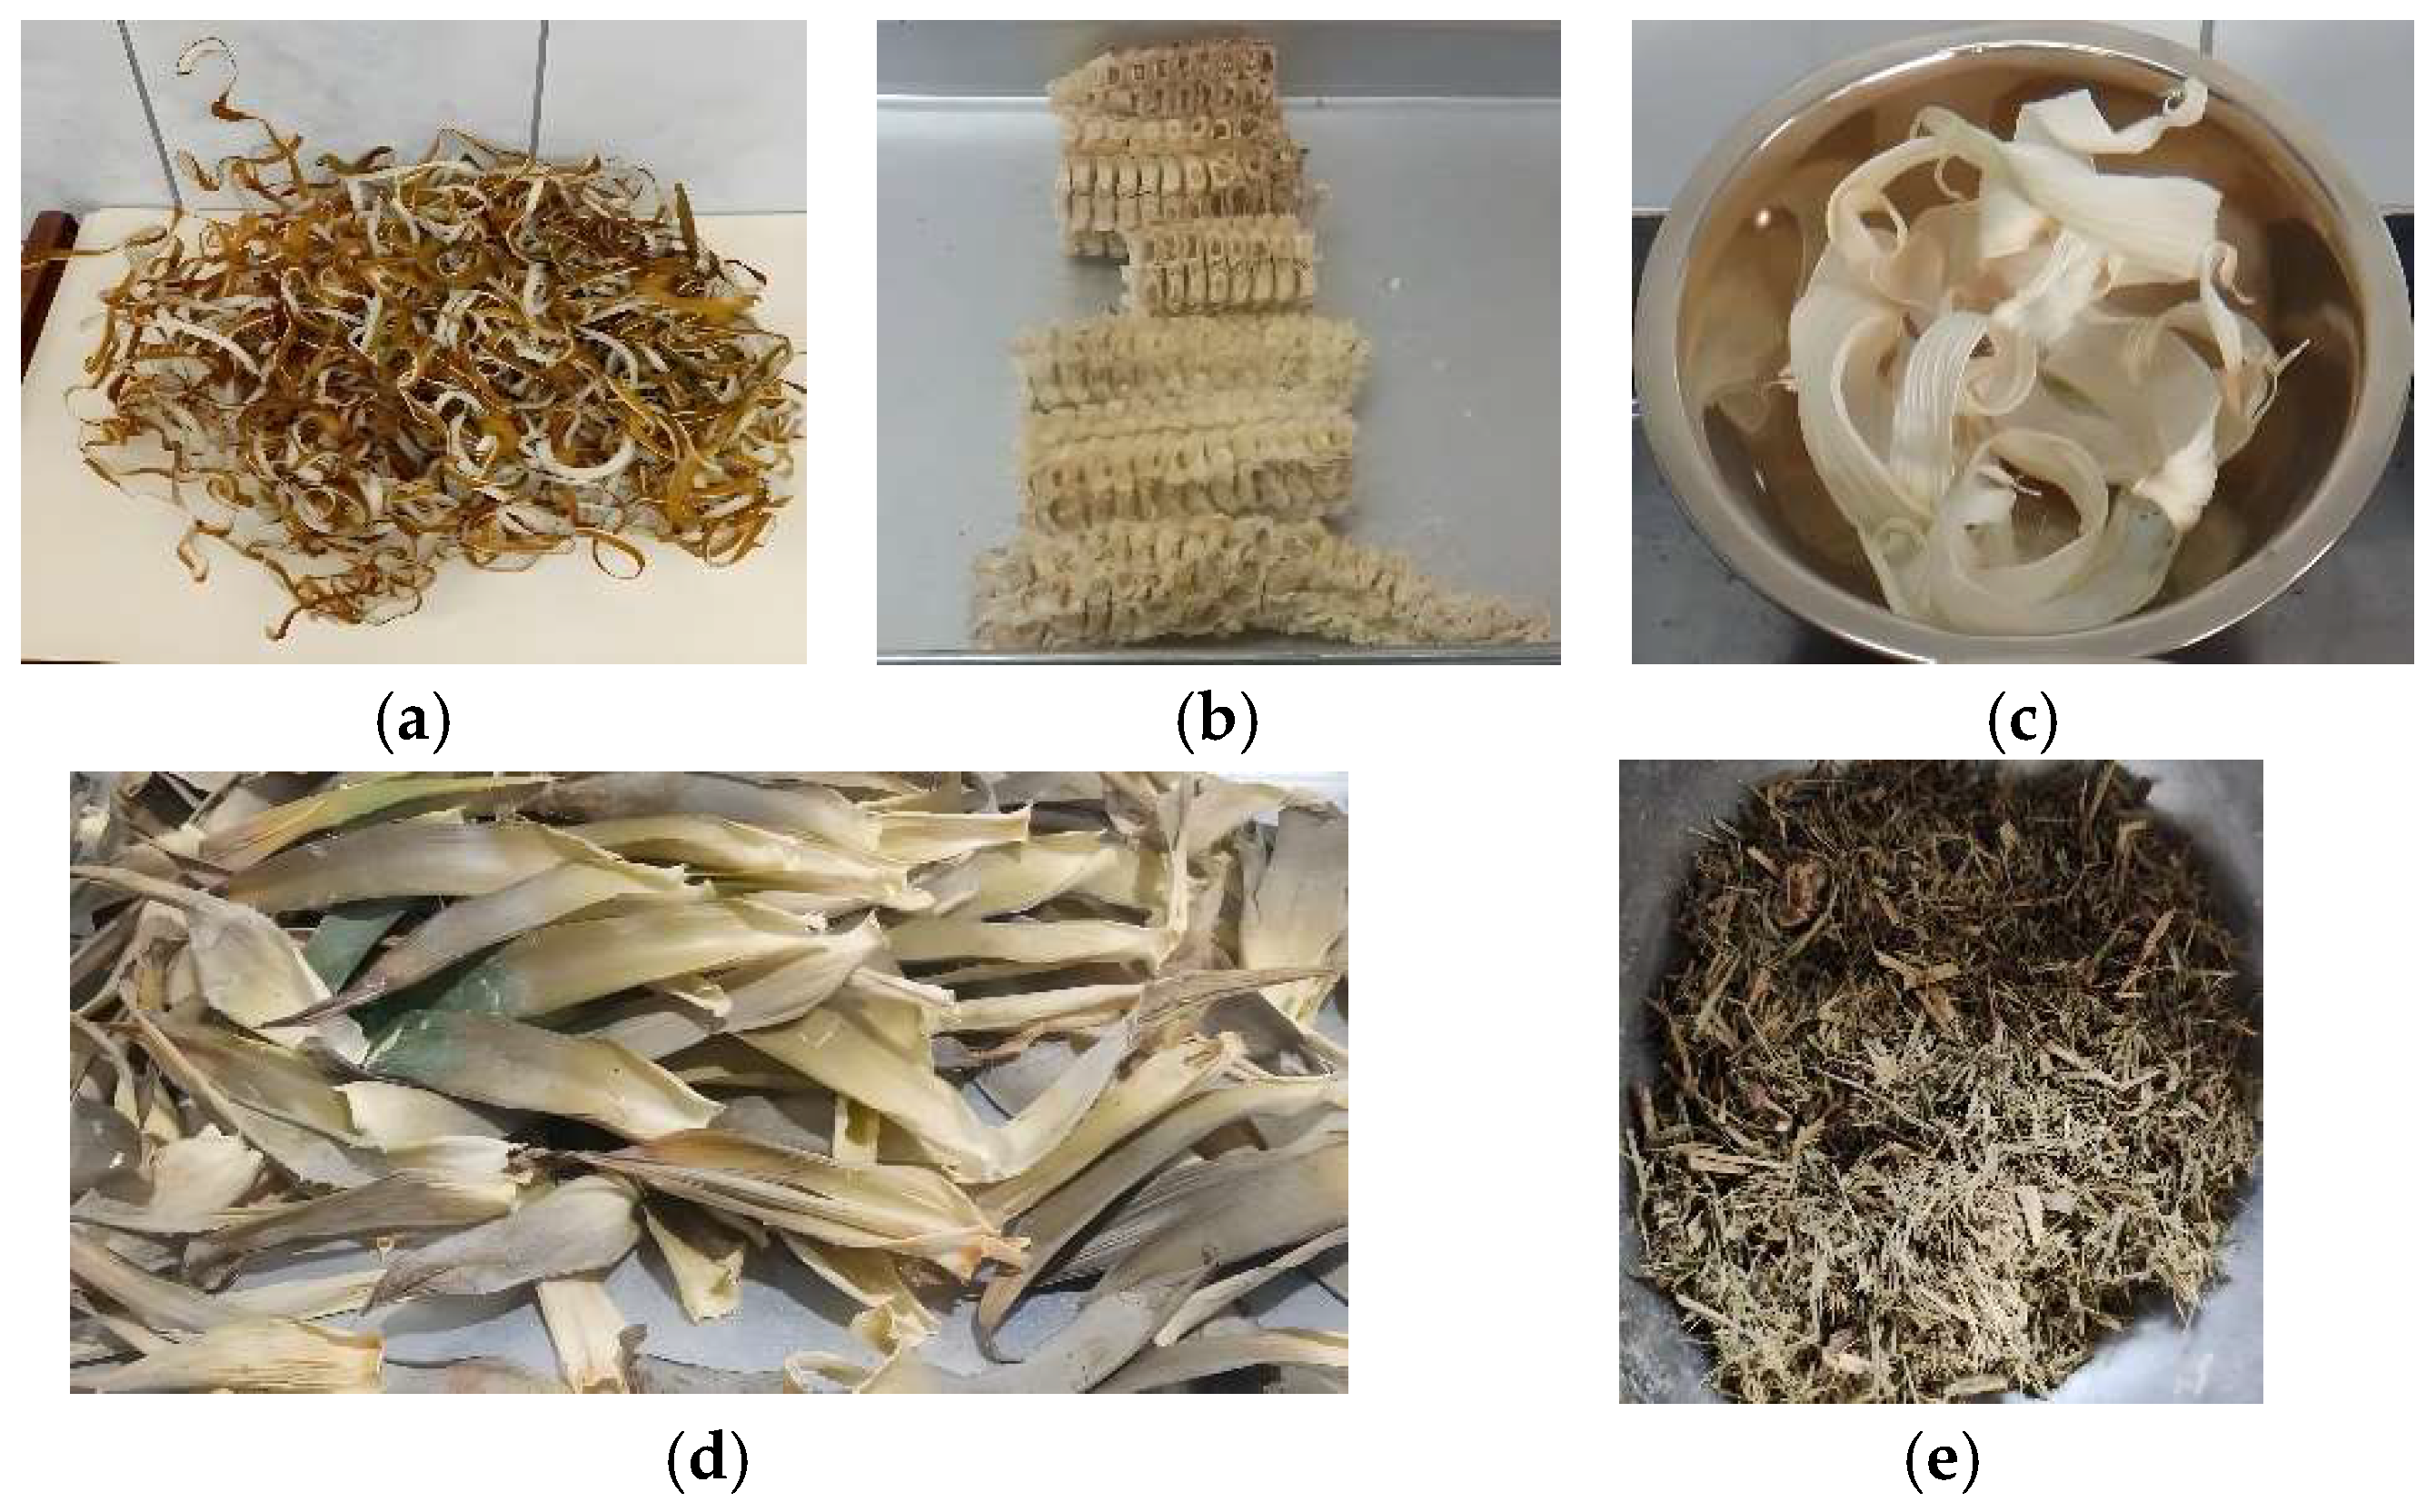
To define the waste to be studied, markets and homes in the city were visited and surveys were made in different homes at random to find out the types of waste and their availability and dried until obtaining constant weight
Figure 2
For the characterization of the samples, the analysis was carried out by Scanning Electron Microscopy (SEM), and by X-ray spectrometry to determine the chemical composition and elemental analysis and cellulose content, before and after exposure to UV, with Elemental Analyzer, through infrared spectroscopy analysis.
2.1.2. Cement and Aggregates
The cement was Portland I and aggregates of commonly used in Peru,
2.1.3. Fine Aggregate
The particle size was evaluated according to standards [
11] for fine aggregates.
Table 1 shows the granulometric analysis of the sand used; the fineness modulus obtained was 2.84 and
Table 2 shows the Physical properties of fine aggregate.
2.1.4. Coarse Aggregate
The coarse aggregate employed is a natural material commonly used.
The particle size was evaluated according to standard [
12].
The granulometric analysis of the coarse was done and the fineness modulus obtained was 7.40 and
Table 3 shows other properties.
2.2. Experimental Program
2.2.1. Exploratory Tests
Exploratory tests were carried out with the five residues using compression tests of mortar mixtures with various percentages of sand replacement after 7 days of curing.
Mortar Mix Design
Table 4,
Table 5 and
Table 6 present thirteen mortar mixes. Water/cement (w/c) ratio of 0.63 was constant and sand substitutions were in weight proportions of 0.2-0.6%, 0.6-1.2% and 1.2-1.8% of the natural sand weight.
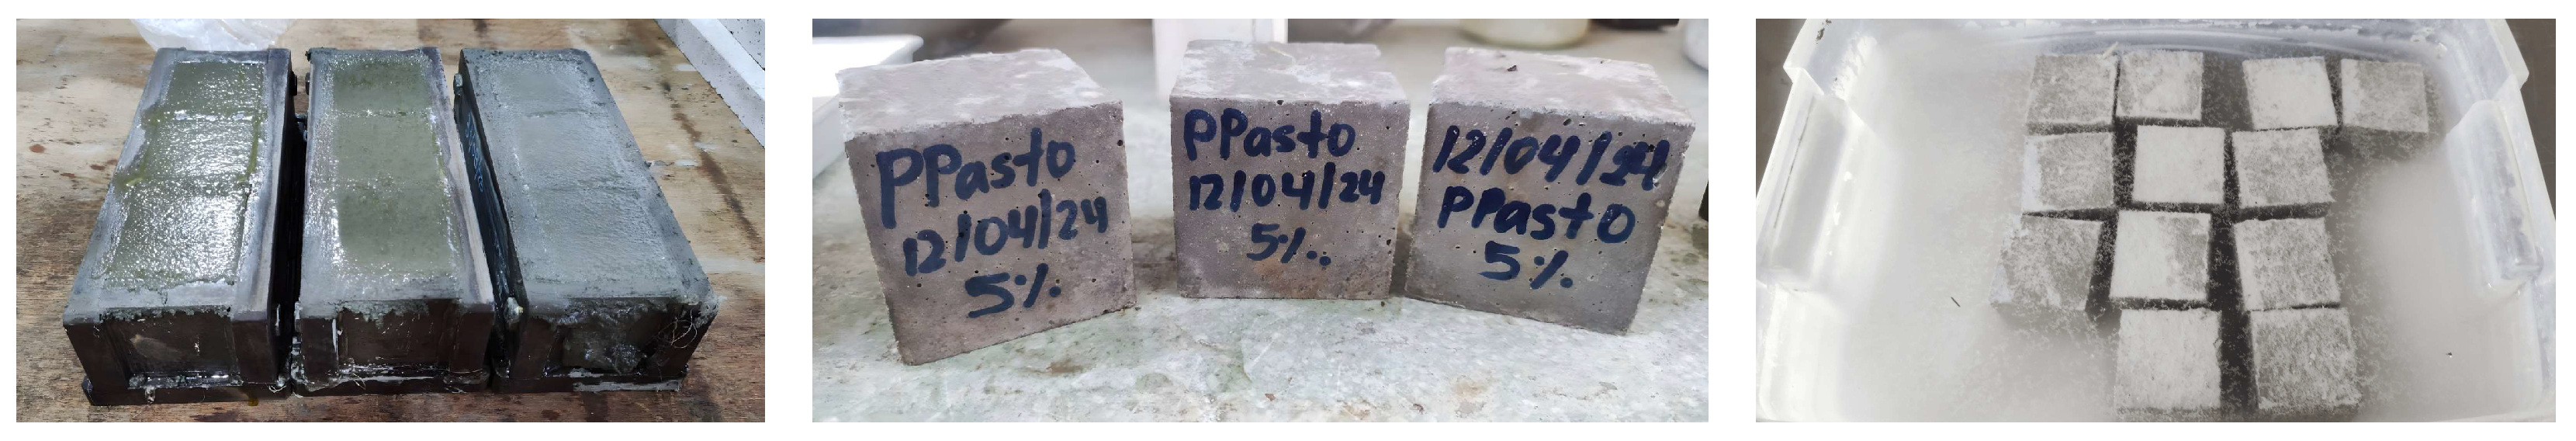
The manufacturing, molding and curing of the concrete samples were carried out according to the standards [
15,
16,
17]. The waste was added together with the sand. Total samples manufactured were 39.
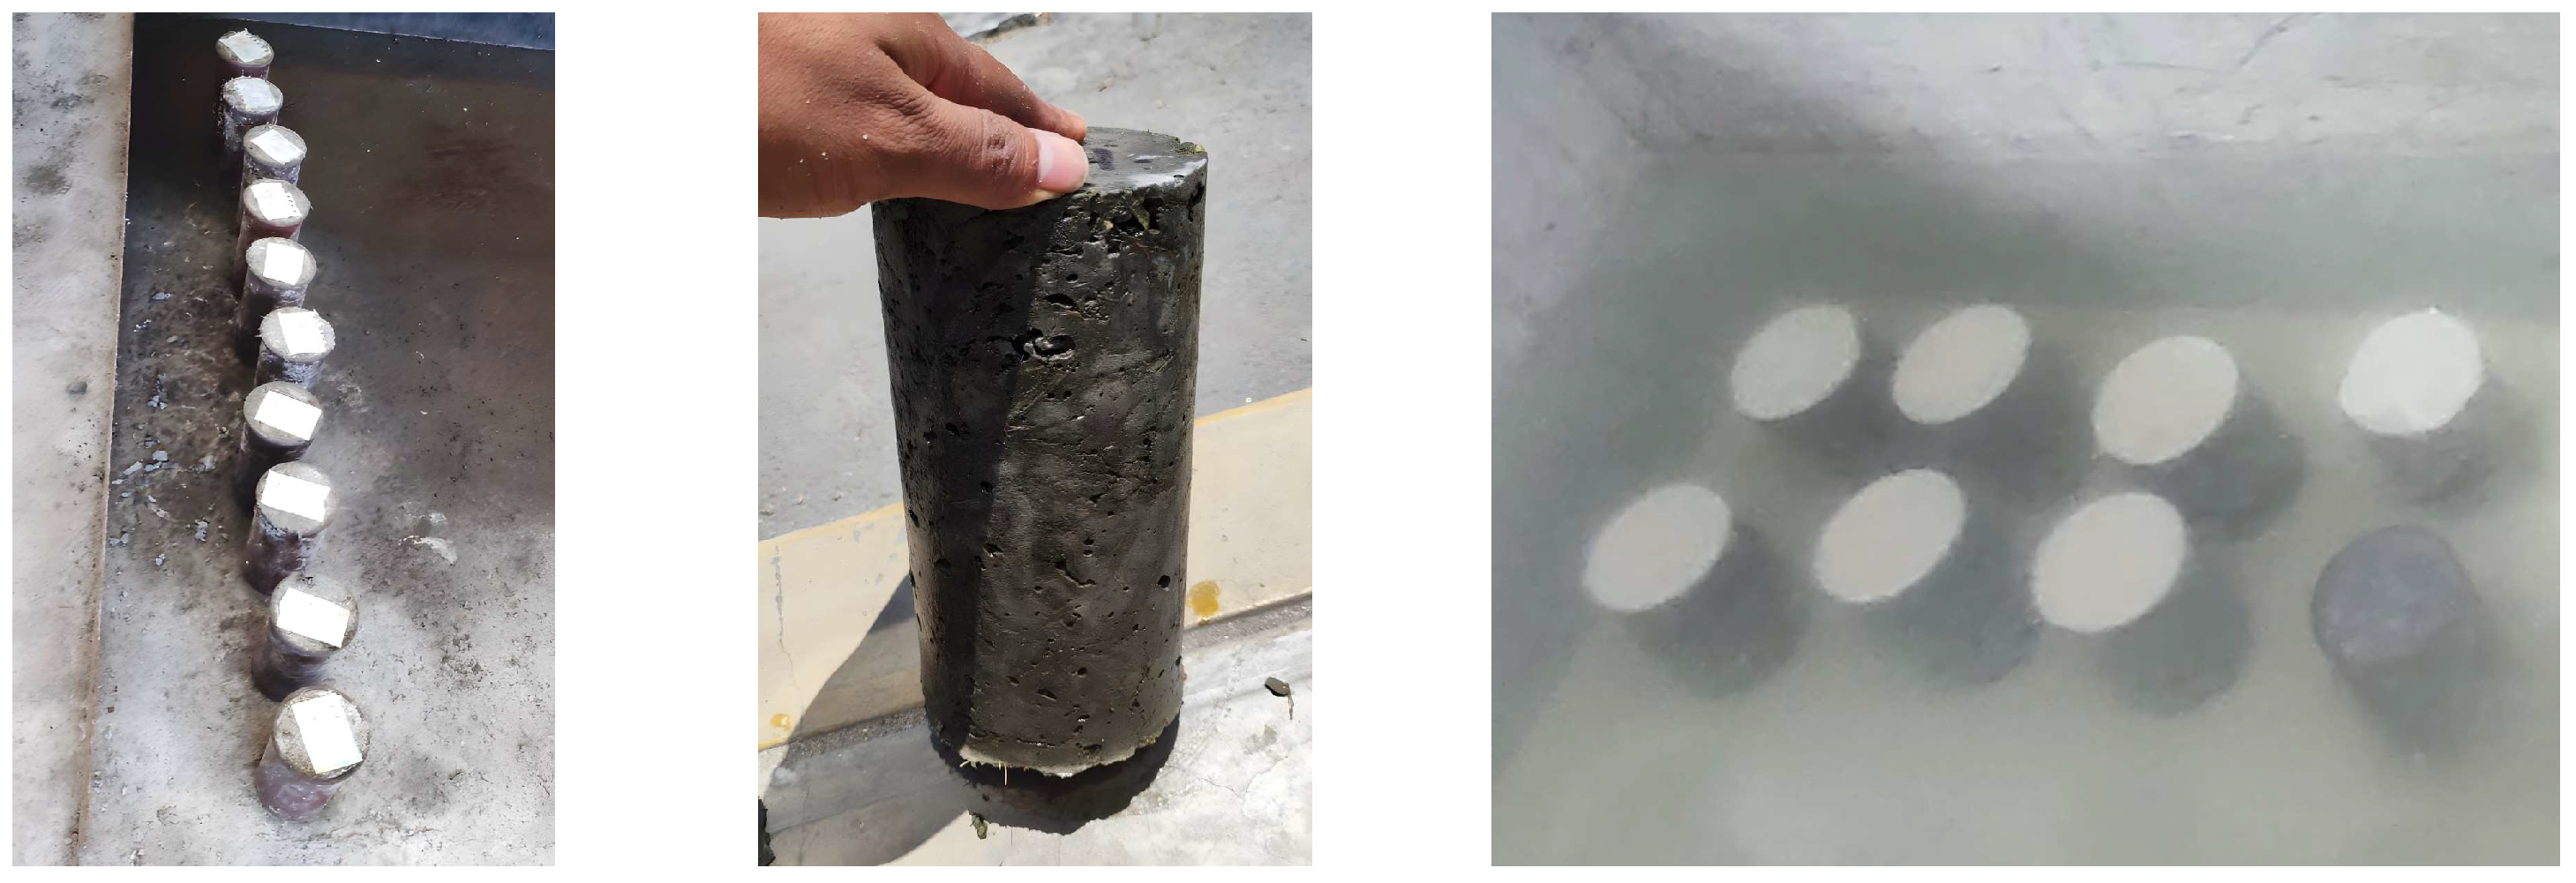
Figure 3.
Samples manufacturing process.
Figure 3.
Samples manufacturing process.
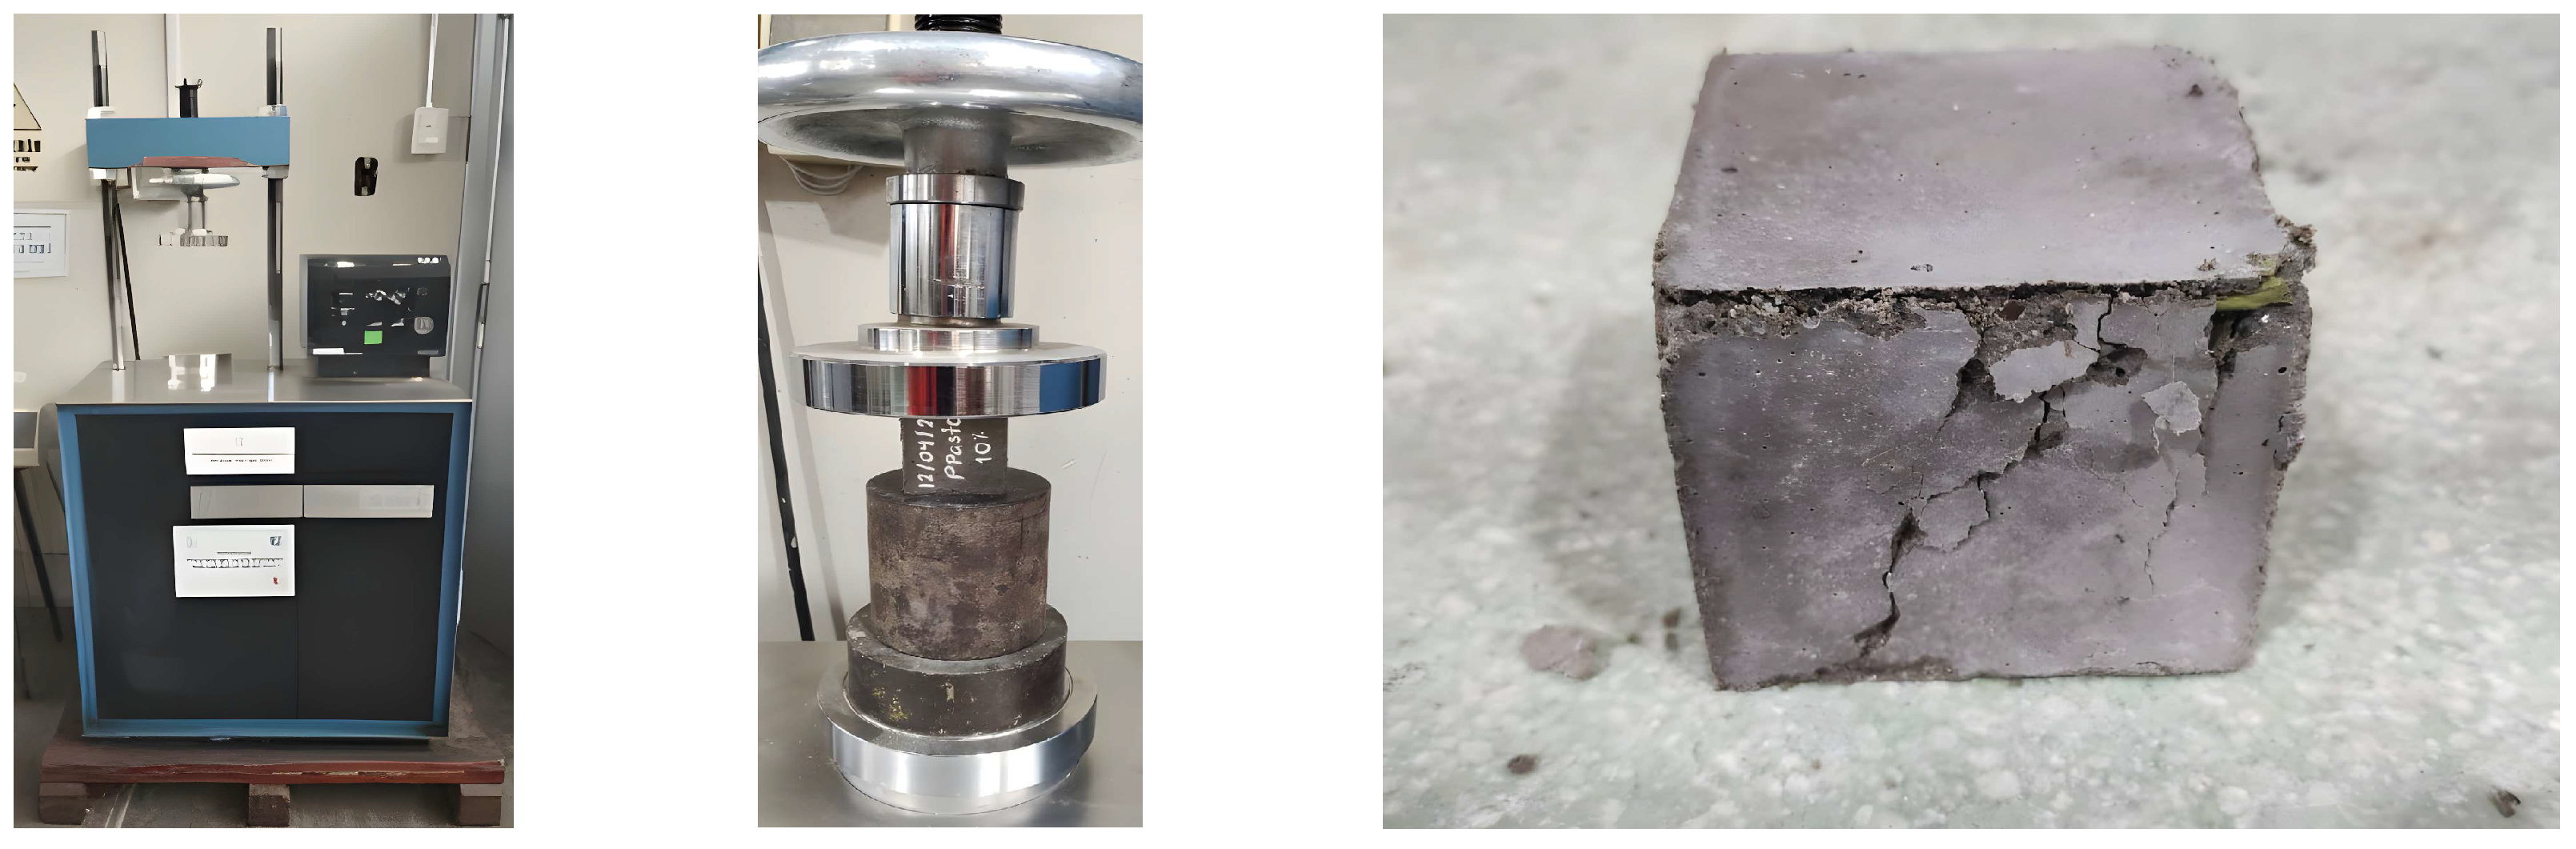
The Compressive tests
Eighteen cubic mortar samples were tested according to standard [
16], at a curing age of 7 days
Figure 4.
Compressive tests.
Figure 4.
Compressive tests.
2.2.2. Tests with the Residue with the Best Results
With the residue with the best results in the exploratory tests, samples of mortars and concrete were prepared and tested with sand replacement percentages of 5% and 10% by volume.
Mix Design
Table 8 presents six concrete dosages with water/cement (w/c) ratio of 0.57 constant, and sand substitutions with grass in volumetric proportions of 5% and 10% (CG-5% and CG-10%) of the natural sand volume.
Manufacturing of concrete samples
The concrete mixture was prepared, molded and curing according to standards [
17]. The grass was added together with the sand and a total of 30 samples were done.
Figure 5.
The concrete slump, the unit weight, the setting time and the temperature were obtained with the ASTM standards [
18,
19,
20,
21].
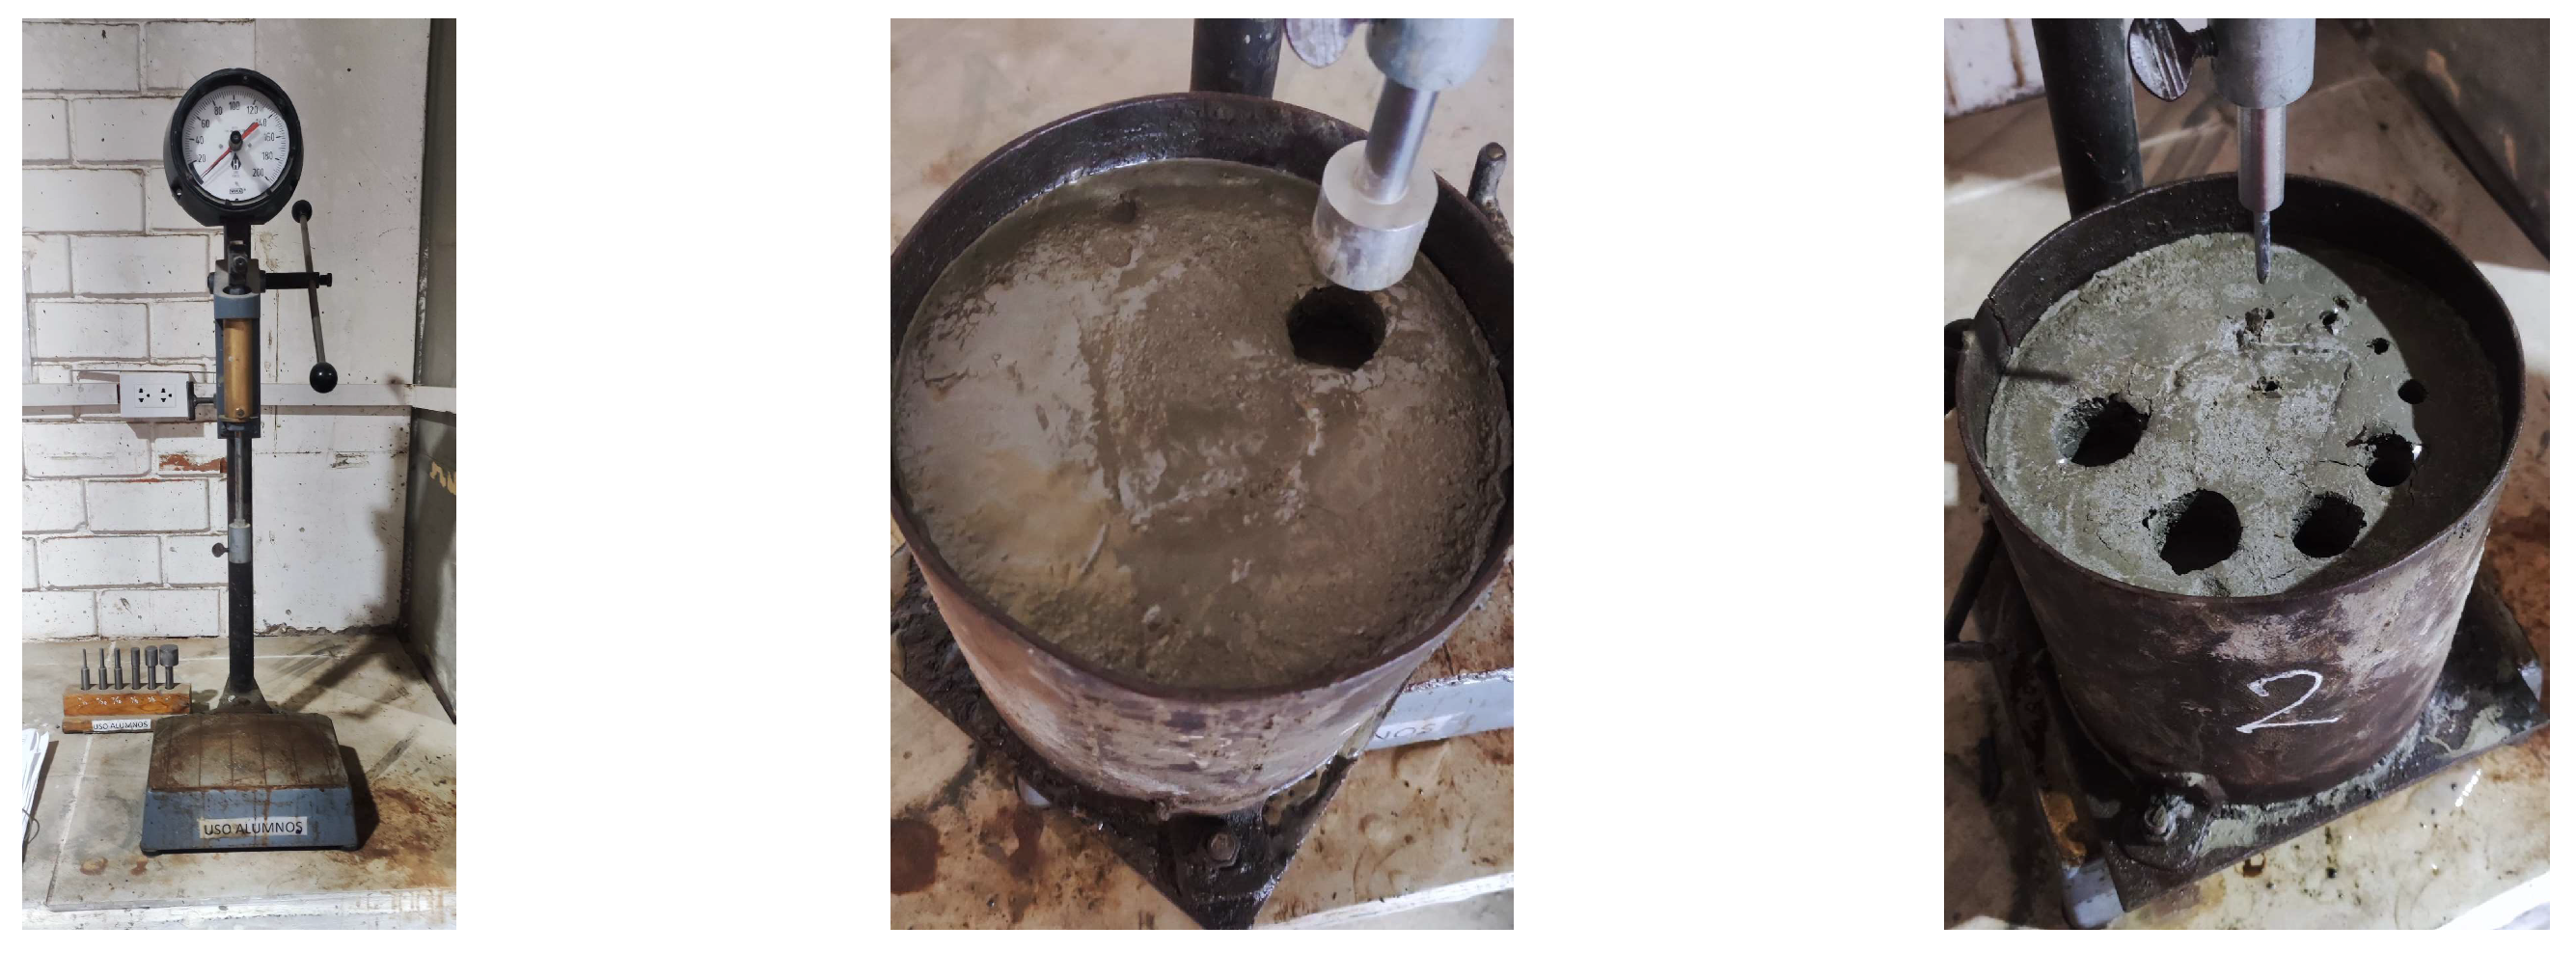
The initial and final setting times were also determined, and the corresponding graphs were plotted.
Figure 6.
The setting time for the pattern (PC).
Figure 6.
The setting time for the pattern (PC).
The Temperature of the Concrete
Temperature was tested for the three types of concrete and the values varies between 19.2 °C and 21.3 °C.
The Compressive tests
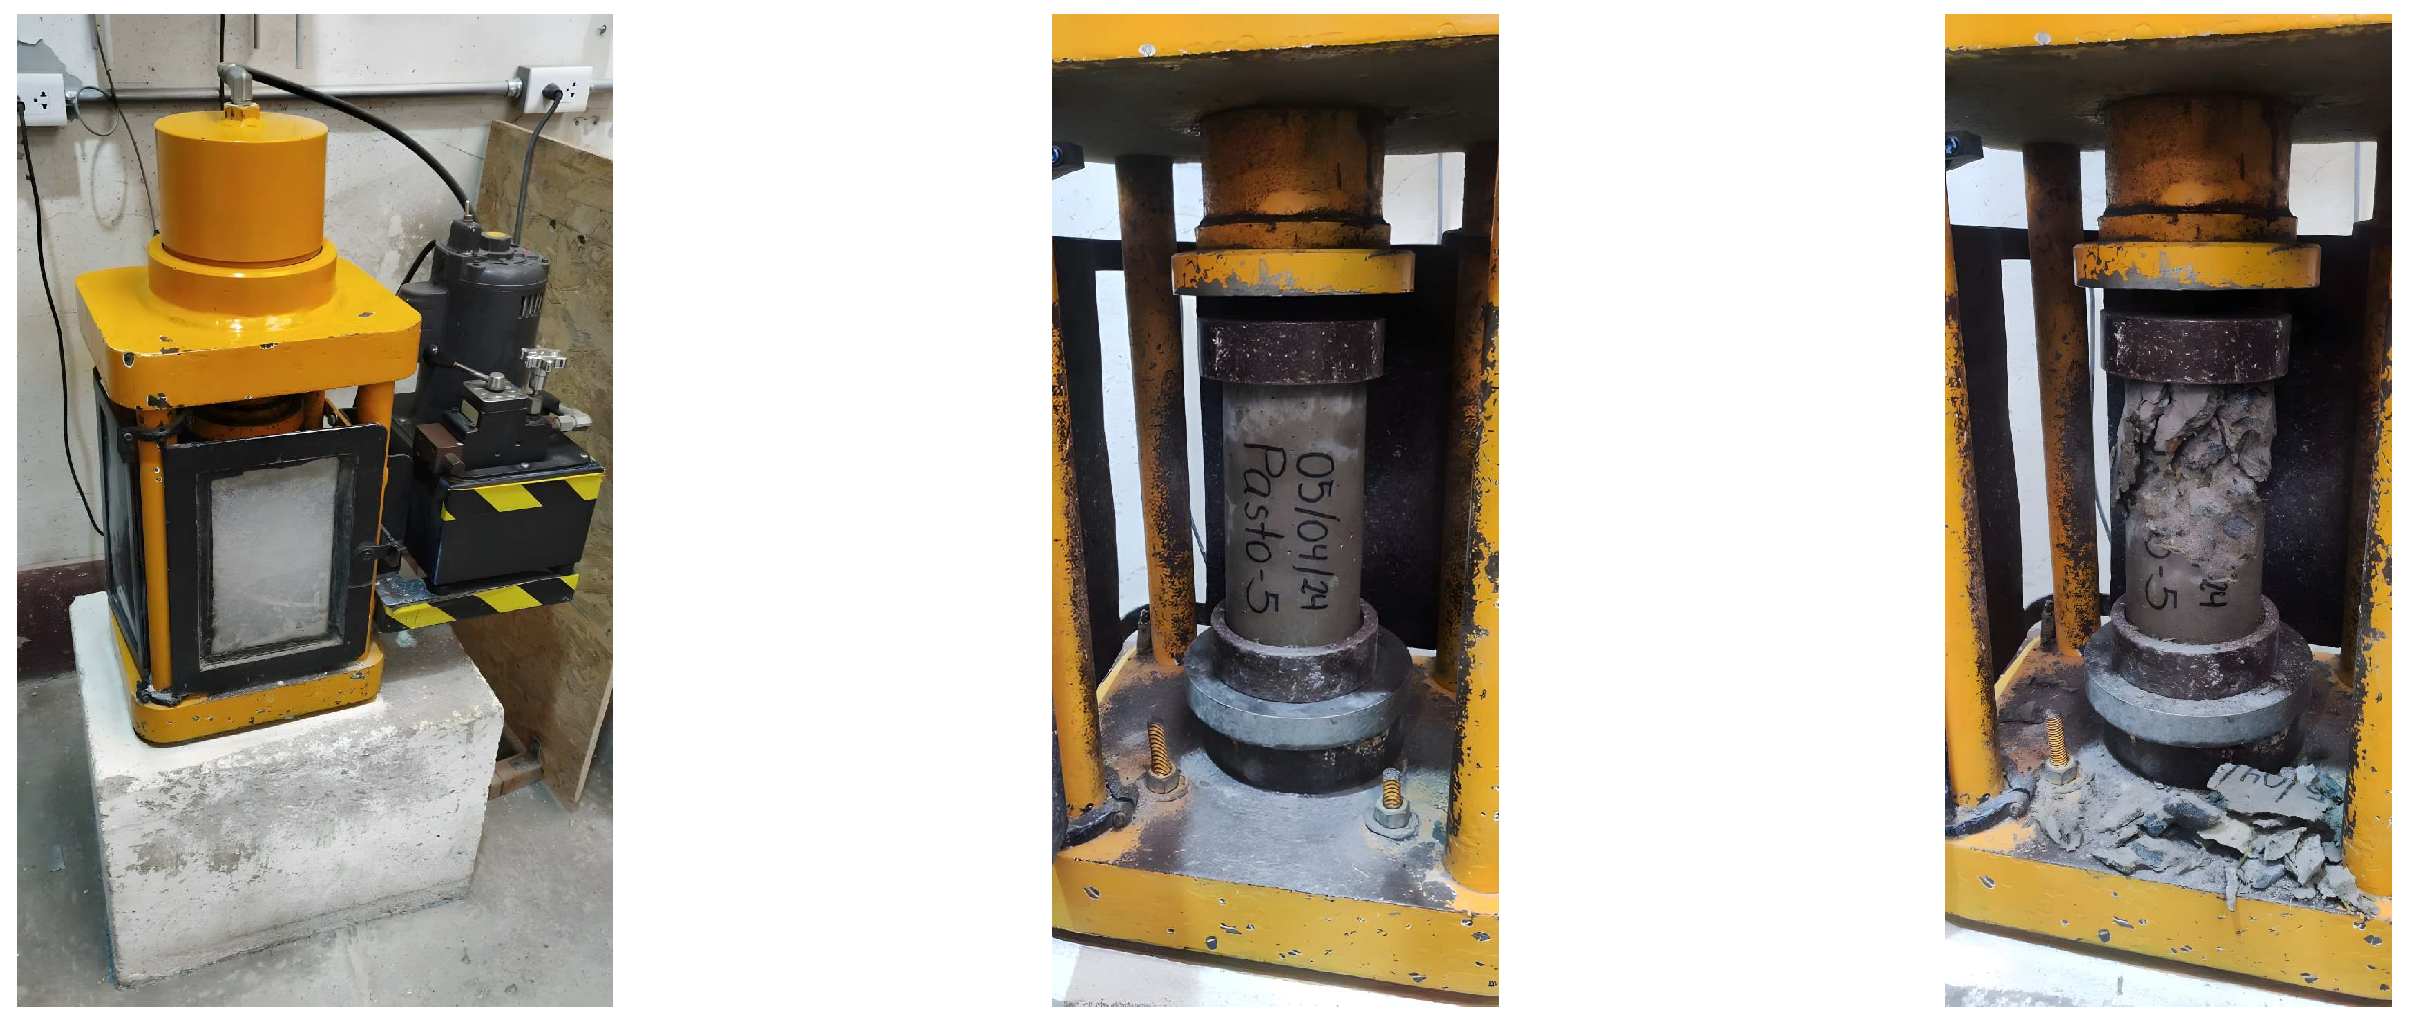
Thirty concrete samples were tested according to standards [
22], at curing ages of 7, 14, and 28 days.
Figure 7.
Compressive strength test
Figure 7.
Compressive strength test
3. Results
3.1. Botanical Identification
The samples were identified as: Citrus Aurantium L. (orange peel), Zea mays L. (corn cob, corn husk), Ananas comosus (L.) Merr. (pineapple leaf) and Stenotaphrum secundatum (grass).
Table 8.
Classification of samples according to the following taxonomic position.
Table 8.
Classification of samples according to the following taxonomic position.
| Waste |
Order |
Family |
Genus |
Specie |
| Orange Peel |
Sapindales |
Rutaceae |
Citrus |
Citrus aurantium L. |
| Corn Cob |
Poales |
Poaceae |
Zea |
Zea mays L. |
| Corn Husk |
| Pineapple leaf |
Bromeliaceae |
Ananas |
Ananas comosus (L.) Merr. |
| Grass |
Poaceae |
Stenotaphrum |
Stenotaphrum secundatum |
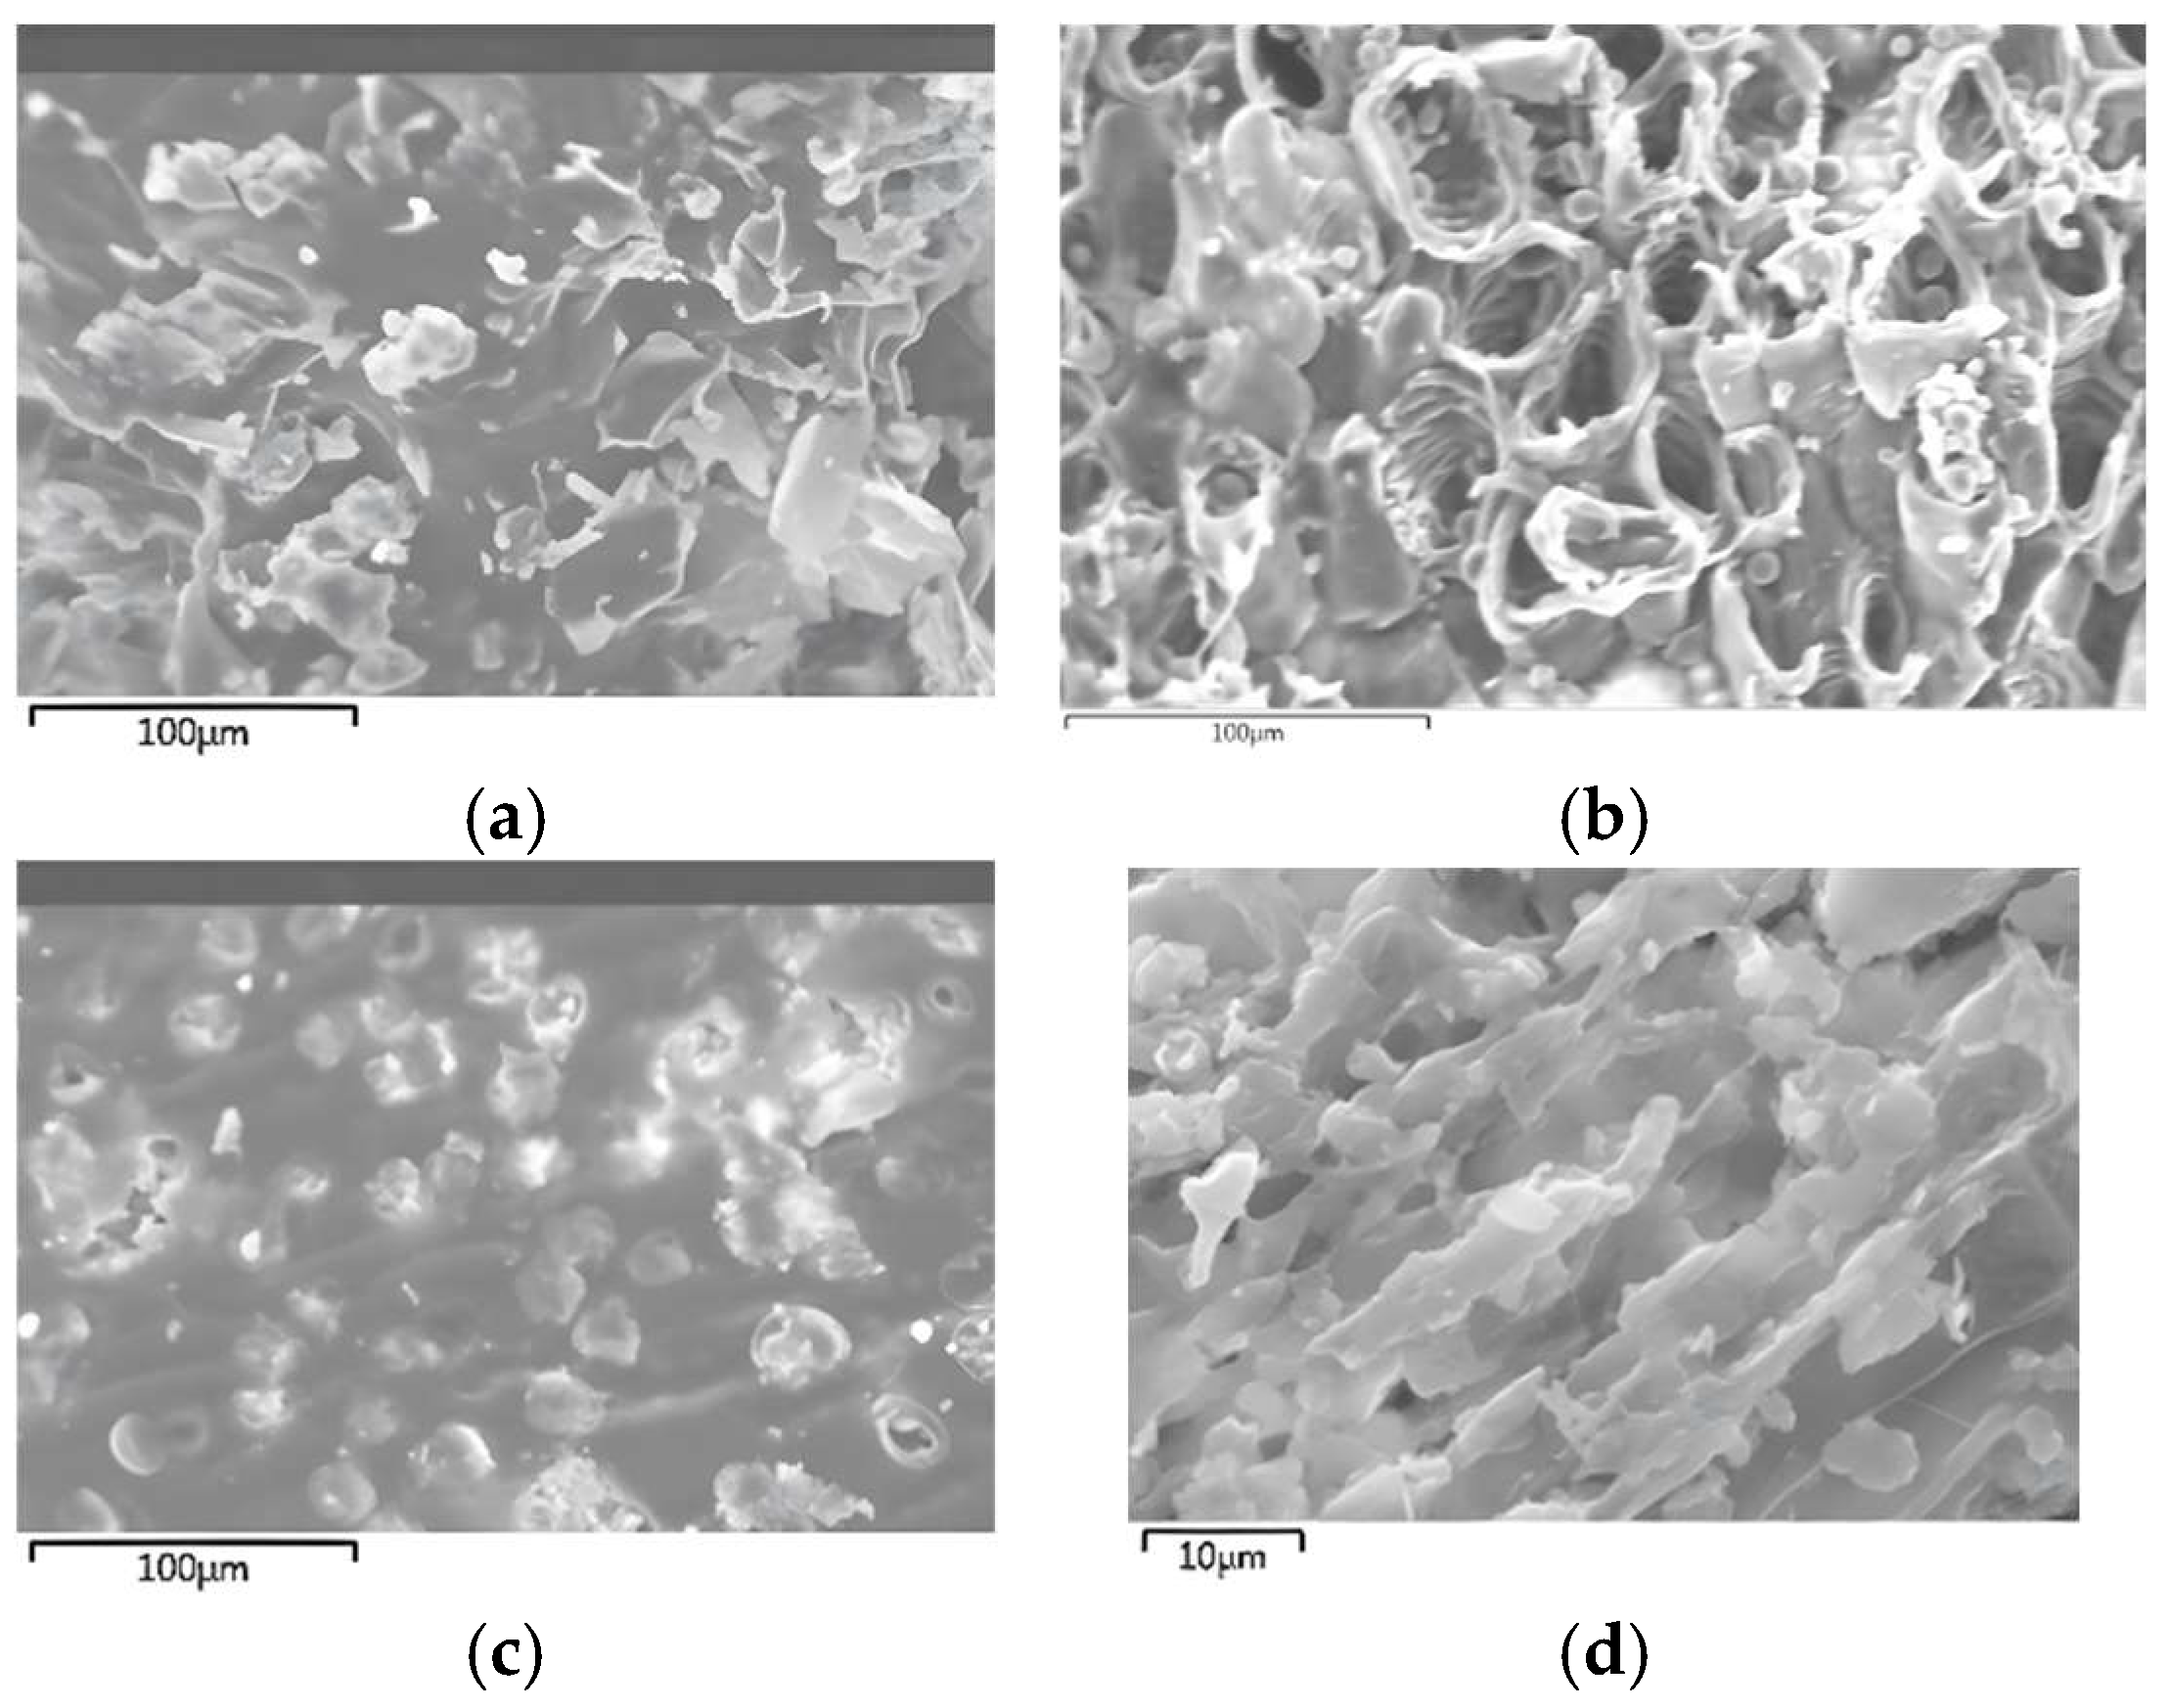
3.2. Microscopic Images of Vegetal Waste
Figure 8.
Microscopic images of samples: (a) Orange peel; (b) Corn cob; (c) Corn husk; (d) Grass.
Figure 8.
Microscopic images of samples: (a) Orange peel; (b) Corn cob; (c) Corn husk; (d) Grass.
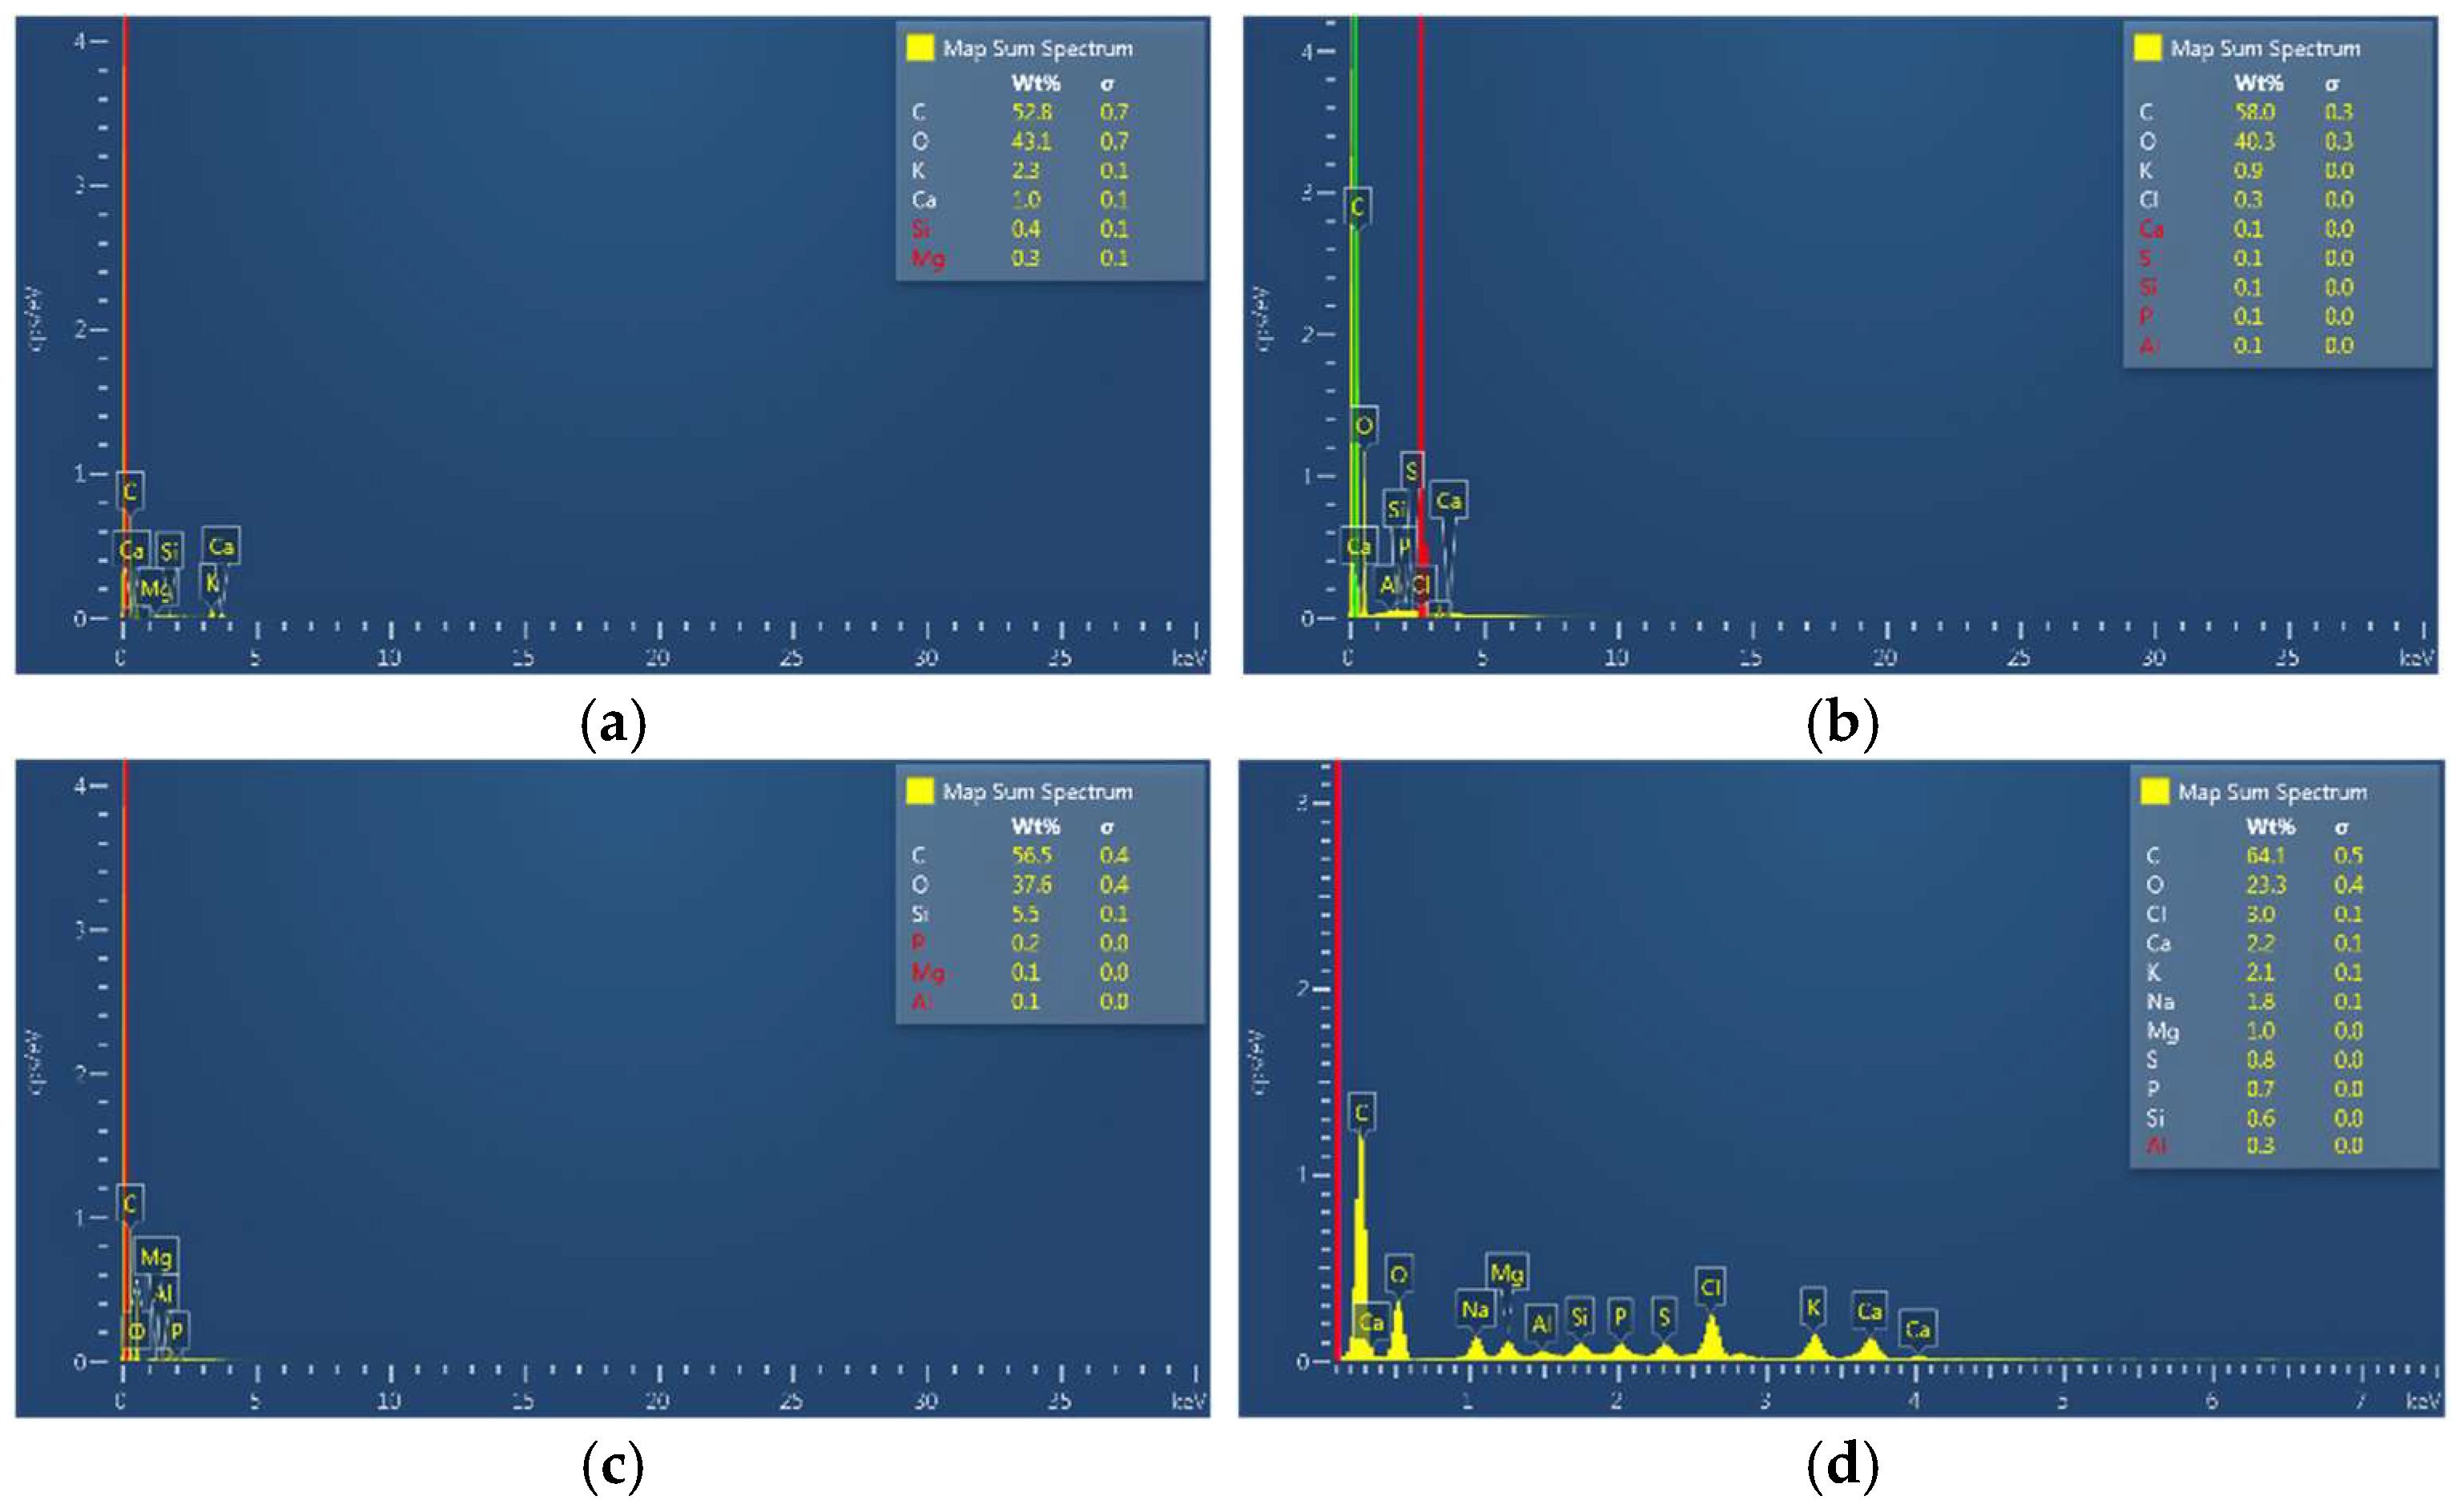
3.3. Chemical Elements of Waste Materials
The chemical elements of the vegetal waste are shown in the following figure as weight percentages.
Figure 9.
Figure 9.
Diffractogram of samples: (a) Orange peel; (b) Corn cob; (c) Corn husk; (d) Grass.
Figure 9.
Diffractogram of samples: (a) Orange peel; (b) Corn cob; (c) Corn husk; (d) Grass.
Table 9.
Elemental analysis, percentage by weight.
Table 9.
Elemental analysis, percentage by weight.
| Waste |
% Weight |
| C |
O |
Cl |
Ca |
K |
Na |
Mg |
S |
P |
Si |
Al |
| Orange Peel |
52.8 |
43.1 |
- |
1.0 |
2.3 |
- |
0.3 |
- |
- |
0.4 |
- |
| Corn Cob |
58.0 |
40.3 |
0.3 |
0.1 |
0.9 |
- |
- |
0.1 |
0.1 |
0.1 |
0.1 |
| Corn Husk |
56.5 |
37.6 |
- |
- |
- |
- |
0.1 |
- |
0.2 |
5.5 |
0.1 |
| Grass |
64.1 |
23.3 |
3.0 |
2.2 |
2.1 |
1.8 |
1.0 |
0.8 |
0.7 |
0.6 |
0.3 |
3.4. Elemental Analysis of Waste
Table 10 shows the percentage of Carbon, Oxygen and Nitrogen in the waste.
3.5. Cellulose Content Before and after UV Exposure
Table 11 and
Table 12 shows the cellulose content before and after 7 days UV exposure accordingly.
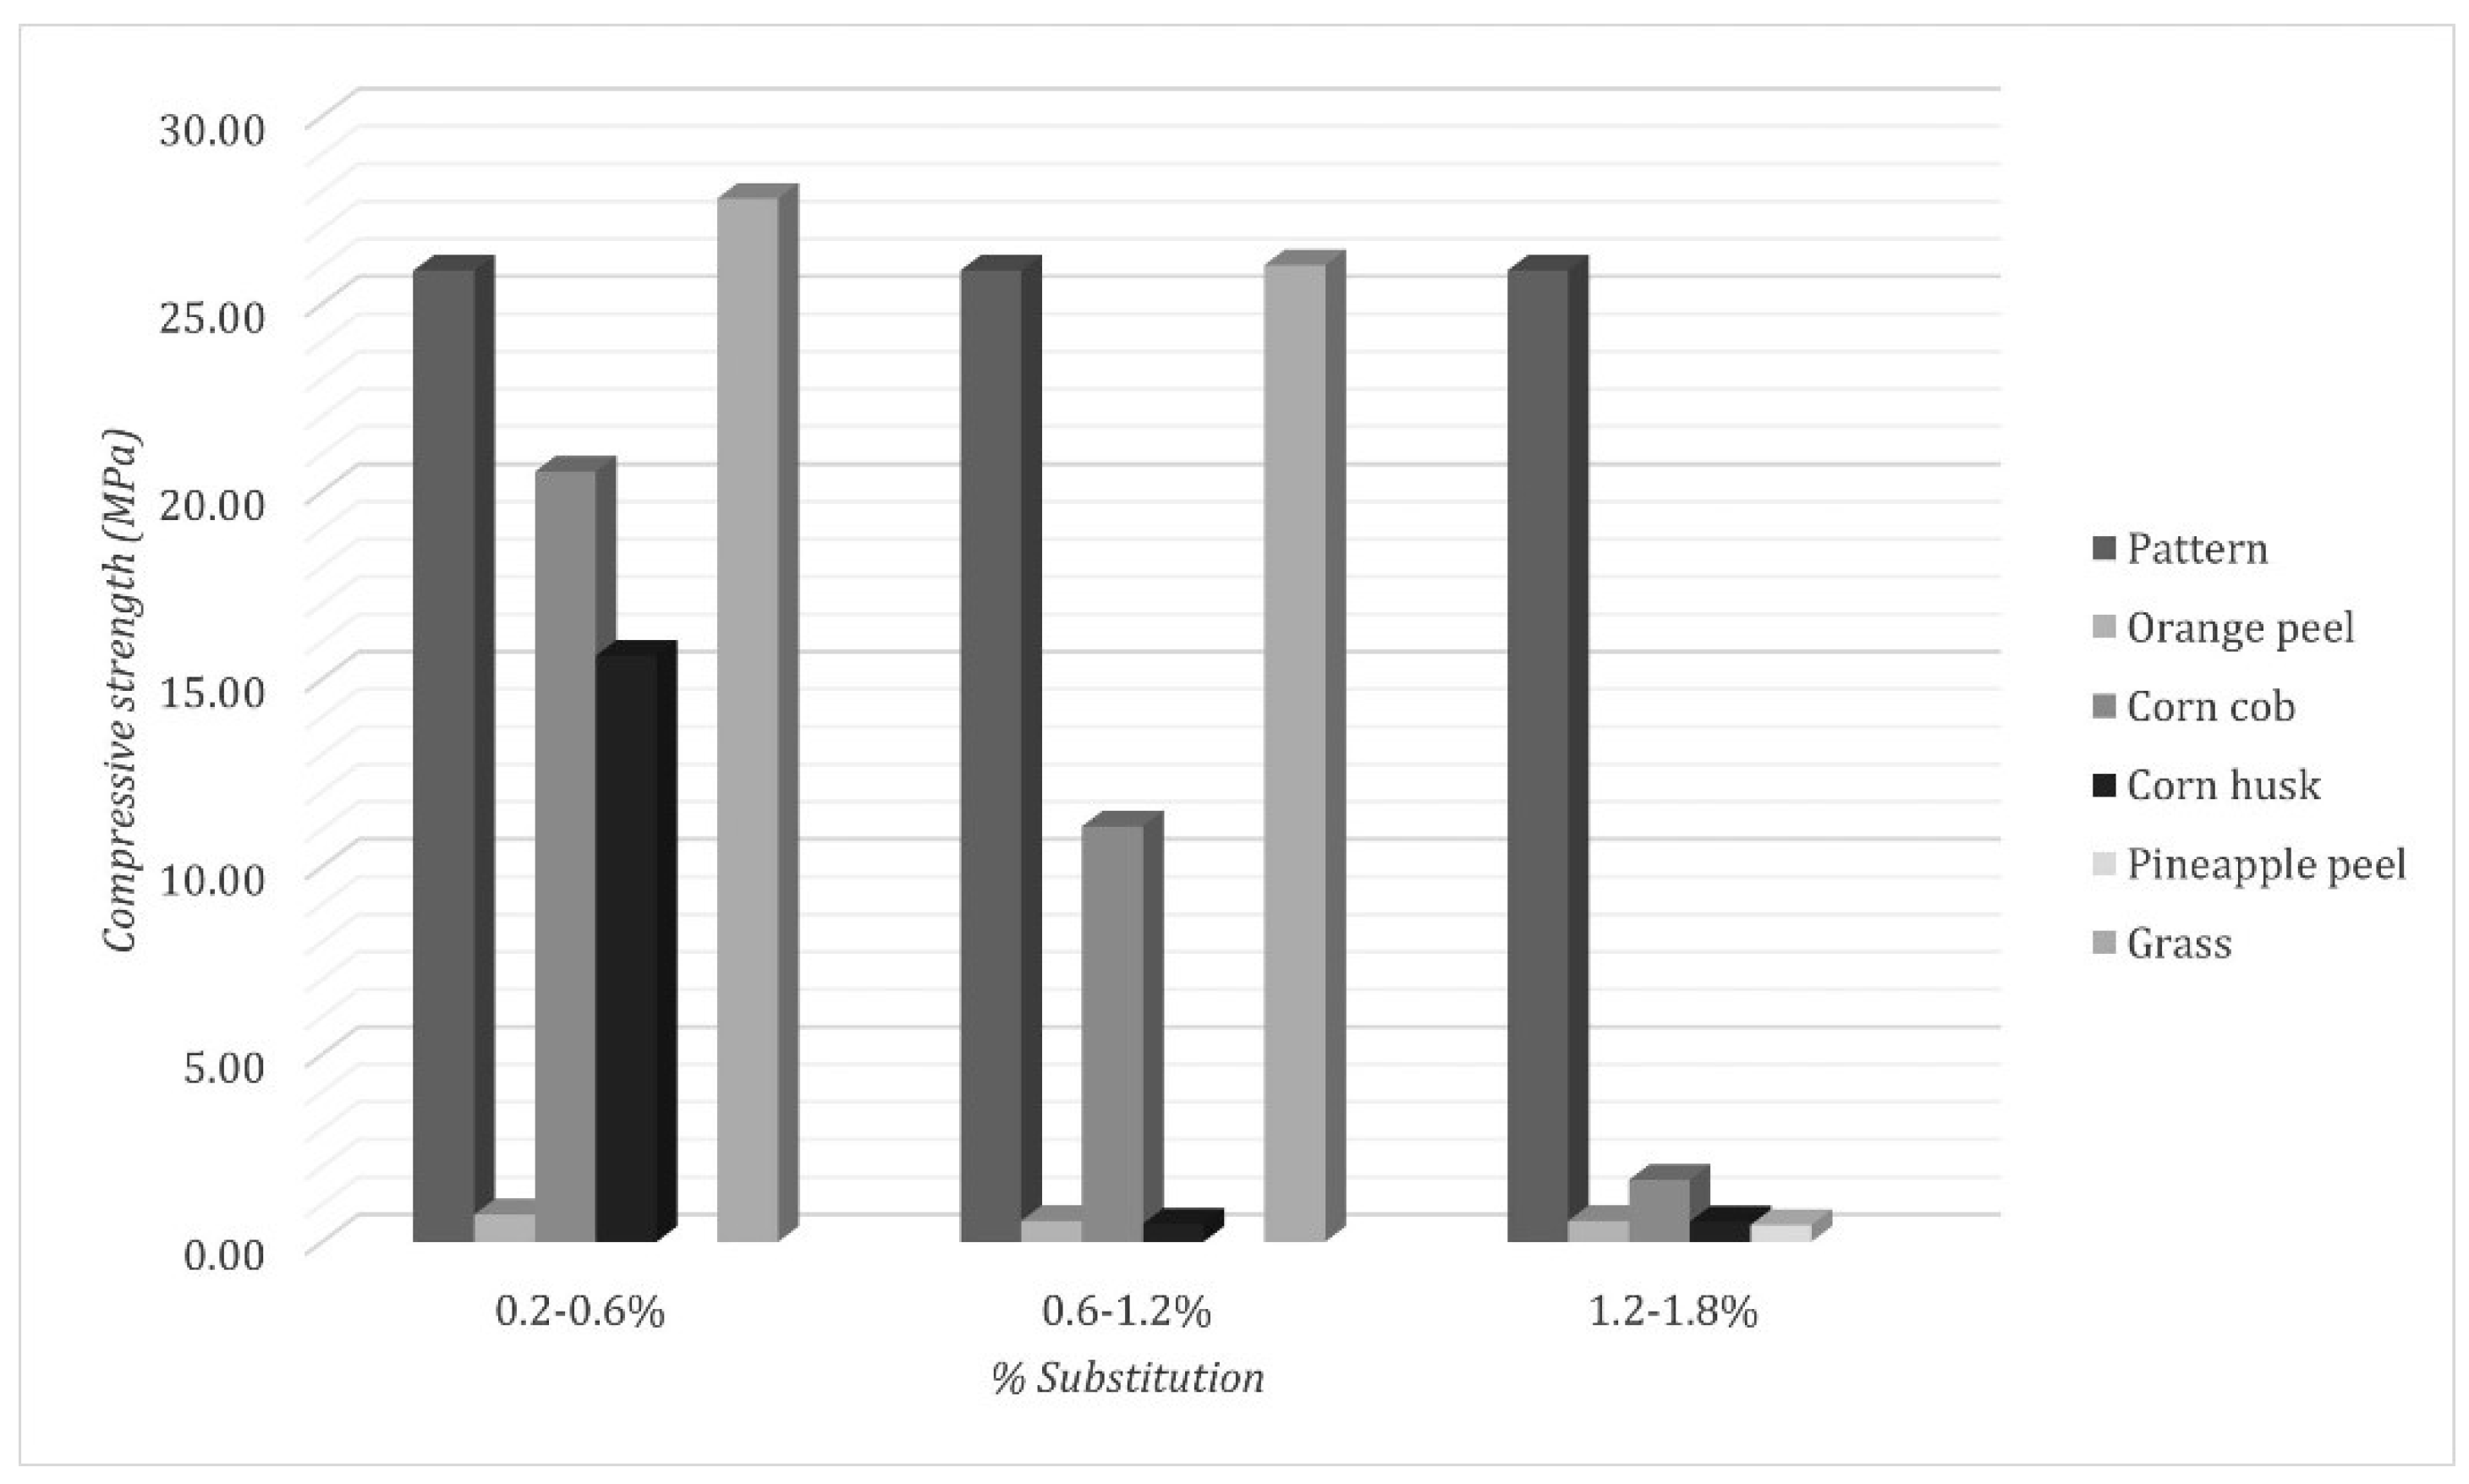
3.6. Results of Exploratory Tests
3.6.1. Compressive Strength
The compression of the waste mortar cubes in the exploratory tests is presented in
Table 13 and
Figure 10.
Table 13.
Compressive strength in MPa of mortar dosages, at 7 days of curing with different percentages in substitution.
Table 13.
Compressive strength in MPa of mortar dosages, at 7 days of curing with different percentages in substitution.
| Design |
|
0.2-0.6% |
0.6-1.2% |
1.2-1.8% |
| Pattern |
Compressive strength (MPa) |
25.89 |
25.89 |
25.89 |
| Orange peel |
Compressive strength (MPa) / %Pattern |
0.73 |
0.56 |
0.56 |
| 2.8% |
2.2% |
2.2% |
| Corn cob |
20.53 |
11.08 |
1.65 |
| 79.3% |
42.8% |
6.4% |
| Corn husk |
15.62 |
0.48 |
0.54 |
| 60.3% |
1.9% |
2.1% |
| Pineapple leaf |
- |
- |
0.45 |
| - |
- |
1.7% |
| Grass |
27.81 |
26.03 |
- |
| 107.4% |
100.5% |
- |
Figure 10.
Graph of the compressive strength in MPa of mortar dosages, at 7 days of curing with different percentages in substitution.
Figure 10.
Graph of the compressive strength in MPa of mortar dosages, at 7 days of curing with different percentages in substitution.
Table 13 presents the results of the six mortar samples at curing age of 7 days. The control samples had a compressive strength of 25.89 MP and the highest strengths were up to 27.81 MPa with 0.21% substitution of sand by grass while the lowest strengths were obtained with orange peel and pineapple leaf.
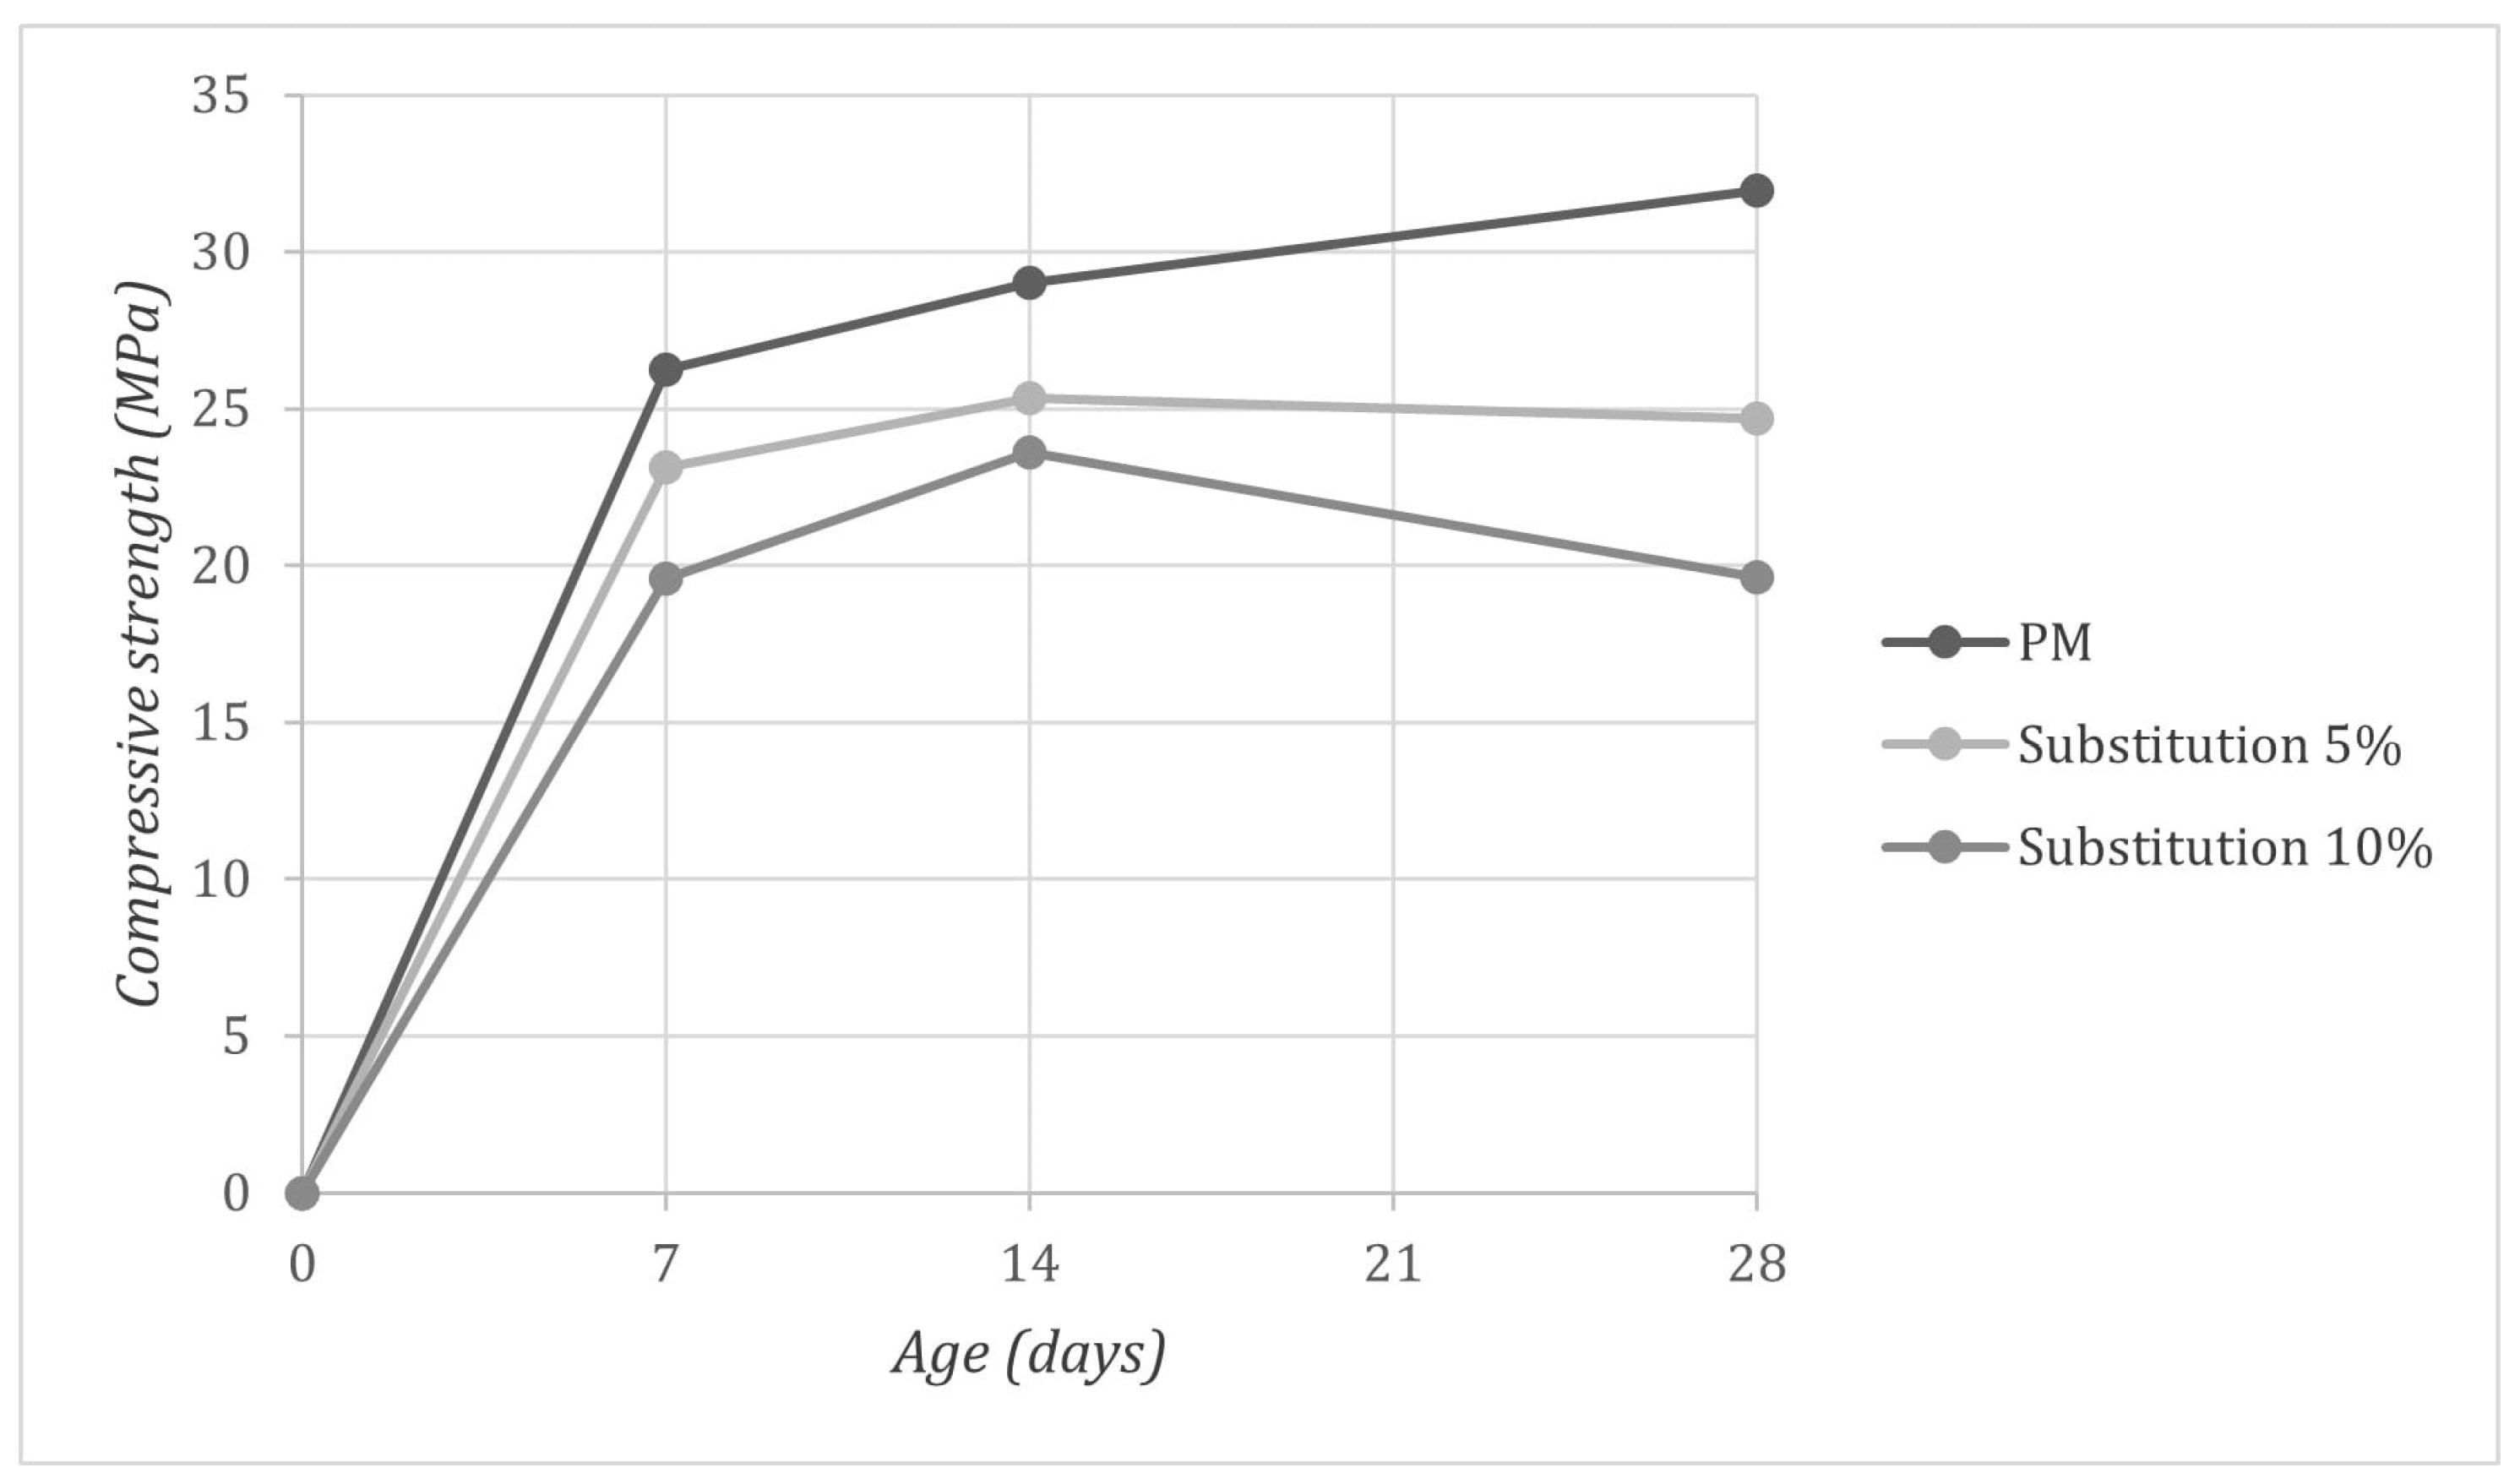
3.7. Results of Mortar with Grass Tests
3.7.1. Compressive Strength
Using grass, which was the residue with the best compressive performance, 27 mortar cubes were made with 5% and 10% substitution and were tested for compression between 7 and 28 days of age.
Table 14.
Compressive strength in MPa between 7 to 28 days of curing of the standard mortar (PM) and mortar dosages with grass in substitution of 5 and 10% of sand volume.
Table 14.
Compressive strength in MPa between 7 to 28 days of curing of the standard mortar (PM) and mortar dosages with grass in substitution of 5 and 10% of sand volume.
| Design |
7 days |
14 days |
28 days |
| PM |
26.24 |
28.99 |
31.97 |
| Substitution-5% |
23.11 |
25.35 |
24.69 |
| Substitution-10% |
19.57 |
23.59 |
19.64 |
Figure 11.
Graph of the compressive strength in of the standard mortar (PM) and mortar dosages with grass.
Figure 11.
Graph of the compressive strength in of the standard mortar (PM) and mortar dosages with grass.
The data indicate that the proportion of grass is a factor influencing the material's strength and age, showing that strength decreases as the grass content in the mix increases.
3.8. Results of Concrete with Grass Tests
3.8.1. The Concrete Slump Testing
Applying the ASTM C143 [
18],
Table 15 shows the concrete slump of the standard concrete (PC) and the concrete with grass 5% and 10% (CG-5% and CG-10%).
3.8.2. Other Properties
Table 16 presents the volumetric weight and
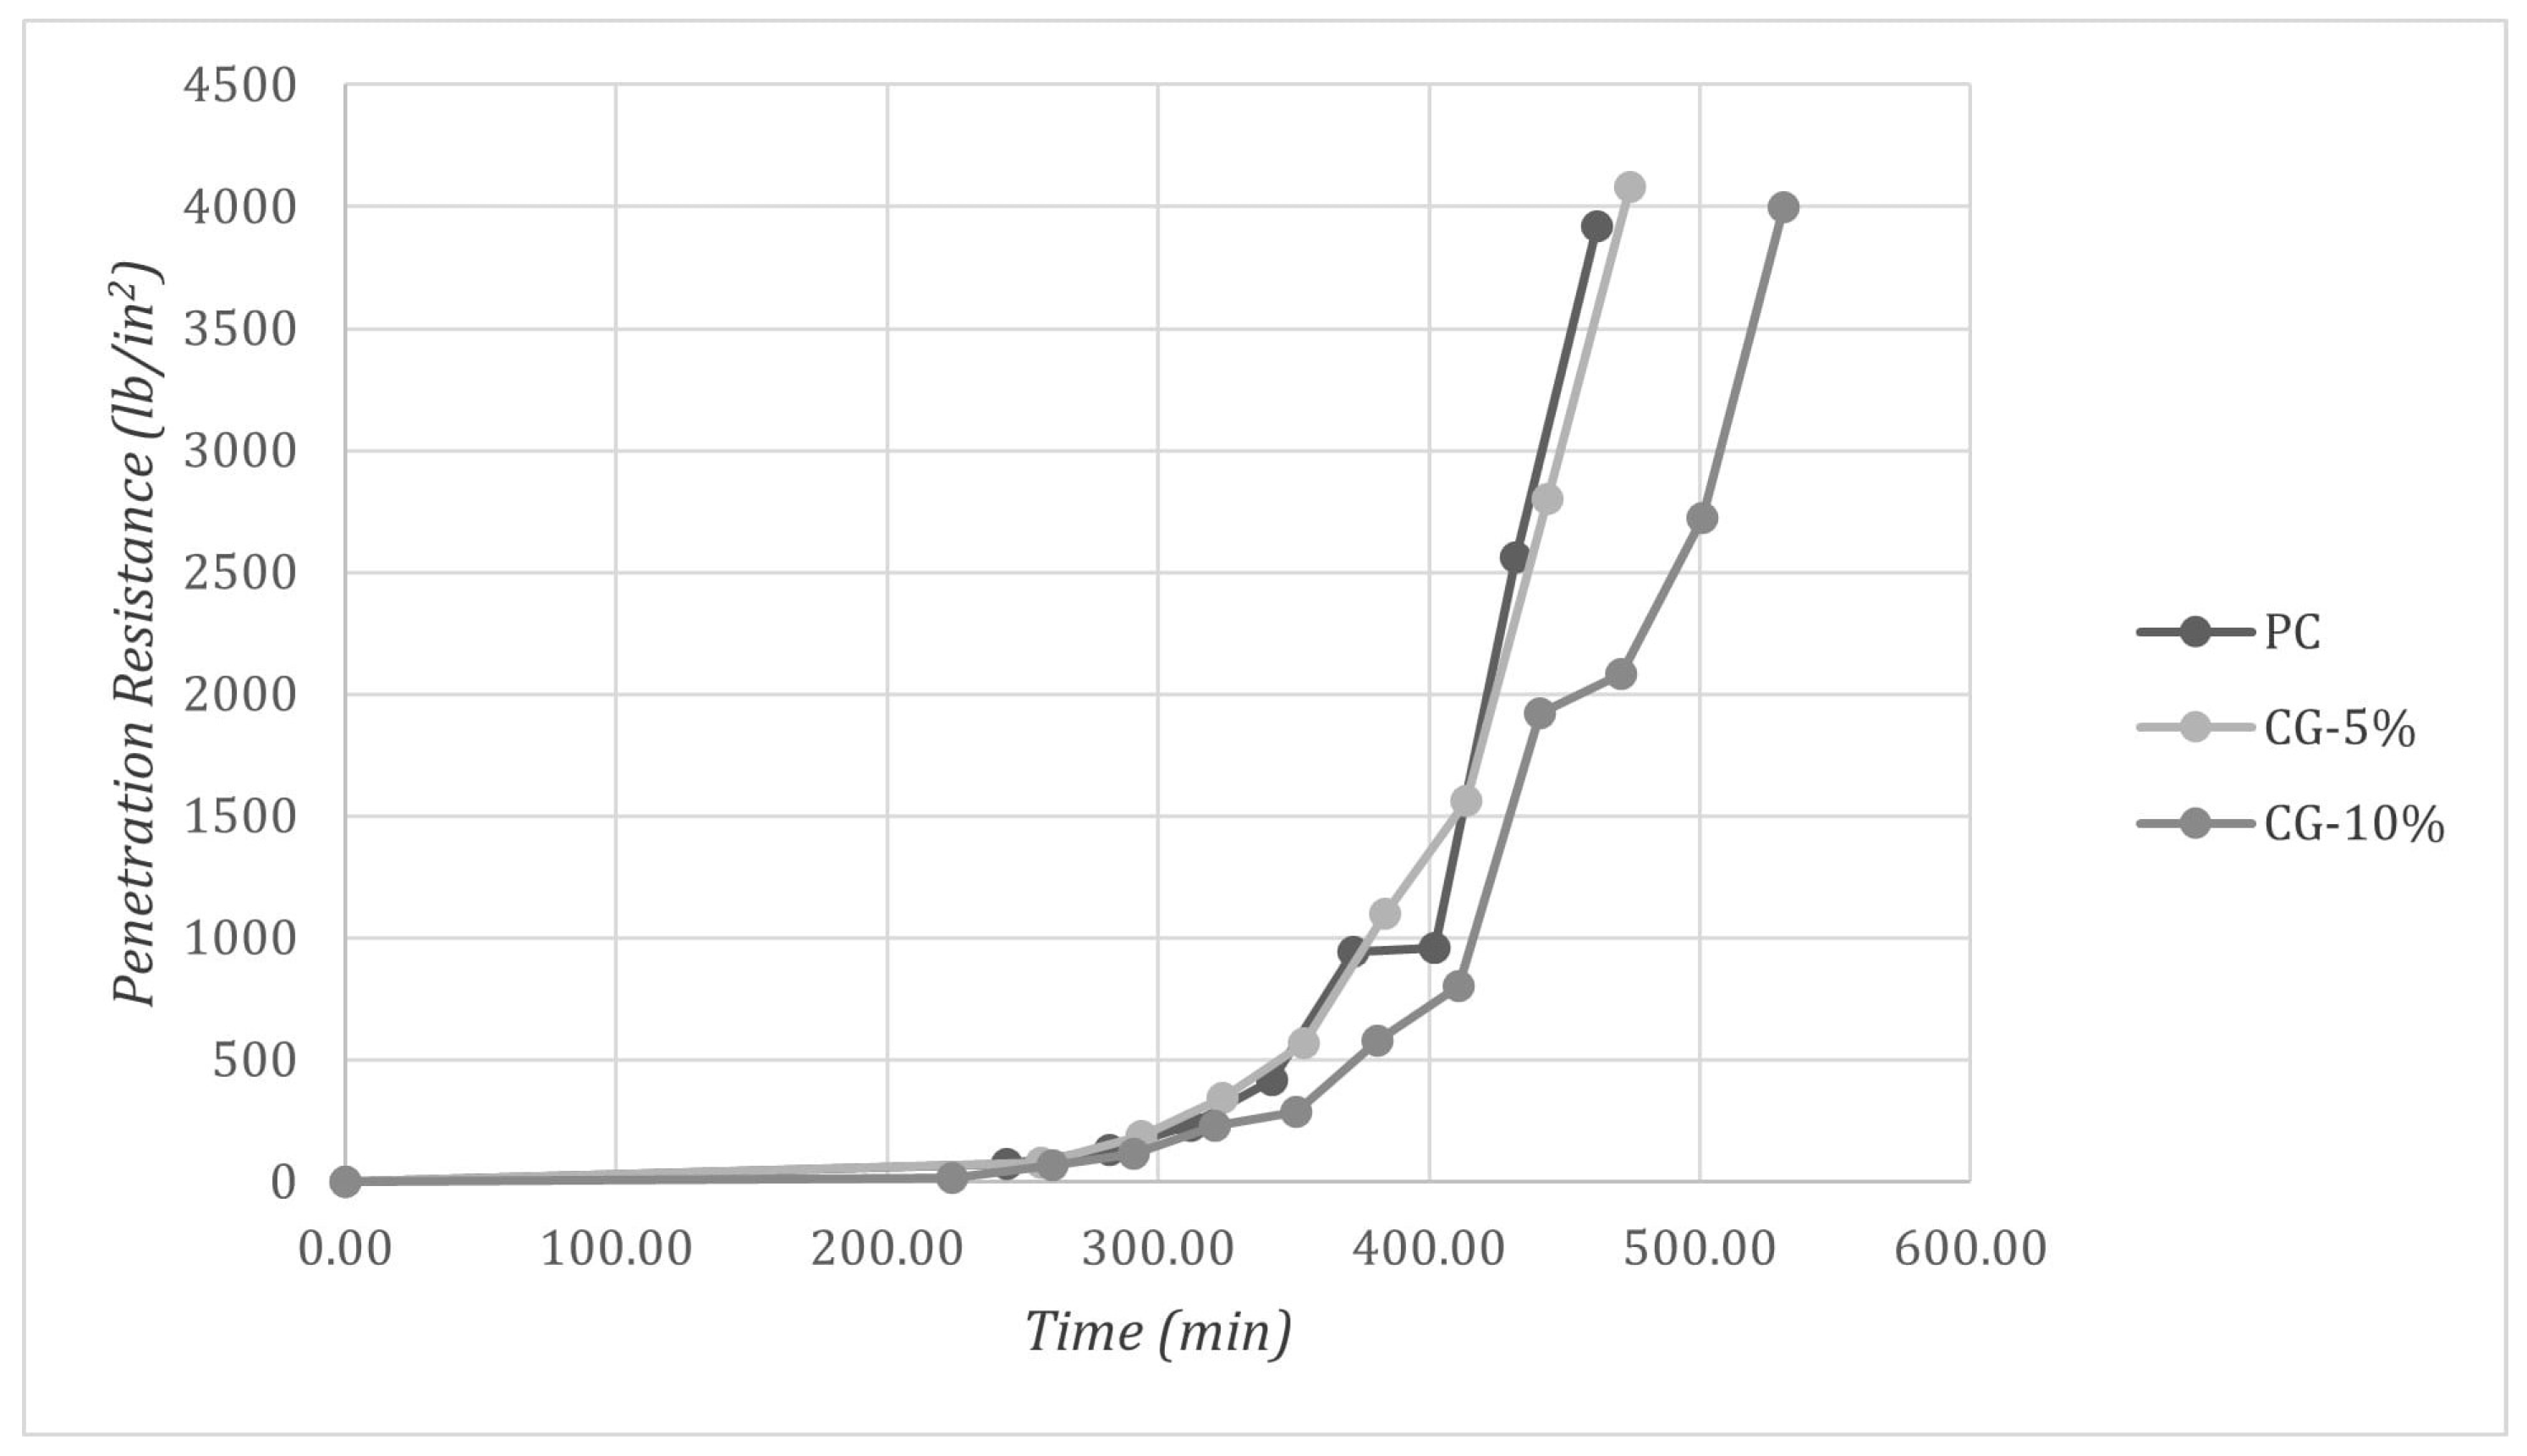
Figure 12 shows the setting time as determined according to standards [
20].
The setting time of the concrete with the addition of grass was determined CG-5% and CG-10%, as these mixes showed the best performance in strength among the thirteen designs studied.
Figure 12.
Setting times for standard concrete (PC), CG-5%, and CG-10%.
Figure 12.
Setting times for standard concrete (PC), CG-5%, and CG-10%.
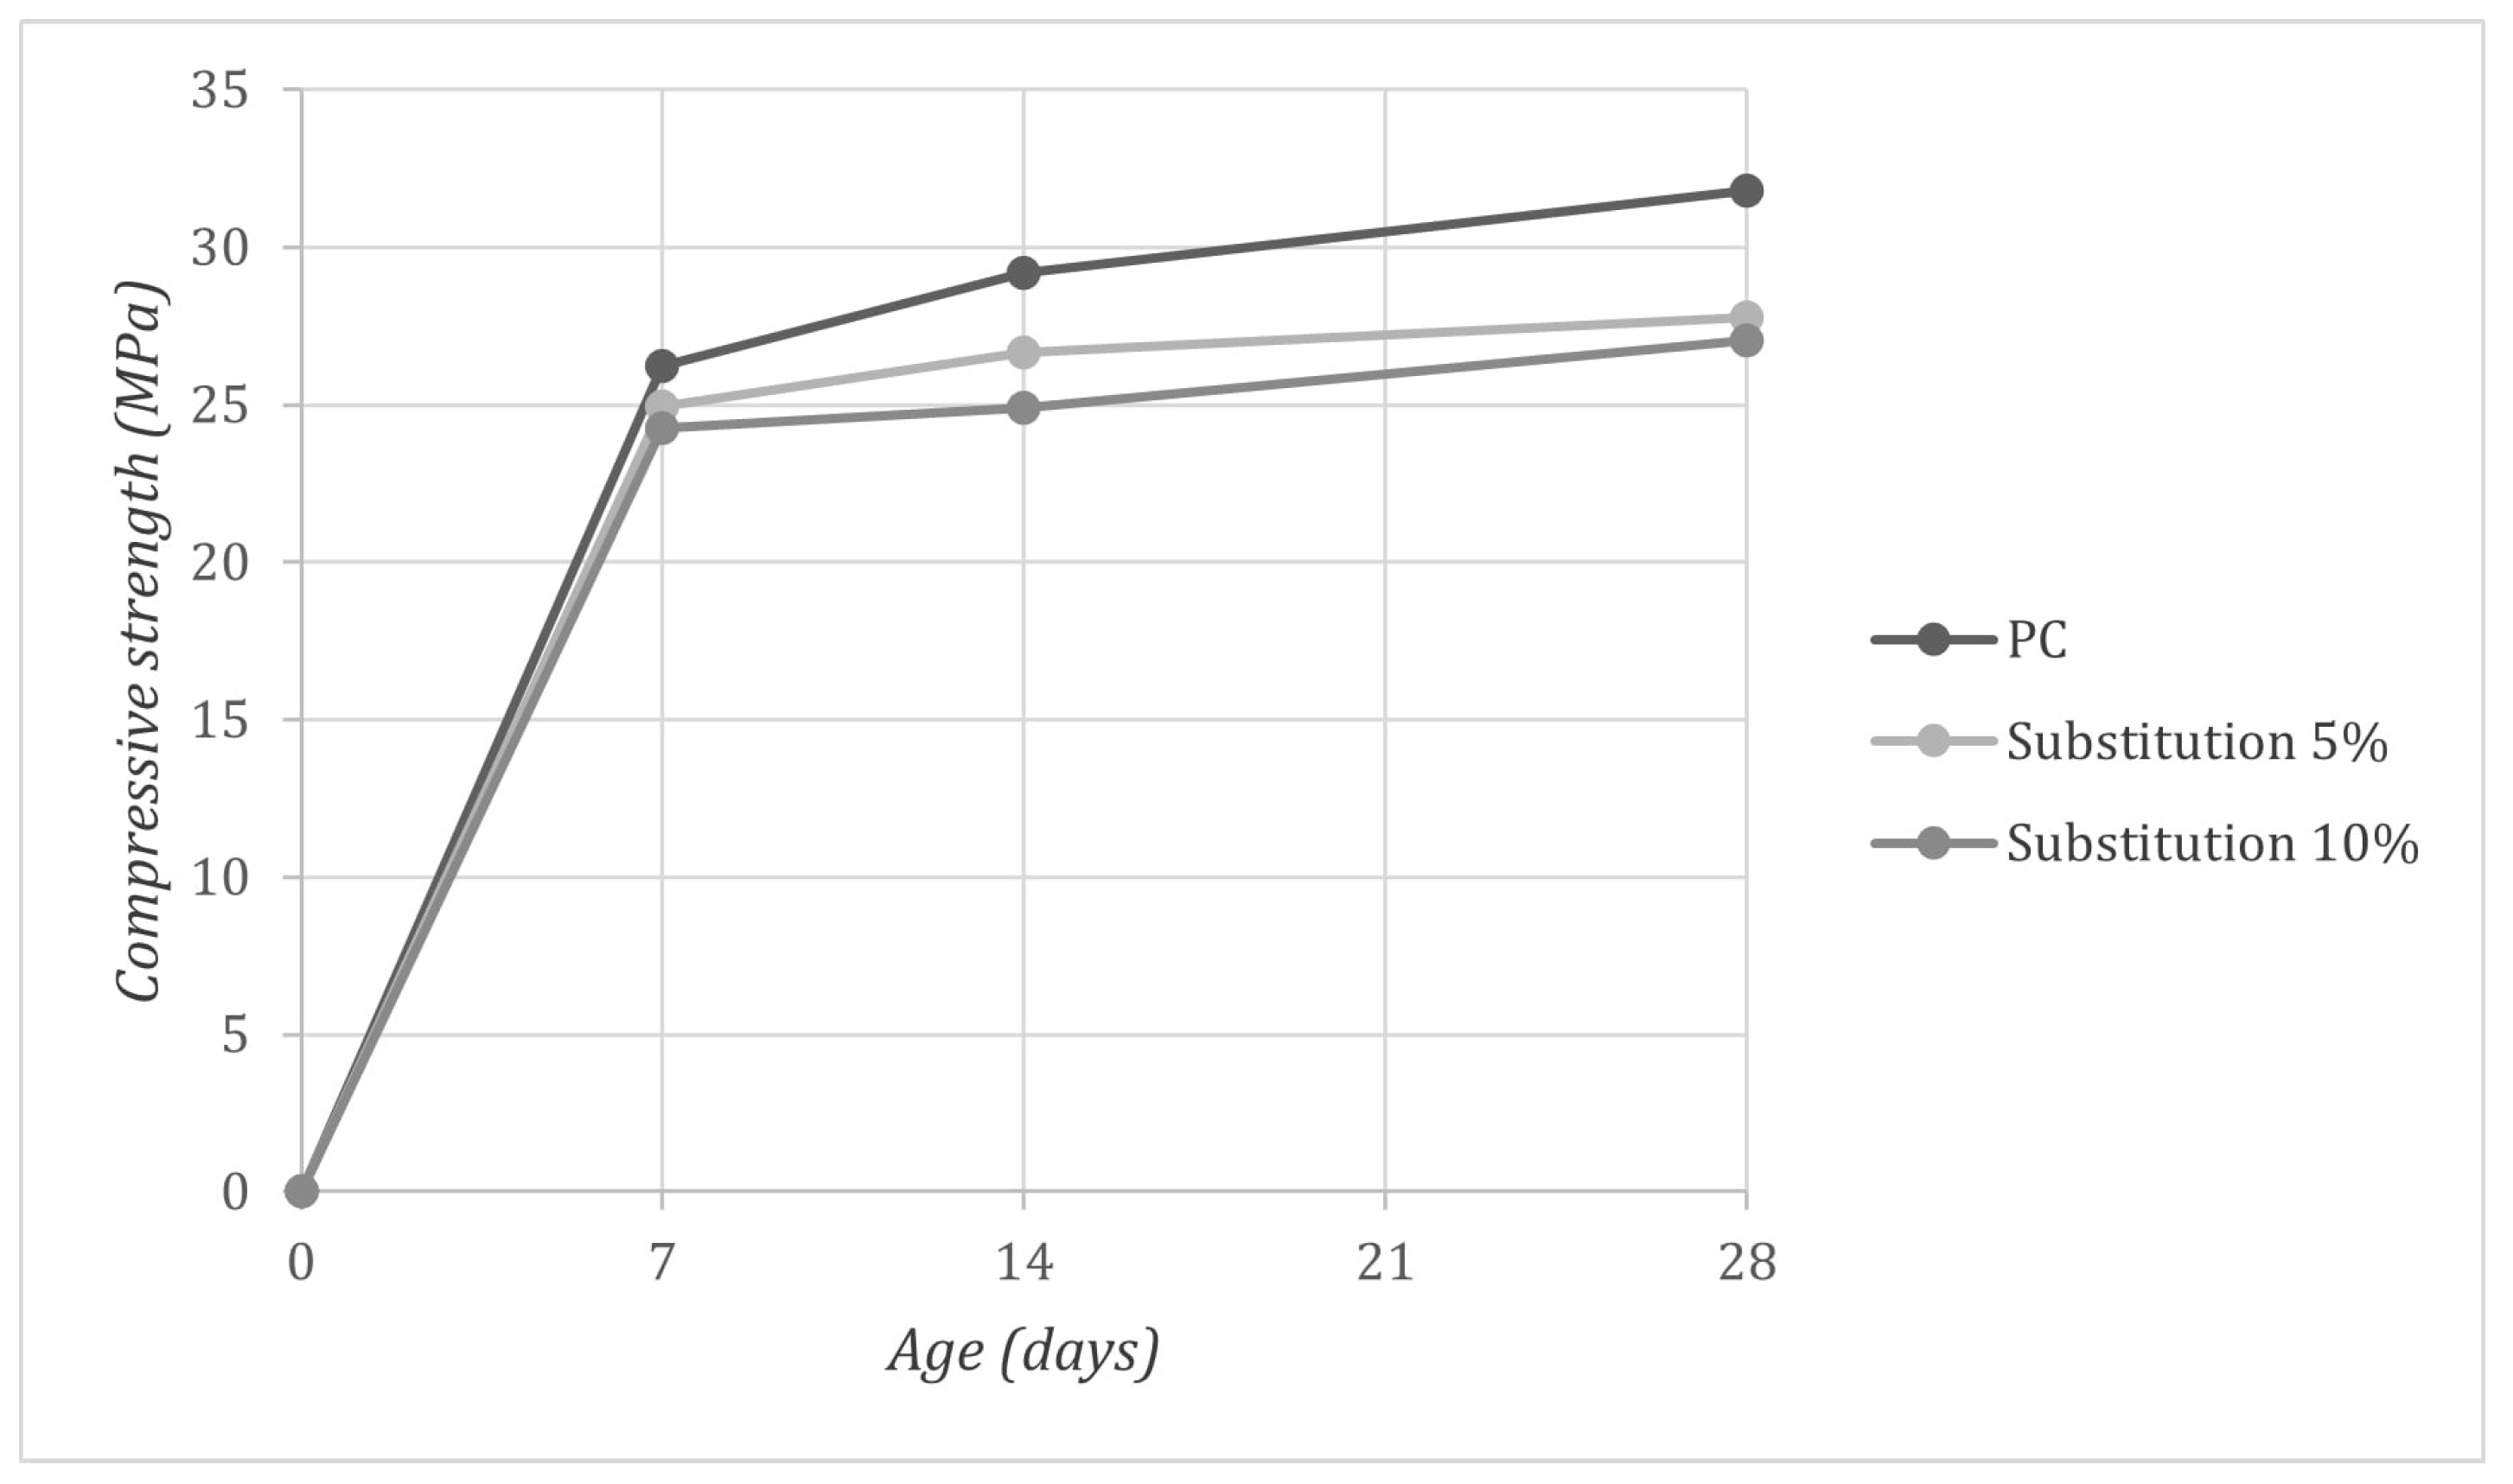
3.8.3. Compression Strength
Table 17 presents the results of these tests
Table 17.
Results of Compression tests in MPa.
Table 17.
Results of Compression tests in MPa.
| Design |
|
7 days |
14 days |
28 days |
| PC |
|
26.24 |
29.20 |
31.82 |
| Substitution - 5% |
%/Pattern |
24.96 |
26.66 |
27.77 |
| 95.12% |
91.30% |
87.27% |
| Substitution - 10% |
%/Pattern |
24.28 |
24.89 |
27.05 |
| 92.53% |
85.24% |
85.01% |
Figure 13.
Graph of the compression strength.
Figure 13.
Graph of the compression strength.
4. Discussions
From the analysis of the SEM images, it can be observed that the residues have a different surface structure, elongated or in the form of particles and voids of different sizes, which may have influenced the results. The corn cob and the grass, which had the best results, have fewer voids and the grass, which had the best result, is the one that shows the greatest compactness, in addition to being the only one that presents an elongated structure.
The content of Carbon, Hydrogen and Nitrogen is similar, so no influence of these factors is observed in the results.
The cellulose content is also similar in the samples analysed, except for the pineapple leaf, which is higher; however, it is one of the residues with which the lowest resistance was obtained. It was initially considered that the cellulose content could have an important influence on the results, given that it constitutes the main support component of these materials.
UV exposure for 7 days did not produce a significant reduction in cellulose content. This analysis was carried out due to the above-mentioned hypothesis that its content could have an important influence on the results and that it could vary over time.
The compression strength of the samples is 10-15% lower than the Standard and varies with the replacement percentage and the age of the sample. However, resistance to other types of stress, mainly tension and bending, should be verified.
5. Conclusions
Based on the analysis of the results, the following conclusions were reached:
Utilizing grass as a substitute for natural fine aggregate with a fineness modulus (FM) of 2.84 and curing times of 28 days is a viable option.
The workability of the concrete increases as the proportion of sand replaced by the waste material rises, ranging from 11% to 28%.
The unit weight is like the standard mixture for both substitution percentages.
The setting is slightly reduced in the mixture with 5% substitution, but significantly in the mixture with 10% substitution with respect to the standard.
According to the results obtained, it can be up to 137 kg of natural sand per 1 m3 of mortar and 90 kg per 1 m³ of concrete.
For the two designs of concrete, strengths up to 27 MPa, so it is possible to use in structural design up to 10% of replacement of fine aggregate.
Author Contributions
Conceptualization, IM; methodology, IM; software, JM; Validation, IM; Formal analysis, IM, CV, CR, LS; Investigation, IM, CV, CR, LS, AT, JM; resources, CR, LS, IM, CV, AT; data curation, IM; writing—Original draft preparation, IM; review and editing, AT; visualization, JM; supervision, IM; project administration, IM; funding acquisition, IM. All authors have read and agreed to the published version of the manuscript.
Funding
Funded by Research Vice-Rector of National Engineering University Lima Perú, FIC-PFR-32-2023.
Data Availability Statement
Additional data will be available upon request.
Acknowledgments
Our recognition to Chemistry Laboratory and Materials Testing Laboratory of e Faculty of Civil Engineering and the Center for the Development of Advanced Materials and Nanotechnology - CEMAT and the Research and Certification Laboratory - LABICER of the Faculty of Sciences.
Conflicts of Interest
We do not have any conflicts of interest.
References
- Paruthi, S.; Khan, A.H.; Kumar, A.; Kumar, F.; Hasan, M.A.; Magbool, H.M.; Manzar, M.S. Sustainable Cement Replacement Using Waste Eggshells: A Review on Mechanical Properties of Eggshell Concrete and Strength Prediction Using Artificial Neural Network. Case Studies in Construction Materials 2023, 18, e02160. [Google Scholar] [CrossRef]
- Wu, N.; Ji, T.; Huang, P.; Fu, T.; Zheng, X.; Xu, Q. Use of Sugar Cane Bagasse Ash in Ultra-High Performance Concrete (UHPC) as Cement Replacement. Constr Build Mater 2022, 317, 125881. [Google Scholar] [CrossRef]
- Henry, C.S.; Lynam, J.G. Embodied Energy of Rice Husk Ash for Sustainable Cement Production. Case Studies in Chemical and Environmental Engineering 2020, 2, 100004. [Google Scholar] [CrossRef]
- Mohammadhosseini, H.; Alyousef, R.; Abdul Shukor Lim, N.H.; Tahir, M.M.; Alabduljabbar, H.; Mohamed, A.M.; Samadi, M. RETRACTED: Waste Metalized Film Food Packaging as Low Cost and Ecofriendly Fibrous Materials in the Production of Sustainable and Green Concrete Composites. J Clean Prod 2020, 258, 120726. [Google Scholar] [CrossRef]
- Ahmed, W.; Khushnood, R.A.; Memon, S.A.; Ahmad, S.; Baloch, W.L.; Usman, M. Effective Use of Sawdust for the Production of Eco-Friendly and Thermal-Energy Efficient Normal Weight and Lightweight Concretes with Tailored Fracture Properties. J Clean Prod 2018, 184, 1016–1027. [Google Scholar] [CrossRef]
- Muñoz, P.; Letelier, V.; Muñoz, L.; Bustamante, M.A. Adobe Bricks Reinforced with Paper & Pulp Wastes Improving Thermal and Mechanical Properties. Constr Build Mater 2020, 254, 119314. [Google Scholar] [CrossRef]
- Vilchez Vela, B.; OLIVER Bach VILCHEZ VELA, G.; Carlos Asesor, R.; Ing Chavarría Reyes, M.; Janet, L. Diseño de Concreto Con Adición de Fibras Secas de Maíz Para Habilitaciones En El Distrito de Villa María Del Triunfo Año 2019. Repositorio institucional - URP 2019.
- Bocanegra, C. Sustitución de 5 y 10% de Cemento Por Ceniza de Tusa de Maíz En La Resistencia a La Compresión de Un Mortero, Chimbote, 2018.
- Ydrogo Perez, B.; Raymundo, C.; Pico, R.; Antonio, Á. Elaboración de Concreto Incorporando Puzolana de Mazorca de Maíz y Aserrín Calcinado Como Sustituto Parcial Del Cemento. Repositorio Institucional - USS 2023.
- Varas Ramírez, J.B.; Areche García, J.N. Comportamiento Mecánico Del Adoquín de Hormigón Adicionando Residuos Orgánicos Del Maíz. Dominio de las Ciencias, ISSN-e 2477-8818, Vol. 7, No. Extra 5, 2021 (Ejemplar dedicado a: ESPECIAL SEPTIEMBRE 2021), págs. 148-168 2021, 7, 148–168. [CrossRef]
- ASTM ASTM C 136-06: Standard Test Method for Sieve Analysis of Fine and Coarse Aggregates; 2006.
- ASTM C29/C29M-23 Standard Test Method for Bulk Density (“Unit Weight”) and Voids in Aggregate. ASTM International 2023, 04.02.
- ASTM ASTM C128-04. Standard Test Method for Density, Relative Density ( Specific Gravity ), and Absorption. Annual Book of ASTM Standards 2004.
- American Society for Testing and Material Standard Test Method for Total Evaporable Moisture Content of Aggregate by Drying. ASTM C-566-19 2019.
- ASTM C305-20 Standard Practice for Mechanical Mixing of Hydraulic Cement Pastes and Mortars of Plastic Consistency 1. ASTM International 2020.
- American Society for Testing and Materials Astm C109/C109M. Standard Test Method for Compressive Strength of Hydraulic Cement Mortars 2021, 04.
- ASTM International C192/C192M-19 Standard Practice for Making and Curing Concrete Test Specimens in the Laboratory; 2019.
- ASTM ASTM C143/C143M-12 Standard Test Method for Slump of Hydraulic-Cement Concrete. Annual Book of ASTM Standards 2015.
- ASTM Standards C138/C138M − 17a: Standard Test Method for Density (Unit Weight), Yield, and Air Content (Gravimetric) of Concrete 1; 2017.
- ASTM C403 / C403M - 16 Standard Test Method for Time of Setting of Concrete Mixtures by Penetration Resistance, ASTM International, West Conshohocken, PA. Book of ASTM Standards 2016, 04.02.
- Astm C1064/C1064M-04 Standard Test Method for Temperature of Freshly Mixed Hydraulic-Cement Concrete. Annual Book of ASTM Standards 2004.
- American Society for Testing and Materials Astm C39/C39M. Standard Test Method for Compressive Strength of Cylindrical Concrete Specimens 2001, 04.
|
Disclaimer/Publisher’s Note: The statements, opinions and data contained in all publications are solely those of the individual author(s) and contributor(s) and not of MDPI and/or the editor(s). MDPI and/or the editor(s) disclaim responsibility for any injury to people or property resulting from any ideas, methods, instructions or products referred to in the content. |
© 2024 by the authors. Licensee MDPI, Basel, Switzerland. This article is an open access article distributed under the terms and conditions of the Creative Commons Attribution (CC BY) license (http://creativecommons.org/licenses/by/4.0/).